1 Data Collection and Progress Monitoring for Transition Diane Sobolewski 2004 PA Transition...
60
1 Data Collection and Progress Monitoring for Transition Diane Sobolewski 2004 PA Transition Communities of Practice Conference Pennsylvania Training and Technical Assistance Network Pennsylvania Department of Education
-
Upload
clare-ramsey -
Category
Documents
-
view
214 -
download
0
Transcript of 1 Data Collection and Progress Monitoring for Transition Diane Sobolewski 2004 PA Transition...
1
Data Collection
and
Progress Monitoring
for TransitionDiane Sobolewski
2004 PA Transition
Communities of Practice Conference
Pennsylvania Training and Technical Assistance Network Pennsylvania Department of Education
2
Data Collection Decisions
What is the purpose for collecting data?
Set appropriate IEP goals and objectives based on baseline data of present levels of performance
Facilitate effective instructional decisions based on data
Communicate the rate and growth of student progress to parents or other professionals
3
Data Collection Decisions
What type of data will be collected? Frequency or rate Fluency Percentage or accuracy Duration Latency Quality Level of Assistance Number
4
Data Collection Decisions
Where will the data be collected?
Settings (classroom, home, cafeteria,
community, etc.)
Situations (during instruction, transitions,
free time, etc.)

5
Data Collection Decisions
How often will the data be collected?
Daily Twice a week Weekly Every other week

6
Data Collection Decisions
Who will collect the data?
Special education teacher Regular education teacher Paraprofessional Parent Related service provider Student

7
Data Collection Decisions
Example RWLS Standard 1.6.11A Listen to others, ask clarifying
questions, synthesize information to determine relevancy.
Given a job shadowing visit and a list of questions developed ahead of time, Adam will chart 100% of the
answers re: 5 aspects of each job with fewer than 3 prompts per visit.
Type of data – Number / Level of Assistance Where – job shadowing site in community How often – weekly Who – para-educator or special education teacher

8
Data Collection Decisions
Example
Math 2.1.3E Count, compare, and make change using a collection
of coins and bills
Ellen will pay the bus driver using the correct combination of coins and/or bills 5/5 trials over 3 consecutive weeks.
Type of data – Where - How often – Who -
Percentage or accuracy
On-site, in the communitydaily
Para-educator, travel trainer, teacher
9
Data Collection Decisions
Looking at Cork’s information, make your data collection decisions on one objective:
Type of data – Where – How often – Who –

10
Activity

11
Activity 1
Consider each data collection decision: type of data, where, how often, and who
Complete chart for each student
Do not complete the “tool” column

12
Data Collection Tools & Review Schedule
Data Decisions Type of data needed
Where, by whom, and how often
data will be collected
Guide your selection of a meaningful data collection tool
13
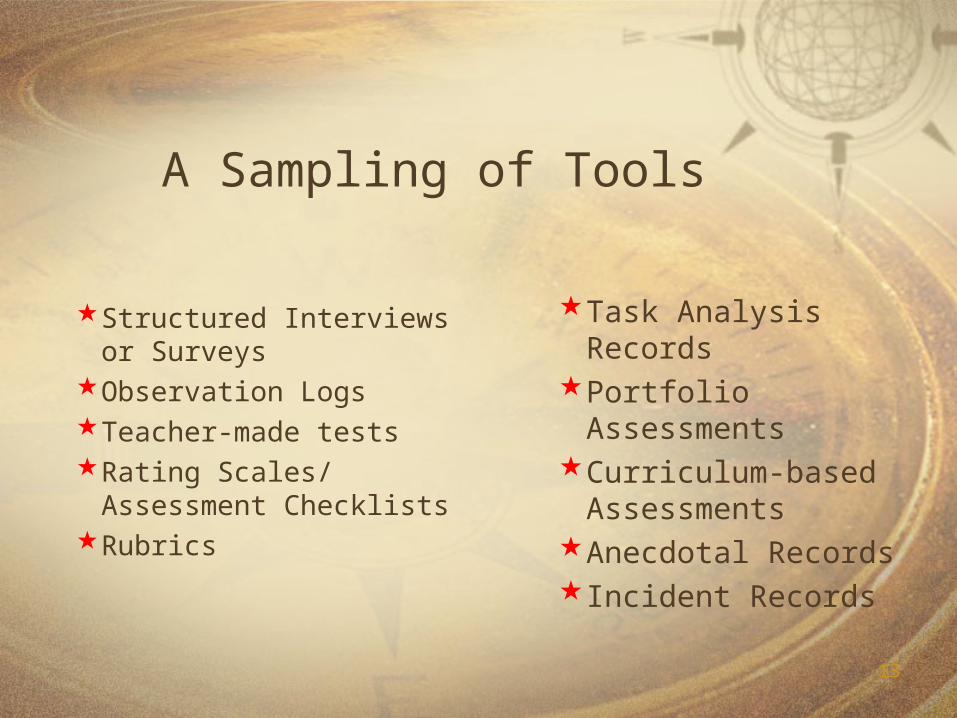
A Sampling of Tools
Structured Interviews or Surveys
Observation LogsTeacher-made testsRating Scales/
Assessment ChecklistsRubrics
Task Analysis Records
Portfolio Assessments
Curriculum-based Assessments
Anecdotal RecordsIncident Records
14
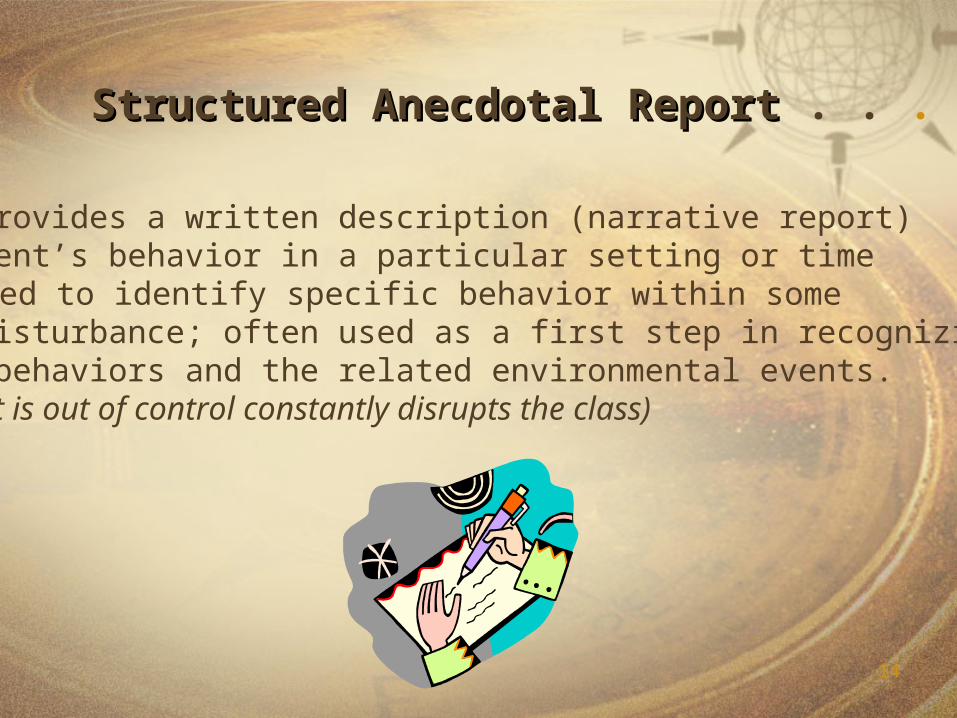
. . . . provides a written description (narrative report) of a student’s behavior in a particular setting or time period. Used to identify specific behavior within some general disturbance; often used as a first step in recognizing specific behaviors and the related environmental events. (Ex. student is out of control constantly disrupts the class)
Structured Anecdotal ReportStructured Anecdotal Report . . .
15
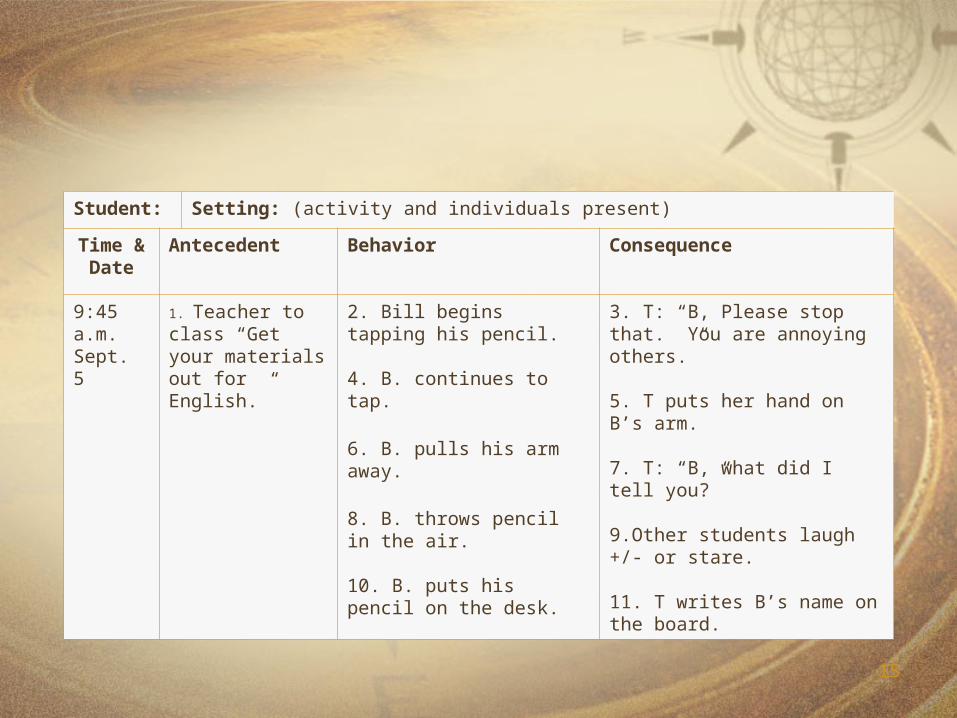
Student: Setting: (activity and individuals present)
Time &Date
Antecedent Behavior Consequence
9:45 a.m.Sept. 5
1. Teacher to class “Get your materials out for English.”
2. Bill begins tapping his pencil.
4. B. continues to tap.
6. B. pulls his arm away.
8. B. throws pencil in the air.
10. B. puts his pencil on the desk.
3. T: “B, Please stop that. You are annoying others.”
5. T puts her hand on B’s arm.
7. T: “B, what did I tell you?”
9.Other students laugh +/- or stare.
11. T writes B’s name on the board.
16
. . . . directly and accurately reflects the number of times a behavior occurs. Suitable for behaviors that have an obvious beginning and end. Recording tools include: tally marks, checkmarks, abacus, hand-held frequency counters, stitch counters, smile faces, tokens, etc. (Ex. word recognition, coin counting, verbal yes/no responses, drinking from a cup.)
Event RecordingEvent Recording . . .

17
Student ______________Observer______________Behavior____________________________________________
Date Time Tally Total
3/163/173/183/19
8:35a.m.-9:008:35a.m.-9:008:35a.m.-9:008:35a.m.-9:00
///////////////////////////////////////////////////////////////////////////
22 14 19 20

18
. . . . used to record the occurrence of a behavior within a specified time period. Results in an estimate of the actual number of times a behavior occurs.
Interval RecordingInterval Recording . . . .

19
Student: _________________________ Behavior: _________________Date/Time: _______________________ __________________________Observer: ________________________
10 sec 20 sec 30 sec 40 sec 50 sec 60 sec
+ + 0 0 + 0
20
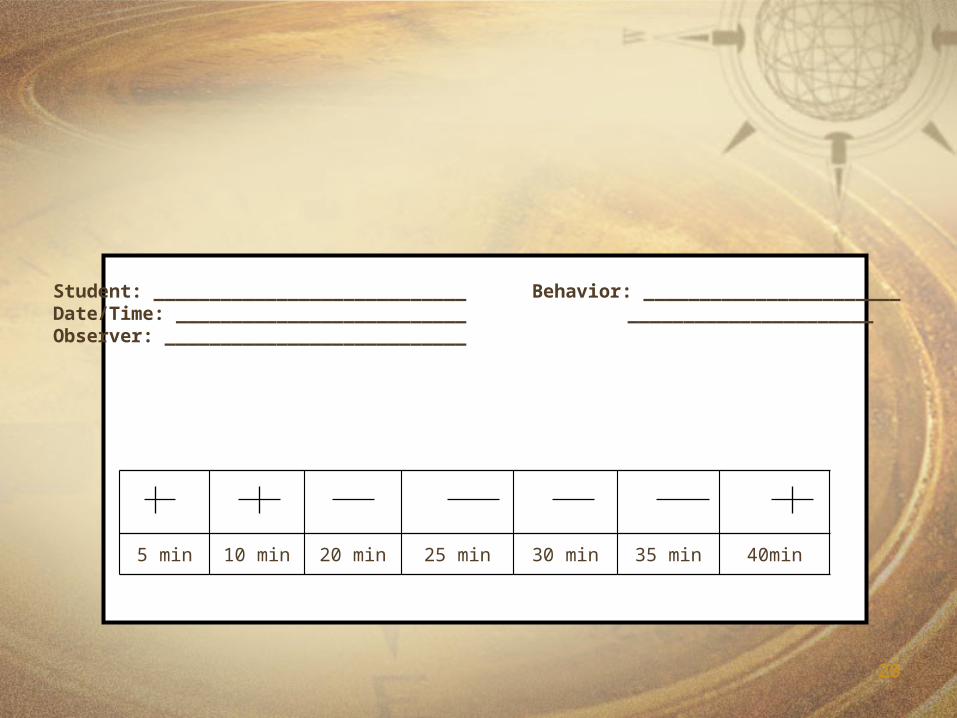
Student: ____________________________ Behavior: _______________________Date/Time: __________________________ ______________________Observer: ___________________________
5 min 10 min 20 min 25 min 30 min 35 min 40min

21
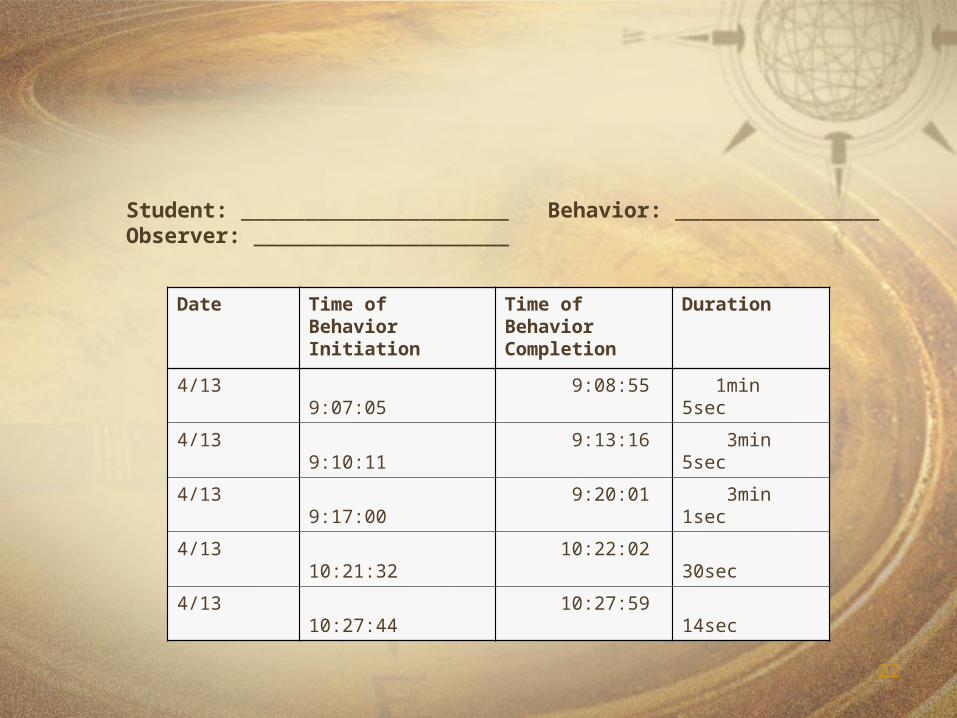
. . . . used to measure the length of time a student engages in a particular behavior. Suitable for behaviors that have a clear beginning and end. A timer is used to measure duration. (Ex. talking, screaming, interacting with peers, length of restroom breaks).
Duration Recording . . . . .
22
Student: _____________________ Behavior: ________________Observer: ____________________
Date Time of BehaviorInitiation
Time of BehaviorCompletion
Duration
4/13 9:07:05 9:08:55 1min 5sec
4/13 9:10:11 9:13:16 3min 5sec
4/13 9:17:00 9:20:01 3min 1sec
4/13 10:21:32 10:22:02 30sec
4/13 10:27:44 10:27:59 14sec

23
. . . .used to record the length of time that elapses from the time the student is cued until (s/he begins the behavior (Ex. beginning academic assignments, beginning to put away toys)
Latency Recording . . . .

24
Student _________________________ Behavior _____________________
Observer ________________________
Date Time of Cue Time of Initiation of Behavior Latency
2/18 1:07:05 1:07:11 6 sec
2/18 1:11:00 1:11:29 29 sec
2/18 1:22:54 1:23:02 8 sec

25
Activity
26
Activity 2
Look at chart from Activity 1
Determine what tool to use to gather data
Complete the “tool” column for each student

27
Representing the Data
Why Represent Data Visually?
Communicate program effectiveness to the
teacher, parents, student, etc. about: Instruction IEP Reevaluation
Provide reinforcement and feedback
Make decisions about continuing or improving instructional practices

28
Representing the Data
Appropriate representation
requires a graph to be:
Simple Stand alone Understandable

29
Representing the Data
Most common types of graphs used include:
Line Graph – used to reveal trends over time
Bar Graph – used to compare sets of values

30
Which is easier / quicker to interpret?
This:
Adam
Day 1 – 8 prompts Day 5 – 4 promptsDay 2 – 7 prompts Day 6 – 4 promptsDay 3 – 5 prompts Day 7 – 3 promptsDay 4 – 9 prompts Day 8 –
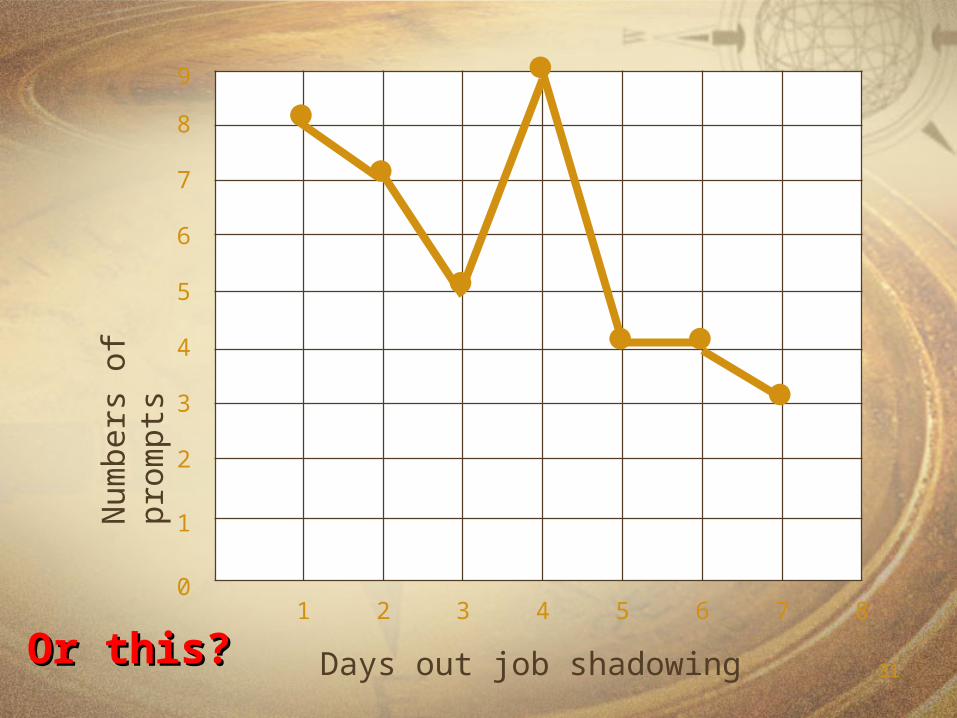
31Days out job shadowing
Num
bers
of
prom
pts
1 2 3 4 5 6 7 80
1
2
3
4
5
6
7
8
9
Or this?Or this?

32
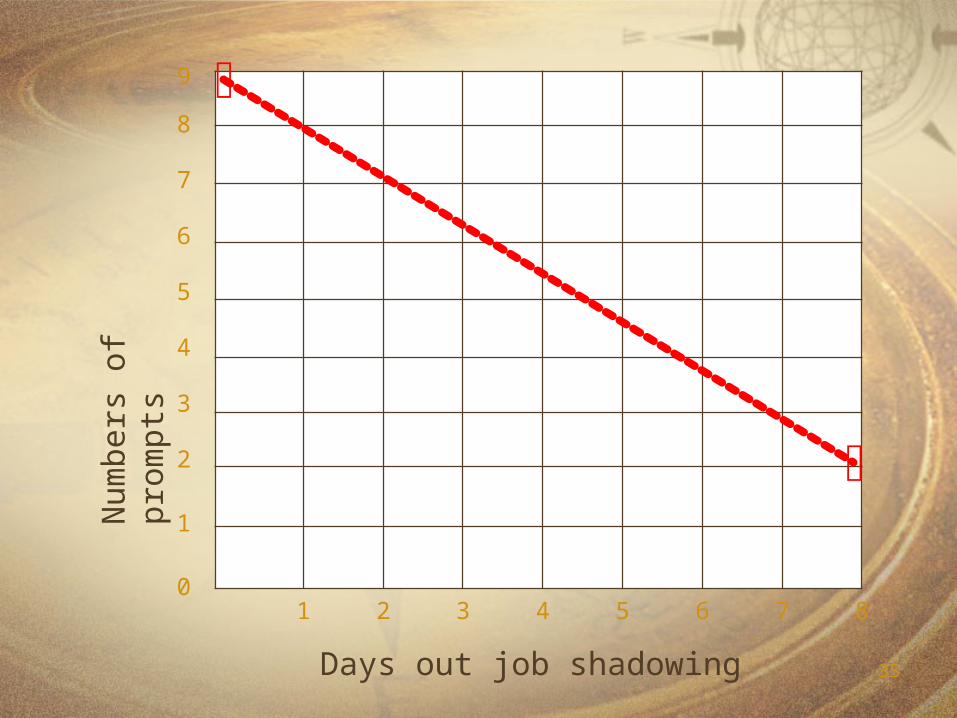
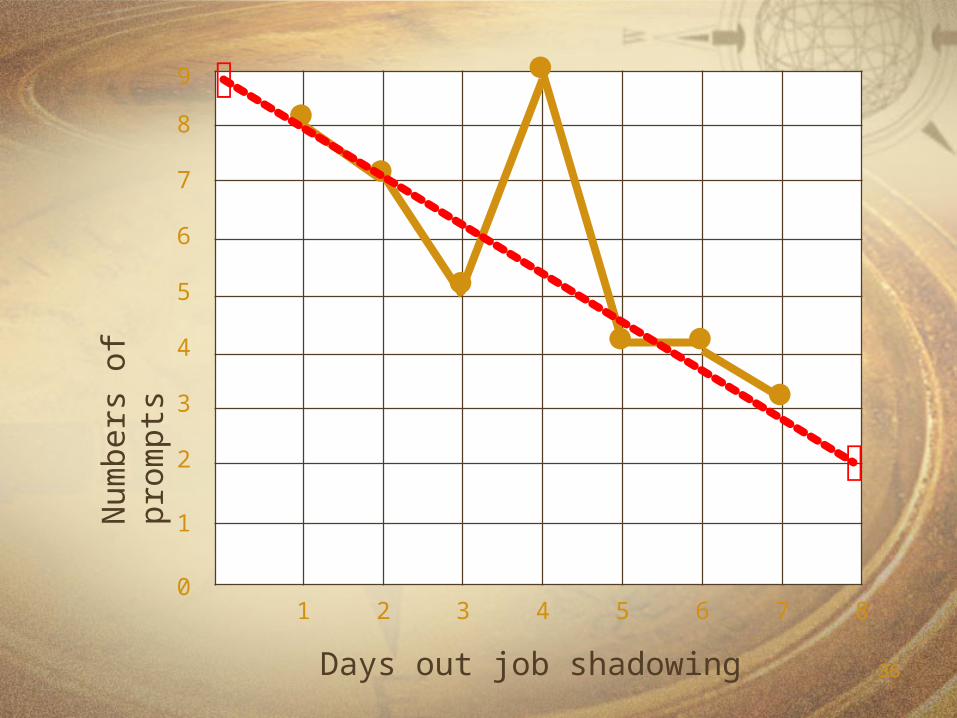
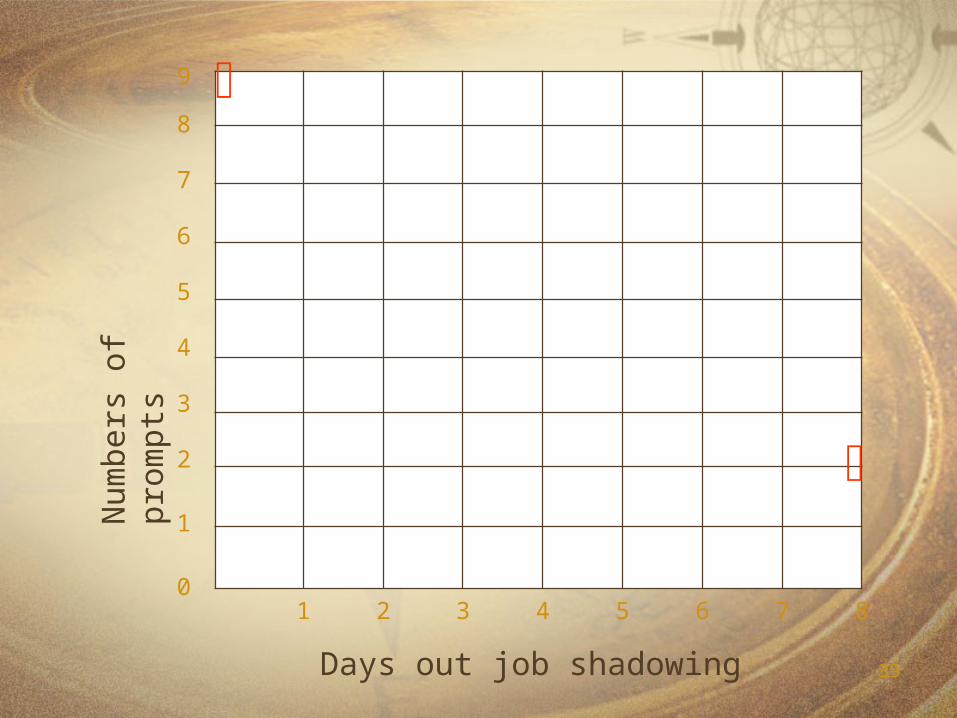
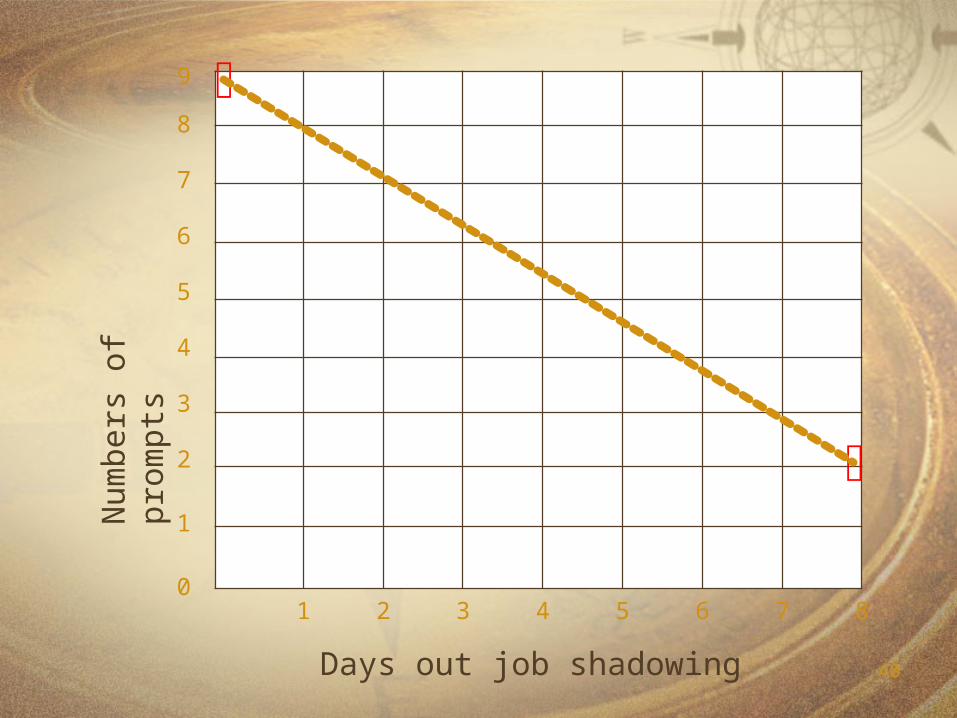
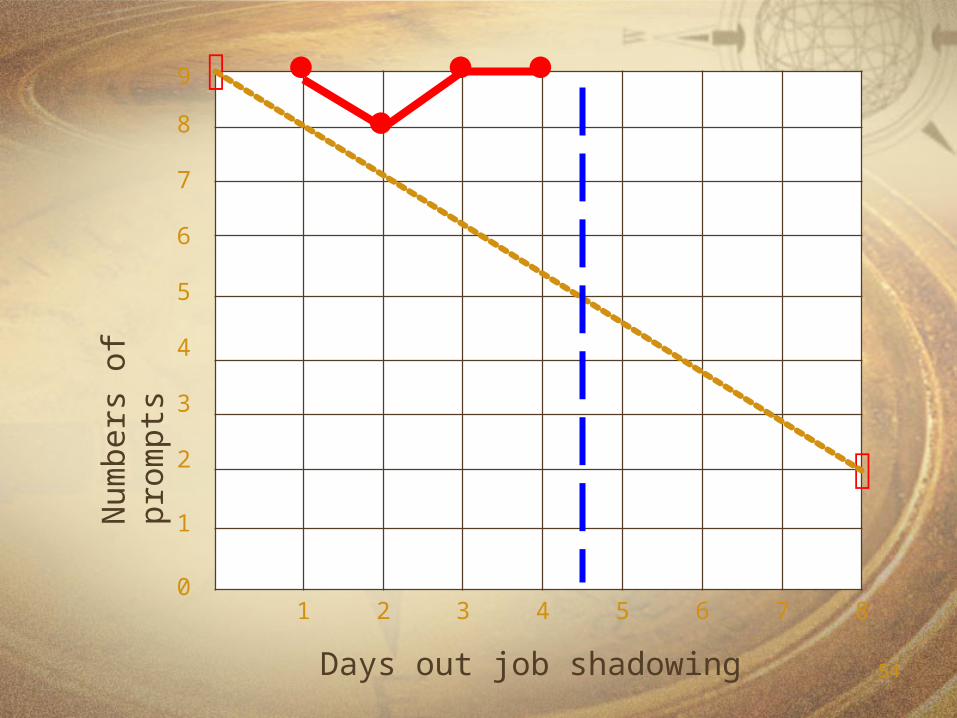
Is Adam making progress?

33Days out job shadowing
Num
bers
of
prom
pts
1 2 3 4 5 6 7 80
1
2
3
4
5
6
7
8
9

34Days out job shadowing
Num
bers
of
prom
pts
1 2 3 4 5 6 7 80
1
2
3
4
5
6
7
8
9
35Days out job shadowing
Num
bers
of
prom
pts
1 2 3 4 5 6 7 80
1
2
3
4
5
6
7
8
9
36Days out job shadowing
Num
bers
of
prom
pts
1 2 3 4 5 6 7 80
1
2
3
4
5
6
7
8
9

37
Is Adam making progress?

38Days out job shadowing
Num
bers
of
prom
pts
1 2 3 4 5 6 7 80
1
2
3
4
5
6
7
8
9
39Days out job shadowing
Num
bers
of
prom
pts
1 2 3 4 5 6 7 80
1
2
3
4
5
6
7
8
9
40Days out job shadowing
Num
bers
of
prom
pts
1 2 3 4 5 6 7 80
1
2
3
4
5
6
7
8
9

41Days out job shadowing
Num
bers
of
prom
pts
1 2 3 4 5 6 7 80
1
2
3
4
5
6
7
8
9

42
Evaluate the Data
Why evaluate the data?Effectiveness and efficiency of instruction
Who should evaluate the data?Teacher, Parents, Student, Others

43
Assumptions to consider before evaluating the data:
Teacher is implementing instructional strategies
Student is actively engaged in instruction
Aim line has been correctly identified based on
present levels of educational performance
Appropriate identification of annual goals and
objectives
44
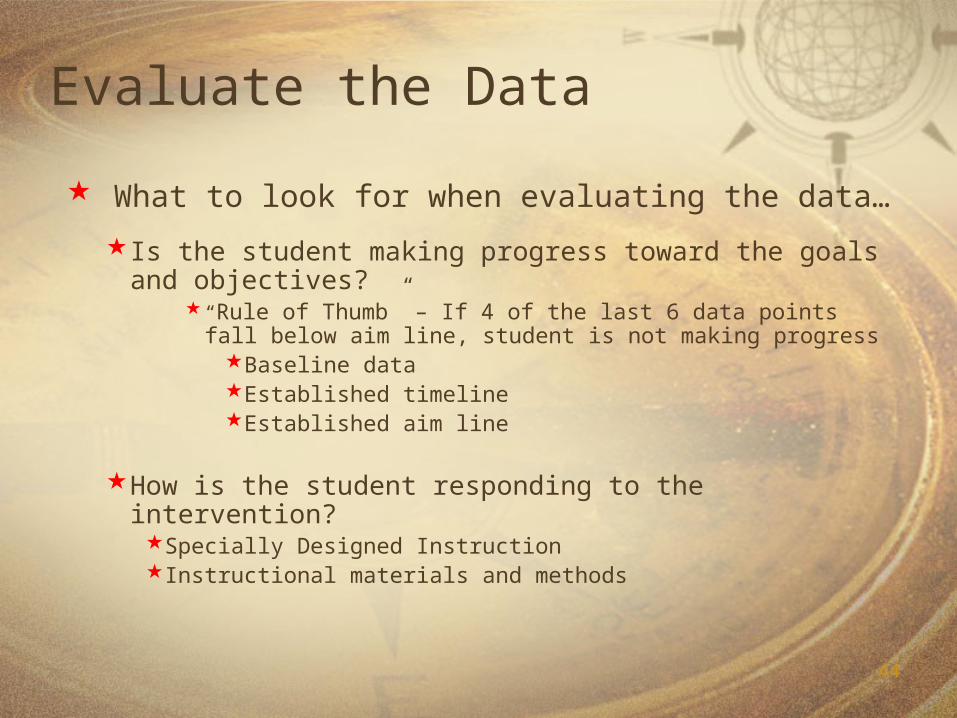
Evaluate the Data
What to look for when evaluating the data…
Is the student making progress toward the goals and objectives?
“Rule of Thumb” – If 4 of the last 6 data points fall below aim line, student is not making progress
Baseline dataEstablished timelineEstablished aim line
How is the student responding to the intervention?Specially Designed InstructionInstructional materials and methods
45
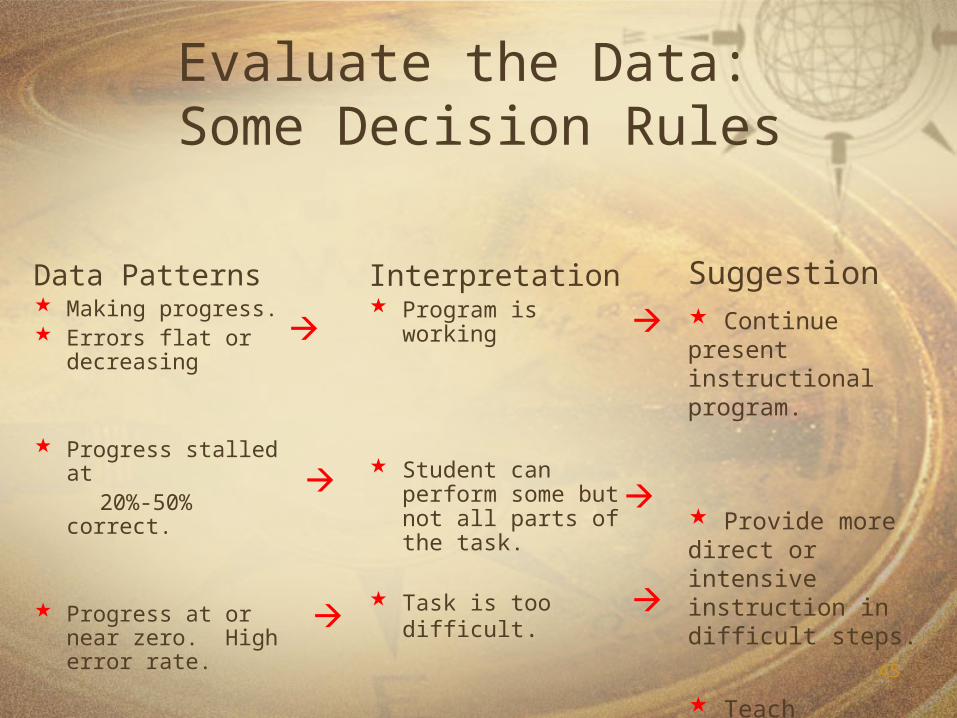
Evaluate the Data: Some Decision Rules
Data Patterns Making progress. Errors flat or
decreasing
Progress stalled at 20%-50% correct.
Progress at or near zero. High error rate.
Interpretation Program is working
Student can perform some but not all parts of the task.
Task is too difficult.
Suggestion Continue present instructional program.
Provide more direct or intensive instruction in difficult steps.
Teach prerequisite skills.

46
Evaluate the Data: More Decision Rules
Data Patterns Progress stalled close
to goal, no increase in rate
Meets aim line
Interpretation Student is ready for
skill building
Successful instructional program
SuggestionProvide frequent opportunities for practice to increase accuracy and rate.
Implement maintenance and generalization programs. Move on to new task.

47
Problem Solving Routine: IDEA
Inspect the last 4 data points
Decide what the scores look like . . .
Variable? Going up? Going down?
48
Problem Solving Routine: IDEA
Evaluate why scores are this way
Attendance? Motivation? Instruction?
49
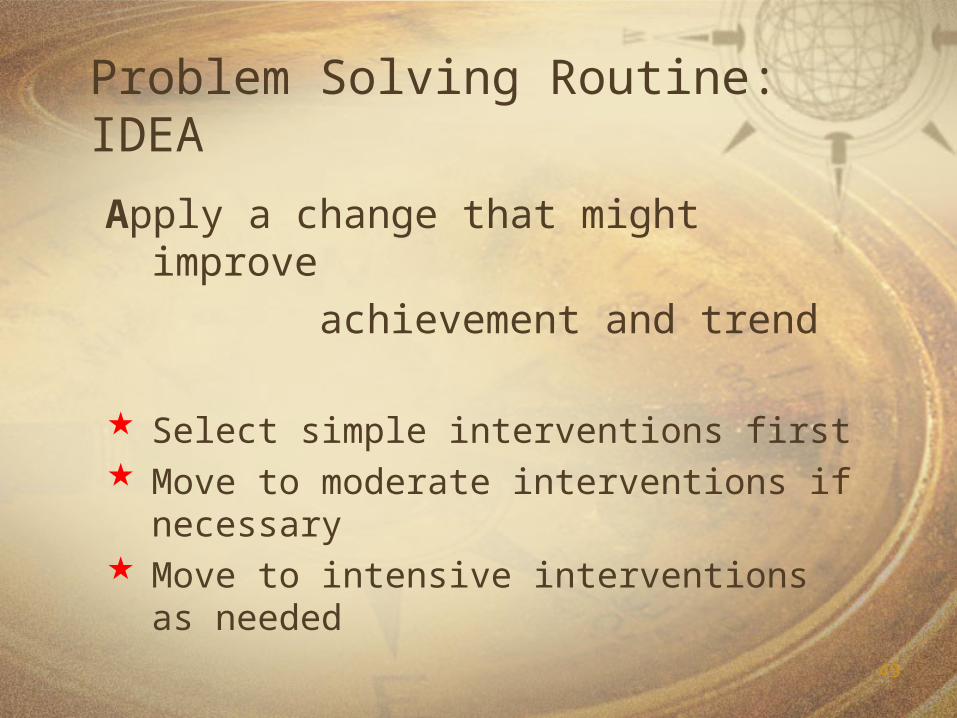
Problem Solving Routine: IDEA
Apply a change that might improve
achievement and trend
Select simple interventions first Move to moderate interventions if
necessary Move to intensive interventions as
needed
50
If student is not makingprogress, then
instructional adjustmentsmust be made.
51
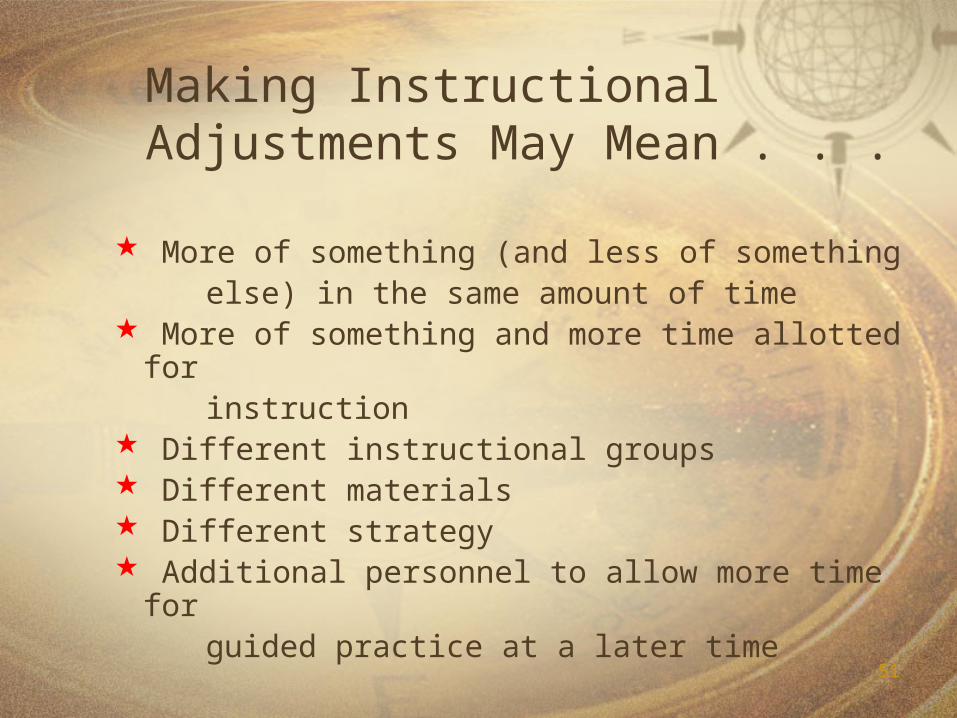
Making Instructional Adjustments May Mean . . .
More of something (and less of something else) in the same amount of time More of something and more time allotted for instruction Different instructional groups Different materials Different strategy Additional personnel to allow more time for guided practice at a later time

52
Levels of Instructional Adjustments
Look for simple changes first, before moving to more complex changes
Simple interventions Moderate interventions Intensive interventions

53
How do you represent data
after an instructional
adjustment?
54Days out job shadowing
Num
bers
of
prom
pts
1 2 3 4 5 6 7 80
1
2
3
4
5
6
7
8
9
55
Level of Performance
What changes occur immediately after a program modification?
Is there an immediate step (up or down) that results from the new intervention?
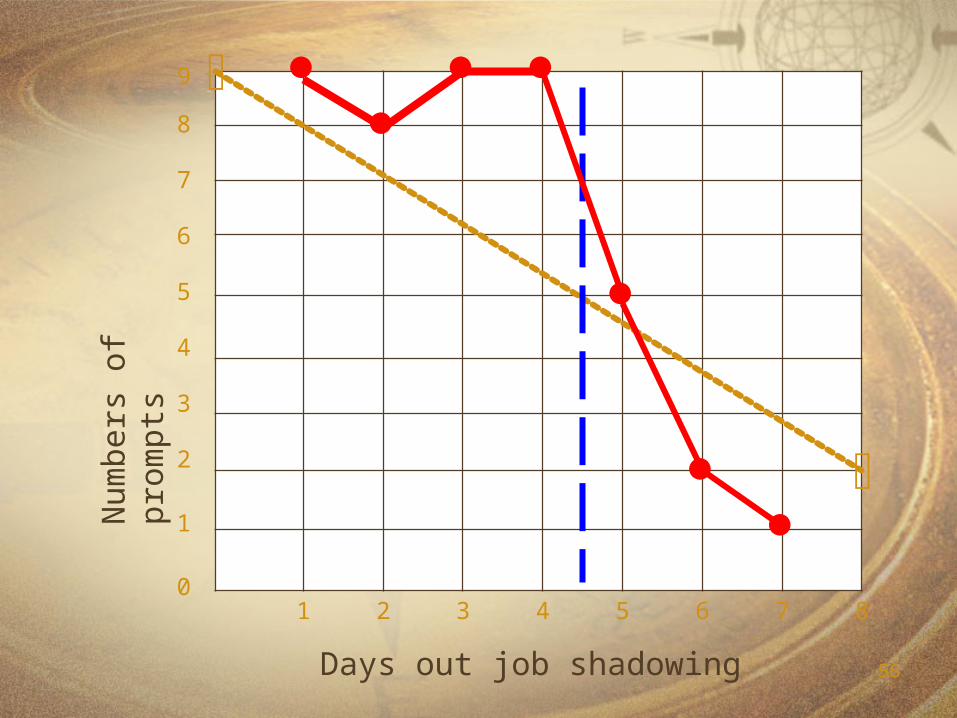
56Days out job shadowing
Num
bers
of
prom
pts
1 2 3 4 5 6 7 80
1
2
3
4
5
6
7
8
9
57
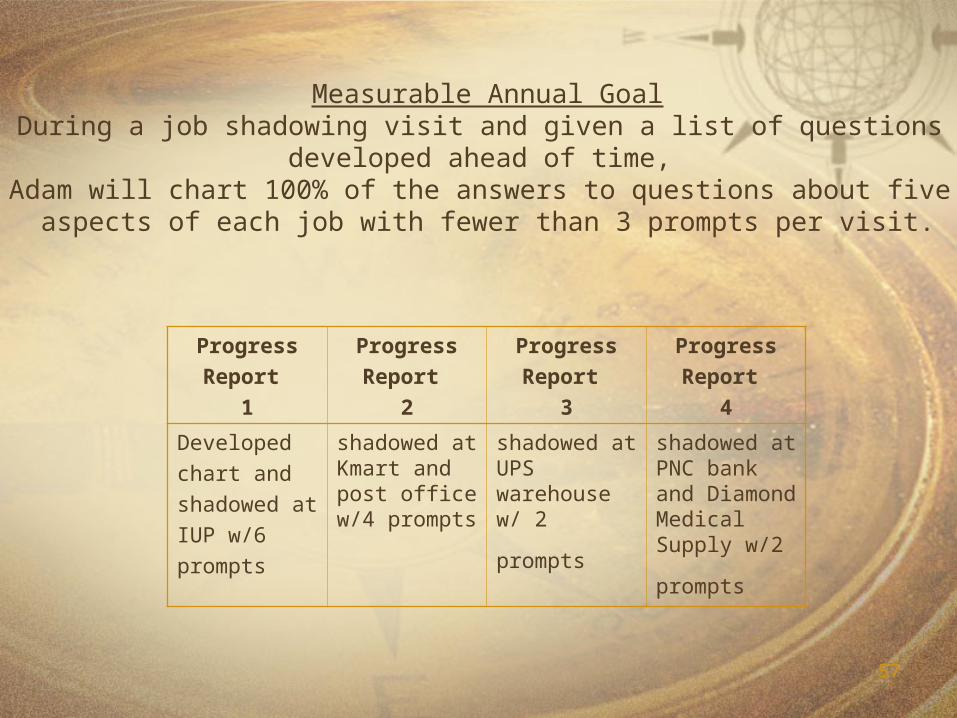
Measurable Annual GoalDuring a job shadowing visit and given a list of questions
developed ahead of time, Adam will chart 100% of the answers to questions about five
aspects of each job with fewer than 3 prompts per visit.
Progress
Report
1
Progress
Report
2
Progress
Report
3
Progress
Report
4
Developed
chart and
shadowed at
IUP w/6
prompts
shadowed at Kmart and post office w/4 prompts
shadowed at UPS warehouse w/
2 prompts
shadowed at PNC bank and Diamond Medical Supply w/2
prompts
58
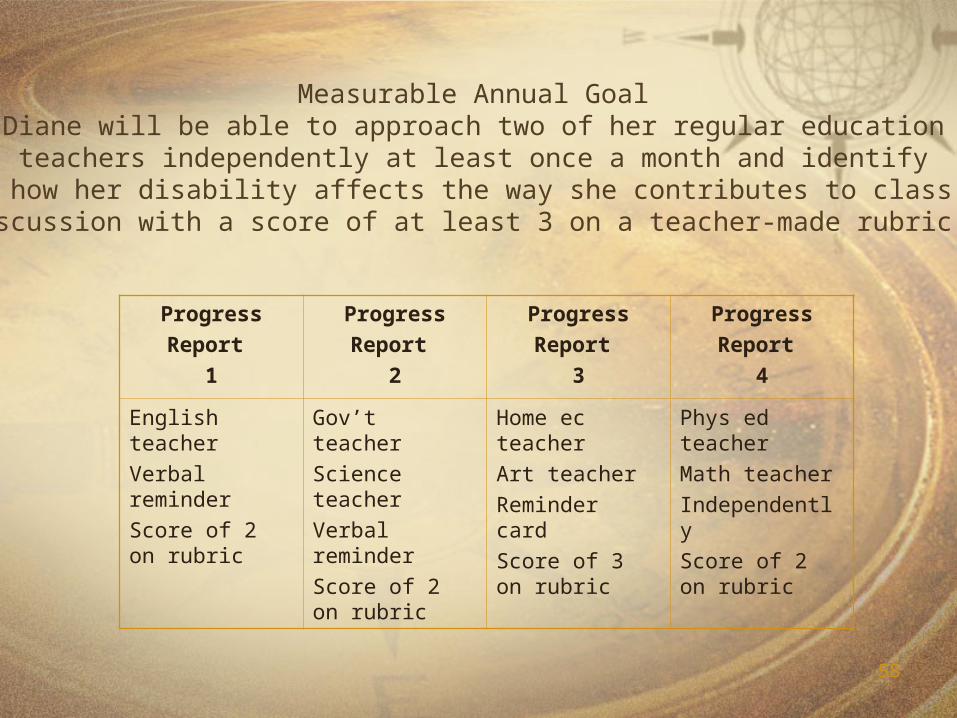
Measurable Annual GoalDiane will be able to approach two of her regular educationteachers independently at least once a month and identify how her disability affects the way she contributes to class
discussion with a score of at least 3 on a teacher-made rubric.
Progress
Report
1
Progress
Report
2
Progress
Report
3
Progress
Report
4
English teacher
Verbal reminder
Score of 2 on rubric
Gov’t teacher
Science teacher
Verbal reminder
Score of 2 on rubric
Home ec teacher
Art teacher
Reminder card
Score of 3 on rubric
Phys ed teacher
Math teacher
Independently
Score of 2 on rubric

59