1 Beaverdam Creek: An Environmental Perspective. 2 Chesapeake Bay Watershed.
14
1 Beaverdam Creek: An Environmental Perspective
-
Upload
rosanna-parrish -
Category
Documents
-
view
218 -
download
2
Transcript of 1 Beaverdam Creek: An Environmental Perspective. 2 Chesapeake Bay Watershed.

1
Beaverdam Creek:An Environmental Perspective

2
Chesapeake Bay Watershed

3
Montgomery County
Prince George's County
District of Columbia
#
Potomac River
#
Anacostia Watershed
N
5 0 5 10 Miles

4

5
Anacostia Watershed Background
• Urban, over 75% Developed
• Size : 176 mi2; avg. daily discharge: 138 cfs
• Drains both Piedmont and Coastal Plain
• 8.4 mile long tidal freshwater river portion
• Overall, approximately 25% impervious
• 805,000 + residents
• Diversity of people and streams

6
Six Restoration Goals
Goal 1: Reduce Pollutant Loads
Goal 2: Enhance Aquatic diversity and Encourage a Quality Urban Fishery
Goal 3: Restore Anadromous Fish Spawning Range
Goal 4: Increase Acreage and Quality of Wetlands
Goal 5: Expand Forest Cover and Riparian Buffers
Goal 6: Increase Public Awareness, Citizen Participation and “Friends of Groups”
7
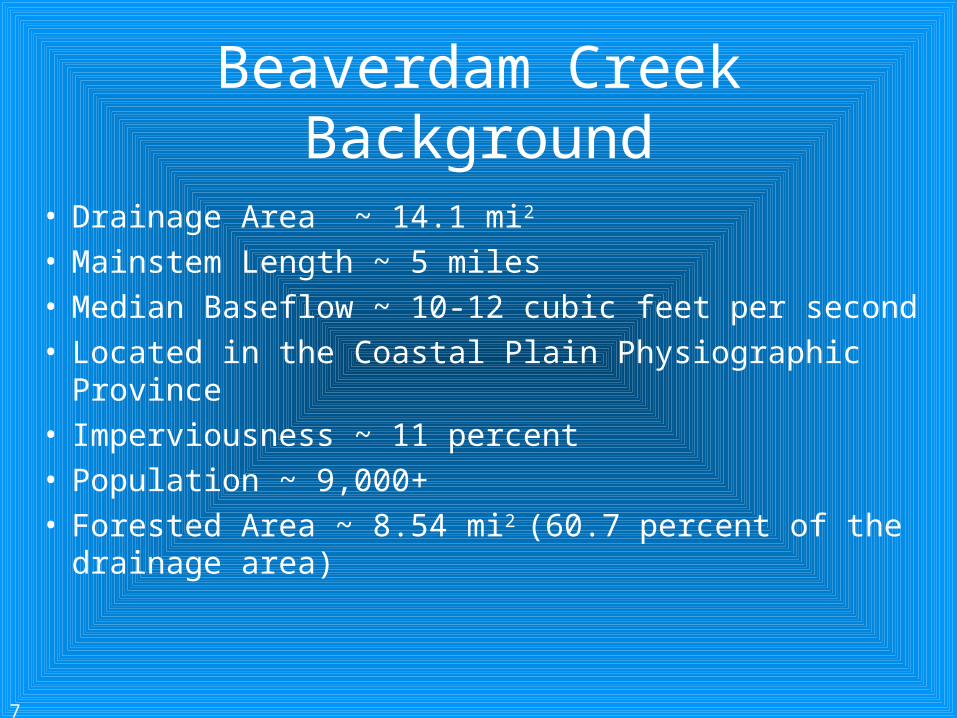
Beaverdam Creek Background
• Drainage Area ~ 14.1 mi2 • Mainstem Length ~ 5 miles• Median Baseflow ~ 10-12 cubic feet per second• Located in the Coastal Plain Physiographic Province• Imperviousness ~ 11 percent• Population ~ 9,000+• Forested Area ~ 8.54 mi2 (60.7 percent of the drainage
area)

8
Beaverdam Creek Subwatershed
Research Road
Soil Conservation Road
Springfield Road
Powder Mill Road
Edmonston Road
City of Greenbelt
9

10
How Does Beaverdam Creek Compare?

11
Subwatershed Watershed Area
Estimated % Impervious
Surfaces
Acres Sq. Miles
Sligo Creek 7,404.7 11.57 35.0%
Northwest Branch 26,808.6 41.89 17.0%
Paint Branch 13,285.6 20.76 18.0%
Little Paint Branch 6,687.3 10.45 19.0%
Indian Creek 9,930.5 15.52 20.0%
Upper Beaverdam Creek 9,007.9 14.07 11.0%
Still Creek 2,550.2 4.0 15.1%
Brier Ditch 2,598.3 4.1 26.4%
Northeast Branch 4,268.9 6.67 36.0%
Lower Beaverdam Creek 10,064.2 15.73 39.0%
Watts Branch 2,404.8 3.76 29.0%
Fort Chaplin 318.7 0.50 36.3%
Fort Dupont 457.1 0.71 13.3%
Pope Branch 249.9 0.39 28.0%
Estimated Percent Impervious Surface For Selected Anacostia Subwatersheds

12
Subwatershed Forest Watershed Area
% Watershed Covered by
Forest
Acres Sq. Miles Acres Sq. Miles
Sligo Creek 1,100.9 1.72 7,404.7 11.57 14.9%
Northwest Branch 8,282.0 12.94 26,808.6 41.89 30.9%
Paint Branch 4,829.8 7.55 13,285.6 20.76 36.4%
Little Paint Branch 2,105.7 3.29 6,687.3 10.45 31.5%
Indian Creek 3,064.5 4.79 9,930.5 15.52 30.9%
Upper Beaverdam Creek 5,464.2 8.54 9,007.9 14.07 60.7%
Still Creek 1,400.8 2.19 2,550.2 4.0 54.9%
Brier Ditch 762.7 1.19 2,598.3 4.1 29.4%
Northeast Branch 984.5 1.54 4,268.9 6.67 23.1%
Lower Beaverdam Creek 2,515.2 3.93 10,064.2 15.73 25.0%
Watts Branch 529.4 0.83 2,404.8 3.76 22.0%
Piney Run 91.2 0.14 1,014.6 1.59 9.0%
Fort Chaplin 62.2 0.10 318.7 0.50 19.5%
Fort Dupont 292.3 0.46 457.1 0.71 63.9%
Pope Branch 89.8 0.14 249.9 0.39 35.9%
Fort Davis 171.4 0.27 588.1 0.92 29.1%
Fort Stanton 104.6 0.16 366.9 0.57 28.5%
Forest Cover For Selected Anacostia Subwatersheds

13
MacroinvertebratesScores Verbal Rating 36 - 40 Excellent27 – 35 Good17 - 26 Fair0 - 16 Poor
Macroinvertebrate Index of Biotic Integrity (IBI)

14
Fish Scores Verbal Rating 47 – 50 Excellent35 – 46 Good23 – 34 Fair0 - 22 Poor
Fish Index of Biotic Integrity (IBI)