
1 b module hmts
81
Economics for Engineers Syllabus for HMTS3101 For HITK students by S.K.Sen Module 1 : a. Market: Meaning of Market, Types of Market, Perfect Competition, Monopoly, Monopolistic and Oligopoly market. b. The basic concept of economics – Needs, Wants, Utility. c. National Income-GDP, GNP. Demand & Supply, Law of demand, Role of demand and supply in price determination, Price Elasticity. d. Inflation: meaning, reasons, etc. (6L) Module 2 : a. Business: Types of business, Proprietorship, Partnership, Joint-stock company, and cooperative society – their characteristics. b. Banking: role of commercial banks; credit and its importance in industrial functioning. c. Role of central bank: Reserve Bank of India. d. International Business or Trade Environment. (4L) Module 3 : a. Financial Accounting-Journals. Ledgers, Trial Balance, Profit & Loss Account, Balance Sheet. b. Financial Statement Analysis (Ratio and Cash Flow analysis). (8L) c. Cost Accounting- Terminology, Fixed, Variable and Semi-variable costs, Break Even Analysis. d. Cost Sheet, Budgeting and Variance Analysis. e. Marginal Cost based decisions. (6L) Module 4 : a. Time Value of Money: Present and Future Value, Annuity, Perpetuity. b. Equity and Debt, Cost of Capital. c. Capital Budgeting: Methods of project appraisal - average rate of return - payback period - discounted cash flow method: net present value, benefit cost ratio, internal rate of return. d. Depreciation and its types, Replacement Analysis, Sensitivity Analysis.
-
Upload
ashis-manna -
Category
Education
-
view
28 -
download
0
Transcript of 1 b module hmts

Economics for EngineersSyllabus for HMTS3101
For HITK students by S.K.Sen
Module 1 :a. Market: Meaning of Market, Types of Market, Perfect Competition, Monopoly, Monopolistic and Oligopoly market. b. The basic concept of economics – Needs, Wants, Utility.c. National Income-GDP, GNP. Demand & Supply, Law of demand, Role of demand and supply in pricedetermination, Price Elasticity. d. Inflation: meaning, reasons, etc. (6L)Module 2 :a. Business: Types of business, Proprietorship, Partnership, Joint-stock company, and cooperative society – their characteristics.b. Banking: role of commercial banks; credit and its importance in industrial functioning. c. Role of central bank: Reserve Bank of India.d. International Business or Trade Environment. (4L)Module 3 :a. Financial Accounting-Journals. Ledgers, Trial Balance, Profit & Loss Account, Balance Sheet.b. Financial Statement Analysis (Ratio and Cash Flow analysis). (8L)c. Cost Accounting- Terminology, Fixed, Variable and Semi-variable costs, Break Even Analysis. d. Cost Sheet, Budgeting and Variance Analysis. e. Marginal Cost based decisions. (6L)Module 4 : a. Time Value of Money: Present and Future Value, Annuity, Perpetuity.b. Equity and Debt, Cost of Capital. c. Capital Budgeting: Methods of project appraisal - average rate of return - payback period - discounted cash flow method: net present value, benefit cost ratio, internal rate of return. d. Depreciation and its types, Replacement Analysis, Sensitivity Analysis.

Economics for EngineersSyllabus for HMTS3101
For HITK students by S.K.Sen
There will be 2 Internal Tests (One each from Module 1 and Module 2) as per Institute DairyPattern of Qs for Internal tests will be as per HITK template (3 Qs of 10 marks each; no MCQs)Pattern of Qs for End Sem exam will comprise 5 sections viz. – A, B, C, D and E –Sec A will have 10 MCQs of 1 mark each (no choice) -Sec B, C, D and E will have 2 Qs each from the Module 1, 2, 3 and 4 respectively [may have a), b), c) or a), b)] -Essay type Qs will be avoidedStudents are required to answer 5 out of 8 Qs, selecting at least one from each ModuleEvaluation : Max marks-100Internal Test-30Semester Test-70Suggested Readings :1. R. Narayanswami, Financial Accounting- A Managerial Perspective. Prentice-Hall of India Private Limited. New Delhi 2. Horne, James C Van, Fundamentals of Financial Management. Prentice-Hall of India Private Limited, New Delhi 3. H. L. Ahuja., Modern Economic Theory. S. Chand. New Delhi.4. Newman, Donald G., Eschenbach, Ted G., and Lavelle, Jerome P. Engineering Economic Analysis. New York: Oxford University Press. 2012.AEIE – Classes will be taken by SKS, AB and KCECE-D – Classes will be taken by SKS, AB and JG
10
12x5= 60

BASIC CONCEPT of
ECONOMICSNEEDS, WANTS, UTILITY
For HITK students by S.K.Sen

For HITK students by S.K.Sen
Economics is the Social Science that describes the factorsthat determine the production, distribution and consumptionof goods and services. It is the study of human efforts tosatisfy unlimited wants with limited resources.The term economics comes from the Ancient Greek (oikos,“house”) and (nomos, “custom” or “law”), hence “rules ofthe house (hold for good management)”. 'PoliticalEconomy' was the earlier name for the subject, buteconomists in the late 19th century suggested “Economics”as a shorter term for “Economic Science” to establish itselfas a separate discipline outside of Political Science andother Social Sciences.Economics focuses on the behaviour and interactions ofeconomic agents and how economies work. Consistent withthis focus, primary textbooks often distinguish betweenMicroeconomics and Macroeconomics.

For HITK students by S.K.Sen
Microeconomics examines the behaviour of basic elementsin the economy, including individual agents and markets,their interactions, and the outcomes of interactions.Individual agents may include, for example, households,firms, buyers, and sellers. Macroeconomics analyzes theentire economy (meaning aggregated production,consumption, savings, and investment) and issuesaffecting it, including unemployment of resources (labour,capital, and land), inflation, economic growth, and thepublic policies that address these issues (monetary, fiscal,and other policies).Other broad distinctions within economics include thosebetween positive economics, describing “what is”, andnormative economics, advocating “what ought to be”;between economic theory and applied economics; between

For HITK students by S.K.Sen
rational and behavioural economics; and between mainstreameconomics (more “orthodox” and dealing with the“rationality-individualism-equilibrium nexus”) and heterodoxeconomics (more “radical” and dealing with the “institutions-history-social structure nexus”). Besides the traditionalconcern in production, distribution, and consumption in aneconomy, economic analysis may be applied throughoutsociety, as in business, finance, health care, and government.Economic analysis may also be applied to such diversesubjects as crime, education, the family, law, politics,religion, social institutions, war, science, and theenvironment. Education, for example, requires time, effort,and expenses, plus the foregone income and experience, yetthese losses can be weighted against future benefits educationmay bring to the agent or the economy. At the turn of the 21stcentury, the expanding domain of economics in the socialsciences has been described as economic imperialism.

For HITK students by S.K.Sen
The ultimate goal of economics is to improve the livingconditions of people in their everyday life.There are a variety of modern definitions of economics.Some of the differences may reflect evolving views of thesubject or different views among economists. Scottishphilosopher Adam Smith (1776) defined what was thencalled political economy as “an inquiry into the nature andcauses of the wealth of nations”, in particular as : a branchof the science of a statesman or legislator with the twofoldobjectives of providing a plentiful revenue or subsistencefor the people ... and to supply the state or commonwealthwith a revenue for the public services.J. B. Say (1803), distinguishing the subject from its public-policy uses, defines it as the science of production,distribution, and consumption of wealth. On the satirical

For HITK students by S.K.Sen
side, Thomas Carlyle (1849) coined "the dismal science" asan epithet for classical economics, in this context,commonly linked to the pessimistic analysis of Malthus(1798). John Stuart Mill (1844) defines the subject in asocial context as: The science which traces the laws of suchof the phenomena of society as arise from the combinedoperations of mankind for the production of wealth, in sofar as those phenomena are not modified by the pursuit ofany other object.Alfred Marshall provides a still widely cited definition inhis textbook Principles of Economics (1890) that extendsanalysis beyond wealth and from the societal to themicroeconomic level : Economics is a study of man in theordinary business of life. It enquires how he gets his incomeand how he uses it. Thus, it is on the one side, the study of

For HITK students by S.K.Sen
wealth and on the other and more important side, a part ofthe study of man.Lionel Robbins (1932) developed implications of what hasbeen termed "perhaps the most commonly accepted currentdefinition of the subject": Economics is a science whichstudies human behaviour as a relationship between ends andscarce means which have alternative uses.Robbins describes the definition as not classificatory in"picking out certain kinds of behaviour" but ratheranalytical in "focusing attention on a particular aspect ofbehaviour, the form imposed by the influence of scarcity."He affirmed that previous economist have usually centeredtheir studies on the analysis of wealth: how wealth iscreated (production), distributed, and consumed; and howwealth can grow. But he said that economics can be used to

For HITK students by S.K.Sen
study other things, such as war, that are outside its usualfocus. This is because war has as the goal winning it (as asought after end), generates both cost and benefits; and,resources (human life and other costs) are used to attain thegoal. If the war is not winnable or if the expected costsoutweigh the benefits, the deciding actors (assuming theyare rational) may never go to war (a decision) but ratherexplore other alternatives. We cannot define economics asthe science that studies wealth, war, crime, education, andany other field economic analysis can be applied to; but, asthe science that studies a particular common aspect of eachof those subjects (they all use scarce resources to attain asought after end).Microeconomics examines how entities, forming a marketstructure, interact within a market to create a market

For HITK students by S.K.Sen
system. These entities include private and public playerswith various classifications, typically operating underscarcity of tradeable units and government regulation. Theitem traded may be a tangible product such as apples or aservice such as repair services, legal counsel, orentertainment.In theory, in a free market the aggregates (sum of) ofquantity demanded by buyers and quantity supplied bysellers will be equal and reach economic equilibrium overtime in reaction to price changes; in practice, various issuesmay prevent equilibrium, and any equilibrium reached maynot necessarily be morally equitable. For example, if thesupply of healthcare services is limited by external factors,the equilibrium price may be unaffordable for many whodesire it but cannot pay for it.

For HITK students by S.K.Sen
Various market structures exist. In perfectly competitivemarkets, no participants are large enough to have the marketpower to set the price of a homogeneous product. In otherwords, every participant is a “price taker” as no participantinfluences the price of a product. In the real world, marketsoften experience imperfect competition.Forms include monopoly (in which there is only one sellerof a good), duopoly (in which there are only two sellers of agood), oligopoly (in which there are few sellers of a good),monopolistic competition (in which there are many sellersproducing highly differentiated goods), monopsony (inwhich there is only one buyer of a good), and oligopsony(in which there are few buyers of a good). Unlike perfectcompetition, imperfect competition invariably meansmarket power is unequally distributed. Firms under

For HITK students by S.K.Sen
imperfect competition have the potential to be "pricemakers", which means that, by holding a disproportionatelyhigh share of market power, they can influence the prices oftheir products.Microeconomics studies individual markets by simplifyingthe economic system by assuming that activity in themarket being analysed does not affect other markets. Thismethod of analysis is known as partial-equilibrium analysis(supply and demand). This method aggregates (the sum ofall activity) in only one market. General-equilibrium theorystudies various markets and their behaviour. It aggregates(the sum of all activity) across all markets. This methodstudies both changes in markets and their interactionsleading towards equilibrium.

For HITK students by S.K.Sen
In microeconomics, production is the conversion of inputsinto outputs. It is an economic process that uses inputs tocreate a commodity or a service for exchange or direct use.Production is a flow and thus a rate of output per period oftime. Distinctions include such production alternatives asfor consumption (food, haircuts, etc.) vs. investment goods(new tractors, buildings, roads, etc.), public goods (nationaldefense, smallpox vaccinations, etc.) or private goods (newcomputers, bananas, etc.), and "guns" vs. "butter".Opportunity cost refers to the economic cost of production :the value of the next best opportunity foregone. Choicesmust be made between desirable yet mutually exclusiveactions. It has been described as expressing “the basicrelationship between scarcity and choice”. For example, if abaker uses a sack of flour to make pretzels (type of baked bread or

For HITK students by S.K.Sen
crisp biscuit) one morning, then the baker cannot use either theflour or the morning to make bagels (dense bread roll) instead. Partof the cost of making pretzels is that neither the flour northe morning are available any longer, for use in some otherway. The opportunity cost of an activity is an element inensuring that scarce resources are used efficiently, such thatthe cost is weighed against the value of that activity indeciding on more or less of it. Opportunity costs are notrestricted to monetary or financial costs but could bemeasured by the real cost of output forgone, leisure, oranything else that provides the alternative benefit (utility).Inputs used in the production process include such primaryfactors of production as labour services, capital (durableproduced goods used in production, such as an existingfactory), and land (including natural resources). Other

For HITK students by S.K.Sen
inputs may include intermediate goods used in productionof final goods, such as the steel in a new car.Economic efficiency describes how well a system generatesdesired output with a given set of inputs and availabletechnology. Efficiency is improved if more output isgenerated without changing inputs, or in other words, theamount of “waste” is reduced. A widely accepted generalstandard is Pareto efficiency, which is reached when nofurther change can make someone better off without makingsomeone else worse off.

For HITK students by S.K.Sen
Opportunity Cost - The cost of an economic decision. Theclassic example is “guns or butter.” What should a nationproduce; butter, a need, or guns, a want? What is the costof either decision? If we choose the guns the cost is thebutter. If we choose butter, the cost is the guns. Nationsmust always deal with the questions faced by opportunitycost. It is a matter of choices. Resources are limited thuswe cannot meet every need or want.
For HITK students by S.K.Sen

For HITK students by S.K.Sen
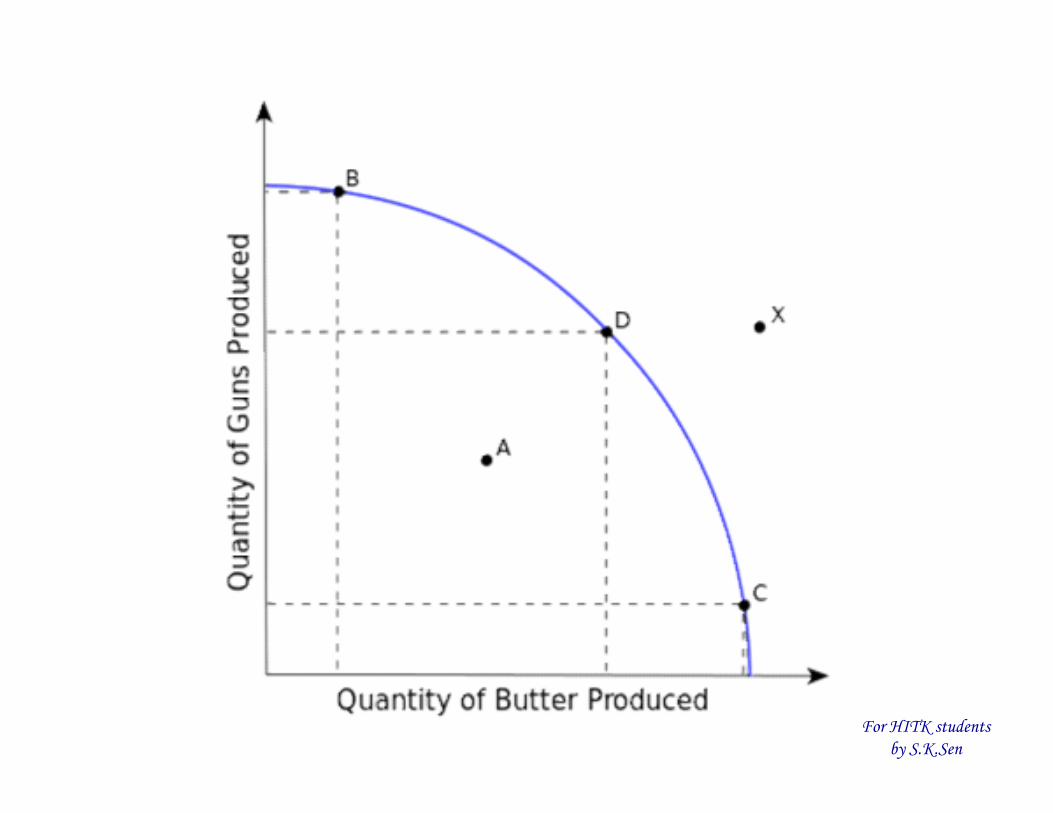
The production-possibility frontier (PPF) is an expositoryfigure for representing scarcity, cost, and efficiency. In thesimplest case an economy can produce just two goods (say“guns” and “butter”). The PPF is a table or graph (inprevious slide) showing the different quantity combinationsof the two goods producible with a given technology andtotal factor inputs, which limit feasible total output. Eachpoint on the curve shows potential total output for theeconomy, which is the maximum feasible output of onegood, given a feasible output quantity of the other good.Scarcity is represented in the figure by people being willingbut unable in the aggregate to consume beyond the PPF(such as at X) and by the negative slope of the curve. Ifproduction of one good increases along the curve,production of the other good decreases, an inverse

For HITK students by S.K.Sen
relationship. This is because increasing output of one goodrequires transferring inputs to it from production of theother good, decreasing the latter.The slope of the curve at a point on it gives the trade-offbetween the two goods. It measures what an additional unitof one good costs in units forgone of the other good, anexample of a real opportunity cost. Thus, if one more Guncosts 100 units of butter, the opportunity cost of one Gun is100 Butter. Along the PPF, scarcity implies that choosingmore of one good in the aggregate entails doing with lessof the other good. Still, in a market economy, movementalong the curve may indicate that the choice of theincreased output is anticipated to be worth the cost to theagents.

For HITK students by S.K.Sen
By construction, each point on the curve shows productiveefficiency in maximizing output for given total inputs. Apoint inside the curve (as at A), is feasible but representsproduction inefficiency (wasteful use of inputs), in thatoutput of one or both goods could increase by moving in anortheast direction to a point on the curve. Examples citedof such inefficiency include high unemployment during abusiness-cycle recession or economic organization of acountry that discourages full use of resources. Being on thecurve might still not fully satisfy allocative efficiency (alsocalled Pareto efficiency) if it does not produce a mix ofgoods that consumers prefer over other points.Much applied economics in public policy is concerned withdetermining how the efficiency of an economy can beimproved. Recognizing the reality of scarcity and then
For HITK students by S.K.Sen
figuring out how to organize society for the most efficientuse of resources has been described as the “essence ofeconomics”, where the subject “makes its uniquecontribution.”

For HITK students by S.K.Sen
Macroeconomics examines the economy as a whole toexplain broad aggregates and their interactions “top down”,that is, using a simplified form of general-equilibriumtheory. Such aggregates include national income andoutput, the unemployment rate, and price inflation andsubaggregates like total consumption and investmentspending and their components. It also studies effects ofmonetary policy and fiscal policy.Since at least the 1960s, macroeconomics has beencharacterized by further integration as to micro-basedmodeling of sectors, including rationality of players,efficient use of market information, and imperfectcompetition. This has addressed a long-standing concernabout inconsistent developments of the same subject.

For HITK students by S.K.Sen
Macroeconomic analysis also considers factors affectingthe long-term level and growth of national income. Suchfactors include capital accumulation, technological changeand labour force growth.

For HITK students by S.K.Sen

For HITK students by S.K.Sen
Wants : Simply the desires. Wants are different fromneeds. They are means of expressing a perceived need.Wants are broader than needs. The idea of want can beexamined from many perspectives. In secular societieswant might be considered similar to the emotional desire,which can be studied scientifically through the disciplinesof psychology or sociology. Want might also be examinedin economics as a necessary ingredient in sustaining andperpetuating capitalist societies that are organised aroundprinciples like consumerism. Alternatively want can bestudied in a non-secular, spiritual, moralistic or religiousway, particularly by Buddhism but also Christianity, Islamand Judaism.In economics, a want is something that is desired. It is saidthat every person has unlimited wants, but limited

For HITK students by S.K.Sen
resources (Economics is based on the assumption that onlylimited resources are available to us from the infiniteuniverse). Thus, people cannot have everything they wantand must look for the most affordable alternatives.Wants are often distinguished from needs. A need issomething that is necessary for survival (suchas food and shelter), whereas a want is simply somethingthat a person would like to have. Some economists haverejected this distinction and maintain that all of these aresimply wants, with varying levels of importance. By thisviewpoint, wants and needs can be understood as examplesof the overall concept of demand.Needs : Needs are based on physiological, personal, orsocio-economic requirements necessary for an individualto function and live. Food, cloth, shelter and other needs of

For HITK students by S.K.Sen
daily life are basic requirements for survival. In recentyears we have seen a perceived shift of certain items fromwants to needs eg. – mobile phones, vehicles, etc. etc.A need is something that is necessary for an organism tolive a healthy life. Needs are distinguished from wants inthat, in the case of a need, a deficiency causes a clearadverse outcome: a dysfunction or death.Needs can be objective and physical, such as the need forfood, or psychological and subjective, such as the needfor self-esteem.There are also needs of a social or societal nature.Needs and wants are a matter of interest in, and form acommon substrate for, the fields of Philosophy, Biology,Psychology, Social Science, Economics and Politics.

For HITK students by S.K.Sen
Utility : In economics, utility is a measure of preferencesover some set of goods and services. The concept is animportant underpinning of rational choice theory ineconomics and game theory, because it representssatisfaction experienced by the consumer of a good. Agood is something that satisfies human wants. Since onecannot directly measure benefit, satisfactionor happiness from a good or service, economists insteadhave devised ways of representing and measuring utility interms of economic choices that can be measured.Economists have attempted to perfect highly abstractmethods of comparing utilities by observing andcalculating economic choices. In the simplest sense,economists consider utility to be revealed in people'swillingness to pay different amounts for different goods.

For HITK students by S.K.Sen
Applications : Utility is usually applied by economists insuch constructs as the indifference curve, which plot thecombination of commodities that an individual or a societywould accept to maintain a given level of satisfaction.Utility and indifference curves are used by economists tounderstand the underpinnings of demand curves, which arehalf of the supply and demand analysis that is used toanalyze the workings of goods markets.Individual utility and social utility can be construed as thevalue of a utility function and a social welfarefunction respectively. When coupled with production orcommodity constraints, under some assumptions thesefunctions can be used to analyze Pareto efficiency, such asillustrated by Edgeworth boxes in contract curves. Suchefficiency is a central concept in welfare economics.

For HITK students by S.K.Sen
In finance, utility is applied to generate an individual'sprice for an asset called the indifference price. Utilityfunctions are also related to risk measures, with the mostcommon example being the entropic risk measure.Scarcity : The fundamental economic problem facing allsocieties. Essentially it is how to satisfy unlimited wantswith limited resources. This is the issue that plagues allgovernment and peoples.Economic View of Needs and Wants : The economic viewof needs and wants utilizes the fictional concept of theeconomic man, who acts rationally to maximize hispotential to consume goods and services that offer him thehighest degree of utility or satisfaction. Our economicman's quest is limitless. While your needs may eventually

For HITK students by S.K.Sen
be satisfied for a while, according to economic theory,wants never are.For example, a one-bedroom apartment fulfills your needsand wants for housing, but once you get married, you wanta townhouse. The want changes to a three-bedroom housewhen the first kid comes along. Then you decide you wanta house with a few extra bedrooms, and a pool wouldn't bebad either, even though the original house fulfills yourneed for family housing.Ethical Considerations : The economic perspective ofneeds and wants raises some ethical concerns. One concernis that consumers are subject to undue persuasion from aconsumer culture that makes it difficult for them todetermine their true needs and wants, rather than

For HITK students by S.K.Sen
artificially manufactured needs and wants. A great exampleof a manufactured want is the pet rock, which served noutilitarian purpose.Another concern is the idea of consumer lock-in, whereour society requires individuals to obtain more and moreincome and consumption to meet fundamental needs. Forexample, once upon a time, people functioned perfectlyfine without personal automobiles, computers, and cellphones, but now most people view these items as essentialneeds. All these 'needs' add up.In economics, utility is a measure of preferences over someset of goods and services. The concept is an importantunderpinning of rational choice theory in economics andgame theory, because it represents satisfaction experiencedby the consumer of a good. A good is something that

For HITK students by S.K.Sen
satisfies human wants. Since one cannot directly measurebenefit, satisfaction or happiness from a good or service,economists instead have devised ways of representing andmeasuring utility in terms of economic choices that can bemeasured. Economists have attempted to perfect highlyabstract methods of comparing utilities by observing andcalculating economic choices. In the simplest sense,economists consider utility to be revealed in people'swillingness to pay different amounts for different goods.Applications : Utility is usually applied by economists insuch constructs as the indifference curve, which plot thecombination of commodities that an individual or a societywould accept to maintain a given level of satisfaction.Utility and indifference curves are used by economists tounderstand the underpinnings of demand curves, which are

For HITK students by S.K.Sen
half of the supply and demand analysis that is used toanalyze the workings of goods markets.Individual utility and social utility can be construed as thevalue of a utility function and a social welfare functionrespectively. When coupled with production or commodityconstraints, under some assumptions these functions can beused to analyze Pareto efficiency, such as illustrated byEdgeworth boxes in contract curves. Such efficiency is acentral concept in welfare economics.In finance, utility is applied to generate an individual'sprice for an asset called the indifference price. Utilityfunctions are also related to risk measures, with the mostcommon example being the entropic risk measure.

For HITK students by S.K.Sen
Revealed preference : It was recognized that utility couldnot be measured or observed directly, so insteadeconomists devised a way to infer underlying relativeutilities from observed choice. These 'revealedpreferences', as they were named by Paul Samuelson, wererevealed e.g. in people's willingness to pay:Utility is taken to be correlative to Desire or Want. It hasbeen already argued that desires cannot be measureddirectly, but only indirectly, by the outward phenomena towhich they give rise: and that in those cases withwhichveconomics is chiefly concerned the measure isfound in the price which a person is willing to pay for thefulfillment or satisfaction of his desire.Utility functions : There has been some controversy overthe question whether the utility of a commodity can be
For HITK students by S.K.Sen
measured or not. At one time, it was assumed that theconsumer was able to say exactly how much utility he gotfrom the commodity. The economists who made thisassumption belonged to the 'cardinalist school' ofeconomics. Today utility functions, expressing utility as afunction of the amounts of the various goods consumed,are treated as either cardinal or ordinal, depending onwhether they are or are not interpreted as providing moreinformation than simply the rank ordering of preferencesover bundles of goods, such as information on the strengthof preferences.

For HITK students by S.K.Sen
Cardinal utility : When cardinal utility is used, themagnitude of utility differences is treated as an ethically orbehaviourally significant quantity. For example, suppose acup of orange juice has utility of 120 utils, a cup of tea hasa utility of 80 utils, and a cup of water has a utility of 40utils. With cardinal utility, it can be concluded that the cupof orange juice is better than the cup of tea by exactly thesame amount by which the cup of tea is better than the cupof water. One cannot conclude, however, that the cup of teais two thirds as good as the cup of juice, because thisconclusion would depend not only on magnitudes of utilitydifferences, but also on the "zero" of utility.Neoclassical economics has largely retreated from usingcardinal utility functions as the basis of economicbehaviour. A notable exception is in the context ofanalyzing choice under conditions of risk.

For HITK students by S.K.Sen
Sometimes cardinal utility is used to aggregate utilitiesacross persons, to create a social welfare function. Theargument against this is that interpersonal comparisons ofutility are meaningless because there is no simple way tointerpret how different people value consumption bundles.Ordinal utility : When ordinal utilities are used, differencesin utils (values taken on by the utility function) are treatedas ethically or behaviourally meaningless: the utility indexencodes a full behavioural ordering between members of achoice set, but tells nothing about the related strength ofpreferences. In the above example, it would only bepossible to say that juice is preferred to tea to water, but nomore.

For HITK students by S.K.Sen
Factors of Production / Resources - These are those elementsthat a nation has at its disposal to deal with the issue ofscarcity. How efficiently these are used determine themeasure of success a nation has. They are -Land - natural resources, etc.Capital - investmentLabour - the work force; size, education, quality, work ethic.Entrepreneurs - inventive and risk taking spirit. This is arather new addition to a traditional list.The "Three Basic Economic Questions" - These are thequestions all nations must ask when dealing with scarcity andeffciently allocating their resources.What to produce?How to produce?For whom to produce?

For HITK students by S.K.Sen
ADDITIONAL / OPTIONAL

For HITK students by S.K.Sen
The supply and demand model describes how prices varyas a result of a balance between product availability anddemand. The graph depicts an increase (that is, right-shift)in demand from D1 to D2 along with the consequentincrease in price and quantity required to reach a newequilibrium point on the supply curve (S).Prices and quantities have been described as the mostdirectly observable attributes of goods produced andexchanged in a market economy. The theory of supply anddemand is an organizing principle for explaining howprices coordinate the amounts produced and consumed. Inmicroeconomics, it applies to price and outputdetermination for a market with perfect competition,which includes the condition of no buyers or sellers largeenough to have price-setting power.

For HITK students by S.K.Sen

For HITK students by S.K.Sen
For a given market of a commodity, demand is the relationof the quantity that all buyers would be prepared topurchase at each unit price of the good. Demand is oftenrepresented by a table or a graph showing price andquantity demanded (as in the figure). Demand theorydescribes individual consumers as rationally choosing themost preferred quantity of each good, given income,prices, tastes, etc. A term for this is “constrained utilitymaximization” (with income and wealth as the constraintson demand). Here, utility refers to the hypothesizedrelation of each individual consumer for ranking differentcommodity bundles as more or less preferred.The law of demand states that, in general, price andquantity demanded in a given market are inversely related.That is, the higher the price of a product, the less of it

For HITK students by S.K.Sen
people would be prepared to buy (other thingsunchanged). As the price of a commodity falls, consumersmove toward it from relatively more expensive goods (thesubstitution effect). In addition, purchasing power fromthe price decline increases ability to buy (the incomeeffect). Other factors can change demand; for example anincrease in income will shift the demand curve for anormal good outward relative to the origin, as in thefigure. All determinants are predominantly taken asconstant factors of demand and supply.Supply is the relation between the price of a good and thequantity available for sale at that price. It may berepresented as a table or graph relating price and quantitysupplied. Producers, for example business firms, arehypothesized to be profit-maximizers, meaning that they

For HITK students by S.K.Sen
attempt to produce and supply the amount of goods thatwill bring them the highest profit. Supply is typicallyrepresented as a function relating price and quantity, ifother factors are unchanged.That is, the higher the price at which the good can be sold,the more of it producers will supply, as in the figure. Thehigher price makes it profitable to increase production.Just as on the demand side, the position of the supply canshift, say from a change in the price of a productive inputor a technical improvement. The “Law of Supply” statesthat, in general, a rise in price leads to an expansion insupply and a fall in price leads to a contraction in supply.Here as well, the determinants of supply, such as price ofsubstitutes, cost of production, technology applied andvarious factors inputs of production are all taken to be

For HITK students by S.K.Sen
constant for a specific time period of evaluation of supply.Market equilibrium occurs where quantity supplied equalsquantity demanded, the intersection of the supply anddemand curves in the figure above. At a price belowequilibrium, there is a shortage of quantity suppliedcompared to quantity demanded. This is posited to bid theprice up. At a price above equilibrium, there is a surplusof quantity supplied compared to quantity demanded. Thispushes the price down. The model of supply and demandpredicts that for given supply and demand curves, priceand quantity will stabilize at the price that makes quantitysupplied equal to quantity demanded. Similarly, demand-and-supply theory predicts a new price-quantitycombination from a shift in demand (as to the figure), orin supply.

For HITK students by S.K.Sen
For a given quantity of a consumer good, the point on thedemand curve indicates the value, or marginal utility, toconsumers for that unit. It measures what the consumerwould be prepared to pay for that unit. The correspondingpoint on the supply curve measures marginal cost, theincrease in total cost to the supplier for the correspondingunit of the good. The price in equilibrium is determinedby supply and demand. In a perfectly competitive market,supply and demand equate marginal cost and marginalutility at equilibrium.On the supply side of the market, some factors ofproduction are described as (relatively) variable in theshort run, which affects the cost of changing output levels.Their usage rates can be changed easily, such as electricalpower, raw-material inputs, and over-time and temp work.

For HITK students by S.K.Sen
Other inputs are relatively fixed, such as plant andequipment and key personnel. In the long run, all inputsmay be adjusted by management. These distinctionstranslate to differences in the elasticity (responsiveness) ofthe supply curve in the short and long runs andcorresponding differences in the price-quantity changefrom a shift on the supply or demand side of the market.Marginalist theory, such as above, describes theconsumers as attempting to reach most-preferredpositions, subject to income and wealth constraints whileproducers attempt to maximize profits subject to their ownconstraints, including demand for goods produced,technology, and the price of inputs. For the consumer, thatpoint comes where marginal utility of a good, net of price,reaches zero, leaving no net gain from further

For HITK students by S.K.Sen
consumption increases. Analogously, the producercompares marginal revenue (identical to price for theperfect competitor) against the marginal cost of a good,with marginal profit the difference. At the point wheremarginal profit reaches zero, further increases inproduction of the good stop. For movement to marketequilibrium and for changes in equilibrium, price andquantity also change "at the margin": more-or-less ofsomething, rather than necessarily all-or-nothing.Other applications of demand and supply include thedistribution of income among the factors of production,including labour and capital, through factor markets. In acompetitive labour market for example the quantity oflabour employed and the price of labour (the wage rate)depends on the demand for labour (from employers for

For HITK students by S.K.Sen
production) and supply of labour (from potential workers).Labour economics examines the interaction of workers andemployers through such markets to explain patterns andchanges of wages and other labour income, labour mobility,and (un)employment, productivity through human capital, andrelated public-policy issues.Demand-and-supply analysis is used to explain the behaviourof perfectly competitive markets, but as a standard ofcomparison it can be extended to any type of market. It canalso be generalized to explain variables across the economy,for example, total output (estimated as real GDP) and thegeneral price level, as studied in macroeconomics. Tracing thequalitative and quantitative effects of variables that changesupply and demand, whether in the short or long run, is astandard exercise in applied economics. Economic theory mayalso specify conditions such that supply and demand throughthe market is an efficient mechanism for allocating resources.

For HITK students by S.K.Sen
Economics Basics : Supply and Demand - Supply anddemand is perhaps one of the most fundamental conceptsof economics and it is the backbone of a market economy.Demand refers to how much (quantity) of a product orservice is desired by buyers. The quantity demanded is theamount of a product people are willing to buy at a certainprice; the relationship between price and quantitydemanded is known as the demand relationship.Supply represents how much the market can offer. Thequantity supplied refers to the amount of a certain goodproducers are willing to supply when receiving a certainprice. The correlation between price and how much of agood or service is supplied to the market is known as thesupply relationship. Price, therefore, is a reflection ofsupply and demand.

For HITK students by S.K.Sen
The relationship between demand and supply underline theforces behind the allocation of resources. In marketeconomy theories, demand and supply theory will allocateresources in the most efficient way possible. How? Let ustake a closer look at the law of demand and the law ofsupply.1. The Law of Demand : The law of demand states that, ifall other factors remain equal, the higher the price of agood, the less people will demand that good. In otherwords, the higher the price, the lower the quantitydemanded. The amount of a good that buyers purchase at ahigher price is less because as the price of a good goes up,so does the opportunity cost of buying that good. As aresult, people will naturally avoid buying a product thatwill force them to forgo the consumption of something
For HITK students by S.K.Sen
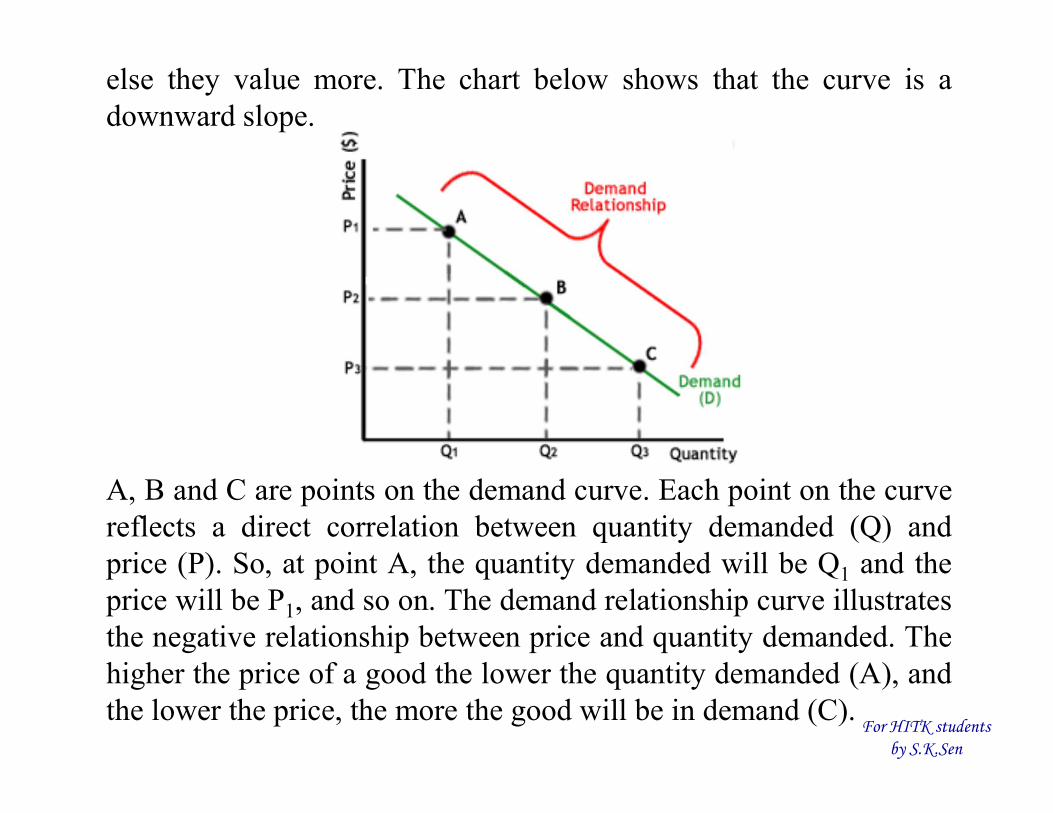
else they value more. The chart below shows that the curve is adownward slope.
A, B and C are points on the demand curve. Each point on the curvereflects a direct correlation between quantity demanded (Q) andprice (P). So, at point A, the quantity demanded will be Q1 and theprice will be P1, and so on. The demand relationship curve illustratesthe negative relationship between price and quantity demanded. Thehigher the price of a good the lower the quantity demanded (A), andthe lower the price, the more the good will be in demand (C).

For HITK students by S.K.Sen
2. The Law of Supply : Like the law of demand, the law of supplydemonstrates the quantities that will be sold at a certain price. Butunlike the law of demand, the supply relationship shows an upwardslope. This means that the higher the price, the higher the quantitysupplied. Producers supply more at a higher price because selling ahigher quantity at a higher price increases revenue.
A, B and C are points on thesupply curve. Each point onthe curve reflects a directcorrelation between quantitysupplied (Q) and price (P).At point B, the quantitysupplied will be Q2 and theprice will be P2, and so on.

For HITK students by S.K.Sen
Time and Supply : Unlike the demand relationship,however, the supply relationship is a factor of time. Time isimportant to supply because suppliers must, but cannotalways, react quickly to a change in demand or price. So itis important to try and determine whether a price changethat is caused by demand will be temporary or permanent.Let's say there's a sudden increase in the demand and pricefor umbrellas in an unexpected rainy season; suppliers maysimply accommodate demand by using their productionequipment more intensively. If, however, there is a climatechange, and the population will need umbrellas year-round,the change in demand and price will be expected to be longterm; suppliers will have to change their equipment andproduction facilities in order to meet the long-term levelsof demand.

For HITK students by S.K.Sen
3. Supply and Demand Relationship : Now that we knowthe laws of supply and demand, let's turn to an example toshow how supply and demand affect price.Imagine that a special edition CD of your favourite brand isreleased for $20. Because the record company's previousanalysis showed that consumers will not demand CDs at aprice higher than $20, only ten CDs were released becausethe opportunity cost is too high for suppliers to producemore. If, however, the ten CDs are demanded by 20 people,the price will subsequently rise because, according to thedemand relationship, as demand increases, so does theprice. Consequently, the rise in price should prompt moreCDs to be supplied as the supply relationship shows thatthe higher the price, the higher the quantity supplied.
For HITK students by S.K.Sen
If, however, there are 30 CDs produced and demand is stillat 20, the price will not be pushed up because the supplymore than accommodates demand. In fact after the 20consumers have been satisfied with their CD purchases, theprice of the leftover CDs may drop as CD producersattempt to sell the remaining ten CDs. The lower price willthen make the CD more available to people who hadpreviously decided that the opportunity cost of buying theCD at $20 was too high.4. Equilibrium : When supply and demand are equal (i.e.when the supply function and demand function intersect)the economy is said to be at equilibrium. At this point, theallocation of goods is at its most efficient because theamount of goods being supplied is exactly the same as theamount of goods being demanded. Thus, everyone

For HITK students by S.K.Sen
(individuals, firms, or countries) is satisfied with the currenteconomic condition. At the given price, suppliers are selling all thegoods that they have produced and consumers are getting all thegoods that they are demanding.
As you can see on the chart,equilibrium occurs at theintersection of the demand andsupply curve, which indicatesno allocative inefficiency. Atthis point, the price of the goodswill be P* and the quantity willbe Q*. These figures arereferred to as equilibrium priceand quantity.
In the real market place equilibrium can only ever be reached intheory, so the prices of goods and services are constantly changingin relation to fluctuations in demand and supply.

For HITK students by S.K.Sen
5. Disequilibrium : Disequilibrium occurs whenever the price orquantity is not equal to P* or Q*.i) Excess Supply : If the price is set too high, excess supply will becreated within the economy and there will be allocativeinefficiency.
At price P1 the quantity ofgoods that the producers wishto supply is indicated by Q2.At P1, however, the quantitythat the consumers want toconsume is at Q1, a quantitymuch less than Q2. BecauseQ2 is greater than Q1, toomuch is being produced
and too little is being consumed. The suppliers are trying toproduce more goods, which they hope to sell to increase profits,but those consuming the goods will find the product less attractiveand purchase less because the price is too high.

For HITK students by S.K.Sen
ii) Excess Demand : Excess demand is created when price is setbelow the equilibrium price. Because the price is so low, too manyconsumers want the good while producers are not making enoughof it.
In this situation, at price P1, thequantity of goods demanded byconsumers at this price is Q2.Conversely, the quantity of goodsthat producers are willing toproduce at this price is Q1. Thus,there are too few goods beingproduced to satisfy the wants(demand) of the consumers.
However, as consumers have to compete with one other to buy thegood at this price, the demand will push the price up, makingsuppliers want to supply more and bringing the price closer to itsequilibrium.

For HITK students by S.K.Sen
6. Shifts vs. Movement : For economics, the "movements"and "shifts" in relation to the supply and demand curvesrepresent very different market phenomena:i) Movements : A movement refers to a change along acurve. On the demand curve, a movement denotes achange in both price and quantity demanded from onepoint to another on the curve. The movement implies thatthe demand relationship remains consistent. Therefore, amovement along the demand curve will occur when theprice of the good changes and the quantity demandedchanges in accordance to the original demand relationship.In other words, a movement occurs when a change in thequantity demanded is caused only by a change in price,and vice versa.

For HITK students by S.K.Sen
Movement along the Demand Curve
Like a movement along the demand curve, a movement along thesupply curve means that the supply relationship remains consistent.Therefore, a movement along the supply curve will occur when theprice of the good changes and the quantity supplied changes inaccordance to the original supply relationship. In other words, amovement occurs when a change in quantity supplied is causedonly by a change in price, and vice versa.
Movement along the Supply Curve

For HITK students by S.K.Sen
ii) Shifts : A shift in a demand or supply curve occurs when agood's quantity demanded or supplied changes even though priceremains the same. For instance, if the price for a bottle of beer was$2 and the quantity of beer demanded increased from Q1 to Q2,
then there would be ashift in the demand forbeer. Shifts in the demandcurve imply that theoriginal demandrelationship has changed,meaning that quantitydemand is affected by afactor other than price.
A shift in the demand relationship would occur if, for instance,beer suddenly became the only type of alcohol available forconsumption.

For HITK students by S.K.Sen
Conversely, if the price for a bottle of beer was $2 and the quantitysupplied decreased from Q1 to Q2, then there would be a shift in thesupply of beer. Like a shift in the demand curve, a shift in thesupply curve implies that the original supply curve has
changed, meaning that the quantity supplied is effected by a factorother than price. A shift in the supply curve would occur if, forinstance, a natural disaster caused a mass shortage of hops; beermanufacturers would be forced to supply less beer for the sameprice.

For HITK students by S.K.Sen
Elasticity : In economics, the law of demand states that, allelse being equal, as the price of a product increases (↑),quantity demanded falls (↓); likewise, as the price of a productdecreases (↓), quantity demanded increases (↑). In simpleterms, the law of demand describes an inverse relationship, andan elasticity, between price and quantity of demand. There is anegative relationship between the quantity demanded of a goodand its price. The factors held constant in this relationship arethe prices of other goods and the consumer's income. Thereare, however, some possible exceptions to the law of demand(see Giffen goods and Veblen goods).Mathematical expression : Mathematically, the inverserelationship may be expressed as a causal relation:Qx = f(Px), f ’ < 0, where Qx is the quantity demanded for goodx, Px is price of the good, f is demand function, f ’ is derivative.Here, Px is casual factor (independent variable) and Qx isdependent variable.

Graphical depiction : A demand curve is a graphicaldepiction that abides by the law of demand. It shows howthe quantity demanded of some product during a specifiedperiod of time will change as the price of that productchanges, holding all other determinants of the quantitydemanded constant. Price is measured on the vertical axisand quantity demanded on the horizontal axis.There are two important things to note about the demandcurve :(i) It is downward sloping indicating that between theprice of a product and the quantity demanded a negative orinverse relationship exists. In other words, as the pricedeclines the quantity demanded increases. This is indicatedby a downward movement along the demand curve. Anincrease in price decreases the quantity demanded, and anupward movement along the demand curve occurs. For HITK students
by S.K.Sen

(ii) The movement along a given demand curve due to achange in price is referred to as "change in quantitydemanded". (i:e demand changes as only the pricechanges, and diagrammatically, there is only one demandcurve, with the movement noticeable between points) theprice changes, the quantity demanded changes. The term"change in demand" refers to a shift of the demand curvebecause of factors other than price(in the which case,prices, incomes of consumers, government policies,seasons and weather, tastes, reigning fashion, festivals etcand other non-price factors determine/cause the demandcurve to shift. Diagrammatically, new curves are drawn toshow the shifts, aside from the other curves/readers shouldnote this important distinction).
For HITK students by S.K.Sen

For HITK students by S.K.Sen
Exceptions to the law of demand : Generally the amountdemanded of a good increases with a decrease in price ofthe good and vice versa. In some cases, however, this maynot be true. There are certain goods which do not followthis law. These include Veblen goods and Giffen goods.Further exception and details are given in the sectionsbelow.Giffen goods : Initially proposed by Sir Robert Giffen,economists disagree on the existence of Giffen goods inthe market. A Giffen good describes an inferior good thatas the price increases, demand for the product increases.As an example, during the Irish Potato Famine of the 19thcentury, potatoes were considered a Giffen good. Potatoeswere the largest staple in the Irish diet, so as the price roseit had a large impact on income. People responded by

For HITK students by S.K.Sen
cutting out on luxury goods such as meat and vegetables,and instead bought more potatoes. Therefore, as the priceof potatoes increased, so did the quantity demanded.Expectation of change in the price of commodity : If anincrease in the price of a commodity causes households toexpect the price of a commodity to increase further, theymay start purchasing a greater amount of the commodityeven at the presently increased price. Similarly, if thehousehold expects the price of the commodity to decrease,it may postpone its purchases. Thus, some argue that thelaw of demand is violated in such cases. In this case, thedemand curve does not slope down from left to right;instead it presents a backward slope from the top right todown left. This curve is known as an exceptional demandcurve.
For HITK students by S.K.Sen
Basic or necessary goods : The goods which people needno matter how high the price is are basic or necessarygoods. Medicines covered by insurance are a goodexample. An increase or decrease in the price of such agood does not affect its quantity demanded.The law of demand and change in demand : The law ofdemand states that, other things remaining same, thequantity demanded of a good increases when its price fallsand decreases when the price rises. This is represented bymovement along the demand curve, since the product'sprice is on the vertical axis.The demand for goods changes as a consequence ofchanges in income, tastes etc. Since these factors are noton the axes of the demand curve diagram, such a change isreflected in a shift of the demand curve to a new location.

For HITK students by S.K.Sen
A shift of the demand curve is referred to as a change indemand, in contrast to a movement along a fixed demandcurve, which is referred to as a change in the quantitydemanded.
A demand curve, shownin red and shifting to theright, demonstrating theinverse relationshipbetween price andquantity demanded (thecurve slopes downwardsfrom left to right; higherprices reduce thequantity demanded).

For HITK students by S.K.Sen
Price elasticity of demand (PED or Ed) is a measure usedin economics to show the responsiveness, or elasticity, ofthe quantity demanded of a good or service to a change inits price, ceteris paribus. More precisely, it gives thepercentage change in quantity demanded in response to aone percent change in price."Price elasticity" is not to be confused with Price elasticityof supply.Price elasticities are almost always negative, althoughanalysts tend to ignore the sign even though this can leadto ambiguity. Only goods which do not conform to the lawof demand, such as Veblen and Giffen goods, have apositive PED. In general, the demand for a good is said tobe inelastic (or relatively inelastic) when the PED is lessthan one (in absolute value): that is, changes in price have

For HITK students by S.K.Sen
a relatively small effect on the quantity of the gooddemanded. The demand for a good is said to be elastic (orrelatively elastic) when its PED is greater than one (inabsolute value): that is, changes in price have a relativelylarge effect on the quantity of a good demanded.Revenue is maximized when price is set so that the PED isexactly one. The PED of a good can also be used to predictthe incidence (or "burden") of a tax on that good. Variousresearch methods are used to determine price elasticity,including test markets, analysis of historical sales data andconjoint analysis.It is a measure of responsiveness of the quantity of a rawgood or service demanded to changes in its price. Theformula for the coefficient of price elasticity of demand fora good is : dQ / Q
dP / Pe(p) =

For HITK students by S.K.Sen
The above formula usually yields a negative value, due tothe inverse nature of the relationship between price andquantity demanded, as described by the "law of demand".For example, if the price increases by 5% and quantitydemanded decreases by 5%, then the elasticity at the initialprice and quantity = − 5% / 5% = −1. The only classes ofgoods which have a PED of greater than 0 are Veblen andGiffen goods. Although the PED is negative for the vastmajority of goods and services, economists often refer toprice elasticity of demand as a positive value (i.e., inabsolute value terms).This measure of elasticity is sometimes referred to as theown-price elasticity of demand for a good, i.e., theelasticity of demand with respect to the good's own price,in order to distinguish it from the elasticity of demand for

For HITK students by S.K.Sen
that good with respect to the change in the price of someother good, i.e., a complementary or substitute good. Thelatter type of elasticity measure is called a cross-priceelasticity of demand.As the difference between the two prices or quantitiesincreases, the accuracy of the PED given by the formulaabove decreases for a combination of two reasons. First,the PED for a good is not necessarily constant; asexplained below, PED can vary at different points alongthe demand curve, due to its percentage nature. Elasticityis not the same thing as the slope of the demand curve,which is dependent on the units used for both price andquantity. Second, percentage changes are not symmetric;instead, the percentage change between any two valuesdepends on which one is chosen as the starting value and

For HITK students by S.K.Sen
which as the ending value. For example, if quantitydemanded increases from 10 units to 15 units, thepercentage change is 50%, i.e., (15 − 10) ÷ 10 (convertedto a percentage). But if quantity demanded decreases from15 units to 10 units, the percentage change is −33.3%, i.e.,(10 − 15) ÷ 15.Two alternative elasticity measures avoid or minimisethese shortcomings of the basic elasticity formula: point-price elasticity and arc elasticity.

For HITK students by S.K.Sen
Giffen good : In economics and consumer theory, a Giffengood is a product that people consume more of as the pricerises and vice versa - violating the law of demand. For anygood, as the price of the good rises, the substitution effectmakes consumers purchase less of it, and more ofsubstitute goods; for most goods, the income effect (due tothe effective decline in available income due to more beingspent on existing units of this good) reinforces this declinein demand for the good. But a Giffen good is so stronglyan inferior good (being more in demand at lower income)that this contrary income effect more than offsets thesubstitution effect, and the net effect of the good's pricerise is to increase demand for it.A Giffen good should not be confused with productsbought as status symbols or for conspicuous consumption

For HITK students by S.K.Sen
(Veblen goods). The classic example given by Marshall isof inferior quality staple foods, whose demand is driven bypoverty that makes their purchasers unable to affordsuperior foodstuffs.They both violate the law of demand (price goes up,demand goes down and vice-versa).Veblen goods violate the law of demand because peopleactually *prefer* goods to be more expensive as a statussymbol.Giffen goods (which are also mostly theoretical) violatethe law of demand because when the price of a necessarygood rises (eg. their food staple), they are *forced* tosubstitute out even more expensive alternatives in favourof the staple.

For HITK students by S.K.Sen
A giffen good occurs when a rise in price causes higherdemand because the income effect outweighs thesubstitution effect. Suppose you have a very low incomeand eat two basic food stuffs rice and meat. Meat is aluxury and is much more expensive than rice.In economics, Veblen goods are types of materialcommodities for which the demand is proportional to itshigh price, which is an apparent contradiction of the law ofdemand; Veblen goods also are commodities that functionas positional goods. Veblen goods are types of luxurygoods, such as expensive wines, jewelry, fashion-designerhandbags, and luxury cars, which are in demand becauseof the high prices asked for them. The high price makesthe goods desirable as symbols of the buyer's high socialstatus, by way of conspicuous consumption and

For HITK students by S.K.Sen
conspicuous leisure; conversely, a decrease of the prices ofVeblen goods would decrease demand for the products.In an economy, the consumption of Veblen goods is afunction of the Veblen effect (goods desired for beingover-priced) that is named after the American economistThorstein Veblen, who first identified conspicuousconsumption as a mode of status-seeking in The Theory ofthe Leisure Class (1899).


