1 Analyzing the Economic Sustainability of Tourism ...
36
1 Analyzing the Economic Sustainability of Tourism Development: Evidence from Hong 1 Kong 2 Abstract 3 Despite increased concerns about the negative economic impacts of tourism on host communities, 4 insufficient attention has been paid to assess tourism economic sustainability. This paper aims to 5 develop and validate a framework for assessing economic sustainability from the perspective of 6 local stakeholders. In-depth interviews with 12 major stakeholders and a telephone survey with 7 1839 Hong Kong citizens were conducted. The tourism economic sustainability construct 8 consisted of three dimensions: economic positivity, development control and individual welfare. 9 The reliability and validity of the dimensions were confirmed by the data of sub-samples. The 10 links between socio-demographic characteristics and attitudes toward tourism economic 11 sustainability were evaluated. This paper enhanced our understanding of tourism economic 12 sustainability by expanding the measurement from the macro level to micro level. Using the 13 study setting in Hong Kong, it transcends previous analysis by providing a context to learn from 14 ongoing controversies about the effects of tourism on host community. 15 Keywords: Economic sustainability; host-guest conflict; Hong Kong; economic positivity; 16 development control; individual welfare 17 Introduction 18 Tourism industry is currently facing unprecedented challenges worldwide due to the sector’s 19 maturity and the rapidly evolving environments. Concerns about the negative economic impacts 20 of tourism on host communities continue to surface, highlighting the importance of evaluating 21
Transcript of 1 Analyzing the Economic Sustainability of Tourism ...

1
Analyzing the Economic Sustainability of Tourism Development: Evidence from Hong 1
Kong 2
Abstract 3
Despite increased concerns about the negative economic impacts of tourism on host communities, 4
insufficient attention has been paid to assess tourism economic sustainability. This paper aims to 5
develop and validate a framework for assessing economic sustainability from the perspective of 6
local stakeholders. In-depth interviews with 12 major stakeholders and a telephone survey with 7
1839 Hong Kong citizens were conducted. The tourism economic sustainability construct 8
consisted of three dimensions: economic positivity, development control and individual welfare. 9
The reliability and validity of the dimensions were confirmed by the data of sub-samples. The 10
links between socio-demographic characteristics and attitudes toward tourism economic 11
sustainability were evaluated. This paper enhanced our understanding of tourism economic 12
sustainability by expanding the measurement from the macro level to micro level. Using the 13
study setting in Hong Kong, it transcends previous analysis by providing a context to learn from 14
ongoing controversies about the effects of tourism on host community. 15
Keywords: Economic sustainability; host-guest conflict; Hong Kong; economic positivity; 16
development control; individual welfare 17
Introduction 18
Tourism industry is currently facing unprecedented challenges worldwide due to the sector’s 19
maturity and the rapidly evolving environments. Concerns about the negative economic impacts 20
of tourism on host communities continue to surface, highlighting the importance of evaluating 21
2
economic sustainability in the development of tourism destinations (Logar, 2010; Calgaro, Lloyd, 1
& Dominey-Howes, 2014). However, most existing sustainability evaluation tools and guidelines 2
tend to focus on environmental and social perspectives (Buckley, 2012). Some do refer to 3
economic sustainability but mainly focused on macro-level and objective indicators such as GDP, 4
employment rate and investment. While useful, macro level and objective perspective fails to 5
capture many other indicators with significant importance to local stakeholders, who are 6
impacted by tourism development strategies and who have their own interpretations of 7
sustainability (Muresan et al., 2016). 8
Sustainable tourism, an alternative approach of developing destinations that can establish 9
a harmonious relationship between tourism and its encompassing environment (environmental, 10
economical, and social), has become more complicated due to an increased number of 11
stakeholders involved, and the often divergent interests they pursue. Tourism activities and 12
development may influence the host-guest relationship, which in turn can have significant impact 13
on the potential of tourism industry (Sharpley, 2008). Thus, it has been advised that 14
incorporating local perspectives would tap into the complex knowledge related to sustainability 15
and thus, be a better way of evaluating sustainability (Veenhoven, 2001; Choi & Sirakaya, 2005). 16
Therefore, the aim of this paper is to develop and validate an indicator framework for assessing 17
economic sustainability from the perspective of local stakeholders in Hong Kong. While this 18
indicator framework was developed specifically for Hong Kong, the case study may be relevant 19
for many other popular destinations that are experiencing stagnation of tourism growth. 20
Hong Kong provides an appropriate case for studying economic sustainability of tourism. 21
Over the last few decades, stimulated by the visa liberalization such as the Individual Visit 22

3
Scheme (IVS) in 2003 and the multiple-entry permits of Shenzhen residents in 2009, the number 1
of visitor arrivals from mainland China has enjoyed a rapid and sustained growth from 8.47 2
million in 2003 to 45.84 million in 2015, which accounted for 77.56% of the inbound market 3
share (Hong Kong Tourism Board [HKTB], 2016). The increase of Chinese visitors has brought 4
billions of tourism receipts per year and generated numerous job opportunities. However, as 5
more mainland visitors came to Hong Kong, they started to visit non-tourism regions and bought 6
many daily used items such as milk powder and diapers which caused the increase of price and 7
shortage of some goods (Liu & McKercher, 2016). Such behavior deteriorated the relationship 8
between the mainland visitors and the Hong Kong residents. Reports related to physical conflict 9
between tourists and residents can be found in social media and more importantly, arrivals from 10
China suffered a decline since 2015 which is the first time since IVS was launched (Wong & 11
Buckley, 2015; HKTB, 2016). 12
It is only recently that sustainable development of tourism in Hong Kong has attracted 13
attention from researchers. For example, Zhang, Fan, Tse and King (2016) measured 14
sustainability of tourism development form the social perspective. Shen, Luo, and Zhao (2017) 15
examined local residents’ attitudes toward mainland Chinese tourists as well as the factors that 16
influences these attitudes. However, systematic understanding of the residents’ attitude and its 17
causes are still lacking. To provide a better understanding of the progress toward sustainable 18
tourism and to relieve the conflict between the visitors and the hosts, a tool which could analyze 19
the economic sustainability of tourism development is urgent and necessary. The measurement 20
tool developed in the study could provide the Hong Kong government and also practitioners with 21

4
the opportunity to assess tourism economic sustainability from the viewpoint of local 1
communities and then undertake any appropriate and necessary actions. 2
3
Literature Review 4
Economic Sustainability of Tourism 5
Despite its pivotal role for tourism, the economic dimension of tourism sustainability remains 6
poorly defined and studied. There was insufficient agreement on what conditions constitute a 7
position of sustainability as it is a continuous and future state. To the best of our knowledge, 8
three definitions have been provided by public organizations and researchers. According to 9
UNWTO (2004), economic sustainability addresses long-term viability of economic operations, 10
fairness and equity of benefits distribution, employment and income-earning opportunities, and 11
poverty alleviation. United Nations Environmental Programme (UNEP) and UNWTO’s (2005) 12
definition concerns with economic prosperity at different levels of society, cost-effectiveness and 13
economic efficiency, and vitality of tourism enterprises. Choi and Sirikaya (2006) referred to 14
economic sustainability as a process “optimizing the development growth rate at a manageable 15
level with full consideration of the limits of the destination environment.” Economic 16
sustainability of tourism is, in all these versions of definitions, a multidimensional construct of 17
comprehensive meaning. However, existing studies on sustainability indicators often view 18
economic sustainability as a uni-dimensional construct (Miller, 2001; Lawson, 2001; Su & Lin, 19
2004; Timur & Getz, 2009; Muresan et. al, 2016). One exception is from the World Tourism 20
Organization (UNWTO, 2004), which proposed seven sub-dimensions of economic 21
sustainability: tourism seasonality, leakages, employment, tourism as a contributor to nature 22

5
conservation, community and destination economic benefits, tourism and poverty alleviation and 1
competitiveness of tourism businesses. It was advised that the guidebook should be used as a 2
menu for destination managers to develop meaningful indicators that can adapt to specific 3
circumstances of the destination. 4
Most research on economic sustainability drew heavily on macro-level objective 5
indicators, with less effort devoted to develop micro-level subjective indicators from the 6
stakeholders’ perspective (Sirakaya-Turk & Gursoy, 2013). Only a few exceptions can be found 7
in the literature. An important study was conducted by Choi and Sirakaya (2005) to build the 8
residents’ attitudes toward sustainable tourism scale (SUS-TAS). In their scale, several 9
dimensions identified were related to economic sustainability such as perceived economic 10
benefits, community-centered economy, and visitor satisfaction. Timur and Getz (2009) 11
investigated how destination stakeholders (tourism industry and government) perceive 12
sustainable urban tourism. Three economic indicators were selected for the study: provide long 13
term business profitability, continue to grow city’s tourism industry, and ensure that city’s 14
tourism marketing budget is sustained and increased. Muresan et. al (2016) assessed the local 15
residents’ attitude toward economic sustainability of rural tourism development based on overall 16
economic development, tax revenue, employment, and living cost. Overall, these studies 17
emphasized on residents’ attitudes toward tourism development and consider less about how 18
residents’ feelings toward tourists. 19
Research devoted to the drivers of tourism economic sustainability are scant. Seasonal 20
operations of tourism, which have brought about decreased occupancy rates, transportation 21
difficulties, and increased prices, was considered as a chief factor in the sustainability of the 22
6
tourism corporations (Altinay, 2000; Shen, Luo, & Zhao, 2017). Researchers have suggested 1
that characters of tourists such as travel mode and social status may be related directly to 2
economic sustainability (Faulkner & Tideswell, 1997). The quality of accommodation facilities 3
and sufficiency of trained work force were also identified as major issues affecting economic 4
sustainability of tourism destination (Logar, 2010). Focusing on the temporal dynamic of 5
tourism development, Giannoni and Maupertuis (2007) suggested that the trade-off between 6
tourism investments and environmental preservation is critical to ensure the sustainability of 7
population income in the long run. Bramwell (2011) highlighted the state’s influence on 8
economic sustainability of tourism. 9
Economic Impacts of Tourism 10
One area of research that is highly relevant for economic sustainability of tourism is the 11
measuring and managing of tourism impacts. Previous research has widely explored positive 12
economic consequences of tourism. Tourism seems to constitute a good engine of growth and 13
provide vast welfare gains (Katircioglu, 2011). Such economic outcome may be attained from 14
export and foreign exchange earnings, employment and adding sources of income, balance of 15
payments, and tax revenues (Oh, 2005; Katircioglu, 2009; Seetanah, 2011). In the context of 16
developing countries and indigenous people, tourism is considered an alternative source for 17
poverty alleviation and sustainable livelihood (Tao & Wall, 2009). Nonetheless, tourism must 18
not be viewed as a panacea or the easiest way out of economic problems. It may also generate 19
static and perverse effects. For example, tourism is found to be an unstable source of income, as 20
it is often very sensitive to actual or perceived changes to the environmental and social 21
conditions of destinations (Giannoni & Maupertuis, 2007). Over-development, excessive visitor 22

7
use, and the pursuit of short-term economic gains can threaten the longevity of many tourism 1
destinations (Burak, Dogan, & Gazioglu, 2004). The issue of economic leakage and 2
distributional inequality has limited the benefits of tourism on host communities (Nepal, 2002). 3
Tourism jobs are often low paid with high turnover rates, which calls for attention on the 4
employment quality and opportunity cost of of labor (Lacher & Oh, 2012). In an era when 5
sustainability has become a major paradigm, investigating merely tourism impacts is not 6
sufficient (Choi & Sirakaya, 2005). More efforts are needed to integrate knowledge of economic 7
impacts of tourism into the development of tools for measuring economic sustainability of 8
tourism. 9
10
Residents’ Attitudes Toward Tourism 11
Understanding residents’ attitudes toward tourism has long been of interest to tourism scholars. 12
Previous research showed that residents’ responses to tourism development varied based on a 13
number of factors such as the level of tourism development, socio-demographic characteristics, 14
economic dependence on tourism, extent of local residents’ interaction with tourists, and spatial 15
proximity to the tourist attractions (Uriely, Israeli, & Reichel, 2003; Ho, Chia, Ng, & 16
Ramachandran, 2017). Theoretical approaches to the study of residents’ attitudes toward tourism 17
have typically employed stage-based models such s Doxey’s (1975) Irridex model and Butler’s 18
(1980) tourism area life cycle model. Their basic premise is that with the increase of adverse 19
tourism impacts, residents’ support for tourism decreases. Taking into account the trade-off 20
between positive (benefits) and negative effects (costs) of tourism, social exchange theory has 21
been frequently employed to explain individual’s decision making toward tourism related issues 22

8
(Ap, 1992). A resident is likely to be supportive of tourism development as long as the perceived 1
benefits exceed the perceived costs. Hinges upon the notion of fairness, stakeholder theory has 2
also been used to deal with conflicts and trade-offs among various stakeholders (Kuvan & Akan, 3
2012). It requires simultaneous attention to the legitimate interests of all appropriate stakeholders 4
in the establish of policies and case by case- decision-making (Freeman, 1984). Another 5
influential theoretical approach draws upon social representation theory, which enables us to see 6
the attitudes, ideas, and action orientations of tourism as shared knowledge of local residents (Lai, 7
Hsu, & Nepal, 2013). 8
9
Knowledge Gap 10
Based on the discussion above, several gaps can be identified in the literature. First, although 11
great progress has been made for assessing sustainable tourism, few studies have focused on the 12
economic aspects of sustainable tourism. There are no agreements on either of the phenomenon 13
itself or its main drivers. Also, existing studies often treat economic sustainability of tourism as 14
a uni-dimensional construct, which failed to reflect the comprehensive contents of the definition 15
proposed by UNWTO (2004). Thus, there is a need to deepen the understanding of economic 16
sustainability by exploring its dimensions. Second, it is worthy of note that current research 17
mainly relies on objective macro-level indicators to measure economic sustainability in tourism. 18
Other subjective micro-level criteria that emphasize the perceptions of local stakeholders (e.g., 19
economic benefits for individuals and tourism development control) tend to be overlooked. As a 20
result, economic sustainability indicators of extant research fall short in assessing all aspects of 21
the development progress toward sustainable tourism. Third, although there have been many 22

9
studies carried out on residents’ attitudes toward tourism, only a few have employed sustainable 1
development perspective to comprehend residents’ attitudes toward tourism. Fourth, although the 2
respective concepts of economic impact and economic sustainability are closely related, little 3
effort has been made to integrate the results of economic impacts into the assessment of 4
economic sustainability. To address the aforementioned research gaps, this study aims to analyze 5
tourism economic sustainability as a multi-dimensional concept from the host perspective. This 6
study also attempts to transform dimensions of economic effect into an evaluation tool of of 7
economic sustainability. 8
9
Methodology 10
Item and Questionnaire Development 11
Measurement development is a crucial step in research design and could fundamentally affect the 12
research results. Regarding this research, due to the scarcity of literature on multi-dimensional 13
measurements of economic sustainability, a systematical development of the instruments is in 14
need. According to Churchill’s (1979) classical framework and the continuous development by 15
different researchers (e.g. Hung & Petrick, 2010; Zhang et al., 2016), the current measurement 16
instruments were developed by following the 10-step approach (Table 1). 17
Insert Table 1 Here 18
As the first and second steps, literature search and in-depth interviews were conducted to 19
specify the domain of the construct and to generate a sample of items. The literature related to 20
economic sustainability of tourism development was reviewed by the research team to clarify the 21

10
domain of economic sustainability and to look for the items used by scholars to measure 1
sustainability. Specifically, though the uni-dimensional measurements in the literature had 2
limited ability to reflect the comprehensive meaning of social sustainability, they formed a good 3
knowledge base for the current study. Items such as those developed by Lawson (2001), Su and 4
Lin (2004) as well as UNEP and UNWTO (2005) were considered as part of the item pool. To 5
solicit the tourism industry view, interviews were carried out with different main stakeholders of 6
the Hong Kong tourism industry. Purposive sampling was adopted to select interviewees. This 7
sampling method is appropriate when researchers with expertise in a particular field seek for 8
interviewees who meet specific criteria and can represent a cross-section of the population 9
(Black, 2010). Specifically, members in the research team have rich industry experiences and 10
network. Applying such expert knowledge, the study conducted 12 in-depth interviews with 11
leaders or representatives from major stakeholders of the Hong Kong’s tourism industry, 12
including Hong Kong Tourism Board, China National Tourism Administration, Travel Industry 13
Council, Quality Tourism Services Association, Hong Kong Association of Travel Agents, Hong 14
Kong Hotel Association, Ocean Park, Disneyland, and local residents. An organization or 15
association was selected from each industry sector that best represented the respective sector. 16
This qualitative method allowed the research team to capture the interviewees’ perceptions, ideas, 17
and experiences and gain the necessary insights. All interviewees were first invited by an e-mail 18
that clearly stated the project’s background and objectives, and guideline questions were 19
provided. With their consent, the interviews were scheduled based on mutual convenience. 20
Interviewees may also nominate other organizations or associations if they were considered to be 21
related. As a result, the pool of items was further expanded by taking the knowledge from 22
tourism practitioners into consideration. By comprehensively analyzing the literature and 23

11
interview transcripts, 28 items were developed including destination attractiveness, leakage 1
reduction, market understanding, managed tourism seasonality, employment opportunities, 2
visitor satisfaction, as well as development control (Fredline & Faulkner, 2000; Lawson, 2001; 3
Su & Lin, 2004; Tosun, 2002; UNEP & UNWTO, 2005; UNWTO, 2004). 4
In the third step, a panel of experts was invited to provide comments on the item pools. A 5
panel discussion was held with five scholars who hold expertise in sustainability. Revision was 6
made according to the comments from the panel and a questionnaire was then developed. The 7
sources of items were displayed in Appendix 1. The questionnaire was distributed to 80 Hong 8
Kong university students as a pilot test. The questionnaire was further revised based on the 9
results of the pilot test and 23 items were maintained for the main survey. 10
The questionnaire included two parts. The first set was to obtain respondents’ perceptions 11
regarding economic sustainability using a 5-point Likert-type agreement scale with 1 12
representing “strongly disagree” and 5 representing “strongly agree”. The second section was 13
related to the demographic information. The questionnaire was originally designed in English. 14
For the convenient distribution purpose to Hong Kong residents, it is translated into traditional 15
Chinese by back translation technique. 16
17
Data Collection 18
As the fourth step, data were collected by telephone interviews. The telephone survey is the 19
most convenient way to conduct simple random sampling regarding time, labor and financial 20
cost. This technique has been widely used in tourism related studies (Losada, N., Alén, E., 21
Nicolau, J. L., & Domínguez, T., 2017). Furthermore, because both the questionnaire and the 22

12
interview process are standardized, the impact of interviewers on the response of interviewees is 1
limited. By conducting the non-face-to-face interview, respondents are more likely to give the 2
real information instead of the socially desirable one (Carr & Worth, 2001; Marcus & Crane, 3
1986; Robson, 1993). Scholars also documented the advantages of this technique, especially 4
where random sampling dialing is available, including equal chance of selection (Carr & Worth, 5
2000; Robson, 1993), quality control and dealing with security issues (Marcus & Crane, 1986). 6
As any other technique, telephone interviews also have some disadvantages, such as the 7
difficulty of building rapport, lack of visual cues, and limitations on the interview length (Carr & 8
Worth, 2000; Robson, 1993). It may also disregard some groups who are unable to communicate 9
via phone. 10
A sample size of 2,000 was targeted for this study considering the number of items in the 11
survey and the variable sample ratios discussed in the literature (Byrne, 2010; Hair et al., 2010). 12
Quota sampling was conducted based on the current geographical distribution of the Hong Kong 13
population in selecting prospective survey respondents. As reported by the Hong Kong Census 14
and Statistics Department (2013), Hong Kong Island, Kowloon, and the New Territories have 15
populations of 1,277,200 (17.9%), 2,146,800 (30.0%), and 3,729,600 (52.1%), respectively. As a 16
result, 358 residents from Hong Kong Island, 600 residents from Kowloon, and 1,042 residents 17
from the New Territories were decided as the sample for the telephone interviews. 18
The survey was conducted from July to August in 2014. The respondents must be 18-year-19
old or above. The telephone numbers were selected and dialed by simple random sampling 20
method in the three regions of Hong Kong with the calculated quotas, which ensured that each 21
member of the population is equally likely to be chosen as part of the sample. In particular, 22

13
respondents were selected by the last-birthday method within a sampled household. The selected 1
respondents were the ones whose birthdays were closest to the interview date among the eligible 2
household members. A computer-assisted interview system was employed to standardize the 3
interview process and control the data quality. Fifteen calls were made to be the pilot interviews 4
and these calls were not included in the main survey data. At least three calls should be made in 5
different time periods of a day before the sample was categorized as unreachable. Finally, 1,839 6
responses were collected with the contact rate and the overall cooperation rate of 85.75% and 7
42.41%, respectively. According to Gripp, Luloff and Yonkers (1994), response rate is not 8
appropriate for telephone survey and such two indicators are more meaningful to show the 9
efficiency of the telephone survey. More details of the telephone survey of this research can be 10
found in Table 2. 11
Insert Table 2 Here 12
13
Data Analysis 14
The data was analyzed by the Statistical Package for the Social Science (SPSS) and 15
Analysis of Moment Structures (AMOS). As the fifth step, after data screening and descriptive 16
analysis, the exploratory factor analysis (EFA) was conducted to abstract factors from the data 17
by SPSS. In step six, Cronbach’s alpha was employed to test the reliability of the items under 18
each factor. In step seven, the EFA result’s stability was validated by splitting data into high and 19
low density groups and performing separate EFA tests and reliability tests again in both groups. 20
In step eight, the confirmatory factor analysis (CFA) was carried out in the next step by AMOS 21
to confirm and further purify the factors explored by EFA. In step nine, a series of tests were also 22

14
implemented to examine the reliability and validity of the CFA results including composite 1
reliability, discriminant validity, convergent validity, nomological validity and overall fit indices. 2
Last, the CFA structure stability was also validated by splitting data into high and low density 3
groups and performing the aforementioned tests again in both groups. After the establishment of 4
the measurements, to evaluate the features of economic sustainability, the relationship between 5
socio-demographic characteristics and attitudes toward tourism economic sustainability was 6
examined by ANOVAs and t-tests. Detailed explanation for each of the steps is presented in the 7
findings. 8
9
Findings 10
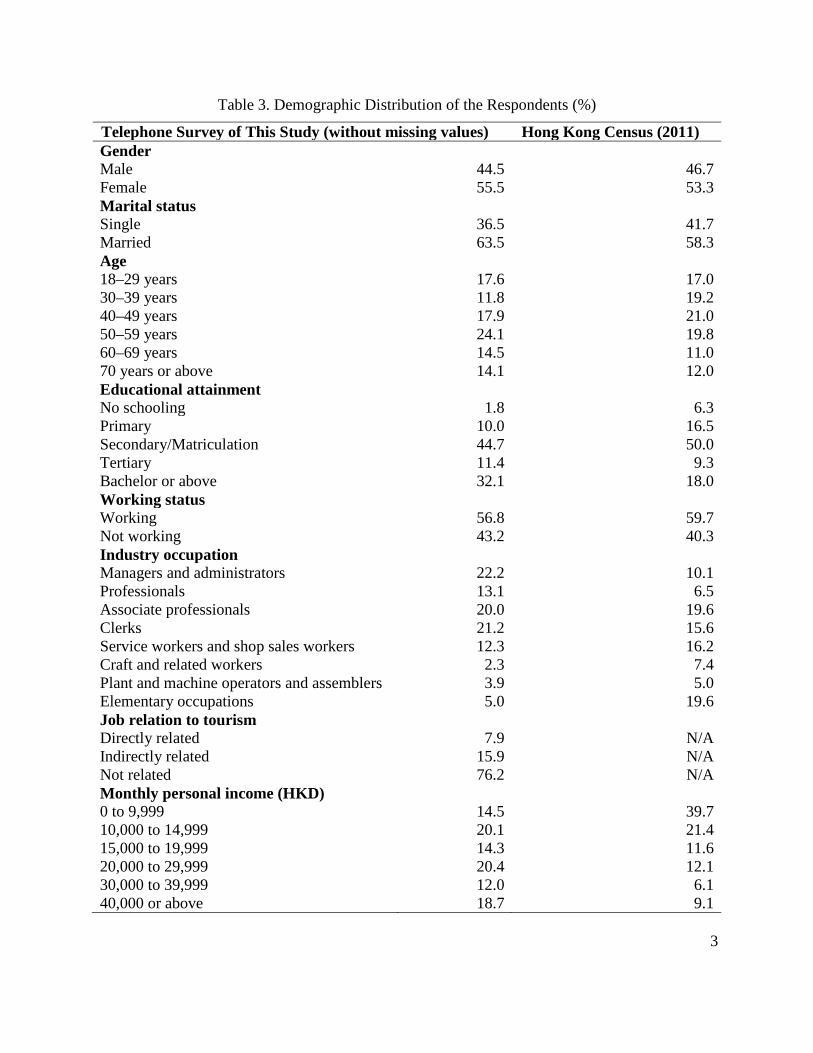
Respondent Demographic Profiles 11
Table 3 shows the profiles of the respondents. Among the 1,839 responses, 55.5% of them were 12
female whereas the other 44.5% were males. In terms of marriage, 60.4% of the respondents 13
were married and 70.8% of them were aged from 18 to 59. Regarding the educational attainment, 14
44.5% of them held secondary/matriculation and 31.9% of them held bachelor or higher degrees. 15
Among all the respondents, 56.6% of them were working and 87% of them were not related to 16
tourism industry. Only half of the respondents agreed to report their monthly personal income 17
and around 56% of them earned from 10,000 HKD to 30,000 HKD. To test the sampling bias, 18
the demographic information of the sample was compared with the results of the Hong Kong 19
2011 Population Census (2012). It is found that the key indicators such as gender, age, 20
educational attainment and income were similar to the census results, indicating that the selected 21
sample of this study can represent the population of Hong Kong residents. 22

15
Insert Table 3 Here 1
2
The Exploration of the Dimensions 3
Missing data were eliminated via listwise deletion before conducting any analysis. Two cases 4
were deleted during the assessment of normality and outliers because of their high Mahalanobis 5
d-squared values. As a result, a total of 1406 cases were retained for the analysis. Descriptive 6
analysis was conducted with all the 23 items and their mean and standard deviation were 7
reported accordingly (Table A.1. in Appendix 2). EFA was employed to deduct the dimensions 8
and abstract the representative factors measuring the economic sustainability of tourism 9
development. According to Hair, Black, Babin, and Anderson (2010), principal axis factoring 10
method and direct oblimin rotation were selected to obtain a more robust result. 11
The Kaiser–Meyer–Olkin (KMO) was 0.863 and the p value of Bartlett’s test was 0.001, 12
indicating the data collected was qualified to run EFA. From Table 4, it can be found that 11 13
items were deleted via EFA from the item pool because their loadings were smaller than 0.40 or 14
they caused cross-loading problems. The factor loadings of all the items remained in the model 15
were higher than 0.643 without any cross-loadings. Three factors were abstracted, namely 16
Economic Positivity (6 items), Development Control (5 items), and Individual Welfare (2 items). 17
The three factors explained 53.2% information included in the data. Cronbach’s alpha was 18
applied to obtain the internal consistency estimate of reliability for each construct. As a result, 19
Cronbach’s alpha ranged from 0.639 to 0.862. Although the cut-off point of Cronbach’s alpha is 20
0.7, it may decreases to 0.6 for an exploratory study (Hair et al., 2010). Thus, the reliability of 21
the EFA result was acceptable. 22

16
Insert Table 4 Here 1
2
The Assessment of Factor Structure Stability 3
To test the robustness of the EFA result, the overall sample was further divided into two 4
subgroups. Hong Kong has 18 districts across its three regions. The resident population and 5
number of tourists vary across these districts. The study sought to compare the economic 6
sustainability measurement in both the high- and low-density areas. Due to the lack of statistics 7
of the volume of tourist flow, the number of tourism attraction in each district was used to 8
represent the tourism density. The resident-attraction density of a district could be calculated 9
using the following equation, which considered the population and attraction densities in a 10
particular district: 11
Resident − attraction density = ��𝑑𝑑𝑑𝑑𝑑𝑑𝑑𝑑 𝑝𝑝𝑝𝑝𝑝𝑝𝑑𝑑𝑝𝑝
𝑑𝑑𝑑𝑑𝑑𝑑𝑑 𝑝𝑑𝑎𝑝� �𝑝𝑝. 𝑝𝑜 𝑝𝑑𝑑𝑑𝑝𝑑𝑑𝑑𝑝𝑝𝑑 𝑑𝑝 𝑑𝑑𝑑𝑑𝑑𝑑𝑑𝑑
𝑑𝑑𝑑𝑑𝑑𝑑𝑑𝑑 𝑝𝑑𝑎𝑝�
As a result, the resident-attraction density of the 18 districts were ranged from 0.013 to 0.518. 12
Following Zhang et al. (2016), 0.1 was employed to be the cut-off point. This cut-off point was 13
employed considering the sample size for each sub-groups and the distribution of each district in 14
the traditional categorization of tourism regions. As a result, eight districts (i.e., Central and 15
West, Wan Chai, East, Yau Tsim Mong, Sham Shui Po, Kowloon City, Wong Tai Sin, and 16
Kwun Tong) were grouped into high density districts whereas the other 10 districts (i.e., South, 17
Tsuen Wan, Kwai Tsing, Sai Kung, Sha Tin, Tai Po, North, Tuen Mun, Yuen Long, and Island) 18
were low density districts. The categorization was consistent with the fact that districts in Hong 19
Kong Island (except South) and Kowloon were considered as high resident-attraction density 20

17
regions, whereas those in New Territories were not as popular as the other two regions for 1
tourists. 2
There are 607 and 790 responses in the high and low density group, respectively. It should 3
be noted that nine respondents did not provide their addresses in the survey, and were hence 4
excluded from the sub-samples. And the nine responses with missing address were excluded 5
from the sub-sample analysis. As shown in Table 4, satisfactory KMO values and significant 6
results of Bartlett’s test were obtained from both the two sub-groups, indicating that they were 7
eligible for EFA analysis. Factor loadings of the high density group were ranged from 0.610 to 8
0.890, whereas the low density group was 0.633 to 0.823. The results were similar to the whole 9
sample, which means that all the loadings contributed significant information to the 10
corresponding factors. The Cronbach’s alpha of each construct in the two groups was larger than 11
0.635, meaning acceptable reliability (Hair et al. 2010). The EFA results of the sub-groups 12
indicated that the three factors derived from the whole sample were robust and the structure of 13
the factors were stable. 14
The Confirmation of the Dimensions 15
The CFA results are displayed in Table 5. It is shown that the standardized factor loadings of 16
all the 13 items were above 0.5 and significant at 0.001 significance level, indicating good 17
representativeness of the items to the corresponding three factors. The composite reliability of 18
the factors ranged from 0.670 to 0.864, indicating good reliability (Bagozzi & Kimmel, 1995). 19
The extent of the correlation between the intended measure and the other measures in the 20
construct was evaluated using convergent validity. Convergent validity represents the internal 21
consistency of the variables within one construct. The standardized item-to-factor loading 22

18
magnitude should be at least 0.5, and the factor loadings should reach the level of statistical 1
significance (Hair et al., 2010). Average variance extracted (AVE) was also calculated for each 2
construct to estimate the convergent validity, and the results were all above the cut-off point 0.5 3
(Hair et al., 2010), indicating a satisfactory convergent validity. The differences between 4
constructs are examined using discriminant validity (Byrne, 2010). The test does not provide 5
strong evidence of discriminant validity if the squared correlation between any two constructs 6
exceeded the corresponding AVE. In this study, each of the squared correlation between any two 7
constructs was smaller than the corresponding AVE (Table A.2. in Appendix 2), confirming the 8
discriminant validity of the measurement scale. Last, the nomological validity was employed to 9
examine the correlations among the constructs in a measurement model which should be 10
theoretically related (Hair et al., 2010). In this study, correlations were found to be statistically 11
significant, indicating a nomological validity of the measurement model (Table A.2. in Appendix 12
2). Therefore, the convergent validity, discriminant validity, and nomolocigal validity were all 13
confirmed. The model also passed a series of model fit indices such as the root mean square error 14
of approximation (0.070), the goodness-of-fit index (0.941) and the comparative fit index (0.940). 15
The details of the validity tests can be found in Table A.3. in Appendix 2. 16
CFA was also conducted for the two subgroups (high and low resident-attraction density 17
regions). It can be found in Table 5 that the loadings of each item in both the two subgroups were 18
similar to the results of the whole sample. The composite reliability were all larger than 0.6, 19
indicating good reliability. The CFA results of the two subgroups were similar to the whole 20
sample and the reliability, validity and model fit indices were all acceptable (see Table A.3. in 21
19
Appendix 2). It means the factors abstracted from the data were robust and the factor structure 1
was stable. 2
As shown in Table 5, the factor mean of Development Control was the highest among all 3
dimensions (3.6), followed by Economic Positivity (3.4) and Individual Welfare (1.7). The 4
relationship between socio-demographic characteristics and attitudes toward tourism economic 5
sustainability was examined by ANOVAs and t-tests (see Table A.4.-A.7. in Appendix 2). The 6
results showed that those who were single, female, employed, younger, with low income, 7
moderate level of education, living in the high tourism density area were more in favor of 8
Development Control. People who were older, married, and have jobs related to tourism rated 9
higher on Economic Positivity. People who were older, married, unemployed, with higher level 10
of education, higher income, have jobs related to tourism, and living in the high tourism density 11
area reported higher level of Individual Welfare. 12
Insert Tables 5 Here 13
14
Discussion 15
This paper makes an important contribution to the literature on economic sustainability of 16
tourism by expanding the measurement from the macro level to micro level, which reveals the 17
concerns of residents and makes the measurement more comprehensive. Using the study setting 18
in Hong Kong, it transcends previous analysis by providing a context to learn from ongoing 19
controversies about the effects of tourism on local community. By employing telephone survey 20
with quota sampling based on geographical distribution of the Hong Kong, the results of the 21
study are considered as representative. Further, the robustness and stability of the measurement 22

20
is verified by comparing the results from residents from both high and low resident-attraction 1
density areas. 2
Our study revealed that economic sustainability has three dimensions, Economic Positivity, 3
Development Control and Individual Welfare. Economic Positivity is composed of six items 4
which focus on the macro-economic benefits brought by inbound tourism and IVS. It means the 5
items which are related to the positive economic impact confirmed by this research are robust to 6
measure economic sustainability (Choi & Sirakaya, 2005; Sirakaya-Turk & Gursoy, 2013). The 7
ratings on this dimension showed that residents believe tourism only has a slightly positive 8
impact on the community (e.g., visitors could enlarge the destination’s tourism market, bring 9
more job opportunities and increase government revenue). This finding reflects that the Hong 10
Kong tourism industry may have entered the stage of stagnation, a later stage of tourism 11
development (Butler, 1980). Since 2015, the total number visitors to Hong Kong has declined 12
because of falling mainland tourists (HKBT, 2016). Consistent with Doxey (1976), residents’ 13
positive attitudes toward tourism development will be weakened as a destination moves towards 14
stagnation. Hong Kong has long been the shopping hotspots for mainland Chinese tourists who 15
try to avoid high tariffs (Zhang, et al., 2016). However, with the development of duty free 16
shopping options in the surrounding area such as South Korea, Japan, and mainland China, the 17
selling point of Hong Kong as shopping paradise has been gradually weakened. In addition, the 18
anti-mainland sentiments expressed by the locals also changed the previous image of Hong Kong 19
as hospitable. It has affected the sustainable growth of the mainland Chinese market that Hong 20
Kong relied very much on (Shen, Luo & Zhao, 2017). To cope with the slowdown, Hong Kong 21
needs to renew its charm by offering tourists more authentic, real-life, and welcoming experience. 22

21
The Development Control dimension consisted of issues related to limit the number of 1
tourists, impose restrictions to preserve the environment, and suppress prices. Our study shows 2
that although residents recognize the economic benefits of tourism, they are more concerned with 3
limits relevant to the destination environment. Tourism, as a demand-driven industry, is likely to 4
be sustained only in places where natural and cultural resources remain attractive to tourists 5
(Holden, 2013). This finding reinforces that long-term well-being of a tourism community 6
requires intervention mechanisms to reduce potential negative impacts as well as to enhance 7
resilience to tourism induced change (Berkes & Ross, 2013). In our study, Hong Kong residents 8
asked the government to limit the number of visitors, particularly from mainland China because 9
they believed that the prices of the local commodities were pushed up by them. This result is 10
contrary to the results of previous research. The Nielsen Company (2010) reported that over 80% 11
of respondents were either positive or neutral towards the increasing number of mainland tourists 12
shopping in Hong Kong. Another study conducted by Shen, Luo & Zhao (2017) found that while 13
Hong Kong residents worried about the negative impacts of tourism, they expected more 14
Mainland Chinese tourists. The finding is a complement to some previous studies. Kuvan and 15
Akan (2012) found that residents were much more negative about tourist impacts than other 16
stakeholders. In addition, residents were less supportive of further allocation of land to tourism 17
development. The finding may be understood in the specific context of Hong Kong. It's been 20 18
years since Hong Kong, a former British colony, reverted to Chinese sovereignty, yet tensions 19
between local people and those from the mainland run deeper than ever. Mainlanders have been 20
described by some local media as locusts that usurped medical resources, increased inflation, and 21
disturbed goods supply in Hong Kong. These tensions have also been mediated by cultural 22
stereotypes toward Chinese tourists such as speaking loudly, littering, and jumping in queue 23

22
(Yeung & Leung, 2007). These kinds of conflicts are often complex and challenging to deal 1
with. Thus, gaining a better understanding of conflicts is essential to improve economic 2
sustainability of tourism in Hong Kong. 3
The third construct abstracted by this study is the Individual Welfare. In published studies, 4
all measurements of economic sustainability are based on the macroeconomic indicators such as 5
objective index used UNWTO (2004) and subjective ones in Choi and Sirakaya (2005). The 6
findings of this research expand the measurement from the macro level to micro level, reveals 7
the concerns of residents for their own welfare and makes the measurement of economic 8
sustainability of tourism development more comprehensive. Hong Kong residents disagreed that 9
the increase of their income and the expansion of their consumption correlate to the growth of 10
tourism. This pattern is in agreement with the earlier research which found significant correlation 11
between residents’ net economic gain and attitudes associated with tourism (Lindberg & Johnson, 12
1997). This finding is also consistent with recent research suggesting that while tourist 13
expenditure benefited land tycoons and big retail business, ordinary people suffered from 14
increased real estate price, inflation, crowding, as well as shortage of local commodities caused 15
by tourism expansion (Zhang, et al., 2016). Improving the well-being for local residents is an 16
important goal of sustainability (OECD, 2011). The government should use the transfer payment 17
to balance the tourism economic positivity perceived by various groups of stakeholders and 18
allocate more resources to the construction of infrastructures to improve the welfare of all 19
residents. 20
In addition, this study reveals that the evaluation of sustainability construct is inconsistent 21
across various socio-demographic groups. The benefits brought by tourism development are 22
23
mostly appreciated by senior residents, married individuals and people whose jobs are related to 1
tourism. It is easy to understand that the abovementioned three groups also believe the arrivals of 2
mainland visitors could improve their welfare. It is interesting to notice that people with low 3
education or income levels, unemployed or living in high tourism density areas tend to express a 4
higher level of agreement that tourism can enhance their individual welfare. It can be explained 5
that the increase of employment opportunities brought by tourism development mainly go to the 6
frontline staff with the increase of newly opened hotels, retail shops and other service related 7
sectors. Meanwhile, residents living in low-density regions were more supportive to control the 8
tourism development. Comparing with their original living areas, people in low-density regions 9
are now receiving more and more tourists in their territories, along with pushing up the prices of 10
the local commodity and real estate. Such kind of disturbance, especially at its beginning stage, 11
may arouse the uncomfortable sentiment from the residents (Lindburg & Johnson, 1997). 12
Conclusion and Limitations 13
The scale developed in this study contributes to the literature by considering some micro aspects, 14
such as the individual welfare, into the economic sustainability measurement. It also pioneers the 15
economic sustainability of tourism research by including the policy suggestions of residents. The 16
finding of this study can also be useful when government and industries prepare future 17
development plans and to make policy decisions. The scale expresses the expectation of residents 18
to the government and reveals what they care about for their own welfare. Those views are 19
essential for the success of any development plans and policies. As suggested by Zhang et al. 20
(2016), it is necessary to conduct the resident survey on a regular basis, thus the stakeholders 21

24
could be aware of the residents’ attitudes and formulate policies proactively to correspond to 1
their views and maintain the sustainability of tourism development. 2
The current decline in the number of mainland Chinese tourists to Hong Kong is a cause of 3
concern with particular effects on retail trade, hotel occupancy rates and government revenues. It 4
demonstrates how the Irritation Effect (Doxey, 1975) can impact on residents’ views on both the 5
number and behaviors of visitors. There is some evidence of recent events in Hong Kong 6
suggesting that on the Doxey scale, residents’ attitudes towards mainland tourists have moved 7
from “irritation” to “antagonism”. It may be one major factor influencing mainland tourists’ 8
decision not to visit Hong Kong. It further reinforces the view of this study that in any research 9
on residence and community attitude to tourism development and its sustainability, their views 10
can be a major factor in how tourism and tourists are perceived in a destination. In a heavily-11
urbanized area like Hong Kong, the community is where most tourism takes place, and therefore, 12
host-guest conflicts take place. In relation to tourism expansion, environmentally friendly forms 13
of tourism such as ecotourism should be encouraged in order to eliminate the negative impacts of 14
mass tourism-oriented activities. 15
As in any study, this research is not without limitations. As a Hong Kong based study, the 16
current measurement will need to be tested in different cultural contexts and different destination 17
types. After further refinement, the scale may provide a more comprehensive measurement to 18
academia, industry and communities. 19
20
References 21

25
Altinay, L. (2000) Possible impacts of a federal solution to the Cyprus problem on the tourism 1
industry of North Cyprus. International Journal of Hospitality Management, 19(3): 295-2
309. 3
Ap, J. (1992). Residents’ perceptions on tourism impacts. Annals of Tourism Research, 19(4): 4
665-690. 5
Bagozzi, R. P., & S. K. Kimmel. (1995). A comparison of leading theories for the prediction of 6
goal directed behaviours. British Journal of Social Psychology, 34 (4): 437–461. 7
Berkes, F., & H. Ross. (2013). Community resilience: Toward an integrated approach. Society & 8
Natural Resources, 26(1): 5-20. 9
Black, K. (2010). Business Statistics: Contemporary Decision Making. (6th Ed.). John Wiley & 10
Sons. 11
Bramwell, B. (2011). Governance, the state and sustainable tourism: A political economy 12
approach. Journal of Sustainable Tourism 19(4-5): 459-477. 13
Buckley, R. (2012). Sustainable tourism: Research and reality. Annals of Tourism Research 14
39(2): 528-546. 15
Burak, S. A., E. Dogan, & C. Gazioglu. (2004). Impact of urbanization and tourism on coastal 16
environment. Ocean & Coastal Management, 47(9): 515-527. 17
Butler, R. W. (1980). The concept of a tourist area cycle of evolution: implications for 18
management of resources. The Canadian Geographer/Le Géographe canadien, 24(1), 5-19
12. 20

26
Byrne, B. M. (2010). Structural equation modeling with AMOS: Basic concepts, applications, 1
and programming (2nd Ed.). New York: Taylor & Francis Group. 2
Carr, E. C., & A.Worth. (2001). The use of the telephone interview for research. Journal of 3
Research in Nursing, 6 (1): 511-524. 4
Calgaro, E., K. Lloyd, & D. Dominey-Howes. (2014). From vulnerability to transformation: a 5
framework for assessing the vulnerability and resilience of tourism destinations. Journal 6
of Sustainable Tourism, 22(3): 341-360. 7
Choi, H. C., & E. Sirakaya. (2005). Measuring residents’ attitude toward sustainable tourism: 8
Development of sustainable tourism attitude scale. Journal of Travel Research, 43(4): 9
380-394. 10
Choi, H. C., & E. Sirakaya. (2006). Sustainability indicators for managing community 11
tourism. Tourism Management, 27(6): 1274-1289. 12
Churchill, G. A. (1979). A paradigm for developing better measures of marketing constructs. 13
Journal of Marketing Research, 16(1): 64–73. 14
Doxey, G. V. (1975). A causation theory of visitor-resident irritants: Methodology and research 15
inferences. In the impact of tourism sixth annual conference proc of the travel research 16
Association. 17
Fredline, E., & B. Faulkner. (2000). Host community reactions: A cluster analysis. Annals of 18
Tourism Research, 27 (3): 763-784. 19
Giannoni, S., & M. A. Maupertuis. (2007). Is tourism specialization sustainable for a small 20
island economy? A cyclical perspective. Advances in Modern Tourism Research, 87-105. 21

27
Gripp, S. I., A. E. Luloff, & R. D. Yonkers. (1994). Reporting response rates for telephone 1
surveys used in agricultural economics research. Agricultural and Resource Economics 2
Review, 23(2): 200-206. 3
Hair, J. F., W. C. Black, B.J. Babin, & R. E. Anderson. (2010). Multivariate Data Analysis (7th 4
Ed.), Upper Saddle River, New Jersey: Pearson Education, Inc. 5
Ho, J. A., Chia, K. W., Ng, S. I., & Ramachandran, S. (2017). Problems and Stakeholder 6
Responsibilities in Island Tourism: The Case of Tioman Island in Malaysia. Journal of 7
Hospitality & Tourism Research, 41(4), 445-474. 8
Holden, A. (2013). Tourism, poverty and development. Hoboken: Taylor and Francis. 9
Hong Kong Census & Statistics Department. (2012). 2011 Population Census. Retrieved 15 10
September 2105, from http://www.statistics.gov.hk/pub/B11200552011XXXXB0100.pdf 11
Hong Kong Census & Statistics Department. (2013). Population. Retrieved 01 May 2103, from 12
http://censtatd.gov.hk/hkstat/sub/ss20_tc.jsp 13
Hong Kong Tourism Board. (2016). Visitor Arrival Statistics-Jan 2016. Retrieved 1st July 2016, 14
from 15
http://securepartnernet.hktb.com/filemanager/intranet/dept_info/private_20/paper/VAS2016
02/VAS2016/VAS_01_2016_0.pdf 17
Hung, K., & J.F. Petrick. (2010). Developing a measurement scale for constraints to cruising. 18
Annals of Tourism Research, 37 (1): 206–228. 19
Katircioglu, S. T. (2009). Revisiting the tourism-led-growth hypothesis for Turkey using the 20
bounds test and Johansen approach for cointegration. Tourism Management, 30(1), 17-20. 21

28
Katircioglu, S. (2011). Tourism and Growth in Singapore: New Extension from Bounds Test to 1
Level Relationships and Conditional Granger Causality Tests. Singapore Economic 2
Review, 56 (3): 441-453. 3
Kuvan, Y., & Akan, P. (2012). Conflict and agreement in stakeholder attitudes: Residents’ and 4
hotel managers’ views of tourism impacts and forest-related tourism development. 5
Journal of Sustainable Tourism, 20(4), 571-584. 6
Lacher, R. G., & C. O. Oh. (2012). Is tourism a low-income industry? Evidence from three 7
coastal regions. Journal of Travel Research, 51(4): 464-472. 8
Lai, P. H., Hsu, Y. C., & Nepal, S. K. (2013). Representing the landscape of Yushan national 9
park. Annals of Tourism Research, 43, 37-57. 10
Lawson, J.R. (2001). Community issues and resident opinions of tourism. Annals of Tourism 11
Research, 28(2): 269-290. 12
Lindberg, K., & Johnson, R. L. (1997). Modeling resident attitudes toward tourism. Annals of 13
Tourism Research, 24(2), 402-424. 14
Liu, A., & B. McKercher. (2016). The impact of visa liberalization on tourist behaviors—The 15
case of China outbound market visiting Hong Kong. Journal of Travel Research, 55(5): 16
603-611. 17
Logar, I. (2010). Sustainable tourism management in Crikvenica, Croatia: An assessment of 18
policy instruments. Tourism Management, 31(1): 125-135. 19

29
Losada, N., E. Alén, J. L. N icolau, & D T. omínguez. (2017). “Senior tourists’ accommodation 1
choices”. International Journal of Hospitality Management, 66: 24-34. 2
Mathieson, A., & G. Wall (1982). Tourism: Economic, Physical, and Social Impacts. London: 3
Longman. 4
Marcus, A., & L. Crane. (1986). Telephone surveys in public health research. Medical Care, 24 5
(2): 97-112. 6
Miller, G. (2001). The development of indicators for sustainable tourism: results of a Delphi 7
survey of tourism researchers. Tourism Management, 22(4): 351-362. 8
Muresan, I. C., Oroian, C. F., Harun, R., Arion, F. H., Porutiu, A., & Chiciudean, G. O., et al. 9
(2016). Local residents' attitude toward sustainable rural tourism development. 10
Sustainability, 8(2), 100. 11
Nepal, S.K. (2002). Mountain ecotourism and sustainable development: ecology, economics, and 12
ethics. Mt. Res. Dev 22(2): 104-109. 13
The organization for economic cooperation and Development (OECD). (2011). How’s Life?: 14
Measuring Well-Being, OECD Publishing, Paris. 15
Oh, C. O. (2005). “The contribution of tourism development to economic growth in the Korean 16
economy.” Tourism Management 26(1): 39-44. 17
Robson, C. (1993). Real World Research. Oxford: Blackwell. 18
Seetanah, B. (2011). Assessing the dynamic economic impact of tourism for island 19
economies. Annals of Tourism Research, 38(1): 291-308. 20
Sharpley, R. (2008). Tourism, tourists and society. Huntingdon UK: Elm publications 21

30
Shen, H., Luo, J., & Zhao, A. (2016). The sustainable tourism development in hong kong: an 1
analysis of Hong Kong residents’ attitude towards mainland Chinese tourist. Journal of 2
Quality Assurance in Hospitality & Tourism, 1-24. 3
Sirakaya-Turk, E., & D. Gursoy. (2013). Predictive validity of SUSTAS. Tourism 4
Analysis, 18(5): 601-605. 5
Su, Q., & B.Y. Lin. (2004). Classification of residents in the tourist attractions based on attitudes 6
and behaviors: A case study in XIdi, Zhouzhaung and Jiuhua Mountain. Geographical 7
Research, 23 (1): 104-114. 8
Tao, T. C., & G. Wall. (2009). Tourism as a sustainable livelihood strategy. Tourism 9
Management, 30(1): 90-98. 10
The Nielsen Company (2010) Mainland Tourists Tripling the Size of Hong Kong Population. 11
Retrieved Nov 30, 2017, from http://blog.nielsen.com/nielsenwire/consumer/ mainland-12
tourists-tripling-the-size-of-hong-kong-population/ 13
Timur, S., & D. Getz. (2009). Sustainable tourism development: How do destination 14
stakeholders perceive sustainable urban tourism?. Sustainable Development, 17(4): 220-15
232. 16
The United Nations Environmental Programme (UNEP) & The United Nations World Tourism 17
Organization (UNWTO). (2005). Making tourism more sustainable: A guide for policy 18
makers. Madrid: UNWTO. 19
The United Nations World Tourism Organization (UNWTO). (1995). Agenda 21 for the travel 20
and tourism industry. Madrid: UNWTO 21
31
The United Nations World Tourism Organization (UNWTO). (2004). Indicators of sustainable 1
development for tourism destinations. Madrid: UNWTO. 2
Tosun, C. (2002). Host perceptions of impacts: A comparative tourism study. Annals of Tourism 3
Research, 29 (1): 231–253. 4
Uriely, N., Israeli, A., & Reichel, A. (2003). Religious identity and residents’ attitudes toward 5
heritage tourism development: The case of Nazareth. Journal of Hospitality & Tourism 6
Research, 27(1), 69-84. 7
Veenhoven, R. (2001). Why Social Policy Needs Subjective Indicators. Berlin, Germany: Social 8
Science Research Center. 9
Wong, A., & C. Buckley. (2015). Protesters Confront Mainland Shoppers in Hong Kong. The 10
New York Times (Feb 9, 2015). 11
Yeung, S., & Leung, C. (2007). Perception and attitude of Hong Kong hotel guest-contact 12
employees towards tourists from Mainland China. International Journal of Tourism 13
Research, 9(6), 395–407. 14
Zhang, H. Q., D. X. F. Fan, T. S. Tse, & B. King. (2016). “Creating a scale for assessing socially 15
sustainable tourism.” Journal of Sustainable Tourism, 25(1): 65-78. 16

1
Table 1. Procedure for Developing the Measurement Instruments
Procedures Techniques
1. Specify the domain of the construct Literature search
2. Generate a sample of items Literature search
In-depth interviews
3. Purify items and design a questionnaire Panel of experts, pilot study
(content validity)
4. Collect data Survey
5. Explore dimensionality Exploratory factor analysis
6. Assess reliability Coefficient alpha
7. Assess factor structure stability (1) Data split: Conduct steps 5 and 6 in both high and low resident-tourism density groups
8. Confirm dimensionality Confirmatory factor analysis
9. Assess reliability and validity Composite reliability
Convergent validity
Discriminant validity
Nomological validity
10. Assess factor structure stability (2) Data split: Conduct step 9 in both high and low resident-tourism density groups

2
Table 2. Results of the Telephone Reviews
Types Number of calls
Complete interviews 1,839
Partial interviews 131
Refused eligible units 2,366
No eligible units 1,056
Not contacted, but known eligible units 7,401
Other non-interviewed units 40,207
Total number of dialed telephone numbers 53,000
3
Table 3. Demographic Distribution of the Respondents (%)
Telephone Survey of This Study (without missing values) Hong Kong Census (2011) Gender Male 44.5 46.7 Female 55.5 53.3 Marital status Single 36.5 41.7 Married 63.5 58.3 Age 18–29 years 17.6 17.0 30–39 years 11.8 19.2 40–49 years 17.9 21.0 50–59 years 24.1 19.8 60–69 years 14.5 11.0 70 years or above 14.1 12.0 Educational attainment No schooling 1.8 6.3 Primary 10.0 16.5 Secondary/Matriculation 44.7 50.0 Tertiary 11.4 9.3 Bachelor or above 32.1 18.0 Working status Working 56.8 59.7 Not working 43.2 40.3 Industry occupation Managers and administrators 22.2 10.1 Professionals 13.1 6.5 Associate professionals 20.0 19.6 Clerks 21.2 15.6 Service workers and shop sales workers 12.3 16.2 Craft and related workers 2.3 7.4 Plant and machine operators and assemblers 3.9 5.0 Elementary occupations 5.0 19.6 Job relation to tourism Directly related 7.9 N/A Indirectly related 15.9 N/A Not related 76.2 N/A Monthly personal income (HKD) 0 to 9,999 14.5 39.7 10,000 to 14,999 20.1 21.4 15,000 to 19,999 14.3 11.6 20,000 to 29,999 20.4 12.1 30,000 to 39,999 12.0 6.1 40,000 or above 18.7 9.1

4
Table 4. Exploratory Factor Analysis Results for the Overall, High Density, and Low Density Samples
Measures
Overall (N=1406)ᵃ High Density (N=607)ᵇ Low Density (N=790)ᶜ Factor
loading/ Cronbach's
alpha
Eigenvalue % of variance
Factor loading/
Cronbach's alpha
Eigenvalue % of variance
Factor loading/
Cronbach's alpha
Eigenvalue % of variance
Factor One: Economic Positivity α=0.862 3.476 30.473 α=0.864 3.497 30.691 α=0.862 3.484 30.378 Overall, inbound tourism is important to Hong Kong economically 0.750 0.744 0.762 Mainland visitors enlarge Hong Kong's tourism market. 0.705 0.741 0.708 Mainland visitors bring more job opportunities. 0.731 0.737 0.724 A great number of Hong Kong residents will lose their jobs when the tourism shrinks in Hong Kong. 0.675 0.686 0.661 The increase of taxes related to the tourism industry has raised the government revenue. 0.639 0.610 0.653 The Individual Visit Scheme brought economic benefits to Hong Kong. 0.772 0.794 0.768
Factor Two: Development Control α=0.839 2.900 15.292 α=0.851 2.992 15.927 α=0.828 2.816 15.114 Hong Kong has to limit the number of visitors. 0.699 0.733 0.660 Hong Kong has to limit the number of mainland visitors. 0.838 0.890 0.823 Government should impose restriction to preserve the environment and to conserve tourism resources. 0.704 0.691 0.713 The Government should impose restriction to suppress prices. 0.668 0.674 0.650 Mainland visitors negatively impact local commodity price. 0.655 0.673 0.649
Factor Three: Individual Welfare α=0.639 1.491 6.299 α=0.635 1.433 6.273 α=0.642 1.531 6.369 The increase of my income was related to the development of tourism industry after the Individual Visit Scheme. 0.643 0.689 0.633 I bought some extra commodities, which is affected by the demonstration effect of mainland visitors. 0.727 0.691 0.746
ᵃKMO =0.854, Bartlett's Test of Sphericity p<0.000; ᵇKMO =0.842, Bartlett's Test of Sphericity p<0.000; ᶜKMO =0.854, Bartlett's Test of Sphericity p<0.000

5
Table 5.Confirmatory Factor Analysis Results for the Overall, High Density, and Low Density Samples
Overall
High Low
Measures
Means
Composite Reliability
Standardized Factor
Loading p Composite
Reliability
Standardized Factor
Loading p Composite
Reliability
Standardized Factor
Loading p
Factor One: Development Control 3.60 0.839 0.849 0.830 Hong Kong has to limit the number of visitors.
4.03 0.715 NA 0.760 NA 0.674 NA
Hong Kong has to limit the number of mainland visitors. 3.79
0.903 *** 0.930 *** 0.877 ***
Government should impose restriction to preserve the environment and to conserve tourism resources.
3.64
0.724 *** 0.694 *** 0.745 ***
The Government should impose restriction to suppress prices. 3.32
0.590 *** 0.604 *** 0.579 ***
Mainland visitors negatively impact local commodity price. 3.21
0.619 *** 0.621 *** 0.628 ***
Factor Two: Economic Positivity 3.41 0.864 0.865 0.864 Overall, inbound tourism is important to Hong Kong economically
3.62 0.749 NA 0.733 NA 0.770 NA
Mainland visitors enlarge Hong Kong's tourism market. 3.49
0.747 *** 0.750 *** 0.751 ***
Mainland visitors bring more job opportunities. 3.42
0.742 *** 0.742 *** 0.736 ***
A great number of Hong Kong residents will lose their jobs when the tourism shrinks in Hong Kong. 3.32
0.672 *** 0.676 *** 0.670 ***
The increase of taxes related to the tourism industry has raised the government revenue. 3.32
0.598 *** 0.604 *** 0.600 ***
The Individual Visit Scheme brought economic benefits to Hong Kong. 3.28
0.783 *** 0.801 *** 0.711 ***
Factor Three: Individual Welfare 1.71 0.670 0.673 0.699 The increase of my income was related to the development of tourism industry after the Individual Visit Scheme. 1.84
0.824 NA 0.851 NA 0.815 NA
I bought some extra commodities, which is affected by the demonstration effect of mainland visitors. 1.59
0.585 *** 0.558 *** 0.600 ***
*** p<0.001