..,,1 67-78 New York 79-89 North Carolina 90 - 102 Ohio 103-114 Pennsylvania 115 - 129 South...
182
DOCUMENT RESUME ED 031 325 RC 003 508 The Appalachian Region: A Statistical Appendix of Comparative Socioeconomic Indicators. Appalachian Regional Commission, Washington, D.C. Pub Date Mar 68 Note-181p. EDRS Price MF-$0.75 HC-$9.15 Descriptors-Census Figures, *Comparative Statistics, *Democaraphy, *Depressed Areas (Geographic), Economic Status, Geographic Regions, Population DiOribution, *Rural Population, *Socioeconomic Status, Tables (Data) Identifiers-* Appalachia Socioeconomic and demographic indicators for the Appalachian regional area are compared in this report with similar indicators for the total United States. The Appalachian region is defined as including parts of Alabama, Georgia, Kentucky, Maryland, Mississippi, New York, North Carolina, Ohio, Pennsylvania, South Carolina, Tennessee, Virginia, and West Virginia. Comparisons between Appalachia and the United States as a whole include population by sex and by place, distribution of families by income, educational levels, labor force and employment status, and economic and businesS factors. Statistical data in these areas is provided individually .for the Appalachian portion of the states listed above. (EV) a let . ..,,1
Transcript of ..,,1 67-78 New York 79-89 North Carolina 90 - 102 Ohio 103-114 Pennsylvania 115 - 129 South...

DOCUMENT RESUME
ED 031 325 RC 003 508The Appalachian Region: A Statistical Appendix of Comparative Socioeconomic Indicators.Appalachian Regional Commission, Washington, D.C.Pub Date Mar 68Note-181p.EDRS Price MF-$0.75 HC-$9.15Descriptors-Census Figures, *Comparative Statistics, *Democaraphy, *Depressed Areas (Geographic), EconomicStatus, Geographic Regions, Population DiOribution, *Rural Population, *Socioeconomic Status, Tables (Data)
Identifiers-* AppalachiaSocioeconomic and demographic indicators for the Appalachian regional area
are compared in this report with similar indicators for the total United States. TheAppalachian region is defined as including parts of Alabama, Georgia, Kentucky,Maryland, Mississippi, New York, North Carolina, Ohio, Pennsylvania, South Carolina,Tennessee, Virginia, and West Virginia. Comparisons between Appalachia and theUnited States as a whole include population by sex and by place, distribution offamilies by income, educational levels, labor force and employment status, andeconomic and businesS factors. Statistical data in these areas is provided individually.for the Appalachian portion of the states listed above. (EV)
a let .
..,,1

U.S. DEPARTMENT OF HEALTH, EDUCATION 8, WELFARE
OFFICE OF EDUCATION
THIS DOCUMENT HAS BEEN REPiODUCED EXACTLY AS RECEIVED FROM THE
PERSON OR ORGANIZATION ORIGINATING IT. POINTS OF VIEW OR OPINIONS
STATED DO NOT NECESSARILY REPRESENT OFFICIAL OFFICE OF EDUCATION
POSITION OR POLICY.
THE APPALACHIAN REGION:
A Statistical Appendix ofComparative Socioeconomic
Indicators
htzwEe-1 JUL 22 1969
TIMSU
Appalachian Regional Commission1666 Connecticut Avenue, N.W.Washington, D.C. 20235March 1968

7--ramemenimppergetramesemonlesametwomiswawegmeruar
STATISTICAL APPENDIX
Appalachian Region Fact Sheet
United States
Population by Sex, 1960Population by Place, 1960Distribution of Families by Income, 1960
Education of Persons 25 and over, 1960Labor Force Status by Sex -14 and over- 1960Employment Status by Sex -14 and over- 1960
Number ofPercent
NuMber ofPercent
Establishments in Selected Services and Sales 1963,and 5
Change 1958-1963Wholesale Establishments and Sales 1963, andChange 1958-1963
Number of Retail Establishments and Sales 1963, andPercent Change 1958-1963
Appalachian Re gi
Population by Sex, 1960 7Population by Place, 1960Distribution of Families by Income, 1960
Population, Rate of Natural Increase, and Net Migration Rate, 8
1950-1960, and 1960-1965, for the.United States, AppalachianRegion, and Appalachian Portions of Each State
Education of Persons 25 and over, 1960Labor Force Status by Sex -14 and over- 1960Employment Status by Sex -14 and over- 1960
Civilian Work Force, Employment, and Unemployment, 1965 10
Percent Change 1962-1965, and 1962-1965 Rate of Unemployment
Manufacturing Employment and Value Added by Manufacture, 1954, 11
1958, and 1963 and Percent Change, 1954-1958 and 1958-1963

Page
Appalachian Region (Cont.)
Value Added by Manufacturing Employee, 1954, 1958, and 1963 and 12Percent Change, 1954-1958 and 1958-1963
.Number of Establishments in Selected Services and Sales 1963, and 13Percent Change 1958-1963Number of Wholesale Establishments and Sales 1963, and
Percent Change 1958-1963
Number of Retail Establishments and Sales, 1963,and 14Percent Change 1958-1963
Alabama - State Total
Population by Sex, 1960Population by Place, 1960Distribution of Families by Income, 1960
Education of Persons 25 and over, 1960Labor.Force Status by Sex -14 and over- 1960Employment Status by Sex -14 and over- 1960
Number ofPercent
Number ofPercent
Number ofPercent
15 - 18
15
16
Establishments in Selected Services and Sales 1963,and 17Change 1958-1963Wholesale Establishments and Sales 1963,andChange 1958-1963
Retail Establishments and Sales 1963, andChange 1958-1963
Alabama - Appalachian Portion of State
Population by Sex, 1960Population by Place, 1960Distribution of Families by Income, 1960
18
19-27
19
Population, Rate of Natural Increase, and Net Migration Rate, 201950-1960, and 1960-1965
Education of Persons 25 and over, 1960Labor Force Status by Sex -14 and over- 1960Employment Status by Sex -14 and over- 1960
22

Alabama - Appalachian Portion of State (Cont.)
Percent Change 1962-1965 in Work Force, Employment andUnemployment, Appalachian and Non-Appalachian Portion of State
Manufacturing Etployment and Value Added by Manufacture, 1951!,1958, and 1963 and Percent Change, 1954-1958 and 1958-1963
Number ofPercent
Number ofPercent
Number ofPercent
EstabliShments in Selected Services and Sales 1963, andChange 1958-1963Wholesale Establishments and Sales 1963, andChange 1958-1963
Retail Establishments and Sales 1963, andChange 1958-1963
Page
23
2 6
27
Georgia 28 - 40
Kentucky 41 - 55
Maryland 56 - 66
Mississippi 67 - 78
New York 79 - 89
North Carolina 90 - 102
Ohio 103 - 114
Pennsylvania 115 - 129
South Carolina 130 - 140
Tennessee 141 - 153
Virginia 154 - 166
West Virginia 167 - 177

Region
U.S.
Region
U.S.
Region
U.S.
Appendix - 1
APPALACHIAN REGION FACT SHEET
(All numbers in thousands)
Population and Migration Data
Estimated
Population
1965
18,110.1
193,795.0
Population
1960
17,726.6
179,323.2
Percent of 1960 Population
Urban
47.3
69.9
Rural
Rural
Nonfarm
Farm
37.5
15.3
22.6
7.5
Estimated
Percent
Change
1960-65
2.2
8.1
Estimated
Net
Migration
1960-65
-589.1
2,510.5
Estimated
Net
Nigration
Rate
1960-65
-3.3
1.4
Rate of
Natural
Increase
1960-65
5.4
6.7
Population
1950
17,378.1
150,697.4
Percent Distribution of
Families by Income, 1960
Percent
Change
Population
1950-60
2.0
18.5
Total Number
of Families
4,466.5
45,128.3
Percent
Under
$2,000-
$3,000-
$6,000-
$10,000
$2,000
$2,999
$52-____
999
__.2.---_
$9 999
and over
19.3
10.8
36.6
24.5
8.8
13.1
8.3
32.8
30.8
15.1
Labor Force, Employment andUnemployment Statistics
Labor Force
Participation
Unemployment
Rate - 1960
Rate - 1960
Total
Nhle
Female
Total
Ehle
Female
50.4
72.6
29.7
55.3
77.4
34.5
6.8
7.1
6.0
5.1
5.0
5.4
Unemployment Rate - 1962-1965
1962
1963
1964
1965
8.6
8.1
7.0
5.2
5.5
5.7
5.2
4.5
Net
Net
Nigration
Migration
Rate
1950-60
1950-60
-2,201.9
-12.7
2,973.0
2.0
Major
Employment in Mhjor Industry Groups -1960
Civilian Work Force, Employment,AndUnemployment,
1965, And Percent Change - 1962-1965
Number
Percent
Distribution
Percent Change
1950-1960
U.S.
Region
U.S.
Estion
Percent Change
.2.V22P.E
Total
_arai-22
5 865 8
66 372.6
100.0
100.0
0.0
15.5
Number 1965
1962-65
Agriculture
417.0
4,349.9
7.1
6.6
-51.6
-38.2
Region
U.S.
Region
U.S.
Mining
198.8
654.0
3.4
1.0
-58.2
-29.7
Work Force
6,451.1
74,455.0
2.8
7.3
Construction
337.1
3,815.9
5.7
5.7
7.0
10.4
Employment
6,118.6
71,089.0
6.6
9.3
Manufacturing
1,911.6
17,513.1
32.6
26.4
17.2
19.9
Unemployment
332.5
3,366.0
-38.3
-26.5
Service
3,001.2
40,039.7
51.2
60.3
20.9
27.3

APPALACHIAN REGION FACT SHEET continued
(All numbers in thousands)
Appendix - 2
MANUFACTURING EMPLOYbENT, VALUE ADEED BY MANUFACTURE, AND VALUE ADDED PER
MANUFACTURING EMPLOYEE, 1954, 1958 AND 1963 AND PERCENT CHANGE 1954-1958 AND 1958-1963
Number
Percent Change
1954
1958
1963
19514-1958
1958-1963
Ma.nufacturing Employment
Region
1,622.8
1,668.9
1,758.0
2.8
5.3
U.S.
15,669.1
16,024.9
16,942.3
2.3
5.7
Value Added
Region
$ 10,968.9
$ 13,239.6
$ 17,463.1
20.7
31.9
U.S.
$117,212.8
$141,532.5
$192,330.1
20.7
35.9
Value Adeed per Employee 1/
Region
$6,760
$7,933
$9,933
17.4
25.2
U.S.
$7,481
$8,832
$ 11,352
10.1
28.5
Percent Distribution of Broad Occupation Groups for Employed Persons by Sex, 1960
Percent Distribution
Occupation
2E2R
E.-
--
Thtal
Male
Ffle
ails
U.S.
Region
U.S.
U.S.
43.2
29.2
..Region
50.2
57.5
White Collar
35.6
36.4
Blue Collar
574
50.3
61.5
549
48.1
40.7
Farm
7.0
6.4
9.3
8.7
1.7
1.8
Percent Distribution of Years of School Completed For the Population Aged25 and Over, 1960
Percent Distribution of Persons Completing
Number of persons
Under 5
5-8 years
1-3 years
4 years
Seri
25 and over
years schooling
schooling
IISIL2S1-1221
high school
Sante
Region
9,703.0
11.3
38.0
17.9
21.5
11.3
U.S.
99,438.1
8.4
31.4
19.2
24.6
16.5
1/ Actual numbers - not in thousands.
Appalachian Regional Commission
Planning and Research Division
1666 Connecticut Avenue, N.V.
Washington, D.C.
20235

Number
PercentDistribution
Percent Change1950-1960
Number
PercentDistribution
Percent Change1950-1960
Number
PercentDistribution
Percent Change1950-1960
Appendix - 3
UNITED STATES
POPULATION BY SEX, 1960
Total Male Female
179,323,175 88,331,494 90,991,681
100.00 49.26 50.74
19.00 18.00 19.98
POPULATION BY PLACE, 1960
Rural RuralTotal Non-Farm Farm Urban
179,325,671 40.596,990 13,444,898 125,283,783
100.00 22.64 7.50 69.86
19,00 30.20 41.67 29.87
DISTRIBUTION OF FAMILIES BY INCOMEt_ 1960
Under $2,000- $3,000- $6,000- $10,000
Totak $2.000 $2,999 _0,949 $9,999 & Over
45,128,393 5,886,481 3,763,758 14,803,991 13,879,783 6,794,380
100.00 13.04 8.34 32.80 30.76 15.06
17.79 -44.75 -46.09 3.45 314.15 495.21

Number
PercentDistribution
UNITED STATES
EDUCATION OF PERSONS 25 AND OVER 1960
Appendix - 4
Persons Com leting1-67751.is 1-4 Years 1 or More Ws
Total* ElerexltarSchooliii21 .1oolof Collene
99,438,084
100.00
Percent Change1950-1960 13.66
37,224,529 43,571,399 16,367,343
37.43 43.82
-4.25 34.21
16.46
41.79
*Total includes.persons who have never attended school, or who have less
than one year of schooling.
Number
PercentDistribution
Percent Change1950-1960
LABOR FORCE STATUS t9LSEX - 14 AND OVER 1960
TotalIn Out of
Labor LaborFc ce* . Force
MaleIn Out ofLabor LaborForce* . Force
FemaleIn Out of
Labor LaborForce* Force
69,877,481 56,399,067 47,467,721 13,847,573 22,409,760 42,551,494
55.34 44.66
17.16 8.33
*Includes persons in the Armed Forces.
Number'
PercentDistribution
77.42 22.58
10.16 20.31
EMPLOYMENT STATUS BY SEX - 14 AND OVER .1960
Male
34.0 65.50
35.39
Female1
Unem- Unem- Unem.
,Ltmacm.d.....j:mload_......2.12yed Employed ployed
4.94
64,639,252 3,504,827 43,466,951 2,295,718
Tercent Changei950-1960
94.86 5.14
15.87 22.64
94.98
8.57
21,172,301
5.02 94.60
9.90 34.42
1,209,109
5.4p
57.23

UNITED STATES Appendix - 5
NUMBER OF ESTABLISHMENTS IN SELECTED SERVICES
AND SALES 1963 AND PERCENT CHANGE 1958-1953
Establishments
NumberPercentChange
Receipt3 ($1000)Percent
Value Change1963* 1958-63 1963* 1958-63
All Establishments ,061 673 8.42 44,586,261, 37.16
Personal Services 447,080 8.20 INA INA
Auto Repair, Garages 139,611 11.07 INA INA
Other Services 4749.982 7.87 INA INA
*Details may not add to total because of disclosure rule.
NUMBER OF WHOLESALE ESTABLISHMENTS AND
SALES 1963? AND PERCENT CHANGE 1958-1963
All Establishments
Merchant Wholesalers
Other Operating Types
Establishments
Number1963*
308,177
PercentChange1958-63
7.36
208,997 9.71
99,180 2.72
Sales ($1000)
Value1963*
PercentChange1958-63
20,385,749 25.43
15793911769 28.95
200,993,980 22.81
*Details may not add to total because of disclosure rule.

Appendix - 6
UNITED STATES
NUMBER OF RETAIL ESTABLISHMENTS AND SALES 1963,
.AND PERCENT CHANGE 1958-1963
Establishments Sales ($1000)
Number1963*
PercentChange1958-63
PercentValue Change1963* 1958-63
ALL STORES 11_7979931 -4.84 244,201 777 21.87
Lumber, bldg. materials, etc. 92,703 -14.47 14,605,836 1..95
General merchandise 62,063 -28.38 30,002,764 36.55
Food stores 319,433 -10.47 57,079,186 15.95
Automotive dealers 98,514 4.93 45,376,290 42.22
Gasoline service stations 211,473 2.27 17,759,917 24.82
Apparel, accessory stores 116,223 -2.54 14,039,979 11.70
Furniture, home furnishings etc. 93,649 -9.74 10,925,843 8.07
Eating, drinking places 334,481 -3.40 18,412,414 20.42
Drug stores, proprietary stores 54,732 -2.93 8,486,682 24.74
Other retail stores 244,868 1.54 21,309,222 15.02
Non-store retailers 79,792 6.35 6,203,644 14.60
iDetails may not add to tOtal because of disclosure rule.
.

Number
PercentDistribution
Percent Change1950-1960
Number
PercentDistribution
Percent Change1950-1960
Number
Percent.Distribution
Percent Change1950-1960
APPALACHIAN REGION
POPULATION BY SEX, 1960
Total
17,726,567
100.00
2,01
Male
8,689,796
POPULAT/ON BY PLACE, 1960
Total
17,726 567
100.00
2.01
RuralNon-Farm
6,643,119
37.46
14.95
149.02
0.69
RuralFarm
24704,436
15.26
-31.97
DISTRIBUTION OF FAMILIES BY INCOME, 1960
Total
Appendix -
Female
9,036,771
50.98
3.30
Urban
8,379,011
47.27
11.41
Under $2,000- $3,000- $6,000-
$2 000 $2999 $5,999 $9,999
$10,000& Over
4,466,522 860,520 483,753 1,635,813 1,092,679 393,757
100.00 19.27 10.83 36.62 24.46 8.82
5.35 -46.04 28.34 376.94 546.78

POPULATION, RATE OF NATURAL INCREASE, AND NET MIGRATION RATE, 1950-1960, AND 1960-1965,
FOR THE UNITED STATES, APPALACHIAN REGION, AND APPALACHIAN PORTIONS OF EACH STATE1/
Appendix - 8
Population
1960
Estimated
Population
1965
Estimated
Percent
Change
Population
1960-1965
Rate
of Natural
Increase
1960-1965
Estimated
Net
Migration
1960-1965
Number
Estimated Net
Migration Rate
1960-1965
Percent
Change
Population
1950-1960
Net
Migration
Rate
1950-1960
Net
Migration
1950-1960
Number
Population
1950
United States
179,323,175
193,795,000
+ 8.1
6.7
+2,510,500
+ 1.4
+18.5
+1.8
2,973,000
150,697,361
AltpalackILL13.21
17,726,567
18,111,015
+2.2
5.4
-581,323
- 3.3
+2.0
- 12.7
-2,201,899
17,378,110
Appalachian portion of:
Alabama
1,982,286
2,136,967
+ 7.8
6.8
+20,590
+ 1.0
+6.5
- 11.1
-205,723
1,860,829
Georgia
675,024
733,900
+ 8.7
6.9
+12,619
+ 1.8
+8.9
- 10.6
-65,722
619,766
Kentucky
922,152
908,500
- 1.5
6.7
-75,468
- 8.2
- 14.0
- 31.8
-340,759
1,072,750
Maryland
195,808
214,200
+ 9.4
4.9
8,801
+ 4.5
+3.2
-7.8
-14,751
189,701
Mississippi
406,187
440,060
+ 8.3
7.0
5,369
+ 1.3
-4.7
- 21.2
-90,324
426,076
New York
1,000,064
1,036,759
+ 3.7
5.4
16,948
- 1.7
+9.0
-3.8
-35,050
917,490
North Carolina
939,740
993,443
+ 5.7
6.4
6,200
- 0.7
+6.6
-9.6
-84,691
881,560
Ohio
1,119,555
1,154,159
+ 3.1
5.3
24,341
- 2.2
+8.2
-4.5
-46,387
1,035,058
Pennsylvania
5,930,784
5,876,400
- 0.9
4.2
-300,960
- 5.1
+ 2.5
-9.3
-538,715
5,784,652
South Carolina
586,523
616,500
+ 5.1
7.2
-12,306
- 2.1
+ 12.1
-7.8
-40,593
523,265
Tennessee
1,607,689
1,687,063
+ 4.9
6.3
-22,507
1.4
+ 5.1
- 11.4
-174,658
1,529,762
Virginia
500,334
506,505
+ 1.2
5.4
-21,006
- 4.2
-5.9
- 22.2
-117,815
531,649
West Virginia
1,860,421
1,815,000
- 2.4
5.0
-138,228
- 7.4
-7.2
- 22.3
-446,711
2,005,552
1/
Population 1965 and net migration 1960-1965 are estimates.

Number
PercentDistribution
Percent Change19504960
Appendix - 9
APPALACHIAN REGION
EDU ,CATIONOF PERSONS 25 AND OVER 1960
Total*
9,703,010
100.00
3.48
Persons Com-letinears 4 Tears or More 'rig
Elementar School Hi-h School .of Cblle-e
4,520,578 3,826,388 1,100,434
146.59 39.44 11. 314
9.09 29.25 25.314
*Total includes.persons who have never. attended school, or who have less
than one year of schooling.
Number'
PercentDistribution
Percent Change1930-1960 1.97 .1.72 -6.64 13.17 29.04 -6.2
Inc1udes persons in the Armed Forces.
LABOR FORCIi STATUS BY SEX - 14 Ale OM 1960,
Tbtal MaleIn
Labor Labor Labor Labor.
Labbr
Porce Force Force* . Fbrce Force*
Penal@
LaborFore
6,290,976 6,194,239 14,369,533 1,651,0149 1,921,1443 4,543,1
50 . 140 49.60 72 58 27 .142 29.73 70.2
Number.
PercentDistribution
Percent Change1930.1960
EMPLOYMENT STATUS EY SEX - 14 ANDOVER' 1960
Maio -Female
nem- Unem- henlo ed 10 od
5,843,7514 425,135 14;0382314 310,720 1,805,440 314,143.5
93.22 6.78 92.86 7.14 94.04 5.96.,
-0.25 39.67 -8.97 . 30 . 28 26.93 73.68

Appendix - 10
CIVILIAN WORK FORCE, EMPLOYMENT, AND UNEMPLOYMENT, 1965,
PERCENT CHANGE 1962-1965 AND 1962-1965 RATE OF UNEMPLOYMENT
UNITED STATES, APPALACHIAN STATES, NON-APPALACHIAN PORTION OF STATES,
AND APPALACHIAN REGION
(In thousands)
CIVILIAN WORK FORCE
Change1965 1962-1965
Number
United States 74,455.0Appalachian States 29,326.0
Non-Appalachian Portion 22,874.9Appalachian Region 6,451.1
EMPLOYMENT
Number Percent
3,841.0 5.2
1,042.2 3.7869.2 3.9173.0 2.8
Change1965 1962-1965
Number
United States 71,088.0Appalachian States 28,071.8
Non-Appalachian Portion 21,953.2Appalachian Region 6,118.6
UNEMPLOYMENT
Number Percent
4,386.0 6.21,494.5 5.61,115.5 5.4
379.0 6.6
Change1965 1962-1965
Number Number Percent
-545.0-453.0 -26.5-247.0 -21.1-206.0 -38.3
United States 3,366.0Appalachian States 1,253.5
Non-Appalachtan Portion 921.0Appalachian Region 332.5
RATE OF UNEMPLOYMENT (%)
1962 1963 1964 1965
United States 5.5 5.7 5.2 4.5
Appalachian States 6.0 5.9 5.2 4.3
Non-Appalachian Portion 5.3 5.2 4.7 4.0
Appalachian Region 8.6 8.1 7.0 5.2 (

MANUFAULURING EMPLOYMENT AND VALUE ADDED BYM&NUFACTURE, 1954, 1958, AND 1963,
ZD
Appendix - 11
AND PERCENT CHANGE, 1954-1958 AND
1958-1963
Mhnufacturing Employment
Value Added by Manufacture
Number
Percent Change
Niimber ($1,000)
Percent Chan&e
1954
1958
1963
1954-
1958
1958-
1963
1954
1958
1963
1954-
1958 -
1958
1963
United States
15,669,101
16,024,862
16,942,292
2.3
5.7
117,212,837
141,532,532
192,330,126
20.7
35.9 -
Aupalaablan_Bagi2n
1 622 847
1 668 899
1 758 007
2.8
5.3
10 969 841
13 239 573
17 463 056
20.7
31.9
Appalachian Portion of:
Alabama
156,876
163,247
170,227
4.1
4.3
1,008,460
1,332,961
1,881,512
32.2
41.1
Georgia
71,406
73,821
84,408
3.4
14.3
300,230
418,974
647,119
39.6
'
54.5
Kentucky
16,566
18,134
24,349
9.5
34.3
97,684
144,469
201,762
47.9
39.7.
Maryland
23,780
23,350
22,966
- 1.8
- 1.6
148,077
157,649
228,152
6.5
44.7
Mississippi
19,538
25,772
36,007
31.9
39.7
71,365
127,675
242,960
78.9
90.3
New York
132,373
128,811
123,496
- 2.7
- 4.1
924,718
1,007,881
1,152,166
9.0
14.3
North Carolina
104,683
115,864
135,892
10.7
17.3
650,451
872,121
1,384,943
-34.1
58.8
Ohio
82,715
81,397
82,274
- 1.6
1.1
583,780
767,180
952,811
31.4
24.2
Pennsylvania
640,309
648,929
648,145
1.3
- 0.1
4,721,330
5,224,720
6,238,926
10.7
19.4
South Carolina
84,657
89,379
104,534
5.6
17.0
360,736
465,376
702,223
29.0
50.9
Tennessee
146,471
155,388
176,569
6.1
13.6
945,521
1,226,962
1,676,338
29.8
36.6
Virginia
24,905
28,606
32,114
14.9
12.3
169,215
224,763
266,996
32.8
18.8
West Virginia
118,568
116,201
117,026
- 2.0
0.7
988,274
1,268,842
1,887,148
28.4
48.7
Source:
Census of Mlanufactures, 1954,
1958, and 1963.
Where actual census data
were not available for a county because of the
"disclosure.rule",
estimates were made based onprojections of data for availableyears and/or on the state averages of value added
per employee for the predominant
industry groups.

Appendix - 12
VALUE ADDED PER MANUFACTURING EMPLOYEE, 1954, 1958, AND 1963,
AND PERCENT CHANGE, 1954-1958 AND 1958-1963
Value Added Per Manufacturing Employee
Number ql Percent Change
1954 1958 19631954-1958
1958-1963'
United States 7 481 8 832 11 352 18.1 28.5
.k.P.A.L86-111-4.1.1tiii9M6 760 7,933, 9 933 17.4 25.2
Appalachian portion of:
Alabama 6,428 8,165 11,053 27.0 35.4
Georgia 4,205 5,676 7,667 35.0 35.1
Kentucky 5,897 6,312 8,268 7.0 31.3
Maryland 6,227 6,752 9,934 8.4 47.1
Mississippi 3,653 4,954 6,748 35.6 36.2
New York 6,986 7,824 9,330 12.0 19.2
North Carolina 6,214 7,527 10,191 21.1 35:4
Ohio 7,058 9,425 11,581 33.5 22.9
Pennsylvania 7,374 8,051 9,626 9.2 19.6
South Carolina 4,261 5,207 6,718 22.2 29,0
Tennessee 6,455 7,896 9,494 22.3 20.2
Virginia 6,794 7,857 8,314 15.6 5.8
West Virginia 7,659 9,705 14,657 26.7 51.0
Source: Census of Manufactures, 1954, 1958, and 1963. Where actual census
data were not available for a county because of the "disclosure rule",
estimates were nade based on projections of data for available years and/or
on the state averages of value added per employee for the predominant
industry groups.
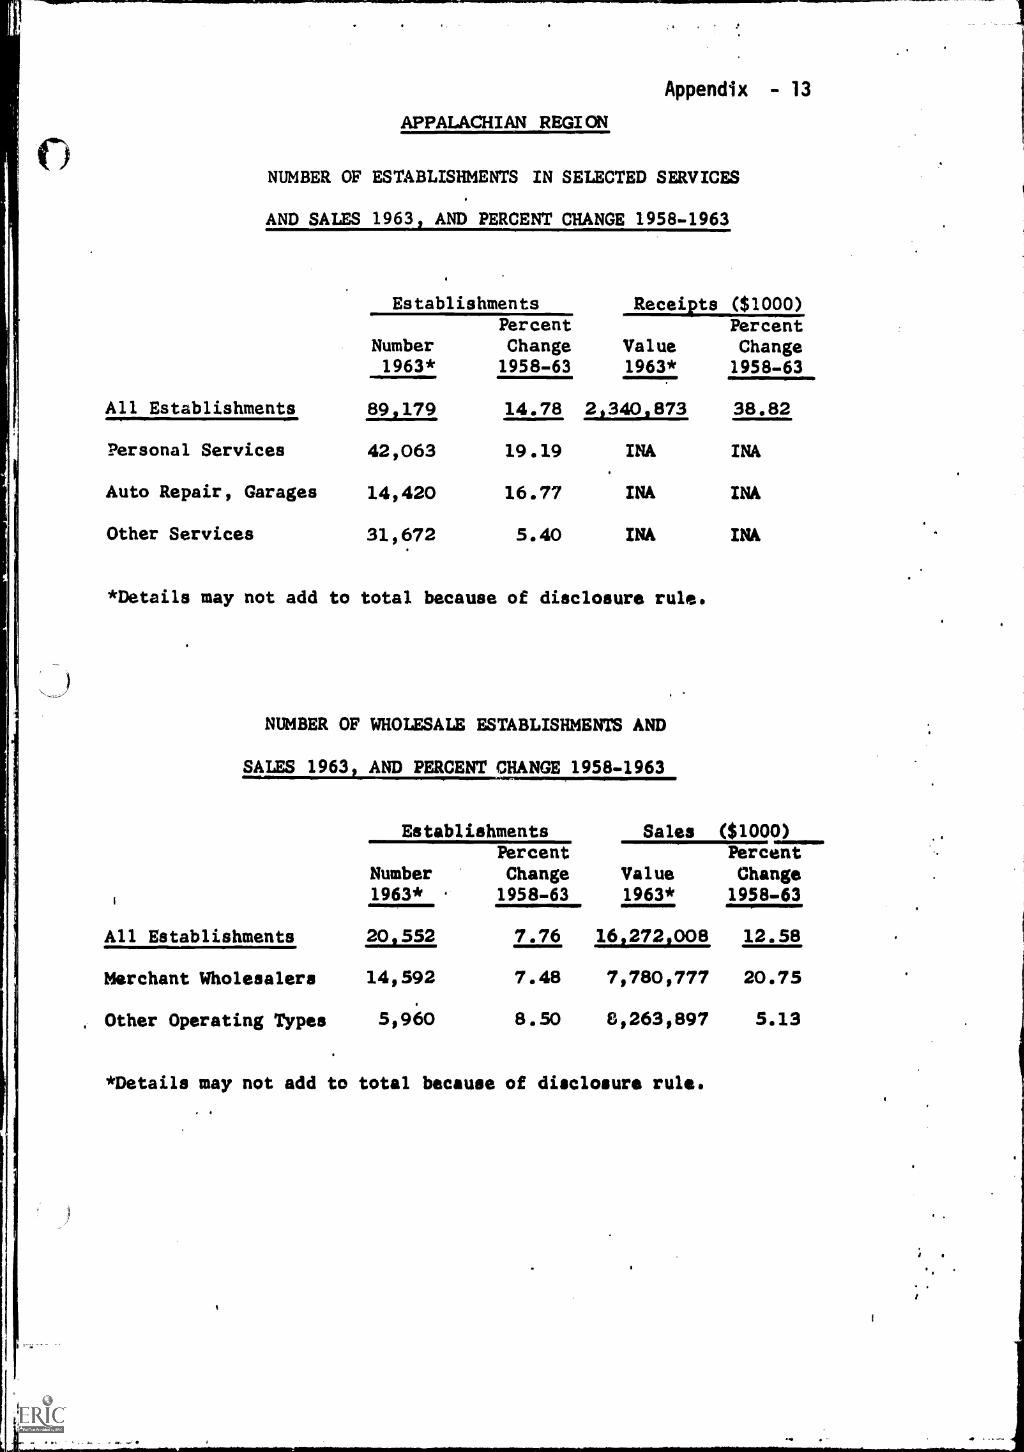
Appendix - 13
APPALACHIAN REGION
NUMBER OF ESTABLISHMENTS IN SELECTED SERVICES
AND SALES 1963, AND PERCENT CHANGE 1958-1963
Establishments Receipts ($1000)
Number1963*
PercentChange1958-63
Value1963*
PercentChange1958-63
All Establishments 89 179 14.78 21340,873 38.82
Personal Services 42,063 19.19 INA INA
Auto Repair, Garages 14,420 16.77 INA INA
Other Services 31,672 5.40 INA INA
*Details may not add to total because of disclosure rule.
NUMBER OF WHOLESALE ESTABLISHMENTS AND
SALES 1963 AND PERCENT CHANGE 1958-1963
1
Establishments Sales ($1000)
Number1963*
PercentChange1958-63
Value1963*
PercentChange
1958-63
All Establishments 20 552 7.76 164_ 1272 008 12.58
Merchant Wholesalers 14,592 7.48 7,780,777 20.75
Other Operating Types 5,960 8.50 8,263,897 5.13
*Details may not add to total because of disclosure rule.

Appendix - 14
APPALACHIAN REGION
NDHBER OF RETAIL ESTABLISHMENTS AND SALES 1963,
AND PERCENT CHANGE 1958-1963
Establishments Sales ($1000)
Number1963*
PercentChange1958-63
Percent
Value Change1963* 1958-63
ALL STORES 172 L45P -3.49 18 _723580 17.52
Lumber, bldg. materials, etc. 8,210 -11.82 1,139,559 7.02
General merchandise 7,582 -40.88 2,163,207 11.23
Food stores 42,594 -1.53 4,858,080 15.53
Automotive dealers 11,492 9.19 3,679,097 37.26
Gasoline service stations 22,284 4.15 1,486,481 22.65
Apparel, accessory storeo 10,357 0.62 1,009,275 10.60
Furniture, home furnishings, etc. 8,659 -11.80 827,936 2.13
Eating, drinking places 29,834 -3.28 1,078,159 13.35
Drug stores, proprietary stores 4,781 -0.25 566,592 17.2
Other retail stores 20,035 2.65 1,378,270 8.31
lion-store retailers 6,520 7.34 343,597 45..84
*Details may not add to total because of disclosure rule.

Appendix - 15
ALABAMA - STATE TOTAL
POPULATION BY SEX, 1960
Total Male Female
Number 3,266,740 1,591,645 1,675,095
PercentDistribution 100.00 48.72 51.28
Percent Change1950-1960 6.70 5.92 7.44
POPULATION BY PLACE, 1960
Rural RuralTotal Non-Farm Farm Urban
Number 3,266,740 1,068,716 402 0855 1,795,:.69
PercentDistribution 100.00 32.72 12.33 54.95
Percent Change1950-1960 6.70 40.56 -58.06 33.87
DISTRIBUTION OF FAMILIES BY INCOME 1960
Under $2,000. $3 ,000- $6,000- $10 ,000Total $2,00(7 $2,999 1.5.4222... & Over
Number 790,710 209,931 98,940
,$9,999
257,579 161,281 62,979
PercentDistribution 100.00 26.55 12.51 32.58 20.40 7.96
Percent Change1950-1960 8.35 -44.80 -23.05 63.98 472.63 573.57
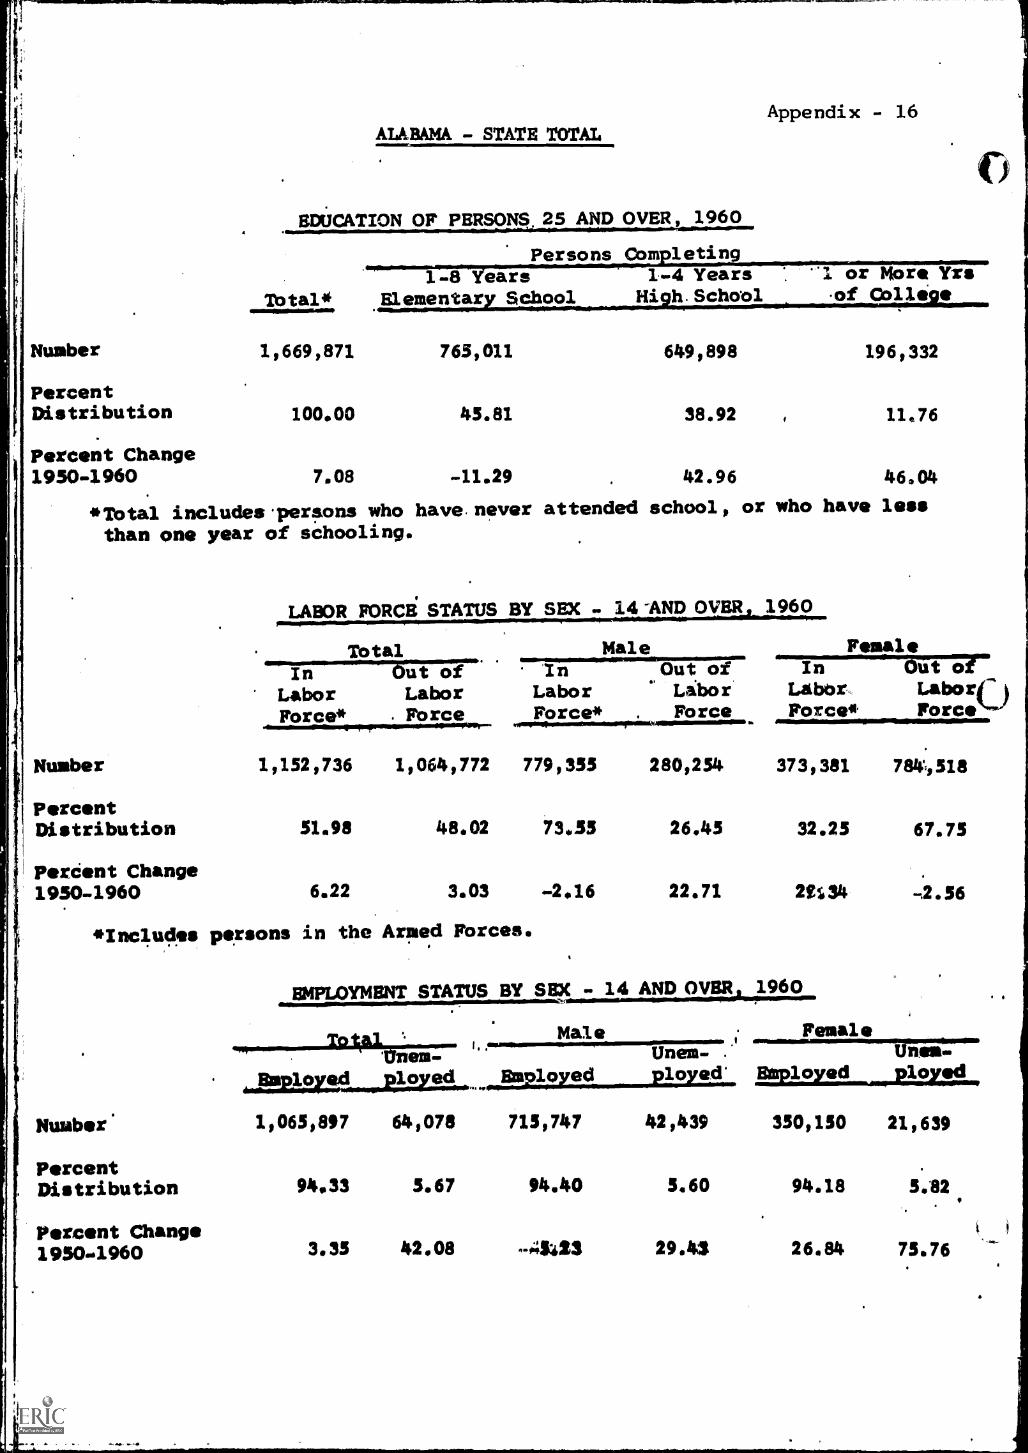
ALA.BAMA - STATE TOTAL
EDUCATION O FP ERSONS. 25 AND OVER, 1960
lbtal*
Persons Com leting1-8 Years 1-4 Years
Elementar School Hi h.Schobl
Appendix - 16
'1 or More Yrsof
Number 1,669,871 765,011 649,898 196,332
PercentDistribution 100.00 45.81 38.92 11.76
Percent Change1950-1960 7.08 -11.29 42.96 46.04
*lbtal includes .persons who have never attended school, or who have lessthan one year of schooling.
LABOR FORCEj STATUS BY SEX - 14-AND OVER 1960
TotalIn Out of
Labor LaborForce* . Force
_
MaleIn Out of
Labor LaborForce* Force
FemaleIn Out of
Labor. Labor()Force*Force
Number 1,152,736 1,064,772 779,355 280,254 373,381 784518
PercentDistribution 51.98 48.02 73.55 26.45 32.25 67.75
PerCnt Change1950-1960 6.22 3.03 -2.16 22.71 8%134 -2.56
Includes parsons in the Armed Forces.
EMPLOYMENT STATUS BY SEX - 14 AND OVER .1960
TsrVa..an'ea. MaleI. ; Female
!mar
EmployedUnem-ployed' d
egraremp1oydt
Number. 1,065,897 64,078 715,747 42,439 350,150 21,639
PercentDistribution 94.33 5.67 94.40 5.60 94.18 5.82
Percent Change1950..1960 3.33 42.08 -41423 29.43 26.84 75.76

Appendix - 17
ALABAMA--STATE TOTAL
NUMBER OF ESTABLISHMENTS IN SELECTED SERVICES
AND SALES 19631 AND PERCENT CHANGE 1958-1963
All Establishments
Personal Services
Auto Repair, Garages
Other Services
Establishments
Number1963*
13,752
6,480
2,287
40.985
ReceiptsPercentChange Value1958-63 1963*
19.23
21.10
24.84
14.33 INA
362 571
INA
INA
*Details may not add to total because of disclosure rule.
NUMBER OF WHOLEaAIE ESTABLISHMENTS AND
SALES 1963, AND PERCENT CHANGE 1958-1963
All Establishments
Merchant Wholesalers
Other Operating Types
Establishments
Number1963*
14 935
2,668
1,267
PercentChange1958-63
15.97
19.05
9.98
($1000)
PercentChange1958-63
41.86
INA
INA
INA
Sales ($1000)
Value1963*
3,3940992
1,6680667
107260325
*Details may not add to total because of disclosure rule.
PercentChange1958-63
18.99
28.03
11.38

It
Appendix - 18
ALABAMA - STATE TOTAL
NUMBER OF RETAIL ESTABLISHMENTS AND SALES 1963,
AND PERCENT CHANGE 1958-1963
Establishments Sales ($1000)Percent
Number Change1963* 1958-63
Value1963*
PercentChange1958-63
ALL STORES 29,065 8.08 3,253,433 26.73
Lumber, bldg. materials, etc. 1,229 -0.57 212,594 17..46
General merchandise 1,776 -36.64 383,176 16.25
Food stores 8,090 13.56 820,336 29.17
Autnmetive dealers 1,951 26.61 676,752 50.01
Gasoline service stations 4,071 17.59 264,664 34.40
Apparel, accessory stores 1,779 9.34 188,075 10.76
Furniture, home furnishings etc. 1,658 10.46 163,183 16.99
Eating, drinking pl.L. ss 3,332 3.45 144,676 23.72
Drug stores, proprietary stores 955 4.26 .110,488 23.67
Other retail stores 3,079 18.20 238,663 5.50
Non-store retailers 1,145 33.61 50,826 60.33
*Details may not add to tetal because of disclosure rule.
Number
PercentDistribution
Percent Change1950-1960
Number
PercentDistribution
Percent Change1950-1960
Number
PercentDistribution
Percent Change1950-1960
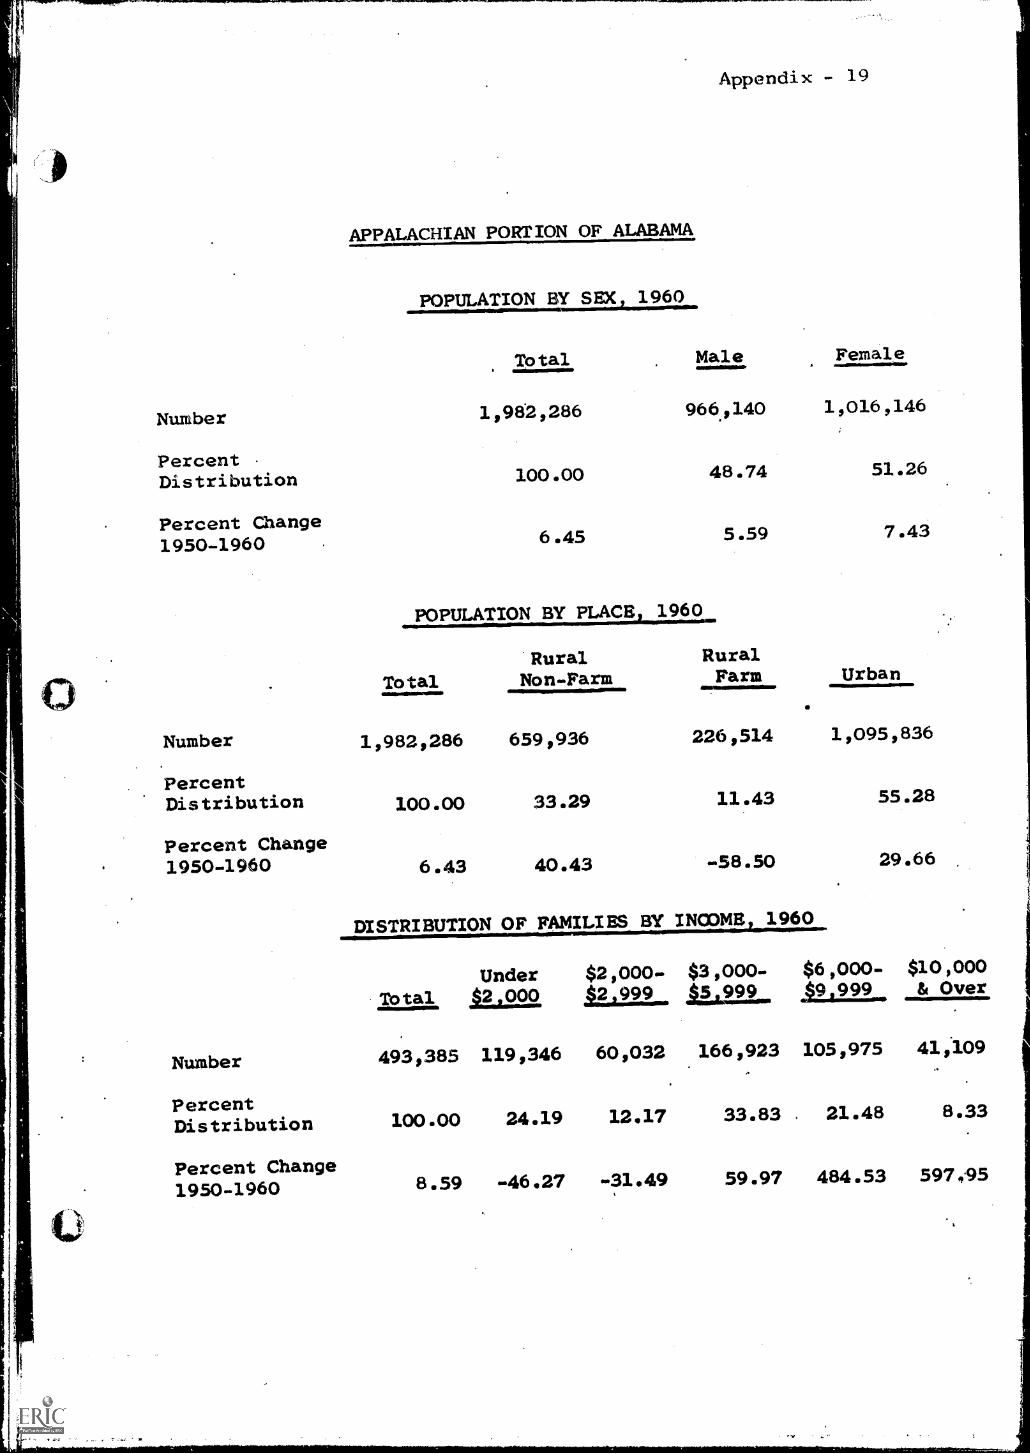
Appendix - 19
APPALACHIAN PORTION OF ALABAMA
POPULATION BY SEX1 1960
Total Male Female
1,982,286 966,2140 1,016,146
100.00 48.74 51.26
6.45 5.59 7.43
POPULATION BY PLACE, 1960
TotalRuralNon-Farm
RuralFarm Urban
1,9822286 659,936 226,514 1,095,836
100.00 33.29 11.43 55.28
6.43 40.43 -58.50 29.66
DISTRIBUTION OF FAMILIES BY INCOME 1960
Under $2,000- $3,000- $6,000- $10,000
Total $2,000 ,$2,999 154999 A2J999, &Over
493,385 119,346 60,032 166,923
100.00 24.19 12.17 33.83
8.59 -46.27 -31.49 59.97
105,975
. 21.48
484.53
:
41.9109
8.33
597 .95

Appendix - 20
1/
:POPULATION, RATE OF NATURAL INCREASE,AND NET MIGRATION RATE, 1950-1960, AND
1960-1965-
:
Population
196a
Estimated
Population
1965
Estimated
Percent Change
Population
1960-1965
Rate
of Natural
Increase
1960-1965
Estimated
Natural Increase
1960-1965
Number
Estimated Net
Migration Rate
1960-1965
Percent
Change
Population
1950-1960
Net
Migration
Rate
1950-1960
et
Migration
1950-1960
Number
Population
1950
ALABAMA - STATE TOTAL,
-3 266140
3 486 421
+6.7
7.2
235 205
-0.5
+6.7
- 12.0
368/442
3,061 743
APPALACHIAN PORTION
!:1,982086
2 136 967
+7.8
6.8
o
134 091
+1.0
+6.5
- 11.1
- 205 723
1 860 829
-'-
Alabama - 56
453,633
563 468
+ 24.2
9.2
41,699
+ 15.0
+ 15.7
-4.2
-16,453
392,254
Colbert
46,506
50,546
+8.7
7.5
3,488
+1.2
+ 17.6
'
-1.4
588
Franklin
,21,988
23,900
+8.7
5.7
1,253
+3.0
- 14.5
-7,390
Jackson
-..
36;681
38,828
+5.8
6.1
.2,238
-0.3
-5.9,
- 21.2
9,031
Lauderdale:
61;622
67,922
+ 10.2
8.2
5,053
+2.0
+ 13.7
-0.1
3,292
Lawrence
24,501
27,484
+ 12.2
8.8
2,156
+3.4
_9,7.
- 28.6
7,763
Limestone
36,513
41,610
+ 14.0
8.2
2,994
+5.8
+2.1,
- 16.0
5,727
Medison
117,348
181,332
+ 56.2
13.6
15,959
+ 42.6
+ 61.0
+ 33.8
24,632
Marshall
48,018
55,519
+ 15.6
7.5
3,601
+ 8.1
+6.5
- 12.6
5,691
Mbrgan
60,454
14,327
+ 22.9
8.2
4,957
+ 14.7
+ 14.2
-3.0
1,603
Alabama - 57
261:487
282,102
+1.2
6.2
16,189
-6.0
+5.4
- 12.8
31,829
248 017
Calhoun
95,878
98,525
+2.8
7.5
7,191
- 47
+ 20.5
-2.4
1,885
Cherokee
16,303
16,306
0.0
4.8
783
-4.8
-7.5:
- 22.2
3,915
Cleburne
10,911
10,701
-1.9
5.9
644
-7.8
-8.3:
- 20.7
2,465
DeKalb
41,417
42,559
+2.8
5.4
-
2,237
-2.6
-8.1,
- 21.5
9,698
Etowah
96,080
94,011
-3.1
5.5
5,334
-8.6
+3.3
- 14.8
13,866
Alabama - 58
145,962
149,457
+2.4
5.5
8,042
-3.1
-5.5
31,962
154 459
Chambers
37,828
31,521
-0.8
5.3
2,006
-6.1
-4.3
- 20.8
8,209
Clay
12,400
12,472
+0.6
4.5
558
-3.9
- 11.0
- 22.6
3,144
Coosa
10,726
11,058
+3.1
4.4
472
-1.3
-8.8
- 22.2
2,607
Elmore
30,524
33,779
+ 10.7
6.8
2,076
+3.9
-3.6
- 18.9
5,989
Randolph
19,477
19,024
-2.3
4.8
935
-7.1
- 13.5
- 27.0
6,072
Tallapoosa
35,007
35,603
+1,5
5.7
1,995
-4.2
-0.2
- 16.9
5,941
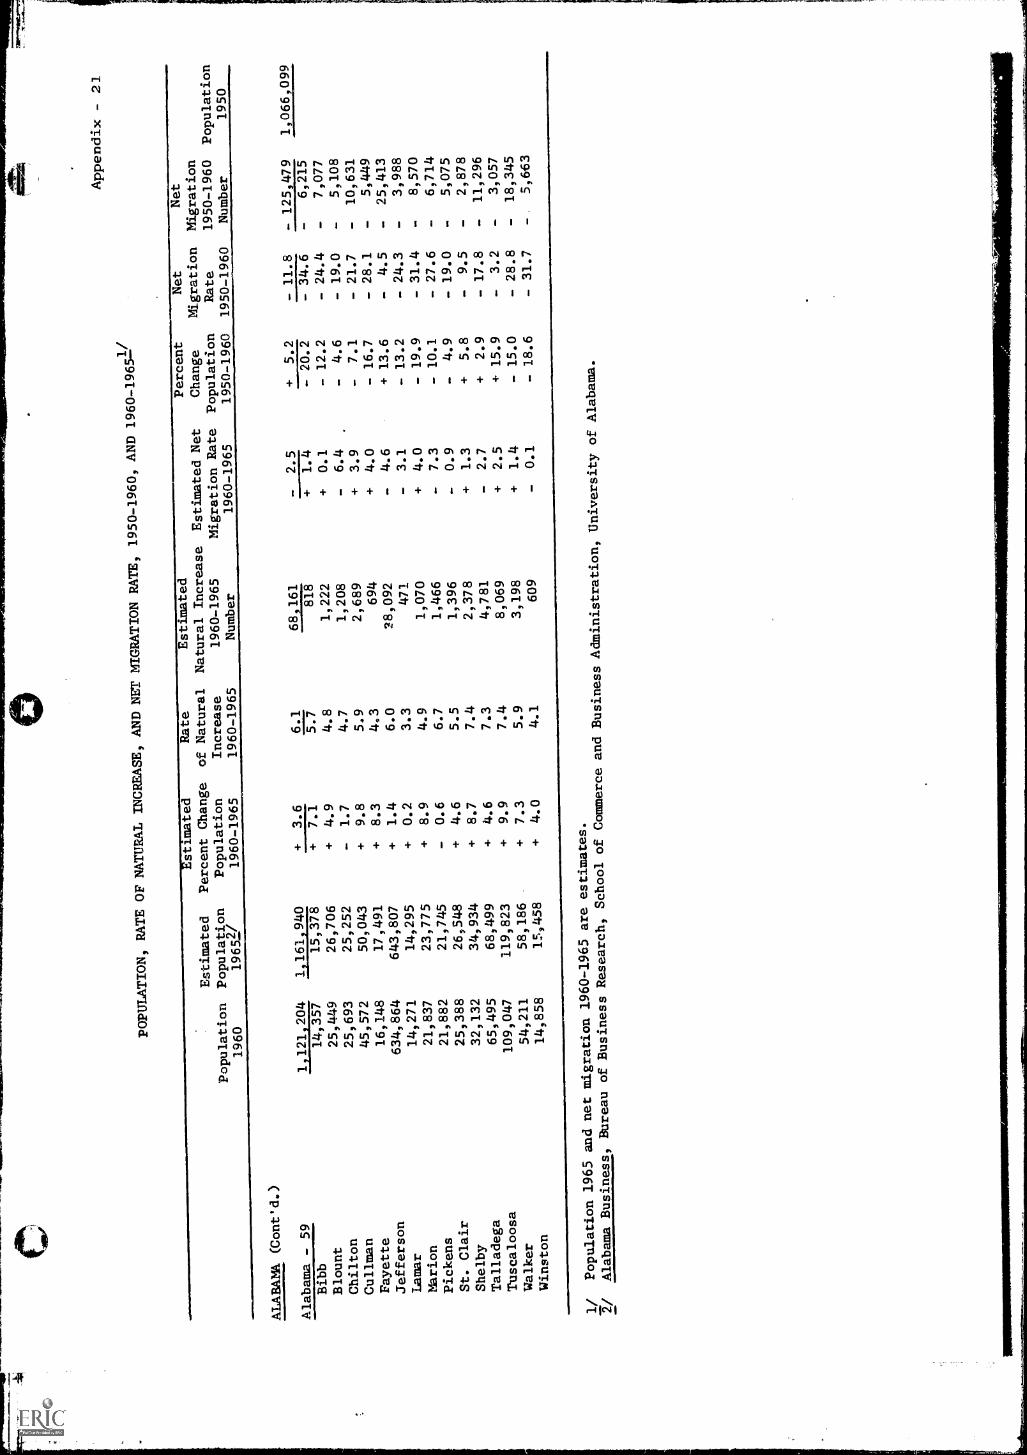
POPULATION, RATE OF NATURAL
INCREASE, AND NET MIGRATION RATE,
1950-1960, AND 1960-1965-1/
Appendix - 21
Population
1960
Estimated
Population
19652/
Estimated
Percent Change
Population
1960-1965
Rate
of Natural
Increase
1960-1965
Estimated
Natural Increase
Estimated Net
1960-1965
Migration Rate
Number
1960-1965
Percent
Change
Population
1950-1960
Net
Migration
Rate
1950-1960
Net
Migration
1950-1960
Number
Population
1950
ALABAMA (Cont 'd.)
Alabama - 59
1 121 204
1 161 940
-1---2---
+3.6
6.1
68,161
-2.5
+5.2
- 11.8
- 125,479
1,066,099
Bibb
14,357
15,378
+7.1
5.7
818
+1.4
- 20.2
- 34.6
-6,215
Blount
25,449
26,706
+4.9
4.8
1,222
+0.1
- 12.2
- 24.4
-7,077
Chilton
25,693
25,252
-1.7
4.7
1,208
-6.4
-4.6
- 19.0
-5,108
Cullman
45,572
50,043
+9.8
5.9
2,689
+ 39
-7.1
- 21.7
-10,631
Fayette
16,148
17,491
+8.3
4.3
694
+4.0
- 16.7
- 28.1
-5,449
Jefferson
634,864
643,807
+1.4
6.0
38,092
-4.6
+ 13.6
-4.5
-25,413
Lamar
14,271
14,295
+0.2
3.3
471
-3.1
- 13.2
- 24.3
-3,988
Marion
21,837
23,775
+8.9
4.9
1,070
+4.0
- 19.9
- 31.4
-8,570
Pickens
21,882
21,745
-0.6
6.7
1,466
-7.3
- 10.1
- 27.6
-6,714
St. Clair
25,388
26,548
44.6
5.5
1,396
-0.9
-4.9
- 19.0
-5,075
Shelby
32,132
34,934
+8.7
7.4
2,378
+1.3
+5.8
-9.5
-2,878
Talladega
65,495
68,499
4.
4.6
7.3
4,781
-2.7
+2.9
- 17.8
-11,296
Tuscaloosa
109,047
119,823
+9.9
7.4
8,069
+2.5
+ 15.9
-3.2
-3,057
Walker
54,211
58,186
+7.3
5.9
3,198
+1.4
- 15.0
- 28.8
-18,345
Winston
14,858
15,458
+4.0
4.1
609
-0.1
- 18.6
- 31.7
-5,663
1/
Population 1965 and net migration1960-1965 are estimates.
7/ Alabama Business, Bureau of BusinessResearch, School of Commerce and
Business Administration, University
of Alabama.

Number
PercentDistribution
Peráent Change1950-1960
!Total includes-pers.ons who have. haver attended school, or who have less'than one year of schooling.
Appendix - 22
APPALACHIAN PORTION OF ALABAMA
EDUCATION OF PERSONS. 5 MID OVER 1960
Ibtal4
Persons Cbm letinYears 1-4 Years ', "1 or Mors yrs
Eleaentar School Hih.Schoo1 .of Coll. e
1,038,669 476,578 412,587 119,525
100.00 45.88 39972 11.50,
9.37 -9.21 43.21 49.42
LABOR FORCi STATUS BY SEX 7 14 AND OVERy 1960
MtalIn Out of
Labor LaborForce* . Force
Male7"172' ot"""---Tral"
. .
Labor LaborForce* Force
Number' 698,067 667.,04)0 479,903
PercentDistribution 51.25 48.75 73..56
Percent Change1950-1960 7.56 2.25 1.87
*Includes persons in the Armed Forces.,
,'Number
Percent.!' Distribution
1
Percent Change1950-1960
FemaleIn Chit of.
Labor LaborForce* Force 0
172,477 218,164 494,553
26.44 30.74 69.26
22.11 36.40 %.3.03
EMPLOYMENT STATUS BY SEX 14 .AND OVER 1960
Maio -Female
eLL.imicsei.a.mtd EmployedUnem-played' EnVoyed
Unea:.plord
649,714 40;289 445,367 27,717 204,347 12,572
94.16 5.84 94.14 5.86 94.20 5.80
7.24 1.45 -2.35 36.30 36.46 70.03
))

Appendix - 23
PERCENT CHANGE 1962-1965 IN WORK FORCE,EMPLOkMENT AND UNEMPLOYMENT,
AND 1962-1965 RATE OF UNEMPLOYMENTAPPALACHIAN & NON-APPALACHIAN
PCRTION OF STATE(All Numbers in Thousands)
Total Work Force
1965 Chan9e 1962-65Number Number Percent
Alabama
_
1,238.3 64.9 5.5
Non-Appalachian Portion 469.4 5.6 1.2
Appalachian Portion 768.9 59.3 8.4
pToLB_LyjTmt
1965 Change 1962-65
Number Number Percent
Alabama 1,182.7 88.8 8.1
Non-Appalachian Portion 447.7 15.7 3.6
Appalachian Portion 735.0 73.1 11.0
1965
Unemployment
Change 1962-65
Number Number Percent
Alabama 55.6 -23.9 -30.1
Non-Appalachian Portion 21.7 -10.1 -31.8
Appalachian Portion 33.9 -13.8 -28.9
Rate of Unemployment
1962 1963 1964 1965
Alabama 6.8 6.0 5.0 4.5
Non-Appalachian Portion 6.9 6.2 3.6 4.6
Appalachian Portion 6.7 5.9 5.9 4.4

Appendix - 24
MANUFACTURING EMPLOYMENT AND VALUE ADDED BY MANUFACTURE,
1954, 1958, AND 1963,
AND PERCENT CHANGE, 1954-1958 AND 1958-1963
Manufacturing Employment
Value Added by Manufacture
Number
Percent Change
Number ($1,000)
Percent Change
1954
1958
1963
1954-
1958
1958-
1963
1954
1958
1963
1954-
1958
1958-
1963
ALABAMA - STATE TOTAL
217 084
229
2830
243
2800
5.9
6.1
319 192
17-
--2
1 7702-
-510
-2.-
---
518 314
22-
---2
34.2
42.2
------
----
---
--
APPALACHIAN PORTION
156,876
163,247
170,227
4.1
4.3
1,008,460
1,332,961
1,881,512
32.2
41.1
Alabama - 56
20 720
--z-
26,171
36L747
26.3
,40.4
116,093
226,381
393,589
95.0
73.9
Colbert
- 7,033_...--
7,721
31.3
9.7
42,014
92,089
113,726
119.1
5,355
23.5
Franklin
467
549
997
17.5
81.6
1,425
2,402
5,408
68.6
125.1
Jackson
1,388
1,901
2,354
36.9
23.8
4,289
7,021
14,859
63.7
111.6
Lauderdale
1,818
1,803
1,824
-0.8
1.1
7,134
12,061
16,786
69.1
39.1
Lawrence
164
299
802
82.3
168.2
272
736
2,329
170.6
216.4
Limestone
666
621
701
-6.7
12.9
2,377
1,902
3,072
- 19.9
61.5
Mhdison
4,572
6,160
12,598
34.7
104.5
21,176
41,719
114,883
97.0
175.4
Mhrshal1
1,689
2,505
3,550
48.3
41.7
6,300
13,140
22,890
108.6
74.2
Mbrgan
4,601
5,300
6,200
15.2
17.0
31,106
55,311
99,636
77.8
80.1
Alabama - 57
27 2
140
24
2967
?1,775
-8.0
- 12.7
172,269
218 864
2253 348
--L
--27.0
15.8
Calhoun
__-__
12,322
--.---
10,612
9,064
TiTiis
63,365
-----
72,001
13.6-
14.2
82,234
Cherokee
93
399
462
329.0
15.8
258*
1,401
2,375
443.0
69.5
Cleburne
219
462
328
110.9
- 29.0
607
2,993
5,133
393.1
71.5
DeKalb
1,746
1,780
2,272
1.9
27.6
6,327
7,766
14,576
22.7
87.7
Etowah
12,760
11,714
9,649
-8.1
- 17.6
101,712
134,703
149,030
32.4
10.6
Alabama - 58
18,943
18,553
19,005
-2.1
2.4
69,740
83,936
103,897
20.3
23.7
Chambers
8,209
7,880
7,578
-4.0
-3.8
31,785*
37,762*
45,006*
18.8
19.2
Clay
641
594
893
-7.3
50.3
2,237
1,915
4,396
- 14.3
129.5
Coosa
661
483
547
- 26.9
13.2
2,567
1,604
2,138
- 37.5
33.3
Elmore
843
635
662
- 24.6
4.2
3,436
4,037
3,889
17.5
-3.7
Randolph
1,674
1,857
1,958
10.9
5.4
4,345
4,575
7,152
5.3
56.3
TallapcGsa
6,915
7,104
7,367
2.7
3.7
25,370
34,043
41,316
34.2
21.4
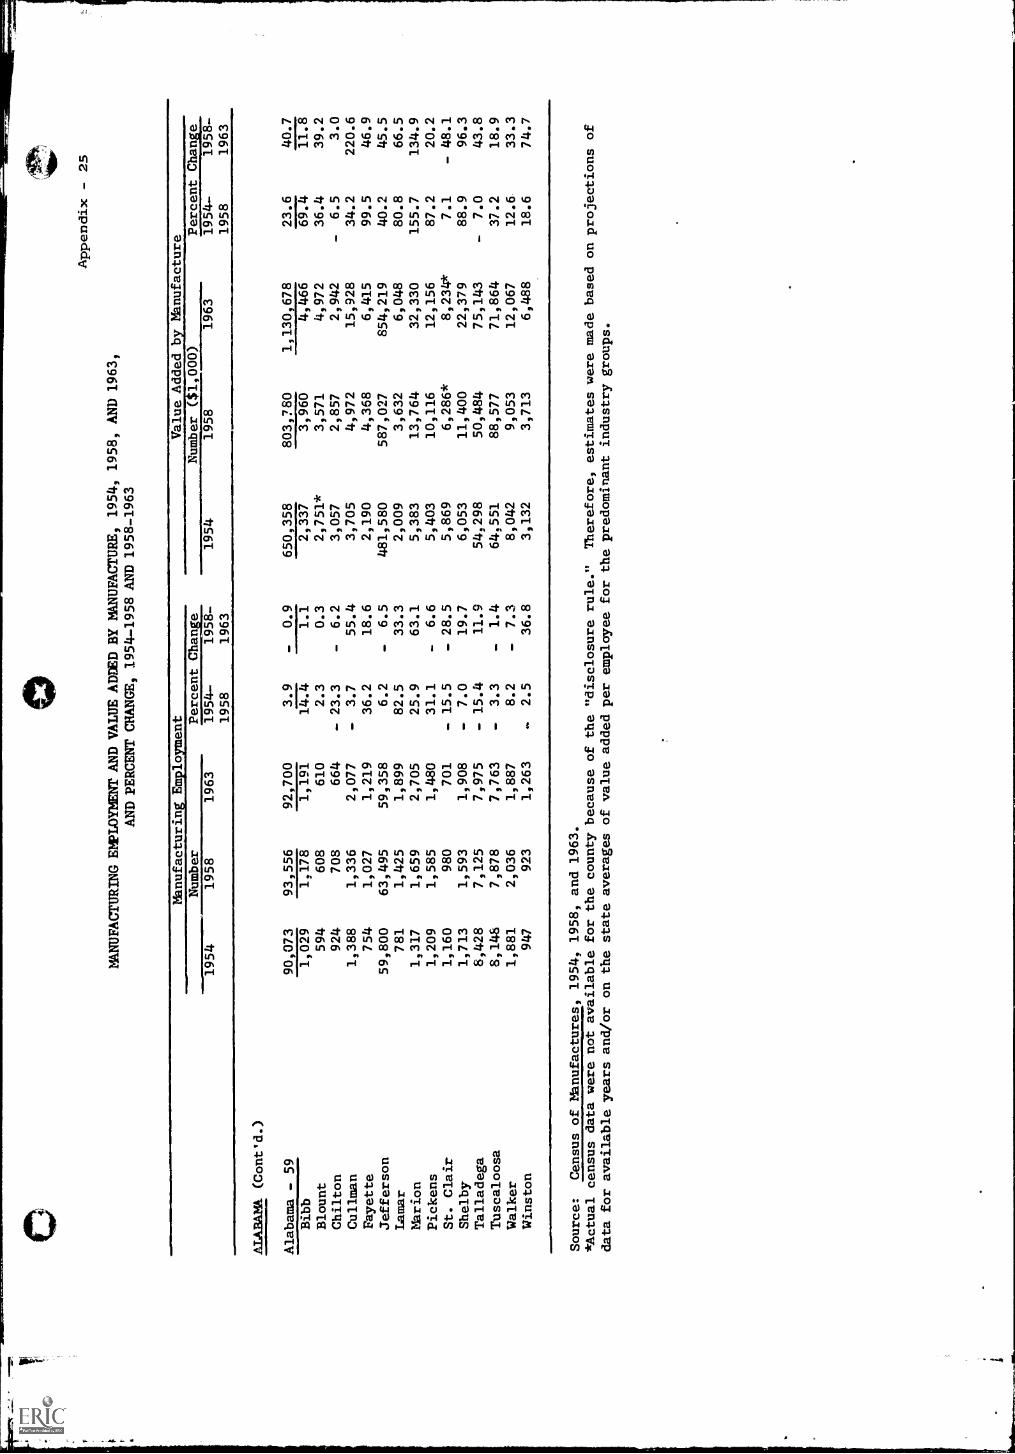
MANUFACTURING EMPLOYMENT AND VALUE AXED BY MANUFACTURE, 1954, 1958, AND 1963,
AND PERCENT CHANGE, 1954-1958 AND 1958-1963
Appendix - 25
Mhnufacturing Employment
Value Added by Manufacture
Number
Percent Chan
Number ($1,000)
Percent Change
1954
1958
1963
1954-
1958
1958 -
1963
1954
1958
1963
1954-
1958
1958-
1963
AIABAMA (Cont'd.)
Alabama - 59
90,073
93,556
92,700
3.9
-0.9
650,358
803,780
1,130,678
23.6
40.7
Bibb
1,029
1,178
1,191
14.4
1.1
2,337
3,960
4,466
69.4
11.8
Blount
594
608
610
2.3
0.3
2,751*
3,571
4,972
36.4
39.2
Chilton
924
708
664
- 23.3
-6.2
3,057
2,857
2,942
-6.5
3.0
Cullman
1,388
1,336
2,077
-3.7
55.4
3,705
4,972
15,928
34.2
220.6
Fayette
754
1,027
1,219
36.2
18.6
2,190
4,368
6,415
99.5
46.9
Jefferson
59,800
63,495
59,358
6.2
-6.5
481,580
587,027
854,219
40.2
45.5
Lamar
781
1,425
1,899
82.5
33.3
2,009
3,632
6,048
80.8
66.5
Nhrion
1,317
1,659
2,705
25.9
63.1
5,383
13,764
32,330
155.7
134.9
Pickens
1,209
1,585
1,480
31.1
-6.6
5,403
10,116
12,156
87.2
20.2
St. Clair
1,160
980
701
- 15.5
- 28.5
5,869
6,286*
8,234*
7.1
- 48.1
Shelby
1,713
1,593
1,908
-7.0
19.7
6,053
11,400
22,379
88.9
96.3
Talladega
8,428
7,125
7,975
- 15.4
11.9
54,298
50,484
75,143
-7.0
43.8
Tuscaloosa
8,148
7,878
7,763
-3.3
-1.4
64,551
88,577
71,864
37.2
18.9
Walker
1,881
2,036
1,887
8.2
-7.3
8,042
9,053
12,067
12.6
33.3
Winston
947
923
1,263
-2.5
36.8
3,132
3,713
6,488
18.6
74.7
Source:
Census of Manufactures, 1954, 1958, and 1963.
tActual census data were not available for the county because of the "disclosure rule."
Therefore, estimates were made based on projections of
data for available years and/or on the state averages of value added per employee for the predominant industry groups.

Appendix - 26
APPALACHIAN PORTION OF ALABAMA
NUMBER OF ESTABLISHMENTS IN SELECTED SERVICES
AND SALES 1963, AND PERCENT CHANGE 1958-1963
Establishments
NumberPercentChange Value
Receipts ($1000)PercentChange
1963* 1958-63 1963* 1958-63
All Establishments 8 603 18.45 232 082 46.15
Personal Services 4,207 20.93 INA 1NL
Auto Repair, Garages 1,432 23.13 INA INA
Other Services 2,964 13.09 INA INA
*Details may not add to total because of disclosure rule.
NUMBER OF WHOLESALE ESTABLISHMENTS AND
SALES 1963 AND PERCENT CHANGE 1958.1963
All Establishments
Merchant Wholesalers
Other Operating TYpes
Establishments Sales ($1000)Percent
Number Change Value1963* 1958.63 1963*
2 352 16.32 2.274.561
1,584 19,27 1,038,089
768 10.66 1,224,514
*Details may not add to total because of disclosure rule.
PercentChange1958.63
17.69
27.95
10.56

APPALACHIAN PORTION OF ALABAMA
NUMBER OF RETAIL ESTABLISHMENTS AND SALES 1963,
AND PERCENT CHANGE 1958-1963
Establishments
Number1963*
ALL STORES 17 823
Lumber, bldg. materials, etc. 759
General merchandise 998
Food stores 4,959
Automotive dealers 1,283
Gasoline iervice stations 2,.534
Apparel, accessory stores 1,098
Furniture, home furnishings,, etc. 1,031
Eating, drinking places 1,921
Drug stores, proprietary stores 585
Other retail stores 1,937
Non-store retailers 718
PercentChange1958-63
6.92
- 2.44
-40.52
13.35
28.04
16.56
9.25
5.31
- 0.97
1.39
20.09
29.60
Appendix - 27
Sales ($1000)Percent
Value Change1963* 1958-63
2 044,483
129,647
232,189
514,911
441,513
164,251
121,642
104,484
87,251
66,969
139,561
32,825
*Details may not add to tOtal because of disclosure rule.
27.17
20.42
10.28
28.69
57.70
33.36
14.28
16.75
23.30
27.26
5.03
62.28

Number
PercentDistribution
Percent Change1950-1960
Number
PercentDistribution
Percent Change1950-1960
Number
PercentDistribution
Percent Change1950-1960
Appendix - 28
GEORGIA -- STATE TOTAL_
POPULATION BY SEX, 1960
Total Male Female
3,942,936 1,925,957 2,016,979
100.00 48.85 51.15
14.47 14.05 14.87
POPULATION BY PLACE, 1960.
TotalRural
Non-FarmRural
Farm Urban
3,942,936 1,355,602 407,278 2,180,056
100.00 34.38 10.33 55.29
14.47 46.92 -57.68 39.80
DISTRIBUTION OF FAMILIES BY INCOME, 1960
Under $2 ,000- $3 1000- $6 ,000- $10,000Total ,$2 low 111299 an_ $91999 & Over
949,408 213,977 124,143 317,887 206,029 87,372
100.00 22.54 13.08 33.48 21.70 9.20
15.21 -47.84 -12.77 73.12 484.31 566.71

111
GEORGIA--STATE TOTAL
EDUCATION OF PERSONSa 25 AZM1 OVER 1960. ....................................
Pe.5112.14V2212ILE9
Appendix - 29
........p....
"s"--I=Mars 1.4 Years **I, or More Yts
Zatal* .Elementar School Hi h School of, C01,1020_
Number 2,014,845 935,415 740,174 272,588
PercentDistribution 100.00 46.43 36.74 13.53
Percent Change1950-1960 13.29 -6.25 54.25 46.84
*Total includes.persons who have.neverthan one year of schooling.
attended school, or who have
LABOR FORCB STATUS BY SEX . 14 ANDOVER 1960
Total
less
Male Female
'67litofr" In Out of
Labor Labor Labor Libor
Force* . Force Force* Force.................mm.i......,...."...,- .......40....6-...,- ...........
Number. 1,315,829 1,172,368
PercentDistribution 56,39 42,61
Percent Change1950-1960 13.38 8.68
Include, persons 411 the Armed Forces.
In Out ofLabbr LaborForce* Force
990,432 299,814 525,397 872,554
76,76 23.24 37.58 .62.42
5.25 32.03 32.70 2.45
EMPLOYMENT STATUS BY SEX - 14 AMMI OVER 1960
Totp1 Male I amoilimm.Female
44Imployed ployed Employed ployed* Employed ployed
Number' 1,385,047 64,897 889,403 35,840 495,644 29,057
Percent- Distribution 95.52 448 96.13 3.87 94.46 5.54
- 'Percent Change1950-1960 10.37 46.43 1.39 33.413 31.22 66.43
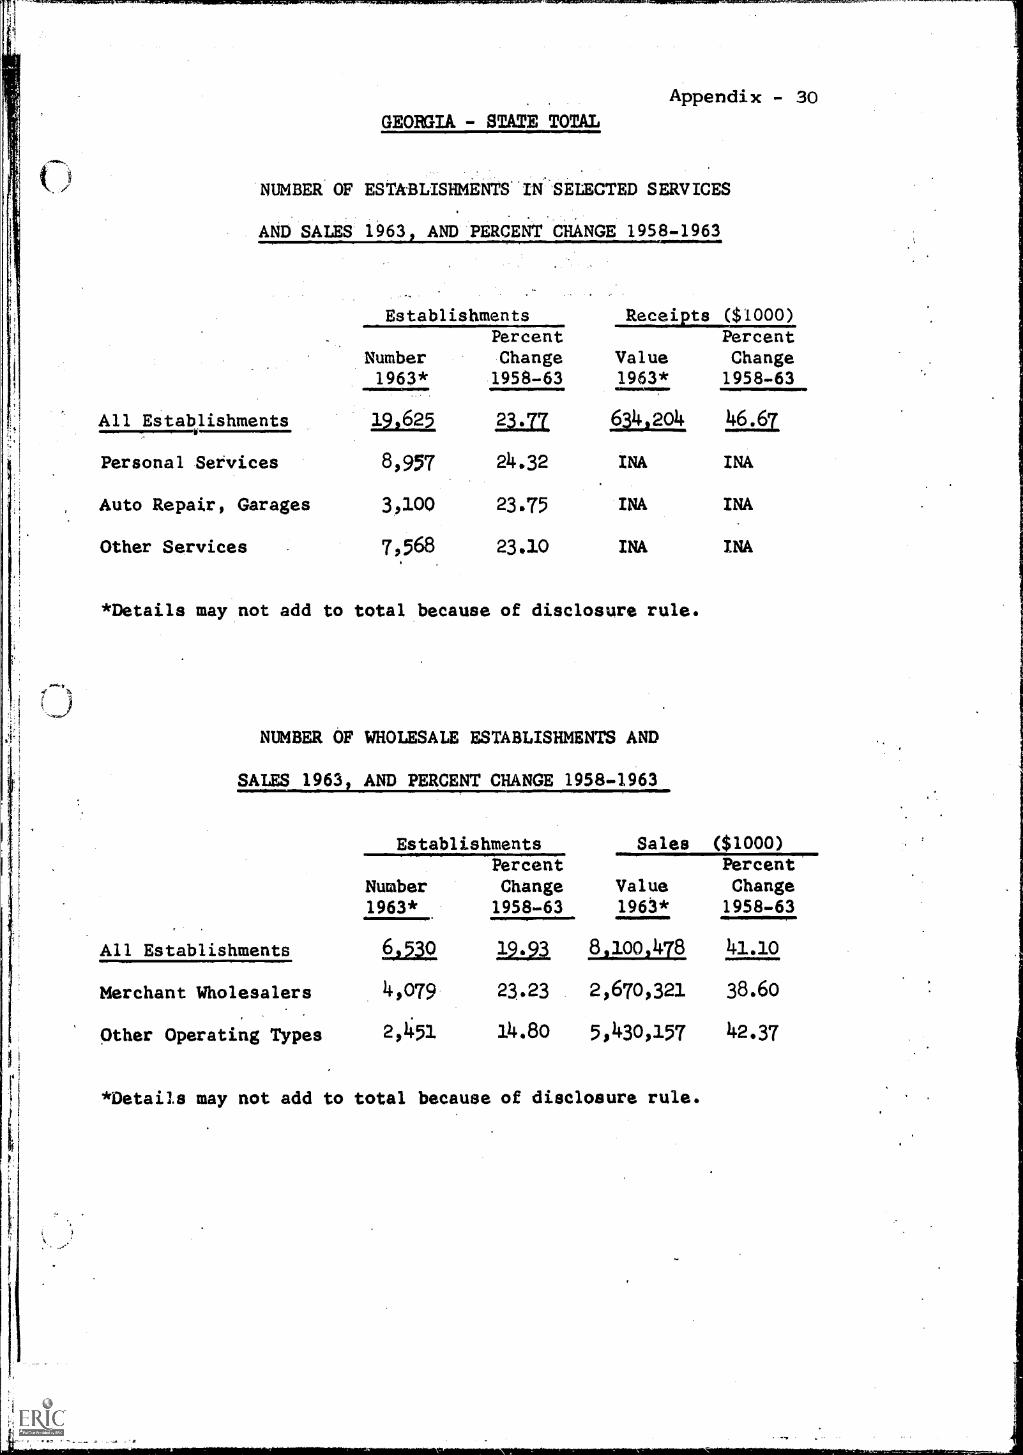
Appendix - 30
GEORGIA - STATE TOTAL
NUMBER OF ESTABLISHMENTS-IN SELECTED SERVICES
AND SALES 1963 AND PERCENT CHANGE 1958-1963
EstablishmentsPercent
Number Change1963* 1958-63
All Establishments 19,625 23.77
Personal Services 8,957 24.32
Auto Repair, Garages 3 100 23.75
Other Services V 7,.568 23,10
Receipts
Value1953*
($1000)
PercentChange1958-63
634,204 46.67
INA INA
INA
INA
*Details may not add to total because of disclosure rule.
NUMBER OF WHOLESALE ESTABLISHMENTS AND
SALES 1963 AND PERCENT CHANGE 1958-1963
All Establishments
Merchant Wholesalers
Other Operating Types
Establishments
Number1963*
SalesPercentChange Value1958-63 1963*
Lag 12,21 8,100,478,
4,079 23.23 2,670,321
2,451 14.80 5,430,157
*Details may not add to total because of disclosure rule.
INA
INA
($1000)Percent'Change1958-63
41.10
38.60
42.37

GEORGIA -- STATE TOTAL
NUMBER OF RETAIL ESTA.BLISHMENTS AND SALES 1963,
AND PERCENT CHANGE 1958-1963
Establishments
Number1963*
PercentChange1958-63
ALL STORES 36 987 4,33
Lumber, bldg. materials, etc. 1,543 -3.32
General merchandise 1,893 -38.78
Food stores 9,336 4.51
Automotive dealers 2,699 19.42
Gasoline service stations 5,662 12.72
Apparel, accessory stores 2,207 11.92
Furniture, home furnishings, etc. 2,146 9.66
Eating, drinking places 4,054 -1.20
Drug stores, proprietary stores 1,163 0.09
Other retail stores4,681 13.70
Non-store retailers1,603 25.43
Appendix - 31
Sales
Value1963*
415702013
284,632
533,156
1,037,386
*Details may not add to tOtal because of disclosure rule.
958,810
399,004
255,874
200,260
222,899
158,125
413,200
($1000)PercentChange1958761
29.53
12.11
21.28
27.28
57.49
37.99 .
20.46 ( )
17.10
36.91
35.72
22.91
106,677 -13.14

Number
PercentDistribution
Percent Change1950-1960
APPALACHIAN PORTION OF GEORGIA
POPULATION BY SEX 1960
Total
Appendix - 32
Male Female
675,024 331,284 343,740
100.00 49.08 50.92
8.92 8.31 9.50
POPULATION gy PLACE, 1960
Total
a
Rural RuralNon-Farm Farm Urban
Number 675,024 405,878 81,501 187,645
PercentL...stribution 100.00 60.13 12.07 27.80
Percent Change1950-1960 8.92 77.47 -66.94 29.85
DISTRIBUTION OF FAMILIES BY INCOME 1960
UnderTotal itiom
Number 170,598 38,993
PercentDistribution 100.00 22.86
Percent Change1950-1960 13.8/ -52.64
$2,000-$2,999
$3,000-111222.
24,717 65,856
14.49 38.60
-14.95 128.03
$6,000- $10,000'A9999 /4 Over
32,283 8,749
18.92 5.13
793.03 647.78

POPUIATION, RATE OF NATURAL INCREASE, AND NET MIGRATION RATE, 1950-1960, AND 1960-1965-1/
Appendix - 33
Population
1960
Estimated
Population
19652/
Estimated
Percent Change
Population
1960-1965
Rate
of Natural
Increase
1960-1965
Estimated
Natural Increase
Estimated Net
1960-1965
Migration Rate
Number
1960-1965
Percent
Change
Population
1950-1960
Net
Migration
Rate
1950-1960
Net
Migration
1950-1960
Number
Population
1950
GEORGIA - STATE TOTAL
3,943,116
4 360,700
+ 10.6
8.1
31Q 392
+2.5
+ 14.5
-6.2
- 213 569
3 444 579
APPA1ACHIAN PORTION
675,024
733,900
+8.7
6.9
46,257
+1.8
+8.9
- 10.6
-65,722
619,766
Georgia - 51
319,825
348,600
+9.0
7.0
22,265
+2.0
+8.9
-8.8
-25,629
293,595
Bartow
28,267
32,800
+ 15.9
6.7
1,894
+9.9
+3.3
- 15.0
-4,116
Catoosa
21,101
22,800
=8.1
7.9
1,667
+0.2
+ 39.3
+ 17.0
+2,573
Chattooga
19,954
21,100
+5.5
6.0
1,197
-0.5
-5.9
- 22.5
462
Dade
8,666
9,200
+ 57
6.8
589
-1.1
+ 17.7
-6.1
-.450
Floyd
69,130
70,200
+1.6
6.2
4,286
-4.6
+9.9
-7.0
-4,384
Gordon
19,228
20,500
=6.8
7.3
1,404
-0.5
+1.6
- 11.5
-2,182
Haralson
14,543
15,100
=4.1
4.4
640
-0.3
-0.8
- 14.0
-2,054
Murray
10,447
11,300
+8.7
8.4
878
+0.3
-2.1
- 19.8
2,118
Paulding
13,101
13,900
+6.1
6.4
838
-0.3
+ 11.5
-3.8
445
Polic
28,015
29,700
+6.1
5.7
1,597
+0.4
-9.6
- 26.1
8,095
Walker
45,264
50,800
+ 12.1
7.7
3,485
+4.4
+ 18.5
-0.4
138
Whitfield
42,109
51,200
.+ 21.6
9.0
3,790
+ 12.6
+ 22.3
+1.0
342
Georgia - 52
208,903
221,700
6.1
6.5
13,643
-0.4
+6.5
- 10.7
-20,931
196,241
Banks
6,497
6,700
+3.1
3.5
227
-0.4
-6.3
- 16.7
1,156
Cherokee
23,001
24,500
6.5
7.1
1,633
-0.6
+ 10.8
-7.0
1,448
Dawson
3,590
3,800
+5.6
5.5
197
+0.1
-3.3
- 17.5
650
Fannin
13,620
14,000
+2.9
3.6
490
-0.7
- 10.3
- 24.8
3,764
Forsyth
12,170
13,100
+7.4
7.4
901
0.0
+ /0.6
-4.6
506
Franklin
13,274
13,700
+3.0
4.0
531
-1.0
-8.1
- 19.8
2,866
Gilmer
8,922
9,300
+ 45
4.6
410
-0.1
- 10.4
-23.7
2,363
Habersham
18,116
19,400
+7.2
7.0
1,268
+0.2
+9.4
-7.8
1,283
Hall
49,739
53,800
+8.2
8.6
4,278
-0.4
+ 24.0
+2.1
853
lumpkin
7,241
7,700
+6.9
6.3
456
+0.6
+ 10.1
-5.5
360
Pickens
8,903
9,500
+6.7
7.3
650
-0.6
+0.5
- 22.3
1,974
Rabun
7,456
7,900
+ 53
6.0
447
-0.7
0.4
- 15.8
1,175
Stephens
18,391
19,300
+4.9
6.2
1,140
-1.3
+ 10.5
-8.9
1,486
Towns
4,538
4,700
+4.4
5.1
231
-0.7
-5.5
- 18.4
886
Union
6,510
6,900
+6.2
4.8
312
+1.4
- 11.0
- 25.2
1,84F
White
6,935
7,400
+7.2
6.8
472
+0.4
+ 16.5
-0.4
21

/Th
,
--Appendix - 34
POPULATION, RATE OF NATURAL INCREASE, AND NET MIGRATION RATE, 1950-1960,AND 1960-19652(
Population
1960
Estimated
Populatpn
19652
Estimated
Percent Change
Population
1960-1965
Rate
of Natural
Increase
1960-1965
Estimated
Natural Increase
1960-1965
Number
Estimated Net
Migration Rate
1960-1965
Percent
Change
Population
1950-1960
Net
Migration
Rate
1950-1960
Net
Migration
1950-1960
Number
Population
1950
GEORGIA (Cont'd)
Georgia - 53
44,230
46,400
5.0
6.2
2.,757
1.2
-0.3
- 15.0
6,646
44,350
Barrow
14,485
15,200
+4.8
6.0
869
-1.2
+ 10.4
-5.3
699
Jackson
18,499
19,500
5.4
6.5
1,202
-1.1
-2.6
- 17.8
3,384
Madison
11,246
11,700
4.5
6.1
686
-1.6
-8.1
- 20.9
2,563
Georgia - 54
60,282
72,600
+ 20.4
8.8
5,322
+ 11.6
+ 355
+ 13.6
6,033
44,493
Deuglas
16,741
18,000
+ 7.8
8.9
1,490
-1.1
+ 37.5
+ 15.9
1,941
Gwinnett
43,541
54,600
+ 25.5
8.8
3,832
16.7
+ 34.7
+ 12.7
4,092
Georgia - 55
41,784
49,600
+ 18.7
5.4
2,270
+ 13.3
+1.7
- 15.3
6 283
41 087
Carroll
36,451
39,100
+7.1
5.6
2,041
+1.5
+6.9
- 10.6
1,626
Heard
5,333
5,500
+3.8
4.3
229
-0.5
_ 23.5
- 38.1
2,657
1/ Population 1965 and net migration 1960-1965 are estimates.
2/
Source:
Biostatistics Service, Georgia Dept. of Public Health, July 1965.
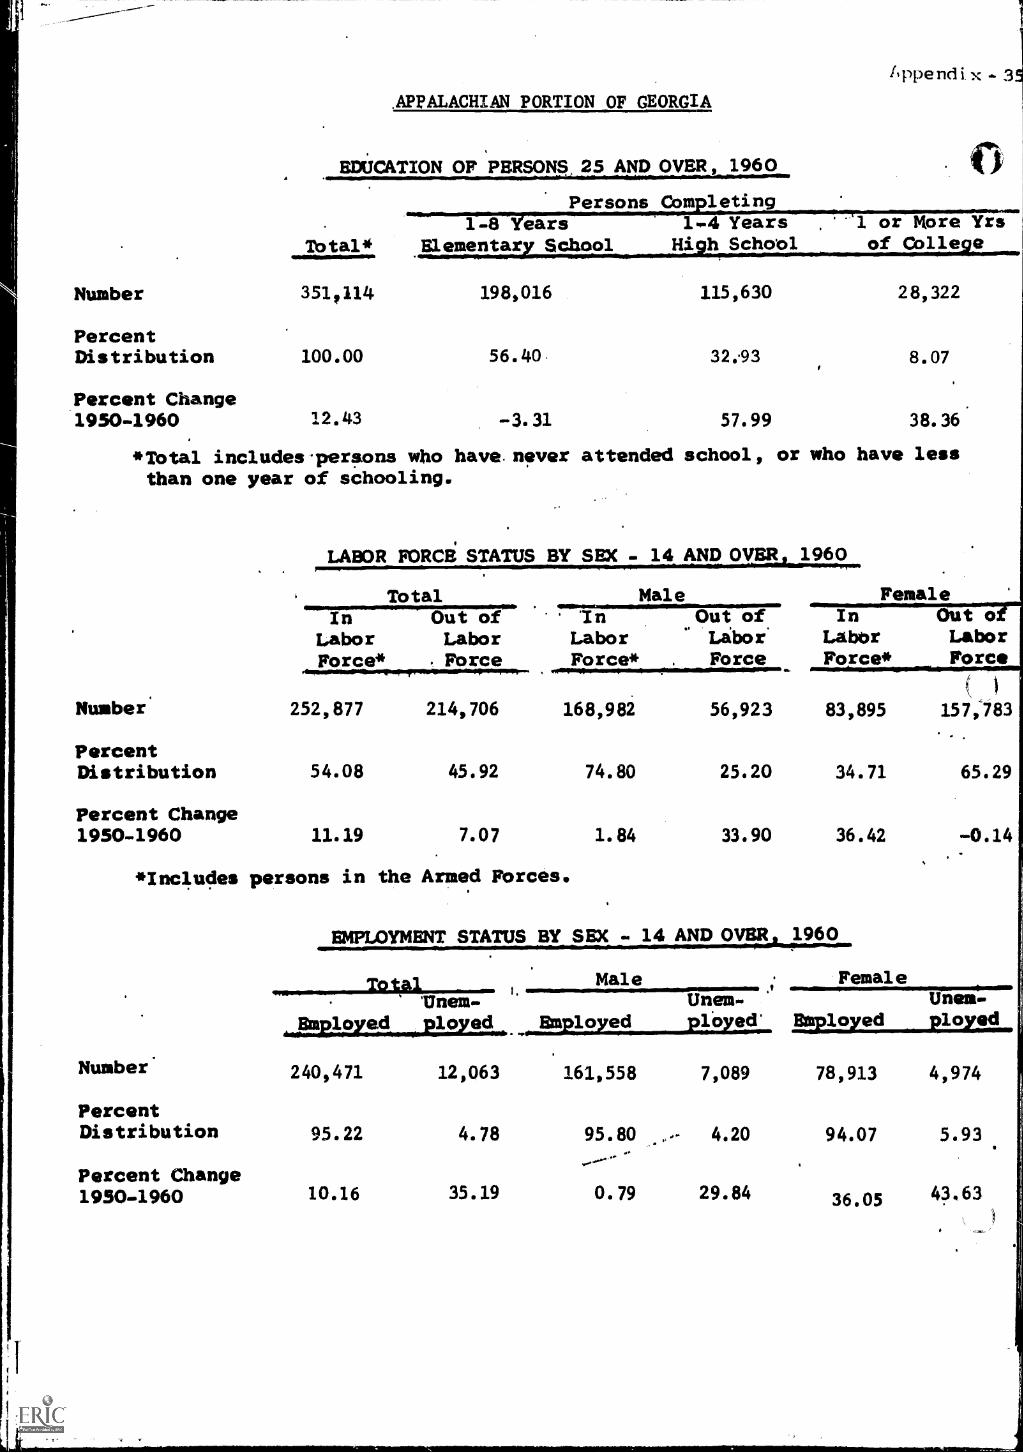
fppendix - 3APPALACHIAN PORTION OF GEORGIA
EDUCATION OF 'PERSONS 25 AND OVER, 1960
Total*
Persons Completing .................""'"-='.-8TearsElementar School
1.4 YearsHa. h School
A or More yrsof Colle e
Number 351,114 198,016 115,630 28,322
PercentDistribution 100.00 56.40 32..93 8.07
Percent Change1950-1960 12.43 -3.31 57.99 38.36
*Total includes-persons who have, never attended school, or who have lessthan one year of schooling.
LABOR FORCi STATUS BY SEX - 14 ANDOVER, 1960
Total MaleIn
LaborForce*
Out ofLabor
. Force
InLaborForce*
Out ofLabor
. Force
Number. 252,877 214,706 168,982 56,923
PercentDistribution 54.08 45.92 74.80 25.20
Percent Change1950-1960 11.19 7.07 1.84 33.90
*Includes persons in the Armed Forces.
Number.
PercentDistribution
Percent Change1950.1960
FemaleIn Out o
Labor LaborForce* Force
83,895 157;783
34.71 65.29
36.42 -0.14
EMPLOYMENT STATUS BY SEX - 14 AND OVER) 1960
Total MaleUnem-
lo 3.)(a.c...1 Employed plOyed.
.t
240,471 12,063
95.22
10.16
4. 78
35.19
FemaleUneni-
Etayloyed eloyed
161,558 7,089 78,913 4,974
95.80 4.20 94.07 5.93
0.79 29.84 36.05 43.63

Appendix - 36
PERCENT CHANGE 1962-1965 IN WORK FORCE,EMPLOYMENT AND UNEMPUOYMENT
AND 1962-1965 RATE OF UNEMPLOYMENTAPPALACHIAN & NON-APPW.ACHIAN
FORTION OF STATE(All Numbers in Thousands)
Total Work Force
1965 Change 1962-65Number Number Percent
Georgia 1,634.4 143.0 9.6
Non-Appalachian Portion 1,394.9 127.6 10.1
Appalachian Portion 239.5 15.4 6.9'
Total Employment
1965 Change 1962-65Number Number Percent
Georgia 1,571.5 163.5 11.6
Non-Appalachian Portion 1,343.4 142.4 11.9
Appalachian Portion 228.1 21.1 10.2
1965
Unemployment
Change 1962-65Number Number Percent
Georgia 62.9 - 20.5 - 24.6
NnnLAppalachian Portion 51 5 - 14.8 - 22.3
Appalachian Portion 11.4 - 5.7 - 33.3
Rate of Unemployment
1962 1963 1964 1965
Georgia 5.0% 5,0% 4.5% 3.0
Non-Appalachian Portion 5.2 4.7 4.3 3.7
Appalachian Portion 7.7 7,0 5.8 4.8

Appendix - 37
MANUFACTURING EMPLOYMENT AND VALUE ADDED BY MANUFACTURE, 1954, 1958, AND 1963,
AND PERCENT CHANGE, 1954-1958 AND 1958-1963
Manufacturing EMployment
Value Added by Manufacture
Number
Change
Number ( 1,000)
-Percent Change
1954
1958
1963
1954-
1958
1958-
1963
1954
1958
1963
1954-
1958
1958-
1963
GEORGIA - STATE TOTAL
301,290
314,008
354,023
4.2
12.7
1,592,411
2,102,332
3,254,007
32.0
54.8
APPALACHIAN PORTION
71,406
73,821
84,406
3.4
14.3
300,230
418,974
647,119
39.6
54.5
Georgia - 51
41,939
41,726
46,015
-0.5
10.3
189,316
251,542
403,512
32.9
60.4
Bartow
2,273
2,447
33273
7.6
33.8
9,770
12,069
24,523
23.5
103.2
Catoosa
351
580
730
65.2
25.9
1,295
4,534
1,543*
250.1
- 65.8
Chattooga
4,329
4,277
4,284
-1.2
0.2
20,606
22,764
34,554
10.5
51.8
Dade
151
180
68
19.2
- 62.2
432
351
454
- 18.8
29.3
Floyd
10,362
10,117
10,116
-2.3
0.0
46,517
70,829
109,644
52.3
54.8
Gordon
2,223
1,859
3,210
- 16.3
72.7
8,212
9,698
35,988
18.1
271.1
Haralson
3,092
3,680
4,800
19.0
30.4
14,928
18,098
32,831
21.2
81.4
MUrray
424
336
532
- 20.7
58.3
1,917
1,924*
2,848
0.4
46.0
Paulding
493
474
450
-3.8
-5.1
1,659
1,436
1;902
- 13.4
32.5
Polk
3,699
3,273
3,562
- 11.5
8.8
19,429
21,619
29,050
11.3
34.4
Walker
5,716
5,469
3,919
-4.0
_ 26.6
26,425
27,479
30,419
4.0
10.7
Whitfield
6,826
9,014
11,071
2.1
22.6
38,126
60,741
99,756
59.3
64.2
Georgia - 52
10 831
21
1060
24,664
11.8
17.1
77,244
119,808
158,623
55.1
32.4
Banks
34
208
549
511.7
163.9
94
574
1,706
531.9
197.2
Cherokee
2,319
2,085
2,344
- 10.0
12.4
7,479
9,203
9,534
23.1
3.6
Dawson
159
22
210
- 86.1
854.5
241
42*
1,176*
- S2.5
2,700.0
Fannin
231
191
525
- 17.3
174.9
1,323
953*
3,034
- 28.0
218.4
Forsyth
341
631
916
85.0
45.2
1,057
3,986
4,287
277.1
7.6
Ftanklin
1,256
1,488
1,162
18.4
- 20.6
3,733
4,996
5,069
33.8
1.4
Gilmer
822
790
930
-3.8
17.7
2,727
3,520
4,082
20.0
16.0
Habersham
2,087
2,268
2,850
0.6
24.6
8,929
14,070
17,696
57.5
25.8
Hall
53655
7,293
7,990
24.5
9.6
27,619
47,074
62,887
70.4
33.6
Lumpkin
42
404
420
861.9
4.0
74
901*
1,722*
1,117.5
91.1
Pickens
1,142
1,136
971
-0.5
- 14.5
4,509
5,248
4,846
16.3
-7.6
Rabun
570
807
1,077
41.5
33.5
1,299
3,395
8,895*
161.4
162.0
Stephens
3,407
3,136
3,862
-7.9
23.2
15,867
22,221
25,896
40.0
16.5
Towns
21
37
43
76.1
16.2
53
118*
188
122.6
59.3
Union
76
42
164
- 44.7
290.5
102
69
575
- 32.2
733.3
White
469
502
631
7.0
25.7
2,138
3,438
7,030
60.8
104.4

MANUFACTURING EMPLOYMENT AND VALUE ADDED BY MANUFACTURE, 1954, 1958, and 1963,
AND PERCENT CHANGE, 1954,1958 AND 1958-1963'
Appendix - 38
Manufacturing
Employment
Value Added by Manufacture
Number
Perceht Change
Number ($1,000)
Percent Change
1954
1958
1963
1954-
1958
1958-
1963
1954
1958
1963
1954,-
1958
1958-
1963
GEORGIA (Cont'd.)
Georgia - 53
5,111
5,051
5,383
-0.4
5.7
14,516
19,317
30,113
33.1
55.9
Barrow
2,514
2,227
2,408
- 11.4
8.1
6,097
8,092
13,942
32.7
72.3
Jackson
2,495
2,453
2,436
-1.6
- 0.7
8,212
10,090
14,462
22.9
43.3
Madison
102
413
539
304.9
30.5
207
1,135
1,709
448.3
50.6
Georgia - 54
2,421
2,458
3,270
1.5
33.3
9,370
12,817
20,688
36.8
61.4
Douglas
553
257
411
53.5
59.9
1,425
1,349
2,789
- 5.3
106.7
Gwinnett
1,868
2,201
2,859
17.8
29.9
7,945
11,468
17,899
44.3
56.1
Georgia - 55
3,104
3,484
5,076
12.2
45.7
9,784
16,485
34,183
68.5
107.4
Carroll
3,031
3,327
4,779
9.7
44.5
9,594
16,142
29,238
68.3
81.1
Heard
73
157
297
115.0
89.2
190
343
4,945
80.5
1,341.6
Source:
Census of Manufactures, 1954, 1958, and 1963.
*Actual census data were not available for the county because of the "disclosure rule."
Therefore,
estimates were made based on projections of data for available years and/or on the state averages
of value
added per employee for the predominant industry groups.

Appendix - 39
APPALACHIAN PORTION OF GEORGIA
NUMBER OF ESTABLISHMENTS IN SELECTED SERVICES
AND SALES 1963 AND PERCENT CHANGE 1958-1963
Establishments
NumberPercentChange
Receipts
Value
($1000)
PercentChange
1963* 1958-63 1963* 1958-63
All Establishments 3, _441 36,98 62,502 63.37
Personal Services 1,697 47.44 INA INA
Auto Repair, Garages 680 38.49 INA INA
Other Services 1,064 22.30 INA INA
*Details may not add to total because of disclosure rule.
NUMBER OF WHOLESALE ESTABLISHMENTS AND
SALES 1963 AND PERCENT CHANGE 1958-1963
Establishments Sales ($1000)
NumberPercentChange Value
PercentChange
1963* 1958-63 1963* 1958-63
All Establishments 720 28.34 475 541 20.63
Merchant Wholesalers 492 32.26 194,724 49.22
Other Operating Types 228 20.63 229,057 98.96
*Details may not add to total because of disclosure rule.
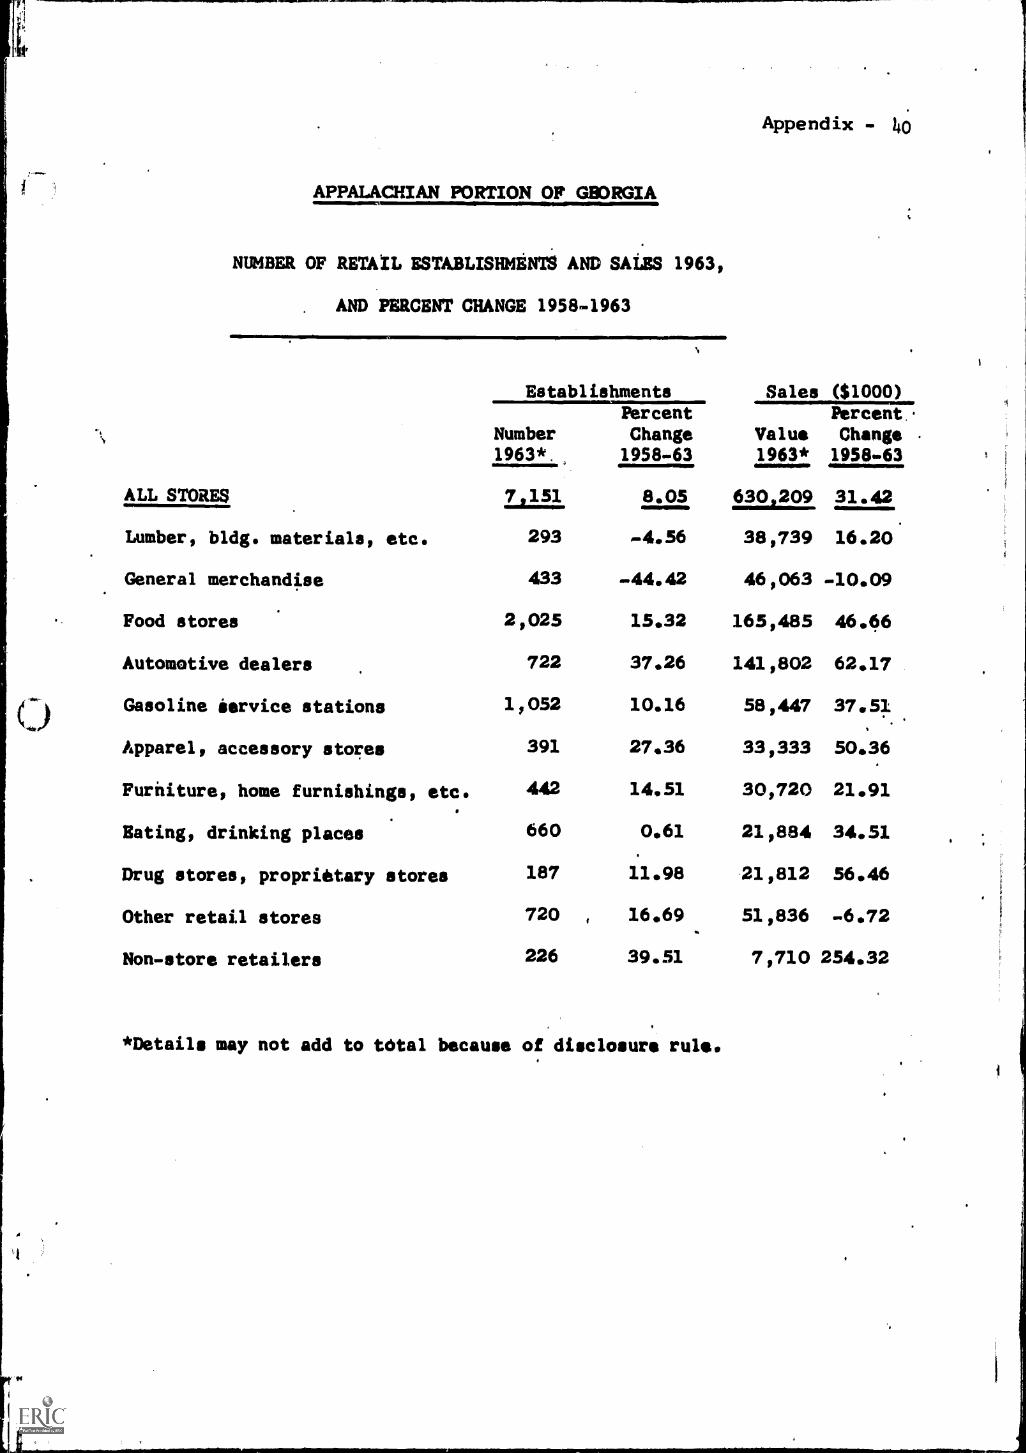
APPALACHIAN PORTION OF GBORGIA
NUMBER OF RETA/L ESTA.BLISHMENTS AND SALES 1963,
. AND PERCENT CHANGE 1958-1963
EstablishmentsPercent
Number Change1963*. 1958-63
ALL STORES 151 8.05
Lumber, bldg. materials, etc. 293 -4.56
General merchandise 433 -44.42
Food stores 2,025 15.32
Automotive dealers 722 37.26
Gasoline /service stations 1,052 10.16
Apparel, accessory stores 391 27.36
Furniture, home furnishings, etc. 442 14.51
Eating, drinking places 660 0.61
Drug stores, proprietary stores 187 11.98
Other retail stores 720 16.69
Non-store retailers 226 39.51
*Details may not add to tonal because of disclosure rule.
Appendix - 4o
Sales ($1000)Percent .
Value Change1963* 1958-63
63.2019 31.42
38,739 16.20
46 0063 -10.09
165,485 46.66
141,802 62.17
58,447 37.51
33,333 50.36
30,720 21.91
21,884 34.51
21,812 56.46
51,836 -6.72
7,710 254.32

Number
PercentDistribution
Percent Change1950.1960
Number
PercentDistribution
Percent Change1950-1960
Number
PercentDistribution
Percent Change1950-1960
KENTUCKY--STATE TOTAL
POPULATION BY SEX 1960
Total Male
Appendix - 41
Female
3,038,156 10508,536 1,529,620
100.00 49.65 50.35
3.17 2.27 4.07
POPULATION BY PLACE, 1960
Total
RuralNon-Farm
RuralFarm Urban
3,038,156 1,137,118 547,823 1,353,215
100.00 37.43 18.03 44.54
3.17 28.26 -43.77 24.83
DISTRIBUTION OF FAMILIES BY INCOME, 1960
TotalUnder $2 1000- $33000- $60000- $10 ,000
AIM?. ILJUUL. ALM- ..4,L999 & Olr
7520671 195,985 900252 249,806 156, 407 60 , 221
100.00 26.04 11.99 33.19 20.78 8.00
4.90 -42.18 -35.32 48.23 420.84 443.27

PercentDistribution
Percent Change1950-1960
7rasturePisitSmilaim.x.insiaggmarvagsaciaragivmaRpgmta
KENTUCKY -- STATE TOTAL
EDUCATION OF PERSONS 25 AND OVER, 1960
Persons C2Epi1 -TeVears 1-4 Years
'Dotal* Elementar School Hi h Schooleinilems
Appendix - 42
'1 or More Yrs.of Cone
1,609,957 888,027 506 285 177,908
100.00 55.16 31.45 11.05
3.70 -7.48 31.20 25.73
*Total includes .persons who have, never attended school, or who have lessthan one year of schooling.
LABOR FORCE STATUS BY SEX - 14 AND 0VEJ 1960
TotalIn Out of
Labor LaborForce* Foice
Male'In Out of
.
Labor LaborForce* . Force
FemaleIn
LaborForce*
'Out orLabor.Force
1,034,489 1,076,195 743,255 293,185 291,234 783,010
PercentDistribution 49.01 50.99 71.71 28.29 27.11 72. 89
Percent Change1950-1960 2.10 0.12 -6.99 21.88 35.99 -6.15
*Includes persons in the Armed Forces.
PercentDistribution
Percent Change1950-1960
EMPLOYMENT STATUS BY SEX - 14 AND OVER .1960
TotpA Male .Female'Unem. Unem. U1110717:-1"
ejla jrap1and.........2.12zied". 2 y e d ployd
935,944 60,250 '660,728 44,683 275,216 15,567
93.95 6.05
-1.99 66.97
93.67 6.33 94.65
-11.75 56.80
5.35
33.39 105.15

F..wweilignMEIMIROIRISIMErMiliORMIMPINFIM
KENTUCKY - STATE TOTALAciwidix - 43
NUMBER OF ESTABLISHMENTS IN SELECTED SERVICES
AND SALES 1963 AND PERCENT CHANGE 1958-1963
All Establishments
Personal Services
Auto Repair, Garages
Other Services
Establishments Receipts ($1000)Percent Percent
Number Change Value Change
1963* 1958-63 1963* 1958-63
15,188 19.52 186,024 32.86
6,804 26.30 INA INA
2,254 14.36 INA INA
61130 14.60 INA INA
*Details may not add to total because of disclosure rule.
NUMBER OF WHOLESALE ESTABLISHMENTS AND
SAIES 1963 AND PERCENT CHANGE 1958-1963
All Establishments
Merchant Wholesalers
Other Operating Types
Establishments Sales ($1000)
Percent
Number Change Value
1963* 1958-63 1963*
3)632 12.80 3,211,260
2,424 17.16 1,509,534
1,268 4.95 1,701,726
*Details may not add to total because of disclosure rule.
PercentChange1958-63
25.25
31.31
20.32

Appendix.- 44
KENTUCKY -- STATE TOTAL
NUMBER OF RETAIL ESTABLISHMENTS AND SALES 1963,
AND PERCENT CHANGE 1958-1963
Establishments Sales ($1000)Percent
Number Change1963* 1958-63
Value1963*
PercentChange1958.63
ALL STORES 30 107 1.35 3,174,265 23.01
Lumber, bldg. materials, etc. 1,601 -2.56 233,384 12.80.
General merchandise 1,389 -42.93 336,510 17.86
Food stores 8,167 4.25 795,845 20.60
Automotive dealers 2,054 17.37 614,040 37.18
Gasoline service stations 3,674 12.49 264,123 35.30
Apparel, accessory stores 1,631 3.62 165,903 12.32
Furniture, home furnishings, etc. 1,413 -2.95 135,183 9.76
Eating, drinking places 4,428 0.61 197,749 16.45
Drug stores, proprietary stores 834 1.71 119,030 26.91
Other retail stores 3,829 8.81 257,057 20.10
Non-store retailers 1,087 7.62 55,441 50,41
*Details may not add to tOtal because of disclosure rule.
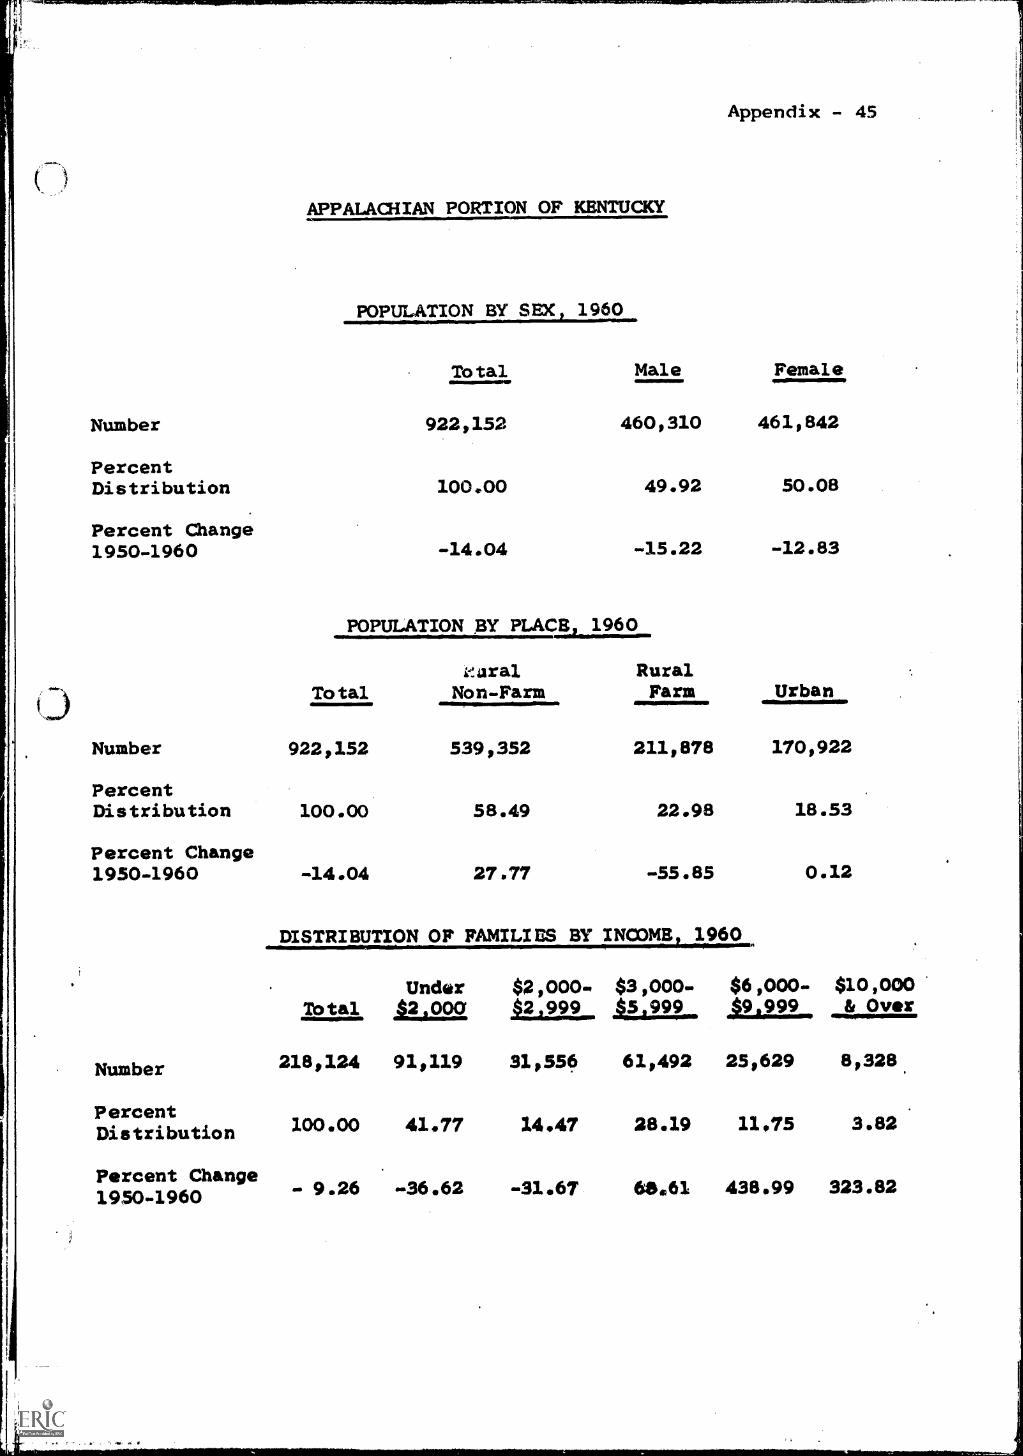
Number
PercentDistribution
Percent Change1950-1960
Number
PercentDistribution
Percent Change1950-1960
Number
APPALACHIAN PORTION OF KENTUCKY
Appendix - 45
POPULATION BY SEX 1960
Total Male Female
922,152 460,310 461,842
100.00 49.92 50.08
-14.04 -15.22 -12.83
POPULATION BY PLACE 1960
Totale.aral
Non-FarmRuralFarm Urban
922,152 539,352 211,878 170,922
100.00 58.49 22.98 18.53
-14.04 27.77 -55.85 0.12
DISTRIBUTION OF FAMILIES BY INCOMES 1960
Under $2,000. $3,000.Total A2,000 ALVA. 04999
218,124 91,119 31,556 61,492
28.19
68.61
PercentDistribution 100.00 41.77 14.47
Percent Change1950-1960 - 9.26 -36.62 -31.67
$6,000.491999,
$10,000& Over
25,629 8,328,
11.75 3.82
438.99 323.82
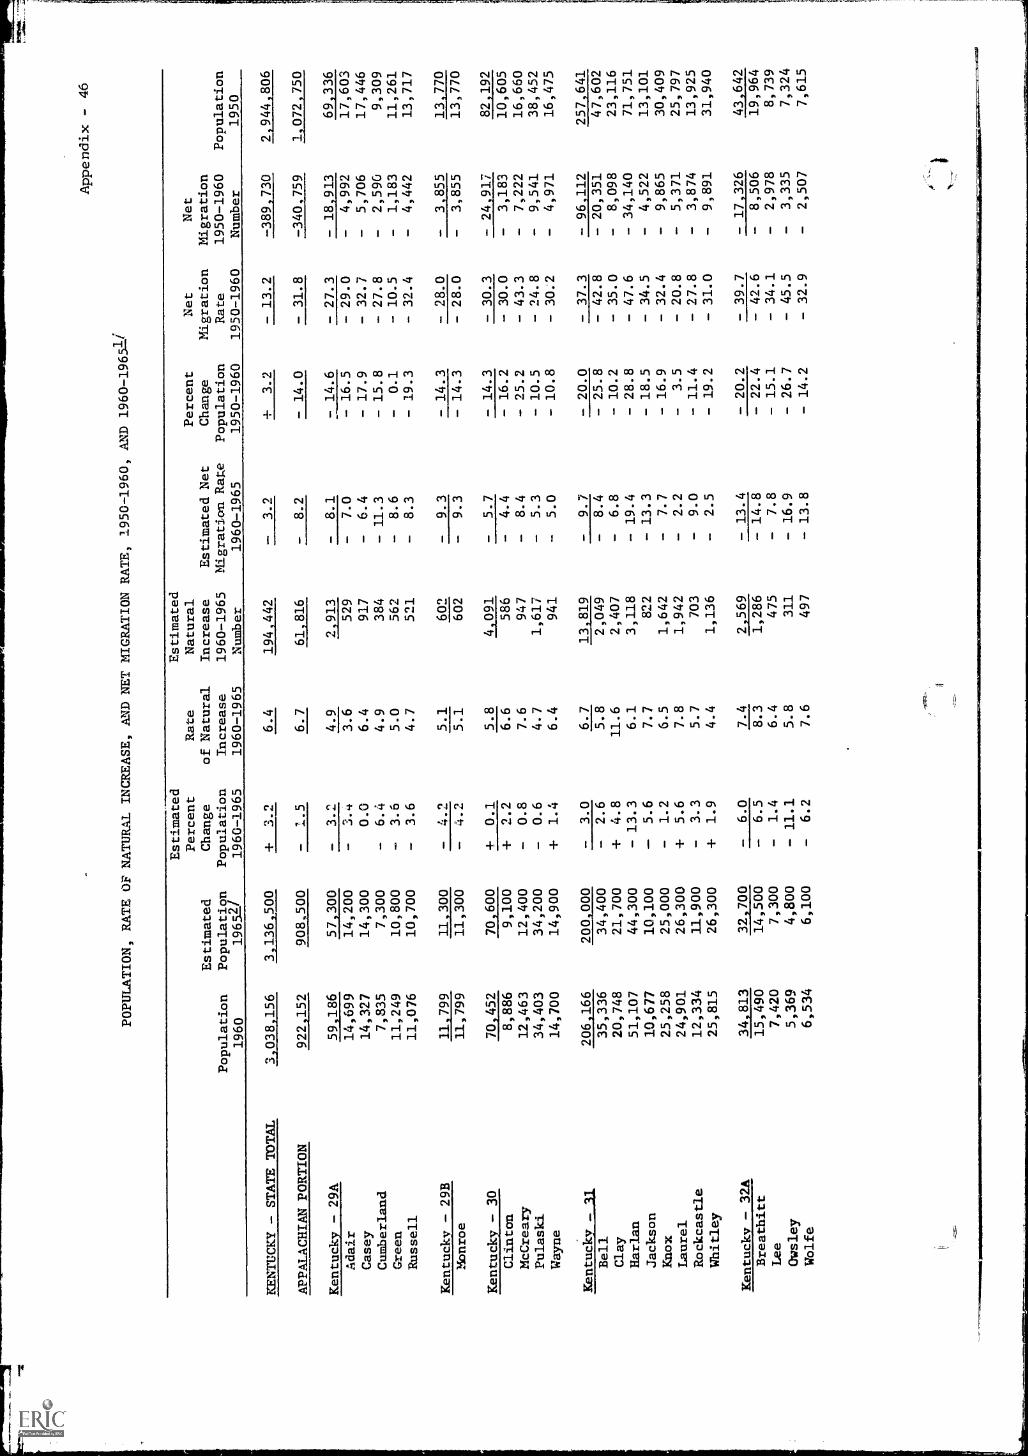
Appendix - 46
POPULATION, RATE OF NATURAL INCREASE, AND NET MIGRATION RATE, 1950-1960, AND1960-1965V
Population
1960
Estimated
Population
1965V
Estimated
Percent
Change
Population
1960-1965
Rate
of Natural
Increase
1960-1965
Estimated
Natural
Increase
1960-1965
Number
Estimated Net
Migration Rate
1960-1965
Percent
Change
Population
1950-1960
Net
Migration
Rate
1950-1960
Net
Migration
1950-1960
Number
Population
1950
KENTUCKY - STATE TOTAL
3,038,156
3 136 500
+ 3.2
6.4
194 442
-3.9
+3.2
-13.2
-389,730
2,944,806
APPALACHIAN PORTION
922 152
908,500
-1.5
6.7
61 816
-8.2
- 14.0
- 31.8
-340,759
1,072,750
Kentucky - 29A
59 186
57 300
-3.2
4.9
2 913
-8.1
- 14.6
- 27.3
- 18 913
69 336
Adair
14,699
14,200
-3.4
3.6
529
-7.0
- 16.5
- 29.0
-4,992
17,603
Casey
14,327
14,300
0.0
6.4
917
-6.4
- 17.9
- 32.7
-5,706
17,446
Cumberland
7,835
7,300
-6.4
4.9
384
- 11.3
- 15.8
- 27.8
-2,590
9,309
Green
11,249
10,800
-3.6
5.0
562
-8.6
-0.1
- 10.5
-1,183
11,261
Russell
11,076
10,700
-3.6
4.7
521
-8.3
- 19.3
- 32.4
-4,442
13,717
Kentucky - 29B
11 799
11 300
-4.2
5.1
602
-9.3
- 14.3
- 28.0
-3 855
13770
Monroe
11,799
11,300
-4.2
5.1
602
-9.3
- 14.3
- 28.0
-3,855
13,770
Kentucky - 30
70 452
70 600
+ 0.1
5.8
4 091
-5.7
- 14.3
- 30.3
- 24 917
82 192
Clinton
8,886
9,100
+ 2.2
6.6
586
-4.4
- 16.2
- 30.0
-3,183
10,605
McCreary
12,463
12,400
-0.8
7.6
947
-8.4
- 25.2
- 43.3
-7,222
16,660
Pulaski
34,403
34,200
-0.6
4.7
1,617
-5.3
- 10.5
- 24.8
-9,541
38,452
Wayne
14,700
14,900
+ 1.4
6.4
941
-5.0
- 10.8
- 30.2
-4,971
16,475
Kentucky - 13
206 166
200 000
-3.0
6.7
13 819
-9.7
- 20.0
- 37.3
- 96 112
257 641
Bell
35,336
34,400
-2.6
5.8
2,049
-8.4
- 25.8
- 42.8
- 20,351
47,602
Clay
20,748
21,700
+ 4.8
11.6
2,407
-6.8
- 10.2
- 35.0
-8,098
23,116
Harlan
51,107
44,300
- 13.3
6.1
3,118
- 19.4
- 28.8
- 47.6
- 34,140
71,751
Jackson
10,677
10,100
- 5.6
7.7
822
- 13.3
- 18.5
- 34.5
-4,522
13,101
Knox
25,258
25,000
-1.2
6.5
1,642
-7.7
- 16.9
- 32.4
-9,865
30,409
Laurel
24,901
26,300
+ 5.6
7.8
1,942
-2.2
-3.5
- 20.8
-5,371
25,797
Rockcastle
12,334
11,900
-3.3
5.7
703
-9.0
- 11.4
- 27.8
-3,874
13,925
Whitley
25,815
26,300
+ 1.9
4.4
1,136
-2.5
- 19.2
- 31.0
-9,891
31,940
Kentucky - 32A
34 813
32 700
-6.0
7.4
2 569
- 13.4
- 20.2
- 39.7
- 17 326
43 642
Breathitt
15,490
14,500
-6.5
8.3
1,286
- 14.8
- 22.4
- 42.6
-8,506
19,964
Lee
7,420
7,300
-1.4
6.4
475
-7.8
- 15.1
- 34.1
-2,978
8,739
Owsley
5,369
4,800
- 11.1
5.8
311
- 16.9
- 26.7
- 45.5
-3,335
7,324
Wolfe
6,534
6,100
-6.2
7.6
497
- 13.8
- 14.2
- 32.9
-2,507
7,615
AN
EM
IC

POPULATION, RATE OF NATURAL INCREASE, AND NET MIGRATION RATE, 1950-1960,
AND 1960-19651/
Appendix - 47
Population
1960
Estimated
Population
19651/
Estimated
Percent
Change
Population
1960-1965
Rate
of Natural
Increase
1960-1965
Estimated
Natural
Increase
1960-1965
Number
Estimated Net
Migratien Rate
1960-1965
Percent
Change
Population
1950-1960
Net
Migration
Rate
1950-1960
Net
Migration
1950-1960
Number
Population
1950
KENTUCKY (Cont'd.)
Kentucky - 32B
93 366
87 000
6.9
9.2
8 590
- 16.1
- 23.4
- 45.6
-55 632
121 945
Knott
17,362
16,700
4.0
8.6
1,493
- 12.6
- 14.6
- 36.1
- 7,334
20,320
Leslie
10,941
10,600
2.8
15.2
1,663
- 18.0
- 29.6
- 60.8
- 9,453
15,537
Letcher
30,102
27,400
9.0
7.6
2,288
- 16.6
- 23.8
- 43.0
-16,988
39,522
Perry
34,961
32,300
7.7
9.0
3,146
- 16.7
- 24.9
- 46.9
-21,857
46,566
Kentucky - 33
151 011
145 200
3.9
7.4
11 250
- 11.3
- 17.9
- 38.9
-71 552
184 016
Floyd
41,642
40,000
3.9
7.9
3,290
- 11.8
- 22.2
- 43.4
-23,244
53,500
Johnson
19,748
18,600
5.6
4.9
968
- 10.5
- 17.2
- 32.3
- 7,714
23,846
Magoffin
11,156
10,100
9.8
8.4
937
- 18.2
- 19.4
- 41.4
- 5,728
13,839
Nartin
10,201
10,100
1.0
8.5
867
-9.5
- 12.6
- 34.6
- 4,041
11,677
Pike
68,264
66,400
2.8
7.6
5,188
- 10.4
- 15.9
- 38.0
-30,825
81,154
Kentucky - 34
120 682
123 500
2.3
6.3
7 608
4.0
+ 1.5
- 16.2
-19 271
118 898
Boyd
52,163
53,600
2.7
6.2
3,234
3.5
+ 4.4
- 12.9
- 6,434
49,949
Carter
20,817
20,900
0.5
6.6
1,374
6.1
-7.7
- 25.6
- 5,767
22,559
Elliott
6,330
6,500
3.2
6.8
430
3.6
- 10.7
- 29.4
- 2,080
7,085
Greenup
29,238
30,500
4.5
6.8
1,988
2.3
+ 17.5
-3.7
-918
24,887
Lawrence
12,134
12,000
0.8
4.8
582
5.6
- 15.8
- 28.2
- 4,072
14,418
Kentucky - 35A
73 697
79 200
+7.5
6.5
4 822
1.0
+ 3.0
- 12.2
- 8 736
71 566
Clark
21,075
22,200
+ 5.2
6.2
1,307
1.0
+ 11.5
-4.3
-812
18,898
Estill
12,466
12,300
-1.6
5.7
711
-7.3
- 15.1
- 27.6
- 4,057
14,677
Eadison
33,482
37,800
+ 12.8
6.6
2,210
+6.2
+7.4
-8.1
- 2,528
31,179
Powell
6,674
6,900
+ 3.0
8.9
594
5.9
-2.0
- 19.7
- 1,339
6,812
Kentucky - 35B
26 250
25 700
2.3
4.6
1 199
6.9
- 11.6
- 23.1
- 6 851
29 697
Garrard
9,747
9,900
+ 2.1
4.0
390
1.9
- 11.6
- 22.3
- 2,461
11,029
Lincoln
16,503
15,800
4.3
4.9
809
9.2
- 11.6
- 23.5
- 4,390
18,668

Appendix - 48
POPULATION, RATE OF NATURAL INCREASE, AND NET MIGRATION
RATE, 1950-1960, AND 1960-19652J
Population
1960
Estimated
PopulatIcyn
1965!
Estimated
Percent
Change
Population
196Es-1965
Rate
of Natural
Increase
1960-1965
Estimated
Natural
Increase
1960-1965
Nonher
Estimated Net
Migration Rate
1960-1965
Percent
Change
Population
1950-1960
Net
Migration
Rate
1950-1960
Net
Migration
1950-1960
Number
Population
1950
KENTUCKY (Coned.)
Kentucky - 36A
50 715
50 900
+ 0.4
6.0
3 042
-5.6
-7.1
- 22.5
-12 269
54 565
Bath
9,114
8,700
- 4.4
4.5
410
-8.9
- 12..
- 28.4
- 2,954
10,410
Menifee
4,276
4,200
6.1
261
-8.4
- 10.9
- 23.4
-4,798
Montgomery
13,461
14,000
+ 3.7
5.3
713
-1.6
+ 3.3
- 10.9
- 1,418
13,025
Morgan
11,056
10,400
- 6.3
6.2
685
- 12.5
- 18.8
- 35.5
- 4,841
13,624
Rowan
12,808
13,600
+ o.3
7.6
973
-1.3
+ 0.6
- 15.2
- 1,932
12,708
Kentucky - 36B
24 005
25 100
+ 4.6
5.5
1,313
-0.9
-5.8
- 20.9
- 5 325
25 482
Fleming
10,890
11,600
+ o.4
2.9
316
+ 3.5
-9.j
- 19.0
- 2,97-c
11,962
Lewis
13,115
13,500
+ 3.1
7.6
997
-4.5
-3.0
- 22.6
- 3,050.
13,520
1/ Population 1965 and net migration 1960-1965 are estimates.
2/ Source: Population Estimates, Department of Rural
Sociology, University of Kentucky, January 1965.

Appendix - 4
APPALACHIAN PORTION OF KENTUCKY
_DUCATIONOF PERSONS 25 AND OVER 1960
Persons...n----rrvana 1-4 Years 1 or More YrsTotal* Elementar School h School -of College
Number 453,450 307,101 96,198 34499
PercentDistribution 100.00 67.73 21.2l 7.01
Percent Change19504960 .12.90 23.22 9.22
*Total includes-persons who have, never attended school, or who have lssthan one year of schooling«
Number
PercentDistribution
Percent Change1950.1960
_LA BOR FORCli STATUS BY SEX . 14 ilANDOVER 1960,,...-----.9--....,...,........................-......o.-.Total Male Female
In Out of In Out of In,
Labor Labor Labor Labor Labor Labor
., Force* . Force ____f_ ,orce* Force Force* Force.,.........r............_-%
245,519 373,024 187,556 117,809 57,963 2557215
39.69 60.31 61.42 38.58 18.51 81.49
.18.59 6.69 -27.48 26.74 35.00 15.66
Includes persons in the Armed Forces.
EMPLOYMENT STATUS BY SEX 14 AND OVER 1960
Male .Female
__Employed EmployedUnem.ployed
Unem-
Number. 224,342 20,980 169,326 18,033 55,016 2 ;947
PercentDistribution 91.45 8.55 90.38 9.62 94.92 5.08
Percent Change19504960 .22.74 91.13 .32.02 92.93 33.18 83.73
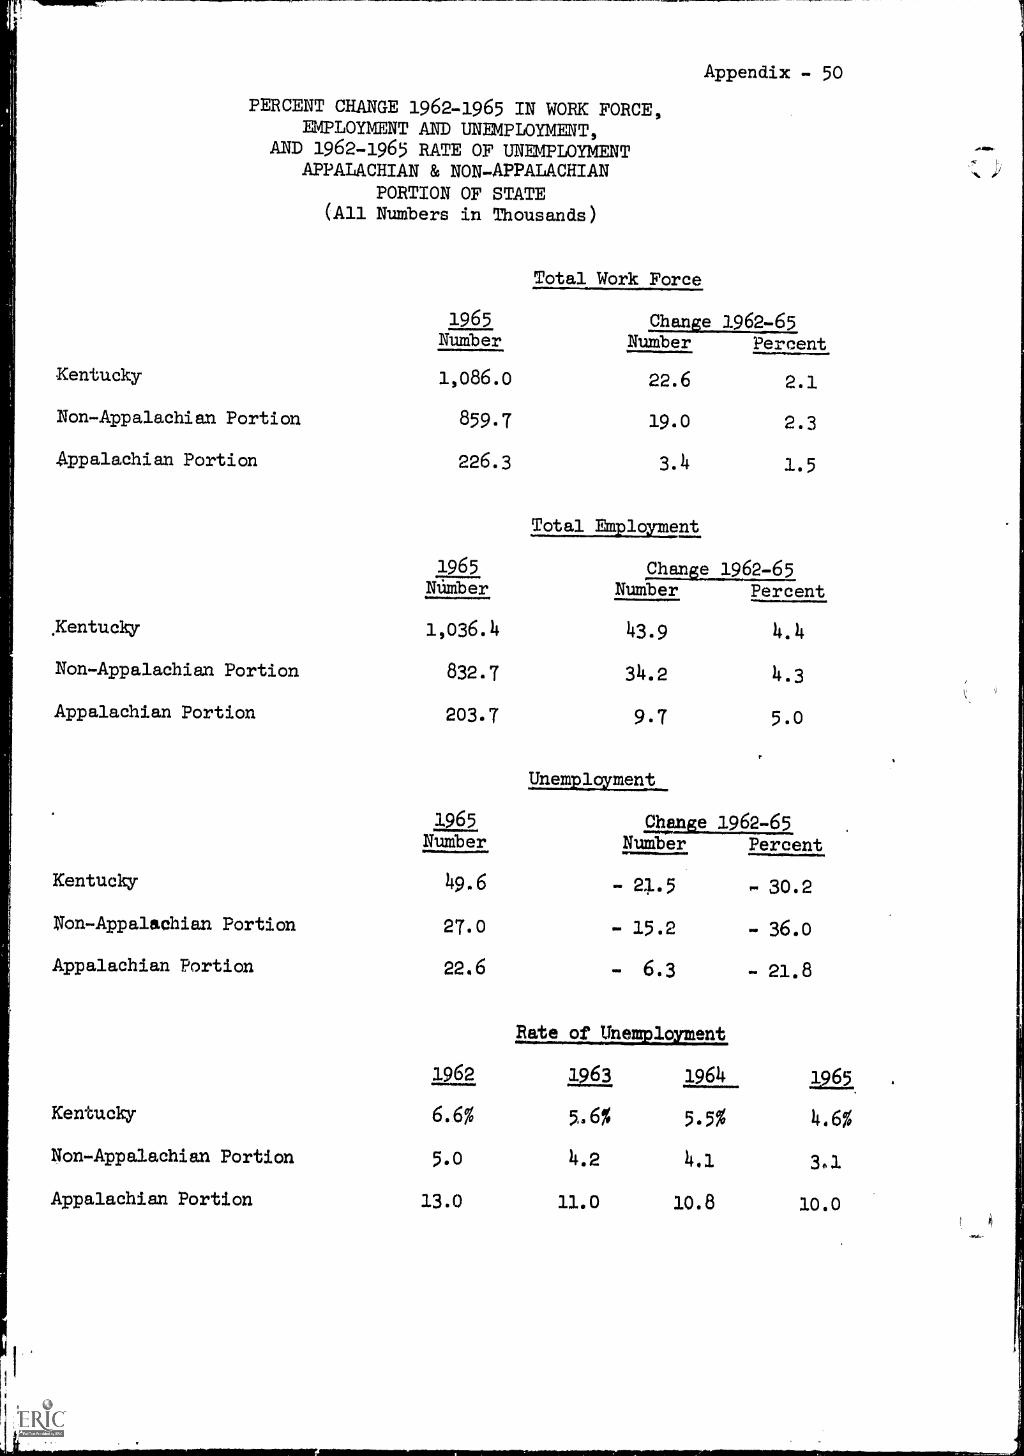
Appendix - 50
PERCENT CHANGE 1962-1965 IN WORK FORCE,EMPLOYMENT AND UNEMPLOYMENT,
AND 1962-1965 RATE OF UNEMPLOYMENTAPPALACHIAN & NON-APPALACHIAN
PORTION OF STATE(All Numbers in Thousands)
Total Work Force
1965 ChanEe 1962-65Number
Kentucky 1,086.0
Non-Appalachian Portion 859.7
Appalachian Portion 226.3
Number Percent
22.6 2.1
19.0 2.3
3.4 1.5
Total Employment
1965 Change 1962-65NuMber Number Percent
.Kentucky 1,036.4 43.9 4.4
Non-Appalachian Portion 832.7 34.2 4.3
Appaladhian Portion 203.7 9.7 5.0
Unemployment
1965 ClaRge 1962-65Number Number Percent
Kentucky 49.6
Non-Appalachian Portion 27.0
Appalachian Portion 22.6
- 21.5 , 30.2
- 15.2 - 36.0
- 6.3 - 21.8
Rate of UnemEloyment
1962 1963 1964 1965.
Kentucky 6.6% 5.6% 5.5% 4.6%
Non-Appalachian Portion 5.0 4.2 4.1 3.1
Appalachian Portion 13.0 11.0 10.8 10.0

Appendix - 51
MANUFACTURING EMPLOYMENT AND VALUE ADDED BY MANUFACTURE, 1954, 1958,
AND 1963,
AND PERCENT CHANGE, 1954-1958 AND 1958-1963
Manufacturing Employment
Value Added by Manufacture
Number
Percent Change
Number ($1.000)
Percent Change
1954
1958
1963
1954-
1958
1958-
1963
1954
1958
1963
1954-
1958
1958-
1963
KENTUCKY - STATE TOTAL
146 434
162 243
180 460
10.8
11.2
1,236,230
1,769,269
2,548,531
43.1
44.0
APPALACHIAN PORTION
16 566
18 134
24 349
9.5
34.3
97 684
144 469
201 762
47.9
39.7
Kentucky - 29A
473
702
1 306
48.4
86.0
1 453
2 010
5 163
38.3
156.9
Adair
97
95
254
-2.0
162.4
244
315
1,529
21.1
385.4
Casey
88
111
300
26.1
170.3
276
266
828
-3.6
211.3
CuMberland
71
189
229
166.2
21.2
186
470
621
152.6
32.1
Green
108
194
204
79.6
5.2
495
589
1,289
18.9
118.8
Russell
109
113
319
3.6
182.3
252
370
896
46.8
142.2
Kentucky - 29B
224
227
540
1.3
137.9
593
794
1 697
33.9
113.7
Monroe
224
227
540
1.3
137.9
593
794
1,697
33.9
113.7
Kentucky - 30
1 300
1 883
2 516
44.8
33.6
5 276
8 349
13 764
58.2
62.5
Clinton
17
194
231
1,041.1
19.1
81
518
1,084
539.5
109.3
McCreary
159
59
206
- 62.8
249.2
660
120
544
- 81.8
353.3
Pulaski
823
1,144
1,382
39.0
20.8
3,636
6,076
8,647
67.1
42.3
Wayne
301
486
697
61.4
43.4
899
1,635
3,489
81.9
113.3
Kentucky - 31
2 442
2 429
3,187
-0.5
31.2
10 700
13 414
20 621
25.4
53.7
Bell
737
650
772
- 11.8
18.8
4,210
4,599
5,545
9.2
20.6
Clay
171
173
129
1.1
25.4
414
586
635
41.5
8.4
Harlan
410
445
463
8.5
40.4
2,092
2,436
4,138
16.4
69.9
Jackson
59
32
48
- 45.7
50.0
193
65
135
66.3
107.6
Knox
176
320
715
81.8
123.4
801
1,555
4,085
94.1
162.7
Laurel
370
408
599
10.2
46.8
1,557
2,766
3,768
77.6
36.2
Rockcastle
19
24
926.3
- 62.5
48
35
118
27.1
237.1
Whitley
500
377
442
- 24.6
27.4
1,385
1,372
2,197
0.9
60.1
Kentucky - 32A
121
105
95
- 13.2
-9.5
498
274
521
- 45.0
90.1
Breathitt
75
41
53
- 45.3
29.3
379
134
234
- 64.6
74.6
Lee
33
24
32
- 27.2
33.3
107
101*
255*
- 44.4
152.5
Owsley
1*
13
2*
1,200.0
- 84.6
1*
78*
600.0
14.3
Wolfe
12
27
8*
125.0
- 70.3
11*
32
24*
190.9
- 25.0

MANUFACTURING EMPLO1MENT AND VALUE ADDED BY MANUFACTURE,
1954,
AND PERCENT CHANGE, 1954-1958-1963
1958, AND 1963,
Appendix - 52
Manufacturing Employment
Value Added by Manufacture
Number
Percent Change
Number ($1,000)
Percent Change
1954
1958
1963
1954-
1958
1958-
1963
1954
1958
1963
1954-
1958
1958-
1963
KENTUCKY (Coned.)
Kentucky - 32B
812
484
325
- 40.4
- 32.9
2 738
2 255
1 515
- 17.6
- 32.8
Knott
34
17
14
- 50.0
- 17.6
61
_...t
32
21
- 47.5
- 34.4
Leslie
248
206
78
- 16.9
- 62.1
534
828
264
55.0
- 68.1
Letcher
243
129
133
- 46.9
3.1
1,284
841
660
- 34.5
- 21.5
Perry
287
132
100
- 54.0
- 24.2
859
554
570
- 35.5
2.9
Kentucky - 33
502
559
534
11.4
-2.7
2 097
1 872
3 210
- 10.7
71.5
Floyd
62
81
115
30.6
42.0
192
311
957
61.9
207.7
Johnson
86
104
61
20.9
- 41.3
384
267
374
- 30.4
40.1
Eagoffin
11
12
37
9.0
208.3
33
46*
80
39.3
73.9
Martin
Pike
12
331
12*
350
31
290
0.0
5.7
158.3
- 17.1
4*
1 ,484
1,24r
10*
1,789
0.0
- 16.1
150.0
43.8
Kentucky - 34
7 063
7 215
7 687
2.2
6.5
56 006
87.743
107 949
56.7
23.0
Boyd
5,681
6,161
6,586
65.2
6.9
48,327
79,855
96,919
65.2
21.4
Carter
1,011
748
593
- 26.0
- 20.7
4.971
5,302
3,217
6.7
4- 39.3
Elliott
12*
12*
127
0.0
958.3
43*
53*
652*
23.3
1;130.7
Greenup
317
251
285
-8.4
13.5
2,528
2,314
6,641
-8.4
187.0
Lawrence
42
43
96
59.8
123.3
137
219
520
59.9
137.4
Kentucky - 35A
1 774
2 346
3 966
32.4
69.1
9 096
17 425
28 781
91.6
65.2
Clark
668
1,115
1,650
66.9
48.0
4,070
7,947
12,677
95.3
59.5
Estill
290
316
775
8.9
145.3
984
1,094
651
11.2
- 40.5
Madison
758
853
1,466
12.5
71.9
3,868
8,178
14,930
111.4
82.6
Powell
58
62
75
6.8
21.0
174
206
523
18.4
153.9
Kentucky - 35B
476
563
1 056
18.3
87.6
1 987
2 740
6 323
37.9
130.8
Garrard
299
476
557
59.2
17.0
1,131*
2,322*
3.182*
105.3
37.0
Lincoln
177
87
499
- 50.8
473.6
856
418
3,141*
- 51.1
651.4
Kentucky - 36A
1 211
1 234
2 321
1.9
88.1
6 904
6 506
7 331
-5.8
12.7
Bath
113
51
782
- 54.8
1,433.3
3,070
9225*
- 99.7
2,400.0
Mpnifee
11
19
29
72.7
52.6
26
52
14*
100.0
- 73.1
Hontgomery
506
533
688
5.3
29.1
1,768
3,608
2,667
115.4
- 26.1
Morgan
58
72
166
24.1
130.6
195
17
'
-581
- 91.2
3,317.6
Rowan
523
559
656
6.8
17.4
1,845
2,820
3,845
52.8
36.3

Appendix - 53
MANUFACTURING EMPLOYMENT AND VALUE ADDED BYMANUFACTURE, 1954, 1958, AND 1963,
AND PERCENT CHANGE, 1954-1958 AND 1958-1963
Manufacturing Employment
Value Added by Manufacture
Number
Percent Change
Number ($1,000)
Percent Change
1954
1958
1963
1954-
1958-
1954
1958
1963
1954-
1958-
1958
1963
1958
1963
KENTUCKY (Cont'd.)
.E.q.E.2E2LX=21
168
387
826
130.4
113.4
336
1 087
4 887
223.5
349.6
Fleming
107
45
377
- 57.9
737.8
199
95
1,929*
- 52.2
1930.5
Lewis
61
342
449
460.6
31.3
137
992
2,958
624.1
198.2
Scurce:
Census of Manufactures, 1954, 1958, and 1963.
* Actual census datawere not available for the county 'ecause of the "disclosure rule."
Therefore, estimates were made based on projections of
data for availableyears and/or on the state averages of value added per employee for the predominant
industry groups.

Appendix - 54
APPALACHIAN PORTION OF KENTUCKY
NUMBER OF ESTABLISHMENTS IN SELECTED SERVICES
AND SALES 1963, AND PERCENT CHANGE 1958-1963
Establishments Receipts ($1000)
Number1963*
PercentChange1958-63
Value1963*
PercentChange1958-63
All Establishments3_..t4412 25.18 5_999; 27.58IMIMONIMV
Personal Services 1,520 32.52 INA INA
Auto Repair, Garages 622 25.15 INA INA
Other Services 1,298 17.57 INA INA
*Details may not add to total because of disclosure rule.
NUMBER OF WHOLESALE ESTABLISHMENTS AND
SALES 1963 AND PERCENT CHANGE 1958-1963
Establishments
Number
SalesPercentChange Value
($1000)
PercentChange
1963* 1958-63 1963* 1958.63
All Establishments 725 9.19 396 531 16,12
Merchant Wholesalers 499 14.45 202,407 38.66
Other Operating Types 226 -0.88 158,216 -10.07
*Details may not add to total because of disclosure rule.

Appendix - 55
APPALACHIAN PORTION OF KENTUCKY
NUMBER OF RETAIL ESTABLISHMENTS AND SALES 1963,
AND PERCENT CHANGE 1958-1963
Establishments Sales ($1000)
Number1963*
PercentChange
1958-63Value1963*
PercentChange1958-63
ALL STORES 9,657 7.41 6749079 24460'
Lumber, bldg. materials, etc. 410 3.54 52,859 38492
General merchandise 537 -53.83 60,061 -10.12
Food stores 3 594 22.54 187,834 23.35
Automotive dealers 657 20.55 120,518 33.07
Gasoline service stations 1,102 21.77 63,688 36.65
Apparel, accessory stores 494 6.93 32,928 7.33
Furniture, home furnishings, etc. 416 -1.42 28,793 5.05
Eating, drinking places 947 3.61 27,037 16.70
Drug stores, proprietary stores 173 6.13 15,596 8,,26
Other retail stores 974 6.45 45,710 47.06
Non-store retailers 253 46.24 6,528 9.97
*Details may not add to total because of disclosure rule.

PercentDistribution
Percent Change1950-1960
Number .
PercentDistribution
Percent Change1950-1960
Number
PercentDistribution
Percent Change1950-1960
Appendix - 56
MARYLAND STATE TOTAL
POPULATION BY SEX 1960
Total Male Female
3,100,687 1,532,925 1,567,762
100.00 49.44 50.56
32.34 31.40 33.27
POPULATION BY PLACE, 1960
TotalRuralNon-Farm
RuralFarm Urban
3,100,687 736,700 110,157 2,253,830
100.00 23.76 3,55 72.69
32.34 35.52 -39.96 39.48
DISTRIBUTION OF FAMILIES BY INCOME, 1960
UnderTotal ,$2,000,
763,412 66,628
100.00 8.73
31.21 -49.16
$2,000-$21999
$3,000-ha,999
$6,000. $10,000fi Over
49,673 239,491
,$9,999,
256,382 151,238
6.51 31.37 33.58 19.81
-53.39 7.69 312.02 675.18

Number
PercentDistribution
Percent Change1950-1960
Appendix - 57
MARYLAND - STATE TOTAL
EDUCATION OF PERSONS 25 ANDOVER, 1960
Persons Com leting1--17"-Vel--r7- 1-4 Years '1 or More Yrs
Total* School School of College
1,692,562 669,367 706,794 292,486
100.00 39.55 41.76 17.28
24.23 2.86 52.24 64.52
*Total includes.persons who have never attended school, or who have less
than one year of schooling.
Number
PercentDistribution
Percent Change1950-1960
LABOR FORCE STATUS BY SEX - 14 AMIC1 OVER 1960
TotalIn Out of
Labor LaborForce* . Force
Male FemaleIn 'Out of
Labor Labor
Force* Force Force* Force. 4.-
..
In Out ofLabor Labor
1,242,217 9130041 8420887 210,589 399,330 702,452
57.64 42.36 80.01 19.99 36.24 63.76
27.66 17.84 20.67 27.37 45.45 '15.25
*Includes persons in the Armed Forces.
Number'
PercentDistribution
Percent Change1950.1960
EMPLOYMENT STATUS BY SEX - 14 AND OVER 1960
Male Female
Unem- Unem-
1,133,968 56,823 756,547 36,994 377,421 19,829
95.23 4.77 95.34 4.66 95.01 4.99.
26.73 30.54 19.32 20.63 44.77 54.16

r
AI*
MARYLAND - STATE TOTALAppendix - 58
NUMBER OF ESTABLISHMENTS IN SELECTED SERVICES
AND SALES 1963 AND PERCENT CHANGE 1958-1963
Establishments Receipts ($1000)Percent Percent
Number Change Value Change1963* 1958-63 1963* 1958-63
All Establishments 13,840 3.48 7051999 53.50
Personal Services 6,225 2.52 INA INA
Auto Repair, Garages 1,749 3.25 INA INA
Other Services 5,866 4.6o INA INA
*Details may not add to total because of disclosure rule.
NUMBER OF WHOLESALE ESTABLISHMENTS AND
SALES 1963 AND PERCENT CHANGE 1958-1963
Establishments Sales ($1000)
Percent Percent
Number Chance Value Change
1963* 1958-63 1963* 1958-63
All Establishments 1.§.22 8.21 4,473,736 35.03
Merchant Wholesalers 2,646 6.91 1,852,741 40.67
Other Operating Types 1,012 13.96 2,620,995 31.31
*Details may ndt add to total because of disclosure rule.
).1
ti

Appendix - 59
MARYLAND -- STATE TOTAL
NUMBER OF RETAIL ESTABLISHMENTS AND SALES 1963,
AND PERCENT CHANGE 1958-1963
Establishments Sales ($1000)
Number1963*
PercentChange1958-63
Value1963*
PercentChange1958-63
ALL STORES 23 901 -8.60 4,237,061 27.39
Lumber, bldg. materials, etc. 962 -17.64 187,673 4.51
General merchandise 788 -21.67 616,812 68.75
Food stores 5,104 -19,87 1,020,560 14.09
Automotive dealers 1,227 6.97 761,211 56.75
Gasoline Service stations 2,677 -1.11 284,212 25.12
Apparel, accessory stores 1,506 -8.11 220,994 20.87
Furniture, home furnishings, etc. 1,154 -3.11 161,807 16.52
Eating, drinking places 5,115 -6.63 337,089 19.90
Drug stores, proprietary stores 846 1.68 178,278 27.39
Other retail stores 3,231 -1.61 353,378 16.39
Non-store retailers 1,291 -2.79 115,047 -9.57
*Details may not add to total because of disclosure rule.
,
-ayawn,11111*

Number
PercentDistribution
Percent Change1950-1960
Number
PercentDistribution
Percent Change1950-1960
Number
PercentDistribution
Percent Change1950-1960
Appendix - 60
MARYLAND -- SUBREGEON 37
POPMATION BY SEX, 1960
Total Male Female
1951808 951680 1001128
100.00 48.86 51.14
3.22 2.20 4.21
POPULATION BY PLACE, 1960
TotalRuralNon-Farm
RuralFarm Urban
195,808 94,671 12,494 88,643
100,00 48.35 6.38 45.27
3.22 46.02 -44.26 -13.48
raSTRIBUTION OF FAMILIES BY INCOME, 1960
UnderTotal zoosz ,$2,999 .
$10,000& Over
51,143 7,216 5,188 20,354 13,696 4,689
100.00 14,11 10.14 39.80 26,78 9.17
4.45 -55.47 .55.20 27.37 451.15 525.20
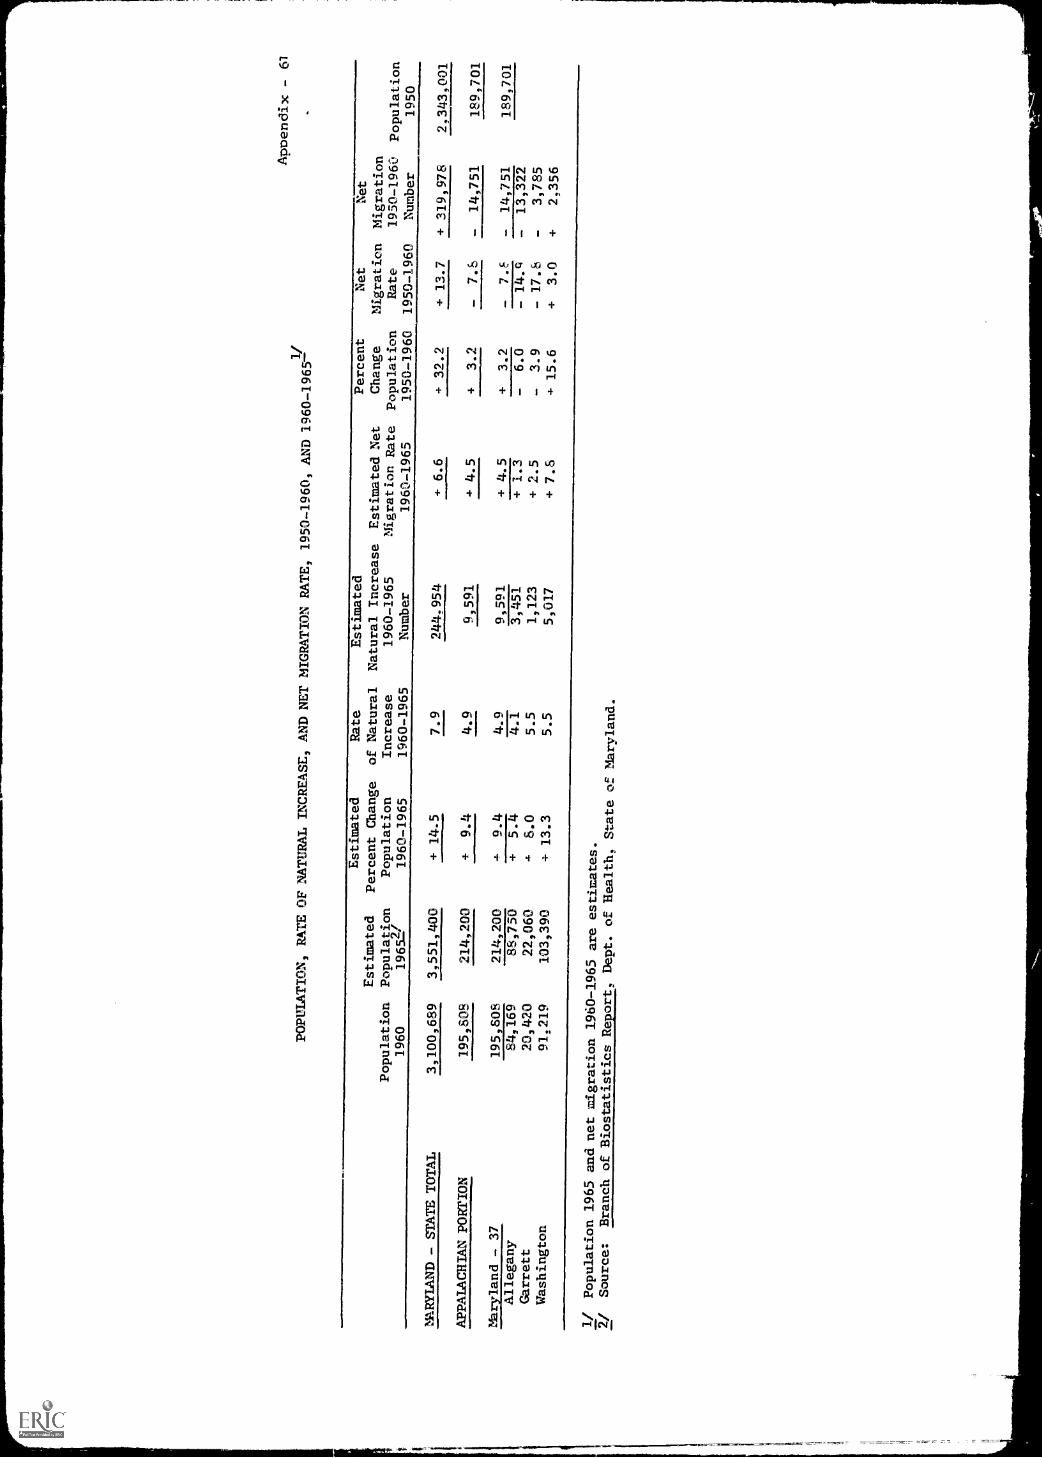
Appendix - 61
1/
POPULATION, RATE OF NATURAL INCREASE, AND NET MIGRATION RATE, 1950-1960,AND 1960-1965-
Population
1960
Estimated
Population
1965Y
Estimated
Percent Change
Population
1960-1965
Rate
of Natural
Increase
1960-1965
Estimated
Natural Increase Estimated Net
1960-1965
Migration Rate
Number
1960-1965
Percent
Change
Population
1950-1960
Net
Migration
Rate
1950-1960
Net
Migration
1950-1960
Number
Population
1950
MARYLAND - STATE TOTAL
3,100,689
3,551,400
+ 14.5
7.9
244,954
+6.6
+ 32.2
+ 13.7
+ 319,978
2.343,001
APPALACHIAN PORTION
195,808
214,200
+9.4
4.9
9,591
4 4.5
+3.2
-7.8
14,751
189,701
Nkryland - 37
195,808
214,200
-J.
9.4
4.9
9,591
+ 4.5
+3.2
-7.E
14,751
189,701
Allegany
84,169
88,750
+5.4
4.1
3,451
+ 1.3
-6.0
- 14.11
13,322
Garrett
20,420
22,060
.6.0
5.5
1,123
+ 2.5
-3.9
- 17.8
3,785
Washington
91,219
103,390
+ 13.3
5.5
5,017
+ 7.6
4- 15.6
+3.0
2,356
1/ Population 1965 and net migration 1960-1965
are estimates.
2/
Source:
Branch of Biostatistics Report, Dept. of Health,
State of Maryland.

Number
PercentDistribution
Percent Change1950-1960
Appendix - (12
MARYLAND - SUBREGION 37
EDUCATION OF PERSONS 25 AND OVER, 1960
Persons Com leting1 ears 1-4 Years 1 or More Yrs
Total* Elementar School
111,969
100.00 49.32
3.62 - 7.10
55 I220 44,771
39.99
21.66
10,907
9.74
26.60
*Total includes.persons who have never attended school, or who have less
than one year of schooling.
LABOR FORCFi STATUS BY SEX - 14 AND OVER 1960
TotalIn Out of
Labor LaborForce* . Force
MaleIn Out ofLabor LiborForce* , Force
FemaleIn Out of
Labor LaborForce* Force
Number 72,131 69,653 54'208 17,052 20,923 52,601
PercentDistribution 50.87 49.13 75.02 24.98 28.46 71.54
Percent Change1950-1960 3.12 - 0.24 - 2.63 9.84 20.53 - 3.13
*Xncludes persons in the Armed Forces.
011111,
EMPLOYMENT STATUS BY SEX - 14 AND OVER 1960
Total MaleUnem-
FemaleUnem- Unem-
elms!. anamta.....autl..21.221ed....0 Employed
Numbers 65,915 5,622 46,748 3,972 19,167 1,650
PercentDistribution 92.14 7.86 92.17 7.83 92.07 7.93
Percent Change1950-1960 2.60 0.41 - 3.00 -7.82 19.41 27.91

Appendix - 63
PERCENT CHANGE 1962-1965 IN WORK FORCE,EMPLOYMENT AND UNEMPLOYMENT,
AND 1962-1965 RATE OF UNEMPLOYMENTAPPALACHIAN & NON-APPALACHIAN
PORTION OF STATE(All Numbers in Thousands)
Total Work Force
1965 Change 1962-65
Number Number Percent
Maryland 1,260.5 92.9 8.0
Non-Appalachian Portion 1,184.7 92.5 8.5
Appalachian Portion 75.8 .4 .5
IsIDAJImIlEmult
1965 Change 1962-65
Number Number Percent
Maryland 1,210.6 108.3 9.8
Non-Appalachian Portion 1,139.2 106.2 10.3
Appalachian Portion 71.4 2.1 3.0
1965
Unemployment
Change 1962-65
Number Number Percent
Maryland 49.9 - 15.4 . 23.6
Non-Appalachian Portion 45.5 - 13.7 . 23.2
Appalachian Portion 4,4 1.7 - 27.9
Rate of Unemployment
1962 1963 1964 1965
Maryland 5.6% 5.0% 4.5% 4.0%
Non-Appalachian Portion 5.4 4.8 4.4 3.8
Appalachian Portion 8.1 8.1 7.0 5.8
..amw,---....rhemc........aamrrmmmmswmkw-mrromrowm..Agppmr.m..-

E.4
Appendix - 64
MANUFACTURING EMPLOYMENT AND VALUE ADDED BY MANUFACTURE, 1954,
AND PERCENT CHANGE, 1954-1958 AND 1958-1963
1958, AND 1963,
Manufacturing Employment
Value Added by Manufacture
Number
Percent Change
Number ($1,000)
Percent Change
1954
1958
1963
1954-
1958
1958-
1963
1954
1958
1963
1954-
1958
1958-
1963
MARYLAND - STATE TOTAL
')53,144
259 097
263 672
I2.4
1.8
1,888,585
2,394,414
3,001,468
26.8
25.4
APPALACHIAN PORTION
23,780
23,350
22,966
- 1.8
- 1.6
148,077
157,649
228,152
6.5
44.7
Maryland - 37
23,780
23,350
22,966
- 1.8
- 1.6
148,077
157,649
228,152
6.5
44.7
Allegany
8,701
9,389
10,199
7.9
8.6
68,891
94,157
123,674
36.7
31.3
Garrett
314
505
585
60.8
15.8
907
1,791
3,224
97.5
80.0
Washington
14,765
13,456
12,182
- 8.8
- 9.5
7F,279
61,701
101,254
-21.2
64.1
Source:
Census of Manufactures, 1954, 1956, and 1963.

Appendix - 65
MARYLAND - SUBREGION 37
NUMBER OF ESTABLISHMENTS IN SELECTED SERVICES
AND SALES 1963; AND PERCENT CHANGE 1958-1963
Establ ishments Receipts ($1000)
Number1963*
PercentChange1958-63
Value1963*
PercentChange1958-63
All Establishments 12008 8.39 244660 36.82
Personal Services 468 11.16 INA INA
Auto Repair, Garages 140 5.26 INA INA
Other Services 400 6.38 INA INA
*Details may not add to total because of disclosure rule.
NUMBER OF WHOLESALE ESTABLISHMENTS AND
SALES 1963, AND PERCENT CHANGE 1958-1963
Establishments Sales ($1000)
Number1963*
PercentChange1958-63
Value1963*
PercentChange1958-63
All Establishments 279 6.08 152,520 22.44
Merchant Wholesalers 197 4.23 79,114 14.37
Other Operating Types 82 10.81 66,770 20.53
*Details may not add to total because of disclosure rule.

MARYLAND - SUBREGION 37
NUMBER OF RETAIL ESTABLISHMENTS AND SALES 1963,
AND PERCENT CHANGE 1958-1963
EstablishmentsPercent
Number Change1963* 1958-63
ALL STORES - 8.58
Lumber, bldg. materials, etc. 86 - 6.52
General merchandise 70 - 21.35
Food stores .439 - 15.74
Automotive dealers 138 - 2.82
Gasoline service stations 239 4.82
Apparel, accessory stores 120 - 11.76
Furniture, home furnishings etc. 107 - 6.14
Eating, drinking places 417 - 4.79
Drug stores, proprietary stores 48 - 14.29
Other retail stores 248 - 11.74
Non-store retailers 59 2.99
*Details may not add to tOtal because of disclosure rule.
0
Appendix - 66
Sales ($1000)Percent
Value Change1963* 1958-63
264 636 22:30
18,937 24.62
36,883 56.41
64,538 10.30
46,598 32.78
19,981 31.15
16,605 21.22
11,347 10:84
15,715 10 77
7,548 9.92
21,828 13.29
3,963 18.87

Numoer
PercentDistribution
Percent Change1950-1960
Number
PercentDistribution
Percent Change1950-1960
Number
PercentDistribution
Percent Change1950-1960
Appendix - 67
MISSISSIPPI - STATE TOTAL
POPULATION BY SEX 1960
Total Male Female
2.178 141 1 067 955 1 110 186
100.00 49.03 50.97
-0.04 -0.82 0.73
POPULATION BY PLACE 1960
TotalRuralNon-Farm
RuralFarm Urban
2 178 141 814,497 542 839 820 805
100.00 37.39 24.92 37.68
-0.04. 71.64 -50.53 35.19
. DISTRIBUTION OF FAMILIES BY INCOME 1960
Under $2,000- $3,000- $6,000- $10,000Total $2,000 $2,999 $5,999 $9,999 & Over
500021 188 724 69,825 142 548 73,900 25,924=Mw
100.00 37.68 13.94 28.46 14.75 5.18
-1.58 -44.27 8.06 102.97 500.08 407.82

Appendix - 68
MISSISSIPPI - STATE TOTAL
EDUCATION OF PERSONS 25 AND OVER, 1960
Persons Com leting1-8 Years 1-4 Years .1 or More Yrs
Total* Elementar School Hi h School
Number
PercentDistribution
Percent Change1950-1960
1 064 976 508 135 383 432
100.00
-0.77
47.71
-16.38
36.00
28.98
of Colle e
12.47
33.97
*Total includes.persons ft-6 have never attended school, or who have lessthan one year of schooling.
LABOR FORCE STATUS BY SEX - 14 AND OVER 1960
TotalIn Out of
Labor LaborForce* , Force
MaleIn Out of
.
Labor LaborForce* Force.1011.11ftwerrolw 'Omer
Number 742 604 696019 497 645 195 823
PercentDistribution 51.59 48.41 71.76 28.24
Percent Change1950-1960 -1.89 -3.77 -12.60 27.05
*Includes persons in the Armed Forces.
Number'
PercentDistribution
Percent Change1950-1960
FemaleIn Out of
Labor LaborForce* Force
214,222 501 046
32.84 67.16
30.64 -12.11
EMPLOYMENT STATUS BY SEX - 14 AND OVER 1960
spoplimpimimmmommM404;071;;:
Simp1oyel, ployed
94.56
-4.81
.19_1284
5.44
51.23
Male Female
EmyloyedUnem-ployed' EMployed
453 026 23,868 229 313
95.00
-15.90
5.00
40.80
93.70
28.71
tines=
ployed
15,416
6.30
70.83 Li)

MISSISSIPPI - STATE TOTAL
Appendix - 69
NUMBER OF ESTABLISHMENTS IN SELECTED SERVICES
AND SALES 1963 AND PERCENT CHANGE 1958-1963
Establishments Receipts ($1000)
Number1963*
PercentChange1958-63
Value1963*
PercentChange1958-63
All Establishments 9 056 25.81 200 710 37.77
Personal Services 4,303 24.36 INA INA
Auto Repair, Garages 1,360 46.24 INA INA
Other Services 3,.393 20.83 INA INA
*Details may not add to total because of disclosure rule.
NUMBER OF WHOLESALE ESTABLISHMENTS AND
SALES 1963, AND PERCENT CHANGE 1958-1963
Establishments
Number
PercentChange
Sales ($1000)
Value
PercentChange
All Establishments
1963* 1958-63 1963* 1958-63
12.37 1,786664 28.68
'Merchant Wholesalers
Other Operating Types
1,664
880
19.71
0.69
1,003,441
783,223
41.07
15.66
*Details may not add to total because of disclosure rule.
-Ira11.--a7--

Appendix - 70
MISSISSIPPI - STATE TOTAL
NUMBER OF RETAIL ESTABLISHMENTS AND SALES 1963,
AND PERCENT CHANGE 1958-1963
Establishments Sales ($1000)Percent
Number Change1963* 1958-63
PercentValue Change1963* 1958-63
ALL STORES 19 167 3.75 1 914 221 29 19
Lumber, bldg. materials, etc. 894 -11.49 178,748 38.26
General merchandise 1,311 -41.63 173,226 0.95
Food stores 5,652 12.75 461,624 29.02
Automotive dealers 1,341 22.91 402,975 44.66
Gasoline service stations 2,525 10.50 165,982 28.98
Apparel, accessory stores 1,245 10.57 132,079 37:51
Furniture, home furnishings, etc. 981 7.10 78,207 20.95
Eating, drinking places 2,122 5.62 72,688 19.24
Drug stores, propridtary stores 609 -5.29 65,486 23.57
Other retail stores 1,846 9.43 152,420 22.67
Non-store retailers 641 42.76 30,786 81.77
*Details may not add to to:nal because of disclosure rule.

Number
PercentDistribution
Percent Change1950-1960
Number
PercentDistribution
Percent Change1950-1960
Number
PercentDistribution
Percent Change1950-1960
Appendix - 71
MISSISSIPPI - SUBREGION 60
POPULATION "a SEX, 1960
Total Male FcrizAle
406,187 199,206 206,981-
100.00 49.04 50.96
-4.67 -5.30 -4.05
POPULATION BY FLACE, 1960
TotalRural
Non-FarmRuralFarm Urban
406,187 152,745 142,297 111,145
100.00 37.61 35.03 27.36
.-4.67 68.17 -44.72 42.79
DISTRIBUTION OF FAMILIES BY INCOME, 1960
Under $2,000- $3,000- $6,00o. $10,000
Total ,09000 15221.9 $9,999_ & Over:
97,447 40,158 14,743 27,824 11,258
100.00 41.21 () 15.13 28.55 11.55
-3.30 -45.03 21.14 162.61 643.10
3,464
3.55
364.97

POPULATION, RATE OF b TURAL INCREASE, AND NET MIGRATION RATE, 1950-1960, AND
1960-1965-1/
Appendix - 72
Population
1960
Estimated
Population
19653/
Estimated
Percent Change
Population
1960-1965
Rate
of Natural
Increase
1960-1965
Estimated
Natural Increase Estimated Net
1960-1965
Migration Rate
Number
1960-1965
Percent
Change
Population
1950-1960
Net
Nigration
Rate
1950-1960
Net
Migration
1950-1960
Number
Population
1950
MISSISSIPPI - STATE TOTAL
2,178,141
2,329,874
7.0
8.2
178,608
-1.2
0.0
- 19.9
-433,584
2,178,914
APPALACHIAN PORTION
406,187
440,060
8.3
7.0
28,504
+1.3
-4.7
- 21.2
- 90,324
426,076
Mississippi - 60
406,187
440,060
8.3
7.0
28,504
+1.3
-4.7
- 21.2
- 90,324
426,076
Alcorn
25,282
27,580
9.1
4.7
1,188
+4.4
-6.9
- 19.3
-5,242
27,158
Benton
7,723
8,430
9.2
7.7
595
+1.5
- 12.2
- 31.4
-2,761
b,793
Chickasaw
16,891
19,373
14.7
7.2
1,216
+7.5
- 10.9
- 27.4
-5,198
18,951
Choctaw
8,423
8,250
-2.1
5.4
455
-7.5
- 23.5
- 36.9
-4,061
11,009
Clay
18,993
19,527
2.8
7.5
1,424
-4.7
4-
6.6
- 14.8
-2,623
17,757
Itawamba
15,060
16,447
9.1
3.9
586
+5.2
- 12.4
- 23.0
-3,958
17,216
Kemper
12,277
11,967
-2.5
5.3
651
-7.8
- 22.8
- 37.2
-5,919
15,893
Lee
40,589
46,215
13.9
7.9
3,207
+6.0
+6.2
- 11.3
-4,338
38,237
Lowndes
46,639
54,455
16.8
10.7
4,990
+6.1
+ 23.2
+2.4
+925
37,852
Marshall
24,503
26,034
6.2
10.4
2,546
-4.2
-2.4
- 27.4
-6,868
25,106
Mbnroe
33,953
35,179
3.6
6.5
2,207
-2.9
-7.1
- 21.3
-7,768
36,543
Noxubee
16,826
16,801
-0.1
8.1
1,363
-8.2
- 16.0
- 35.8
-7,171
20,022
Oktibbeha
26,175
30,756
17.5
9.8
2,565
7.7
6.5
- 16.2
-3,979
24,569
Pontotoc
17,232
18,363
6.6
4.1
707
=2.5
- 13.8
- 23.9
-4,783
19,994
Prentiss
17,949
19,800
10.4
5.5
987
+4.9
-9.4
- 24.3
-4,807
19,810
Tippah
15,093
16,097
6.7
5.9
890
+0.8
- 13.9
- 27.4
-4,801
17,522
Tishomingo
13,889
16,183
16.5
4.2
583
+ 12.3
- 10.6
- 23.0
-3,579
15,544
Union
18,904
18,498
-2.1
4.8
907
-6.9
-6.7
- 19.4
-3,940
20,262
Webster
10,580
11,158
5.5
3.9
413
+1.6
-8.8
- 21.2
-2,456
11,607
Winston
19,246
18,938
-1.6
5.3
1,020
-6.9
- 13.4
- 31.5
-6,997
22,231
1/
Population 1965 aad net migration 1960-1965 are estimates.
2/
Source:
Mississippi County Population Estimates by Race and Age, 1965, Mississippi State University.

EstimatedPopulation
1965
440.1
Appendix - 73
MISSISSIPPI - SUBREGION 60
ESTIMATED POPULATION 1965 AND
PERCENT CHANGE 1960 . 1965
(All Numbers in Thousands)Change 1960-1965
Number Percent
33.9 8.3
PERCENT CHANGE 1962-1965 IN WORK FORCE,EMPLOYMENT AND UNEMPLOYMENT,
AND 1962-1965 RATE OF UNEMPLOYMENT
(All Numbers in Thousands)Total Work Force. Total Employment
1965 stave 1962.1965 1965 Chan9e 1962-1965Number Number Percent Number Number percent
149.4 2.3 1.6 141.1 5.8 4.3
Unemployment Rate of Unemployment
1965 Chanpe 1962-1965 1962 8,0
Number Number Percent1963 6.3
8.4 -3.4 -28.81964 7.0
1965 5.6
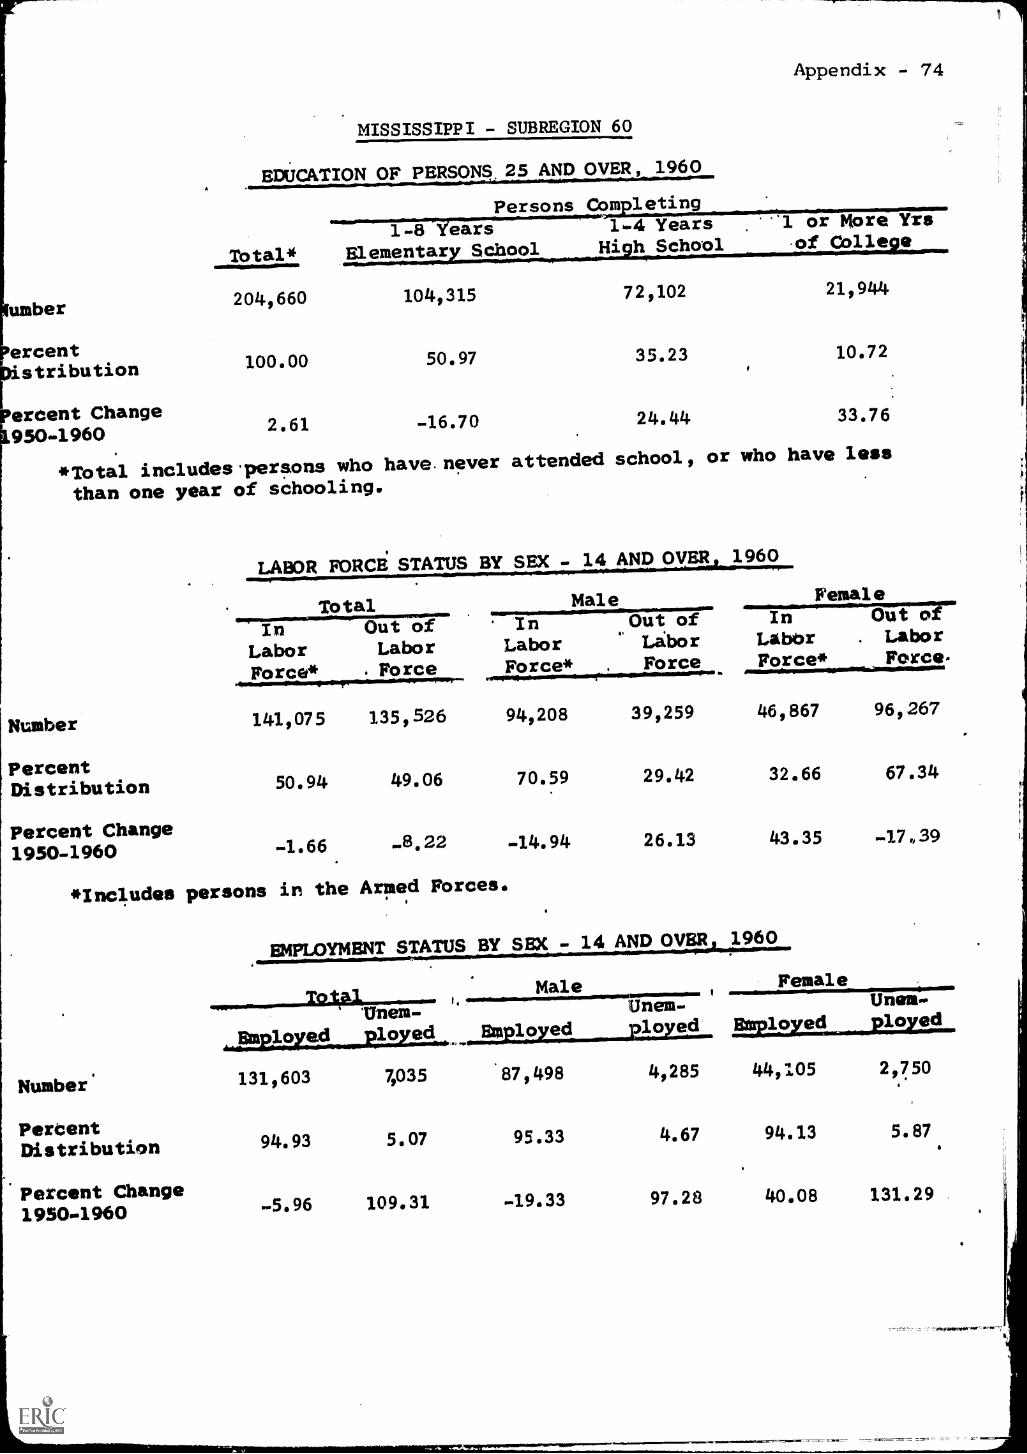
Appendix - 74
MISSISSIPPI - SUBREGION 60
EDUCATION OF PERSONS 25 AND OVER, 1960
Total*
Persons Completing-'1 or More Yrs
of Colle e1:6 Years
Elementar School
'1-4 YearsHi h School
umber204,660 104,315 72,102 21,944
ercentstribution
100.00 50.97 35.23 10.72
ercent Change950-1960
2.61 -16.70 24.44 33.76
*Total includes.persons who have.never attended school, or who have less
than one year of schooling.
LABOR FORCE STATUS BY SEX - 14 AND OVER4 1960
Total Male Female
In Out of In Out of In Out of
Labor Labor Labor Labor Labor . Labor
Force* . Force Force* . Force Force* Force.Air
Number 141,075 135,526 94,208 39,259 46,867 96,267
PercentDistribution 50.94 49.06 70.59 29.42 32.66 67.34
Percent Change1950-1960 -1.66 -8.22 -14.94 26.13 43.35 -1739
*Includes persons in the Armed Forces.
EMPLOYMENT STATUS BY SEX - 14 AND OVER .1960
Tot*_ Male 1Female
i.`Unem- Unem- Unseat-
0:42Z2A- 1° et....../.1...-ELZ---4)ed
Number' 131,603 7,035 .87,498 4,285
PercentDistribution 94.93 5.07 95.33 4.67
Percent Change1950-1960 -5.96 109.31 -19.33 97.28
44,105 2,750
94.13 5.87
40.08 131.29
"IIIMIIMall1.21G--7-00.1.0,1C

Appendix - 75
PERCENT CHANGE 1962-1965 IN WORK FORCE,EMPLOYMENT AND UNEMPLOYMENT,
AND 1962-1965 RATE OF UNEMPLOYMENTAPPALACHIAN & NON-APPALACHIAN
PORTION OF STATE(All Numbers in Thousands)
Total Work Force
1965 Change 1962-65Number Number Percent
Mississippi 773.6 17.1 2.3
Non-Appalachian Portion 624.2 14.8 2.4
Appalachian Portion 149.4 2.3 1.6
Total Employment
1965 Change 1962-65Number Number Percent
Mississippi 737.6 30.3 4.3
Non-Appalachian Portion 596.5 24.5 4.3
Appalachian Portion 141.1 5.8 4.3
Unemployment
1965 Change 1962-65Number Number Percent
Mississippi 36.0 -13,2 -26.8
Non-Appalachian Portion 27.7 -9.7 -25.9
Appalachian Portion 8.4 -3.4 -28.8
1962
Rate of Unemployment
19651963 1964
Mississippi 6.5 6.2 5.7 4.7
Non-Appalachian Portion 6.1 6.2 5.4 4.4
Appalachian Portion 8.0 6.3 7.0 5.6

Appendix - 76
MANUFACTURING EMPLOYMENT AND VALUE ADDED BY MANUFACTURE, 1954, 1958, AND 1963,
AND PERCENT CHANGE, 1954-1958 AND 1958-1963
Manufacturing Employment
Value Added by Manufacture
Number
Percent Change
Number ($1,000)
Percent Change
1954
1958
1963
1954-
1958-
1954
1958
1963
1954-
1958-
1958
1963
1958
1963
MISSISSIPPI - STATE TOTAL
90,641
108,539
128,506
19.7
18.4
467,625
642,175
1,016,962
37.3
58.4
APPALACHIAN PORTION
19,538
25,772
36,007
31.9
39.7
71t365
127,675
242,960
78.9
90.3
Mississippi - 60
19,538
25,772
36,007
31.9
39.7
_.....-
71,365
127,675
242,960
78.9
90.3
Alcorn
1,748
1,974
2,833
12.9
43.5
-3770
9,831
19,783
TOTT
fUTTY
Benton
179
237
213
32.4
- 10.1
418
655
613
56.7
-6.4
Chickasaw
1,034
1,566
2,264
51.5
44.6
3,858
9,782
16,089
153.9
64.5
Choctaw
130
332
541
155.3
63.0
603
963
1,707
59.7
77.3
Clay
1,749
1,946
2,203
11.3
13.2
8,137
13,326
21,672
63.8
62.6
Itawamba
879
930
1,910
5.8
105.4
2,147
2,950
8,237
37.4
179.2
Kemper
184
107
119
- 41.8
11.2
388
208
255
- 46.4
22.6
Lee
3,133
4,205
5,987
34.2
42.4
15,909
26,720
44,386
68.0
66.1
Lowndes
2,904
3,714
4,078
27.9
9.8
12,217
20,596
32,465
68.6
57.6
Marshall
249
1,080
1,473
333.7
36.4
839
3,908
9,900
365.8
153.3
Mbnroe
1,733
2,959
4,172
70.7
41.0
5,253
8,530
27,561
62.4
123.1
Noxubee
461
391
686
- 15.2
75.4
4,236
1,316
3,534
- 68.9
168.5
Oktibbeha
729
662
838
- 32.0
26.6
2,646
3,778
8,514
42.8
125.4
Pontotoc
492
608
915
23.6
50.5
1,389
2,108
3,771
51.8
78.9
Prentiss
784
1,302
2,078
66.1
59.6
1,906
4,521
10,408
137.2
130.2
Tippah
433
791
1,618
82.7
104.6
1,012
3,744
7,858
270.0
109.9
Tishomingo
573
1,155
1,351
101.6
17.0
2,087*
4,713*
7,229*
125.8
53.4
Union
1,057
1,148
1,588
8.6
38.3
2,972
5,656
10,566
90.3
86.8
Webster
307
243
567
- 20.8
133.3
1,218
784
3,099
- 35.6
295.2
Winston
780
422
573
- 45.9
35.8
3,603
3,586
5,313
-0.5
48.2
Source:
Census of Manufactures, 1954, 1958, and 1963.
*Actual census data were not available for the county because of the "dis(losure rule."
Therefore, estimates were made based on projections of
data for available years and/or on the state averages of value added per employee for the predominant industry groups.

Appendix - 77
MISSISSIPPI - SUBREGION 60
NUMBER OF ESTABLISHMENTS IN SELECTED SERVICES
AND SALES 1963 AND PERCENT CHANGE 1958-1963
All Establishments
Personal Services
Auto Repair, Garages
Other Services
EstablishmentsPercentChange1958-63
Number1963*
1 757 40.22
809 31.33
334 78.61
614 36.44
Receipts
Value1963*
27 825
INA
INA
INA
*Details may not add to total because of disclosure rule.
NUMBER OF WHOLESALE ESTABLISHMENTS AND
SALES 1963, AND PERCENT CHANGE 1958-1963
All Establishments
Merchant Wholesalers
Other Operating Types
Establishments
Number1963*
($1000)PercentChange1958-63
48.57
INA
INA
INA
Sales ($1000)
Percent Percent
Change Value Change
1958-63 1963* 1958-63
450 25.00 210 457 34.97
284 40.59 132,495 67.63
166 5.06 71,305 - 3.95
*Details may not add to total because of disclosure rule.

Appendix - 78
MISSISSIPPI - SUBREGION 60
NUMBER OF RETAIL ESTABLISHMENTS AND SALES 1963,
AND PERCENT CHANGE 1958-1963
($1000)Establishments Sales
Number1963*
PercentChange1958-63
Value1963*
PercentChange1958.63
ALL STORES 3,958 7.79 325,656 36.75
Lumber, bldg. materials, etc. 184 -13.21 29,866 26.76
General merchandise 291 -48.86 26,014 -4.87
Food stores 1;283 27.03 76,996 42.76
Automotive dealers 332 41.28 71,718 68.94
Gasoline service stations 484 12.04 28,890 31.27
Apparel, accessory stores 237 19.10 20,004 35.89
Furniture, home furnishings, etc. 188 5.62 14,250 26.31. .
Eating, drinking places 353 8.95 9,712 16.03
Drug stores, proprietary stores 109 - 9.17 10,750 23.15
Other retail stores 366 11.93 23,494 56.87
Non-store retailers 131 98.48 7,032 359.61
*Details may not add to tOtal because of disclosure rule.

Number
PercentDistribution
Percent Change1950-1960
Number
PercentDistribution
Percent Change1950-1960
Appendix - 79
NEW YORK -- STATE TDTAL
POPULATION BY SEX, 1960
Total Male Female
16,783,604 8,120,755 8,662,849
100.00 48.39 51.61
13.17 12.17 14.13
POPULATION ,BY PLACE 1960
TotalRural RuralNon-Farm Farm Urban
16,783,604 2,125,633 324,746
100.00 12.66 1.93
13.17 35.38 -43.78
DISTRIBUTION OF FAMILIES BY INCOME , 1960
14,333,225
85.40 .
13.02
Under $2,000- $3,000- $6,000- $10,000
Total ,$2,000 $2,999 $5,999 luta_ Over
Number 4,336,041
PercentDistribution 100.00
Percent Change1950-1960 12.27
334,741 265,495 1,382,375 1,491,011 862,419
7.72 6.12 31.88 34.39 19.89
-53.03 -60.65 -15.17 238.27 390.16

NEW YORK -- STATE TOTAL
EDUCATION OF PERSONS 25 AND OVER 1960
Persons Com leting
Total*1-8 ears 1-4 Years
umber 10,124,045 3,521,970 4,541,645
ercentstribution 100.00 34.79 44.86
ercent Change950-1960 7.29 25.71
Appendix 80
i or More Yrsof College
1, 706 404 .
16.85
36.96
*Total includes.persons who have never attended school, or who have less
than one year of schooling.
LABOR FORCE STATUS BY SEX - 14 AND OVER 1960
TotalIn Out of
Labor LaborForce* . Force
MaleIn Out ofLabor LaborForce* Force
Number
Percent
6,999,450 5,389,255 4,595,110 1,287,090
Distribution56.50 43,50 78,12 21.88
Percent Change1950-1960
10.18 1.73 4.30 6.26
*Includes persons in the Armed Forces.
FemaleIn Out of
Labor LaborForce* Force
2,494,340 4,102,165
EMPLOYMENT STATUS BY SEX . 14 ANDOVER 1960
36.95 63.05
23.48
Male Female
0.39
rnem-ployed
Unem-Evloyed ployed
Number 6099,462 358,873 4,330,216 224,752 2,269,246 134,121
PercentDistribution 94,84 5.16 95.07 4.93 94.42 '5.58
Percent Change1950.1960 11.02 -5.80 5.64 -19.92 22.99 33.75
1

NEW YORK - STATE TOTALAppendix - 81
NUMBER OF ESTABLISHMENTS IN SELECTED SERVICES
AND SALBS 1963 AND PERCENT CHANGE 1958-1963
All Establishments
Personal Services
Auto Repair, Garages
Other Services
Establishments
Number1963*
ReceiptsPercentChange Value1958-63 1963*
($1000)
PercentChange1958-63
107,416 -1.75 9,012,675 34.26
48,939 -3.73
9,984 3.81 INA
48,.493 -0.78 INA
INA
*Details may not add to total because of disclosure rule.
NUMBER OF WHOLESAIE ESTABLISHMENTS AND
SALES 1963, AND PERCENT CHANGE 1958-1963
All Establishments
Merchant Wholesalers
Other Operating Types
Establishments SalesPercent
Number Change Value1963* 1958-63 1963*
4%240 0.09 66,207,771
32,096 2.36 30,425,807
8,064 -8.04 35,781,964
*Details may not add to total because of disclosure rule.
INA
INA
INA
($1000)
PercentChange1958-63
20.61
22.70
18.89

Appendix - 82
NEW YORK -- STATE TOTAL
NUMBER OF RETAIL ESTABLISHMENTS AND SALES 1963,
AND PERCENT CHANGE 1958-1963
Establishments Sales 01000Percent
Number Change1963* 1958-63
Value1963*
PercentChange1958-63
ALL STORES 164 480 -10.21 23 977 310 15.31
Lumber, bldg. materials, etc. 6,630 -16.53 889,140 -1.52
General merchandise, 4,502 -32.62 3,078,811 38.56
Food stores 35,817 -16.33 6,085,713 10.40
Automotive dealers 5,603 -3.71 3,190,542 33.74
Gasoline Service stations 12,010 -3.80 1,135,182 19.99
Apparel, accessory stores 16,271 -5.43 2,029,873 2.43
Furniture, home furnishings, etc. 9,297 -11.47 1,168,731 3.74
Eating, drinking places 35,026 -5.19 2,551,122 15.25
Drug stores, proprietary stores 5,525 -7.11 700,766 16.74
Other retail stores 26,292 -6.05 2,521,379 8.56
Non-store retailers 7,507 -15.23 626,051 8.01
*Details may not add to total because of disclosure rule.
I I

Number
PercentDistribution
Percent Change1950-1960
Number
PercentDistribution
Percent Change1950-1960
Number
PercentDistribution
Percent Change1950-1960
Appendix - 83
APPAIACHIAN PORTION OF NEW YORK
POPULATION LY Si3X, 1960
Total Male
1,000,064 491,906 508,158
100.00 49.19 50.81
9.00 7.91 10.08
POPULATION BY PLACE, 1960
TotalRural
Non-FarmRuralFarm Urban
1,000,064 400,598 94,444 505,022
100.00 40.06 9.44 50.50
9.00 43.08 -43.29 7.23
DISTRIBUTION OP FAMILIES BY INCOME, 1960
Under $2,000- $3,000. $6,000- $10,000Total ALIalz $2,999 151999 $9,999 Ovor
250,245 24,394 19,026 93,796 82,422 30,607
100.00 9.75 7.60 37.48 32.94 12.23
7.73 -56.49 -61.27 0.66 368.44 539.64
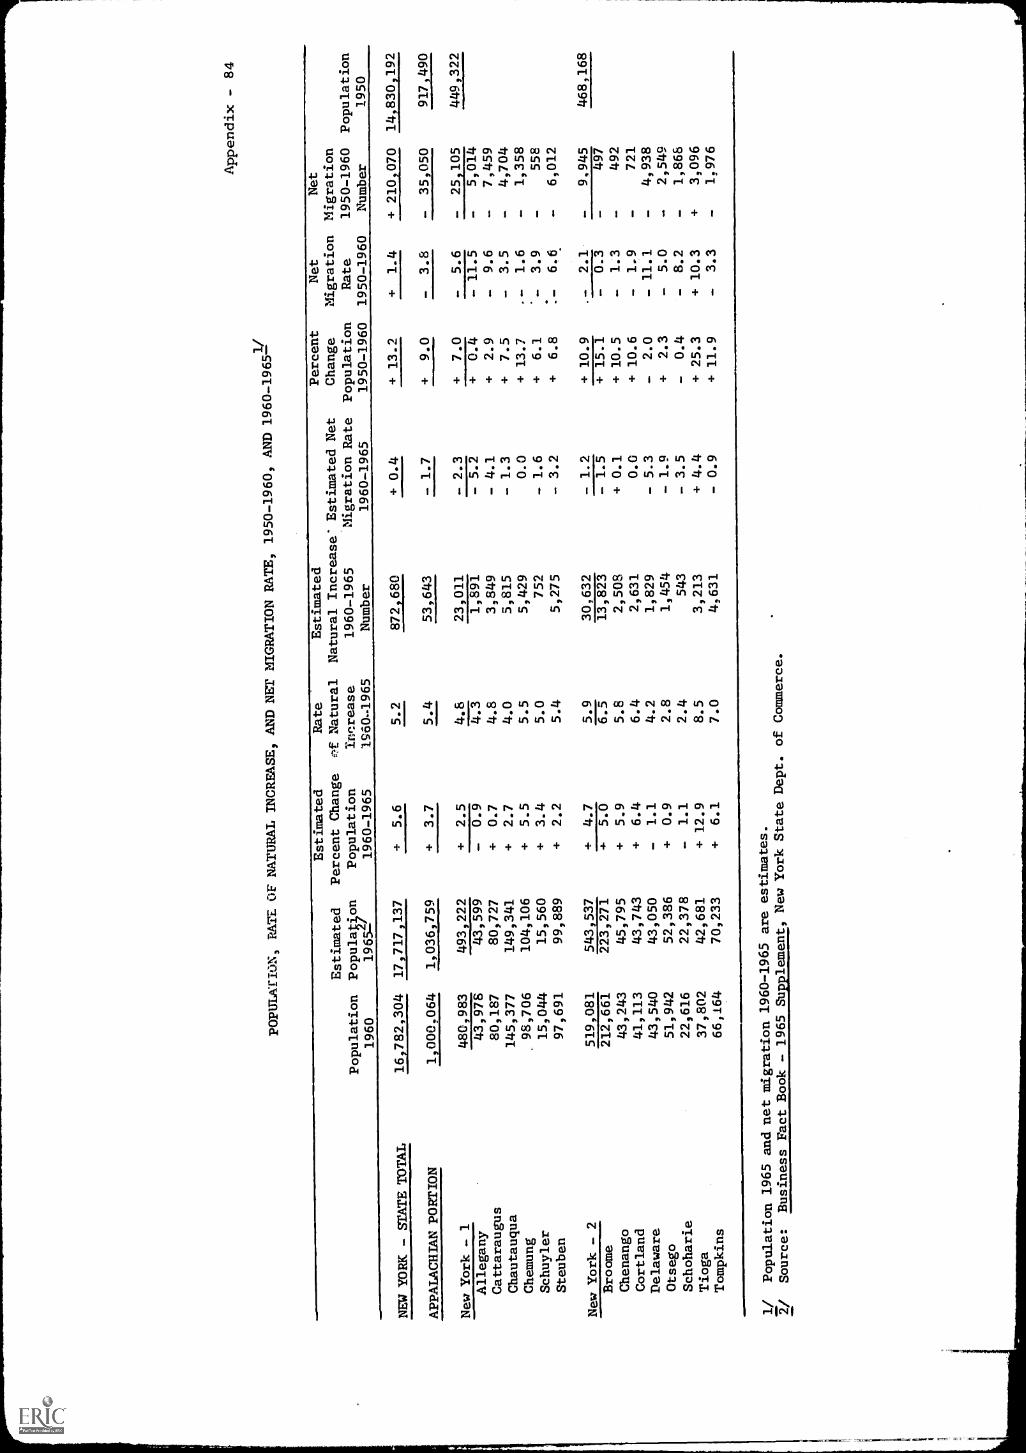
POPULATION, RATE OF NATURAL INCREASE, AND NET MIGRATION
RATE, 1950-1960, AND 1960-1965-1/
Appendix - 84
Population
1960
Estimated
PopulaVlon
1965-/
Estimated
Percent Change
Population
1960-1965
Rate
Natural
Imrease
1960-1965
Estimated
Natural Increase' Estimated Net
1960-1965
Migration Rate
Number
1960-1965
Percent
Change
Population
1950-1960
Net
Migration
Rate
1950-1960
Net
Migration
1950-1960
Number
Population
/950
NEW YORK - srArE TOTAL
16 782,304
17,717,137
-u
5.6
5.2
872 680
+0.4
+ 13.2
+1.4
+ 210 070
14 830,192
APPALACHIAN PORTION
1,000,064
1,036,759
+3.7
5.4
53,643
-1.7
+9.0
-3.8
35,050
917,490
New York - 1
480,983
493,222
+2.5
4.8
23,011
- 2.3
+7.0
-5.6
-25 105
449,322
Allegany
43,978
43,599
-0.9
4.3
1,891
- 5.2
+0.4
- 11.5
-5,014
Cattaraugus
80,187
80,727
+0.7
4.8
3,849
- 4.1
2.9
-9.6
-7,459
Chautauqua
145,377
149,341
+2.7
4.0
5,815
- 1.3
+7.5
-3.5
-4,704
Chemung
98,706
104,106
+ 55
5.5
5,429
0.0
+ 13.7
.-
1.6
-1,358
Schuyler
15,044
15,560
+3.4
5.0
752
- 1.6
+6.1
-3.9
558
Steuben
97,691
99,889
+2.2
5.4
5,275
- 3.2
+6.8
.-
6.6
-6,012
New York - 2
519,081
543,537
+4.7
5.9
30,632
- 1.2
+ 10.9
-2.1
-9,945
468,168
Broome
212,661
223,271
+5.0
6.5
13,823
- 1.5
+ 15.1
-0.3
497
Chenango
43,243
45,795
+ 59
5.8
2,508
+ 0.1
+ 10.5
-1.3
492
Cortland
41,113
43,743
+6.4
6.4
2,631
0.0
+ 10.6
-1.9
721
Delaware
43,540
43,050
-1.1
4.2
1,829
- 5.3
-2.0
- 11.1
-4,938
Otsego
51,942
52,386
+0.9
2.8
1,454
- 1.9
+2.3
-5.0
-2,549
Schoharie
22,616
22,378
-1.1
2.4
543
- 3.5
-0.4
-8.2
-1,868
Tioga
37,802
42,681
+ 12.9
8.5
3,213
+ 4.4
+ 25.3
+ 10.3
+3,096
Tompkins
66,164
70,233
+6.1
7.0
4,631
- 0.9
+ 11.9
-3.3
-1,976
1/
Population 1965 aad net migration 1960-1965 are estimates.
2/
Source:
Business Fact Book - 1965 Supplement, New York State Dept. of
Commerce.

Appendix.- 85
APPA1ACHIAN PORTION OF NEW YORK
EDUCATION OF PERSONS 25 AND OVER , 1960
Persons.amEleting."--.7.747.fears 1-4 Years 1 or More Yrs
Total* Elementar School Hi h Sch6o1 of College...
Number 560,786 192,921 272,101
PercentDistribution 100.00 34.40 48.52
Percent Change1950-1960 3.27 -10.85 18.06
*Total includes.persons who have neverthan one year of schooling.
88 9919
15.86
22.51
attended school, or who have less
LABOR FORCE STATUS BY SEX - 14 AND OVER 1960
Total Male Female
In Out of In Out of In Out of
Labor Labor Labor Labor Labor Labor
Force* . Force Force* Force,
Force* Force
plumber 391,917 319,792 261,255 83,307
PercentDistribution 55.07 44.93 75. 82 24. 18
Percent Change1950-1960 0 6 1.87 -O. 41 6.72
*Includes persons in the Armed Forces.
130,662 235, 585
35. 68 64..33
24.05 -0.12
EMPLOYMENT STATUS BY SEX - 14 AND OVER 1960
Male Female.........
1TwO;unem-Unem-
aLmasm.1.3 Employed ployed.
Number' 371,044 20,563 247,650 13,280
PercentDistribution 9/475 5.25 94.91 5. 09
'Percent Change1950-1960 5. 92 20.87 -0.81 7.54
EmployedUnem-ployed
123,394 7,256
94. 45 5..55
22.62 55.61

Appendix - 86
PERCENT CHANGE 1962-1965 IN WORK FORCE,EMPLOYMENT AND UNEMPLOYMENT,
AND 1962-1965 RATE OF UNEMPLOYMENTAPPALACHIAN & NON-APPALACHIAN
PORTION OF STATE(All Numbers in Thousands)
Total Work Force
1965 Change 1962-65Number Number Percent
New York 7,880.0 135.0 1. 7
Non-Appalachian Portion 7,471.5 134.3 1.8
Appalachian Portion 408.5 0.7 0.2
Total Employment
1965 Change 1962-65Number Number Percent
New York 7,515.0 170.0 2. 3
Non-Appalachian Portion 7,123.8 162.6 2.3
Appalachian Portion 391.2 7.4 1. 9
Unemployment
1965 Change 1962-65Number Number Percent
New York 365.0 - 35.0 - 8.8
Non-Appalachian Portion 347.7 - 28.3 - 7.5
Appalachian Portion 17.3 6.7 - 27.9
1962
Rate of Unemployment
19651963 1964
New York 5.2 5.4 5.1 4.6
Non-Appalachian Portion 5.1 5.4 5.1 4.7
Appalachian Portion 5.9 5.7 5.0 4.2

-
Appendix - 87
MANUFACTURING EMPLOYMENT AND VALUE ADDED BY MANUFACTURE, 1954, 1958, AND 1963,
AND PERCENT CHANGE, 1954-1958 AND 1958-1963
Nhnufacturing Employment
Value Added by Manufacture
Number
Percent Change
Number ($1,000)
Percent Change
1954
1958
1963
1954-
1958
1958-
1963
1954
1958
1963
1954-
1958
1958-
1963
NEW YORK - STATE TOTAL
1,895,982
1.915 877
1,853,050
1.0
-3.3
14,140,524
15,892,629
19,559,120
12.4
23.1
APPALACHIAN PORTION
132 373
128 811
123 496
-2.7
-4.1
924 718
1,007,881
1,152,166
9.0
14.3
New York - 1
66 864
61 963
59 156
-7.3
-4.5
498 724
509 145
571 915
2.1
12.3
Allegany
3,236
3,130
2,836
-3.2
-9.4
25,909
29,388
32,123
13.4
9.3
Cattaraugus
8,839
8,466
7,600
-4.0
- 10.4
56,382
60,781
71,193
7.8
17.1
Chautauqua
22,918
20,425
19,208
-9.9
-6.9
162,708
165,903
178,810
2.0
7.8
Chemung
16,203
14,962
13,709
7.6
-8.4
132,627
135,065
144,875
1.8
7.2
Sdhuyler
1,201
1,190
1,042
-0.9
- 12.4
9,722
14,275
13,588
46.8
-4.8
Steuben
14,467
13,790
14,761
-4.4
6.8
111,376
103,723
131,316
- 6.8
26.5
New York - 2
65,509
66,848
64 340
1.0
-3.8
425 994
498 736
580 251
17.1
16.3
Broome
41,876
39,646
34,016
-4.9
- 14.5
268,720
242,601
251,561
- 9.7
3.6
Chenango
4,247
4,037
4,568
-4.4
12.5
38,014
55,113
72,724
44.9
32.0
Cortland
5,104
4,780
5,746
-6.9
21.0
33,472
34,770
53,624
3.8
54.2
Delaware
5,809
5,710
7,207
-1.7
26.2
36,025
46,206
62,859
28.3
36.0
Otsego
1,788
1,511
1,423
- 15.4
-5.8
8,391
8,985
11,673
7.0
29.9
Schoharie
620
1,085
650
75.0
- 40.1
3,113
10,154
4,271
226.2
- 57.9
Tioga
1,524
4,541
5,224
197.9
15.0
8,274
57,176
74,789
591.0
30.8
Tompkins
4,541
5,538
5,506
21.9
- 0.6
29,985
43,731
48,750
45.8
11.5
Source:
Census of Mhnufactures, 1954, 1958, and 1963.
ti

Appendix - 88APPALACHIAN PORTION OF NEW YORK
NUMBER OF ESTABLISHMENTS IN SELECTED SERVICES
AND SALES 1963, AND PERCENT CHANGE 1958-1963
Establishments Receipts ($1000)
PercentNumber Change1963* 1958-63
Value1963*
PercentChange1958-63
All Establishments 5 922 9.83 138 695 29.95
Personal Services 2 770 15.37 INA INA
Auto Repair, Garages 850 11.99 INA INA
Other Services 2,302 3.14 INA INA
*Details may not add to total because of disclosure rule.
NUMBER OF WHOLESALE ESTABLISHMENTS AND
SALES 1963 AND PERCENT CHANGE 1958-1963
Establishments Sales ($1000)
Percent Percent
Number Change Value Change
1963* 1958-63 1963* 1958-63
All Establishments 1 142 2.06 782 695 17.59
Merchant Wholesalers 809 - 0.25 408,411 6.94
Other Operating Types 333 8.82 372,387 31.27
*Details may not add to total because of disclosure rule.

APPALACHIAN PORTION OF NEW YORK
NUMBER OF RETAIL ESTABLI HMENTS AND SALES 1963,
AND PERCENT CHANGE 1958-1963
Appendix - 89
($1000)
411110111111111M.
Establishments Sa les
Number1963*
PercentChange1958-63
Value1963*
PercentChange1958-63
ALL STORES 10 686 - 6.3] 1.341,834 15.39
Lumber, bldg. materials, etc. 664 -19.22 93,623 9.71
General merchandise 365 -30.08 141,707 29.99
Food stores 1,834 - 8.71 327,382 10.06
Automotive dealers 703 - 2.90 261,291 27.46
Gasoline service stations 1,271 1.11 89,161 16.70
Apparel, accessory stores 695 - 8.19 67,479 4.89
Furniture, home furnishings, etc. 546 -13.88 51,737 1.64
Eating, drinking places 2,336 - 0.26 96,124 16.11
Drug stores, proprietary stores 277 1.09 33,800 8.59
Other retail stores 1,607 - 6.02 148,505 7.37
Non-store retailers 388 9.30 31,025 39.94
*Details may not add to total because of disclosure rule.

Appendix - 90
NORM CAROLINA - STATE TOTAL
POPULATION BY SEX1 1960
Total Male Female
Number 4,556,155 2,246,876 2,309,279
PercentDistribution 100.00 .49.32 50,68
Percent Change1950-1960 12.17 11.39 12.93
POPULATION BY PLACE 1960
Rural RuralTotal Non-Farm Farm Urban
Number 4,556,155 1,945,855 808,379 1,801,921
PercentDistribution 100.00 42.71 17.74 39.55
Percent Change1950-1960 12.17 47.72 -41.28 31.78
DISTRIBUTION OF FAMILIES BY INCOME 1960
Under . $2,000- $3,000- $6,000- $10,000Total $2,999 ,$5,999 ,$9,999 & Over
Number
,$2,000'
1,091,656 261,168 144,411 388,754 221,471 75,852
PercentDistribution 100.00 23.92 13,23 35.61 20.29 6.95
Percent Change1950-1960 16.23 -38.43 -22.24 65.97 432. 83 402. 00

NORrl CAROLINA - STATE Tarn
EDUCATION OF PERSONS 25 AND OVER , 1960
Appendix - 91
Total*
Persons8110111m
completing1-4 Years
Hi h School1 or More Yrsof Colle e
l=r7earsElementar School
ber 2,307,171 1,099,825 828,496 308,023
ercentstribution 100.00 47.67 35.91 13.35
ercent Change950-1960 14.21 -2.87 48.53 38.67
*Total includes.persons who have never attended school, or who have less
than one year of schooling.
LABOR FORCE STATUS BY SEX - 14 AND OVER 1960
Total Male
In Out of 'In Out of
Labor Labor Labor Libor
Force* . Force Force* Force. 9
.
FemaleIn Chit of
Labor LaborForce* Forec
Number 1,754,362 1,364,164 1,154,311 363,494 600,051 1,000,670
PercentDistribution 56.26 43.74 76.05 23.95 37.49 62.51
Percent Change1950-1960 12.83 7.38 3.62 31.68 36.10 0.63
Includes persons in the Armed Forces.
EMPLOYMENT STATUS BY SEX - 14 AND OVER 1960
Male Female
E.Liapdio
1,
'Unem-Employed
Unem-ployed Employed
Unent-pl oat.
Number' 1,605,478 74,964 1,042,511 38,709 562,967 36,255
PercentDistribution 95.54 4.46 96.42 3.58 93.95 6.05
Percent Change1950-1960 51.48 51.22 -.26 36.35 34.65 71.16
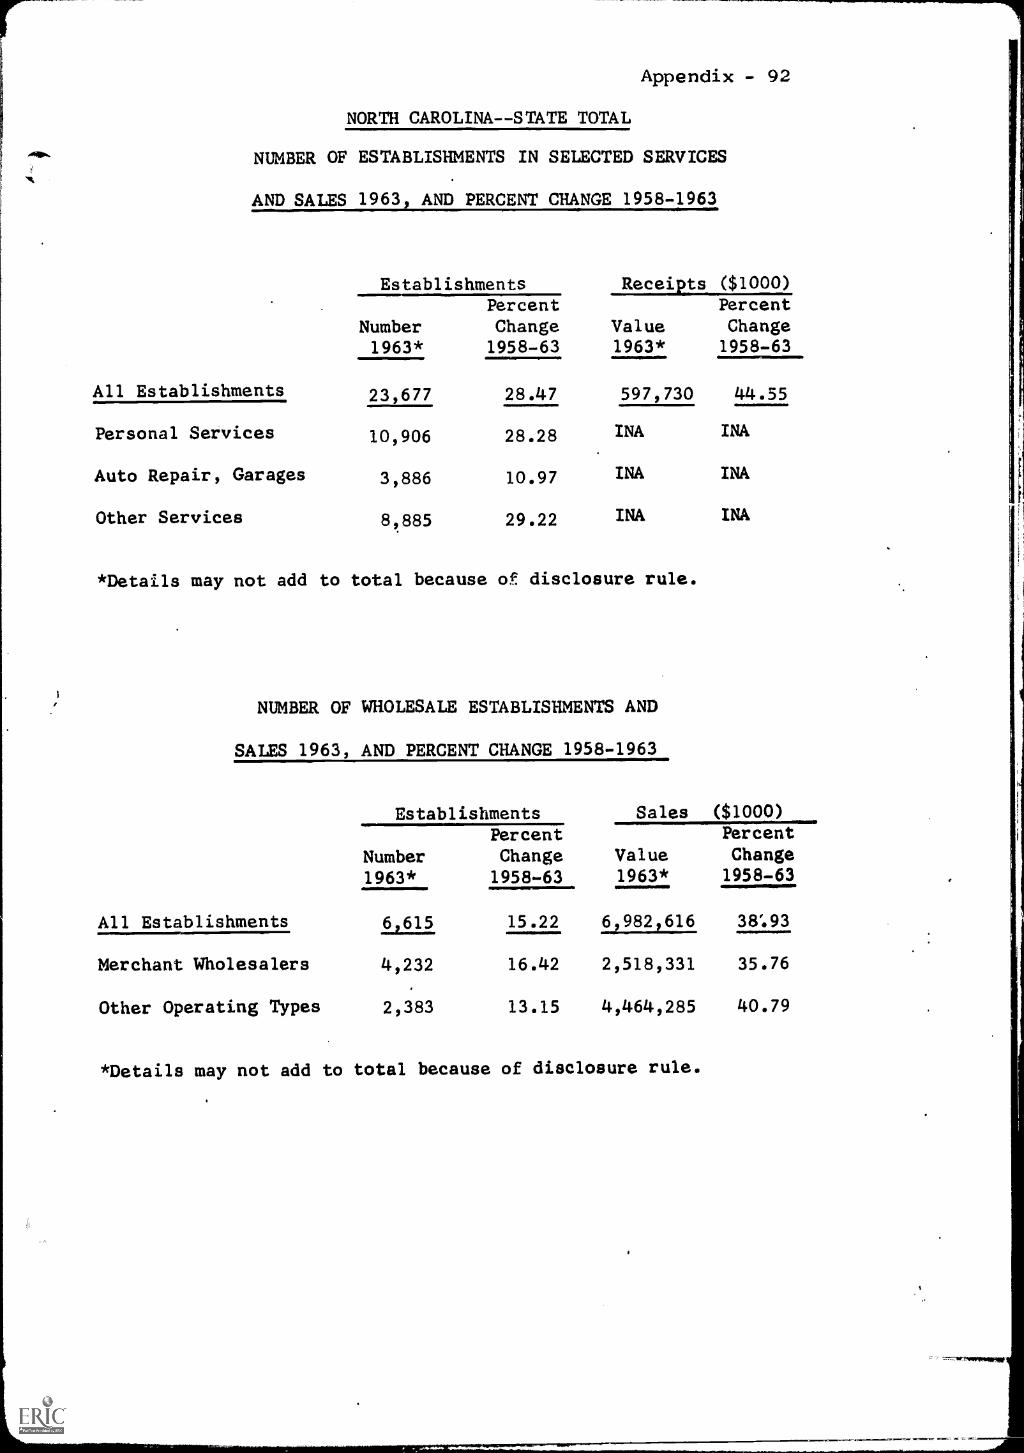
Appendix - 92
NORTH CAROLINA--STATE TOTAL
NUMBER OF ESTABLISHMENTS IN SELECTED SERVICES
AND SALES 1963, AND PERCENT CHANGE 1958-1963
Establishments
Number
ReceiptsPercentChange Value
($1000)
PercentChange
1963* 1958-63 1963* 1958-63
All Establishments 23,677 28.47 597,730 44.55
Personal Services 10,906 28.28 INA INA
Auto Repair, Garages 3,886 10.97 INA INA
Other Services 8,885 29.22 INA INA
*Details may not add to total because or. disclosure rule.
NUMBER OF WHOLESALE ESTABLISHMENTS AND
SAIES 1963, AND PERCENT CHANGE 1958-1963
All Establishments
Merchant Wholesalers
Other Operating Types
Establishments
Number1963*
62_615
4,232
2,383
Sales ($1000)
PercentChange Value1958-63 1963*
15.22
16.42
13.15
6,984616
2,518,331
4,464,285
*Details may not add to total because of disclosure rule.
PercentChange1958-63
38:93
35.76
40.79

Appendix - 93
NORTH CAROLINA - STATE TOTAL
NUMBER OF RETAIL ESTABLISHMENTS AND SALES 1963,
AND PERCENT CHANGE 1958-1963
Establishments Sales ($1000)Percent
Number Change1963* 1958-63
PercentValue Change1963* 1958-63
ALL STORES 43,857 6.20 4,975,282 29.66
Lumber, bldg. materials, etc. 1,733 -6.27 353,749 20.53
General merchandise 2,409 -44.16 538,178 10.82
Food stores 11,928 18.11 1,160,182 32.68
Automotive dealers 2,871 20.58 1,029,802 54.15
Gasoline bervice stations 6,662 9.02 421,058 35.84
Apparel, accessory stores 2,603 4.92 288,136 24.13
Furniture, home furnishings, etc. 2,486 3.71 245,635 26.14
Eating, drinking places 4,964 5.42 227,341 36.83
Drug stores, proprietary stores 1,072 4.48 152,308 23.12
Other retail stores5,223 14.44 446,252 14.82
Non-store retailers1,906 39.63 112,641 12.48
*Details may not add to tOtal because of disclosure rule.
7-s**

Appendix - 94
APPALACHIAN PORTION OF NORTH CAROLINA
POPULATION BY SEX, 1960
Total Male Female
Number939,740 459,106 480,634
PercentDistribution
100.00 48.85 51.15
Percent Change1950-1960
6.60 5.50 7.67
POPULATION BY PLACE, 1960
Rural RuralTotal Non-Farm Farm Urban
Number 939,740 504,060 151,262 284,418
PercentDistribution 100.00 53.64 16.10 30.27
Percent Change1950-1960 6.60 46.45 -49.95 20.94
DISTRIBUTION OF FAMILIES BY INCOME, 1960
Under $2,000- $3,000- $6,000- $10,000Total $2,00O $2,999 ,$9,999 & Over
Number 236,683 54,105 31,594 86,698 47,998 16,288
PercentDistribution 100.00 22.86 13.35 36.63 20.28 6.88
Percent Change1950-1960 13.33 -46,37 -24.53 85.83 521.74 515.80

Appendix - 95
POPULATION, RATE OF NATURAL INCREASE, AND NET MIGRATION RATE, 1950-1960, AND 1960-1965-1/
'Estimated
-Rate
hstimated
Natural Increase
'
1960-1965
Number
Estimated Net
Migration Rate
1960-1965
Percent
Change
Population
1950-1960
Net
Migration
Rate
1950-1960
Net
Migration
1950-1960
Number
Population
1950
Population
1960
Estimated
Population
19652(
Percent Change
Population
1960-1965
of Natural
Increase
1960-1965
NORTH CAROLINA - STATE TOTAL
4,556,155
4,912,195
+7.8
7.6
346,268
+0.2
+ 12.2
-8.1
- 327,987
4,061,929
APPALACHIAN PORTION
939,740
993,443
+5.7
6.4
59,903
-0.7
+6.6
-9.6
-84,691
881,560
North Carolina - 43
69,395
68,992
-0.6
5.2
3,601
-5.8
-9.3
- 24.3
-18,576
76,452
Cherokee
16,335
16,249
-0.5
3.9
637
-4.4
- 10.7
- 24.9
-4,551
Clay
5,526
5,141
-7.0
3.9
216
- 10.9
-8.0
- 23.4
-1,403
Gtaham
6,432
6,211
-3.4
7.2
463
- 10.6
-6.6
- 24.7
-1,704
Jackson
17,780
17,968
+1.1
5.4
960
-4.3
-7.7
- 21.3
-4,111
Macon
14,935
14,656
-1.9
4.5
672
-6.4
-7.7
- 21.9
-3,935
Swain
8,378
8,767
+4.6
7.8
653
-3.2
- 15.5
- 33.0
-3,272
North Carolina - 44
239,537
254,232
+6.1
5.6
13L345
0.5
+4.8
-9.3
21 224
-228 671
Buncombe
130,074
139,753
+7.4
5.3
__---
6,894
+2.1
+4.6
8.2
-10,206
Haywood
39,711
41,243
+3.9
6.6
2,621
-2.7
+5.5
- 10.5
-3,957
Henderson
36,163
39,137
+8.2
5.2
1,880
+3.0
+ 17.0
+2.8
+897
Nhdison
17,217
15,938
-7.4
4.1
706
- 11.5
- 16.1
- 27.2
-5,577
Transylvania
16,372
18,161
+ 10.9
7.6
1,244
+3.3
+7.8
- 15.4
-2,341
North Carolina - 45
83,228
84 366
+1.4
5.6
4,662
-4.2
-0.6
- 16.5
-13,783
83,703
McDowell
26,742
27,690
+3.5
6.5
1,738
-3.0
+4.0
- 16.0
-4,127
Polk
11,395
11,338
-0.5
3.5
399
-4.0
-2.0
- 13.6
-1,587
Rutherford
45,091
45,338
+0.5
5.6
2,525
-5.1
-2.7
- 17.4
-8,069
North Carolina - 46
57,452
56 708
-1.3
5.7
3,269
-7.0
-9.0
- 24.2
-15,286
63 143
Avery
12,009
12,012
0.0
6.4
769
-6.4
- 10.1
- 26.3
-3,511
Mitchell
13,906
12,987
-6.6
4.4
612
- 11.0
-8.2
- 23.2
-3,517
Watauga
17,529
18,560
+5.9
6.3
1,104
-0.4
-4.4
- 19.8
-3,626
Yancey
14,008
13,149
-6.1
5.6
784
- 11.7
- 14.1
- 28.4
-4,632

POPULATION, RATE OF NATURAL INCREASE, AND NET MIGRATION RATE, 1950-1960, AND
1960-196521
Appendix - 96
Population
1960
Estimated
Populaon
1965-f
Estimated
Percent Change
Population
1960-1965
Rate
of Natural
Increase
1960-1965
Estimated
Natural Increase
1960-1965
Number
Estimated Net
Migration Rate
1960-1965
Percent
Change
Population
1950-1960
et
Migration
Rate
1950-1960
et
Migration
1950-1960
Number
Population
1950
NORM CAROLINA (Cont'd.)
North Carolina - 47
117,878
129,236
+9.6
7.4
8,781
+2.2
+ 14.0
-4.4
-4,582
103 424
Alexander
15,625
16,533
+5.8
6.7
1,047
-0.9
+7.4
-8.1
-1,177
---L-_-
Burke
52,701
58,163
4 10.4
6.4
3,373
+4.0
+ 15.8
-0.9
-394
Caldwell
49,552
54,540
4 10.1
8.8
4,361
41.3
4 14.3
-6.9
-3,011
North Carolina - 48
72,771
76,779
45.5
6.2
4 548
-0.7
-3.3
- 18.6
-13 975
75,276
Alleghany
7,734
7,610
-1.6
4.1
317
-5.7
-5.2
- 14.5
-1,185
Ashe
19,768
19,773
0.0
5.6
1,107
-5.6
-9.6
- 24.6
-5,377
Wilkes
45,269
49,396
49.1
6.9
3,124
42.2
+0.1
- 16.4
-7,413
North Carolina - 49
299,479
323,130
4 7.9
7.2
21,697
+0.7
+ 19.4
+1.1
+2,735
250 801
Davie
16,728
18,289
+9.3
6.1
1,020
43.2
+8.5
-7.2
-1,107
Forsyth
189,428
205,926
+8.7
7.7
14,586
41.0
+ 29.6
+ 10.1
+14,743
Stokes
22,314
23,539
45.5
6.5
1,450
-1.0
43.7
- 11.8
-2,539
Burry
48,205
50,889
45.6
6.6
3,182
-1.0
+5.7
- 12.6
-5,762
Yadkin
22,804
24,487
47.4
6.4
1,459
+1.0
+3.0
- 11.7
-2,600
1/
Population 1965 and net migration 1960-1965 are estimates.
2/
Source: Department of Rural Sociology,
University of North Carolina.

APPALACHIAN PORTION OF NORTH CAROLINA
Appendix - 97
-3e
ED6CATION OF PERSONS 25 AND OVER, 1960
Total*
Persons Com leting1-8 Years 1-4 Years
Elementary..........2SeLSchool
"1 or More Yrsof College
umber 503,035 251,974 176,564 60,747
ercentistribution 100.00 50.09 35.10
,12.08
ercent Change950-1960 11.81 -4.22 46.40 40.29
*Total includes.persons who have never attended school, or who have less
than one year of schooling.
LABOR FORCE STATUS BY SEX - 14 ANDOVER 1960
Total Male Female
'In -Out of In Out of In Out of
Labor Labor Labor Libor Labor Labor
Force* . Force Force* Force Force* Force014 46mor gmf/AND . _
Number 353,849 309,915 232,839 85,704 121,010 224,211
PercentDistribution 53.31 46,69 73.09 26.91 35.05 64.95
Percent Change1950-1960 11.57 3.67 0.31 26.73 42.31 -3.07
*I=cludes persons in the Armed Forces.
EMPLOYMENT STATUS BY SEX - 14 AND OVER 1960.
Male Female1
'Unem- Unemt.
4,2123.oec.L.L.21(.2zed. Evloyed ployed Employed paoyed
Number' 337,987 15,502 223,641 8,838 114,346 6,664
ioercentDistribution 95.61 4.39 96,20 3.80 94.49 5.51
Percent Change1950.1960 10.12 55.16 0.85 39.12 40.54 83.18

Appendix - 98
PERCENT CHANGE 1962-1965 IN WORK FORCE,EMPLOYMENT AND MEMPLOYMENT,
AND 1962-1965 RATE OF UNEMPLOYMENTAPPALACHIAN & NON-APPALACH1AN
PDRTION OF STATE(All Numbers in Thousands)
Total Work Force
1965 Change 1962-65Number Number Percent
North Carolina 1,990.3 124.7 6.7
Non-Appalachian Portion 1,596.2 98.0 6.5
Appalachian Portion 394.1 26.7 7.3
Total Employment
1965 Changej962-65Number Number Percent
North Carolina 1,907.1 140.3 7.9
Non-Appalachian Portion 1,533.3 111.2 5.6
Appalachian Portion 373.8 29.1 8.4
North Carolina
Non-Appalachian Portion
Appalachian Portion
1965
Unemployment
Chan e 1962-65Number Number Percent
83.2
62.9
20.3
- 15.6
- 13.2
2.4
- 15.8
- 17.4
- 10.6
Rate of Unemployment
1962 1963 1964 1965
North Carolina 5.3% 5.1% 4.8% 4.2%
Non-Appalachian Portion 5.1 4.8 4.7 4.0
Appalachian Portion 6.2 6.3 5.4 5.2
3.3-F

Appendix - 99
MANUFACTURING EIPLOYMENT AND VALUE ADDED BY MANUFACTURE, 15.'54, 1958, AND 1963,
AND PERCENT CHANGE, 1954-1958 AND 1958-1963
Manufacturing Employment
Value Added by Manufacture
Nutber
Percent Change
Number ($1,000)
Percent Mane.
1954
1958
1963
1954-
1958
1958-
1963
1954
1958
1963
1954-
1958-
1958
1963
NORTH CAROLINA - STATE TOTAL
430,001
461,485
530,646
7.3
15.0
2,210,463
3,077,q29
4,566,947
39.2
48.4
APPALACHIAN PORTION
104,683
115,864
135,892
10.7
17.3
650,451
872,121
1,384,943
34.1
58.8
North Carolina - 43
2,634
2,954
4,02S
12.1
36.3
10,354
15.677
26,717
51.4
70.4
Cherokee
929
748
1,161
- 21.2
55.2
2,377
3,513
7,901
47.7
124.9
Clay
94
236
211
151.0
- 10.6
165
724
1,194
338.8
64.9
Graham
237
270
355
13.9
31.5
927
1,370*
2,234
47.7
63.0
Jackson
643*
643
1,046
0.2
62.7
3,653*
4,73S
8,354
29.7
76.3
Macon
369
762
593
106.5
22.6
1,456
3,943
2,925
165.3
-0.6
Swain
362
295
665
- 18.5
125.4
1,746
1,389
4,109
- 20.4
195.8
North Carolina - 44
21,443
24,043
29,25?
12.1
21.7
135,526
164 522
--2_____
294L___
453
18.8
79.0
Buncombe
11,079
12,171
16,450
9.8
35.1
54,835
147,466
30.1
106.6
71,344
Haywood
4,961
5,219
4,826
5.2
-7.5
48,436
39,969
63,706
- 17.4
59.3
Henderson
2,34S
3,322
3,636
41.4
9.5
9,641
22,110
33,442
129.3
51.3
Madison
154
446
639
189.6
43.3
712
2,265
4,495
218.1
98.4
Transylvania
2,901
2,865
3,697
-0.5
27.4
24,899
26,834
45,344*
15.8
57.3
North Carolina - 45
13,446
13,440
13,731
0.0
2.2
55,518
65,102
92,494
16.4
35.8
McDowell
5,026
5,20S
5,608
3.6
7.7
23,811
32,391
45,606
36.0
40.7
Polk
1,234
1,182
893
-1.S
- 24.7
4,163
4,539
6,526
9.0
43.7
Rutherford
7,216
7,050
7,233
-2.3
2.6
30,544
31,172
40,362
2.0
29.4
North Carolina - 46
1,637
1,935
2,998
5.3
54.9
7,202
8,861
17,233
23.0
94.5
Avery
336
359
464
6.8
34.8
1,150
1,809
3,468
57.3
91.7
Mitchell
590
703
984
19.1
40.0
1,891
2,823
3,574
49.2
26.6
Watauga
172
265
896
54.0
236.1
1,237
1,791
6,157
45.4
243.7
Yancey
739
608
634
- 17.7
4.3
2,924
2,436
4,034*
- 16.6
65.7
North Carolina - 47
18,526
20,850
26,392
12.5
26.6
78,828
104,424
180,536
32.5
72.9
Alexander
1,027
1,258
2,497
22.4
98.5
3,309
4,796
15,083
44.9
214.4
Burke
8,291
9,487
12,345
14.4
30.1
36,168
52,627
86,549
45.5
64.4
Caldwell
9,208
10,105
11,550
9.7
14.3
39,351
47,001
78,904
19.4
67.8

Appendix - 100
MANUFACTURING EMPLOYMENT AND VALUE ADDED BY MANUFACTURE, 1954,
AND PERCENT CHANGE, 1954-1958 AND 1958-1963
1958, AND 1963,
Manufacturing EmploymEnt
Value Added by Manufacture
Number
Percent Change
Number ($1,000)
Percent Change
1954
1958
1963
1954-
1958
1958-
1963
1954
1958
1963
1954-
1958
1958-
1963
NORTH CAROLINA (Cont'd.)
North Carolina - 48
2,261
5,023
7,570
122.2
50.7
12,788
22,498
392.-__
605
75.9
76.0
Alleghany
509
551
1,118
8.2
102.9
1,070
1,503*
__. 5,113
40.4
240.1
Ashe
540
1,028
1,917
90.3
286.5
1,723
5,310
13,545
208.2
155.0
Wilkes
3,212
3,444
4,535
7.2
31.7
9,995
15,685
20,947
56.9
33.5
North Carolina - 49
42,057
47,619
51,923
13.2
29.0
344,235
488,037
733,905
41.8
50.4
Davie
1,923
1,926
2,486
0.1
29.1
7,532
10,118
15,403
34.3
52.2
Forsyth
31,568
35,568
37,116
12.7
4.4
303,756
434,374
645,425
430
48,5
Stokes
479
429
1,042
-10.4
142.9
1,629
1,760
8,178*
8.0
364.6
Surry
8,318
9,391
10,938
12.9
16.6
30,626
40,376
62,983
31.8
56.0
Yadkin
248
305
341
23.0
11.8
692
1,409
1,916
103.6
36.0
Source:
Census of Manufactures, 1954, 1958, and 1963.
*Actual census data were not available for the county because
of :he "disclosure rule."
Therefore, estimates were made based on projections of
data for available years and/or on the state averages
of value added per employee for the predominant industry groups.

Appendix - 101
APPALACHIAN PORTION OF NORTH CAROLINA
NUMBER OF ESTABLISHMENTS IN SELECTED SERVICES
AND SALES 1963, AND PERCENT CHANGE 1958-1963
Establishments Receipts ($1000)
Number1963*
PercentChange1958-63
Value1963*
PercentChange1958-63
All Establishments 5_31._02 27.81 12_, _4542 46.85
Personal Services 2,187 31.04 INA INA
Auto Repair, Garages 901 26,90 INA INA
Other Services 2,014 24.86 INA INA
*Details may not add to total because of disclosure rule.
NUMBER OF WHOLESALE ESTABLISHMENTS AND
SALES 1963, AND PERCENT CHANGE 1958-1963
EstablishmentsPercentChangeNumber
Sales
Value
($1000)
PercentChange
1963* 1958-63 1963* 1958-63
All Establishments 1,042 19.,36 700,564, 24,89
Merchant Wholesalers 725 18,66 342,628 35.18
Other Operating Types 317 20.99 341,728 38.53
*Details may not add to total because of disclosure rule.

Appendix - 102
APPALACHIAN PORTION OF NORTH CAROLINA
NUMBER OF RETAIL ESTABLISHMENTS AND SALES 1963,
AND PERCENT CHANGE 1958-1963
Establishments Sales
Number1963*
PercentChange1958-63
Value1963*
ALL STORES 9,057 6.34 987 914
Lumber, bldg. materials, etc. 364 -9.45 77,689
General merchandise 494 -43,41 104,396
Food stores 2,415 14.89 243,593
Automotive dealers 654 16.79 200,463
Gasoline service stations 1,336 11.43 86,327
Apparel, accessory stores 518 24.22 56,196
Furniture, home furnishings, etc. 549 9.15 50,425
Eating, drinking places 1,018 6.60 46,420
Drug stores, proprièta7y stores 219 3.30 29,896
Other retail stores 1,151 12,73 73,423
Non-store retailers 339 33.99 13,388
*Details may not add to tdotal because of disclosure rule.
($1000)PercentChange1958-63
27.24
18.73
7.98
40.03
42.10
36.96
30.33
24 19
40.01
21.66
4.60
86.83
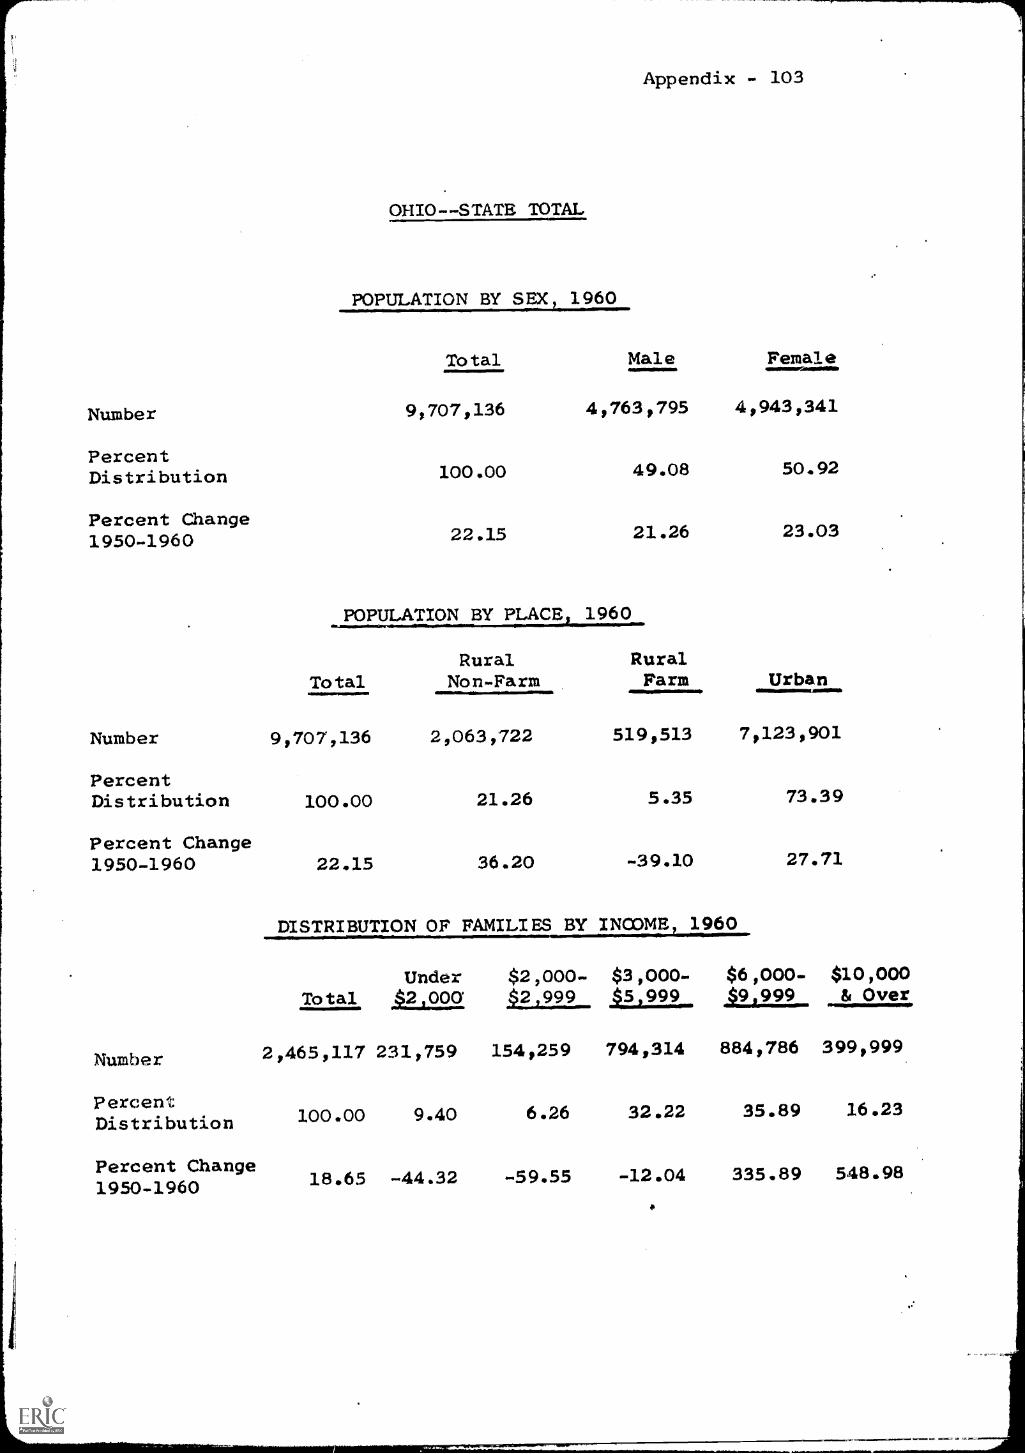
Number
PercentDistribution
Percent Change1950-1960
Number
PercentDistribution
Percent Change1950-1960
Number
PercentDistribution
Percent Change1950-1960
Appendix - 103
OHIO- -STATE TOTAL
POPULATION BY SEX, 1960
Total Male Female
9,707,136 4,763,795 4,943,341
100.00 49.08 50.92
22.15 21.26 23.03
POPULATION BY PLACE 1960
TotalRural
Non-FarmRuralFarm Urban
9,707,136 2/063,722 519,513 7,123,901
100.00 21.26 5.35 73.39
22.15 36.20 -39.10 27.71
DISTRIBUTION OF FAMILIES BY INaams 1960
Under $2;000- $3,000- $6,000- $10,000
Total 124LX.XY $2;999 151292. ,$9,999 & Over
2,465,117 231,759 154,259
100.00 9.40 6.26
18.65 -44.32 -59.55
794,314 884,786 399,999
32.22 35.89 16.23
-12.04 335.89 548.98

mber
ercentstribution
ercent Change950-1960
Appendix - 104
OHIO - STATE TCerAL
EDUCATION OF PERSONS 25 AND OVER, 1960
Mtal*
Persons Completing1-4 Years 1 or More Yrs4.--=.8-"Te6ars
5,377,547 1,907,962 2,612,318 786,561
100.00 35.48 48.58 . 14.63
13.32 -4.46 31.59 32.73
*Total includes.persons who have.never attended school, or who have less*than one year of schooling.
umber.
ercentstribution
ercent Change950..1960
LABOR FORCEi STATUS BY SEX - 14 AND OVER 1960
TotalIn Out of
Labor Labor_FOr_c_e* Force
Male FemaleOut of In ouram"Libor Labor LaborForce Force* Force
InLaborForce*
31724,075 3,043,150 2,571,334
55.03 44.97 78.74
16.04 9.17 9.63
*Includes persons in the Armed Forces.
umber'
ercentstribution
ercent Change950-1960
694,352
21.26
17.60
1,152,741
32.92
33.45
EMPLOYMENT STATUS BY SEX - 14 AND OVER,IL .1960
12145-nem-Male
2,348,798
67.08
6.91
FemaleUnem- Unem-
Ea,soj21.1oLtd".21.2.o cd.. Employed _p?,oyed Employed ployed
3,504,880 202,284 2,415,806
94..54 5.46
14.55 42.95
94,57
8.19
138,804 1,089,074 63,480
5.43 94.49 5.51
32.23 31.74. 73.76
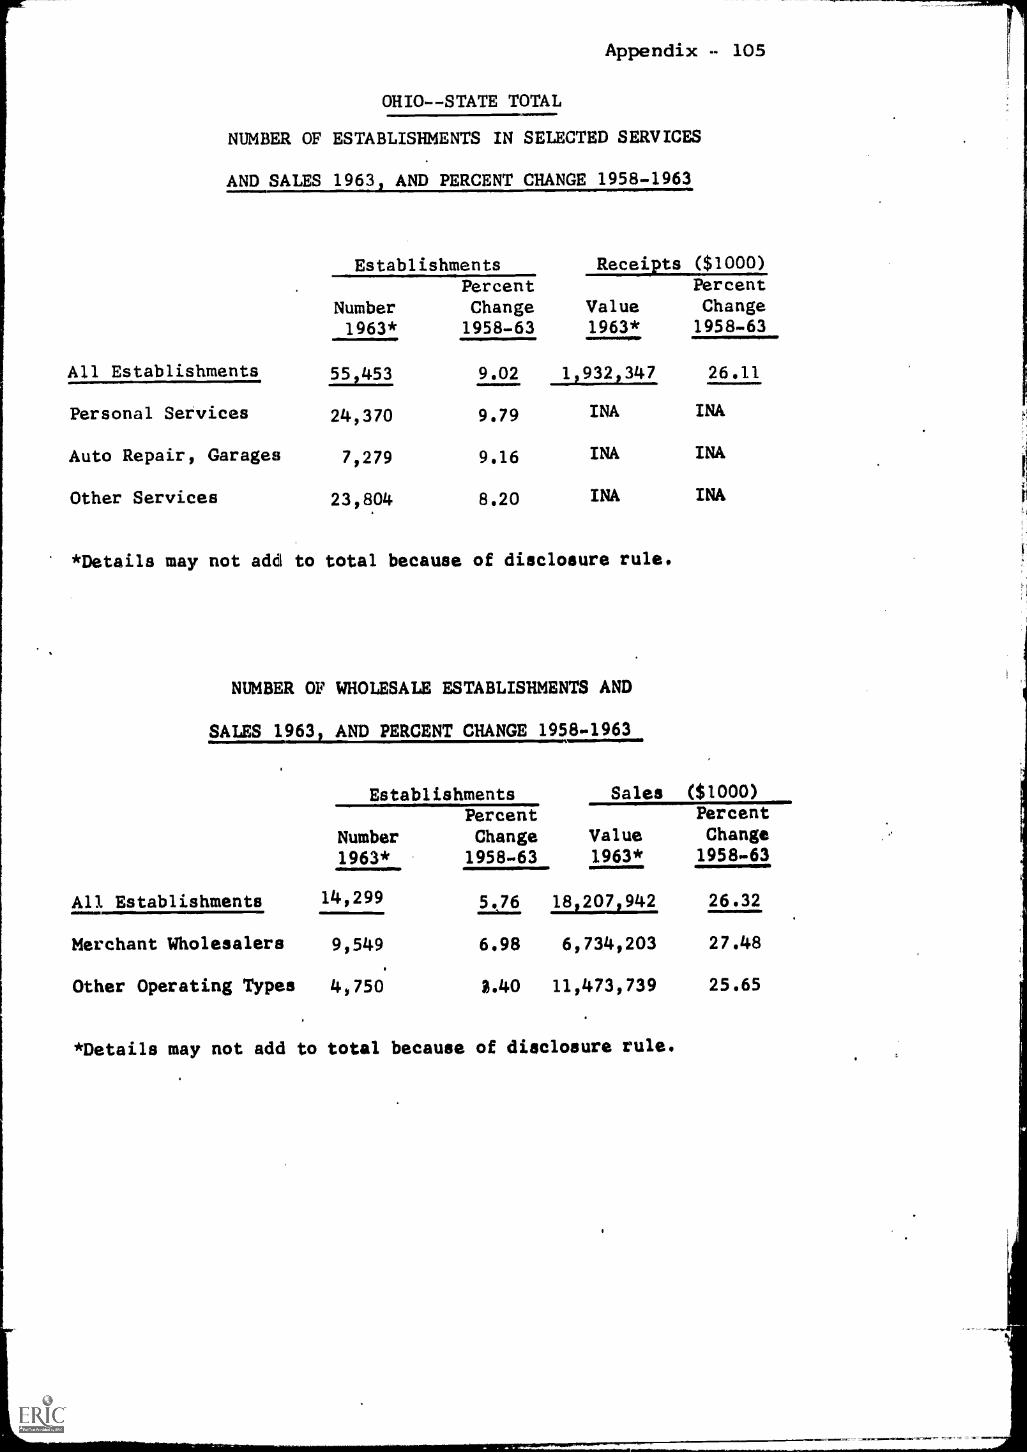
Appendix - 105
OHIO--STATE TOTAL
NUMBER OF ESTABLISHMENTS IN SELECTED SERVICES
AND SALES 1963, AND PERCENT CHANGE 1958-1963
All Establishments
Personal Services
Auto Repair, Garages
Other Services
Establishments
Number1963*
554453
24,370
7,279
23,804
Receipts ($1000)PercentChange1958-63
PercentChange Value1958-63 1963*
9.02 1,932,347 26.11
9.79 INA INA
9.16 INA INA
INA INA8.20
*Details may not add to total because of disclosure rule.
NUMBER OF WHOLESALE ESTABLISHMENTS AND
SALES 1963, AND PERCENT CHANGE 1958-1963
Establishments
Number
SalesPercentChange Value
($1000)PercentChange
1963* 1958-63 1963* 1958-63
All Establishments 14,299 5.76 18,207,942 26.32
Merchant Wholesalers 9,549 6.98 6,734,203 27.48
Other Operating Types 4,750 2.40 11,473,739 25.65
*Details may not add to total because of disclosure rule.

Appendix - 106
OHIO - STATE TOTAL
NUMBER OF RETAIL ESTABLISHMENTS AND SALES 1963,
AND PERCENT CHANGE 1958-1963
Establishments Sales ($1000)
Number1963*
PercentChange
1958-63
PercentValJe Change1963* 1958-63
ALL STORES 84,346 -6.65 12,9051181 18.86
Lumber, bldg. materials, etc. 51120 -20.10 758,486 -3.70
General merchandise 2,286 -27.77 1,837,599 36.10
Food stores 15,767 -13.52 3,147,148 12.48
Automotive dealers 4,813 -1.82 2,512,702 44.14
Gasoline service stations 10,630 6.76 1,018,037 25.50
Apparel, accessory stores 4,714 -10.24 565,823 2.88
Furniture, home furnishings, etc. 4,585 -18.04 540,387 1.42
Hating, drinking places 18,232 -3.07 1,001,931 .15.22
Drug stores, proprietary stores 2,671 -2,52 418,492 17.01
Other retail stores 11,017 -0.51 861,422 2.36
Non-store retailers 4,511 6.90 243,154 27.84
*Details may not add to tdtal because of disclosure rule.
"
r

Number
PercentDistribution
Percent Change1950.1960
PercentDistribution
Percent Change1950.1960
Number
PercentDistribution
Percent Change1950-1960
Appendix - 107
APPALACHIAN PORTION OF OHIO
POPULATION BY SEX, 1960
Total Male Female
1,119,555 555,876 563,679
100.00 49.65 50.35
8,16 7.22 9.11
POPULATION BY PLACE,_1960
TotalRural
Non-FarmRuralFarm Urban
1,119,555 563,077 131,057 425,421
100.00 50.30 11.70 38.00
8.16 40.34 .49.66 13.90
DISTRIBUTION OF FAMILIES BY INCOME 1960
Under $2,000. $30000- $6,000. $10,000
Total 12...1092 $2,999 Alan. $9999 & Over
284,050 47,827 28,036 107,949 77,209 23,029
100.00 16.84 9.87 38.00 27.18 8.11
8.75 .49.59 .53.06 33.37 599.67 627.61

POPULATION, RATE OF NA1URAL INCREASE, AND NET MIGRATION RATE, 1950-1960, AND 1960-19651/
Appendix - 108
Population
1960
Estimated
Population
196522
Estimated
Percent Change
Population
1960-1965
Rate
nf Natural
Increase
1960-1965
Estimated
Natural Increase
1960-1965
Number
Estimated Net
Migration Rate
1960-1965
Percent Change
Net
Population
Micratier. Rate
1950-1960
195'0,-1961
Net Migrati.-n
1950-1960
Number
Population
1950
OHIO - STATE TOTAL
706 397
9 2---L
10 564 144
+8.8
6.4
621.209
+2.4
+22.1
4 5.1
+408,576
7,946,627
----
APPALACHIAN PORTION
12112,125
1,154,159
+3.1
5.3
58,945
- 2.2
+F.
9- 4.5
- 46,387
1,035,058
Ohio - 11
386,395
391,607
+ 1.3
4.7
16.175
- 3.4
+ 5.1
- 7.4
- 27,082
367,796
Carroll
20,857
21,635
+ 3.7
4.7
980
- 1.0
+ 9.5
9.9
-561
Coshocton
32,224
32,819
+ 1.8
4.2
1,353
- 2.4
+ 35
- 5.4
-1,680
Guernsey
38,579
38,645
+ 0.2
3.7
1,427
- 3.5
-r 3.3
- 7.3
-2,81c
Harrison
17,995
17,055
- 5.2
3.:
576
- 8.4
- 5.6
-15.9
-3,033
Holmes
21,591
23,085
+ 6.9
8.9
1,922
- 2.0
+15.1
- 5.4
-1,018
Jefferson
99,201
06.603
- 0.6
4,266
- 4.9
+ 2.8
-10.1
-9,710
MUskingum
79,159
80.725
-r 2.0
5.3
4,195
- 3.3
+ 6.2
- 7.7
-5,714
Tuscarawas
76,769
79,037
+ 2.9
4.5
3,456
- 1.6
+ 9.2
- 3.6
-2,53E
Ohio - 12
291,739
290,484
- ).4
5.4
15.854
- 5.6
+ 0.7
- 8.7
- 25,344
289,680
Athens
46,998
47,655
+ 1.4
4.1
1,927
- 2.7
+ 2.5
- 7.0
-3,202
Belmont
83,864
80,161
- 4.4
8.9
7,464
-13.3
-4.4
-13.3
- 11,706
Hocking
20,168
20,513
+ 1.7
5.2
1,049
- 3.5
+ 3,3
- 7.0
-1,366
Neigs
22,159
21,369
- 3.6
2.6
576
- 6.2
-4.6
-12.7
-2,945
Mbnroe
15,268
15,454
1..)
4.2
641
- 3.0
-0.6
- 6.5
998
Morgan
12,747
12,578
- 1.3
2.4
306
- 3.7
-0.7
- 8.6
-1,106
Noble
10,982
10,345
- 5.8
1.5
165
- 7.3
-6.5
-13.9
-1,631
Perry
-27,864
27,113
7.7
4.1
1,142
- 6.8
-3.9
-14.0
-4,056
Washinaon
51,689
55,296
+ 7.0
5.0
2,584
+ 2.0
+16.4
+ 3.8
+1,666
Ohio - 13
441,421
472,068
+ 5.9
5.6
24,916
+ 1.3
+16.9
4- 1.6
+6,039
377,582
Adams
19,982
19,364
3.1
3.9
779
- 7.0
=27
-12.8
-2,615
Brown
25,178
26,837
+ 6.6
4.6
1,156
+ 2.0
+13.3
+ 3.2
+714
Clermont
80,530
102,790
+27.6
8.5
6,845
+19.1
+90.9
66.2
+ 27,923
Gallia
26,120
26,534
+ 1.6
3.9
1,019
- 2.3
+ 4.9
- 6.1
1,514
Highland
29,716
30,280
+ 1.8
3.7
1,099
- 1.9
+ 5.4
- 4.4
-1,238
Jackson
29,372
29,473
+ 0.3
4.0
1,175
- 3.7
+ 5.8
- 7.6
-2,109
lawrence
55,438
58,104
+ 4.8
5.8
3,215
- 1.0
+12.9
- 3.3
-1,606
Pike
19,380
21,433
+10.6
6.3
1,221
+ 4.3
+32.7
+ 8.8
+1,286
Ross
61,215
64,513
+ 5.4
6.3
3,857
- 0.9
+12.5
- 3.3
-1,804
Scioto
84,216
82,930
- 1.5
4.9
4,127
- 6.4
+ 1.6
-13.4
- 11,111
Vinton
10,274
9,810
- 4.5
4.1
421
- 8.6
-4.5
-17.5
-1,887
Y Population 1965 and
net migration 1960-1965 are estimates. 2/ Source:
Population Estimates, Economic Researth Div., Ohic, DevelopmentDept., Jan. 1, 1965.

APPALACHIAN PORTION OF OHIO
EDUCATION OF PERSONS 25 AND OVER, 1960
Persons Com leting
Total*
Appendix - 109
1-8 Years 1-4 Years 1 or More Yrs
schobl of Calle e
Number 617,488 281,508 270,013 57,606
Percent 100.00 45.59 43.73 9.33
Distribution4.63 - 12.40 33.54 2209.
Percent Change1950-1960
*Total includes.persons who have never attended school, or who have less
than one year of schooling.
LABOR FORCE STATUS BY SEX - 14 AND OVER 1960
TotalIn Out of
Labor LaborForce* . Force
MaleIn Out ofLabor LiborForce* . Force
FemaleIn Out of
Labor LaborForce* Force ,
Number 382,015 405,282 277,275 1080643 104,740 296,639
PercentDistribution 48.52 51.48 71.85 21.15 26.10 73.90
Percent Change1950-1960 5.31 1.78 - 1.74 12.31 30.02 - 1.60
*Includes persons in the Armed Forces.
EMPLOYMENT STATUS BY SEX - 14 AND OVER 1960
Total Male Female
Unem- Unem- Unem-
Number. 353,683 27,964 255,365 21,546 98,318 6,418
PercentDistribution 92.67 7.33 92.22 7.78 93.87 6.13
Percent Change1950..1960 2.42 63.32 - 4.66 52.74 26.88 112.80

Appendix - 110
PERCENT CHANGE 1962-1965 IN WORK FORCE,EMPLOYMENT AND UNEMPLOYMENT,
AND 1962-1965 RATE OF UNEMPLOYMENTAPPALACHIAN & NON-APPALACHIAN
PORTION OF STATE(All Numbers in Thousands)
Total Work Force
1965 glinge 1962-65Number Number Percent
Ohio 4,032.4 146.5 3.8
Non-Appalachian Portion 3,692.2 144.3 4.1
Appalachian Portion 340.2 2.2 .7
Total Employment
1965 Change 1962-65Number Number Percent
Ohio 3,889.8 224.3 6.1
Non-Appalachian Portion 3,568.7 214.8 6.4
Appalachian Portion 321.1 9.5 3.0
Unemployment
1965 Chanae 1962-65Number Number Percent
Ohio 142.6 - 77.8 - 35.3
Non-Appalachian Portion 123.5 - 70.5 - 36.4
Appalachian Portion 19.1 7.3 - 27.7
Rate of Unemployment
1962 1963 1964 1965
Ohio 5.7% 5.1% 4.2% 3.5%
Non-Appalachian Portion 5.5 4.9 3.8 3.3
Appalachian Portion 7.8 7.4 9.0 5.6

App
endi
x -
111
HIM
EX
CII
IHIS
a E
ier.
.012
4MIT
AN
D V
AL
UE
&D
EM
I FE
ItI
gHU
FAC
TU
RE
, 195
4, 1
956,
AIM
196
3,/2
141
FEH
CE
iT C
EE
AN
GE
195
4-15
56 A
na 1
958-
1563
Pfat
ni.-
..act
uria
na a
n.la
ytoa
nat
Val
ue &
Med
by
Man
ufac
ture
nigh
erPe
rcen
t Ply
-to
ws.
--II
:um
ber
($1,
000)
Perc
ent C
hang
e19
544
1956
ME
I19
54-
1955
-19
5619
6119
54,
1958
1963
1954
-19
58-
1958
1963
OH
M -
ST
AT
E T
OT
AL
1,-Z
ET
,542
1,23
11..0
311,
239,
515
- 5-
23.
21(
4.16
5,11
111
,472
,503
15 5
06 1
1812
.935
.2
APF
AT
AE
RT
AN
pai
n=E
a 71
5E
L,3
9T62
.274
4.-
L.6
1-1
583
780.
767
18D
952
811
31.4
24.2
Ohi
o -
Ii46
,567
as36
- 22
9C
302
119
372
979
468
786
23.5
25.7
Car
roll
1,93
91,
556
1,14
919
-7 -
10,5
5513
,362
10,2
0926
.5-
23.6
Cos
hoct
on3,
993,
74,6
7-1.
44,6
211
- H
-Cli
25-9
30,7
4636
,331
57,0
2618
.156
.9G
uern
sey
1,01
1-1
,5aT
17-3
314
.a15
,157
3a,8
tr8
67,3
5610
3.1
118.
6H
arri
son
Irm
aIr
ma
1,31
9-
ra..5
iz5,
462
5,33
96,
134
-1.
214
.8H
olm
es76
E6
lrE
aa.
Efa
Z46
-1 -
27-
65,
584
7,06
57,
147
26.5
1.1
Jeff
erso
n11
,,201
uraa
4.11
1,a4
a-
5-2
- 2.
296
,985
124,
088
143,
052
27.9
15.3
Mas
king
=9,
917"
9714
4ar
craz
- z.
.cu
-78
765
79,5
4275
,359
1.0
-5.
2T
usca
raw
as9,
146.
6,69
9ar
eLE
E-
59,0
0376
,440
102,
503
29.6
34.1
Ohi
o -
1215
798
16,5
7616
,366
D4-
921
-44
99 7
5915
7 5a
s19
8 35
257
.925
.9A
then
s2,
006
1,6.
146-
7 -
zal_
Es
12,1
1817
,511
20,0
7044
.514
.6B
elm
ont
256
44,0
M4,
652
- 5-
4415
-623
,516
28,3
9543
,471
20.7
53.1
Hoc
king
1401
1,51
61,
452
10-4
4 -
6-1
6303
13,6
7518
,885
64.7
38.1
Mei
gs5F
3E49
136
5aT
-a -
25-
62,
427
2,75
33,
273
13.4
19.0
Mon
roe
SE.
34,3
544
2944
7215
76,5
LIT
-01
245
15,0
56*
28,1
98*
6045
.387
.3M
orga
n.74
561
4461
9-
1T-5
CL
ES
6,27
06,
467
6,17
23.
1-
4.5
itabI
e48
63a
va17
,11
- 31
-03
10-4
2,56
82,
113*
4,90
7*-
17.7
132.
2Pe
rry
1,84
0,1,
636
1,52
44-
ac-a
- 9
-28,
360
10,1
3710
,383
21.3
2.4
Was
hing
ton
4447
4,76
21-
445-
635
,951
61,4
0162
,993
70.8
2.6
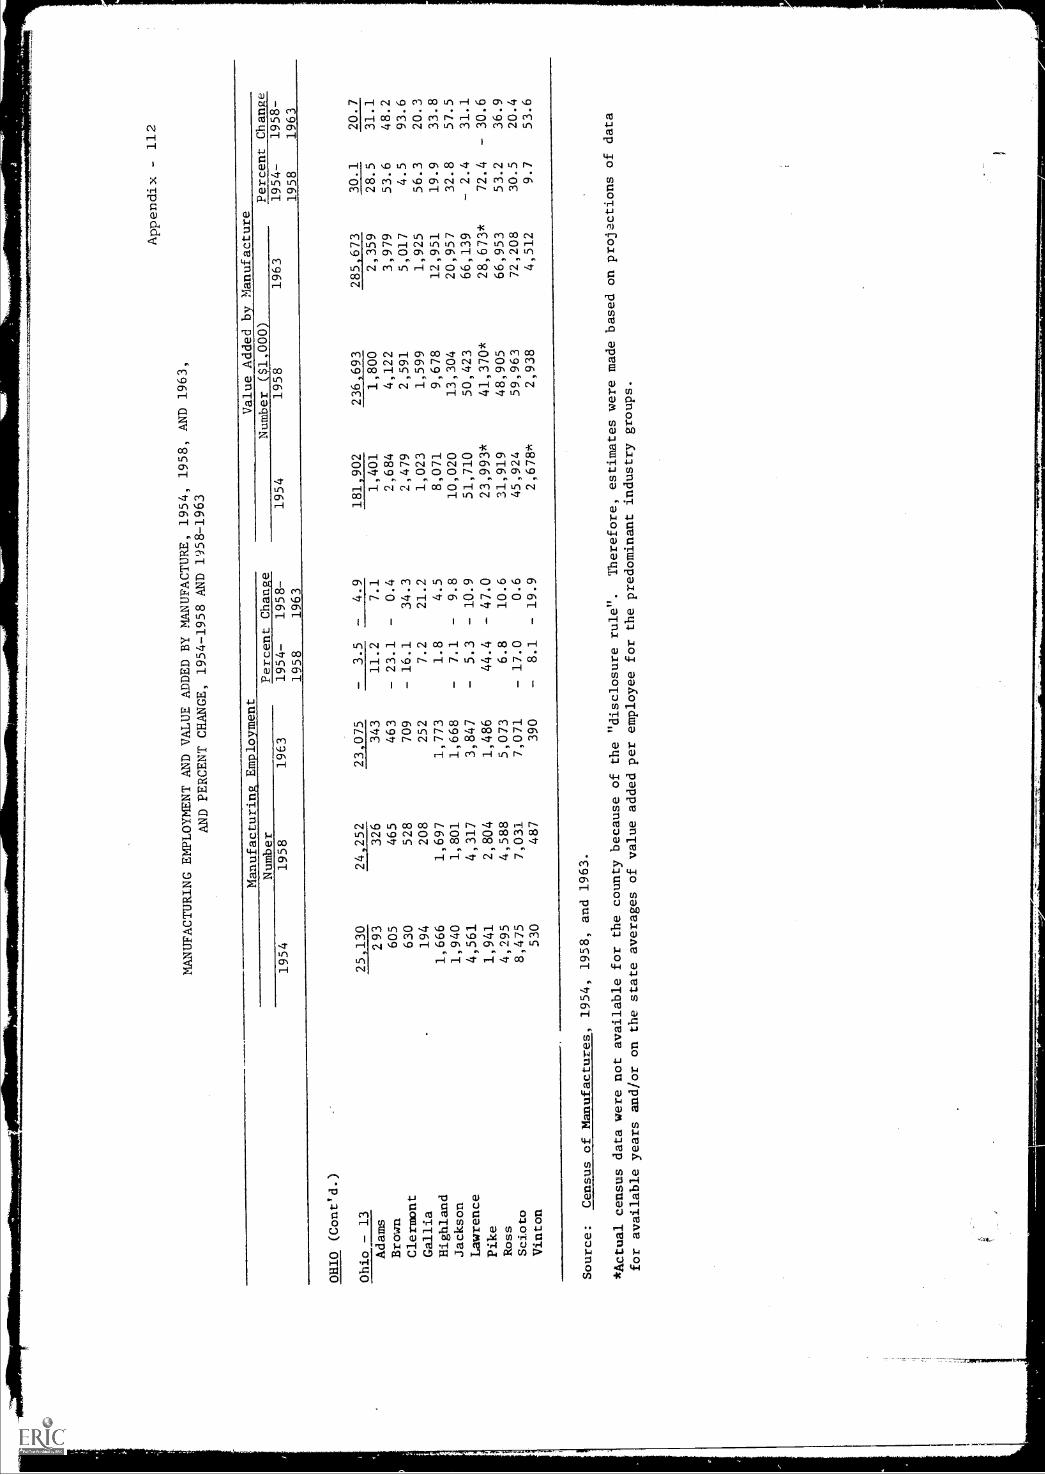
Appendix - 112
MANUFACTURING EMPLOYMENT AND VALUE ADDED BY MANUFACTURE,
1954, 1958,
AND PERCENT CHANGE, 1954-1958 AND 1958-1963
AND 1963,
Manufacturing Employment
Value Added by Manufacture
Number
Percent Change
Number ($1,000)
Percent Change
1954
1958
1963
1954-
1958-
1954
1958
1963
1954-
1958-
1958
1963
1958
1963
OHIO (Cont'd.)
Ohio
13
25 130
24 252
23 075
3.5
-4.9
181,902
236,693
285 673
30.1
20.7
Adams
293
326
343
11.2
7.1
1,401
1,800
2,359
28.5
31.1
BroJn
605
465
463
23.1
0.4
2,684
4,122
3,979
53.6
48.2
Clermont
630
528
709
- 16.1
34.3
2,479
2,591
5,017
4.5
93.6
Gallia
194
208
252
7.2
21.2
1,023
1,599
1,925
56.3
20.3
Highland
1,666
1,697
1,773
1.8
4.5
8,071
9,678
12,951
19.9
33.8
Jackson
1,940
1,801
1,668
7.1
9.8
10,020
13,304
20,957
32.8
57.5
Lawrence
4,561
4,317
3,847
5.3
10.9
51,710
50,423
66,139
2.4
31.1
Pike
1,941
2,804
1,486
44.4
47.0
23,993*
41,370*
28,673*
72.4
30.6
Ross
4,295
4,588
5,073
6.8
10.6
31,919
48,905
66,953
53.2
36.9
Scioto
8,475
7,031
7,071
17.0
0.6
45,924
59,963
72,208
30.5
20.4
Vinton
530
487
390
-8.1
- 19.9
2,678*
2,938
4,512
9.7
53.6
Source:
Census of Manufactures,
1954,
1958, and 1963.
*Actual census data were not available for the county because
of the "disclosure rule".
Therefore, estimates were made based on projactions of
data
for available years and/or on the state averages of value added per
employee for the predominant industry groups.

Appendix - 113
APPALACHIAN PORTION OF OHIO
1:171'' OF EsA13! :41MENTS IN SELECTED SERVICES
AND SALES 1933 AND PERCENT CHANGE 1958-1963
All Establishments
Establishments Receipts ($1000)
PercentNumber Change1963* 1958-63
Value1963*
PercentChange1958-63
5 745 10.46 92,043 22.97
Personal Services 2,618 16.10 INA INA
Auto Repair, Garages 913 9.60 INA INA
Other Services 2,205 4.35 INA INA
*Details may not add to total because of disclosure rule.
NUMBER OF WHOLESALE ESTABLISHMENTS AND
SALES 1963, AND PERCENT CHANGE 1958-1963
Establishments Sales ($1000)
Number1963*
PercentChange1958-63
Value1963*
PercentChange1958-63
All Establishments 3.09 545 409 17.69
Merchant Wholesalers 702 0.72 289,331 26.41
Other Operating Types 365 7.99 246,924 6.88
*Details may not add to total because of disclosure rule.

APPALACHIAN PORTTON QF OHIO
NUMBER OF RETAIL ESTABLISHMENTS AND SALES 1963,
AND PERCENT CHANGE 1958-1963
4111111...1011
Appendix - 114
Establishments sales ($1000)
ChangePercent
Number Change1963* 1958-63
Percent-Value1963* 1958-63
ALL STORES 11 197 - 8.59 1 165 667 13 17
Lumber, bldg. materials, etc. 778 -16.79 82,706 - 2.61
General merchandise 381 -46.64 102,494 6.98
Food stores 2,502 -12.37 318,303 11.14
Automotive dealers 726 - 3.20 231,740 34.98
Gasoline service stations 1,477 1.23 112,113 17.24
Apparel, accessory stores 500 - 2.91 43,563 9.46
Furniture, home furnishings, etc. 497 -25.04 44,798 -11.41
Eating, drinking places 2,181 - 0.50 79,058 8.18
Drug stores, proprietary stores 289 2.48 33,690 22.61
Other retail stores 1,449 - 0.96 98,927 17.09
Non-store retailers 417 - 0.95 15,958 74.10
*Details may not add to total because of disclosure rule.

Appendix - 115
PENNSYLVANIA'-- STATE TOTAL
POPULATION BY SEX, 1960
Total Male Female
Number 11,320,580 5,509,080 5,811,500
PercentDistribution 100.00 48.66 51.34
Percent Change1950-1960 7.84 6.55 9.08
POPULATION BY PLACE 1960
Rural RuralTotal Non-Farm Farm Urban
Number 11,320,580 2,861,417 356,273 8,102,890
PercentDistribution 100.00 25.28 3.15 71.58
Percent Change1950-1960 7.84 19.74 -49.48 9.45
DISTRIBUTION OF FAMILIES BY INCOME, 1960
Under $2,000- $3,000- $6,000- $10,000Total $2,999 $5,999 19_22.22. & Over
Number
,$2,004
2,902,611 274,591 213,363 1,080,553 929,286 404,818
PercentDistribution 100.00 9 46 7.35 37.23 32.02 13.95
Percent Change1950-1960 9.95 -51.98 -62.54 0.56 293.73 498.84

Appendi x 11 6
PENNSYLVANIA - STATE TOTAL
EDUCATION OF PERSONS 25 AND OVER, 1960
Persons Com leting
Total*1-8 lears
Elementar School
1-4 YearsHi h School
,1 or More Yrsof Colleze_
Number 6,605,713 2,629,897 2,998,358 831,937
PercentDistribution 100.00 39.81 45.39 12.59
Percent Change1950-1960 4.97 -10.65 25.28 28.89
*Total includes.persons who have never attended school,
than one year of schooling.
or who have less
LABOR FORCE STATUS BY SEX - 14 AND OVER 1960
TotalIn Out of
Labor LaborForce* . Force
MaleIn Out of
Labor LiborForce* . Force
FemaleOut crrLabe..
Force
InLaborForce*,
Number' 4,419,808 3,766,278 2,997,059 916,836 1,422,749
PercentDistribution 53.99 46.01 76.57 23.43 33.30
Percent Change1950-1960 5.86 -1.88 - 0.99 4.45 23.93
*Includes persons in the Armed Forces.
EMPLOYMENT STATUS BY SEX - 14 AND OVER 1960
MaleUnem- Unem-
pmployed_ 2.12=1. Employed pioyed
Number' 4,127,208 274,690
PercentDistribution 93.76 6.24
Percent Change1950-1960 4.99 21.34
Female
2,849,442
EtTloyed
66.70
-3.75
Unem*-
ployed
2,785,166 194,458 1,342,042 80,232
93.47 6.53 94.36 5.64
-1.56 7.38 21.80 77.21

PENNSYLVANIA - STATE TOTALAppendix - 117
NUMBER OF ESTABLISHMENTS IN SELECTED SERVICES
AND SALES 1963 AND PERCENT CHANGE 195S-1963
All Establishments
Personal Services
Auto Repair, Garages
Other Services
EstablishmentsPercent
Number Change1963* 1958-63
63,830 5.29
30,964 6.45
9,979 10.61
22,887 1.67
Receipts ($1000)Percent
Value Change1963k 1958-63
2_487,523 31.43
INA INA
INA INA
INAINA
*Details may not add to total because of disclosure rule.
NUMBER OF WHOLESALE ESTABLLSHMENTS AND
SALES 1963, AND PERCENT CHANGE 1958-1963
All Establishments
Merchant Wholesalers
Other Operating Types
Establishments
Number1963*
16,790
12,516
4,274
PercentChange1958-63
2.27
1.54
4.45
Sales ($1000)
Value1963*
PercentChange1958-63
181043,645 10.65
7,753,402 20.25
10,290,243 4.37
*Details may not add to total because of disclosure rule.

Appendix - 178
PENNSYLVANIA -- STATE TOTAL
NUMBER OF RETAIL ESTABLISHMENTS AND SALES 1963,
AND PERCENT CHANGE 1958-1963
Establishments Sales ($1000)Percent
Number Change1963* 1958-63
Value1963*
PercentChange1958-63
ALL STORES 109 590 -9.32 13,910,693 12.90
Lumber, bldg. materials, etc. 4,859 -15.70 633,474 -3.60
General merchandise 3,042 -30.31 1,797,215 19.48
Food stores 23,407 -16.81 3,447,266 8.97
Automotive dealers 5,530 0.29 2,486,417 30.65
Gasoline service stations 11,088 -1.90 886,842 20.98
Apparel, accessory stores 8,482 -7.44 900,637 10.10
Furniture, home furnishings, etc. 5,572 -18.25 604,808 -2.15
Eating, drinking places 24,312 -3.67 1,080,433 12.80
Drug stores, proprietary stores 3,691 -6.39 425,161 15.22
Other retail stores 14,264 -4.58 1,249,104 10.18
Non-store retailers 5,343 -5.60 399,336 -13.97
*Details may not add to total because of disclosure rule.

Number
PercentDistribution
Percent Change1950-1960
Number
PercentDistribution
Percent Change1950-1960
Number
PercentDistribution
Percent Change1950-1960
AiTendix- - 110
APPALACHIAN PORTION OF PENNSYVANTA
?:ra;.)N ri 04.10111.01111101.41Im.sINIMMOD
To -..,.1 .,,1 , l',',.:......":
5,930,784 2,95,584 3,035,201
100.00 48.82 51.1i
2.53 1.00 4.03
POPULATION LV 1%:)60
TotalRuralNon-Farm
Rural1?arm
5,930,784 1,971,035 222,550
100.00 33.23 3.75
2.53 17.25 -53.27
DISTRIBUTION OF FAMILIES ;Sir IN, 1960
Urbt.:n
3,737,199
63.01
3.03
Under $2,000- $3,000- $6,000- $10,000Total ILE.* $9 999._ Ovnr
1,530,250 168,910 130,165 608,143 449,105 173,927
100.00 11.04 8.51 39.74 29.35 11.37
5.44 -51.73 -61.91 8.03 300.18 611.40

Appendix - 120
POPULATION, RATE OF NATURAL INCREASE, AND NET MIGRATION RATE, 1950-1960,
AND 1960-19651/
Population
1960
Estimated
Population
19652!
PENNSYLVANIA - STATE TOTAL
11,319,366
11,535,200
APPALACHIAN PORTION
5 930.784
5,876,400
Pennsylvania - 4
721 892
723 600
Clarion
37,408
38,100
Crawford
77,956
80,500
Erie
250,682
255,100
Forest
4,485
4,900
Lawrence
112,965
106,700
Mercer
127,519
126,200
Venango
65,295
63,700
Warren
45,582
48,400
Pennsylvania - 5
2,883,728
2,804,400
Allegheny
1,628,587
1,561,900
Armstrong
79,524
77,100
Beaver
206,943
195,500
Butler
114,639
117,100
Fayette
169,340
162,200
Greene
39,424
39,400
Indiana
75,366
72,100
Washington
217,271
213,100
Westmoreland
352,629
366,000
Pennsylvania - 6
244 240
244 600
Cameron
7,586
7,400
Clearfield
81,534
81,900
Elk
37,328
39,100
Jefferson
46,792
45,800
McKean
54,517
54,200
Potter
16,483
16,200
Estimated
Percent
Change
Population
1960-1965
Rate
of Natural
Increase
1960-1965
Estimated
Natural
Increase
1960-1965
Number
Estimated Net
Nigration Rate
1960-1965
Percent
Change
Population
1950-1960
Net
Migration
Rate
1950-1960
Net
Migration
1950-1960
Number
Population
1950
+ 1.9
4.6
520 691
- 2.7
+7.8
-4.5
-475,286
10,498,012
- 0.9
4.2
246 576
- 5.1
+ 2.5
-9.3
-538 715
5,784,652
+ 0.2
4.8
34 407
- 4.6
+8.3
-6.2
- 41,150
666 724
+ 1.9
5.4
2,020
- 3.5
-9.4
- 15.1
-5,785
+ 3.2
3.9
3,040
- 0.7
-1.3
- 12.0
-9,505
+ 1.8
5.9
14,790
- 4.1
+ 14.3
-2.6
-5,773
+ 8.9
3.8
170
+ 5.1
-9.3
- 16.4
809
- 5.6
3.9
4,406
- 9.5
+7.5
-7.2
-7,528
- 1.0
4.6
5,866
- 5.6
+ 13.9
-1.6
-1,810
- 2.5
3.3
2,155
- 5.8
-0.1
- 12.3
-8,006
+ 6.1
4.3
1,960
+ 1.8
+ 6.8
-4.5
-1,934
- 2.7
4.4
127,740
- 7.1
+ 6.7
-6.5
-177,040
2 703 797
- 4.1
4.4
71,658
- 8.5
+7.5
-5.7
- 85,812
- 3.0
4.1
3,260
- 7.1
-1.6
- 14.9
- 12,007
- 5.6
5.6
11,589
0.0
+ 18.1
+1.3
+ 2,225
+ 2.2
6.0
6,878
- 3.8
+ 17.8
+ 2.0
+1,931
- 4.2
3.2
5,419
- 7.4
- 10.8
- 21.3
- 40,410
0.0
2.0
788
- 2.0
- 13.2
- 23.7
- 10,737
- 4.4
4.8
3,618
- 9.2
-2.3
- 14.0
- 10,787
- 1.9
3.5
7,604
- 5.4
+ 3.6
-8.0
- 16,777
+ 3.8
4.8
16,926
- 1.0
+ 12.6
-1.5
-4,666
+ 0.2
4.7
11 487
- 4.5
-2.3
- 14.5
- 36,338
250 047
- 2.6
6.0
455
- 8.6
+ 8.0
- 10.4
-732
+ 0.5
4.6
3,751
- 4.1
-5.1
- 16.4
- 14,102
+ 4.8
6.6
2,464
- 1.8
+8.2
- 10.6
-3,643
- 2.1
3.7
1,731
- 5.8
-4.8
- 14.8
-7,252
- 0.5
4.3
2,344
- 4.8
-3.7
- 14.9
-8,451
- 1.8
4.5
742
- 6.3
-1.9
- 12.8
-2,158

A
POPULATION, RATE OF NATURAL INCREASE, AND NET EIGRATION RATE, 1950-1960,AND 1960-196511
Appendix - 121
Population
1960
Estimated
Populat,On
1965-4j
Estimated
Percent
Change
Population
1960-1965
Rate
of Natural
Increase
1960-1965
Estimated
Natural
Increase
1960-1965
Number
Estimated Net
Migration Rate
1960-1965
Percent
Change
Population
1950-1960
Net
Migration
Rate
1950-1960
Net
Migration
1950-1960
Number
Population
1950
PENNSYLVANIA (Coned.)
Pennsylvania - 7
510 508
511 300
+0.2
5.0
25 556
-4.8
-2.4
14.6
-76 150
522 902
Bedford
42,451
44,900
+5.6
5.7
2,420
-0.1
+ 4.1
10.2
4,169
Blair
137,270
143,600
+4.6
3.7
5,079
+0.9
-1.6
- 11.5
-16,046
Cambria
203,283
191,700
5.7
3.7
7,521
-9.4
-3.0
- 17.0
-35,569
Fulton
10,597
12,400
+ 17.0
5.6
5,934
+ 11.4
+ 2.0
11.7
- 1,218
Huntingdon
39,457
39,900
+1.0
4.4
1,736
3.4
-3.5
- 14.5
5,913
Somerset
77,450
78,800
+1.7
3.7
2,866
-2.0
-5.3
16.2
-13,235
Pennsylvania - 8
538.295
556,300
+ 3.3
4.6
24,960
-1.3
+3.5
-7.9
-41,197
520 057
Centre
78,580
86,700
10.3
7.3
5,736
+3.0
+ 19.2
+3.0
+ 1,962
Clinton
37,619
38,100
+1.3
4.7
1,768
-3.4
+3.0
9.8
- 3,572
Columbia
53,489
52,200
2.4
2.9
1.551
-5.3
+0.1
9.1
- 4,881
Juniata
15,874
17,000
+6.9
5.4
857
+1.
+4.1
-8.7
- 1,324
Lycoming
109,367
110,700
+1.2
5.4
5,906
-4.2
+8.0
4.7
- 4,805
Elfflin
44,348
45,500
± 2.7
5.3
2,350
-2.6
+ 1.5
11.4
- 4,968
Montour
16,730
17,200
+3.0
4.0
669
-1.0
+4.6
-5.6
-892
Northumberland
104,138
103,100
-1.0
2.3
2,395
-1.3
- 11.1
18.7
-21,871
Perry
26,582
26,500
-0.4
4.9
1,303
-5.3
+7.3
5.8
- 1,441
Snyder
25,922
29,300
- 13.1
5.2
1,348
18.3
+ 13.1
+1.8
4-
401
Union
25,646
3C,000
+ 17.2
4.2
1,077
+ 13.0
+ 10.8
+ 0.8
+194
Pennsylvania - 9
147 740
146 000
-1.2
5.3
7 815
-6.5
+3.5
-8.1
-11 501
142.677
Bradford
54,925
54,900
0.0
6.1
3,350
-6.1
+6.2
-6.6
- 3,435
Sullivan
6,251
5,600
11.1
2.5
156
13.6
-7.3
17.3
- 1,170
Susquehanna
33,137
33,300
+0.6
4.8
1,591
-4.2
+3.7
-7.6
- 2,436
Tioga
36,614
35,500
-3.0
6.0
2,197
-9.0
+3.2
-9.0
- 3,180
Wyoming
16,813
16,700
0.6
3.1
521
-3.7
+0.3
-7.6
- 1,280

POPULATION, RATE OF NATURAL INCREASE, AND NET MIGRATION RATE, 1950-1960,AND 1960-19651/
Appendix - 122
Population
1960
Estimated
Population
196511
Estimated
Percent
Change
Population
1960-1965
Rate
of Natural
Increase
1960-1965
Estimated
Natural
Increase
1960-1965
Number
Estimated Net
Migration Rate
1960-1965
Percent
Change
Population
1950-1960
Net
Migration
Rate
1950-1960
Net
Migration
1950-1960
Number
Populati7m
1950
PEIVSYLVANIA (Cont'd.)
Pennsylvania - 10
884 381
890 200
+ 0.7
1.7
14 611
-1.0
-9.6
15.9
-155 339
978 448
Carbon
52,889
54,300
+ 2.6
1.7
899
+ 0.9
8.1
15.3
8,793
Lackawanna
234,531
226,400
-3.5
1.5
3,518
-5.0
-8.9
15.2
39,203
Luzerne
346,972
347,900
+ 0.3
1.7
5,899
-1.4
- 11.5
- 17.6
69,182
Monroe
39,567
44,100
+ 11.4
4.1
1,622
+ 7.3
+ 17.2
+ 7.1
+ 2,411
Pike
9,158
10,500
+ 14.1
1.0
92
+ 13.1
+ 8.7
+ 5.3
+444
Schuylkill
173,027
177,100
+ 2.4
1.1
1,903
+ 1.3
- 13.7
19.3
- 38,733
Wayne
28,237
29,900
+ 6.0
2.4
678
+ 3.6
-0.8
-8.0
-2,283
1/Population 1965 and net migration 1960-1965 are estimates.
2/ Source: Iutercensal Population Estimates, Pennsylvania State Planning Board, May 1, 1966.

Appendix - 12.;
APPALACHIAN PORTION OF PENNSYLVANIA
EDUCATION OF PERSONS 25 AND OVER 1960
Total*
Persons Com leting1-8 Years 1-4 Years
Elementar School Hi h School1 or More Yrsof College
Number 3,443,354 1,391,594 1,568,489 400,077
PercentDistribution 100.00 40.41 45.55 11.62
Percent Change1950-1960 1.39 -15.04 24.15 20.05
*Total includes persons who have never attended school, or who have less
than one year of schooling.
LABOR FORCi STATUS BY SEX - 14 AND OVER 1960
Total Male Female
In Out of In Out of In Out of
Labor Labor Labor Labor Labor Labor
Force* . Force Force* Force Force* Force
Number 2,1930888 2,082,504 1,530,688 521,821 663,200 1,560,683
PercentDistribution 51.30 48.70 74.58 25.42 29.82 70.18
Percent Change1950-1960 0.87 -4.88 -6.40 2.69 22.87 -7.17
*Includes persons in the Armed Forces.
EMPLOYMENT STATUS BY SEX - 14 AND OVER 1960
Total Male Female
Unem- Unem- Une1477-.
................
...R1.2127.21,...,...klaul. ...P.12212X28.......21. 81*Tioyel......2.12=!...
Number. 2,018,093 172,198 1,3980078 129,067 620,015 43,131
PercentDistribution 92.14 7.86 91.55 8.45 93.50 6.50
Percent Change1950-1960 -0.97 27.73 -8.14 16.11 20.20 82.30

PERCENT CHANGE 1962-1965 IN WORK FORCE,EMPLOYMENT AND UNEMPLOYMENT,
AND 1962-1965 RATE OF UNEMPLOYMENTAPPALACHIAN & NON-APPALACHIAN
PORTION OF STATE
(All numbers in Thousands)
Total Work Force
Change 1962-651965Number
PENNSYLVANIA 4,693.4
NON-APPALACHIAN PORTION 2,483.4
APPALACHIAN PORTION 2,210.0
1965Number
PENNSYLVANIA 4,487.5
NON-APPALACHIAN PORTION 2,380.5
APPALACHIAN PORTION 2,107.0
Appendix - 124
Number Percent
43.8 .9
49.6 2.0
-5.8 - .3
Total Employment
Change 1962-65Number Percent
204.7 4.8
96.8 4.2
107.9 5.4
Unemployment
1965 Change 1962-65KaTir Number Percent
PENNSYLVANIA 205.9 - 160.9 - 43.8
NON-APPALACHIAN PORTION 100.5 - 47.2 - 31.9
APPALACHIAN PORTION 103.0 - 113.7 - 52.5
PENNSYLVANIA
NON-APPALACHIAN PORTION
APPALACHIAN PORTION
1962
7.8
5.9
9.8
Rate of Unemployment
1963 1964 1965
7.2 5.9 4.4
6.1 4.5 4.1
8.5 7.7 4.7

Appendix - 125
MANUFACTURING EMPLOYMENT AND VALUE ADDED BY MANUFACTURE, 1954, 1958, AND 1963,
AND PERCENT CHANGE, 1954-1958.AND 1958-1963
Manufacturing Employment
Value Added by Manufacture
Number
Percent Change
Number ($1,000)
Percent Change
1954
1958
1963
1954-
1958
1958-
1963
1954
1958
1963
1954-
1958
1958-
1963
PENNSYLVANIA - STATE TOTAL
1,421,673
1,401,984
1,392,922
-1.4
-0.6
9,930,486
11,422,611
14,043,602
15.0
22.9
APPALACHIAN PORTION
640 309
648 929
648 145
1.3
-0.1
4,721,330
5,224,720
6,238,926
10.7
19.4
Pennsylvania - 4
97 976
89 115
90 328
-9.1
1.4
758 851
832 266
969 902
9.7
16.5
Clarion
2,246
2,188
2,897
-2.5
32.4
16,020
22,272
29,916
39.0
34.3
Crawford
9,452
8,672
8,311
-8.3
4.2
66,867
71,385
79,402
6.8
11.2
Erie
40,488
34,858
36,437
- 13.9
4.5
286,397
308,019
414,115
7.5
34.4
Forest
484
682
507
40.9
- 25.6
3,361
4,892
4,922
45.5
0.6
Lawrence
13,785
11,525
11,260
- 16.4
-2.3
104,474
108,796
128,130
4.1
17.8
Mercer
19,391
19,146
19,468
- 1.3
1.7
187,613
220,978
201,774
17.7
- 10.2
Venango
7,252
7,201
6,341
-0.1
- 11.9
55,017
58,891
65,994
7.0
12.1
Warren
4,898
4,843
5,107
-1.1
5.5
39,063
37,033
45,649
-5.1
23.3
Pennsylvania - 5
312 221
322 035
301 333
3.1
- 6.4
2,703,579
2,860,154
3,248,440
5.8
13.6
Allegheny
222,331
203,935
173,097
-8.2
- 15.1
1,653,928
1,677,268
1,718,139
1.4
2.4
Armstrong
6,628
5,812
5,605
- 12.3
- 3.7
74,470
66,446
78,504
- 10.7
18.1
Beaver
47,298
44,591
43,371
-5.7
-2.7
395,405
435,820
526,434
10.2
20.8
Butler
10,146
9,659
11,436
-4.9
18.5
88,708
91,836
176,660
3.5
92.4
Fayette
7,258
7,035
7,459
-3.1
6.0
41,294
52,829
66,886
27.9
26.6
Greene
645
580
662
- 10.0
14.1
2,208
2,677
3,734
21.2
69.1
Indiana
2,787
3,140
3,988
12.7
27.0
15,082
24,026
43,497
59.3
81.0
Washington
21,690
17,349
16,823
- 20.0
-2.7
156,954
159,336
179,794
1.5
14.5
Westmoreland
40,736
39,742
38,892
- 2.4
-2.1
275,530
349,916
454,792
26.9
65.1
Pennsylvania - 6
27 194
26 923
26 793
-1.0
-0.5
169 054
211 188
253 136
24.9
19.9
Cameron
1,771
1,950
1,639
10.1
- 15.9
9,680*
12,432*
13,537
28.4
8.9
Clearfield
5,487
5,211
4,741
-5.3
-9.0
28,384
40,144
39,703
41.4
39.8
Elk
7,263
6,959
6,840
-4.1
-1.7
47,834
58,174
66,288
21.6
38.6
Jefferson
4,878
4,474
5,382
-8.2
20.3
32,148
35,984
44,463
27.9
38.3
McKean
7,190
7,430
7,207
3.3
-3.0
48,490
61,138
83,414
26.1
36.4
Potter
605
894
984
47.7
10.0
2,518
3,316
5,731
31.6
72.8

Appendix - 126
MANUFACTURING EMPLOYMENT ANDVALUE ADDED BY MANUFACTURE,
1954, 1958, AND 1963,
AND PERCENT GRANGE,
1954-1958 AND 1958-1963
Manufacturing Employment
Value Added by Manufacture
NuMber
Percent Chan5e
Number ($1,000)
Percent Change
1954
1958
1963
1954-
1958-
1958
1963
1954
1958
1963
1954-
1958
1958-
1963
PENNSYLVANIA (Cont'd.)
Pennsylvania - 7
36,147
38,585
39,773
6.7
3.1
189,338
275,704
352,824
45.6
28.0
Bedford
1,045
1,299
4,595
24.3
22.8
3,609
5,000x"
9,618
33.5
92.4
Blair
8,424
10,398
11,651
23.4
12.1
47,007
83,773
115,595
78.2
37.9
Cambria
21,014
20,610
19,216
-2.0
-7.3
113,224
153,372
187,145
35.4
22.0
Fulton
165
345
464
109.0
34.5
439
916
2,029
108.6
121.5
untingdon
3,139
2,915
3,040
-7.1
43
16,511
18,837
20,214
14.0
22.4
Somerset
2,360
3,016
3,807
27.6
26.1
8,548
13,806
18,223
61.5
32.0
Pennsylvania - S
54,42S
61,262
65,713
12.6
7.3
365,207
428,364
579 404
22.8
62.3
Centre
3,723
3,602
4,231
-3.3
17.5
32,078
31,465
-.L.--
41,341
-1.9
-31.3
Clinton
5,740
5,710
6,124
-0.5
7.3
36,814
47,278
55,082
2c.4
16.4
Columbia
10,307
6,805
8,283
- 14.5
- 5.9
48,067
55,154
61,330
14.7
11,2
Juniata
681
765
1,009
12.3
31.9
2,788
2,925
5,489
4.9
87.6
Lycoming
17,953
16,874
18,033
-7.7
8.8
106,455
109,238
177,408
2.6
62.4
Mifflin
6,310
5,866
6,048
-7.0
3.1
33,832
38,618
53,322
14.1
38.1
Montour
1,746
2,146
3,231
22.9
50.5
14,877
17,072
30,456
14.7
78.4
Northumberland
12,964
13,523
13,905
4.3
2.8
72,150
107,933
124,658
49.5
15.5
Perry
1,104
821
978
- 25.6
19.1
5,234
3,685
4,926
- 29.5
3:1.6
Snyder
1,768
1,975
2,286
11.7
15.7
6,977
7,192
12,788
3.0
77.8
Union
1,402
1,475
1,585
5.2
7.5
5,935
7,804
12,604
31.4
61.5
Pennsylvania - 9
11 033
11,893
11,353
7.8
- 4.6
63,747
78,868
104,704
23.7
32.8
Bradford
_-1.-....-
4,256
5,152
4,695
21.5
- 8.9
29,177
39,456
51,920
35.2
31.5
Sullivan
677
518
600
- 23.4
15.8
2,409
1,953
2,589
- 18.9
32.5
Susquehanna
2,275
2,290
2,399
0.6
4.8
11,139
10,863
15,327
-2.4
41.6
Tioga
3,197
2,978
2,616
-6.8
-12.2
19,059
22,935
30,847
20.3
34.5
Wyoming
628
955
1,043
52.1
9.2
1,963
3,661
4,021
86.5
9.8

likNUFACTURING ENPLOYMENT AND VALUE ADDED BY akNUFACIURE, 1954, 1958, AND 1963,
AND PERCENT CHANGE, 1954-1955 AND 1958-1963
Appendi- - 127
Manufacturing Employment
Value Added by Manufacture
Number
Percent Change
NuMher ($1,000)
Percent Change
1954
1958
1963
1954-
1955
1958-
1963
1954
1958
1963
1954-
1958
1958-
1963
PENNSYLVANIA (Gont "d.)
Pennsclvania - 10
101,310
99,116
109,752
-2.2
10.7
471,554
538.176
730,516
14.1
35.7
Carbon
7,348
7,746
8,477
5.4
9.4
35,696
39,906
52,611
11.7
31.8
Lackawanna
31,524
27,362
29,025
- 13.1
6.1
164,764
159,779
190,151
-3.0
19.0
Luzerne
37,007
3,673
43,754
4.5
13.1
156,328
207,590
311,011
32.7
49.5
Monroe
4,119
3,566
4,639
-6.1
2C,0
21.191
25,647
32,201
21.0
25.6
Pike
296
170
110
- 59.4
- b.1
1,140*
539
953
- 52.7
76.8
Schuylkill
15,662
19,030
21,453
1.9
12.7
83,539
93,295
131,120
11.6
40.5
Wayne
2,354
2,319
2,297
-1.5
- 0.9
5,596
11,417
12,469
28.3
9.7
Source:
Census of Manufactures. 1954, 19554 and 1963.
*Actual census data were not available for the county because of the "disclosure rule.-
Therefore, estimates were made based on projections of
data fr available years and/or or the state averages ef value added per employee for the predominant industry ;,roups.

Appendix - 128
APPALACHIAN PCRTION OF PENNSYLVANIA
NUMBER OF ESTABLISHMENTS IN SELECTED SERVICES
AND SALES 1963 AND PERCENT CHANGE 1958-1963
Establishments ($1000)
Number1963*
PercentChange1958-63
Value1963*
PercentChange1958-63
All Establishments 33/322 8.95 71295 30.64
Personal Services 16 030 12.48 INA INA
Auto Repair, Garages 5,428 14.27 INA INA
Other Services 10,849 -4.44 INA INA
*Details may not add to total because of disclosure rule.
NUMBER OF WHOLESALE ESTABLISHMENTS AND
SALES 1963 AND PERCENT CHANGE 1958-1963
Establishments
Number
PercentChange
Sales (WOO)
ValuePercentChange
1963* 1958-63 1963* 1958-63
All Establishments 7 611 2.38 6,809,788 6.00
Merchant Wholesalers 5,635 1.11 3,0470394 13.35
Other Operating Types 1,976 6.18 3,7050190 -18.64
*Details may not add to total because of disclosure rule.

..n11.1111.11111MIIMMIIMIMMIII=1..
Appondix 120
APPALACHIAN PORTION OF PENNSYLVANIA
NUMBER OF RETAIL ESTABLISHMENTS AND SALES 1963,
AND PERCENT CHANGE 1958-1963
u/1111.1MO.1101.140
($1000)Establishments Sales
Number-
1963*
PercentChange
1958-63
Value1963*
PercentChange1958-63
ALL STORES 58,555 - 8.72 6,747,534 10.83
Lumber, bldg. materials, etc. 2,828 - 15.89 338,599 - 5.20
General merchandise 1,636 - 33.90 853,972 14.70
Food stores 12,472 - 14.66 1,796,174 6.64
Automotive dealers 3,380 1.56 1,251,428 29.12
Gasoline service stations 6,790 - 1.50 474,248 16.17
Apparel, accessory stores 3,967 7.40 387,750 2.74
Furniture, home furnishings, etc. 2,817 - 21.67 278,326 - 9.69
Eating, drinking places 13,514 3.14 471,386 8.14
Drug stores, proprietary stores 1,741 OMNI 3.23 206,063 12.68
Other retail stores 6,884 4.43 488,003 3.64
Non-store retailers 2,526 011111 4.40 1530153 30.24
*Details may not add to total because of disclosure rule.

Number
PercentDistribution
Percent Change1950-1960
Number
PercentDistribution
Percent Change1950-1960
Of
SOUTH caSILINA -- ST.:ATE TEAL
POPULATION BY SEX, 1960
4otal Male
Appendix - 130
Female
2,382,594 1,175,672 1,206,922
100.00 49.34 50.66
12.54 12.99 12.12
POPULATION BY PLACE 1960
Rural Ruralyo tal Non-Farm Farm Urban
981,3862,382,594 1,050,054 351,154
100.00 44.07 14.74
12.54 64.46 -49.88
DISTRIBUTION OF FAMILIES BY INCOME, 1960
41.19
26.15
Under $2,000- $3,000- $6,000- $10,000Total lajoost $2,999 5,999 $9)999 & Over
Number 541,358 143,410 70,620
PercentDistribution 100.00 26.49 13.04
Percent Change1950-1960 13.31 -39.59 -15.09
182,579 109,426 35,323
33.73 20.21 6.52
61.25 464.63 470.19

Number
PprcentDistribution
Percent Change1950-1960
Appendix - 131SOUTH CAROLINA -- STATE TOTAL
EDUCATION OF PERSONS 25 AND OVER, 1960
Persons Com leting1-8 Years 1-4 Years 1 or More Yrs
Total*
1,135,907 543,580 388,967
100.00 47.85 34.24
12.85 -4.56 50.6
151,776
13.36
39.37
*Total includes.persons who have never attended school, or who have lessthan one year of schooling.
Number
PercentDistribution
Percent Change1950-1960
LABOR FORCE STATUS BY SEX - 14 AND OVER 1960
TotalIn Out of
Labor LaborForce* Force
MaleIn Out ofLabor Labor
FemaleIn Out of
Labor LaborForce* Force Force* Force
896,246 683,110 585,351 183,205 310,895 499,905
56.75 43.25 76.16 23.84 38.34 61.66
12.29 9.60 5.93 35.08 26.59 2.51
*Includes persons in the Armed Forces.
Numbers
PercentDistribution
Percent Change1950-1960
EMPLOYMENT STATUS BY SEX 14 ANb OVER 1960
Unem-Male Female
Unem- Unem-
.6.1:e212.11214......14.17.21. Employed
803,733 34,568 509,156 19,176 294,577 15,392
95.88 4.12
6.40 29.53
96.37 3.63
-2.04 12.59
95.03 4.97
25.03 59.40

Appendix - 132
SOUTH CAROLINA - STATE TOTAL
NUMBER OF ESTABLISHMENTS IN SELECTED SERVICES
AND SALES 1963, AND PERCENT CHANGE 195S-1963
Establishments Receipts ($1000)Percent Percent
Number Change Value Change1963* 1958-63 1963* 1958-63
All Establishments 10,494 22.81 253,576 40.24
Personal Services 4,940 29.76 INA INA
Auto Repair, Garages 1,578 10.35 INA INA
Other Services 3,976 20.19 INA INA
*Details may not add to total because of disclosure rule.
NUMBER OF WHOLESALE ESTABLISHMENTS AND
SALES 1963 AND PERCENT CHANGE 1958-1963
Establishments Sales ($1000)
Percent PercentNumber Change Value Change1963* 1958-63 1963* 1958-63
All EsLablishments 2 738 14.70 ,1,993,321 24.17
Merchant Wholesalers 1,839 19.80 1,062,397 38.14
Other Operating Types 899 5-.52 930,924 11.32
*Details may not add to total because of disclosure rule.

Appendix - 113
SOUTH cAKIJIUL:=.331JX_Ilglai...
NUMBER OF RETAIL ESTABLISHMENTS AND SALES 1963,
AND PERCENT CHANGE 1958-1963
Establishments _pales ($1000)
Percent
Number Change1963* 1958-63
Value1963*
PercentChange1958-63
ALL STORES 22 156 1.69 ,272,632 30.07
Lumber, bldg. materials, etc. 817 -10.02 148,179 12.85
General merchandise 1,199 -41.94 259,832 25.92
Food stores 6,229 10.54 569,084 28.26
Automotive dealers 1,637 14.64 470,513 51.35
Gasoline service stations 3,119 5.84 198,487 29.35
Apparel, accessory stores 1,338 13.10 127,164 24.50
Furniture, home furnishings, etc. 1,090 -3.28 111,749 25.63
Eating, drinking places 2,497 -0.12 94,372 23.24
Drug stores, proprietary stores 655 -0.76 74,508 25.19
Other retail stores 2,844 3.76 179,430 17.52
Non-store retailers 731 23.06 39,314 80.74
*Details may not add to total because of disclosure rule.

Appendix - 134
SOUTH CAROLINA -. SUBREGION 50
POPULATION BY SEX, 1960
Total Male Female
Number 586,523 286,269 300,254
PercentDistribution 100.00 48.81 51.19
Percent Change1950-1960 12.09 11.58 12.58
Number
PercentDistribution
Percent Change1950-1960
Number
PercentDistribution
Percent Change1950-1960
POPULATION BY PLACE, 1960
TotalRural
Non-FarmRuralFarm Urban
586,523 267,645 40,188 278,4590
100.00 45.63 6.85 47.52
12.09 50.43 -68.26 27,41
DISTRIBUTION OF FAMILIES BY INCOME, 1960
Under $2,000- $3,000-Total 112222 $2,999 112222..
146,558 26,576 18,501 57,744
100.00 18,13 12.62 39,40
16.18 -45.31 -29.43 .47.63
$6,000-110.22.
$10,000& Over
33;699 10,038
22,99 6.85
409.82 396,93

POPULATION, RATE OF NATURAL INCREASE, AND NET MIGRATION RATE, 1950-1960, AND 1960-1965-1/
Appendix
-135
Estimated
Estimated
Percent Change
Population Ropulation
Population
1960
19652/
1960-1965
Rate
of Natural
Increase
1960-1965
Estimated
Natural Increase
Estimated Net
1960-1965
Migration Rate
Number
1960-1965
Percent
Change
Population
1950-1960
Net
Migration
Rate
1950-1960
Net
Migration
1950-1960
Number
Population
1950
SOUTH CAROLINA - STATE TOTAL
2 382
2594
2 511 300
+ 5.4
7.9
188 225
-2.5
+12.5
- 10.5
11212116
2,117 027
--2-
----
APPAIACHIAN PORTION
586,523
616,500
+ 5.1
7.2
42,283
- 2.1
+ 12.1
-7.8
- 40,593
523,265
South Carolina - 50
586 523
616 500
+ 5.1
7.2
42,283
- 2.1
+ 12.1
-7.8
- 40,593
523,265
Anderson
98,478
101,700
+ 3.2
6.2
6,106
- 3.0
+8.6
-9.0
8,156
Cherokee
35,205
35,300
+ 0.3
6.7
2,359
- 6.4
+0.6
- 17.6
6,162
Greenville
209,776
229,700
+ 9.5
8.1
16,992
+ 1.4
+ 24.8
+1.3
2,246
Oconee
40,204
40,800
+ 1.5
6.9
2,774
- 5.4
+3.0
- 15.2
5,927
Pickens
46,030
49,000
+ 6.5
7.7
3,544
- 1.2
+ 14.9
-3.5
-1,392
Spartanburg
156,830
160,000
+ 2.0
6.7
10,508
- 4.7
+4.3
- 14.1
- 21,202
1/ Population 1965 and net migration 1960-1965 are estimates.
// Source: South Carolina Population Estimates, Bureau of VitalStatistics, State Board of Health, April,
1965.

Appendix - 136
SOUTH CAROLINA - SUBREGION 50
EDUCATION OF PERSONS 25 AND OVER 1960
1-8 Years 1-4 Years 1 or More Yrs
Total* ALEatatta
Number 303,821 148,139 106,914 38,933
PercentDistribution 100.00 48.76 35.19 12.81
Percent Change1950.1960 15.03 - 2.15 51.19 37.16
*Total includes.persons who have never attended school, or who have less
than one year of schooling.
LABOR FORCE STATUS BY SEX - 14 AND OVER 1960
Total Male Female
In -Out of In Out of In Out of'Labor Labor Labor Labor Labor Labor
Force* . Force Force* Force Force* Force
Number
PercentDistribution
Percent Change1950-1960
241,926
59.43
14.58
165,135
40.57
5.56
151,070
77.42
6.95
44,057
22.58
22.12
90,856
42.87
29.99
121,078
57.13
0.60
*Includes persons in the Armed Forces.
EMPLOYMENT STATUS BY SEX - 14 AND OVER 1960
Total Male Female
'Unem----
Unem-122.21.....plozed Employed
Unem-yloyed
Number' 229,599 80570 142,782 4,562 86,817 4,008
PercentDistribution
96.40 3.60 96.90 3.10 95.59 4.41
Percent Change1950-1960
12.88 13.72 4.70 -2.56 29.55 40.43

2Appendix - 137
PERCENT CHANGE 1962-1965 IN WORK FORCE,EMPLOYMENT AND UNEMPLOYMENT,
AND 1962-1965 RATE OF UNEMPLOYMENTAPPALACHIAN & NON-APPALACHIAN
PORTION OF STATE(All Numbers in Thousands)
Total Work Force
1965 Change 1962-65Number Number Percent
South Carolina 981.3 30.0 3.2
Non-Appalachian Portion 710.3 - 11.8 1.6
Appalachian Portion 271.0 41.8 18.2
Total Employment
1965 Change 1962-65Number Number Percent
South Carolina 936.1 38.1 4.2
Non-Appalachian Portion 675.4 - 2.8 - .4
Appalachian Portion 260.7 40.9 18.6
Unemployment
1965 Change 1962-65Number Number Percent
South Carolina 45.2 8.1 - 15.2
Non-Appalachian Portion 34.9 9.0 - 20.5
Appalachian Portion 10.3 .9 9.6
Rate of Unemployment
1962 1963 1964 1965
South Carolina 5.6% 5.7% 5.3% 4.6%
Non-Appalachian Portion 6.1 5.8 5.5 4.9
Appalachian Portion 4.1 5.3 4.9 3.8

MA
NU
FAC
TU
RIN
G E
MPL
OY
ME
NT
AN
D V
AL
UE
AD
DE
D B
Y M
AN
UFA
CT
UR
E, 1
954,
195
8,A
ND
196
33AND PERCENT CHANGE, 1954-1958 AND
1958-1963
Manufacturing Employment
Number
1954
1958
1963
SOU
TH
CA
RO
LIN
A-S
TA
TE
TO
TA
L219,447
225,
510
261,655
APP
AIA
CH
IAN
PO
RT
ION
84,657
89,379
104,534
South Carolina
- 50
84,657
a.222
104,
534
Anderson
16,816
17,2
2517,751
Cherokee
4,371
3,875
5,183
Greenville
27,457
30,0
0735,463
Oconee
5,774
6,168
8,507
Pickens
5,086
6,770
9,897
Spartanburg
25,153
25,334
27,733
Percent Change
1954-
1958
-
Value Added by Manufacture
Number ($1,000)
Percent Change
1954
1958
1963
1954-
1958-
1958
1963
2.8
16.0
1,14
.0_2
36.
1,36
0,13
52,
111,
117
30.7
55.2
5.2.
6.17
.0360,736
465,376
702,223
29.0
50.9
LL
17.0
360,736
465,376
702,223
29.0
50.9
2.4
3.1
74,458
88,962
101,963
19.4
14.6
11.3
33.8
15,513
17,407
30,500
12.2
75.2
9.2
18.2
124,076
174,902
249,363
40.9
42.6
6.8
37.9
20,719
32,615
64,199
57.4
96.6
33.1
46.2
21,363
31,522
65,484
47.5
107.7
0.6
9.5
104,607
119,968
190,714
14.6
59.0
Source:
Census of Manufactures, 1954, 1958, and 1963.
e_

Appendix - 139SOUTH CAROLINA - SUBREGION 50
NUMBER OF ESTABLISHMENTS IN SELECTED SERVICES
AND SALES 1963, AND PERCENT CHANGE 1958-1963
EstablishmentsPercentChangeNumber
Receipts
Value
($1000)
PercentChange
1963* 1958-63 1963* 1958-63
All Establishments 3 053 23.60 84 889 49.00
Personal Services 1,499 34.44 INA INA
Auto Repair, Garages 561 12.42 INA INA
Other Services 993 16.00 INA INA
*Details may not add to total because of disclosure rule.
NUMBER OF WHOLESALE ESTABLISHMENTS AND
SALES 1963, AND PERCENT CHANGE 1958-1963
Establishments Sales ($1000)
Number1963*
PercentChange1958-63
Value1963*
PPrcentChange1958-63
All Establishments 798 17.70 664 568 29.89
Merchant Wholesalers 551 21.10 339,479 44.27
Other Operating Types 247 10.76 325,089 17.64
*Details may not add to total because of disclosure rule.

Appendix - 140
SOUTH CARMINA -- SUBREGION 50
NUMBER OF RETAIL ESTABLISHMENTS AND SALES 1963,
AND PERCENT CHANGE 1958-1963
Establishments Sales ($1000)Percent
Number Change1963* 1958-63
PercentValue Change1963* 1958-63
ALL STORES 5,661 2.61 643 579 33.55
Lumber, bldg. materials, etc.189 -17.47 37,264 4.35
General merchandise289 -25.32 82,895 31.79
Food stores1,356 4.87 162,501 32.47
Automotive dealers523 17.53 132,577 58.55
Gasoline iervice stations870 3.69 53,913 31.78
Apparel, accessory stores 347 25.27 34,674 32.62
Furniture, home furnishings, etc, 286 -6.84 33,433 25.41
Eating, drinking places 714 1.71 26,934 37.78
Drug stores, proprietary storz.s 174 -1.69 23,967 32.29
Other retail stores 720 6.35 41,571 18.51
Non-store retailers 193 4.89 13,850 61.01
*Details may not add to tOtal because of disclosure rule.

Number
PercentDistribution
Percent Change1950-1960
Number
PercentDistribution
Percent Change1950-1960
Number
PercentDistribution
Percent Change1950-1960
TENNESSEE 17 STATE TOTAL
POPULATION BY SEX, 1960
Total Male
Appendix - 141
Female
3,567,089 1,740,345 1,826,744
100.00 48.79 51.21
8.37 7.22 9.48
POPULATION BY PLACE 1960
TotalRural
Non-FarmRuralFarm Urban
3,567,089 1,115,517 586,744 1,864,828
100.00 31.27 16.45 52.28
8.37 35.56 -42.26 28.38
DISTRIBUTION OF FAMILIES BY INCOME, 1960
Under $2,000- $3,000- $6,000- $10,000
Total $2,000' .g2Luza. ,$9,999 8,, Over
893,622 226;925 115,285 299,932
100.00 25.39 12.90 33.56
10.58 -41.68 -21.14 59.19
182,175
20.39
415.49
69,305
7.76
424.24
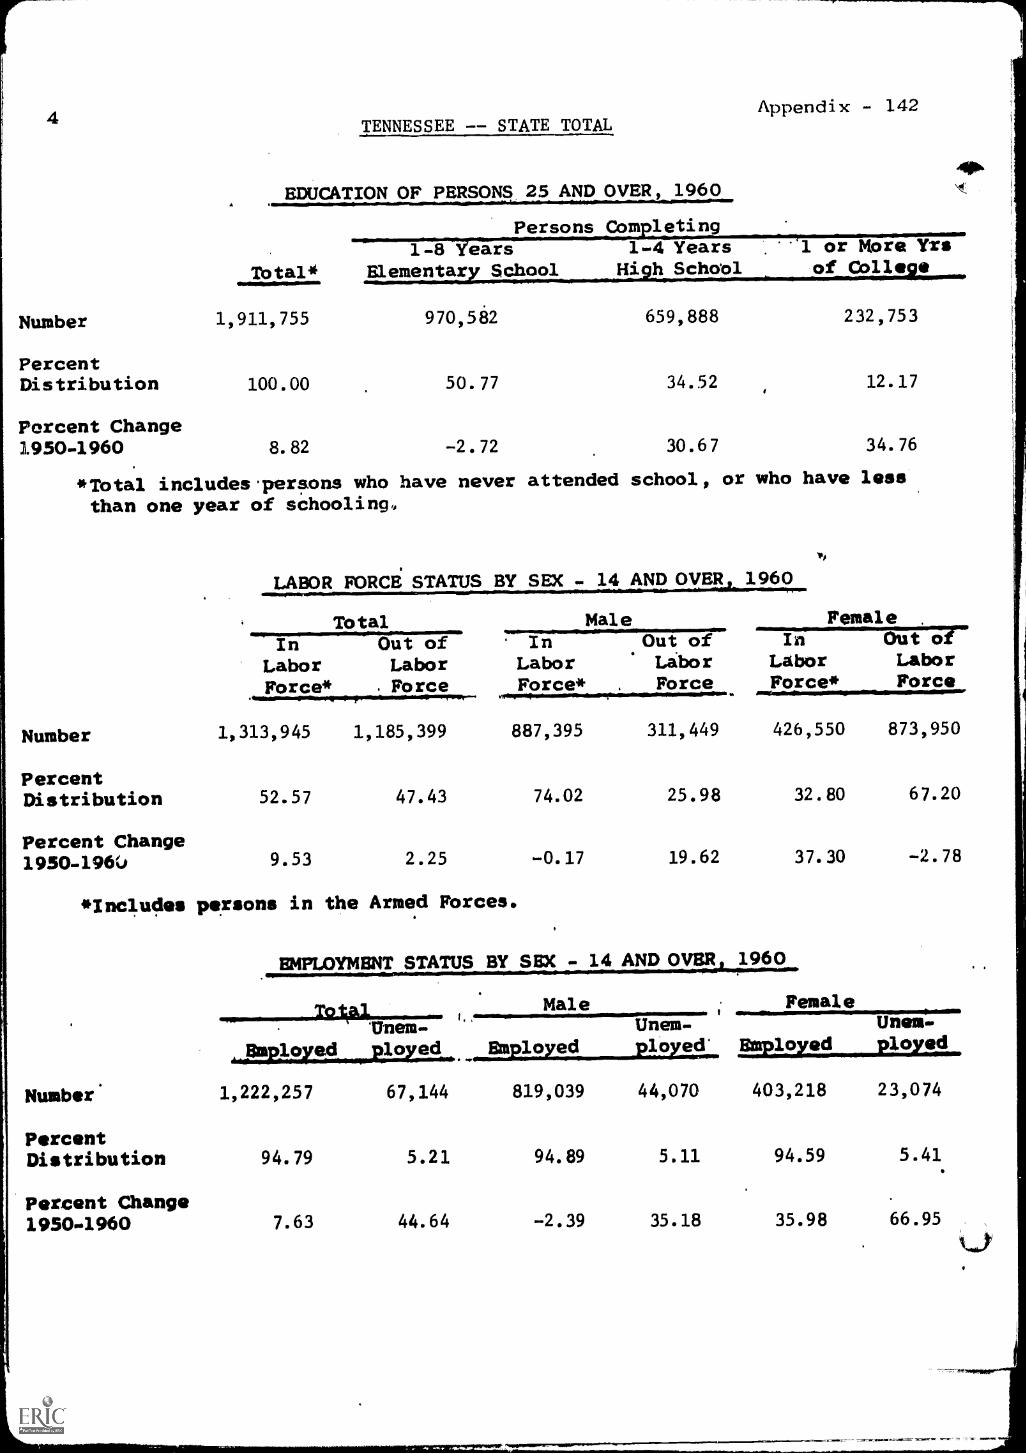
4Appendix - 142
TENNESSEE -- STATE TOTAL
Number
PercentDistribution
Percent Change1950-1960
EDUCATION OF PERSONS 25 AND OVER, 1960
Persons Com leting1-8 ears 1.4 Years 1 or More Yrs
Mtal* Elementary School High Scho1 of lleCo
1,911,755
100.00
8.82
970,582 659,888 232,753
50.77
-2.72
34.52
30.67
12.17
34.76
*Total includesTersons who have never attended school, or who have less
than one year of schooling.
LABOR FORCE STATUS BY SEX - 14 AND OVER 1960
TotalIn Out of
Labor LaborForce* . Force
MaleIn Out ofLabor LiborForce* . Force
110
Female .
In Out ofLabor LaborForce* Force
Number 1,313,945 1,185,399 887,395 311,449 426,550 873,950
PercentDistribution 52.57 47.43 74.02 25.98 32.80 67.20
Percent Change1950-196() 9.53 2.25 -0.17 19.62 37.30 -2.78
*Includes persons in the Armed Forces.
EMPLOYMENT STATUS BY SEX - 14 ANDOVER 1960
Male Female
trilem- Unem- Unem.
,IVIlyed Rloyed .a2112741.....21eati. Employed pllyed
Number. 1,222,257 67,144 819,039 44,070 403,218 23,074
PercentDistribution 94.79 5.21. 94.89 5.1.1. 94.59 5.41
Percent Change1950-1960 7.63 44.64 -2.39 35.18 35.98 66.95

8 TENNESSEE - STATE TOTAL Appendix - 143
NUMBER OF ESTABLISHMENTS IN SELECTED SERVICES
AND SALES 1963 AND PERCENT CHANGE 1958-1963
Establishments ReceiTts ($1000)Percent Percent
Number Change Value Change1963* 1958-63 1963* 1958-63
All Establishments 18 853 25.24 585,311 45.60,
Personal Services 8,654 34,57 INA INA
Auto Repair, Garages 2,797 23.16 INA INA
Other Services 7,402 16.55 INA INA
*Details may not add to total because of disclosure rule.
NUMBER OF WHOLESALE ESTABLISHMENTS AND
SALES 1963 AND PERCENT CHANGE 1958-1963
Establishments Sales ($1000)
Percent Percent
Number Change Value Change1963* 1958-63 1963* 1958-63
All Establishments 5,100 13.29 6,676,952 29.57
Merchant Wholesalers 3,484 16.91 3,334,692. 41,43
Other Operating Types 1;616 7.02 30342,260 19.56
*Details may not add to total because of disclosure rule.

TENNESSEE -- STATE TOTAL
NUMBER OF RETAIL ESTABLISHMENTS AND SALES 1963,
AND PERCENT CHANGE 1958-196300..N.1.1=4..
ALL STORES
Lumber, bldg. materials, etc.
General merchandise
Food stores
Automotive dealers
Gasoline service stations
Aprarel, accessory stores
Furniture, home furnishings, etc.
Eating, drinking places
Drug stores, proprietary stores
Other retail stores
Non-store retailers
Appendix - 144
Establishments Sales ($1000)
Percent
Number Change1963* 1958-63
Value1963*
PercentChange1958-63
33 226 0.91 4 009 128 25.32
1,573 -1.01 273,176 21.01
1,895 -31.79 490,113 21.51
8,322 1.48 929,462 17.49
2,289 17.02 847,517 46.91
4,448 5.65 335,789 28.49
1,917 11.39 207,921 21.58
1,741 1.87 185,579 18.86
4,524 -5.06 194,404 26.94
1,130 -1.82 142,669 31.03
3,931 9.13 313,532 25.40
1,456 17.14 88,966 -12.33
*Details may not add to tOtal because of disclosure rule.

Number
PercentDistribution
Percent Change1950-1960
Number
PercentDistribution
Percent Change1950.1960
Number
PercentDistribution
Percent Change1950-1960
Appendix - 145
APPALACHIAN PORTION OF TENNESSEE
POPULATrON BY SEX, 1960
Total Male Female
1,607,689 786,057 821,632
100.00 48.89 51.11
5.09 3.93 6.23
POPyLATION BY PLACE 1960
TotalRural
Non-rarm
1,607,689 657,531
100.00 40.90
5.09 41.14
DISTRIBUTION OF PAMMIES BY
Under $2,000.Total l2joc22 $21999
405,606 105,667 52,723
100.00 26.05 13.00
10.67 -41.54 -23.18
RuralFarm Urban
265,027
16.48
-45.59
rHcome 1060
685,130
42.62
18.78
$3,000. $6,000. $10,000P1999 AlMa. & Over
136,242 81,649 29,325
33.59 20.13 7.23
66.43 459.81 529.29

POPULATION, RATE OF NATURAL INCREASE, AND NET MIGRATION RATE, 1950-1960, AND
1960-19651/
Appendix
- 146
Population
1960
Estimated
Populatiion
19652?
Estimated
Percent Change
Population
1960-1965
Rate
of Natural
Increase
1960-1965
Estimated
Natural Increase
1960-1965
Number
Estimated Net
Migra
ion Rate
1960-1965
Percent
Change
Population
1950-1960
Net
Migration
Rate
1950-1960
Net
Migration
1950-1960
Number
Population
1950
TENNESSEE - STATE TOTAL
3,567,089
3,845,000
+7.8
6.6
235,428
+1.2
+8.4
8.3
- 272,605
3,291,718
APPALACHIAN PORTION
1,607,689
1,687,063
+4.9
6.3
101,284
-1.4
+5.1
- 11.4
- 174, 58
1,529,762
Tennessee - 38
156,417
163,419
+4.5
5.3
8,316
-0.8
-9.1
- 21.8
-37,595
172,126
Cannon
Clay
Cumberland
DeKalb
Fentress
Jackson
Macon
Overton
Pickett
Putnam
Smith
White
Tennessee - 39
8,537
7,289
19,135
10,774
13,288
9,233
12,197
14,661
4,431
29,236
12,059
15,577
92 416
8,441
7,136
20,500
11,200
14,493
8,982
12,186
15,072
4,063
32,785
12,471
16,090
101,642
-1.1
-2.1
+7.1
4.0
9.1
2.7
-0.1
+2.8
-8.3
+12.1
3.4
3.3
+10.0
4.6
4.4
7.2
4.7
8.3
2.4
4.1
4.4
5.4
5.8
4.3
5.1
6.4
393
321
1,378
506
1,103
992
500
645
239
1,696
519
794
5,933
-5.7
-6.5
-0.1
-0.7
0.8
-5.1
-4.2
-1.6
- 13.7
+6.3
-0.9
-1.8
+3.6
-6.9
-16.2
+1.4
-7.8
-10.9
-25.2
-10.3
-16.5
-13.0
-2.1
-14.5
-3.9
+5.9
15.8
- 27.6
- 17.5
- 17.8
- 99.7
- 35.4
- 21.0
- 28.2
- 26.6
- 15.5
- 22.8
- 15.8
-9.9
1,445
2,398
3,303
2,084
4,424
4,369
2,861
4,950
1,356
4,618
3,220
2,567
8,608
87,294
Coffee
Franklin
Grundy
Van Buren
Warren
Tennessee - 40
28,603
25,528
11,512
3,671
23,102
377 836
33,496
28,313
11,266
3,442
25,125
387,210
17.1
10.9
2.1
6.2
8.8
+2.5
7.5
5.8
5.5
5.3
6.4
6.3
2,145
1,481
633
195
1,479
23,969
+9.6
+5.1
-7.6
- 11.5
+2.4
3.8
+ 24.1
+0.4
-8.3
-7.9
+37
+ 10.0
+5.4
- 14.7
- 25.2
- 23.1
-9.1
-7.4
1,240
3,737
3,159
919
2,033
-25,399
343 578
Bledsoe
Bradley
Hamilton
Mhrion
McMinn
Meigs
Polk
Rhea
Sequatchie
7,811
38,324
237,905
21,036
33,662
5,160
12,160
15,863
5,915
7,599
42,992
241,030
20,651
34,835
5,176
11,813
16,820
6,294
-2.7
+12.2
1.3
1.8
3.5
0.3
-2.9
+6.0
6.4
6.0
8.5
6.1
6.2
6.1
4.7
6.3
6.3
6.2
467
3,258
14,512
1,304
2,053
243
766
999
367
8.7
3.7
4.8
8.0
-2.6
-4.4
-9.2
-0.3
+0.2
-8.8
+18.5
14.2
2_5
5.1
-15.1
-13.6
-1.1
+4.0
24.4
0.6
-4.0
-14.3
-9.5
-30.0
-29.6
-16.4
-10.7
2,093
203
8,307
2,932
3,034
1,822
4,172
2,633
609

POPULATION, RATE OF NATURAL INCREASE, AND NET MIGRATION RATE, 1950-1960, AND1960-1965-1/
Appendix -147
Population
1960
Estimated
Population
19652/
Estimated
Percent Change
Population
1960-1965
Rate
of Increase
1960-1965
Estimated
Natural Increase Estimated Net
1960-1965
Migration Rate
Number
1960-1965
Percent
Change
Population
1950-1960
Net
Migration
Rate
1950-1960
Net
Migration
1950-1960
Number
Populatic
1950
TENNESSEE (Cont'd.)
Tennessee - 41
654,236
690,710
+5.6
6.5
42 768
-0.9
+5.4
- 11.9
-73,764
620
z47
---
Anderson
60,032
61,321
+2.1
8.0
4,803
- 59
+1.1
- 22.2
-13,169
Blount
57,525
59,259
+3.0
6.0
3,452
-3.0
+5.2
- 13.6
-7,426
Campbell
27,936
28,226
+1.0
6.1
1,704
-5.1
- 18.7
- 34.2
-11,754
Claiborne
19,067
18,865
-1.1
5.9
1,125
-7.0
...23.1
- 36.0
-8,912
Cocke
23,390
25,592
+9.4
7.1
1,661
+2.3
+1.7
- 14.1
3,251
Grainger
12,506
13,423
+7.3
6.5
813
+0.8
-4.4
- 17.7
-2,314
Eamblen
33,092
38,740
+ 17.1
7.4
2,449
+9.7
+ 38.0
+ 20.4
+4,886
Jefferson
21,493
24,916
+ 15.9
6.1
1,311
+9.8
+9.3
-4.0
787
Knox
250,523
267,026
+6.6
6.4
16,033
+0.2
+ 12.3
-4.5
9,993
Loudon
23,757
24,277
+2.2
5.0
1,188
-2.8
+2.5
- 12.2
2,838
Monroe
23,316
23,781
+2.0
6.0
1,399
-4.0
-4.9
- 21.5
5,259
Morgan
14,304
14,675
+2.6
6.1
873
-3.5
-9.0
- 23.2
3,654
Roane
39,133
39,154
+0.1
6.8
2,661
-6.7
+ 23.6
+2.6
+835
Scott
15,413
16,128
+4.6
8.1
1,248
-3.5
- 11.2
- 28.9
5,020
Sevier
24,251
26,476
+9.2
6.8
1,649
+2.4
+3.7
- 11.4
2,665
Union
8,498
8,851
+4.2
4.7
399
-0.5
-2.0
- 19.1
1,656
Tennessee - 42
3262784
344,082
+5.3
6.2
20,245
-0.9
+6.7
-9,6
-29,292
306 2£
Carter
41,578
42,305
+1.7
4.9
2,037
-3.2
-2.0
- 16.1
-6,834
Greene
42,163
45,466
+7.8
5.5
2,319
+2.3
+2.7
- 10.2
-4,205
Hancock
7,757
7,382
-4.8
4.4
341
-9.2
- 14.9
- 29.5
-2,689
Hawkins
30,468
32,189
+5.6
6.2
1,889
-0.6
-0.1
- 15.8
-4,833
Johnson
10,765
10,790
+0.2
4.2
452
-4.0
- 12.3
- 24.4
-2,998
Sullivan
114,139
123,868
+8.5
7.3
8,332
+1.2
+ 20.1
+0.2
+166
Unicoi
15,082
15,244
+1.1
6.1
920
-5.0
-5.1
- 21.6
3,439
Washington
64,832
66,838
+3.1
6.1
3,955
-3.0
+8.1
-7.4
4,460
1/ Population 1965 and uet migration 1960-1965 are estimates.
2/
Source:
Tennessee Survey of Business, Vol. 1, No. 5, Jan., 1966, Bureau of Business and Economic Research, College of Business Administration, University
of Tennessee.

Appendix - 148
APPALACHIAN PORTION OF TENNESSEE
EDUCATION OF PERSONS 25 AND OVER 1960
Total*
Persons Com leting1-8 Years
Elementar School1 4 Years
Hi h Schobl1 or More Yrsof Colle e
Number 857,720 462,047 272,552 101,912
PercentDistribution 100.00 53.87 31.77 11.88
Percent Change1950-1960 9.47 -1.56 35.32 34.68
*Total includes persons who have never attended school, or who have less
than one year of schoolj.ng.
LABOR FORCE STATUS BY SEX - 14 AND OVER 1960
Total Male Female
In Out ofLabor LaborForce* Force
InLaborForce*
Out ofLaborForce
In Out ofLabor LaborForce* Force
,. .
Number 572,481 557,551 393,154 149,737 179,327 407,8.L._
PercentDistribution 50.66 49.34 72.47 27.58 30.54 69.46
Percent Change1950-1960 9.83 1.92 -0.29 18.15 41.27 -2.98
*Includes persons in the Armed Forces.
EMPLOYMENT STATUS BY SEX - 14 AND OVER , 1960
Male FemaleI
Unem- Unem- Unem-
ja2ralerstik...21.2zed... Employed ployed EMployed ployed
Number 537,139 34,377 368,352 23,881 168,787 10,496
PercentDistribution 93.98 6.02 93.91 6.09 94.14 5.86
Percent Change1950-1960 7.77 47.16 -2.46 38.62 39.79 71.17

Appendix - 149
PERCENT CHANGE 1962-1965 IN WORK FORCE,EMPLOYMENT AND UNEMPLOYMENT,
AND 1962-1965 RATE OF UNEMPLOYMENTAPPALACHIAN & NON-APPALACHIAN
PORTION OF STATE(All Numbers in Thousands)
Total Work Force
1965 Change 1962-65Number Number Percent
Tennessee 1,534.1 106.9 7.5
Non-Appalachian Portion 908.5 74.1 8.9
Appalachian Portion 625.6 32.8 5.5
Total Employment
1965 Change 1962-65Number Number Percent
Tennessee 1,473.5 132.6 9.9
Non-Appalachian Portion 874.1 84.4 10.7
Appalachian Portion 599.4 48.2 8.7
1965
Unemployment
1962-65ChangeNumber Number Percent
Tennessee 60.6 - 25.7 - 29.8
Non-Appalachian Portion 34.4 - 10.3 - 23.0
Appalachian Portion 26.2 - 15.4 37.0
Rate of Unemployment
1962 1963 1964 1965
Tennessee 6.0 5.9 4.9 4.0
Non-Appalachian Portion 5.4 5.3 4.1 3.8
Appalachian Portion 7.0 6.8 6.0 4.2

Appendix - 150
MANUFACTURING EMPLMENT AND VALDE ADDED BY MANUFACTURE, 1954, 1958,
AND 1963
AND PERCENT CHANGE, 1954-1958 AND 1958-1963
Manufacturing Employment
Value Added by Manufacture
_Number
Percent Change
Number ($1,000)
Percent Change
1954
1958
1963
1954-
1958
1958-
1963
1954
1955
1963
1954-
1958
1958-
1963
TENNESSEE - STATE TOTAL
260,599
282,862
339,1118
5.5
19.9
1,678,786
2,207,073
2,302,688
31.5
LL9.6
APPALACHIAN PORTION
146,471
155,388
176,569
6.1
13.6
945,521
1,226,962
1,676,335
29.5
16.6
Tennessee - 38
7,970
11,572
13,624
45.2
17.7
22,980
39,902
72,714
73.6
82.2
Cannon
9q1
1,366
1,476
39.2
8.1
3,089
4,653
7,129*
50.6
53.2
Clay
29
269
315
1,122.7
18.2
65
964*
757*
1,353.0
- 25.1
Cumberland
267
381
1,110
42.6
191.3
719
1,596
6,884
121.9
331.3
DeKalb
778
931
1,174
19.6
26.1
2,381
3,455*
5,797*
45.1
67.7
Fentress
203
1,064
263
424.1
75.3
549
2,360
680*
329.8
- 71.1
Jackson
114
332
389
191.2
17.2
960*
917
1,157*
252.6
26.2
Macon
521
950
1,141
82.3
20.1
2,497
4,742
8,091
89.9
70.6
Overton
1,287-
1,234
1,500
-3.5
91.6
2,076
3,069
5,386
47.5
75.4
Pickett
387
545
734
41.6
33.9
987
1,661*
3,152*
68.2
89.8
Putnam
1,504
2,199
4,295
46.2
95.3
4,929
9,560
27,027
93.9
182.7
Smith
412
588
780
354
32.7
898
1,813
2,349
101.8
29.6
White
1,501
1,710
1,920
13.9
12.3
4,530
5,112
4,305
12.8
- 57.8
Tennessee - 39
5,376
5 440
9,299
1.1
70.9
24,372
26 993
61,875
10.8
129.2
Coffee
2,158
1,984
2,972
-8.0
49.8
9,288
10,561
20,098
13.7
19.9
Franklin
1,117
1,082
1,626
-3.1
50.0
6,404
6,999
12,276
9.2
75.3
Grundy
248
113
841
-54.4
64.4
1,104
385
2,699
-65.1
601.0
Van Buren
135*
135
520
0.0
285.2
462*
590*
2,700*
21.2
357.6
Warren
1,718
2,126
3,340
23.7
57.1
7,114
8,458
24,102
18.8
185.0
Tennessee - 40
47,768
48 750
53,214
2.1
9.2
299,895
409 805
508,116
36.6
24.0
Bledsoe
103
374
419
263.1
12.0
204
878
1,331
330.3
51.6
Bradley
4,143
5,248
7,306
26.6
39.2
21,105
33,826
54,896
60.2
62.3
Hamilton
37,270
35,299
35,021
-5.3
-0.8
250,889
310,003
361,477
23.5
16.6
Marion
777
757
1,042
-2.5
37.6
3,913
5,042
10,020
28.8
98.7
NMinn
3,310
4,606
4,710
3.91
2.3
14,249
44,719
45,469
213.8
1.7
Nigs
45
42
31
-6.6
- 26.2
116
51
77
- 56.0
51.0
Polk
676
645
1,619
-4.5
151.0
4,756*
5,504*
17,397*
15.7
216.0
Rhea
1,066
1,191
2,310
11.7
94.0
3,370
7,342
13,466
117.8
83.4
Sequatchie
378
588
756
55.5
28.6
1,293*
2,440*
3,983*
88.7
63.2

Appendix - 151
MANUFACTURING EMPLOYMENT AND VALUE ADDED BY MANUFACTURE, 1954, 1958, AND 1963
AN1) PERCENT CHANGE, 1954-1958 AND 1958-1963
Manufacturing Employment
Value Added by Manufacture
Number
Percent Change
Number ($1,000)
Percent Change
1954
1958
1963
1954-
1958
1958-
1963
1954
1958
1963
1954-
1958
1958-
1963
TENNESSEE (Cont'd.)
Tennessee - 41
58,046
59,189
66,231
2.0
11.9
385,937
474,806
629,945
23.0
32.7
Anderson
6,001
6,044
6,641
0.7
9.9
77,622*
94,817*
130,506*
22.1
37.6
Blount
7,314
6,108
6,424
- 16.4
5.2
60,443*
61,220*
80,960*
1.2
32.2
Campbell
299
1,431
1,268
378.5
- 11.4
1,058
3,893
11,986
267.9
207.8
Claiborne
84
220
229
161.9
4.1
300
635
1,168
111.6
83.9
Cocke
769
1,438
2,176
86.9
513.2
4,545
8,317
17,333
82.9
108.4
Grainger
68
77
106
13.2
37.7
143
140
408*
-2.0
191.4
Hamblen
4,359
5,510
7,400
18.1
43.7
31,735
36,744
65,472
15.7
78.1
Jefferson
837
1,647
2,822
96.7
71.3
4,136
9,713
15,480
134.8
59.4
Knox
20,696
18,981
21,789
-8.3
14.8
104,594
129,916
184,389
24.2
41.9
Loudon
2,559
2,686
2,88E
4.9
7.5
7,879
17,558
24,942
122.8
42.1
Monroe
1,280
1,314
1,642
2.6
25.0
5,220
6,015
8,291
15.2
37.8
Morgan
245*
261
257
6.5.
-1.5
492*
1,001
952
103.4
-4.9
Roane
12,795
12,420
10,899
-2.9
- 12.4
85,087
98,270
79,651
15.4
- 18.9
Scott
444
641
891
44.3
39.0
1,434
2,329
3,926
62:4
68.6
Sevier
269
744
787
176.5
5.8
1,199
4,178
4,440
248.4
6.3
Union
27*
27
12
0.0
55.6
50*
60*
41
20.0
- 31.7
Tennessee - 42
27,311
30,437
34,201
11.4
12.4
212,337
275,456
403,688
29.7
46.6
Carter
4,060
4,574
4,274
12.6
- 11.7
24,467
33,427*
41,837*
36.6
25.2
Greene
2,433
2,905
3,985
19.3
37.2
22,120
36,143
74,248
63.3
105.4
Hancock
27
18
19
- 33.3
5.6
73
59
44
- 19.1
- 25.4
Hawkins
1,668
886
854
- 46.8
-3.6
8,839
5,277
7,768
- 40.2
47.2
Johnson
52
48
376
-7.6
683.3
85
177
1,705
108.2
863.3
Sullivan
16,716
18,331
20,403
9.6
11.3
138,451
179,945
246,080
29.9
36.7
Unicoi
1,100
482
900
- 56.1
86.7
2,707
1,804
5,694
- 33.3
215.6
Washingt-ln
1,255
3,193
3,399
154.4
6.5
15,595
18,624
26,312
19.4
41.3
Source:
Census of Manufactures, 1954, 1958, and 1963.
*Actual census eaca were not available for the county because of the "disclosure rule."
Therefore, estimates were made based on projections of
data for w-allable years and/or on the state averages of value added per employee for the
predominant industry groups.
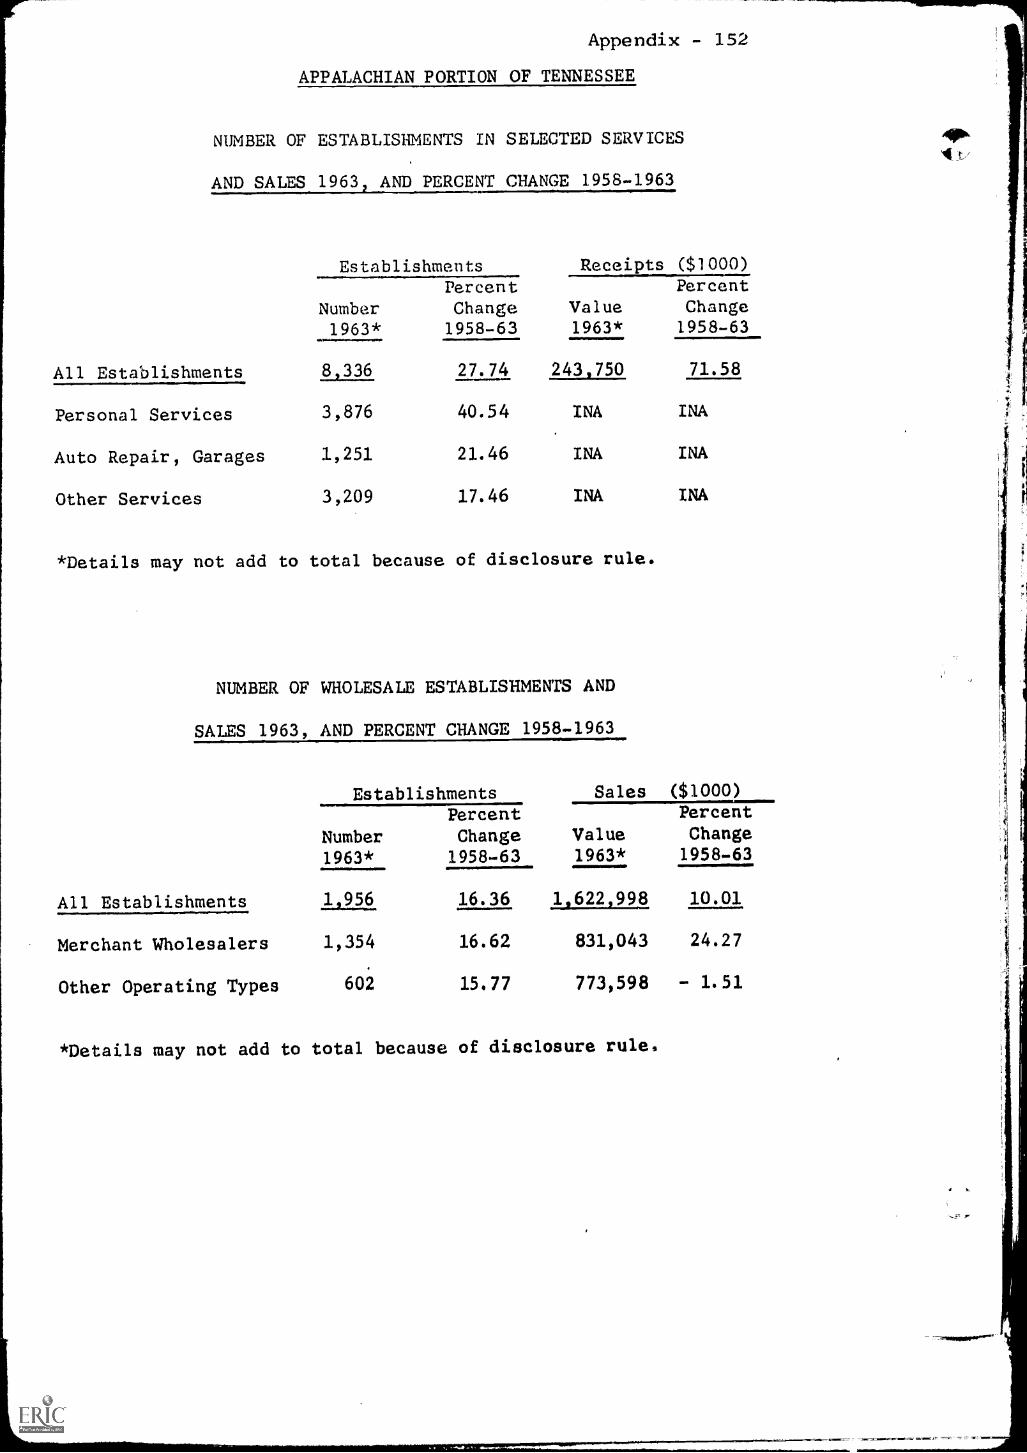
Appendix - 152
APPALACHIAN PORTION OF TENNESSEE
NUMBER OF ESTABLISHMENTS IN SELECTED SERVICES
AND SALES 1963 AND PERCENT CHANGE 1958-1963
Establishments Receipts ($1000)PercentChange
PercentNumber Change Value1963* 1958-63 1963* 1958-63
All Establishments 8 336 27.74 243 750 71.58
Personal Services 3,876 40.54 INA INA
Auto Repair, Garages 1,251 21.46 INA INA
Other Services 3,209 17.46 INA INA
*Details may not add to total because of disclosure rule.
NUMBER OF WHOLESALE ESTABLISHMENTS AND
SALES 1963, AND PERCENT CHANGE 1958-1963
Establishments Sales ($1000)
PercentNumber Change Value
PercentChange
1963* 1958-63 1963* 1958-63
All Establishments 1 956 16.36 1 622 998 10.01
Merchant Wholesalers 1,354 16.62 831,043 24.27
Other Operating Types 602 15.77 773,598 - 1.51
*Details may not add to total because of disclosure rule.

Appendix - 153
APPALACHIAN PORTION OF TENNESSEE
NUMBER OF RETAIL ESTABLISHMENTS AND SALES 1963,
AND PERCENT CHANGE 1958-1963
Establishments Sales ($1000)
Number1963*
PercentChange1958-63
Value1963*
PercentChange1958-63
ALL STORES 15 051 2.33 1,711,639 26.73
Lumber, bldg. materials, etc. 769 5.92 117,680 13.58
General merchandise 888 -29.86 201,871 17.66
Food stores 3,824 3.46 413,381 19.51
Automotive dealers 1,092 16.29 352,818 47.97
Gasoline Service stations 2,153 7.81 147,804 25.49
Apparel, accessory stores 824 12.57 73,178 13.56
Furniture, home furnishings, etc. 796 - 2.21 82,244 14.79
Eating, drinking places 1,933 - 5.75 83,701 27.67
Drug stores, proprietary stores 434 3.09 48,405 11.91
Other retail stores 1,802 16.33 101,455 15.73
Non-store retailers 536 5.51 21,281 18.9.5
*Details may not add to tOtal because of disclosure rule.

Number
PercentDistribution
Percent Change1950-1960
Number
PercentDistribution
Percent Change1950-1960
Number
PercentDistribution
Percent Change1950-1960
Appendix - 154
VIRGINIA -- STATE TOTAL
POPULATION BY SEX, 1960
Total Male Female
319541429 1,969,556 1,984,873
100.00 49.81 50.19
19.16 17.57 20.77
POPULATION BY PLACE 1960
TotalRural
Non-FarmRuralFarm Urban
319541429 113521340 3971176 2,204,913
100.00 34.20 10.04 55.76
19.16 31.73 -45.74 41.33
DISTRIBUTION OF FAMILIES BY INcams, 1960
Under $2,000-Total 11,2ao: $2,999 $3:00999
$10,000& Over
9541720 1661112 100,017 3171912 244,233 1261446
100.00 17.40 10.48 33.30 25.58 13.24
21.61 -39.69 -33.12 34.04 290.09 578.18

Appendix - 155
VIRGINIA -- STATE TOTAL
EDUCATION OF PERSONS 25 AND OVER, 1960
Persons Completing1-8 Years 1-4 Years 1 or More Yrs
Total* Elementar School Hi h School of Connie...
Number 2,083,159 878,750 790,721 358,332
PercentDistribution 100.00 42.18 37.96 17.20
Percent Change1950-1960 15.72 -2.11 45.60 45.71
*Total includes.persons who have never attended school, or who have less
than one year of schooling.
Number
PercentDistribution
Percent Change1950-1960
LABOR FORCE STATUS BY SEX - 14 AND OVEL 1960
TotalIn Out of
Labor LaborForce* . Force
1,532,599
55.67
17.39
- Npm11=m,
1,220,470
44.33
11.07
MaleIn Out ofLabor LaborForce* Force
cfRIONIIIMMOVINEMNIMMIN
1,058,865
77.83
8.68
*Includes persons in the Armed Forces.
301,655
22.1"
27.55
FemaleIn Out of
Labor LaborForce* Force
473,734
34.02
42,99
EMPLOYMENT STATUS BY SEX - 14 AND OVER, 1960
TotalUnem- Unem- Unem-
l.oyed Rloyedl Employed, ployed Employed ployed
Male t imommorma.Female
918,815
65.98
6.55
Number' 1,340,800 58,717 889,550 38,511 451,250 20,206
PercentDistribution 95.80 4.20 95.85 4.15 95.71 4.29.
'Percent Change1950.1960 16.57 26.24 6.25 18.86 44,21 43.19

VIRGINIA - STATE TOTALAppendix - 156
NUMBER OF ESTABLISMMENTS IN SELECTED SERVICES
AND SALES 1963k AND PERCENT CUANCE 1958-1963
All Establishments
Personal Services
Auto Repair, Garages
Other Services
EstablishmentsPercent
Number Change1963* 1958-63
17,719
7,992 21.55
2,317 16.08
7,410 13.11
Receipts ($1000)Percent
Value Change1963* 1958-63
589,069 24.93
INA
INA
INA
*Details may not add to total because of disclosure rule.
NUMBER OF WHOLESALE ESTABLISHMENTS AND
SALES 19630 ANDPERCENT CHANG; 1958-1963
All Establishments
Merchant Wholesalers
Other Operating Types
Establishments
Number1963*
4,317
20876
1044.1
PereentChange1958-63
.11.MMINIM....1111
1222
13.99
11.36
INA
INA
INA
Sales ($1000)
Value1963*
PercentChange1958-63
413750$
2,004,123 32.06
2,371,715 20.31
*Details may not add to total because of disclosure rule.

Appendix - 157
VIRGINIA -- STATE TOTAL
NUMBER OF RETAIL ESTABLISHMENTS AND SALES 1963,
AND PERCENT CHANGE 1958-1963
($1000)Establishments Sales
Percent
Number Change
1963* 1958-63
Value1963*
PercentChange1958-63
ALL STORES 32 206 -2.38 4,790,120 28.72
Lumber, bldg. materials, etc. 1,345 -9.12 264,811 23.22
General merchandise 1,876 -37.94 632,262 33.29
Food stores 7,661 0.16 1,129,219 22.21
Automotive dealers 2,053 10.50 969,854 54.00
Gasoline service stations 4,642 -0.34 375,523 23.68
Apparel, accessory stores 1,851 0.87 266,337 29.02
Furniture, home furnishings, etc. 1,750 2.40 208,476 15.86
Eating, drinking places 4,932 -5.26 276,483 23.01
Drug stores, proprietary stores 946 4.88 188,906 34.49
Other retail stores 3,832 8.65 407,982 9.42
Non-store retailers 1,336 14.97 70,267 40.02
*Details may not add to total because of disclosure rule.

Number
PercentDistribution
Percent Change1950-1960
Number
PercentDistribution
Percent Change1950-1960
APPALACHIAN PORTION OF VIRGINIA
POPULATION BY SEX, 1960
Total Male
Nppendix - 158
Femaleslimiloi=.1111110/6111111.111.
500,317 247,464 252,853
100.00 49.46 5054
- 5.89 - 7.17 - 4.61
POPULATION BY PLACE 1960
TotalRural
Non-FarmRuralFarm Urban
500,317 305,653 96,842 97,822
100.00 61.09 19.36 19.55
- 5.89 21.15 -49.98 14.11
DISTRIBUTION OF FAMILIES BY INCOME 1960
Under $2,000- $3,000- $6,000- $10,000Total .122.0.02 121929 $.5j999 $9,999 & Over
Number 120,355 35,320
PercentDistribution 100.00 29.35
Percent Change1950-1960 0.39 -40.29
17,837 42,743 19,073 5,382
14,82 35.51 15.85 4.47
-35.14 81,77 532.60 368.00

POPLLATION, RATE OF NATURAL INCREASE, AND NET MIGRATION RATE, 1950-1960, AND1960-19651/
Appendix
- 159
Population
1960
.Estimated
Population
19652/
Estimated
Percent
Change
Population
1960-1965
Rate
of Natural
Iucrease
1960-1965
Estimated
Natural
Increase
1960-1965
Number
Estimated Net
Migration Rate
1960-1965
Percent
Change
Population
1950-1960
Net
Migration
Rate
1950-1960
Net
Migration
1950-1960
Number
Population
1950
VIRGINIA - STATE TOTAL
3,966,949
4,425,637
+ 11.6
7.7
305 445
+3.9
+ 19.5
+0.4
+ 14,722
3,318,680
APPALACHIAN PORTION
500 334
506 505
+1.2
5.4
27 177
-4.2
-5.9
- 22.2
-117,815
531 649
Virginia
23
100 229
95 614
-4.6
4.9
4 891
9.5
- 16.6
32.4
- 38 959
120 082
Lee
25,824
24,362
-1.7
3.1
801
-4.8
28.5
- 41.9
- 15,113
Scott
25,813
25,395
-1.6
5.0
1,291
-6.6
-6.6
21.5
-5,949
Wise
43,579
40,693
-6.6
5.8
2,528
- 12.4
15.1
- 33.3
- 17,111
Norton*
5,013
5,164
+3.0
5.4
271
-2.4
-0.4
- 15.7
-786
Virginia
24
128 016
129 322
+1.0
7.3
9 333
6.3
4.1
- 25.4
33 865
133 471
Buchanan
36,724
38,484
+4.8
10.8
3,966
-6.0
+2.7
24.2
-8,648
Dickenson
20,211
19,571
-3.2
6.6
1,334
-9.8
13.6
33.9
-7,937
Russell
26,290
27,606
+5.0
5.8
1,525
-0.8
-2.0
18.7
5,018
Tazewell
44,791
43,661
-2.5
5.6
2,508
8.1
-5.7
- 25.8
12,262
Virginia - 25
55 220
57 803
+4.7
5.4
2 971
0.7
+3.2
- 12.3
- .6,591
53 490
Washington
38,076
40,422
+6.2
6.0
2,285
+0.2
+1.4
14.7
5,510
37,536
Bristol*
17,144
17,381
+1.4
4.0
686
2.6
+7.5
-6.8
-1,081
15,954
Virginia - 26
104 845
107 953
+3.0
4.5
4 752
1.5
-2.9
- 17.2
- 18,529
108 024
Bland
5,982
6,007
+0.4
1.4
84
-1.0
-7.1
- 18.6
1,196
6,436
Carroll
23,178
24,361
+5.1
4.1
950
+1.0
-3.8
16.7
4,034
24,092
Grayson
17,390
17,246
-0.8
3.4
591
-4.2
-7.2
- 21.0
3,939
18,734
Smyth
31,066
32,372
+4.2
6.4
1,988
-2.2
+2.9
- 13.3
4,006
30,187
Wythe
21,975
22,697
+3.3
4.3
945
-1.0
5.8
- 20.3
4,747
23,327
Galax*
5,254
5,270
+0.3
3.7
194
3.4
+0.1
11.6
607
5,248
Virginia - 27
54 939
57 134
+4.0
5.1
2 787
-1.1
-5.4
- 20.0
- 11 597
58 065
Floyd
10,462
10,524
+0.6
2.6
272
-2.0
-7.8
- 17.1
-1,936
11,351
Giles
17,219
18,091
+5.1
5.9
1,016
-0.8
9.2
- 26.1
-4,953
18,956
Pulaski
27,258
28,519
+4.6
5.5
1,499
-0.9
-1.8
- 17.0
-4,708
27,758

POPULATION, RATE OF NATURAL INCREASE, AND NET MIGRATION RATE, 1950-1960,
AND 1960-19651/
Appendix - 160
Population
1960
Estimated
Populatlop
1965E/
Estimated
Percent
Change
Population
1960-1965
Rate
of Natural
Increase
1960-1965
Estimated
Natural
Increase
1960-1965
Number
Estimated Net
Migration Rate
1960-1965
Percent
Change
Population
1950-1960
Net
Migration
Rate
1950-1960
Net
Migration
1950-1960
Number
Population
1950
VIRGINIA (Cont'd.)
Virginia - 28
57 085
58 679
+ 2.8
4.3
2 443
1.5
2.4
- 14.1
-8 274
58 517
Alleghany
12,128
13,119
+ 8.2
5.1
619
+ 3.1
0.4
17.6
-2,145
12,181
Bath
5,335
5,308
+ 0.5
4.6
245
-4.1
- 15.3
- 24.4
-1,537
6,296
Botetourt
16,715
17,969
+ 7.5
4.6
769
+2.9
+6.0
-5.0
-781
15,766
Craig
3,356
3,408
+ 1.5
2.8
94
-1.3
-2.8
- 13.0
-449
3,452
Highland
3,221
3,041
- 5.6
1.5
48
-7.1
- 20.8
- 27.0
-1,100
4,069
Clifton Forge*
5,268
5,450
+ 3.5
2.8
148
+0.7
9.1
- 16.4
949
5,795
Covington*
11,062
10,384
- 6.1
4.7
520
- 10.8
+0.9
- 12.0
-1,313
10,958
1/ Population 1965 and net migration 1960-1965 are estimates.
2/ Source: State of Virginia Estimates of Population of Counties and Cities as of July 1965,
Bureau of Population and Economic
Research, University of Virginia.
*Independent city.

ber
ercentstribution
ercent Change950-1960
Appendix - 161
APPALACHIAN Pan ION OF VIRGINIA
EDUCATION OF PEREONS, 25 AND OVER, 1960
Persons Com leting
'Dotal.*1-8 Years
School1-4 Years .
Hi h School1 or More Yrs.of Co1.219e,Elementary
257,183 153 9474 72,914 22,446
100.00 59.68 28.35 8.73
0.62 -9.39 47.90 19.55
*Total includes 'persons who have. never attended school, or who have lessthan one year of schooling.
Number.
PercentDistribution
Percent Change1950-1960
LABOR FORCE STATUS BY SEX - _14AND OVER 1960
TotalIn Out of
Labor LaborForce* . Force
Male Female'In Out of In Out of
Labor Labor Labor LaborForce* . Force Force* Force
vompwromormmumworromormormarmisra
157,151 187p686 115,761 52,553 41,390 135,133
45.57 54.43 68.78 31.22 23.45 76.55
-3.34 -0.93 -13.31 20.55 42.52 -7.35
*Includes persons in the Armed Forces.
Number
PercentDistribution
EMPLOYMENT STATUS BY SEX - 14 AND OVER 1960
Toaltrnem. MaleUnem- .
j127.21. Employed ployed. Employed ployed
-FemaleUnera'.
145,950 10,981 1062796 8,765 39,154 2,216
93.00 7 00
Percent Change1950.1960 -6.53
92.42 7.58 94 264 5.36.
73.89 -16.85 75.12 41.30 69.16
1

/Mau.
Appendix - 102
PERCENT CHANCE 1962-1965 IN WORK FORCE,EMPLOYMENT AND UNEMPLOYMENT,
AND 1962-1965 RATE OF UNEMPLOYMENTAPPALACHIAN & NON-APPALACHIAN
PORTION OF STATE(All Numbers in Thousands)
Total Work Force
1965 Change 1962-65Number Number Percent
Virginia 1,609.7 118.6 7.8
Non-Appalachian Portion 1,476.4 121.0 8.9
Appalachian Portion 133.3 - 2.4 - 1.8
Total Employment
1965 Change 1962-65Number Number Percent
Virginia 1,561.3 127.9 8.9
Non-Appalachian Portion 1,435.5 126.1 9.6
Appalachian Portion 125.8 1.8 1..5
Unemployment
1965 Change 1962-65Number Number Percent
Virginia 48.4 - 9.3 - 16.1
Non-Appalachian Portion 40.9 - 5.1 - 11.1
Appalachian Portion 7.5 - 4.2 - 35.9
1962
Rate of Unemployment
19651963 1964
Virginia 3.9% 3.6% 3.4% 3.0%
Non-Appalachian Portion 3.4 3.2 3.0 2.8
Appalachian Portion 8.6 7.9 7.2 5.7

Appendi x - 163
MANUFACTURING EMPLOYMENT AND VA1UE ADDED BY MANUFACTURE, 1954, 1958,
AND 1963,
AND PERCENT CRANGE, 1954-1958 AND 1958-1963
Manufacturing Employment
Value added by Manufacture
Number
Percent Change
Number (51,000)
Percent Chana0 e
1954
1958
1963
1954-
1958
1958-
1963
1954
1958
1963
1954-
1958
1958.-
1963
VIRGINIA - STATE
Tom
.239 733
258 136
309 084
7.7
17.0
1.629,041
2,122,652
3,046,268
30.3
43.5
APPALACHIAN PORTION
24,905
28 606
32.114
14.9
12.3
169,215
224,763
266 996
32.8
18.8
Virginia - 23
820
-1
2_.-092
1 019
24.6
- 0.3
2,821
5L053
5.852
79.1
15.8
Lee
54
_L40
100.0
-25.9
54
_30
97
- 44.4
223.3
Scott
250
316*
151
26.4
-52.2
590
1,361
1,008
52.9
- 25.9
Wise
424
499
660
17.6
32.3
1,475
2,782
3,694
88.6
32.8
Norton**
119
153
168
28.5
9.8
402
910
1.053
126.3
15.7
Virginia - 24
1,270
1,926
2L544
51.7
32.1
4,421
8L___
733
_17,041
102.1
95.1
Buchanan
199
192
_174
-3.5
-9.4
470
340
1,995
- 27.6
486.8
DiCkenson
48
91
183
89.5
101.1
99
649
642
555.5
-1.1
Russell
39
273
465
600.0
70.3
154
1,016
1,648
559.7
62.2
Tazewell
984
1,370
1,722
39.2
25.7
3,695
6,728
12,756
81.9
89.6
Virginia - 25
4 294
4,569
4 951
6.4
8.4
22 937
36,098
38,832
57.4
7.6
Washington
1,255
1,135
981
- 9.5
-13.6
7,274
11,134
9,236
53.0
-17.0
Bristol**
3,039
3,434
3,970
12.9
15.6
15,663
24,964
29,596
59.3
18.6
Virginia - 26
9,266
10,620
112-4q6 r__
14.6
7.7
53,016
68 931
88 426
30.0
28.3
Bland
235
328
481
39.6
46.6
600
850*
2,265
41.6
166.5
Carroll
386
638
925
65.3
45.0
1,163
2,349
6,048
101.9
157.5
Grayson
1,533
1,870
2,358
21.9
26.1
4,398
6,834
9,905
55.3
44.9
Smyth
3,551
4,105
3,997
15.6
- 2.6
30,187
38,401
48,522
27.2
26.4
Wythe
1,369
980
1,075
-28.4
9.7
6,015
6,739
5,274
12.0
- 21.7
Galax**
2,192
2,699
2,600
23.1
3.7
10,653
13,758
16,412
29.1
19.3
Virginia - 27
070
51.-___
5 857
27 -1_____
253
15.5
23.8
50 788
59L--
891
79L872
17.9
33.4
Floyd
_269
-- 496
15.5
554
- 1,368
1,913
146.9
39.8
573
84.3
Giles
2,533
2,497
2,940
- 1.4
17.7
38,804
46,289*
54,914*
19.2
18.6
Pulaski
2,268
2,864
3,740
26.3
30.6
11,430
12,234
23,045
2.9
88.4

Appendix - 164
MANUFACTURING EMPLOYMENT AND VALUE ADDED
inrtimuFAcruRE, 1954,
AND PERCENT CHANGE, 1954-1958 AND
1958-1963
1958, AND 1963,
Manufacturing Employment
Value added by Manufacture
Number
Percent Change
Number ($1,000)
Percent Change
1954
1958
1963
1954-
1958
1958-
1963
1954
1958
1963
1954-
1958
1958-
1963
VIRGINIA (Conttd)
Virginia - 28
4,185
4,612
4,911
10.2
6.5
35 232
--2.---
46L057
56
z973
30.7
23.7
Allegheny
279
402
588
44.0
46.3
__-_-
2,206*
-.......--
4,476*
74.3
1,265
162.9
Bath
41
87
-80.4
-12.5
65
847
-87.6
487.5
Botetourt
696
961
901
38.0
- 6.2
6,335
9,121
10,319
43.9
62.9
Craig
100
100*
108
0.0
8.0
236*
286*
352*
21.1
21.8
Highland
115
79
170
-31.3
115.2
287
239
920
-16.7
284.9
Clifton Forge**
115
27
319
-76.5
11174.1
422*
120
1,164
-71.5
870.0
Covington**
2,869
3,035
2,820
5.7
- 7.1
26,622
34,080*
39,696*
28.0
16.5
Source: Cisus of Manufactures,
1954, 1958, and 1963.
*Actual census data were not available
for the county because of the"disclosure rule."
Therefore, estimates were made based
on projections of
data for availableyears and/or on the state averages of value addedper employee for the predominant industry
groups.
**Independent city.

Appondi x -
APPALACHIAN PORTION OF VIRGINIA
NUMBER OF ESTABLISHMENTS IN SELECTED SERVTCES
AND SALES 1963 AND PERCENT CHANGE 195S-1963
All Establishments
Personal Services
Auto Repair, Garages
Other Services
EstablishmentsPercent
Number Change1963* 1958-63
1,843
862
271
18.83
31.80
2.26
710 12.34
Receipts ($1000)Percent
Value Change1963* 1958-63
37 418
INA
INA
33.09
INA
INA
INA INA
*Details may not add to total because of disclosure rule.
NUMBER OF WHOLESALE ESTABLISHMENTS AND
SALES 1963, AND PERCENT CHANGE 3958-1963
EstablishmentsPercent
Number Change
Sales ($1000)
ValuePercentChange
1963* 1958-63 1963* 1958-63
All Establishments 382 11.05 240 553 8.18
Merchant Wholesalers 243 8.97 112,696 16.86
Other Operating Types 139 14.88 116,262 -2.08
*Details may not add to total because of disclosure rule.

APPALACHIAN PORI ION OF VIRGINIA
NUMBER OF MAI!. ESTABL SUMENTS AND SALM 19C),
AND PERCENT CHANGE 19S8-1963
Appendix - too
Eviablishments Sa)es 01)0001rerc el,t
Ch%nAk_:
1958-11
P..r(eut
Number Change1963k 198-53
Valli,.
1963k
ALL STORES 4/7_68 -1.77 407 9014----.--- 1 S.23
Lumber, bldg. materials, etc. 186 -1.06 28,673 14.93
General merchandise 333 -47.81 31,705 -14.76
Food stores 169,474 12. 108,269 11.08
Automotive dealers 307 8.10 84,811 26.58
Gasoline service stations 687 4.41 41,289 12.93
Apparel, accessory stores 247 10.27 16,893 38.88
Furniture, home furnishings, etc. 217 - 15,720 8.82
Eating, drinking places 602 -9.34 18,391 4.65
Drug stores, proprietary stores 112 12.00 9,511 14.02
Other retail stores 463 3.12 33,358 24.22
Non-store retailers 140 12.90 5,148 119.45
*Details may not add to total because of disclosure rule.

Number
PercentDistribution
Percent Change1950-1960
Number
PercentDistribution
Percent Change1950-1960
Number
PercentDistribution
Percent Change1950-1960
WEST VIRGINIA - STATE TOTAL
POPULATION SY SEX, 1960
Appendix - 107
Total Male Female
1,860,421 914,906 945,515
100.00 49.18 50.82
-7.24 -9.08 -5.38
POPULATION BY PLACE 1960
TotalRural
Non-FarmRuralFarm Urban
1,860,421 120,938 1,028,382 711,101
100.00 6.50 55.28 38.22
-7.24. -70.57 14.25 2.39
DISTRIBUTION OF FAMILIES BY INCOME, 1960
Under $2,000- $3,000- $6,000- $10,000Total 2,0OO 12_2229 1.5_,999 & Over
462,078 100,889 49,635 160,049 112,683 38,822
100.00 21.83 10.74 34.64 24.39 8.40
-3.59 -37.33 -57.30 6.62 336.67 413.86
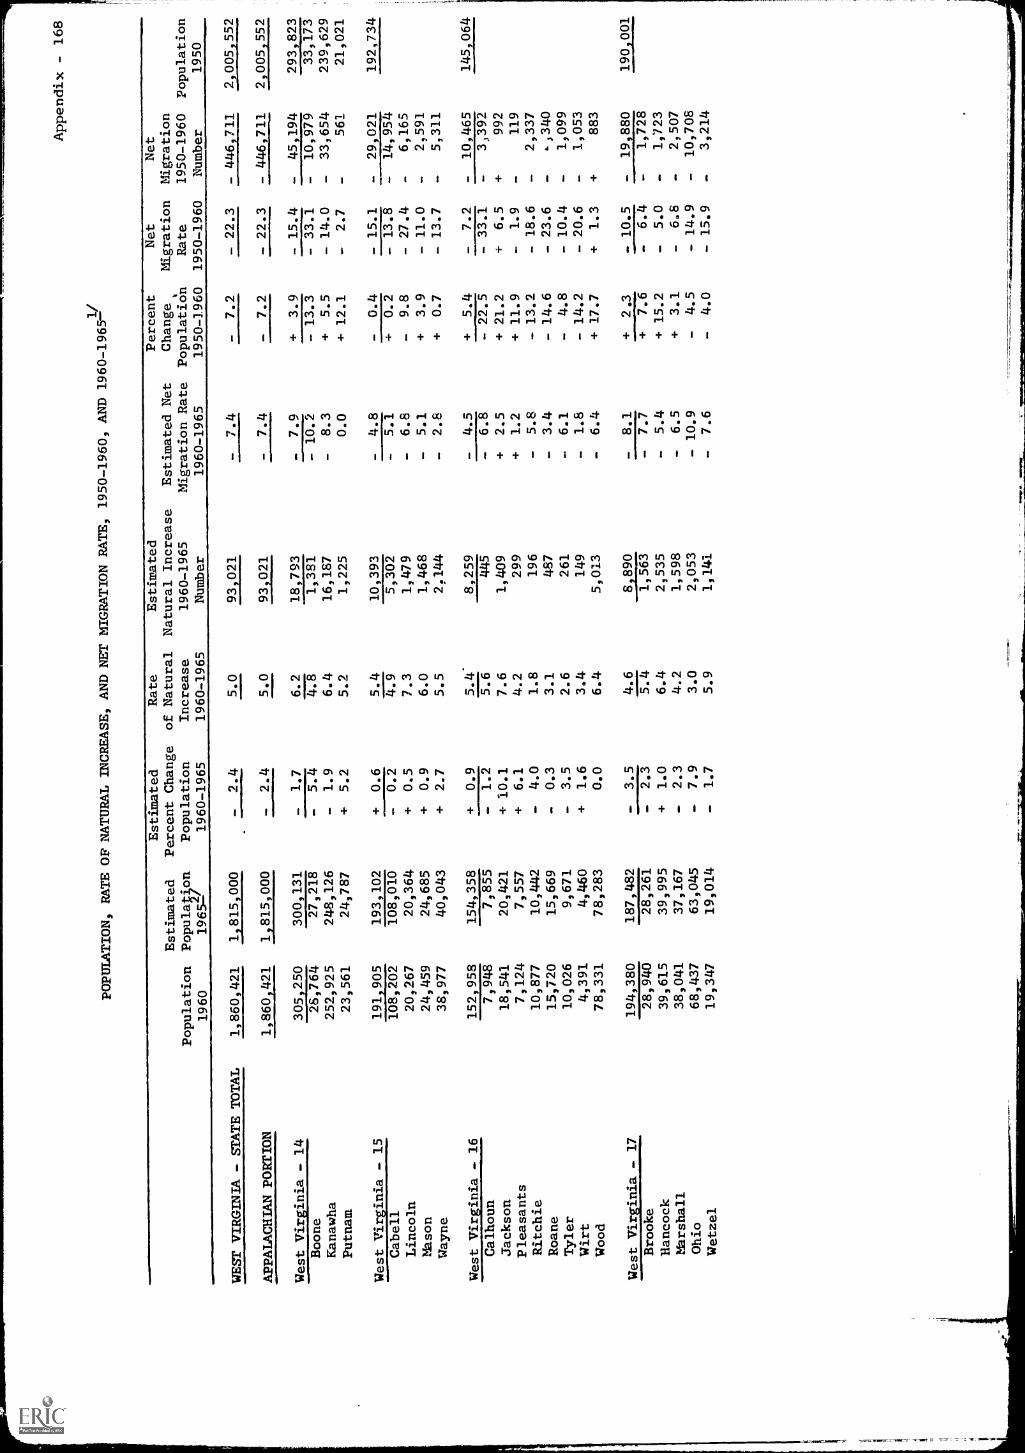
POPULATION, RATE OF NATURAL INCREASE, AND NET MIGRATION RATE,
1950-1960, AND
1960-19651/
Appendix - 168
Population
1960
Estimated
Popula;on
1965-f
Estimated
Percent Change
Population
1960-1965
Rate
of Natural
Increase
1960-1965
Estimated
Natural Increase
1960-1965
Nutber
Estimated Net
Migration Rate
1960-1965
Percent
Change,
Population
1950-1960
Net
Migration
Rate
1950-1960
Net
Migration
1950-1960
Number
Population
1950
WEST VIRGINIA - STATE TOTAL
1,860,421
1 815,000
-2.4
5.0
93,021
-7.4
-7.2
- 22.3
446 711
2,005 552
APPALACHIAN PORTION
1,860,421
1,815,000
-2.4
5.0
93 021
-7.4
-7.2
- 22.3
- 446,711
2,005 552
West Virginia - 14
305,250
300,131
-1.7
6.2
18,793
-7.9
+3.9
- 15.4
-45,194
293,823
Boone
26,764
27,218
-5.4
4.8
1,381
- 10.2
- 13.3
- 33.1
-10,979
33,173
Kanawha
252,925
248,126
-1.9
6.4
16,187
-8.3
+5.5
- 14.0
-33,654
239,629
Putnam
23,561
24,787
+ 5.2
5.2
1,225
0.0
+ 12.1
-2.7
-561
21,021
West Virginia - 15
191 905
193,102
+0.6
5.4
10,393
-4.8
-0.4
- 15.1
-29,021
192,734
Cabell
108,202
108,010
-0.2
4.9
5,302
-5.1
+0.2
- 13.8
-14,954
Lincoln
20,267
20,364
+0.5
7.3
1,479
-6.8
-9.8
- 27.4
-6,165
Mason
24,459
24,685
+0.9
6.0
1,468
-5.1
+3.9
- 11.0
-2,591
Wayne
38,977
40,043
+2.7
5.5
2,144
-2.8
+0.7
- 13.7
-5,311
West Virginia - 16
152,958
154,358
+0.9
5.4'
8,259
-4.5
+5.4
-7.2
-10,465
145,064
Calhoun
7,948
7,855
-1.2
5.6
445
-6.8
- 22.5
- 33.1
-3,392
Jackson
18,541
20,421
+ 10.1
7.6
1,409
+2.5
+ 21.2
+6.5
+992
Pleasants
7,124
7,557
+6.1
4.2
299
+1.2
+ 11.9
-1.9
-119
Ritchie
10,877
10,442
-4.0
1.8
196
-5.8
- 13.2
- 18.6
-2,337
Roane
15,720
15,669
-0.3
3.1
487
-3.4
- 14.6
- 23.6
--,340
Tyler
10,026
9,671
-3.5
2.6
261
-6.1
-4.8
- 10.4
-1,099
Wirt
4,391
4,460
+1.6
3.4
149
-1.8
- 14.2
- 20.6
-1,053
Wood
78,331
78,283
0.0
6.4
5,013
-6.4
+ 17.7
+1.3
+883
West Virginia - 17
194,380
187,482
-3.5
4.6
8 890
-8.1
+2.3
- 10.5
-19 880
190,001
Brooke
28,940
28,261
-2.3
5.4
1,563
-7.7
+7.6
-6.4
-1,728
Hancock
39,615
39,995
+1.0
6.4
2,535
-5.4
+ 15.2
-5.0
-1,723
Marshall.
38,041
37,167
-2.3
4.2
1,598
-6.5
+3.1
-6.8
-2,507
Ohio
68,437
63,045
-7.9
3.0
2,053
- 10.9
-4.5
- 14.9
-10,708
Wetzel
19,347
19,014
-1.7
5.9
1,141
-7.6
-4.0
- 15.9
-3,214

Appendix - 169
POPULATION, RATE OF NATURAL INCREASE, AND NET MIGRATION RATE, 1950-1960,
AND 1960-19651(
Population
1960
Estimated
PopulaWm
1965±1
Estimated
Percent Change
Population
1960-1965
Rate
of Natural
Increase
1960-1965
Estimated
Natural Increase
1960-1965
Number
Estimated Net
Migration Rate
1960-1965
Percent
Change
Population
1950-1960
Net
Migration
Rate
1950-1960
Net
Migration
1950-1960
Number
Population
1950
WEST VIRGINIPI (Cont'd.)
West Virginia - 18
274,164
264,959
-3.4
3.6
9,902
-7.0
- 10.8
- 21.5
-66,331
307 821
Doddridge
6,970
-7332
+6.1
T.:7
-1§7
1-+
6.9
- 22.8
- 28.3
-2,554
Gilmer
8,050
8,697
+8.0
4.5
362
4-
3.5
- 17.4
- 25.8
-2,511
Harrison
77,856
74,258
-4.6
4.0
3,114
-8.6
-8.7
- 20.2
-17,246
Lewis
19,711
19,803
+0.5
2.5
493
-2.0
-6.5
- 13.6
-2,871
Marion
63,717
59,874
-6.0
2.9
1,848
-8.9
- 10.9
- 20.5
-14,678
Mbnongalia
55,617
53,835
-3.2
4.4
2,447
-7.6
-8.5
- 21.5
-13,064
Preston
27,233
26,389
-3.1
5.1
1,389
-8.2
- 13.3
- 27.4
-6,611
Taylor
15,010
14.571
-2.9
1.1
165
-4.0
- 18.5
- 26.0
-4,796
West Virginia - 19
120,596
125,049
+3.7
4.9
5,884
-1.2
+1.5
- 10.8
-12 789
118,830
Berkeley
33,791
35,613
+5.4
4.7
1,5ud
-I-
0.7
+ 11.3
-1.1
-327
Grant
8,304
8,902
+7.2
6.1
507
+1.1
-5.2
- 20.9
-1,829
Hampshire
11,705
11,917
+1.8
3.7
443
-1.9
-6.9
- 16.4
-2,067
Hardy
9,308
9,166
.-
1.5
4.0
372
-5.5
-7.2
- 19.5
-1,953
Jefferson
18,665
19,348
+3.7
5.8
1,083
-2.1
+8.6
-4.6
-798
Mineral
22,354
23,993
+7.3
5.8
1,297
+1.5
+0.1
- 10.8
-2,413
Morgan
8,376
8,401
+ 0.3
4.0
335
-3.7
+1.2
- 13.3
-1.103
Pendleton
8,093
7,709
-4.8
3.2
259
-8.0
- 13.1
- 24.7
-2,299
West Virginia - 20
178,674
175,389
-1.8
5.0
9,023
-6.8
- 15.1
- 29.1
-61,314
210 547
Barbour
15,474
15,032
-2.9
3.8
588
-6.7
- 21.6
- 30.7
-6,056
Braxton
15,152
14,909
-1.6
4.6
697
-6.2
- 16.2
- 29.3
-5,304
Clay
11,942
11,203
-6.2
7.1
848
- 13.3
- 20.2
- 42.2
-6,314
Gteenbrier
34,446
33,737
-2.1
4.9
1,688
- 7.0
- 12.3
- 26.6
-10,460
Nicholas
25,414
24,407
-4.0
6.2
1,576
- 10.2
-8.2
- 26.9
-7,451
Pocahontas
10,136
10,099
-0.4
3.1
314
-3.5
- 18.8
- 29.3
-3,655
Randolph
26,349
27,079
+ 2.8
5.3
1,396
-2.5
- 13.8
- 27.1
-8,266
Tucker
7,750
7,372
- 4.9
3.3
256
-8.2
- 26.9
- 34.3
-3,638
Upsbur
18,292
18,612
+ 1.7
4.2
768
-2.5
-4.9
- 16.4
-3,154
Webster
13,719
12,939
-5.7
6.5
892
- 12.2
- 23.3
- 39.2
-7,016

POPULATION, RATE OF NATURAL INCREASE, AND NET MIGRATION RATE,
1950-1960, AND 1960-1965-1/
Appendix - 170
Population
1960
Estimated
PopulaVion
1965-1
Estimated
Percent Change
Population
1960-1965
Rate
of Natural
Increase
1960-1965
Estimated
Natural Increase
1960-1965
Number
Estimated Net
Migration Rate
1960-1965
Percent
Change
Population
1950-1960
Net
Migration
Rate
1950-1960
Net
Migration
1950-1960
Number
Population
1950
WEST VIRGINIA (Cont'd.)
West Virginia - 21
234,987
223,479
-4.9
3.7
8,786
-8.6
- 17.9
- 32.5
-92.980
286
L035
Fayette
61,731
57,843
-6.3
3.4
2,099
-9.7
- 25.1
- 40.3
-33,203
---
Mercer
68,206
66,721
-2.2
4.1
2,796
-6.3
-9.1
- 23.5
-17,611
Monroe
11,584
11,093
-4.2
2.4
278
-6.6
- 11.7
- 20.7
-2,715
Raleigh
77,826
72,612
-6.7
4.2
3,269
- 10.9
- 19.2
- 354
-34,123
Summers
15,640
15,210
-2.8
2.2
344
-5.0
- 18.5
- 27.8
-5,328
West Virginia - 22
207,507
191,051
-7.9
6.2
12,877
- 14.1
... 20.6
- 41.6
- 108 737
261 227
Logan
61,570
56,425
-8.4
6.1
3,756
- 14.5
- 20.4
- 40.9
-31,639
McDowell
71,359
62,798
- 12.0
5.8
4,139
- 17.8
- 27.8
- 47.4
-46,898
Mingo
39,742
38,763
-2.5
7.1
2,822
-9.6
- 16.2
- 39.8
-18,869
Wyoming
34,836
33,065
-5.1
6.2
2,160
- 11.3
-7.2
- 30.2
-11,331
I/
Population 1965 and net migration 1960-1965 are estimates.
2/
Source:
Estimated Population, West Virginia State Chamber of Commerce.

WEST VIRGINIA - STAT TOTAL
EDUCATION OF PERSONS 25 AND OVER, 1960
Appendix - 171
'Dotal*
Perso ns Com leting-4-7.737a7;
School1-4 Years
Hi h School1 or More Yrsof Colle e
Number 999,731
.Elementary
517,691 345,553 114,597
PercentDistribution 100.00 51.78 34.56 11.46
Percent Change1950-1960 -3.83 -14.70 18.89 12.61
*Total includes persons who have never attended schthan one year of schooling.
ool, or who have less
LABOR FORCE STATUS BY SEX 14 ANDO ER 1960
Total Male FemaleIn
LaborForce*
Out ofLaborForce
InLaborForce*
Out ofLiborForce
In Out ofLabor LaborForce* _Force
AsswasarImemw.m..111NPMaaamow".....".108k-
Number 588,080 707,335 425,634 201,707 162,446 505,628
PercentDistribution 45.40 54.60 67.85 32.15 24.32 75.68
Percent Change1950-1960 40.93 -5.12 -18.49 12.92 17 .67 -10.80
*Includes persons in the Armed Forces.
EMPLOYMENT STATUS BY SEX - 14 AND OVER 1960
TotalUnem-
.fi.2.3-132.4=1.......22-.2Y..2.51..
MaleUnem-
Employed ployed
Femal
EmployedUnem-ployed
Number' 538,214. 49,018 385,153 39,685 153,061 9,333
PercentDistribution
oercent Changei950-1960
91.65
-14.32
8.35
55.83
90.66
-22.31
9.34.
53.55
94.25
15.63
5 .75
66.3 3

11111PUMIMMINFIRMIEMPIPP....1.11.1.7.1.P., 7, .11r1M.MMEIM11111==1141MIMIPINIMIPT
Appendix - 172
PERCENT CHANGE 1962-1965 IN WORK FORCE,EMPLOYMENT AND UNEMPLOYMENT
AND 1962-1965 RATE OF UNEMPLOYMENTAPPALACHIAN & NCN-APPALACHIAN
PORTION OF STATE(All Numbers in Thousands)
Total Work Force
1S65 Change 1962-65Number Number Percent
West Virginia 611.0 - 3.6 - 0.6
Non-Appalachian Portion
Appalachian Portion 611.0 - 3.6 - 0.6
West Virginia
Non-Appalachian Portion
Appalachian Portion
West Virginia
Non-Appalachian Portion
Appalachian Portion
Total Employment
1965 Change 1962-65Nunber Number Percent
563.4
563.4
22.5 4.2
22.5 4.2
Unemployment
1965 Change 1962-65Number Number Percent
47.6
47.6
-26.1 - 35.4
-26.1 - 35.4
Rate of Unemployment
1962 1963 1964 1965
West Virginia 12.0% 10.3% 8.8% 7.8%
Non-Appalachian Portion - - - -
Appalachian Portion 12.0 10.3 8.8 7.8

Appendix - 173
MANUFACTURING EMPIOYMENT AND VALUE ADDED BY MANUFACTURE, 1954, 1958, AND
1963,
AND PERCENT CHANGE, 1954-1958 AND 1958-1963
Manufacturing Employment
Value Added by Manufacture
Number
Percent Change,
Number ($1,000)
Percent Change
1954
1958
1963
1954-
1958-
1958
1963
1954
1958
1963
1954-
1958-
1958
1963
WEST VIRGINIA - STATE TOTAL
118,568
116,201
117,026
2.0
0.7
988a274
1 268 842
1 887,148
28.4
48.7
APPAIACHIAN PORTION
118a568
116
---L___
201
117,026
-2.0
0.7
988,274
1,268,842
1 887,148
28.4
48.7
West Virginia - 14
26,005
23,236
22,639
-10.6
-2.6
295,918
400,662
672,338
35.4
67.8
Boone
105
96
105
-8.5
9.4
316
199
593
-37.0
198.0
Kanawha
23,302
21,140
21,157
-9.3
0.1
260,482
367,612
645,023
41.1
75.4
Putnam
2,598
2,000
1,377
-23.0
- 31.2
35,120
32,852
26,722*
-6.4
- 18.7
West Virginia - 15
15,898
13,560
15 008
-15.4
10.7
115,786
120,065
160,672
3.7
33.8
Cabell
13,793
11,663
11,591
-15.4
-0.6
105,863
109,565
129,781
3.4
18.5
Lincoln
187
205
215
9.6
4.9
509
703
791
38.1
12.5
Mason
1,087
1,019
1,628
-6.2
59.8
5,611
5,598
15,868
0.2
183.5
Wayne
831
673
1,574
-19.0
133.9
3,803
4,199
14,232
10.4
238.9
West Virginia - 16
10,065
13,176
16,088
30.9
22.1
27,661
37,516
99,420
35.6
165.0
Calhoun
67
165
332
146.2
101.2
102
324*
9,215*
217.6
583.6
Jackson
107
1,988
3,026
1,757.9
52.2
367
24,838*
54,187*
6,667.8
118.2
Pleasants
752
736
708
-2.1
-3.8
14,322
18,108*
24,959*
26.4
37.8
Ritchie
444
410
571
-7.6
39.3
1,093
1,236
2,698
13.0
118.3
Roane
138
548
781
297.1
42.5
428
2,440
3,970
470.0
62.7
Tyler
606
347
598
-42.7
72.3
1,559
3,494
20,496*
124.1
-486.6
Wirt
32
43
37
34.3
- 14.0
58
123
218
112.0
77.2
Wood
7,919
8,939
10,035
12.8
12.3
62,924
92,472
162,909
46.9
76.2
Wst Virginia - 17
35 446
32 650
29 109
7.8
- 10.8
269,035
329,756
435,134
22.6
32.0
Brooke
4,167
3,598
3,007
-13.6
- 16.3
34,853*
38,858*
36,337
11.4
-6.5
Hancock
16,008
15,147
14,726
-8.6
0.7
136,676*
161,347*
248,906
18.0
54.3
Marshall
5,839
5,703
5,252
-2.3
-7.9
43,841
67,036
93,062
52.9
38.8
Ohio
8,758
7,512
5,695
-14.2
- 24.8
50,091
54,909
53,556
9.6
-2.5
Wetzel
674
690
429
2.3
- 37.8
3,574
7,606
3,273
112.8
56.9

MANITALWRING EMPLOYMENT AND WiLUE ADDED BY MANUA ETRE, 1954,
AND PERCENT CHANGE, -954-1958 AN
1958-1963
1958, kND 1963,
Appendix - 174
Mknufacturing Employment
Value Added by Manufacture
Number
Percent
Change
Number ($1,000)
Percent Change
1954
1958
1963
1.-9347-7-
1958-
1954
1958
1963
1954-
1958-
1958
1963
1958
1963
WEST VIRGINIA (Cont'd.)
West Virginia - 18
16,825
16 036
16 497
4.7
1.6
115 684
L___
127,655
152,608
10.3
19.5
Doddridge
120
123
100
2.5
- 18.7
315
309
31
1.9
0.3
Gilmer
59
33
21
44.0
- 36.4
98
46
69
53.0
50.0
Harrison
6,597
6,233
5,902
5.5
-5.3
45,423
53,032
62,369
16.7
17.6
Lewis
1,036
1,102
1,129
6.3
2.5
3,359
4,562
5,475
35.8
20.0
Marion
4,311
4,409
5,588
2.2
26.7
35,620
46,550
56,737
30.6
21.9
Mbnongalia
3,572
2,917
2,779
18.3
-4.7
24,223
15,159
19,314
37.4
24.5
Preston
564
676
667
19.8
-1.3
2,943
3,409
5,892
15.8
72.9
Taylor
566
543
311
4.0
- 42.7
3,703
4,588*
2,442
23.8
46.8
West Virginia - 19
5 347
-A--
5,580
6,371
4.4
14.2
271661
37,516
99,420
35.6
175.0
Berkeley
3,614
3,864
4.6
6.9
---
19,381
28,080
71,399
44.8
154.2
3,454
Grant
156
134
190
14.1
41.8
473
540
820
14.1
51.9
Hampshire
215
160
169
25.5
5.6
721
626
2,290
13.1
265.8
Hardy
317
241
445
23.9
84.6
886
875
1,659
1.0
89.6
Jefferson
945
657
1,105
8.9
68.2
3,541
4,076
19,623
15.1
381.4
Mineral
335
305
415
30.4
36.1
1,390
2,199
2,887
58.2
31.3
Morgan
337
292
115
13.3
- 60.6
1,001
852
485
14.8
- 43.0
Pendleton
288
177
68
38.5
- 61.6
288
268
257
6.9
-4.1
West Virginia - 20
5,130
5,169
4,483
0.8
-9.5
17,180
19,959
25,423
16.2
27.4
Barbour
143
204
146
42.6
- 28.4
442
632
838
42.9
32.6
Braxton
115
103
171
10.4
66.0
306
348*
793
13.7
127.8
Clay
198
180
136
9.0
4.4
683
675
929
-1.2
37.6
Greenbrier
987
1,031
888
4.4
- 38.7
4,178
4,364
4,620
4.5
5.9
Nicholas
746
624
512
16.3
- 17.9
2,546
2,155
2,689
- 15.4
24.8
Pocahontas
750
679
541
9.4
- 20.3
3,125
3,625
2,797
16.0
- 35.8
Randolph
1,039
1,473
1,007
41.7
- 31.6
3,083
5,043
6,984
63.6
38.5
Tucker
389
357
487
8.2
36.4
1,130
1,527
3,241
35.3
112.2
Upshur
316
364
255
15.1
- 29.9
932
1,154
1,281
10.6
11.0
Webster
249
154
340
38.1
120.8
755
436
1,251
- 42.3
186.9

MANUFAUlURING EMPLOYMENT AND VALUE ADDED BYMANUFACTURE, 1954, 1958, AND 1953,
AND PERCENT CHANGE, 1954-1958 AND 1958-1963
:
Appendix - 175
Manufacturing Employment
Value Added b
Manufacture
Number
Percent Ghana_
Number ($1 000)
Percent Change
1954
1958
1963
1954-
1958-
1958
1963
1954
1958
1963
1954-
1958-
1958
1963
WEST VIRGINIA (Cont 'd.)
West Virginia
- 21
4 2747
-.-
5,501
281
5 .._/--
15.9
-4.0
32,286
46 967
--A-
59,723
45.5
27.2
Fayette
2,205
2,246
1.8
- 11.9
20,780*
34,601*
31.5
26.5
1,978
27,344*
Mercer
1,556
1,829
2,022
17.5
10.6
6,642
11,558
15,766
74.0
36.4
Mbnroe
56
76
49
35.7
- 35.5
144
239
227
65.9
-5.0
Raleigh
792
1,247
1,115
57.4
- 10.6
4,672
7,491
8,752
60.3
16.9
Summers
138
103
117
-25.3
13.6
138
335
377
142.7
12.5
West Virginia - 22
1 3656
1,375
1,550
-17.0
12.7
6,954
7,609
10,494
9.4
37.9
Logan
-- 349
341
576
-2.2
68.9
1,374
1,650
3,863
20.0
134.1
MblObwell
478
349
193
-26.9
- 44.7
2,565
2,107
1,646
- 17.8
- 21.9
Mingo
416
344
483
-17.3
40.4
1,655
2,522
3,489
52.3
38.3
Wyoming
413
341
298
-17.4
- 12.6
1,360
1,330
1,496
-2.2
12.4
Source:
Census of Manufactures, 1954, 1958, and 1963.
*Actual census data were not available for the
county because of the "disclosure rule."
Therefore, estimates were made basedon projections of
data for available years and/or on the stateaverages of value added per employee for the predominant industrygroups.

Appendix - 176
WEST VIRGINIA--STATE TOTAL
NUMBER OF ESTABLISHMENTS IN SELECTED SERVICES
AND SALES 1963 AND PERCENT CHANGE 1958-1963
Establishments Receipts ($1000)Percent
Number Change1963* 1958-63
Value1963*
PercentChange1958-63
All Establishments 7,607 4.65 255,780 42.63
Personal Services 3,520 7.35 INA INA
Auto Repair, Garages 1,037 4.33 INA INA
Other Services 3,050 1.80 INA INA
*Details may not add to total because of disclosure rule.
NUMBER OF WHOLESALE ESTABLISHMENTS AND
SALES 1963, AND PERCENT CHANGE 1958-1963
Establishments Sales ($1000)
Percent Percent
Number Change Value Change1963* 1958-63 1963* 1958-63
All Establishments 2,028 -0.49 1,395,823 5.68
Merchant Wholesalers 1,517 -0.13 762,966 16.62
Other Operating Types 511 -1.54 632,857 - 5.06
*Details may not add to total because of disclosure rule.

Appendix - 177
WEST VIRGINIA - STATE TOTAL
NUMBER OF RETAIL ESTABLISHMENTS AND SALES 1963,
AND PERCENT CHANGE 1958-1963
Establishments Sales ($1000)Percent
Number Change1963* 1958-63
PercentValue Change1963* 1958-63
ALL STORES 16,915 -11.81 1,779,336 10.72
Lumber, bldg. materials, etc. 700 -18.79 93,276 3.78
General merchandise 867 -48.15 240,957 -1.74
Food stores 4,417 -7.65 474,599 11.29
Automotive dealers 975 -6.70 341,820 27.16
Gasoline service stations 2,289 -4.66 146,369 18.11
Apparel, accessory stores 919 -6.03 105,030 7.83
Furniture, home furnishings, etc. 767 -23.68 81,659 -2.90
Eating, drinking places 3,238 -13.03 94,546 4.15
Drug stores, proprietary stores 433 -2.70 58,585 15.58
Other retail stores 1,716 1.36 110,599 1.95
Non-store retailers 594 3.66 31,896 49.32
*Details may not add to tdtal becausq of disclosure rule.