1 2007-09 Higher Education Budget Recommendations Presented to: Ways and Means Committee January 30,...
44
1 2007-09 Higher Education Budget Recommendations Presented to: Ways and Means Committee January 30, 2007
-
Upload
adela-thomas -
Category
Documents
-
view
215 -
download
0
Transcript of 1 2007-09 Higher Education Budget Recommendations Presented to: Ways and Means Committee January 30,...

1
2007-09 Higher Education Budget Recommendations
Presented to:Ways and Means Committee
January 30, 2007

2
HOW DOES INDIANA COMPARE?

3
5,825
5,282
0
2,000
4,000
6,000
8,000
10,000
12,000
14,000
Wyo
ming
Alaska
Hawaii
Conne
cticu
t
New Je
rsey
Nevad
a
Mas
sach
uset
ts
New M
exico
Georg
ia
New Y
ork
North
Car
olina
Illino
is
Idah
o
Delaw
are
Tenne
ssee
Rhode
Islan
d
Kansa
s
Wisc
onsin
Main
e
Kentu
cky
Arizon
a
Nebra
ska
Miss
ouri
Was
hingt
on
Califo
rnia
Unite
d Sta
tes
Mich
igan
Penns
ylvan
ia
Minn
esot
a
Texas
Utah
India
naIo
wa
Louis
iana
South
Car
olina
Virgini
a
Alabam
a
Oklaho
ma
Florida
Miss
issipp
iOhi
o
Arkan
sas
South
Dak
ota
Mar
yland
North
Dak
ota
Orego
n
Wes
t Virg
inia
Mon
tana
Color
ado
New H
amps
hire
Verm
ont
Higher Education Appropriations per FTE by State, 2005
U.S.Indiana
Source: SHEEO SHEF, State Higher Education Finance FY2005.

4
Net Tuition as a Percentage of Public Higher EducationTotal Educational Revenues by State, 2005
77%
50%
37%
13%
0%
10%
20%
30%
40%
50%
60%
70%
80%
90%
Verm
ont
New H
amps
hire
Color
ado
Delaw
are
Mar
yland
Orego
n
Penns
ylvan
ia
Mon
tana
Rhode
Islan
d
Mich
igan
South
Dak
ota
India
naOhi
oIo
wa
Alabam
a
South
Car
olina
Virgini
a
Wes
t Virg
inia
Main
e
Minn
esot
a
North
Dak
ota
New Je
rsey
Tenne
ssee
Mas
sach
uset
ts
Conne
cticu
t
Miss
ouri
Miss
issipp
i
Kansa
s
Arkan
sas
Kentu
cky
Wisc
onsin
Unite
d Sta
tes
Arizon
a
Nebra
skaUta
h
Oklaho
ma
New Y
ork
Texas
Illino
is
Louis
iana
Florida
North
Car
olina
Was
hingt
on
AlaskaId
aho
Nevad
a
Hawaii
Califo
rnia
Georg
ia
Wyo
ming
New M
exico
Source: SHEEO SHEF, State Higher Education Finance FY2005.
U.S.
Indiana

5
Total Educational Revenues per FTE for Public Institutions by State, 2005
$10,585
$9,196
$-
$2,000
$4,000
$6,000
$8,000
$10,000
$12,000
$14,000
$16,000
Florida
Califo
rnia
Loui
siana
Oklaho
ma
Arkan
sas
North
Dak
ota
Was
hingt
on
Wes
t Virg
inia
Miss
issipp
i
Color
ado
Texas
Utah
Mon
tana
New M
exico
Idah
o
Georg
ia
Unite
d Sta
tes
Nebra
ska
Arizon
a
South
Dak
otaOhi
o
Orego
n
Virgini
a
Alabam
a
North
Car
olina
Illino
is
Kentu
cky
Wisc
onsin
Miss
ouri
New H
amps
hire
South
Car
olina
Kansa
s
Minn
esot
a
Nevad
a
Mar
yland
Iowa
India
na
Tenne
ssee
New Y
ork
Main
e
Mich
igan
Penns
ylvan
ia
Hawaii
Rhode
Islan
d
Mas
sach
uset
ts
Verm
ont
Wyo
ming
New Je
rsey
Delaw
are
Alaska
Conne
cticu
t
Indiana
U.S.
Source: SHEEO SHEF, State Higher Education Finance FY2005.
6
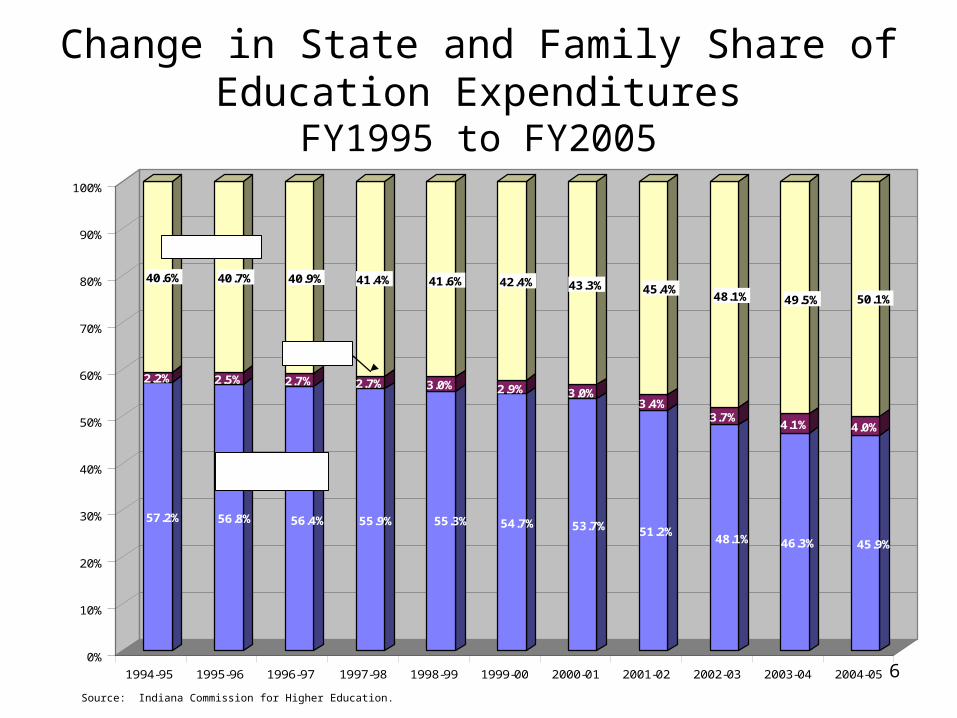
Change in State and Family Share of Education Expenditures
FY1995 to FY2005
Source: Indiana Commission for Higher Education.
57.2%
2.2%
40.6%
56.8%
2.5%
40.7%
56.4%
2.7%
40.9%
55.9%
2.7%
41.4%
55.3%
3.0%
41.6%
54.7%
2.9%
42.4%
53.7%
3.0%
43.3%
51.2%
3.4%
45.4%
48.1%
3.7%
48.1%
46.3%
4.1%
49.5%
45.9%
4.0%
50.1%
0%
10%
20%
30%
40%
50%
60%
70%
80%
90%
100%
1994-95 1995-96 1996-97 1997-98 1998-99 1999-00 2000-01 2001-02 2002-03 2003-04 2004-05
State Operating Appropriations
Tuition & Fees
SSACI Aid
7
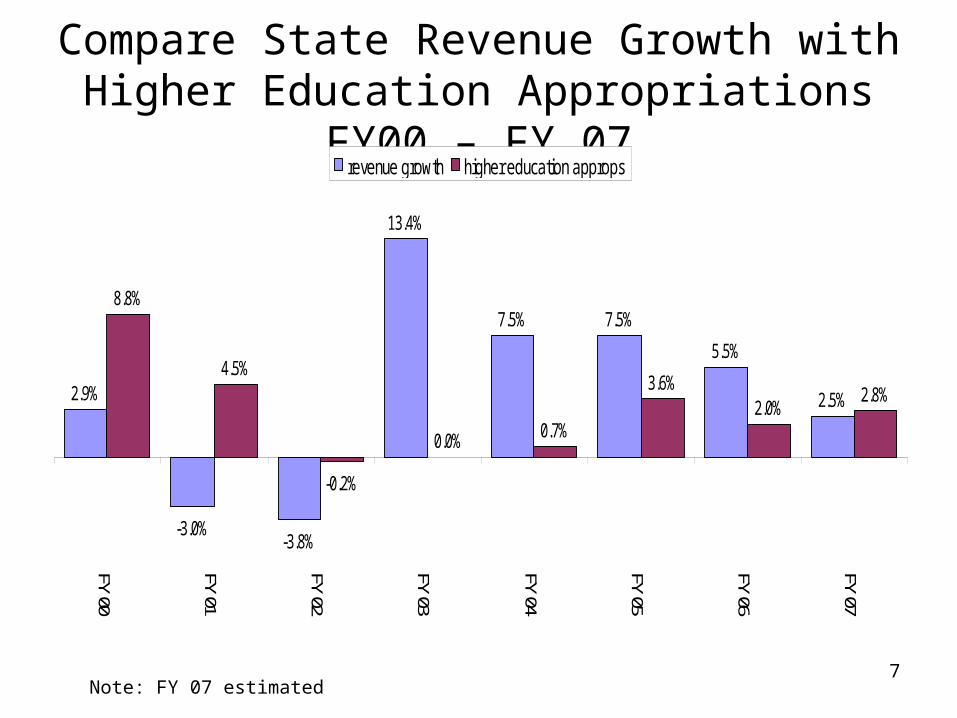
Compare State Revenue Growth with Higher Education Appropriations FY00 – FY 07
2.9%
-3.0%-3.8%
13.4%
7.5% 7.5%
5.5%
2.5%
8.8%
4.5%
-0.2%
0.0% 0.7%
3.6%2.0%
2.8%
FY 00
FY 01
FY 02
FY 03
FY 04
FY 05
FY 06
FY 07
revenue growth higher education approps
Note: FY 07 estimated

8
Compare Revenue Projections to CHE Higher Education Institutional Funding
Recommendation
4.2%4.5%
5.0% 5.0%
0.0%
1.0%
2.0%
3.0%
4.0%
5.0%
6.0%
FY 08 FY 09
Revenue Projection CHE Recommendation
Note: FY 08 and FY 09 from December 14, 2006 revenue projections

9
Commission for Higher Education Responsibilities and Funding Priorities
• Debt Service• Research• Enrollment• Degree Completion• Operating Support• Repair and Rehabilitation• SSACI

10
Growth in Debt ServiceDebt Service as a Percentage of Debt Service and Operating
0.0%
2.0%
4.0%
6.0%
8.0%
10.0%
12.0%
14.0%
1975-76
1976-77
1977-78
1978-79
1979-80
1980-81
1981-82
1982-83
1983-84
1984-85
1985-86
1986-87
1987-88
1988-89
1989-90
1990-91
1991-92
1992-93
1993-94
1994-95
1995-96
1996-97
1997-98
1998-99
1999-00
2000-01
2001-02
2002-03
2003-04
2004-05
2005-06
2006-07
2007-08
2008-09
Note: includes debt service in FY 09 for CHE recommended new capital projects

11
Debt Service GrowthOperating Debt
ServiceDS as % of
Oper. + DS
FY 1980 $335.6 $17.0 4.8%
FY 1985 $497.3 $34.5 6.5%
FY 1990 $743.3 $64.0 7.9%
FY 1995 $824.6 $79.4 8.8%
FY 2000 $1,025.4 $104.8 9.3%
FY 2005 $1,176.1 $110.2 8.6%
FY 2007 $1,185.3 $131.2 10.0%
FY 2009 $1,220.0 $169.8 11.8%
Avg. Annual % Incr. 1980 to 2009 4.4% 7.3%
Total % Increase 1980 to 2009 237% 620%
Note: includes debt service in FY 09 for CHE recommended new capital projects

12
Research FundingTotal institutional research & development expenditures per capita
for Indiana, US and Selected States
Source: National Center for Higher Education Management Systems (using National Science Foundation; U.S. Census Bureau).
$138.3$146.2
$65.3
$25.8
$67.3
$42.6
$57.4
$43.5
$56.9
$134.3
$102.4$102.9
$115.1
$135.1
0
20
40
60
80
100
120
140
160
Michigan Indiana Illinois Ohio Minnesota Kentucky Nation
1990 2004

13
Research Funding Incentive
• Matches University Expenditures on Research Expenditure Growth $.50 per $1
• Matches Federal, Industry and Competitively Awarded Private Foundation Research Grants
• Includes IUB, PUWL & IUPUI Health

14
College-going RatePercent of high school graduates
enrolled the next fall in higher education
Ranked34th
Ranked10th
Source: Mortenson, T. Postsecondary Education Opportunity, Oskaloosa, Iowa. (Note: Technical corrections were made to three states: Indiana, Kentucky, and Utah in the 2004 data and are reflected in the chart).
62.0%
54.3%
62.0%60.0%60.5%
58.0%55.0%
50.5%
57.1%58.6%
56.5%57.3% 55.5%56.7%
1992 1994 1996 1998 2000 2002 2004
Indiana Nation

15
Adult Participation in Postsecondary Education for Indiana and Selected States
Source: U.S. Census Bureau, Decennial Census, 2000.
3.6%
4.0%
4.2%
4.4%
4.6%
4.7%
4.8%
4.8%
5.2%
5.4%
5.6%
6.4%
0.0% 1.0% 2.0% 3.0% 4.0% 5.0% 6.0% 7.0%
Indiana
Oklahoma
Florida
U.S.
Michigan
Virginia
Washington
Illinois
Hawaii
Maryland
Alaska
California
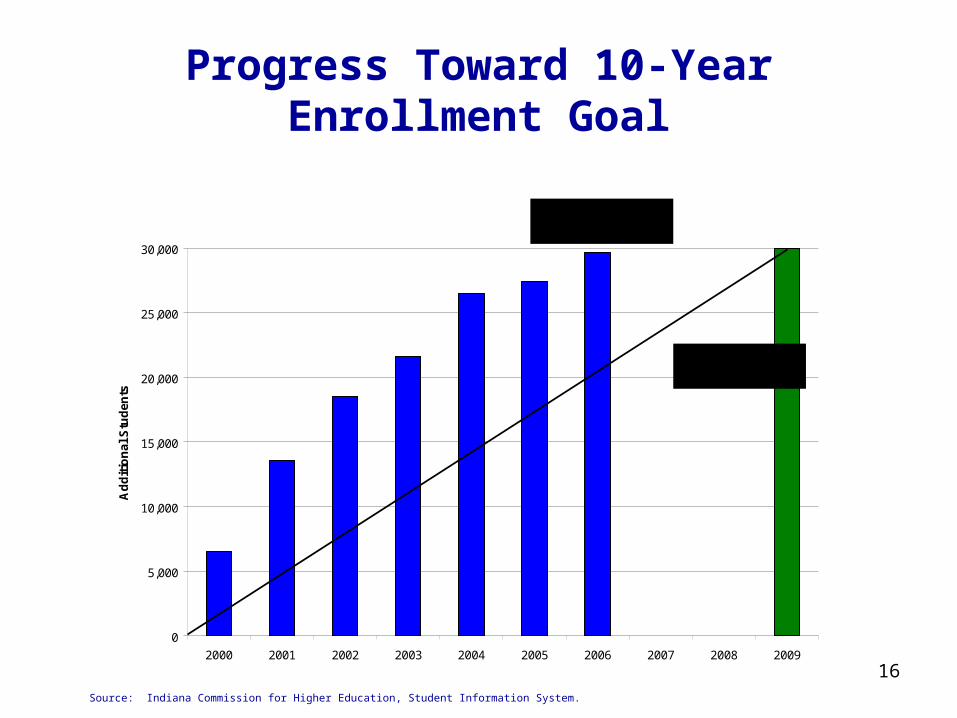
16
Progress Toward 10-Year Enrollment Goal
Source: Indiana Commission for Higher Education, Student Information System.
0
5,000
10,000
15,000
20,000
25,000
30,000
2000 2001 2002 2003 2004 2005 2006 2007 2008 2009
Ad
dit
ion
al
Stu
de
nts
Goal: 30,000 More Students
Current: 29,636 More Students

17
Fall Headcount Enrollment in Indiana Postsecondary
InstitutionsTotal346,378
Public266,790
Private*79,588
Source: Annual Editions of Report of Enrollment in Indiana Colleges and Universities, prepared for the Indiana Association of Collegiate Registrars and Admissions Officers. Independent Colleges of Indiana. Commission for Higher Education Student Information System. *Awaiting update
0
50,000
100,000
150,000
200,000
250,000
300,000
350,000
400,000
1979-80
1980-81
1981-82
1982-83
1983-84
1984-85
1985-86
1986-87
1987-88
1988-89
1989-90
1990-91
1991-92
1992-93
1993-94
1994-95
1995-96
1996-97
1997-98
1998-99
1999-00
2000-01
2001-02
2002-03
2003-04
2004-05
2005-06

18
Percent of first-time full-time degree-seeking students earning a baccalaureate degree for Indiana’s public colleges, 2004
College/University 4-Year Grad Rate 6-Year Grad Rate
Indiana University Bloomington 41% 71%
Purdue University West Lafayette 31% 64%
Ball State University 26% 52%
Indiana State University 19% 40%
University of Southern Indiana 13% 32%
Indiana University East 4% 19%
Indiana University Kokomo 8% 23%
Indiana University Northwest 7% 24%
Indiana University South Bend 5% 21%
Indiana University Southeast 4% 26%
IUPUI 5% 22%
Purdue University Calumet 4% 22%
Purdue University North Central 1% 11%
IPFW 3% 19%
NOTE: Graduation rates calculated using the national GRS formula for first-time full-time degree seeking students.Source: The Education Trust, College Results Online, Databank/Reporting Tool using data collected by the U.S. Department of Education’s National Center for Education Statistics (NCES) through the IPED Graduation Rate Survey.

19
Percent of first-time full-time degree-seeking students earning an associate degree for Indiana’s public community colleges, 2004
College/University 2-Year Grad Rate 3-Year Grad Rate
Ivy Tech Community College of Indiana 4% 18%
Vincennes University 11% 19%
NOTE: Graduation rates calculated using the national GRS formula for first-time full-time degree seeking students.
Source: For 3-year grad rate, Ivy Tech’s data gathered from reports on the IPEDS Graduation Rate Survey published by the Office of Institutional Research at ITCCI. For 3-year grad rate, Vincennes data gathered from U.S. Department of Education’s National Center for Education Statistics (NCES) through the IPED Graduation Rate Survey Peer Analysis System. For 2-year grad rate, data gathered from the CHE SIS system.

20
Six-Year Graduation Rates Relative to Peer Groups
Indiana University-Bloomington
Purdue University-Main Campus
Ball State University
Indiana University-Purdue University-Indianapolis
Indiana State University
Indiana University-Purdue University-Fort Wayne
University of Southern Indiana
Indiana University-South Bend
Indiana University-Northwest
Indiana University-Southeast
Purdue University-Calumet Campus
Purdue University-North Central Campus
Indiana University-Kokomo
Indiana University-East
INDIANA UNIVERSITY-BLOOMINGTON
PURDUE UNIVERSITY-MAIN CAMPUS
BALL STATE UNIVERSITY
INDIANA UNIVERSITY-PURDUE UNIVERSITY-INDIANAPOLIS
INDIANA STATE UNIVERSITY
INDIANA UNIVERSITY-PURDUE UNIVERSITY-FORT WAYNE
UNIVERSITY OF SOUTHERN INDIANA
INDIANA UNIVERSITY-SOUTH BEND
INDIANA UNIVERSITY-NORTHWEST
INDIANA UNIVERSITY-SOUTHEAST
PURDUE UNIVERSITY-CALUMET CAMPUS
PURDUE UNIVERSITY-NORTH CENTRAL CAMPUS
INDIANA UNIVERSITY-KOKOMO
INDIANA UNIVERSITY-EAST
Range of Peer Groups
0% 10% 20% 30% 40% 50% 60% 70% 80% 90% 100%
Source: National Center for Higher Education Management Systems (IPEDS Graduation Rate Survey, 2003)
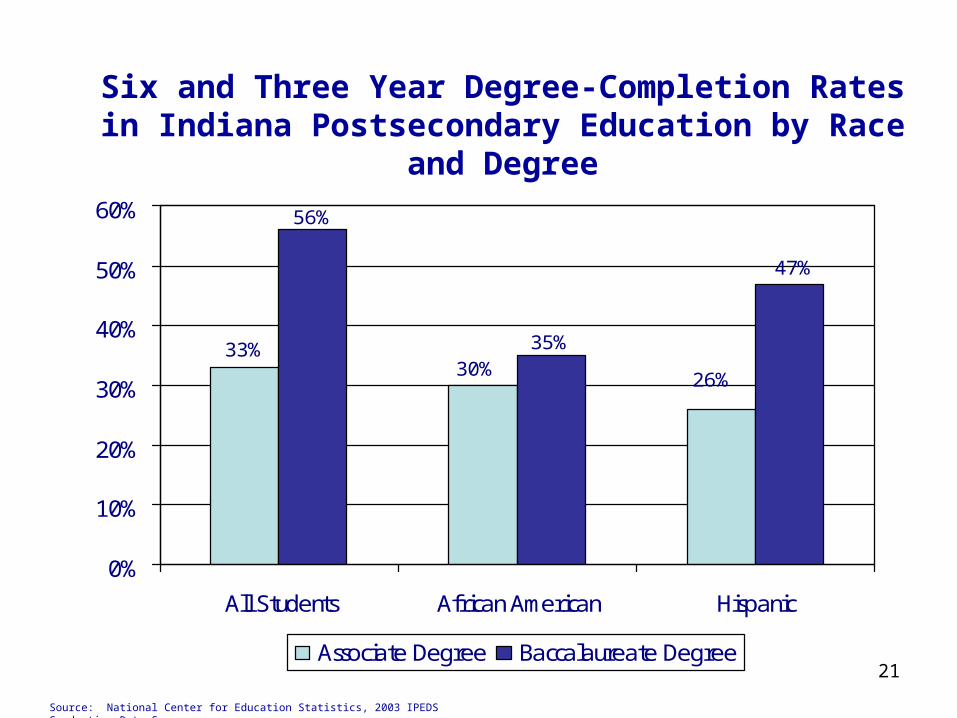
21
Six and Three Year Degree-Completion Rates in Indiana Postsecondary Education
by Race and Degree
33%
26%30%
47%
35%
56%
0%
10%
20%
30%
40%
50%
60%
All Students African American Hispanic
Associate Degree Baccalaureate Degree
Source: National Center for Education Statistics, 2003 IPEDS Graduation Rate Survey

22
New Incentives
• Degree Growth Incentive
• Time to Degree Incentive
• Transfer Incentive
23
Degree Growth Incentive
• Change in number of degrees conferred• Includes all resident students regardless of entry
(first time, transfer, continuing) or status type (part-time, full time)
• This is a simple calculation that measures change in the number of degrees conferred over a specified period of time and multiplied by $3,500 for Associates Degree and $4,000 for Baccalaureate Degree (increase only)
• Appropriation is the greater of Change in Degree funding or Enrollment Change funding

24
On-Time Completion Incentive• Change in On-Time Degree Completion Rate (4yr.
And 2yr.)• Includes all full-time, degree-seeking resident
students• Measures change in the graduate rate of cohorts • Uses the Graduation Rate Survey national
methodology and compares rates measured over a specified period of time
• Appropriation is most recent cohort graduation rate minus previous cohort graduation rate: pays $5,000 for increase in bachelor degrees and $2,500 for associate degrees

25
Transfer Incentive
• Provides funding to two-year colleges for students that successfully transfer to public four-year institutions
• Appropriation is the greater of Transfer Incentive funding or Enrollment Change funding

26
Operating Support
• Funds Campus Operating 1.4% FY 08 and 2.0% in FY 09*
• Funds Line Items 3.0% in FY 08 and 3.0% in FY 09
Note: Institutional operating increases 3.1% and 4.7%
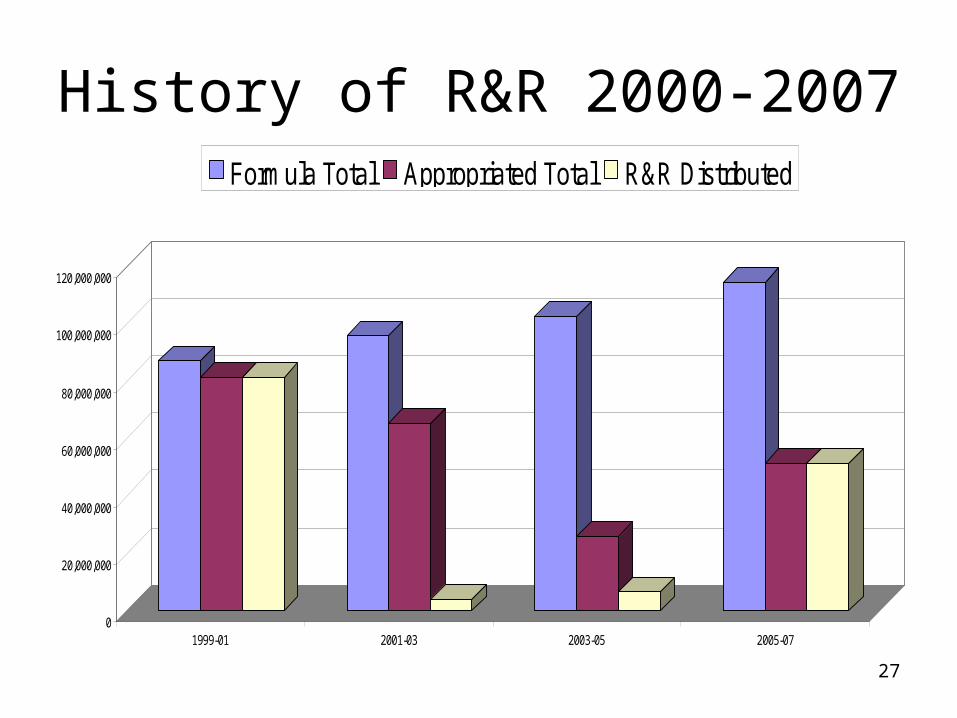
27
History of R&R 2000-2007
0
20,000,000
40,000,000
60,000,000
80,000,000
100,000,000
120,000,000
1999-01 2001-03 2003-05 2005-07
Formula Total Appropriated Total R&R Distributed
FY 07 estimated

28
CHE SSACI Recommendation
• Higher Education Award and Freedom of Choice Award funded to keep caps flat in FY 08 and increase caps 3% in FY 09
• Fully funds 21st Century Scholars Awards• Fully funds fee remission programs for veterans,
National Guard and public safety officers • Other SSACI programs flat or small inflationary
increases• Total SSACI Increases of 7.2% (FY 08) and
4.3% (FY 09)

29
CHE 2007-09HIGHER EDUCATION
BUDGET RECOMMENDATIONS

30
Base Appropriation Increases(includes SSACI)
Appropriation % chg.
FY 07 $1.613 billion
FY 08 $1.699 billion 5.3%
FY 09 $1.783 billion 4.9%
Does not include payment delay repayment $62M

31
Base Appropriation Increases (excludes SSACI)
Appropriation % chg.
FY 07 $1.396 billion
FY 08 $1.465 billion 5.0%
FY 09 $1.539 billion 5.0%
Does not include payment delay repayment $62M

32
Capital Appropriation Increases
Appropriation % chg.
FY 07 $157 million
FY 08 $188 million 20.0%
FY 09* $201 million 7.1%
* Includes first year of debt service for CHE recommended capital projects
33
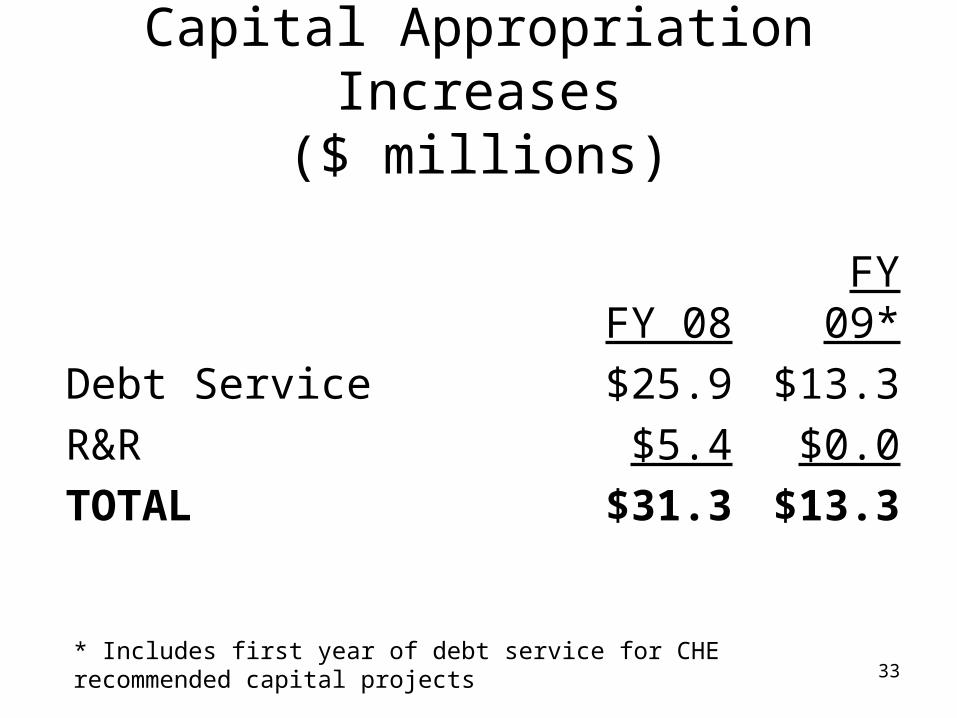
Capital Appropriation Increases($ millions)
FY 08 FY 09*
Debt Service $25.9 $13.3
R&R $5.4 $0.0
TOTAL $31.3 $13.3
* Includes first year of debt service for CHE recommended capital projects

34
Existing and New Debt Service Increases
2008 2009*
IU Totals 9.0% 5.3%PU Totals 13.8% 14.0%ISU Totals 30.0% 0.2%USI Totals 60.8% 23.4%BSU Totals 14.8% -1.7%VU Totals 38.9% 18.8%ITCCI Totals 58.1% 11.3%Total: 19.7% 8.1%
* Includes first year of debt service for CHE recommended capital projects

35
Debt Service as a share of New Appropriations*
60%
40%
19%
81%
FY 08 FY 09
* Includes first year of debt service for CHE recommended capital projects FY 09
DEBT SERVICE

36
Institutional Operating Appropriation Increases
(excludes SSACI)
Appropriation % chg.
FY 07 $1.239 billion
FY 08 $1.277 billion 3.1%
FY 09 $1.337 billion 4.7%

37
Operating Appropriation Increases Over FY 07 Base ($ millions)
* Funded 50% in FY 08 and 100% in FY 09; ** Funded 100% in FY 09
2008 2009
Research Support Incentive* $10.2 $20.4
Enrollment Change Incentive* $6.6 $13.2
Change In Degrees Incentive** $0.0 $6.7
On-Time Degree Completion Incentive** $0.0 $3.4
Two-year campus Transfer Incentive** $0.0 $0.5
Campus Operating Support (1.4% / 2.0%) $16.8 $40.9
Line Item Operating Support (3.0% / 3.0%) $1.2 $2.7
New Academic Programs $2.0 $9.3
Other $1.4 $1.0
Plant Expansion $0.0 $0.0
TOTAL $38.3 $98.7

38
New Academic ProgramsIncreases Over FY 07 Base
2008 2009
IUPUI – Columbus (a) $.9M $1.9M
PU Statewide Technology and TAP Programs (a)(b)
$.1M $1.7M
Fast Track to College $1.0M $4.8M
BSU Entrepreneurial Prog. $0.0M $1.0M
Total: $2.0M $9.3MNotes: (a) Funds new programs related to Cummins expansion
(b) Roll-out of statewide programs

39
Institution Operating Appropriations
% chg 2008 % chg 2009
IU Totals 2.7% $470.6M 4.1% $489.8M
PU Totals 3.1% $324.2M 4.6% $339.2M
ISU Totals 1.3% $74.9M 2.6% $76.9M
USI Totals 2.7% $36.2M 4.9% $37.9M
BSU Totals 1.4% $124.7M 4.2% $128.9M
VU Totals 1.4% $36.9M 4.4% $38.5M
ITCCI Totals 5.8% $152.4M 6.0% $161.6M
Total 2.9% $1,220M 4.4% $1,271M

40
R&R Base AppropriationsFunds 50% of 2007-09 R&R Formula
2008 2009
IU Totals $12.6M $12.6M
PU Totals $9.9M $9.9M
ISU Totals $2.3M $2.3M
USI Totals $.6M $.6M
BSU Totals $3.4M $3.4M
VU Totals $1.1M $1.1M
ITCCI Totals $1.1M $1.1M
Total $31.0M $31.0M
% change over FY07 21.1%

41
Payment Delay Repayment(Does Not Go Into Base)
2008 2009
IU Totals $12.2M $12.2M
PU Totals $8.6M $8.6M
ISU Totals $2.2M $2.2M
USI Totals $.8M $.8M
BSU Totals $3.3M $3.3M
VU Totals $.9M $.9M
ITCCI Totals $3.1M $3.1M
Total $31M $31M
CHE recommends these payments be used for R&R

42
CHE 2007-09 SSACI Budget Recommendations
FY 2007 FY 2008 FY 2009
Higher Education Awards* $120,674,940 6.2% $128,125,919 6.9% $136,917,883
Freedom of Choice Awards* $46,035,799 0.0% $46,035,799 1.3% $46,640,885
21st Century Scholar Program Awards $19,171,429 33.3% $25,546,085 1.0% $25,811,511
Statutory Fee Remissions $18,148,108 10.5% $20,055,513 0.5% $20,150,884
* Funds cap increases of 0% in FY 2008 and 3% in FY 2009
43
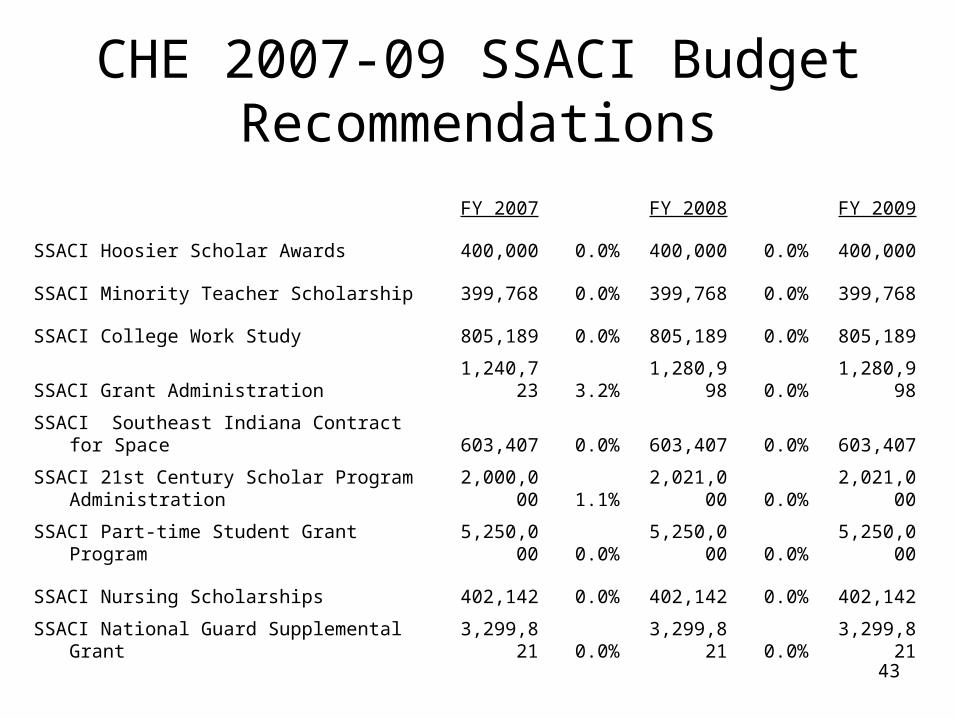
CHE 2007-09 SSACI Budget Recommendations
FY 2007 FY 2008 FY 2009
SSACI Hoosier Scholar Awards 400,000 0.0% 400,000 0.0% 400,000
SSACI Minority Teacher Scholarship 399,768 0.0% 399,768 0.0% 399,768
SSACI College Work Study 805,189 0.0% 805,189 0.0% 805,189
SSACI Grant Administration 1,240,723 3.2% 1,280,998 0.0% 1,280,998
SSACI Southeast Indiana Contract for Space 603,407 0.0% 603,407 0.0% 603,407
SSACI 21st Century Scholar Program Administration 2,000,000 1.1% 2,021,000 0.0% 2,021,000
SSACI Part-time Student Grant Program 5,250,000 0.0% 5,250,000 0.0% 5,250,000
SSACI Nursing Scholarships 402,142 0.0% 402,142 0.0% 402,142
SSACI National Guard Supplemental Grant 3,299,821 0.0% 3,299,821 0.0% 3,299,821

44
Recommended New Capital Projects
PUWL Boiler #6 $53,000,000
VU Electrical Infrastructure/Substation Phase II $2,000,000
USI College of Business/General Classroom Building $24,900,000
IUB Cyber Infrastructure Buildings $18,300,000
IUPUI Neurosciences Research Building $20,000,000
ITCCI Fort Wayne Technology Center & Demolition Costs $26,700,000
PUNC Student Services & Rec. Center A&E $1,000,000
ITCCI Logansport Building $10,500,000
TOTAL RECOMMENDED STATE FUNDING $156,400,000
RECOMMENDED FOR AUTHORITY ONLY
PUWL Mechanical Engineering Addition $33,000,000