1 1 CINEPLEX GALAXY Canada’s #1 Film Exhibitor Q2 Report.
39
1 CINEPLEX GALAXY CINEPLEX GALAXY Canada’s #1 Film Exhibitor Q2 Report
-
Upload
rahul-bertram -
Category
Documents
-
view
215 -
download
0
Transcript of 1 1 CINEPLEX GALAXY Canada’s #1 Film Exhibitor Q2 Report.
11
CINEPLEX GALAXY CINEPLEX GALAXY
Canada’s #1 Film Exhibitor
Q2 Report
22
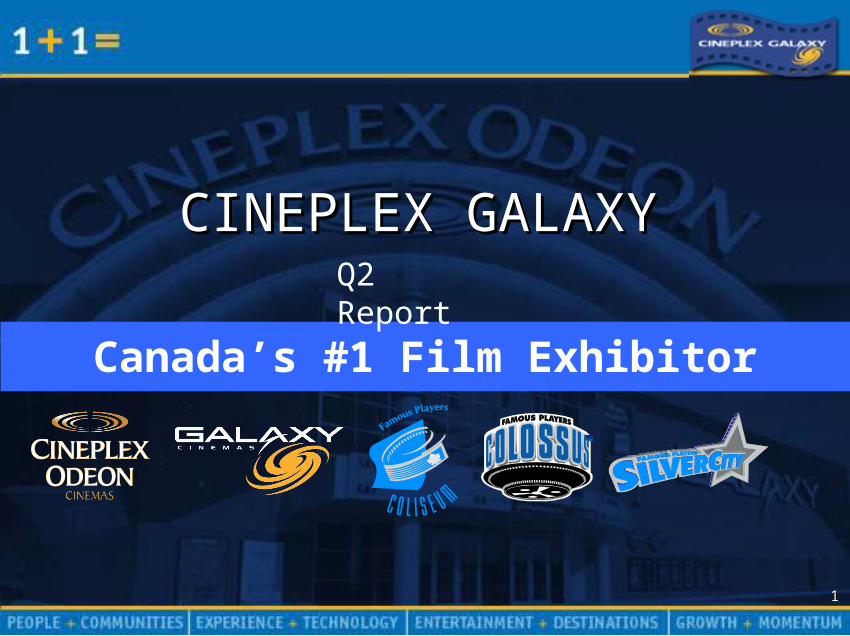
Cineplex Galaxy Cineplex Galaxy
Locations: 86Screens: 775
Locations: 80 Screens: 785
33
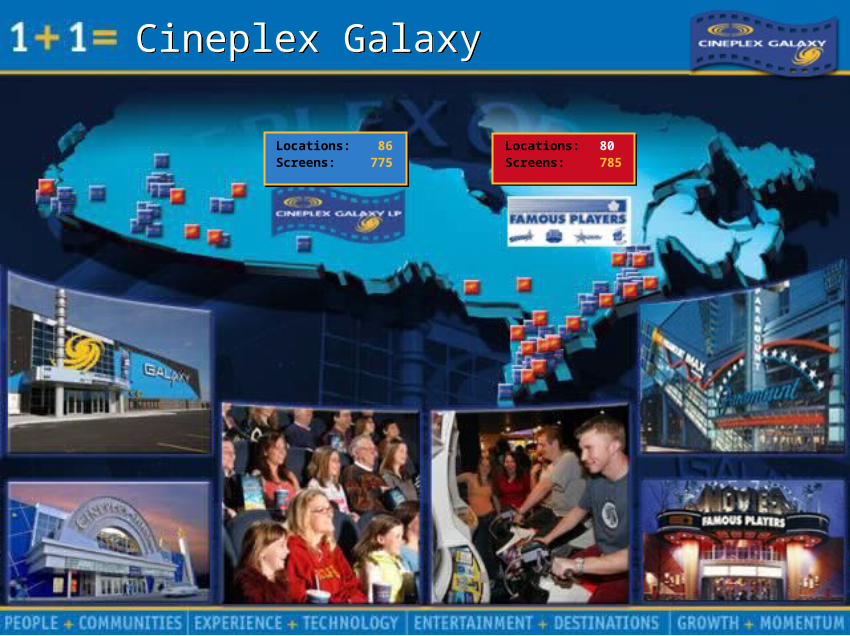
Rationale for the AcquisitionRationale for the Acquisition
The Leading Film Exhibitor in CanadaImmediately Accretive to Distributable CashComplementary Operations will Lead to Cost SavingsOpportunities to Increase Distributable Cash through Revenue GrowthAddition of High Quality theatres in Metropolitan MarketsSuperior Combined Management
The Leading Film Exhibitor in CanadaImmediately Accretive to Distributable CashComplementary Operations will Lead to Cost SavingsOpportunities to Increase Distributable Cash through Revenue GrowthAddition of High Quality theatres in Metropolitan MarketsSuperior Combined Management

44
Famous Players AcquisitionFamous Players Acquisition
Deal signed June 10, 2005
Deal closed July 22, 2005
Organization structure finalized July 29, 2005
Sale of real estate to Rio Can completed August 4, 2005
Employee integration/terminations completed August 5, 2005
Announced sale of 27 locations to Empire on August 22, 2005 for gross proceeds of approx. $83 million

55
ExecutiveExecutive
Ellis Jacob President & CEO
Anne FitzgeraldSr Vice
President Legal
Dan McGrathExecutive Vice
President
Gord NelsonChief Financial
Officer
Jeff KentChief
Technology Officer
Michael Kennedy
Executive VP, Film
Programming
Michael McCartney
Sr Ex VP, Film Programming
Robert O'BrienSr Vice
President, Human
Resources/Payroll

66
Top Tier Theatre BrandsTop Tier Theatre Brands
SilverCity22 theatres/286 screensBC, AB, MB, ON, QC
Colossus3 theatres/56 screensQC, ON, BC
77
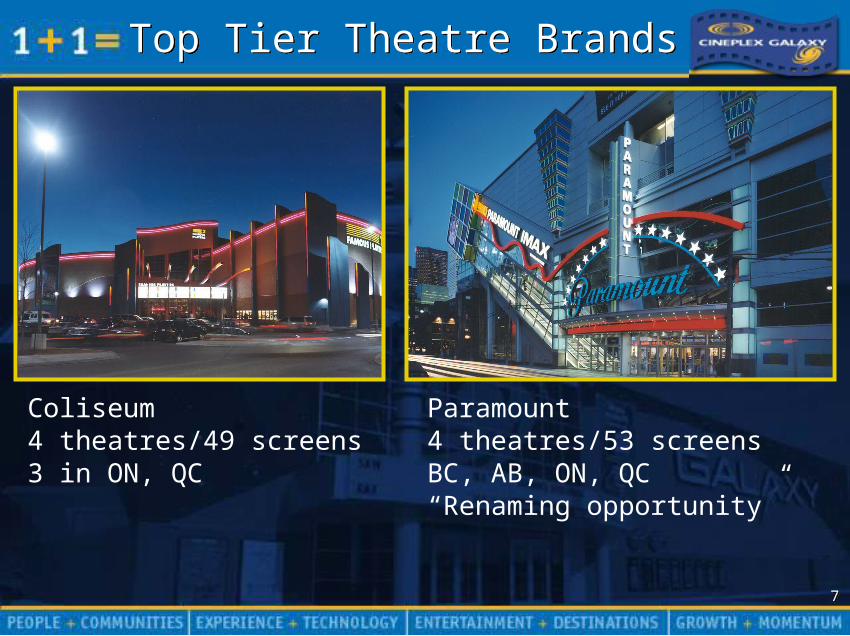
Top Tier Theatre BrandsTop Tier Theatre Brands
Coliseum 4 theatres/49 screens3 in ON, QC
Paramount4 theatres/53 screensBC, AB, ON, QC“Renaming opportunity”
88
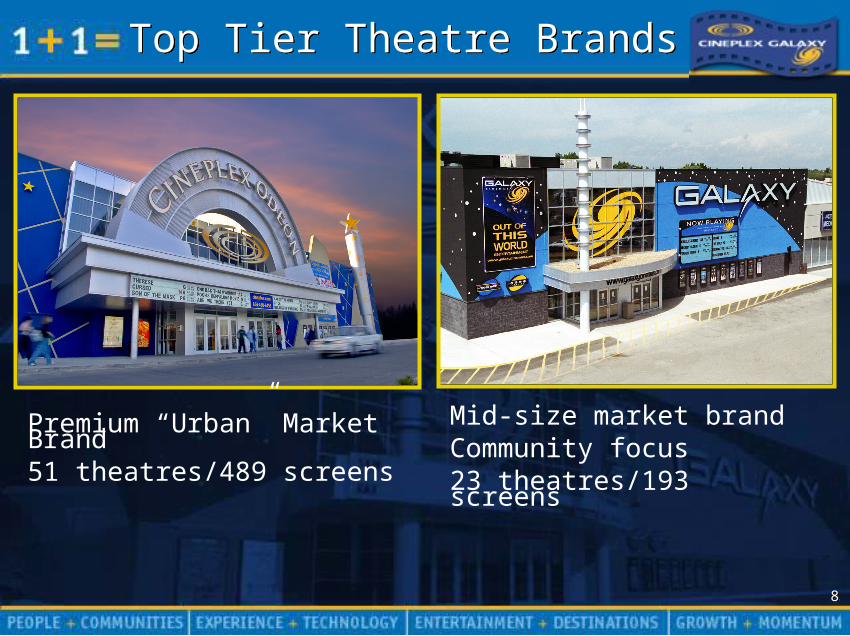
Top Tier Theatre BrandsTop Tier Theatre Brands
Premium “Urban” Market Brand 51 theatres/489 screens
Mid-size market brandCommunity focus23 theatres/193 screens
99
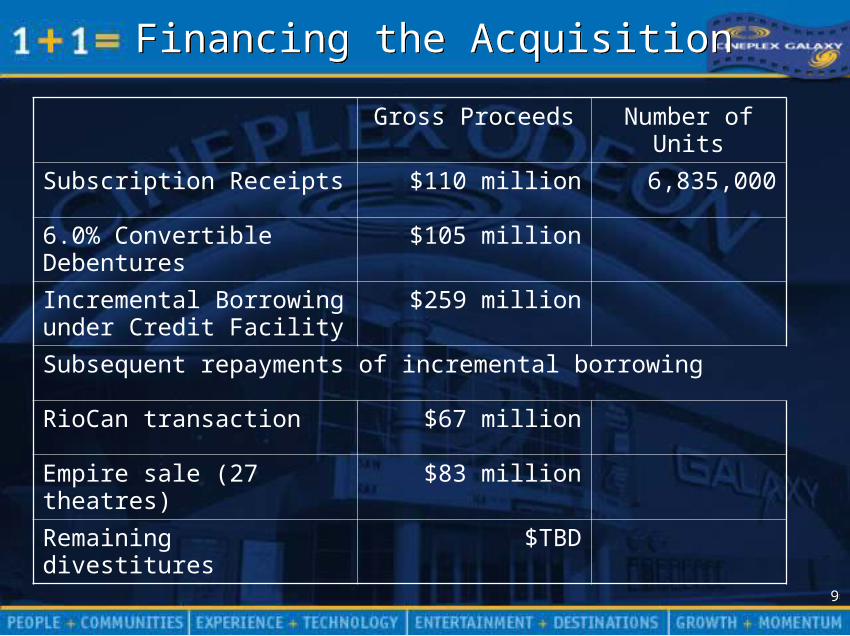
Financing the AcquisitionFinancing the Acquisition
Gross Proceeds Number of Units
Subscription Receipts $110 million 6,835,000
6.0% Convertible Debentures
$105 million
Incremental Borrowing under Credit Facility
$259 million
Subsequent repayments of incremental borrowing
RioCan transaction $67 million
Empire sale (27 theatres)
$83 million
Remaining divestitures $TBD

1010
SynergiesSynergies
Completed to Date:
Employee head count reduced by 35% -- well on the way to meeting $20mm target
Head office employee integration/terminations completed August 5, 2005
Planned to Occur:
Vendor Contract negotiations
Head office facility integration - December 31, 2005
Technology integration – October 31, 2005
Merging the Media businesses – October 31, 2005
Marketing efficiencies – single programs for all brands

1111
Market Share of Canadian Box Office RevenuesQ2 YTD 2004 Q2 YTD 2005
Market Share of Canadian Box Office RevenuesQ2 YTD 2004 Q2 YTD 2005
AMC: 6.5%AMC: 6.5%
Cineplex Galaxy:31.4%
Cineplex Galaxy:31.4%
Famous Players:42.8%
Famous Players:42.8%
Empire: 5.7%Empire: 5.7%
Landmark: 2.9%Landmark: 2.9%Guzzo: 3.1%Guzzo: 3.1%
Other: 7.6%Other: 7.6%
Source: A.C. Nielsen EDI dataSource: A.C. Nielsen EDI data
Strong Market ShareStrong Market Share
Cineplex Galaxy:32.1%
Cineplex Galaxy:32.1%
Famous Players:42.6%
Famous Players:42.6%
Other: 6.9%Other: 6.9%
Guzzo: 3.0%Guzzo: 3.0%Landmark: 3.1%Landmark: 3.1%
Empire: 6.0%Empire: 6.0%
AMC: 6.3%AMC: 6.3%

1212
Market Share of Canadian Box Office Revenues
Q2 YTD 2005
Cineplex Galaxy Combined After Divestiture
Market Share of Canadian Box Office Revenues
Q2 YTD 2005
Cineplex Galaxy Combined After Divestiture
AMC: 6.3%AMC: 6.3%
Cineplex Galaxy:32.1%
Cineplex Galaxy:32.1%
Famous Players:42.6%
Famous Players:42.6%
Empire: 6.0%Empire: 6.0%
Landmark: 3.1%Landmark: 3.1%Guzzo: 3.0%Guzzo: 3.0%
Other: 6.9%Other: 6.9%
Source: A.C. Nielsen EDI dataSource: A.C. Nielsen EDI data
Strong Market ShareStrong Market Share
Cineplex Galaxy:64.2%
Cineplex Galaxy:64.2%Other: 9.8%Other: 9.8%
Guzzo: 3.0%Guzzo: 3.0%Landmark: 3.1%Landmark: 3.1%
Empire: 13.6%Empire: 13.6%
AMC: 6.3%AMC: 6.3%
1313
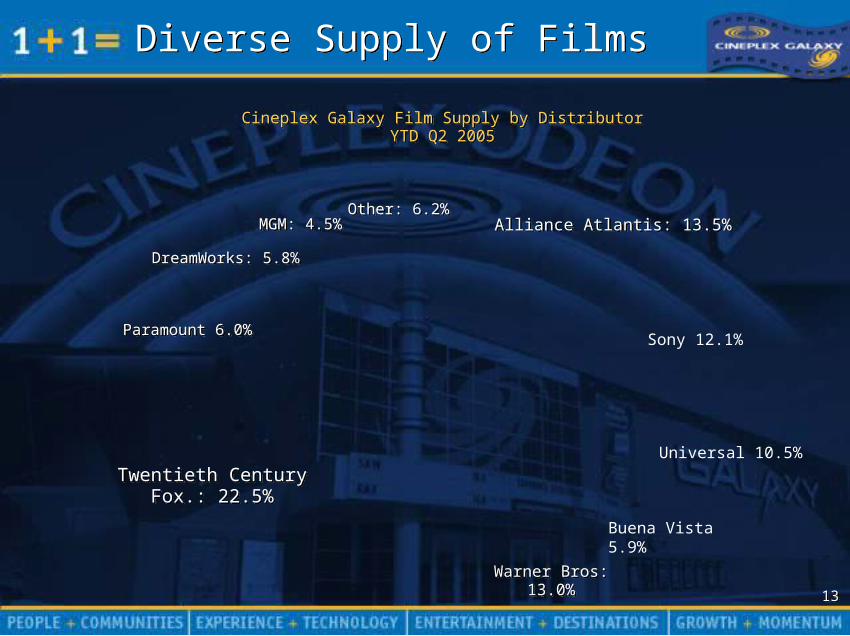
Diverse Supply of FilmsDiverse Supply of Films
Cineplex Galaxy Film Supply by DistributorYTD Q2 2005
Cineplex Galaxy Film Supply by DistributorYTD Q2 2005
Paramount 6.0%Paramount 6.0%
Alliance Atlantis: 13.5%Alliance Atlantis: 13.5%
DreamWorks: 5.8%DreamWorks: 5.8%
Other: 6.2%Other: 6.2%
Warner Bros: 13.0%
Warner Bros: 13.0%
Twentieth Century Fox.: 22.5%
Twentieth Century Fox.: 22.5%
Buena Vista 5.9%
Sony 12.1%
Universal 10.5%
MGM: 4.5%MGM: 4.5%

1414
1515
$0
$250
$500
$750
$1,000
1965 1970 1975 1980 1985 1990 1995 2000
$0
$250
$500
$750
$1,000
1965 1970 1975 1980 1985 1990 1995 2000
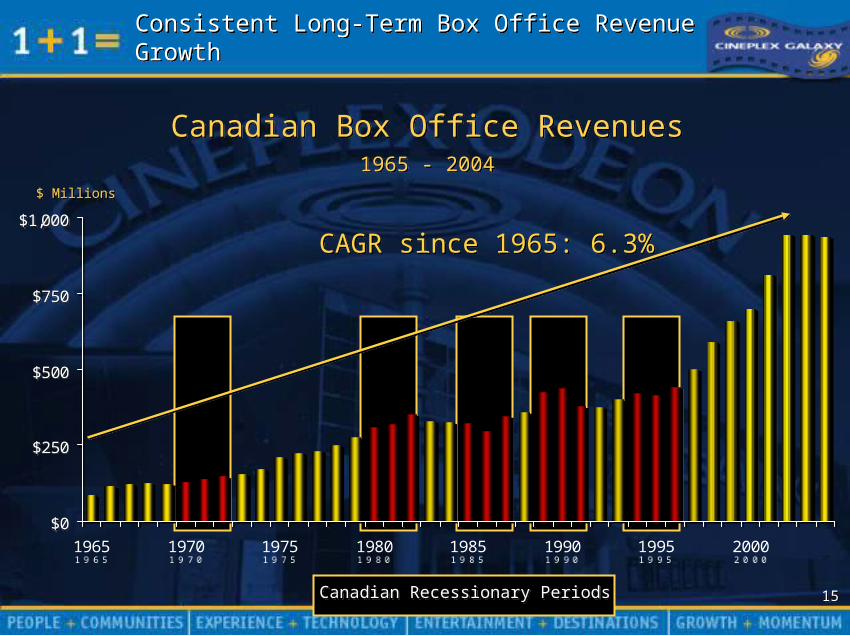
Canadian Box Office Revenues1965 - 2004
Canadian Box Office Revenues1965 - 2004
$ Millions$ Millions
Canadian Recessionary PeriodsCanadian Recessionary Periods
CAGR since 1965: 6.3%CAGR since 1965: 6.3%
Consistent Long-Term Box Office Revenue GrowthConsistent Long-Term Box Office Revenue Growth
1616
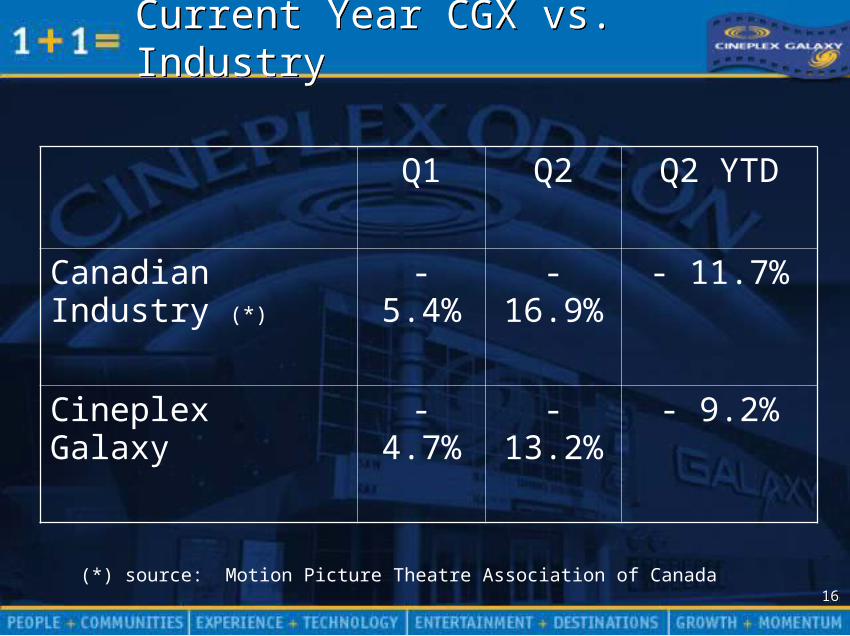
Current Year CGX vs. IndustryCurrent Year CGX vs. Industry
Q1 Q2 Q2 YTD
Canadian Industry (*)
- 5.4% - 16.9%
- 11.7%
Cineplex Galaxy - 4.7% - 13.2%
- 9.2%
(*) source: Motion Picture Theatre Association of Canada

1717
462 453
411
471
510 509
461478 482
467 473 483
1993 1994 1995 1996 1997 1998 1999 2000 2001 2002 2003 2004
462 453
411
471
510 509
461478 482
467 473 483
1993 1994 1995 1996 1997 1998 1999 2000 2001 2002 2003 2004
8 12 10 15 16 18 21 22 20 24 28 22 8 12 10 15 16 18 21 22 20 24 28 22
Consistent Supply of Theatrical ReleasesConsistent Supply of Theatrical Releases
Source: Motion Picture Association of America, 2003Source: Motion Picture Association of America, 2003
US Annual Film ReleasesUS Annual Film Releases
Films greater than $100 million gross
Films greater than $100 million gross
1818
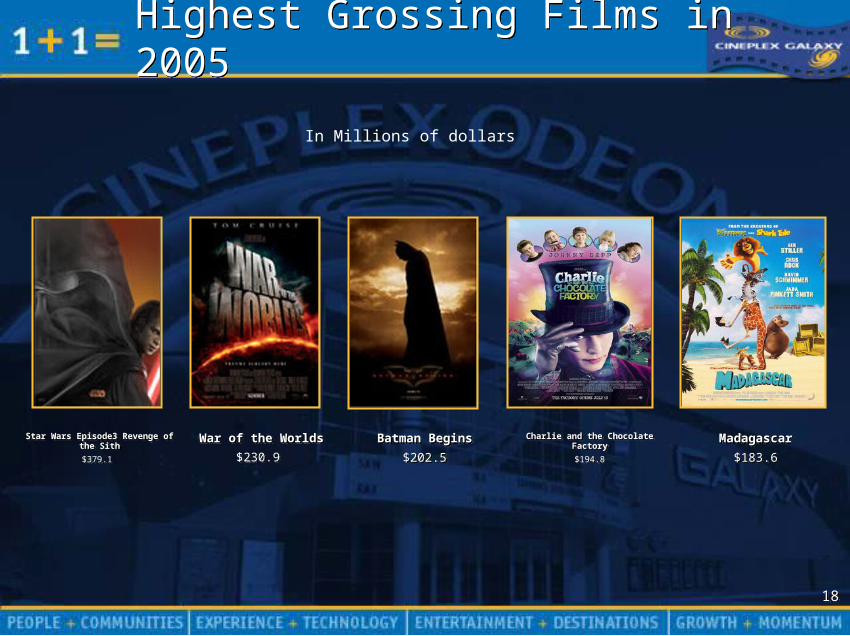
Highest Grossing Films in 2005Highest Grossing Films in 2005
Batman Begins
$202.5
Batman Begins
$202.5
Charlie and the Chocolate Factory
$194.8
Charlie and the Chocolate Factory
$194.8
Madagascar
$183.6
Madagascar
$183.6
War of the Worlds
$230.9
War of the Worlds
$230.9
Star Wars Episode3 Revenge of the Sith
$379.1
Star Wars Episode3 Revenge of the Sith
$379.1
In Millions of dollars
1919
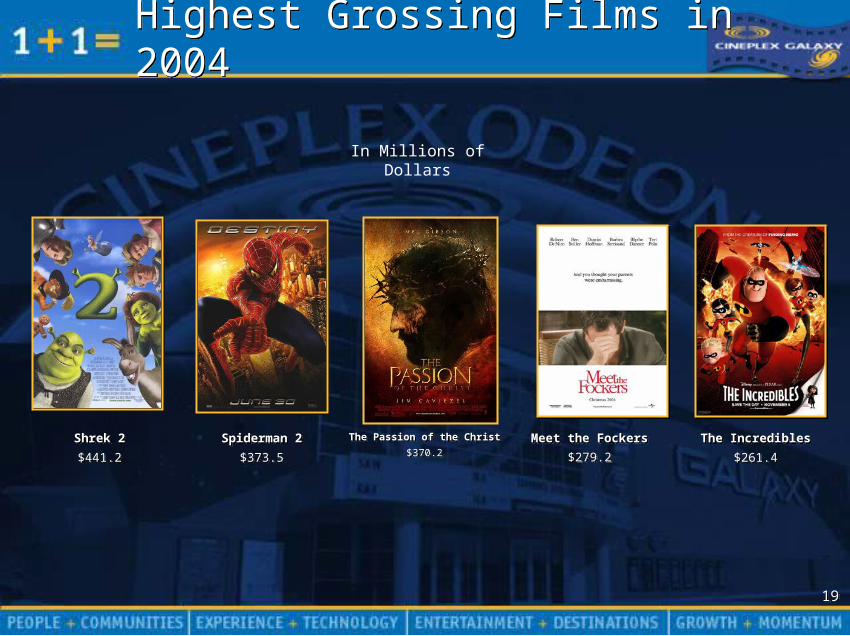
Highest Grossing Films in 2004Highest Grossing Films in 2004
The Passion of the Christ
$370.2
The Passion of the Christ
$370.2Meet the Fockers
$279.2
Meet the Fockers
$279.2The Incredibles
$261.4
The Incredibles
$261.4
Spiderman 2
$373.5
Spiderman 2
$373.5
Shrek 2
$441.2
Shrek 2
$441.2
In Millions of Dollars

2020
Upcoming Films for 2005Upcoming Films for 2005
Harry Potter and the Goblet of Fire
November 2005
Harry Potter and the Goblet of Fire
November 2005
The Lion, the Witch and the Wardrobe
December 2005
The Lion, the Witch and the Wardrobe
December 2005
King Kong December 2005 King Kong
December 2005
Fun with Dick and Jane
December 2005
Fun with Dick and Jane
December 2005
The Producers
December 2005

2121
2222
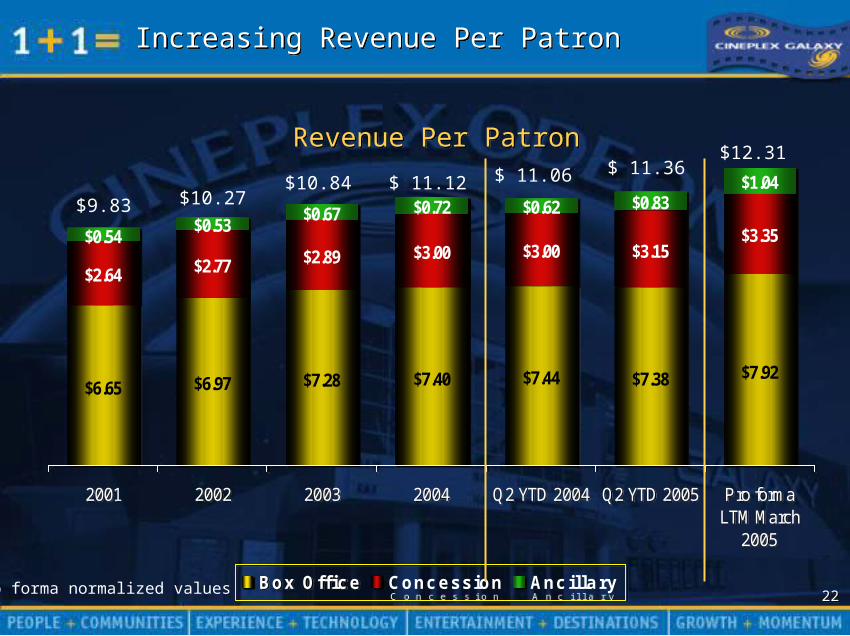
$6.65 $6.97 $7.28 $7.40 $7.44 $7.38 $7.92
$2.64 $2.77 $2.89 $3.00 $3.00 $3.15$3.35$0.54
$0.53$0.67 $0.72 $0.62 $0.83
$1.04
2001 2002 2003 2004 Q2 YTD 2004 Q2 YTD 2005 Pro formaLTM March
2005
Box Office Concession Anc illary
$6.65 $6.97 $7.28 $7.40 $7.44 $7.38 $7.92
$2.64 $2.77 $2.89 $3.00 $3.00 $3.15$3.35$0.54
$0.53$0.67 $0.72 $0.62 $0.83
$1.04
2001 2002 2003 2004 Q2 YTD 2004 Q2 YTD 2005 Pro formaLTM March
2005
Box Office Concession Anc illary
Increasing Revenue Per PatronIncreasing Revenue Per Patron
Revenue Per PatronRevenue Per Patron
Pro forma normalized values
$9.83 $10.27$10.84 $ 11.12 $ 11.06 $ 11.36
$12.31
2323
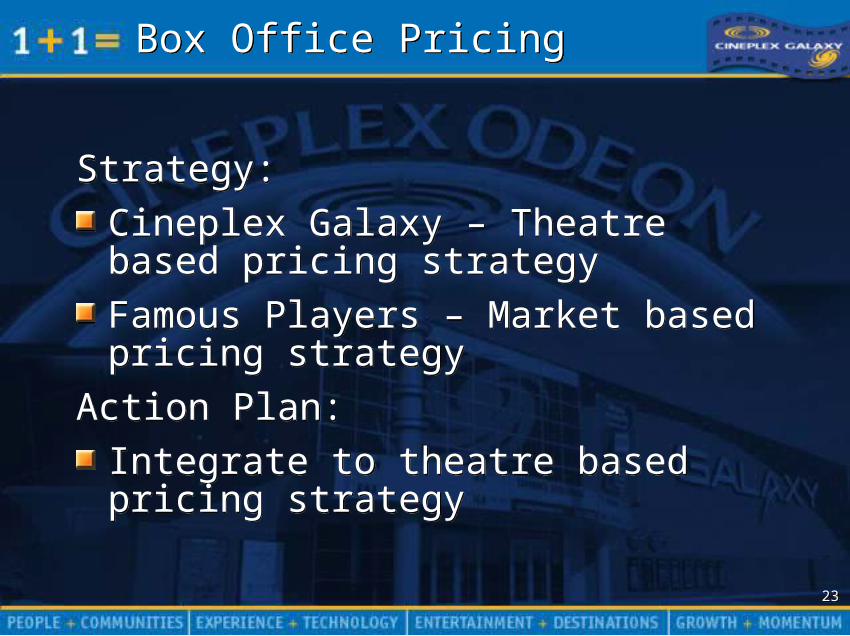
Box Office PricingBox Office Pricing
Strategy:
Cineplex Galaxy – Theatre based pricing strategy
Famous Players – Market based pricing strategy
Action Plan:
Integrate to theatre based pricing strategy
Strategy:
Cineplex Galaxy – Theatre based pricing strategy
Famous Players – Market based pricing strategy
Action Plan:
Integrate to theatre based pricing strategy

2424
$3.35$3.15$3.00$3.00$2.89$2.77$2.64
2001 2002 2003 2004 Q2 2004 YTD Q2 YTD 2005 Pro formaLTM March
2005
$3.35$3.15$3.00$3.00$2.89$2.77$2.64
2001 2002 2003 2004 Q2 2004 YTD Q2 YTD 2005 Pro formaLTM March
2005
Expanded Concessions Driving Revenue per PatronExpanded Concessions Driving Revenue per Patron
Average Concession Dollars per PatronAverage Concession Dollars per Patron

2525
2001 2002 2003 2004 Pro formaLTM March
2005
Q2 YTD 2004 Q2 YTD 2005
Advertising Games Other
2001 2002 2003 2004 Pro formaLTM March
2005
Q2 YTD 2004 Q2 YTD 2005
Advertising Games Other
Significant Other Revenue ContributionSignificant Other Revenue Contribution
Ancillary Revenues ($mill)Ancillary Revenues ($mill)
$13.4 $17.4$20.9
$22.8
$9.5 $12.0
+ 25.8%
$62.5
2626
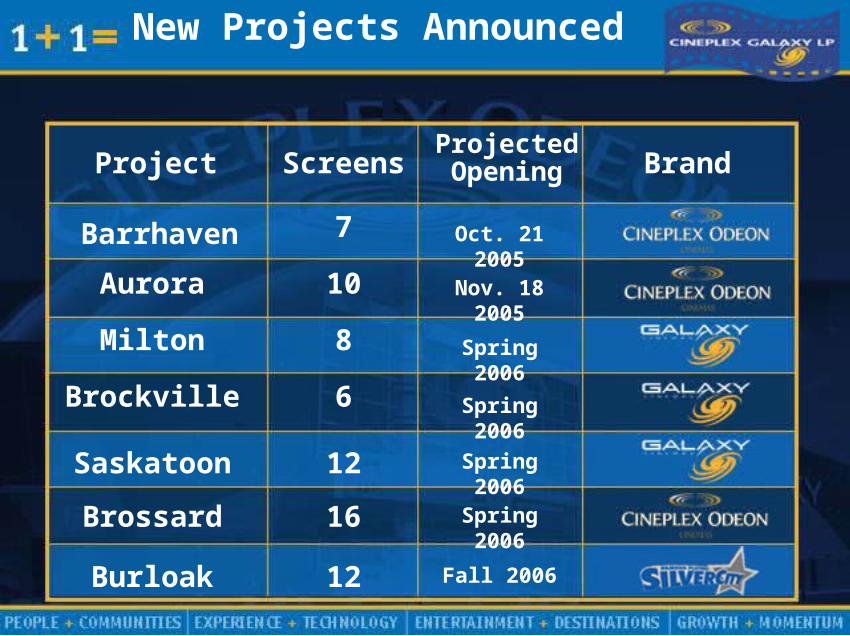
Project ScreensProjectedOpening Brand
Barrhaven
Aurora
Milton
Brockville
Saskatoon
Brossard
Burloak
7
10
8
6
16
12
12
Oct. 21 2005
Nov. 18 2005
Spring 2006
Spring 2006
Spring 2006
Spring 2006
Fall 2006
New Projects Announced

2727
Cost ControlCost Control
Prominent market position allows for effective management of direct theatre-level costs
Best practices amongst both companies will result in incremental operating savings and revenue enhancements
Significant focus on managing costs to the business volumes
Prominent market position allows for effective management of direct theatre-level costs
Best practices amongst both companies will result in incremental operating savings and revenue enhancements
Significant focus on managing costs to the business volumes

2828
Corporate Initiatives 2005Corporate Initiatives 2005
New Theatres:
Theatre Rebranding
On-Screen Advertising Business Integration
POS System integration
Loyalty Program
Digital Advertising Pre-Show Network
New Theatres:
Theatre Rebranding
On-Screen Advertising Business Integration
POS System integration
Loyalty Program
Digital Advertising Pre-Show Network

2929
Threats to the BusinessThreats to the Business
Threats:
Piracy
DVD release window erosion
Quality of Film Product
Opportunities:
Social aspect of an out-of-home experience vs. stay at home
Theatre technology is far superior to “in-home” television system and screen
Entertainment Destinations
Threats:
Piracy
DVD release window erosion
Quality of Film Product
Opportunities:
Social aspect of an out-of-home experience vs. stay at home
Theatre technology is far superior to “in-home” television system and screen
Entertainment Destinations

3030
3131
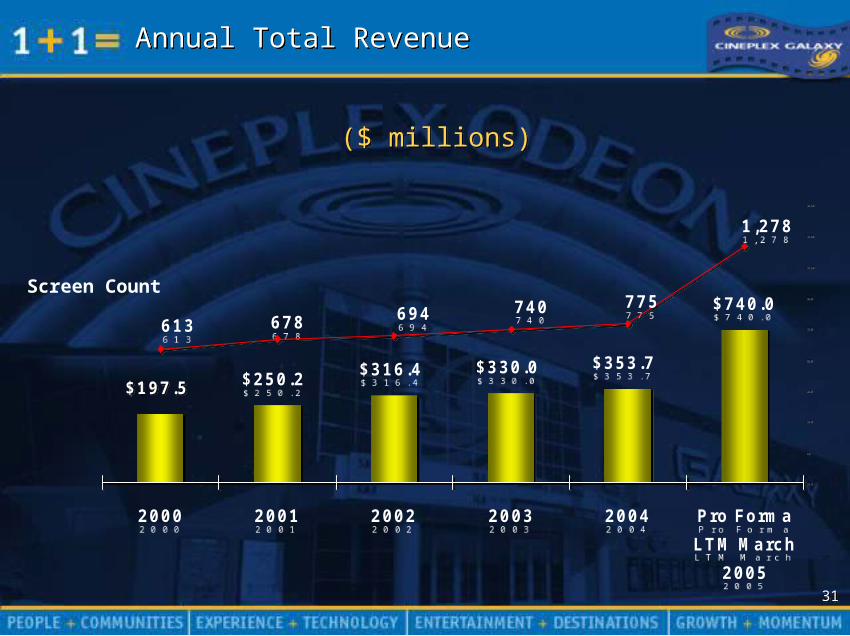
$197.5 $250.2 $316.4 $330.0 $353.7
$740.0613
1,278
775740694678
2000 2001 2002 2003 2004 Pro Forma
LTM March
2005
-250
-50
150
350
550
750
950
1150
1350
1550
$197.5 $250.2 $316.4 $330.0 $353.7
$740.0613
1,278
775740694678
2000 2001 2002 2003 2004 Pro Forma
LTM March
2005
-250
-50
150
350
550
750
950
1150
1350
1550
Annual Total RevenueAnnual Total Revenue
($ millions)($ millions)
Screen Count

3232
$130.1$169.3
$213.9 $221.2 $235.4
$475.9
2000 2001 2002 2003 2004 Pro forma
LTM March
2005
$130.1$169.3
$213.9 $221.2 $235.4
$475.9
2000 2001 2002 2003 2004 Pro forma
LTM March
2005
Annual Box OfficeAnnual Box Office
($ millions)($ millions)
16.0% CAGR
3333
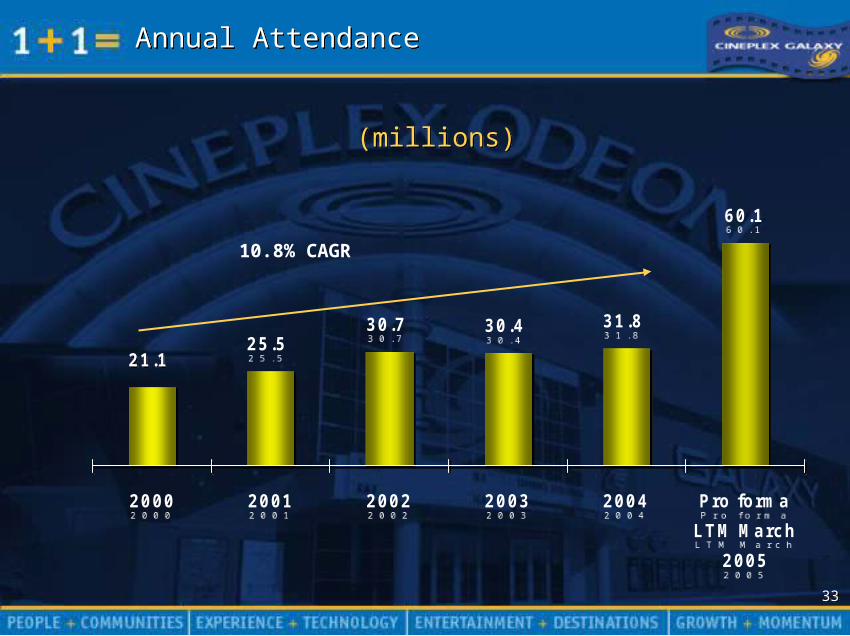
21.125.5
30.7 30.4 31.8
60.1
2000 2001 2002 2003 2004 Pro forma
LTM March
2005
21.125.5
30.7 30.4 31.8
60.1
2000 2001 2002 2003 2004 Pro forma
LTM March
2005
Annual AttendanceAnnual Attendance
(millions)(millions)
10.8% CAGR
3434
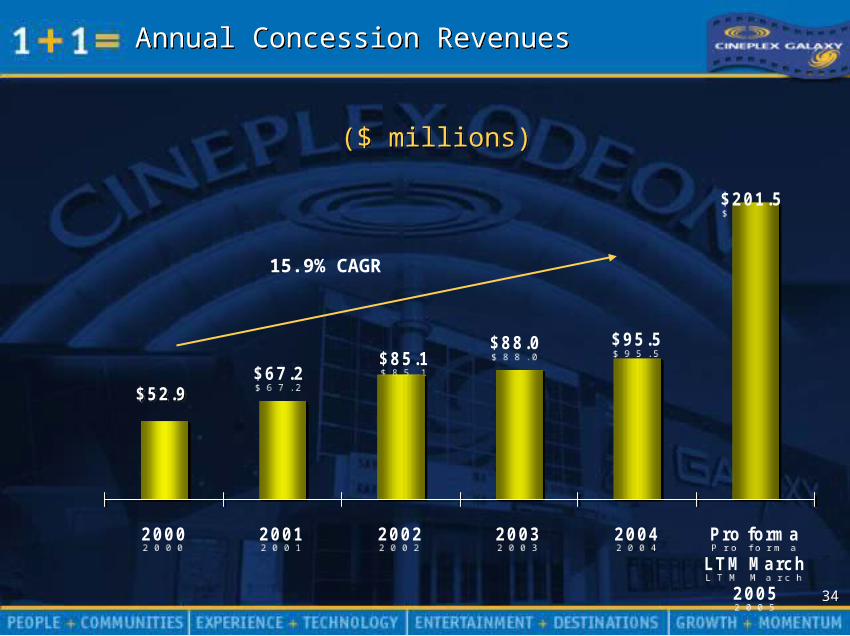
$52.9$67.2
$88.0$85.1
$201.5
$95.5
2000 2001 2002 2003 2004 Pro forma
LTM March
2005
$52.9$67.2
$88.0$85.1
$201.5
$95.5
2000 2001 2002 2003 2004 Pro forma
LTM March
2005
Annual Concession RevenuesAnnual Concession Revenues
($ millions)($ millions)
15.9% CAGR

3535
$24.1
$41.7
$63.0$68.5
$74.5
$97.5
$117.5
15.6%
16.7%
19.4%20.4%
21.1%
13.2%12.2%
$0.0
$20.0
$40.0
$60.0
$80.0
$100.0
$120.0
2000 2001 2002 2003 2004 Pro forma
LTM March
2005 without
synergies
Pro forma
LTM March
2005 with
synergies
5.0%
15.0%
$24.1
$41.7
$63.0$68.5
$74.5
$97.5
$117.5
15.6%
16.7%
19.4%20.4%
21.1%
13.2%12.2%
$0.0
$20.0
$40.0
$60.0
$80.0
$100.0
$120.0
2000 2001 2002 2003 2004 Pro forma
LTM March
2005 without
synergies
Pro forma
LTM March
2005 with
synergies
5.0%
15.0%
Annual EBITDAAnnual EBITDA
($ millions)($ millions)
EBITDA Margin
Adjusted EBITDA Margins – LTM March 2005:
CGX 20.2%
FP 9.0%

3636
Flexible Financing StructureFlexible Financing Structure
Development Facility– Available - $60 million
Working Capital Facility– Available - $50 million
Term Facility– Available - $315 million (reduced with
divestiture proceeds)
Development Facility– Available - $60 million
Working Capital Facility– Available - $50 million
Term Facility– Available - $315 million (reduced with
divestiture proceeds)

3737
LeverageLeverage$ millions
Debt prior to acquisition of FP $141
Incremental acquisition debt 259
Repayment – RioCan transaction <67>
Repayment – Empire transaction <83>
Repayment – additional divestiture proceeds TBD
Net debt $250
Pro forma LTM March 2005 Adjusted EBITDA $101.4
Non-cash items 6.4
Pro forma LTM March 2005 “Adjusted Cash EBITDA” - pre-synergies
$107.8
Synergies 20.0
Pro forma LTM March 2005 “Adjusted Cash EBITDA” – post-synergies
$127.8
Pro forma LTM March 2005 Leverage – pre-synergies(*) 2.3 x
Prom forma LTM March 2005 Leverage – post-synergies (*) 2.0 x(*) excludes debt reduction with additional divestiture proceeds

3838
Focus on Value CreationFocus on Value Creation
The number one Canadian film exhibitor with a market share of 64.2 %+ of Canadian Box OfficeOwn and operate the five top-tier entertainment brands in CanadaSignificant opportunities to grow distributable cashOnly exhibitor in Canada with a continuing build programMarketing power of the brands – reach more than 85 million Canadians across the country.
The number one Canadian film exhibitor with a market share of 64.2 %+ of Canadian Box OfficeOwn and operate the five top-tier entertainment brands in CanadaSignificant opportunities to grow distributable cashOnly exhibitor in Canada with a continuing build programMarketing power of the brands – reach more than 85 million Canadians across the country.
3939
CINEPLEX GALAXY CINEPLEX GALAXY
Contact: Gord Nelson, Chief Financial Officer, 416-323-6602 Pat Marshall, Vice President Investor Relations, 416-323-6648