
098 eslake rba_productivity_august-2011
28
1 PRODUCTIVITY Paper presented to the annual policy conference of the Reserve Bank of Australia HC Coombs Conference Centre, Kirribillii, Sydney 15 th -16 th August 2011 Saul Eslake Director, Productivity Growth Program – The Grattan Institute and Advisor, Economics & Policy, PricewaterhouseCoopers Australia
Transcript of 098 eslake rba_productivity_august-2011
1
PRODUCTIVITY
Paper presented to the annual policy conference of the Reserve Bank of Australia
HC Coombs Conference Centre, Kirribillii, Sydney
15th-16th August 2011
Saul Eslake Director, Productivity Growth Program – The Grattan Institute
and Advisor, Economics & Policy, PricewaterhouseCoopers Australia
1
Introduction
‘Productivity’ is, at its simplest, a measure of how effectively or efficiently a workplace, a business or government agency, a region or a nation as a whole uses the resources at its disposal to produce goods and services which are in turn valued, in some way, by those who consume or use them. At the level of individual workplaces or firms, productivity measures are often expressed in terms of output per unit of a single factor of production, such as land or livestock (in agriculture), some measure of ore extracted (in mining), or, in manufacturing and services businesses, some measure of labour input such as person-hours. At more aggregated or economy-wide levels, productivity is usually expressed as a measure of value added (such as gross product) per unit either of labour input (labour productivity) or per unit of labour and capital services inputs (multi-factor productivity). Conceivably, other factors of production could be included in measures of multi-factor productivity, including ‘environmental’ factors such as water or energy: to date these have been extremely rare, but they may become more widely used as the policy focus on the use of finite natural resources (and their price) increases.
Economists have long recognized that productivity is a Good Thing (in the Sellar and Yeatman (1930) sense) as the most important source of improvements in material living standards. Book I of Smith (1776) is, arguably, a treatise on the contribution of advances in labour productivity achieved through better organization of work (‘the division of labour’):
“ten persons … could make among them upwards of forty-eight thousand pins in a day. Each person, therefore, making a tenth part of forty-eight thousand pins, might be considered as making four thousand eight hundred pins in a day. But if they had all wrought separately and independently, and without any of them having been educated to this peculiar business, they certainly could not each of them have made twenty, perhaps not one pin in a day; that is, certainly, not the two hundred and fortieth, perhaps not the four thousand eight hundredth part of what they are at present capable of performing, in consequence of a proper division and combination of their different operations” (Book I, Chapter 1).
And Book II deals with the way in which the accumulation of capital contributes to higher labour productivity:
“As the accumulation of stock is previously necessary for carrying on this great improvement in the productive powers of labour, so that accumulation naturally leads to this improvement. The person who employs his stock in maintaining labour, necessarily wishes to employ it in such a manner as to produce as great a quantity of work as possible. He endeavours, therefore, both to make among his workmen the most proper distribution of employment, and to furnish them with the best machines which he can either invent or afford to purchase. His abilities in both these respects are generally in proportion to the extent of his stock, or to the number of people whom it can employ. The quantity of industry, therefore, not only increases in every country with the increase of the stock which employs it, but, in consequence of that increase, the same quantity of industry produces a much greater quantity of work” (Book II, Chapter 1)1
Krugman (1992: 9) wrote that “a country’s ability to improve its standard of living over time depends almost entirely on its ability to raise its output per worker”.
.
1 Smith did have some ideas about the relative productivity of the manufacturing and services sectors which continue to influence policymakers’ thinking today: “[T]he labour of a manufacturer adds, generally, to the value of the materials which he works upon, that of his own maintenance, and of his master's profit. The labour of a menial servant, on the contrary, adds to the value of nothing” (Book II, Chapter 3), cf. “I don’t want to be Prime Minister of a country that doesn’t make things any more” (Rudd 2007, emphasis added).
2
And this sentiment has been echoed more recently by Australia’s most senior policy-makers and advisers: Stevens (2009) identifying productivity as “the only real basis for optimism about future income” and more recently (2011) “there is only one source of ongoing higher rates of growth of real per capita incomes, and that is higher rates of growth of productivity”, while Parkinson (2011: 11-12) observed that “in the long run, productivity growth – producing more from the same inputs – is the only sustainable way for future generations to enjoy higher living standards”.
At this Conference a decade ago, Australia’s productivity performance was widely celebrated. Bean (2000: 90) observed that “underpinning Australia’s good productivity performance over the last decade has been a high rate of productivity growth, both in historical terms and relative to other countries”. At the same Conference, Forsyth (2000: 236) also noted that “Australia’s productivity growth had been amongst the most rapid [of a number of countries experiencing high productivity growth] in recent years”. Both authors attributed Australia’s strong productivity growth performance largely to micro-economic or structural reforms, although Bean in particular warned that, on the basis of earlier UK experience with productivity-enhancing reforms, “Australian policy-makers would be unwise to project the recent high rates of productivity growth into the future” (2001: 101). Bean’s note of caution was, as it turned out, especially perspicacious.
Australia’s productivity performance in the 2000s
Australia’s productivity performance, however measured, has deteriorated substantially since the late 1990s. In terms of simple decade-average comparisons:
• Labour productivity for the Australian economy as a whole grew at an average annual rate of 1.5% over the ten years to 2009-10 (or 1.4% per annum using the ABS’ ‘quality-adjusted’ estimates for hours worked), compared with 2.1% per annum over the ten years to 1999-2000, 1.4% per annum over the ten years to 1989-90 and 2.8% per annum over the ten years to 1979-80.
• Multi-factor productivity for the Australian economy as a whole was unchanged over the course of the 2000s (or declined at a 0.2% average annual rate using ‘quality-adjusted’ hours worked), compared with growth averaging 1.6% per annum in the 1990s, 0.7% per annum in the 1980s and 1.5% per annum in the 1970s2
• Labour productivity for twelve of the industry components of the ‘market sector’ (that is, excluding sectors in which productivity growth is notoriously difficult to measure, in particular public administration and safety, education and training, and health care and social assistance) for which the Australian Bureau of Statistics has estimates going back before 1994-95 grew at an average annual rate of 1.9% during the 2000s, compared with 2.6% in the 1990s and 1.6% in the 1980s;
.
• ‘Market sector’ multi-factor productivity grew at an average annual rate of 0.2% in the 2000s, compared with 1.4% in the 1990s.
Growth in all the above measures of productivity deteriorated as the 2000s progressed (see Figure 1 which presents growth in the above four series over rolling five-year periods). In particular, multi-factor productivity growth was negative during the second half of the past decade.
2 The latest series of Australian Bureau of Statistics estimates of multi-factor productivity (in ABS 2010a) only go back to 1994-95. Hence, the rates of multi-factor productivity growth cited for the 1990s, 1980s and 1970s cited here have been derived from ABS (2008), Table 13.

3
Figure 1: Australian labour and multi-factor productivity growth in the 1990s and 2000s
In order to abstract from the influence of the business cycle on measured productivity growth, trends in productivity are more appropriately compared across ‘productivity growth cycles’ (see, for example, Productivity Commission 2010: 58). These of course don’t co-incide neatly with calendar decades. Nonetheless, comparisons across these cycles tell a similar story:
Figure 2: Australian productivity growth cycles, ‘market sector’, 1973-74 to 2009-10
4
• Growth in ‘market sector’ labour productivity decelerated from an average of 3.3% per annum over the productivity growth cycle which ran from 1993-94 through 1998-99, to 1.2% per annum over the cycle which ran from 2003-04 through 2007-08 (or to 0.8% per annum if the four additional ‘market sectors’ for which the ABS publishes estimates from 1995-96 onwards are included), while in the as yet incomplete cycle which began in 2008-09 labour productivity growth has averaged 1.5% per annum.
• Growth in ‘market sector’ multi-factor productivity slowed from an average of 2.1% per annum in the 1993-94 through 1998-99 cycle to -0.3% per annum in the 2003-04 through 2007-08 cycle (or to -0.8% per annum including the four additional ‘market sectors’), and has averaged -1.0% per annum in the as yet incomplete cycle which began in 2008-09.
As shown in Figure 2 (on page 3, above), productivity growth during the most recent completed cycle was, on either measure, the worst of any cycle since the 1970s.
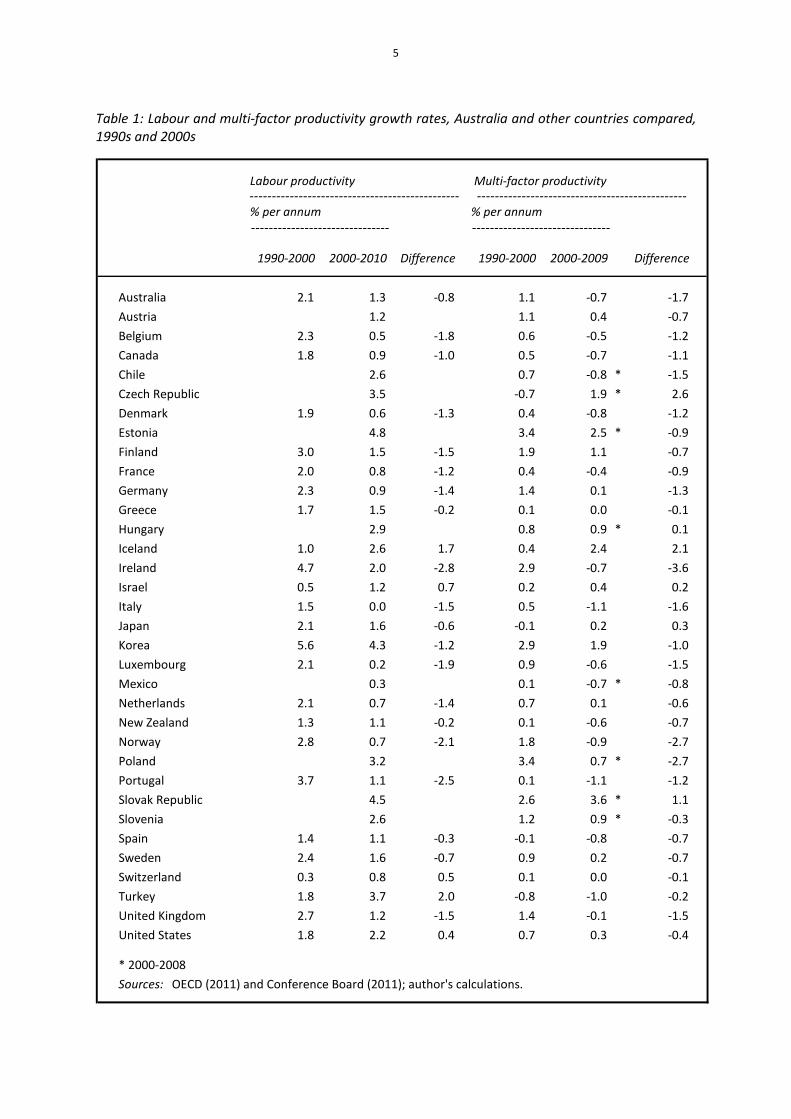
Australia has been by no means unique in experiencing a slow-down in productivity growth since the turn of the century. Of the 25 countries for which the OECD has estimates going back to 1990, only four experienced faster labour productivity growth in the 2000s than in the 1990s, those four being Israel, Switzerland, Turkey and the United States. And the decline in Australia’s labour productivity growth rate between the 1990s and 2000s was of the same magnitude – 0.8 percentage points – as the unweighted average for the 26 countries for which it is possible for such comparisons to be made.
However, whereas Australian labour productivity growth was in line with the (unweighted) OECD average in the 1990s, during the 2000s it was, at 1.3% per annum (according to the OECD’s estimates), 0.5 percentage points below the unweighted OECD average and 0.2 percentage points below the weighted OECD average. Australia ranked 11th out of 25 OECD countries in descending order of labour productivity growth in the 1990s, and 17th out of 34 countries in the 2000s (see Table 1).
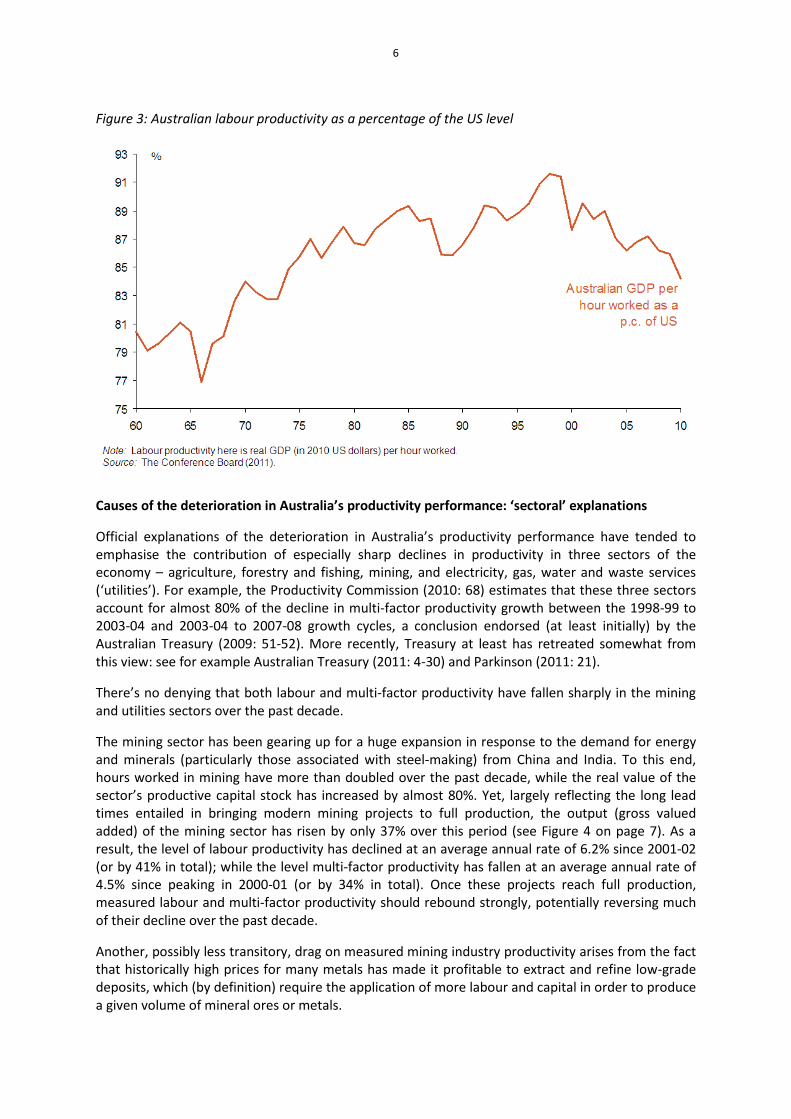
Using the United States as a crude proxy for ‘best practice’ in terms of labour productivity3
Of the 28 OECD countries for which the Conference Board (2011) publishes data on what it calls ‘total factor productivity’ up to 2009, only three experienced faster multi-factor productivity growth in the 2000s than in the 1990s (Israel and, perhaps counter-intuitively, Japan and, even more so, Iceland
, the level of Australian labour productivity declined from a peak of 91.6% of the corresponding US level in 1998 to 84.2% of the US level in 2010, more than reversing the 5 percentage point increase in this ratio which occurred between 1990 and 1998, and in fact the lowest level since 1973 (see Figure 3 on page 6).
4
). However the decline in Australia’s multi-factor productivity growth rate as measured in the Conference Board database, of 1.7 percentage points (from 1.1% per annum to -0.7% per annum) was more than double the (unweighted) average for these 28 countries, and larger than any except those recorded in Ireland, Norway, Malta and Finland.
3 On the grounds that the United States has higher GDP per hour worked than any other OECD country except for Luxembourg and Norway, two small economies an unusually large proportion of each of which is accounted for by a sector with intrinsically high levels of labour productivity, namely financial services and oil extraction, respectively. 4 An illustration, perhaps, of the first part of Krugman’s widely quoted aphorism that “productivity isn’t everything [even if] in the long run it’s almost everything” (1992: 9).
5
Table 1: Labour and multi-factor productivity growth rates, Australia and other countries compared, 1990s and 2000s
1990-2000 2000-2010 Difference 1990-2000 2000-2009 Difference
Australia 2.1 1.3 -0.8 1.1 -0.7 -1.7
Austria 1.2 1.1 0.4 -0.7
Belgium 2.3 0.5 -1.8 0.6 -0.5 -1.2
Canada 1.8 0.9 -1.0 0.5 -0.7 -1.1
Chile 2.6 0.7 -0.8 * -1.5
Czech Republic 3.5 -0.7 1.9 * 2.6
Denmark 1.9 0.6 -1.3 0.4 -0.8 -1.2
Estonia 4.8 3.4 2.5 * -0.9
Finland 3.0 1.5 -1.5 1.9 1.1 -0.7
France 2.0 0.8 -1.2 0.4 -0.4 -0.9
Germany 2.3 0.9 -1.4 1.4 0.1 -1.3
Greece 1.7 1.5 -0.2 0.1 0.0 -0.1
Hungary 2.9 0.8 0.9 * 0.1
Iceland 1.0 2.6 1.7 0.4 2.4 2.1
Ireland 4.7 2.0 -2.8 2.9 -0.7 -3.6
Israel 0.5 1.2 0.7 0.2 0.4 0.2
Italy 1.5 0.0 -1.5 0.5 -1.1 -1.6
Japan 2.1 1.6 -0.6 -0.1 0.2 0.3
Korea 5.6 4.3 -1.2 2.9 1.9 -1.0
Luxembourg 2.1 0.2 -1.9 0.9 -0.6 -1.5
Mexico 0.3 0.1 -0.7 * -0.8
Netherlands 2.1 0.7 -1.4 0.7 0.1 -0.6
New Zealand 1.3 1.1 -0.2 0.1 -0.6 -0.7
Norway 2.8 0.7 -2.1 1.8 -0.9 -2.7
Poland 3.2 3.4 0.7 * -2.7
Portugal 3.7 1.1 -2.5 0.1 -1.1 -1.2
Slovak Republic 4.5 2.6 3.6 * 1.1
Slovenia 2.6 1.2 0.9 * -0.3
Spain 1.4 1.1 -0.3 -0.1 -0.8 -0.7
Sweden 2.4 1.6 -0.7 0.9 0.2 -0.7
Switzerland 0.3 0.8 0.5 0.1 0.0 -0.1
Turkey 1.8 3.7 2.0 -0.8 -1.0 -0.2
United Kingdom 2.7 1.2 -1.5 1.4 -0.1 -1.5
United States 1.8 2.2 0.4 0.7 0.3 -0.4
* 2000-2008
Sources: OECD (2011) and Conference Board (2011); author's calculations.
-------------------------------% per annum
Labour productivity-----------------------------------------------
Multi-factor productivity-----------------------------------------------
% per annum-------------------------------
6
Figure 3: Australian labour productivity as a percentage of the US level
Causes of the deterioration in Australia’s productivity performance: ‘sectoral’ explanations
Official explanations of the deterioration in Australia’s productivity performance have tended to emphasise the contribution of especially sharp declines in productivity in three sectors of the economy – agriculture, forestry and fishing, mining, and electricity, gas, water and waste services (‘utilities’). For example, the Productivity Commission (2010: 68) estimates that these three sectors account for almost 80% of the decline in multi-factor productivity growth between the 1998-99 to 2003-04 and 2003-04 to 2007-08 growth cycles, a conclusion endorsed (at least initially) by the Australian Treasury (2009: 51-52). More recently, Treasury at least has retreated somewhat from this view: see for example Australian Treasury (2011: 4-30) and Parkinson (2011: 21).
There’s no denying that both labour and multi-factor productivity have fallen sharply in the mining and utilities sectors over the past decade.
The mining sector has been gearing up for a huge expansion in response to the demand for energy and minerals (particularly those associated with steel-making) from China and India. To this end, hours worked in mining have more than doubled over the past decade, while the real value of the sector’s productive capital stock has increased by almost 80%. Yet, largely reflecting the long lead times entailed in bringing modern mining projects to full production, the output (gross valued added) of the mining sector has risen by only 37% over this period (see Figure 4 on page 7). As a result, the level of labour productivity has declined at an average annual rate of 6.2% since 2001-02 (or by 41% in total); while the level multi-factor productivity has fallen at an average annual rate of 4.5% since peaking in 2000-01 (or by 34% in total). Once these projects reach full production, measured labour and multi-factor productivity should rebound strongly, potentially reversing much of their decline over the past decade.
Another, possibly less transitory, drag on measured mining industry productivity arises from the fact that historically high prices for many metals has made it profitable to extract and refine low-grade deposits, which (by definition) require the application of more labour and capital in order to produce a given volume of mineral ores or metals.

7
Figure 4: Mining industry labour and capital stock, output and productivity
This inevitably detracts from measured productivity, even though it represents logical and profitable business for mining companies. This drag will persist for as long as metal prices remain high by historical standards. Indeed. Mudd (2009) argues that ore grades will continue declining indefinitely, and the amount of ‘overburden’ required to be removed in order to gain access especially to coal and base metals will continue to increase over time.
A different set of factors have resulted in similar trends in productivity in the utilities sector. This was a sector which recorded substantial productivity gains in the 1990s, largely as a result of reforms engineered by State Governments. During the past decade, however, electricity and gas businesses have had to invest heavily in response to continued growth in demand (especially for peak load, which inevitably entails a large degree of ‘redundancy’ at non-peak times), to replace ageing transmission infrastructure, and to meet government-mandated renewable energy targets. Likewise governments have undertaken significant investments in water infrastructure (including desalination plants in five States), with a view to guaranteeing security of supply in drought conditions, whilst simultaneously imposing restrictions on the use of water throughout much of the decade, which detracted from the output of water businesses without commensurate reductions in factor inputs.
Thus, in this sector, hours worked have increased by 73% over the past decade, and the real value of the productive capital stock by 35%, whereas output has risen by only 15%: correspondingly, labour productivity has fallen by 34% (an average annual rate of decline of 4.0%) and multi-factor productivity by 31% (3.6% pa) (see Figure 5 on page 8).
The output of the agriculture sector has obviously been affected by drought during the past decade, but it’s not obvious that agricultural sector productivity has detracted from Australia’s overall productivity performance over the past decade (see Figure 6). On the contrary, partly as a result of substantial labour-shedding in the early years of the decade, agricultural sector productivity rose at an average annual rate of 3.9% over the 2000s, the second-fastest of any of the 16 industries making up the market sector, while multi-factor productivity in agriculture rose at an average annual rate of 1.9%, a more rapid rate than any other sector.

8
Figure 5: Utilities sector labour and capital stock, output and productivity
Figure 6: Agriculture, forestry and fishing sector labour and capital stock, output and productivity
The mining and utilities sectors together have over the past decade employed about 19% of Australia’s non-housing capital stock and a little over 2% of Australia’s workforce, to produce about 11% of Australia’s overall output. On that basis alone it seems prima facie implausible that these two sectors could have accounted for nearly all of the decline in Australia’s productivity since the turn of the century.

9
However this is not something which can be verified by direct reference to the productivity statistics published by the Australian Bureau of Statistics, since these are, consistent with international practice, published in index number form, with both labour and multi-factor productivity for each industry set to 100.0 in the base year of the national accounts. This provides the most accurate basis for estimating rates of productivity growth for each sector over time, especially when the numerator in the measure of productivity is derived from chain-volume estimates of output. However, the use of index numbers precludes comparisons of the levels of productivity across different industries at any given point in time, or the extraction of particular sectors which are believed to be distorting economy- or market sector-wide productivity in order to arrive at some measure excluding those sectors, analogous to exclusion-based measures of ‘core’ inflation or ‘underlying’ economic activity.
In order to circumvent this problem, Eslake and Walsh (2011) constructed ‘dollar-denominated’ estimates of labour productivity by industry sector. This required the derivation of estimates of actual hours worked by industry by multiplying the published figures for average weekly hours worked in each industry by those for employment in each industry, both of which are available for the middle month of each quarter: the resulting estimates were then average for each financial year, and multiplied by 52 to derive an estimate of annual hours worked in each industry5
These estimates are shown for 2009-10 in Figure 7 below, while Figure 8 (on page 10) shows the behaviour of the measure of GVA per hour worked for the economy as a whole with the corresponding ABS index measure.
. These estimates of aggregate hours worked were then divided into the published estimates of gross value added (GVA) by industry to derive estimates of GVA per hour worked, or labour productivity.
Figure 7: Gross value added per hour worked, in dollars, by industry, 2009-10
5 To the extent that the hours worked in the survey week of the middle month of each quarter are unrepresentative of that quarter as a whole, the resulting estimates of total hours worked may be inaccurate. In practice, however, the behaviour through time of the resulting productivity estimates does not appear to be significantly different from that of the corresponding ABS index numbers.

10
Figure 8: Aggregate gross value added per hour worked vs ABS labour productivity index
The ordering of sectors by output per hour worked accords, in most cases, with what one would expect intuitively – that is, sectors which are intensive in their use of capital and/or skilled labour (such as mining, financial services, rental and hiring, IT and telecommunications, and utilities) have higher-than-average output per hour worked; while sectors which are relatively intensive in their use of unskilled labour (such as retailing, or accommodation and food services) have well-below average output per hour worked. There are a few apparent anomalies, such as education and training, or health care and social assistance, although since output in these sectors is in part measured by reference to labour and capital input so these need to be interpreted more cautiously.
Figure 9 (on page 11) shows estimates of both the 12- and 16-industry measures of ‘market sector’ productivity calculated as GVA per hour worked, including and excluding the mining and utilities sectors.
For the ‘market sector’ (as presently defined by ABS) as a whole, labour productivity growth declined from a peak of 3.1% pa over the five years to 1999-00 to 1.7% pa over the five years to 2009-10, a decline of 1.4 percentage points. Excluding the mining and utilities sectors, market sector labour productivity declined from 3.2% pa to 1.9% pa over the same interval, a decline of 1.3 percentage points. For the larger group of ‘selected sectors’, labour productivity growth declined from a peak of 3.0% pa over the five years to 2001-02 to 1.2% over the five years to 2009-10, a decline of 1.8 percentage points. Excluding the mining and utilities sectors, labour productivity growth for this group declined from 3.2% to 1.4% over the same interval, a decline also of 1.8 percentage points.
This suggests that the decline in labour productivity in the mining and utilities sectors accounts for less than 10% of the decline in overall market sector productivity growth over the past decade – a considerably smaller contribution than suggested by the Productivity Commission’s analysis referred to earlier (Productivity Commission, 2010).
Given the rough-and-ready nature of these estimates, not too much precision should be attributed to this numerical conclusion. However it does nonetheless suggest that the slow-down in Australian productivity growth has been broadly-based rather than being largely the result of peculiar outcomes in a handful of industries.

11
Figure 9: Market sector labour productivity including and excluding the mining & utilities sectors
This conclusion is supported by the observation that both labour and multi-factor productivity growth have slowed in all but three of the 16 sectors for which the ABS produces index-based estimates between the 1990s and 2000s. Those three sectors – construction; administration and support services; and arts and recreation services – account for 9.6% of GDP and 11.2% of gross value added in industry.
The deterioration in Australia’s (labour) productivity performance during the 2000s appears to have been more broadly-based than in other comparable countries. Comparisons of productivity performance among countries at the industry level are complicated not only by the same measurement issues that pertain to comparisons of aggregate productivity (including that of the appropriate exchange rate) but also by differences in industrial classification systems.
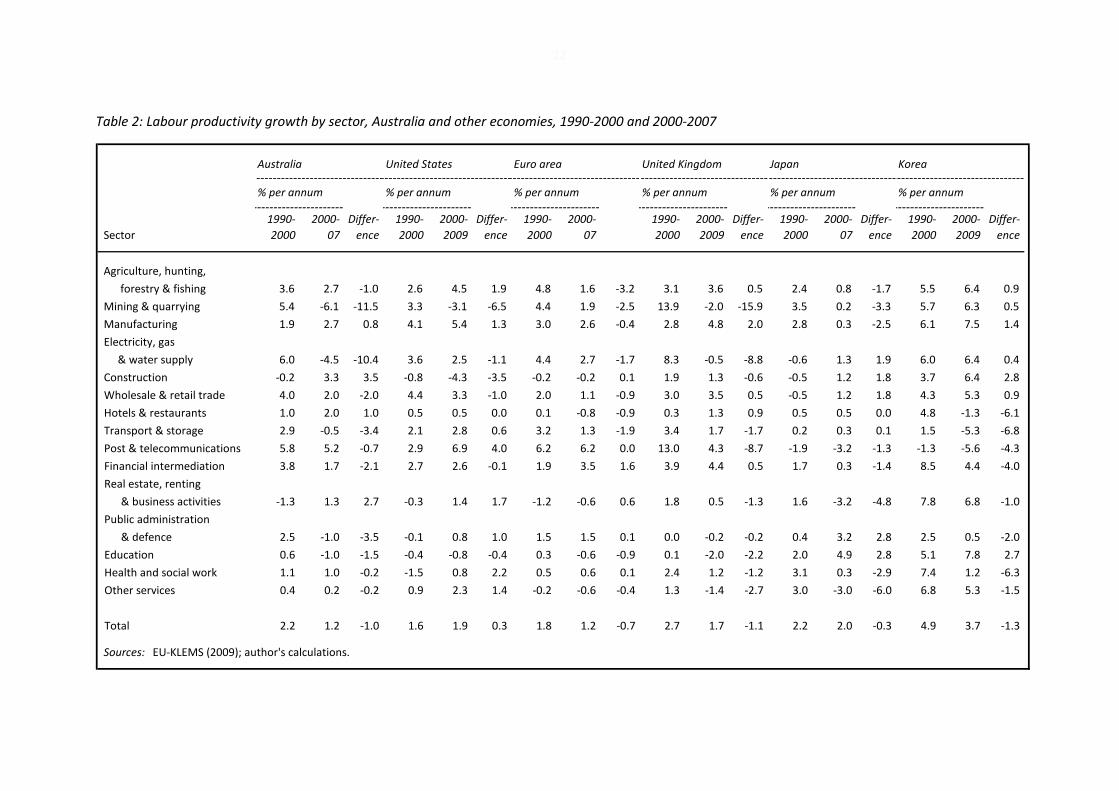
The most readily available data base allowing such comparisons to be made is the Groningen Growth and Development Centre’s EU-KLEMS (2009) database. The latest version of this database contains data only up to 2007. As summarized in Table 2 (on page 12), it shows that labour productivity growth slowed between 1990-2000 and 2000-07 in 11 of the 15 broad industry groups used in EU-KLEMS, compared with 7 in the US, 9 in the Euro area, 10 in the UK, 8 in Japan (for which the data is available only up to 2006), and 8 in Korea. Most other economies also experienced large declines in labour productivity growth in their mining and utilities sectors (almost as large in the UK as in Australia); but by comparison with the other economies shown in Table 2, Australia experienced particularly large declines in productivity growth in the wholesale and retail trade, transport and storage, financial services, public administration and defence, and education sectors.
The Productivity Commission (2011) has recently fleshed out this relatively poor performance in the context of the retail sector, producing estimates suggesting that labour productivity in that sector in 2007 was some 38% lower than in the United States, some 20-35% below that in Germany, the United Kingdom and France, and only marginally higher than in Spain or Greece; and that both labour and multi-factor productivity growth in retailing had been significantly slower in Australia than in the United States.
12
Table 2: Labour productivity growth by sector, Australia and other economies, 1990-2000 and 2000-2007
Sector1990-2000
2000-07
Differ-ence
1990-2000
2000-2009
Differ-ence
1990-2000
2000-07
1990-2000
2000-2009
Differ-ence
1990-2000
2000-07
Differ-ence
1990-2000
2000-2009
Differ-ence
Agriculture, hunting,
forestry & fishing 3.6 2.7 -1.0 2.6 4.5 1.9 4.8 1.6 -3.2 3.1 3.6 0.5 2.4 0.8 -1.7 5.5 6.4 0.9
Mining & quarrying 5.4 -6.1 -11.5 3.3 -3.1 -6.5 4.4 1.9 -2.5 13.9 -2.0 -15.9 3.5 0.2 -3.3 5.7 6.3 0.5
Manufacturing 1.9 2.7 0.8 4.1 5.4 1.3 3.0 2.6 -0.4 2.8 4.8 2.0 2.8 0.3 -2.5 6.1 7.5 1.4
Electricity, gas
& water supply 6.0 -4.5 -10.4 3.6 2.5 -1.1 4.4 2.7 -1.7 8.3 -0.5 -8.8 -0.6 1.3 1.9 6.0 6.4 0.4
Construction -0.2 3.3 3.5 -0.8 -4.3 -3.5 -0.2 -0.2 0.1 1.9 1.3 -0.6 -0.5 1.2 1.8 3.7 6.4 2.8
Wholesale & retail trade 4.0 2.0 -2.0 4.4 3.3 -1.0 2.0 1.1 -0.9 3.0 3.5 0.5 -0.5 1.2 1.8 4.3 5.3 0.9
Hotels & restaurants 1.0 2.0 1.0 0.5 0.5 0.0 0.1 -0.8 -0.9 0.3 1.3 0.9 0.5 0.5 0.0 4.8 -1.3 -6.1
Transport & storage 2.9 -0.5 -3.4 2.1 2.8 0.6 3.2 1.3 -1.9 3.4 1.7 -1.7 0.2 0.3 0.1 1.5 -5.3 -6.8
Post & telecommunications 5.8 5.2 -0.7 2.9 6.9 4.0 6.2 6.2 0.0 13.0 4.3 -8.7 -1.9 -3.2 -1.3 -1.3 -5.6 -4.3
Financial intermediation 3.8 1.7 -2.1 2.7 2.6 -0.1 1.9 3.5 1.6 3.9 4.4 0.5 1.7 0.3 -1.4 8.5 4.4 -4.0
Real estate, renting
& business activities -1.3 1.3 2.7 -0.3 1.4 1.7 -1.2 -0.6 0.6 1.8 0.5 -1.3 1.6 -3.2 -4.8 7.8 6.8 -1.0
Public administration
& defence 2.5 -1.0 -3.5 -0.1 0.8 1.0 1.5 1.5 0.1 0.0 -0.2 -0.2 0.4 3.2 2.8 2.5 0.5 -2.0
Education 0.6 -1.0 -1.5 -0.4 -0.8 -0.4 0.3 -0.6 -0.9 0.1 -2.0 -2.2 2.0 4.9 2.8 5.1 7.8 2.7
Health and social work 1.1 1.0 -0.2 -1.5 0.8 2.2 0.5 0.6 0.1 2.4 1.2 -1.2 3.1 0.3 -2.9 7.4 1.2 -6.3
Other services 0.4 0.2 -0.2 0.9 2.3 1.4 -0.2 -0.6 -0.4 1.3 -1.4 -2.7 3.0 -3.0 -6.0 6.8 5.3 -1.5
Total 2.2 1.2 -1.0 1.6 1.9 0.3 1.8 1.2 -0.7 2.7 1.7 -1.1 2.2 2.0 -0.3 4.9 3.7 -1.3
Australia United States---------------------------------------------------------------% per annum % per annum
---------------------- ----------------------
Sources: EU-KLEMS (2009); author's calculations.
Euro area United Kingdom-------------------------------- -------------------------------
% per annum % per annum---------------------- ----------------------
Japan Korea---------------------------------------------------------------% per annum % per annum
---------------------- ----------------------
13
The Commission concluded that “it appears likely that the size of the gap between Australia and the US has been increasing; nor has Australia made any significant gains in its position in regards to other leading countries” (2011: 67). Similarly, Daley and Walsh (2011) have argued that labour productivity in the Australian construction sector declined by half relative to its US counterpart between 1990 and 2005.
So, as Stevens (2011), observed recently, “it is now just about impossible to avoid the conclusion that productivity growth performance has been quite poor since at least the mid 2000s”.
Causes of the deterioration in Australia’s productivity performance: other possibilities
If the deterioration in Australia’s productivity performance isn’t primarily explained by sharp falls in productivity in a small number of sectors of the Australian economy, then what else could explain it?
It seems eminently plausible that at least part of the slowdown in productivity growth is attributable to the fading of the impact of the reforms which are widely agreed to have been a substantial driver of the acceleration in productivity growth during the 1990s, as re-affirmed recently by the Productivity Commission, which stated that that “the reforms of the latter part of the 1980s and the 1990s” were the “prime candidate” for the “most likely causes of the surge in productivity” during the 1990s (2010: 62) and the OECD (2010a: 14), as well as (as noted earlier) by Bean and Forsyth at this conference a decade ago6
To the extent that reforms of the 1980s and 1990s prompted ‘step changes’ in the level of productivity – as may well have been the case with, for example, the privatization of government monopolies or with at least some aspects of ‘competition policy’ – then the fading of what appeared at the time to have been an increase in the rate of productivity growth is unsurprising.
.
Indeed this was precisely what Bean (2000: 99) suggested would turn out to be the case, predicting that “most of the structural reforms should primarily have a once-off level effect, although it may take some years to work through fully”. At the same conference Quiggin (2000: 269-70) suggested that much of the apparent increase in measured productivity growth during the 1990s could be explained by measured (or unmeasured) increases in working hours and by increases in ‘work intensity’. To the extent that either of these suggestions are accurate (and they were contested by other participants at the conference (see Gruen and Shesthra (2000: 275-6)), the increases in recorded productivity growth rates for which they accounted would also have been unsustainable.
It also seems highly plausible that at least part of the slowdown in productivity growth since the turn of the century is attributable to the absence of any significant productivity-enhancing reforms since that time (and that is, perhaps charitably, counting the reforms to the taxation system of 1999 and 2000 as ‘productivity enhancing’). As Garnaut (2010: 7-8) has observed,
“There has been no successful major step in productivity-raising reform since the tax changes associated with the introduction of the GST in 2001(sic) … Economic policy since the introduction of the GST has been characterised by change rather than productivity-raising reform. The use of independent analysis and transparent discussion of policy reform has become rare … [A]ttempts at major reform that had the potential to raise productivity and incomes, but failed comprehensively … poisoned the soil for further reform for a considerable while”.
6 Salgado (2000) is another useful study in this context.

14
In particular, the workplace relations reforms introduced by the Howard Government under the title ‘Workchoices’ in its last term in office were not, primarily, ‘productivity-enhancing’.
With the exception of the changes to ‘unfair dismissals’ procedures, they did not entail a significant degree of further labour market deregulation, but rather provided for a change in the level of government responsible for the regulation of the labour market, and to some extent the purposes for which that regulation was pursued. And to the extent that it had succeeded in one of its stated objectives of increasing the participation in employment of people with limited skills, it would have (at least initially) detracted from measured labour productivity (although that would not, by itself, be a reason for objecting to the elements of ‘Workchoices’ intended to bring about that result)7
The dearth of productivity-enhancing reforms since about 2000 is clearly in part attributable to changes in the political environment, including a diminution in the enthusiasm of both major political parties for continuing reforms of the type pursed in the 1980s and early 1990s once the politically ‘easiest’ reforms (what management consultants typically call the ‘low-hanging fruit’) had been accomplished and what remained was seen as more politically ‘challenging’, including to important elements of the ‘core constituencies’ of both sides of Australian politics
.
8
The lack of enthusiasm for productivity-enhancing reforms since about 2000, on the part of both political leaders and the public at large, also seems in part attributable, paradoxically, to the generally more prosperous economic circumstances of the last decade.
. Changes in voting behaviour – particularly in rural and regional areas, but also in areas such as western Sydney – made both major political parties more sensitive to the views of those who perceived themselves (not always inaccurately) as ‘losers’ from the reforms of the 1980s and 1990s.
The reforms of the 1980s and 1990s were to a significant degree prompted by the economic vulnerabilities exposed by the persistence of high inflation and unemployment since the mid-1970s, the decline in Australia’s terms of trade during the 1970s and 1980s, and two severe recessions occurring within less than a decade, which prompted the then leaders of both sides of Australian politics to “embrace … the free market agenda and its gradual application as the solution to Australia’s underlying problems” (Kelly 1992: 660) and an at least tacit, if not whole-hearted, acceptance of that agenda on the part of the Australian electorate at large.
By contrast, the past decade has been one of almost uninterrupted growth in economic activity, employment and household disposable income, lower unemployment than at any time since the mid-1970s, sound public finances (especially by comparison with other ‘advanced’ economies’, relatively low and stable inflation, relatively low and stable interest rates, a generally rising exchange rate (something widely seen among the broader population as a short-hand summary of international investors’ views of Australia’s economic performance) and (perhaps most importantly in this context) a dramatic reversal of the downward trend in Australia’s terms of trade which had prevailed throughout most of the twentieth century.
Garnaut (2005: 3) speaks of “a Great Complacency that descended upon the country after a decade of exceptional economic growth … as a community we accepted the excellent economic performance as evidence that we had changed enough”.
More recently Stevens (2011) has noted that “past periods of apparently easy affluence, conferred by favourable international conditions, probably lessened the sharpness of our focus on productivity”. 7 For more on this point see Eslake (2006). 8 For example, newsagents, pharmacies, farming interests and the traditional professions (for the Liberal and National Parties), and public sector unions (for the Labor Party).

15
This ‘diminished focus’ on productivity over the past decade has not been confined to the public policy arena. As the profit share of Australia’s national income has increased to unprecedented levels during the past decade (apart from the period immediately after the global financial crisis), businesses have in general attached less importance to the pursuit of productivity gains at the enterprise or workplace level (which is, after all, where the decisions that actually lead to higher levels of productivity are formulated and executed, if at all). A survey conducted last year by Telstra (2010) found that, among over 300 organizations each with over 200 employees:
• only 42% measure their productivity, have specific productivity targets and know what they are, while 25% don’t measure their productivity at all;
• only 22% believe that they can accurately measure productivity benefits when considering investment decisions; and
• only 34% of firms assign individual responsibilities for productivity improvements.
As with the diminished enthusiasm for productivity-enhancing reforms at the political level, this low emphasis on the measurement of and accountability for productivity at the enterprise level is to at least some extent understandable. Productivity-enhancing change in individual work-places is often disruptive and unpleasant, both for those on the ‘receiving end’ of that change and those (typically ‘middle managers’) who have to communicate it to those affected and implement it. When making such changes is no longer a matter of survival – as it was for many businesses in the 1990s – it is not surprising that there is less desire to make them.
It is also to some extent inevitable, and consistent with both historical experience and the contemporary experience of other countries, that as the Australian economy moved closer to ‘full capacity’ in the second half of the 2000s, a situation characterized by (among other things) increasing shortages of skilled labour and the emergence of ‘bottlenecks’ in key areas of infrastructure provision, that measured productivity would deteriorate – irrespective of whether political and business leaders had maintained their earlier enthusiasm for productivity-enhancing change in either the public policy-making or business decision-making.
Another important and, in this context, pertinent development of the past decade has been the increasing volume of legislation and regulation in reaction to corporate scandals, various actual or perceived threats to ‘security’, and other more quotidian aspects of life.
A common belief underpinning this legislation and regulation is that it is both possible and desirable to eliminate various kinds of risk (to life, to property, to public order and safety, to people’s savings, to standards of corporate or private behaviour, and so on) through additional legislative or regulatory action, irrespective of the probabilities attaching to those risks, irrespective of the adequacy of already existing legislation or regulation to that end, and irrespective of the costs of seeking to eliminate those risks relative to the benefits of doing so9
Much of this legislation and regulation has required the employment of additional staff, the acquisition of additional capital equipment or the costly modification of existing buildings and infrastructure, without resulting in the production of any additional (measured) goods or services, and often with the incidental effect of diverting the time and attention of other people from activities that would have otherwise resulted in the production of additional goods and services.
.
9 See, for example, Mueller and Stewart (2011) for a ‘cost-benefit analysis’ of the aviation ‘security’ measures adopted in the United States (and to a very large extent emulated in Australia) after the terrorist attacks on New York and Washington on September 11, 2001, and subsequent actual or attempted terrorist incidents around the world.

16
In other words, whatever public or private benefits that have been procured through legislation and regulation of this type have inevitably come at some cost in terms of productivity.
Of course, such costs may well be seen by many as an example of where, in Krugman’s famous aphorism, productivity “isn’t everything”: but that is not to deny that such costs have been real.
Nor has Australia’s experience in this regard been unique, although when one looks beyond the realm of aviation ‘security’ to other aspects of business and personal life, the quantum and reach of ‘risk-averting’ legislation and regulation may well have been more pervasive in Australia than in many other ‘advanced’ economies.
Although difficult to verify in any empirical manner, there is considerable anecdotal evidence suggesting that the increased recourse to legislative and regulatory means of eliminating various types of risks has prompted business owners and managers to devote increasing proportions of their time and attention to compliance and risk management activities, and to have become less willing to take on some of the risks inevitably associated with decisions to undertake organizational change, enter new markets, develop new products or services, or engage in other forms of productivity-enhancing innovation.
One illustration of this may be the apparent decline in Australia’s relative take-up of new technologies.
In the second half of the 1990s, Australia typically ranked behind only the Nordic countries and the United States in various (objective and subjective) measures of the penetration or diffusion of new information and communications technologies. By the end of the past decade, however, Australia’s ranking had slipped to, typically, between 15th and 22nd, behind not only the US and Nordic countries but also a large number of Western European countries, a growing number of Asian economies, Canada and Israel (see Table 3).
Although some dimensions of Australia’s innovation effort – for example, gross expenditure on research and development (GERD) as a percentage of GDP – have improved over the past decade, on many others Australia still falls well short of OECD ‘best practice’:
• only 2.4% of Australian firms introduced one or more product innovations that were new to international markets in 2008-09, compared with 10% of Japanese firms, between 20% and 35% of European firms, and even 20% of New Zealand firms;
• only 9.6% of Australian firms introduced one or more product innovations that were new to their domestic market in 2008-09, a slightly better figure than that for German firms of 7.4% but below the 10-15% figures common for firms from other European economies, 25.3% for Japanese firms and even 15.4% for New Zealand firms;
• by contrast, Australian firms are much more likely to modify or adopt products or processes that already exist in domestic markets, which “might contribute to specialization but will not necessarily create or confer any ‘first mover’ competitive advantage” (Department of Innovation, Industry, Science and Research 2011: 26).
Australian business investment in intangibles is also relatively low by OECD standards, at 5.9% of GDP in 2006, lower than all but three of the 16 countries (Spain, Italy and Slovakia) for which this data was available, and substantially below the US (12.0%), Japan (11.1%), Canada (9.8%) and the UK (9.7%) (OECD 2010b).

17
Table 3: Country rankings in surveys of innovation performance
Benchmarking
EU & US Innovation
Top 1. USA 1. Iceland 1. Singapore 1. Singapore 1. Japan 1. SwitzerlandRanking 2. Switzerland 2. Sweden 2. Sweden 2. South Korea 2. Switzerland 2. IrelandCountries: 3. Finland 3. Hong Kong 3. Luxembourg 3. Switzerland 3. USA 3. USA
4. Japan 4. Switzerland 4. Denmark 4. Iceland 4. Sweden 4. Japan5. Sweden 5. Denmark 5. South Korea 5. Ireland 5. Finland 5. Sweden6. Israel 6. Finland 6. USA 6. Hong Kong 6. Germany 6. Germany7. Taiwan, China 7. Singapore 7. Finland 7. Finland 7. Denmark 7. UK8. Germany 8. Netherlands 8. UK 8. USA 8. Taiwan 8. Netherlands9. Singapore 9. New Zealand 9. Japan 9. Japan 9. Netherlands 9. Finland10. Denmark 10. Norway 10. Netherlands 10. Sweden 10. Israel 10. France11. Canada 11. USA 11. France 11. Denmark 11. Austria 11. Denmark12. Korea, Rep. 12. Canada 12. Ireland 12. Netherlands 12. France 12. Belgium13. Netherlands 13. Japan 13. Belgium 13. Luxembourg 13. Canada 13. Austria14. UK 14. UK 14. Germany 14. Canada 14. Belgium 14. Canada15. Belgium 15. Luxembourg 15. Canada 15. UK 15. South Korea 15. Australia16. Luxembourg 16. Germany 16. Austria 16. Israel 16. Norway 16. Italy17. Iceland 17. Belgium 17. Australia 17. Austria 17. Singapore 17. Norway 18. Norway 18. Australia 18. Czech Rep. 18. Norway 18. UK19. France 19. Ireland 19. Estonia 19. Germany 19. Ireland20. Austria 20. Korea, Rep. 20. Spain 20. France 20. Italy21. Australia 21. Austria 21. Hungary 21. Malaysia 21. Australia22. Ireland 22. France 22. Lithuania 22. Australia 22. New Zealand
Year 2010-11 2009-10 2009 2009 2007 2010Source World Economic Forum INSEAD ITIF Boston Consulting
Group Economist Intelligence Unit
Canada Conference Board
Source: INSEAD Global Innovation Index 2007 and 2009-10.
SurveyGlobal Competitiveness Report – Innovation
Global Innovation Index
The Innovation Imperative in Manufacturing
EIU Report How Canada Performs - Innovation
18
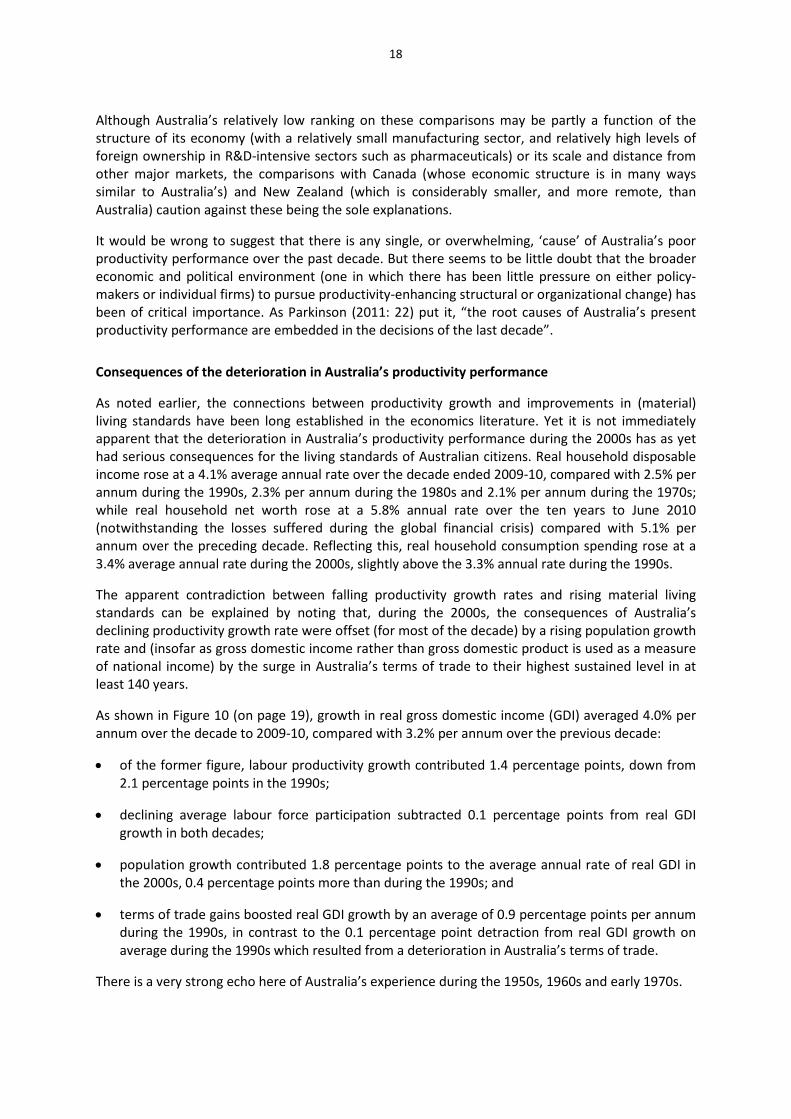
Although Australia’s relatively low ranking on these comparisons may be partly a function of the structure of its economy (with a relatively small manufacturing sector, and relatively high levels of foreign ownership in R&D-intensive sectors such as pharmaceuticals) or its scale and distance from other major markets, the comparisons with Canada (whose economic structure is in many ways similar to Australia’s) and New Zealand (which is considerably smaller, and more remote, than Australia) caution against these being the sole explanations.
It would be wrong to suggest that there is any single, or overwhelming, ‘cause’ of Australia’s poor productivity performance over the past decade. But there seems to be little doubt that the broader economic and political environment (one in which there has been little pressure on either policy-makers or individual firms) to pursue productivity-enhancing structural or organizational change) has been of critical importance. As Parkinson (2011: 22) put it, “the root causes of Australia’s present productivity performance are embedded in the decisions of the last decade”.
Consequences of the deterioration in Australia’s productivity performance
As noted earlier, the connections between productivity growth and improvements in (material) living standards have been long established in the economics literature. Yet it is not immediately apparent that the deterioration in Australia’s productivity performance during the 2000s has as yet had serious consequences for the living standards of Australian citizens. Real household disposable income rose at a 4.1% average annual rate over the decade ended 2009-10, compared with 2.5% per annum during the 1990s, 2.3% per annum during the 1980s and 2.1% per annum during the 1970s; while real household net worth rose at a 5.8% annual rate over the ten years to June 2010 (notwithstanding the losses suffered during the global financial crisis) compared with 5.1% per annum over the preceding decade. Reflecting this, real household consumption spending rose at a 3.4% average annual rate during the 2000s, slightly above the 3.3% annual rate during the 1990s.
The apparent contradiction between falling productivity growth rates and rising material living standards can be explained by noting that, during the 2000s, the consequences of Australia’s declining productivity growth rate were offset (for most of the decade) by a rising population growth rate and (insofar as gross domestic income rather than gross domestic product is used as a measure of national income) by the surge in Australia’s terms of trade to their highest sustained level in at least 140 years.
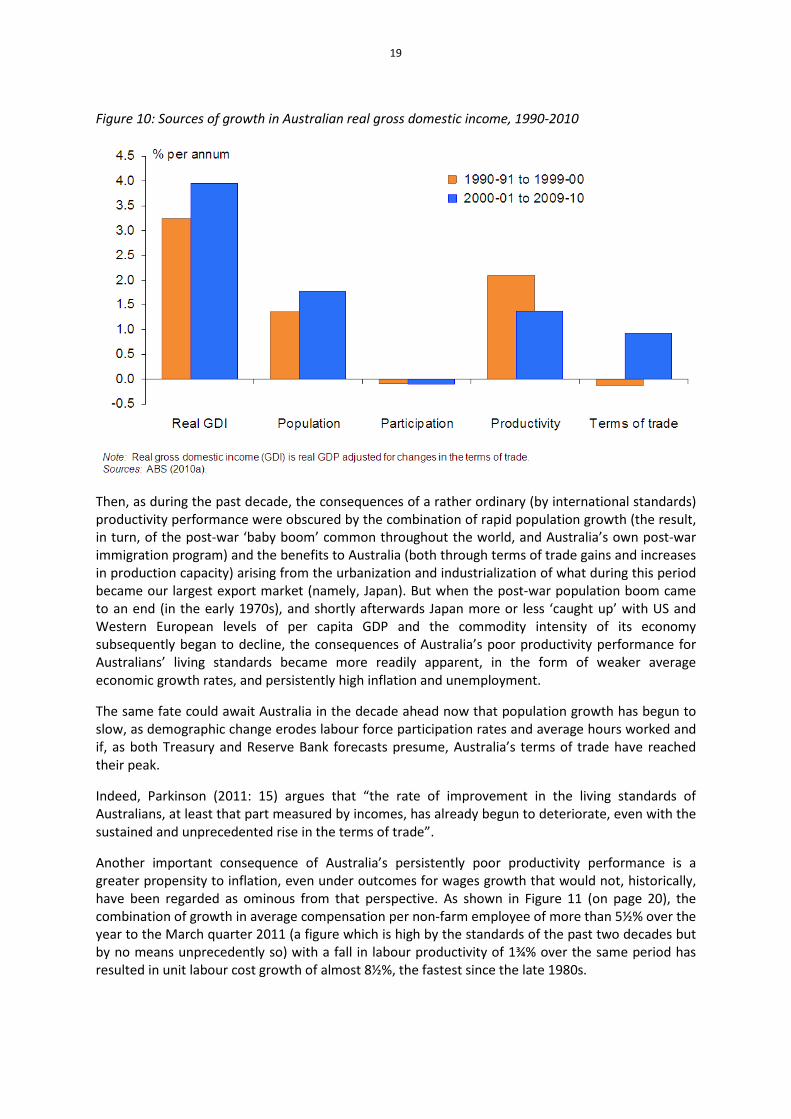
As shown in Figure 10 (on page 19), growth in real gross domestic income (GDI) averaged 4.0% per annum over the decade to 2009-10, compared with 3.2% per annum over the previous decade:
• of the former figure, labour productivity growth contributed 1.4 percentage points, down from 2.1 percentage points in the 1990s;
• declining average labour force participation subtracted 0.1 percentage points from real GDI growth in both decades;
• population growth contributed 1.8 percentage points to the average annual rate of real GDI in the 2000s, 0.4 percentage points more than during the 1990s; and
• terms of trade gains boosted real GDI growth by an average of 0.9 percentage points per annum during the 1990s, in contrast to the 0.1 percentage point detraction from real GDI growth on average during the 1990s which resulted from a deterioration in Australia’s terms of trade.
There is a very strong echo here of Australia’s experience during the 1950s, 1960s and early 1970s.
19
Figure 10: Sources of growth in Australian real gross domestic income, 1990-2010
Then, as during the past decade, the consequences of a rather ordinary (by international standards) productivity performance were obscured by the combination of rapid population growth (the result, in turn, of the post-war ‘baby boom’ common throughout the world, and Australia’s own post-war immigration program) and the benefits to Australia (both through terms of trade gains and increases in production capacity) arising from the urbanization and industrialization of what during this period became our largest export market (namely, Japan). But when the post-war population boom came to an end (in the early 1970s), and shortly afterwards Japan more or less ‘caught up’ with US and Western European levels of per capita GDP and the commodity intensity of its economy subsequently began to decline, the consequences of Australia’s poor productivity performance for Australians’ living standards became more readily apparent, in the form of weaker average economic growth rates, and persistently high inflation and unemployment.
The same fate could await Australia in the decade ahead now that population growth has begun to slow, as demographic change erodes labour force participation rates and average hours worked and if, as both Treasury and Reserve Bank forecasts presume, Australia’s terms of trade have reached their peak.
Indeed, Parkinson (2011: 15) argues that “the rate of improvement in the living standards of Australians, at least that part measured by incomes, has already begun to deteriorate, even with the sustained and unprecedented rise in the terms of trade”.
Another important consequence of Australia’s persistently poor productivity performance is a greater propensity to inflation, even under outcomes for wages growth that would not, historically, have been regarded as ominous from that perspective. As shown in Figure 11 (on page 20), the combination of growth in average compensation per non-farm employee of more than 5½% over the year to the March quarter 2011 (a figure which is high by the standards of the past two decades but by no means unprecedently so) with a fall in labour productivity of 1¾% over the same period has resulted in unit labour cost growth of almost 8½%, the fastest since the late 1980s.

20
Figure 11: Employee compensation, labour productivity and unit labour costs
Given the role played by unit labour costs in most contemporary models of the inflationary process10
What (if anything) is to be done?
, this is a clear warning sign of upward risks to inflation emanating from this source despite the continued moderation (by historical standards) evident in other measures of wages growth.
Keynes (1919: 235) attributed to Lenin the assertion that “the best way to destroy the capitalist system was to debauch the currency”, although there is no evidence that Lenin actually did say this. Lenin did, however, ask “What is to be done?” in a pamphlet written to explain “the difference between the amateurish methods which satisfy the Economists and the organization of revolutionaries which we hold to be indispensable” (1902: 1).
Without in any way endorsing his methods, Lenin’s question seems an appropriate one with which to conclude this discussion of Australia’s productivity performance over the past decade. What is to be done about Australia’s deteriorating productivity performance?
It’s by no means inconceivable that the answer to this question could be ‘nothing’. Indeed, historical precedent strongly suggests that Australians, and their political representatives, will feel no great compulsion to embrace a program of productivity-enhancing economic reforms for as long as the mining boom – and the various channels through which the income generated by that boom is recycled and redistributed throughout the Australian economy – delivers continued growth in incomes and high levels of employment.
It is also possible that the difficulties now being encountered by sectors of the economy which are adversely affected by some of the side-effects of the mining boom, in particular the rising exchange rate (something which did not occur to the same extent, if at all, during previous commodities
10 See, for example, Norman and Richards (2010).
21
booms) will prompt businesses in those sectors, of their own volition, to place a much higher priority on productivity-enhancing organizational and other changes at the enterprise or workplace levels, as a matter of survival, without any need for public policy changes.
But if Australian policy-makers were to decide to seek public policy solutions to the problems posed now or for the future by Australia’s deteriorating productivity performance, what might those look like?
At the outset, it is important to keep in mind that productivity improvements occur as the result of decisions taken by and implemented in enterprises and workplaces, not as the direct result of public policy initiatives.
Public policy initiatives can contribute to improving Australia’s productivity performance to the extent that they increase the incentives facing the owners or managers of enterprises (including government agencies themselves) to make productivity-enhancing changes (to the goods and services they produce, or the way in which they are produced); that they increase the ability of owners or managers of enterprises to implement productivity-enhancing changes once they have decided to make them (or, alternatively, reducing the barriers and obstacles to implementing productivity-enhancing change); or that they facilitate the movement of factors of production from existing uses to ones in which they can be combined in ways that result in higher levels of productivity overall.
As Parkinson has commented, “we do ourselves, and the nation, a disservice if we target reform efforts only on the same areas as we have in the past” (2001: 24). Many of those past reforms were, intrinsically, once-off in their nature: tariffs, once reduced to minimal levels, can’t be cut again; government monopolies, once privatized, can’t be privatized again (unless they’ve been re-nationalized in the meantime); markets, once de-regulated, can’t be de-regulated again (unless the de-regulation has been only partial, and there’s a good case for going further).
Regulatory reform
However, there are many areas of the Australian economy that have, largely for political reasons, remained largely insulated from competitive pressures of the sort that, in other sectors, have acted as strong incentives for the pursuit of productivity-enhancing structural and organizational change – including international aviation, agricultural marketing (other than grains), pharmacies, newsagents, private sector service professions (such as law, medicine, and architecture), and services sectors dominated by public sector agencies (such as health and aged care, education, public transport and law enforcement).
Some of these are, admittedly, relatively small as a share of output or employment; others (in particular the service delivery sectors just mentioned) are both large themselves, and important ‘enablers’ for other sectors of the economy. One of the key obstacles to the pursuit of productivity-enhancing reforms in these areas is the widespread (and bi-partisan) belief that there is a linear correlation between the number of people employed in delivering these services and the quality of them, notwithstanding the absence of any empirical evidence in support of that belief (for example, between staff-student ratios in schools and student outcomes, or between police numbers and crime rates).
Banks (2010: 15) has suggested that “the productivity enhancing reforms that deserve some priority now are those that can reduce business costs and enhance the economy’s supply-side responsiveness, while being fiscally parsimonious”, specifically:
• reducing any government assistance to industry ‘not justified by genuine market failures’;
22
• government procurement, including defence procurement favouring high-cost local production without any obvious social benefit;
• infrastructure projects that do not demonstrably yield a social benefit;
• human services programs where benchmark data suggest scope for more cost-effective delivery; (in particular health services) and
• regulatory constraints on adaptability and flexibility at the enterprise level, particularly those impacting on the markets for labour and capital, and key infrastructural inputs such as transport, energy, telecommunications and water.
Banks lays particular emphasis on industrial relations and the labour market, pointing out that
“[w]hether productivity growth comes from working harder or working smarter, people in workplaces are central to it. The incentives they face and how well their skills are deployed and redeployed in the multitude of enterprises that make up our economy underpins its aggregate performance. It is therefore vital to ensure that regulations intended to promote fairness in Australia’s workplaces do not detract unduly from their productivity … If we are to secure Australia’s productivity potential into the future, the regulation of labour markets cannot remain a no-go area for evidence-based policy making” (2010: 16).
The Productivity Commission’s recent draft report on retailing noted that closing the productivity gap between Australia and countries such as the US “will require greater workplace flexibility so that employers and employees can work cooperatively and creatively together, to deliver the required productivity improvements” (2011: 287), suggested that “some aspects of the ‘Fair Work’ system may be inhibiting the adoption of flexibility enhancing provisions” in retailing workplace arrangements (307), and observed that the ‘workplace flexibility provisions’ in the ‘Fair Work’ system appear to have been used to place “greater emphasis on strategies for developing family-friendly workplaces, rather than productivity” (319).
Of course the scope for regulatory reform extends well beyond the workplace relations framework. The OECD’s recent review of Australian regulatory practices describes Australia as ‘one of the front-running countries in the OECD in terms of its regulatory reform practices’ and observes that ‘in general the Australian States demonstrate regulatory management practices that are among OECD best practice’ (OECD, 2010a: 16-17).
Nonetheless, the Business Council of Australia (BCA) argues that ‘significant reforms … are needed in all jurisdictions to improve their regulatory processes’ (2010: 9), and the OECD itself notes in a separate publication the need for further reforms in infra-structure regulation, and also that Australia’s barriers to foreign direct investment are the 7th highest in the OECD (2010c: 99 and 47). Policymakers and regulators have continued to respond to new social or economic issues with ‘knee-jerk regulatory solutions’, as the Regulation Taskforce reported to the Howard Government (2006: 148). Hence, as the BCA urges, ‘there needs to be a comprehensive model that incorporates both prospective and retrospective reforms to prevent bad regulation from being made in the first place (2010: 4).
There are also still examples where outright deregulation ought to be more actively considered. For example, Abelson (2010) demonstrates that the removal of restrictions governing entry into the Sydney taxi industry (for which there are ‘few efficiency or social reasons’) could produce benefits ‘in the order of $250 million per annum’, with even greater productivity and service benefits if accompanied by reform of the ‘anti-competitive control of the taxi radio networks over all taxi operators’.
23
Similarly, the Productivity Commission (2011: 269-284) has recently highlighted the potential benefits of the removal of remaining restrictions on retail trading hours.
Taxation reform
Tax reform could play an important role in improving Australia’s productivity performance. Australia’s personal and business income tax systems (and State land and payroll tax systems) are littered with exemptions and concessions which confer favourable treatment on particular groups of taxpayers, particular forms of business organization, or particular types of economic activity at the expense of others, leading to household and business investment decisions often being excessively influenced by tax considerations rather than their intrinsic merit (which must be to the detriment of productivity, among other things).
The Henry Review of Australia’s tax system urged that “Australia should configure its tax and transfer architecture to promote stronger economic growth through participation and productivity” (Henry 2009: xviii). Unfortunately, many of the Review’s recommendations to that end were promptly ruled out – by both sides of politics – for transparently political reasons.
Skills and infrastructure
To the extent that Australia’s poor productivity performance over the past decade reflects past under-investment, or poorly targeted investment, in skills formation and in infrastructure, some combination of more and better targeted investment in these areas will contribute to improved productivity performance, albeit with lags that are inevitably protracted. These two areas have been key elements of the current Australian Government’s ‘broad ranging and extensive productivity agenda’ (Australian Treasury 2011: 4-31-32).
Yet despite the continuing upward trend in the proportion of the Australian working-age population with formal educational qualifications, it is not at all clear that the quality of Australian ‘human capital’ has increased significantly.
The OECD concluded, earlier in the decade, that “skill upgrading has played, at best, a modest role in GDP growth per employed person” in Australia (and also in the US, Canada, the Netherlands and New Zealand) (2003: 37). An ABS survey undertaken as part of an OECD study of adult literacy and life skills found that 46% of Australians aged 15-74 lacked the minimum prose and document literacy skills, 50% lacked the minimum numeracy skills, and fully 70% lacked the ‘problem-solving’ skills ‘required for individuals to meet the complex demands of everyday life and work in the emerging knowledge-based economy’ (ABS 2008: 5).
It has been recognized for some time that younger Australians from lower socio-economic backgrounds tend to lag at least one year behind the Australian average, and more than two years behind students in the highest socio-economic quartile (OECD 2010c: 139). The results from the latest OECD Program for International Student Assessment (PISA) suggest that the performance of Australian 15-year old students has declined significantly over the past decade, despite a 33% real increase in public expenditure, and a 54% real increase in private expenditure, on education during this period (Jensen 2010).
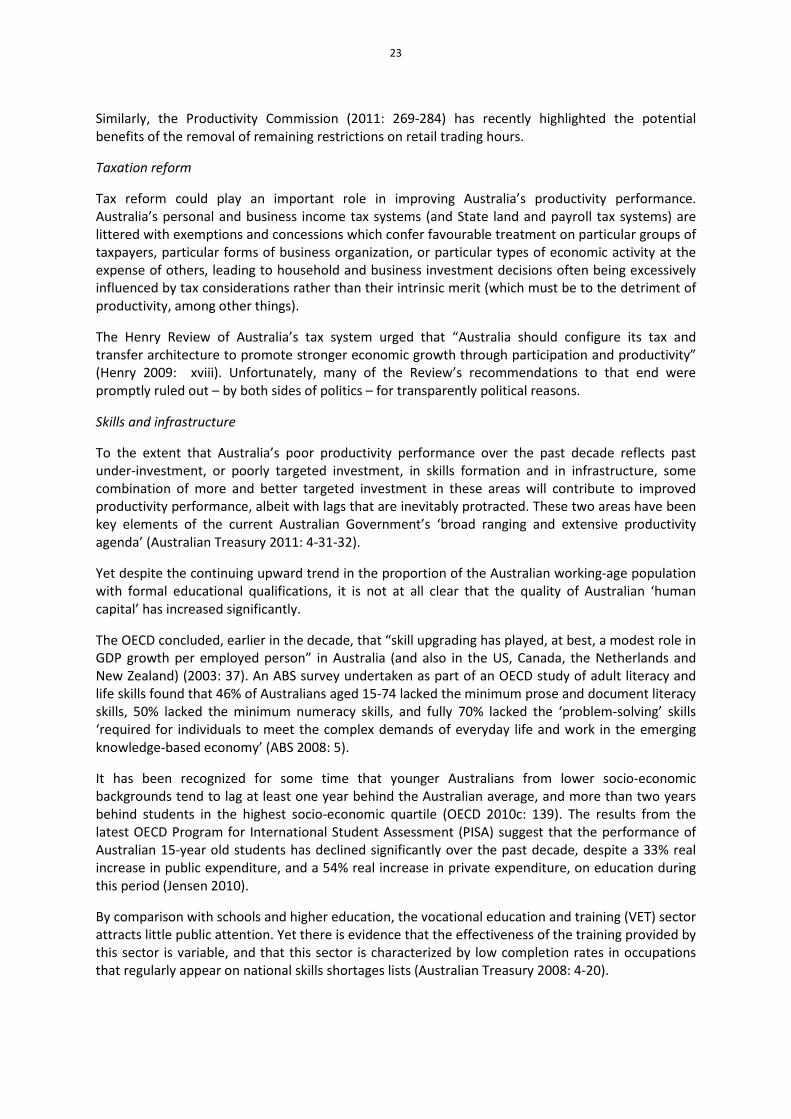
By comparison with schools and higher education, the vocational education and training (VET) sector attracts little public attention. Yet there is evidence that the effectiveness of the training provided by this sector is variable, and that this sector is characterized by low completion rates in occupations that regularly appear on national skills shortages lists (Australian Treasury 2008: 4-20).

24
It is widely accepted that Australia’s infrastructure, particularly in transport, is inadequate for many of the requirements of Australia’s growing economic, personal and social needs, and that this is in part due to ‘under-investment’ in infrastructure in the 1980s and 1990s. However, as the OECD notes, it also reflects “weak co-ordination between public infrastructure and development and fiscal management” and a “lack of co-ordination between the various levels of government, and between jurisdictions at the same level”, so that “infrastructure decisions are frequently taken with no regard for national priorities” (OECD 2011c: 91-95).
The solution to these weaknesses is not simply ‘more spending on infrastructure’, especially if that spending is as unco-ordinated and with as little regard for national priorities as in the past. It is of no less importance to the objectives of higher levels of productivity or faster productivity growth that better use is made of existing infrastructure, including through rational pricing regimes, and through avoiding ill-conceived regulation that detracts from the efficiency with which existing infrastructure is used (for example, by arbitrary and ‘knee-jerk’ reductions in speed limits on roads, or ‘security’ procedures entailing excessive or unnecessary delays in the movement of goods and passengers through airports).
Innovation
It is widely accepted, and not just by economists, that Innovation can increase productivity through the creation of higher value products, more efficient production processes, more effective workplace organisation and opening up new markets” (DIISR 2011: 8). The fact that, as noted earlier, Australia’s innovation effort falls well short of OECD ‘best practice’ on many dimensions, thus suggests the potential for improvements in Australia’s innovation effort to contribute to higher levels of productivity and faster rates of productivity growth.
In this area, no less than in any others, it is important to emphasize that productivity growth happens as a result of decisions being taken and implemented by the owners and managers of individual enterprises (and government agencies), and that the role of public policy is to improve the incentives facing those owners and managers to undertake productivity-enhancing innovations, and to remove obstacles to the undertaking of such innovations where they have been inadvertently created by past public policy interventions.
This is not simply a matter of more generous tax concessions for business R&D expenditures, or higher levels of public expenditure on R&D. As Dodgson et al argue, “modern innovation policy has to recognize, explicitly, that market mechanisms can be used effectively … as devices that permit flexibility, selection and change in a complex evolutionary economic system” (2009: 33).
Among the issues that could be usefully considered in this domain are the extent to which Australia’s competition laws inhibit the kind of collaboration among firms in the same industry which overseas experience suggests is an integral part of the innovation process in many industries; the extent to which the treatment of options by the Australian taxation system inhibits the ability of ‘start-up’ companies to attract and retain talented staff, or to attract institutional investment; and the extent to which what appears to be a highly legalistic approach on the part of many Australian universities to intellectual property rights inhibits the transfer of knowledge between those undertaking ‘pure’ or ‘basic’ research in higher education institutions to innovative entrepreneurs.
Conclusion
Although Australia’s economic performance during the 2000s has been impressive on many dimensions, especially by comparison with that of other ‘advanced’ economies, productivity is not among them. Australia’s productivity performance over the past decade has been, to put it mildly, poor − both by Australia’s own historical standards, and by contemporary international standards.

25
The consequences of this poor productivity performance have not, as yet, become widely apparent, because they have been masked by a combination of faster population growth (until recently) and the most sustained upswing in Australia’s terms of trade in over a century.
Together with a weakening of an earlier, widely shared consensus around the need for on-going economic reform that is perhaps the inevitable result of what has now been the longest period of more-or-less uninterrupted economic growth in more than a century, accompanied by falling unemployment, rising real incomes (which have in turn been fairly widely distributed), and rising personal wealth (for most of the past two decades), the sense that sustaining high rates of productivity growth is an important objective both for Australia as a whole and for individual businesses has declined substantially.
It may well be that an end to this period of comparatively easy prosperity – at least for sectors of the Australian economy that are adversely affected by some of the side-effects of the mining boom, or by the more frugal behaviour of Australian households, and possibly for the broader Australian economy if the global economy enters a renewed downturn with limited means on the part of economic policy-makers in the major advanced economies to ameliorate using the tools that have become customary over the past seventy years – will prompt a renewed focus, both among policy-makers and business leaders, on the objective of raising both the level of productivity and the rate of productivity growth.
If not, then it is unlikely that retrospective evaluations of the performance of the Australian economy over the 2010s, or the 2020s, will be as flattering as those of the past two decades.

26
References
Abelson, Peter (2010), ‘The High Cost of Taxi Regulation, with Special Reference to Sydney’, Agenda, Vol. 17, No. 2, ANU College of Business & Economics, Canberra, pp. 41-72
Australian Bureau of Statistics (2008a), Australian System of National Accounts 2007-08 (catalogue no. 5204.0), Canberra, December.
(2008b), Adult Literacy and Life Skills Survey, Summary Results 2006 (catalogue no. 4228.0), Canberra, January.
(2010a), Australian System of National Accounts 2009-10 (catalogue no. 5204.0), Canberra, December.
(2010b), Experimental Estimates of Industry Multi-factor Productivity (catalogue no. 5260. 0.55.002), Canberra, December.
(2011a), Labour Force, Australia, Detailed, Quarterly (catalogue no. 6291.0.55.003), Canberra, May.
(2011b), Australian National Accounts: National Income, Expenditure and Product (catalogue no. 5206.0), March Quarter 2011, Canberra, June.
Australian Treasury (2008), Statement No. 4: ‘Boosting Australia’s Productive Capacity: the Role of Infrastructure and Skills’, 2011-12 Australian Government Budget – Budget Paper No. 1, Canberra , May.
(2009), ‘Raising the Level of Productivity Growth in the Australian Economy’, Submission to the House of Representatives Standing Committee on Economics, published in Round-Up, August, 47-66.
(2011), ‘Statement 4: Opportunities and Challenges of an Economy in Transition’, 2011-12 Australian Government Budget – Budget Paper No. 1, Canberra, May.
Banks, Gary (2010), ‘Successful Reform: Past Lessons, Future Challenges’, Address to the Annual Forecasting Conference of Australian Business Economists, Sydney, 8 December; available at http://www.pc.gov.au/speeches/successful-reform.
Bean, Charles (2000), ‘The Australian Economic ‘Miracle’: A View from the North’, in Gruen and Shrestha (2000), 74-114.
Business Council of Australia (2010), 2010 Scorecard of Red Tape Reform, Melbourne. Conference Board, The (2011), Total Economy Database, January; available at
http://www.conference-board.org/data/economydatabase/ Daley, John and Walsh, Marcus (2011), ‘Losing the productivity race’, Australian Financial Review, 7
July, 63. Department of Innovation, Industry, Science and Research (DIISR)(2011), Australian Innovation
System Report 2011, Canberra, July. Dodgson, Mark, Foster, John, Hughes, Alan and Metcalfe JS (2009), Systems Thinking, Market Failure,
and the Development of Innovation Policy: The Case of Australia, University of Cambridge Centre for Business Research, Working Paper No. 397, December.
Eslake, Saul (2006), ‘Demystifying Industrial Relations Reform’, Melbourne Review (Vol. 2, No. 1), 19-27.
Eslake, Saul and Walsh, Marcus (2011), Australia’s Productivity Challenge, The Grattan Institute, Melbourne, February.
EU-KLEMS (2009), Growth and Productivity Accounts, November, Groningen Growth and Development Centre; available at http://www.euklems.net/.
Forsyth, Peter (2000), ‘Microeconomic Policies and Structural Change’, in Gruen and Shrestha (2000), 235-267.
Garnaut, Ross (2005), ‘Breaking the Australian Great Complacency of the Early Twenty First Century’, Paper presented at the 2005 Economic and Social Outlook Conference, Melbourne Institute and The Australian, 31 March; available at http://www.rossgarnaut.com.au/AustralianEconomy.html

27
Gruen, David and Shrestha, Shona (2000), The Australian Economy in the 1990s, Reserve Bank of Australia, Sydney.
Henry, Ken (chair) (2009), Australia’s Future Tax System – Report to the Treasurer, Commonwealth of Australia, Canberra, December.
Jensen, Ben (2010), ‘Future Compromised by Failures in Education System’, The Australian, 10 December, 12.
Kelly, Paul (1992), The End of Certainty, Allen & Unwin, Sydney. Keynes, John Maynard (1919), The Economic Consequences of the Peace, Macmillan, London. Krugman, Paul (1992), The Age of Diminished Expectations: US Economic Policy in the 1980s, MIT
Press, Cambridge. Lenin, Vladimir Ilyich (1902), ‘What is to be Done: Burning Questions of our Moment’, in Collected
Works, Volume 5, Foreign Languages Publishing House, Moscow, 1961, pp. 347-530. Mudd, Gavin (2009), The Sustainability of Mining in Australia: Key Production Trends and their
Environmental Implications for the Future, Research Report No RR5, Monash University Department of Civil Engineering and Mineral Policy Institute, Melbourne, April.
Mueller, John and Stewart, Mark (2011), ‘Terror, Security and Risks: Balancing the Risks, Benefits and Costs of Homeland Security’, paper presented at the MidWest Political Science Association Annual Convention, Chicago, 1 April.
Norman, David and Richards, Anthony (2010), Modelling Inflation in Australia, Research Discussion Paper No. 2010-03, Reserve Bank of Australia, Sydney, June.
OECD (2003), The Sources of Economic Growth, OECD, Paris. (2010a), Towards a Seamless National Economy, OECD Reviews of Regulatory Reform:
Australia 2010, OECD, Paris (2010b), Measuring Innovation: A New Perspective, OECD, Paris. (2010c), Economic Surveys – Australia, Volume 2010/21, OECD, Paris, November. (2011), Statistics Portal – Productivity, available at
http://www.oecd.org/topicstatsportal/0,3398,en_2825_30453906_1_1_1_1_1,00.html. Parkinson, Martin (2011), ‘Sustaining Growth in Living Standards in the Asian Century’, Address to
the Seventh Economic and Social Outlook Conference, Melbourne, 30 June. Productivity Commission (2010), Annual Report 2009-10, Canberra. (2011), Economic Structure and Performance of the Australian Retail Industry, Draft Report,
Canberra, July. Regulation Taskforce (2006), Rethinking Regulation: Report of the Taskforce on Reducing Regulatory
Burdens on Business, Report to the Prime Minister and Treasurer, Canberra, January Quiggin, John, ‘Discussion’ of Forsyth (2000), in Gruen and Shrestha (2000), 268-271. Rudd, Hon. Kevin MP (2007), Address to ALP National Conference, 26 April. Salgado, Ranil (2000), ‘Australia: Productivity Growth and Structural Reform’, in IMF, Australia –
Selected Issues and Statistical Appendix, Country Staff Report 00/24, Washington DC. Sellar, Walter and Yeatman, Robert (1930), 1066 and All That, Methuen, London. Smith, Adam (1776), An Inquiry into the Nature and Causes of the Wealth of Nations, Methuen & Co,
London. Stevens, Glen (2009), ‘Challenges For Economic Policy’, Address to the Anika Foundation, 27 July. (2011), ‘The Cautious Consumer’, Address to the Anika Foundation, 26 July. Telstra (2010), The Telstra Productivity Indicator 2010, Melbourne, February; available at
http://www.telstraenterprise.com/SiteCollectionDocuments/Whitepapers/Productivity2010.pdf?inref=TPIR.


![[Shinobi] Claymore 098](https://static.fdocuments.in/doc/165x107/568c34651a28ab02359048db/shinobi-claymore-098.jpg)