09.10.2011 Infrastructure building the mining supply chain, Jim Dwyer
Upload
the-business-council-of-mongoliaCategory
view
226download
0
CENTRAL BANK POLICY
Enkhjargal Danzanbaljir
Mongolia Investment Summit-2011
London

OUTLINE
I. State Monetary Policy Guideline for 2012
II. Economic core indicators
III. Policy measures of the Bank of Mongolia: 2011
IV. Inflation projection
V. BOP, exchange rate indicators
VI. Banking sector indicators

Objective of the Central Bank
According to the Central Bank law, …
… the main objective of the Bank of Mongolia is ensuring stability of Togrog.
… within this, main objective the Bank of Mongolia shall also promote balanced and sustained development of the national economy, through maintaining the stability the national economy, through maintaining the stability of money, financial markets and the banking system.
The Bank of Mongolia formulates monetary policy guidelines and submits it to the Parliament every year.

I. State Monetary Policy Guideline for 2012
Monetary policy will aim at maintaining macroeconomic andfinancial stability and enhancing sustained economic growth overthe medium and long term.
Under the monetary policy framework:
• Monetary policy will aim at maintaining CPI-inflation at a single-digit level for 2012 and below 8 % for 2013-2014.digit level for 2012 and below 8 % for 2013-2014.
• Will establish macro prudential policy framework for (Fiscalprudential policy):� Ensuring sustainable economic growth
� Strengthening financial stability and soundness
• To increase capacity framework to manage inflation expectations.
• To continue open transparent policy on its monetary policy and itsinstruments to the public.
.
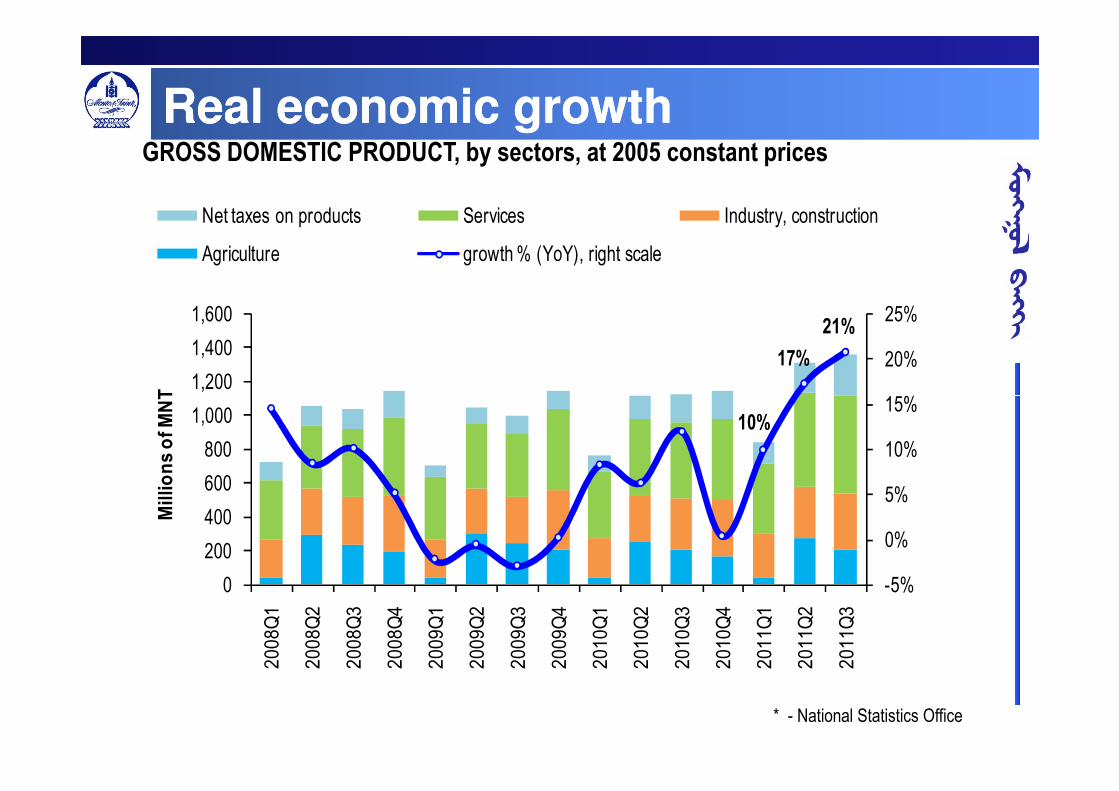
Real economic growthReal economic growthGROSS DOMESTIC PRODUCT, by sectors, at 2005 constant prices
17%
21%
15%
20%
25%
1,200
1,400
1,600
Millions of MNT
Net taxes on products Services Industry, construction
Agriculture growth % (YoY), right scale
* - National Statistics Office
10%
-5%
0%
5%
10%
15%
0
200
400
600
800
1,000
2008Q1
2008Q2
2008Q3
2008Q4
2009Q1
2009Q2
2009Q3
2009Q4
2010Q1
2010Q2
2010Q3
2010Q4
2011Q1
2011Q2
2011Q3
Millions of MNT

H1 H2 H1 H2 Q1 Q2 Q3 Q4 Q1 Q2 Q3
Total GDP 1782.4 2181.6 1759.4 2154.3 764.5 1119.0 1126.2 1153.2 840.3 1312.3 1360.5
growth % (YoY) 10.8% 7.4% -1.3% -1.3% 8.2% 6.3% 12.0% 0.4% 9.9% 17.3% 20.8%
Agriculture 338.5 429.9 351.0 445.4 35.9 257.4 204.7 166.1 38.0 272.8 204.7
growth % (YoY) 4.7% 4.6% 3.7% 3.6% -15.6% -16.5% -15.2% -18.5% 5.7% 6.0% 0.0%
2008 2009 2010 2011
Real economic growthReal economic growthGROSS DOMESTIC PRODUCT, by sectors, at 2005 constant prices
Industry, construction 493.8 621.6 482.5 628.3 240.8 275.7 305.7 336.2 263.3 305.5 338.4
growth % (YoY) 0.2% -1.6% -2.3% 1.1% 10.1% 4.5% 11.0% -4.7% 9.3% 10.8% 10.7%
Services 732.2 867.7 750.7 861.8 391.4 448.1 451.2 479.6 417.2 558.2 574.3
growth % (YoY) 17.4% 15.9% 2.5% -0.7% 4.7% 18.9% 19.4% -0.9% 6.6% 24.6% 27.3%
Net taxes on products 217.9 262.3 175.2 218.7 96.3 137.8 164.5 171.3 121.8 175.7 243.0
28.7% 9.2% -19.6% -16.6% 34.8% 32.9% 48.5% 58.6% 26.4% 27.5% 47.7%
* - National Statistics Office

II. Economic outlook: Core indicators
Indicators2007
X
2008
X
2009
X
2010
X
2011
X
2012
Forecast
Inflation (National)
(annual change)14.7 27.9 0.9 11.3 10.9% 18.4%
Meat price
(annual change)17.9 21.3 -16.5 27.5 30.3% na
Core inflation
(annual change)12.9 24.9 2.9 8.5 10.3% na
• At the beginning of 2011,
meat price increased
sharply due to foot and
mouth disease but in
March to May meat price
went down therefore,
inflation decreased.
• Core inflation continued to
increase from February
2011 until July 2011.
However, in August it had Broad money
(annual change)46.4% 4.1% 13.3% 45.0% 57.2% 30.4%
Reserve money
(annual change)17.7% 8.3% 53.4% 10.5% 83.8% 33.4%
Loan
(annual change)70.9% 39.5% -2.7% 18.0% 69.0% 32.6%
Loan nominal rate
(domestic currency) 21.3% 21.0% 21.9% 19.5% 15.9% na
Loan nominal rate
(foreign currency)13.8% 16.7% 15.8% 13.8% 13.3% na
GDP growth 12.8% 9.8% 0.1% 6.3% 12.2%* 18.4%
However, in August it had
decline due to high growth
in same period of the last
year. In September it went
up again.
• Inflation pressure would be
increased result from lower
lending rate and high
growth of money supply
and loan.
* GDP annual growth as calculating sum
of four quarters, as of the second quarter
of 2011

II. Economic outlook: Inflation ...2011:
• In first 2 months meat price
increased /foot and mouth
disease/, Since March meat
price went down /supply
increased/. But from July it
has been a slight increase.
• Core inflation continued to • Core inflation continued to
increase in last six months
due to cash distributions,
large capital inflows, money
supply growth, and price
increases in Government
regulated goods and fuel.

II. Inflation...
Due to excess demand, core inflation is increasing continuously...
Core inflation is calculated as excluding prices of meat, diary products, and vegetables.

HOUSING PRICE INDEX
7.5
6.7
4.0
6.0
8.0Quaterly Housing Price Index Changes in Ulaanbaatar
-2.1
-1.3
-0.6
0.2
-0.3 -0.2
1.4 1.6 1.6
-4.0
-2.0
0.0
2.0
2009.I 2009.II 2009.III 2009.IV 2010.I 2010.II 2010.III 2010.IV 2011.I 2011.II 2011.III

II. GDP, MONEY, LOAN GROWTH...

II. Credit growth
Individual loan is increasing more rapidly...

III. Policy measures of the Bank of Mongolia: 2011
2011:
� Large capital inflows,
� Rapid growth of loan,
� Cash distribution welfare policy,
� Fuel price increase
� Expectation of price increase in other goods,
� Price increase in Government regulated goods
The BoM took following measures against inflation pressure due to
above mentioned demand and supply factors:
• In February: Raised reserve requirement by 4 % points
• In April: Raised policy rate by 0.5% points.
• In August: Raised policy rate and reserve requirement by 0.25
and 2 % points to 11%
• In October: Raised policy rate by 0,5% points to 12,75%

IV. Monetary policy stance: Increased Reserve Requirement
rate…

IV. Monetary policy stance: Growth of money supply is
weakened due to increased RR…

IV. Monetary policy stance: Increased policy rate…

IV. Monetary policy stance:
Ex-post real interest rate:
• Calculated as using CBB
rate for overall inflation.
• During last three quarters
of 2010 inflation was
higher than CBB rate so higher than CBB rate so
that ex-post real interest
rate was negative.
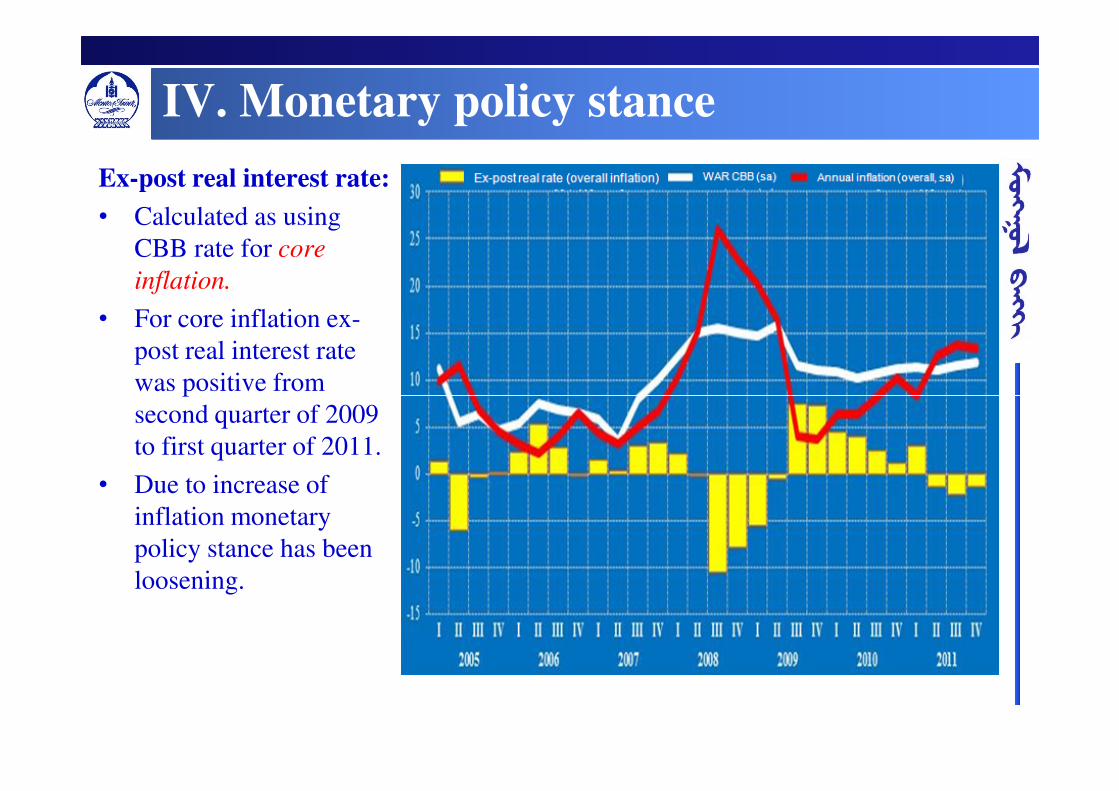
IV. Monetary policy stance
Ex-post real interest rate:
• Calculated as using
CBB rate for core
inflation.
• For core inflation ex-
post real interest rate
was positive from was positive from
second quarter of 2009
to first quarter of 2011.
• Due to increase of
inflation monetary
policy stance has been
loosening.

IV. Monetary policy stance...
Ex-ante real interest rate:
• Calculated as using CCB
rate for expected inflation.
• For expected inflation ex-
ante real interest rate has
been positive since second been positive since second
quarter of 2008.
• From 2010 monetary policy
stance has been tightening.

INTEREST RATE STRUCTURE
V. Inflation projection
Following demand factors result in increase of core inflation near future.
� Increase of budget expenditure and cash distribution,
� Capital inflows,
� Rapid growth of loan, particularly, individual loan growth shows � Rapid growth of loan, particularly, individual loan growth shows
economic overheating.

Following supply side factors can increase Inflation.
� Increase in fuel price in global market,
� Uncertainity of fuel price in domestic market,
� Increase in other goods price due to increased food and fuel price,
� Increase in food price in global market,
V. Inflation projection
� Increase in food price in global market,
� Inflation in neighbour countries,
� Meat price may increase in last six months of the year due to
seasonal effect, export, and herdsmen who have more cash.

V. Inflation forecast
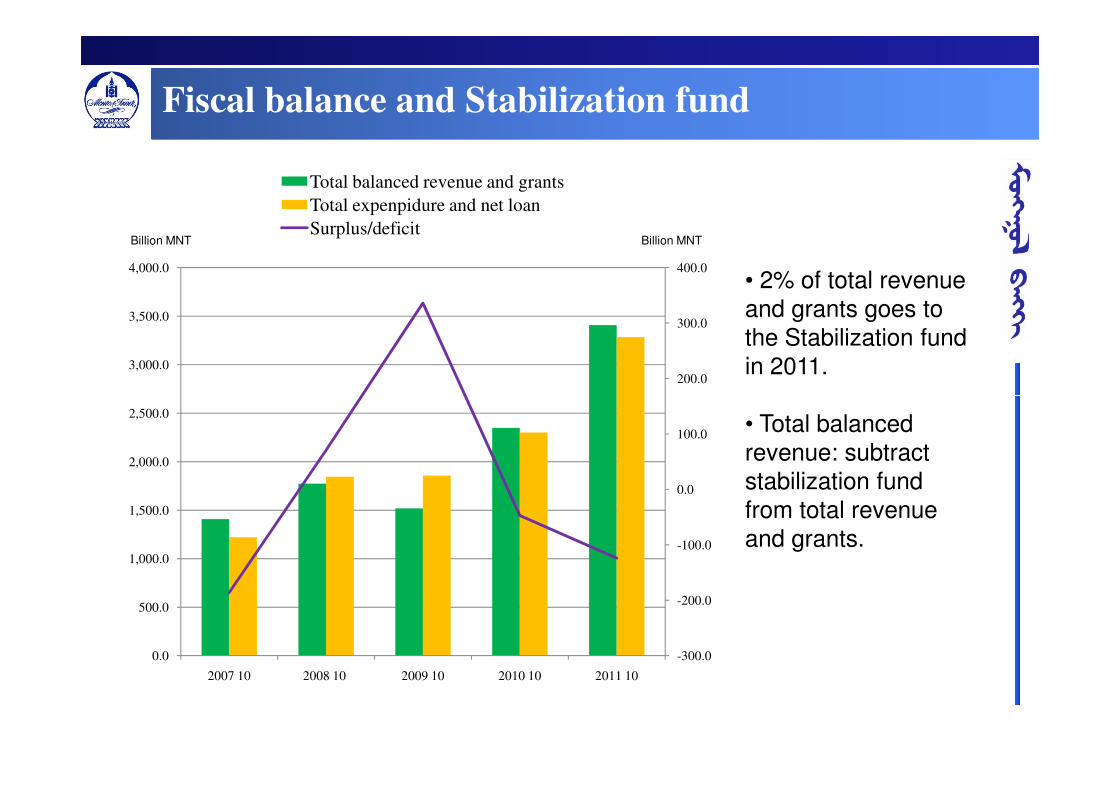
Fiscal balance and Stabilization fund
200.0
300.0
400.0
3,000.0
3,500.0
4,000.0
Total balanced revenue and grants
Total expenpidure and net loan
Surplus/deficitBillion MNT Billion MNT
• 2% of total revenue and grants goes to the Stabilization fund in 2011.
-300.0
-200.0
-100.0
0.0
100.0
0.0
500.0
1,000.0
1,500.0
2,000.0
2,500.0
2007 10 2008 10 2009 10 2010 10 2011 10
• Total balanced revenue: subtract stabilization fund from total revenue and grants.

VI. Banking sector’s indicators: Growth of liabilities...
Net capital flow and credit multiplier are compounding bank’s
liability growth.

Asset side....

Policy challenges
• Economic growth is more faster
• Potential GDP increase?
• Inflation pressure still remained high
• Financial market stability issue becomes more
importantimportant
• Increase in salary can make a pressure to private
sector
• Pro-cyclical policy should not be repeated

State Monetary Policy Guideline for 2012
The flexible exchange rate regime will be continued consistent withmacroeconomic fundamentals.
Policy continues on:
• No capital control• No capital control
• No exchange control
. The Central Bank of Mongolia signed the three-year currency swap,worth almost 1 trillion Mongolian togrog or 5,0 billion-yuan ($769million) with People’s Bank of China. This deal is aimed atpromoting bilateral trade, cross border trade settlements andoffering short-term liquidity to the two countries' financialinstitutions to reduce its reliance on the U.S. dollar in the wake ofthe global financial crisis.
Policy action in the FX market
Policy continues on:
• The flexible exchange rate regime consistent withmacroeconomic fundamentals.
• No capital control
• No exchange control
Signed the 3 year currency swap, worth ₮1 trillion= CNYSigned the 3 year currency swap, worth ₮1 trillion= CNY5,0 billion ($769 million) with People’s Bank of China.This deal is aimed at promoting bilateral trade, crossborder trade settlements and offering short-termliquidity to the two countries' financial institutions toreduce its reliance on the U.S. dollar in the wake of theglobal financial crisis.

Terms of trade (TOT): stable and highTerms of trade (TOT): stable and high
1.5
2.0
2.5
4.0
5.0
6.0
7.0
8.0
Terms of trade (R.scale) Export price index Import price index
Source: Bank of Mongolia
0.0
0.5
1.0
0.0
1.0
2.0
3.0
4.0
20
00
m1
20
00
m7
20
01
m1
20
01
m7
20
02
m1
20
02
m7
20
03
m1
20
03
m7
20
04
m1
20
04
m7
20
05
m1
20
05
m7
20
06
m1
20
06
m7
20
07
m1
20
07
m7
20
08
m1
20
08
m7
20
09
m1
20
09
m7
20
10
m1
20
10
m7
20
11
m1
20
11
m7

200
300
400
500
Net foreign exchange inflowsNet foreign exchange inflows
$US 0.3 bln. $US 1.6 bln.$US 416
mln.
-200
-100
0
100
2009-01
2009-02
2009-03
2009-04
2009-05
2009-06
2009-07
2009-08
2009-09
2009-10
2009-11
2009-12
2010-01
2010-02
2010-03
2010-04
2010-05
2010-06
2010-07
2010-08
2010-09
2010-10
2010-11
2010-12
2011-01
2011-02
2011-03
2011-04
2011-05
2011-06
2011-07
2011-08
2011-09
2011-10
2011-11
Source: Bank of Mongolia

FX inflow compositionFX inflow composition
Export
Loan9%
Currency and deposit10% Others
2%
(Jan - Sep 2010)
Export34%
Currency and deposit24%
Others2%
(Jan - Sep 2011)
Source: Bank of Mongolia
Export47%
Services4%
Income1%
Current transfer8%
FDI19%
Services4%
Income0%
Current transfer4%
FDI26%
Loan6%

Balance of PaymentsBalance of Payments
0
500
1000
1500Million USD
Current account
Capital and Financial account
Overall BOP
Source: Bank of Mongolia
-1000
-500
I улирал
II улирал
III улирал
IV улирал
I улирал
II улирал
III улирал
IV улирал
I улирал
II улирал
III улирал
IV улирал
I улирал
II улирал
III улирал
IV улирал
I улирал
II улирал
III улирал
IV улирал
I улирал
II улирал
III улирал
IV улирал
I улирал
II улирал
III улирал
IV улирал
I улирал
II улирал
III улирал
2004 2005 2006 2007 2008 2009 2010 2011
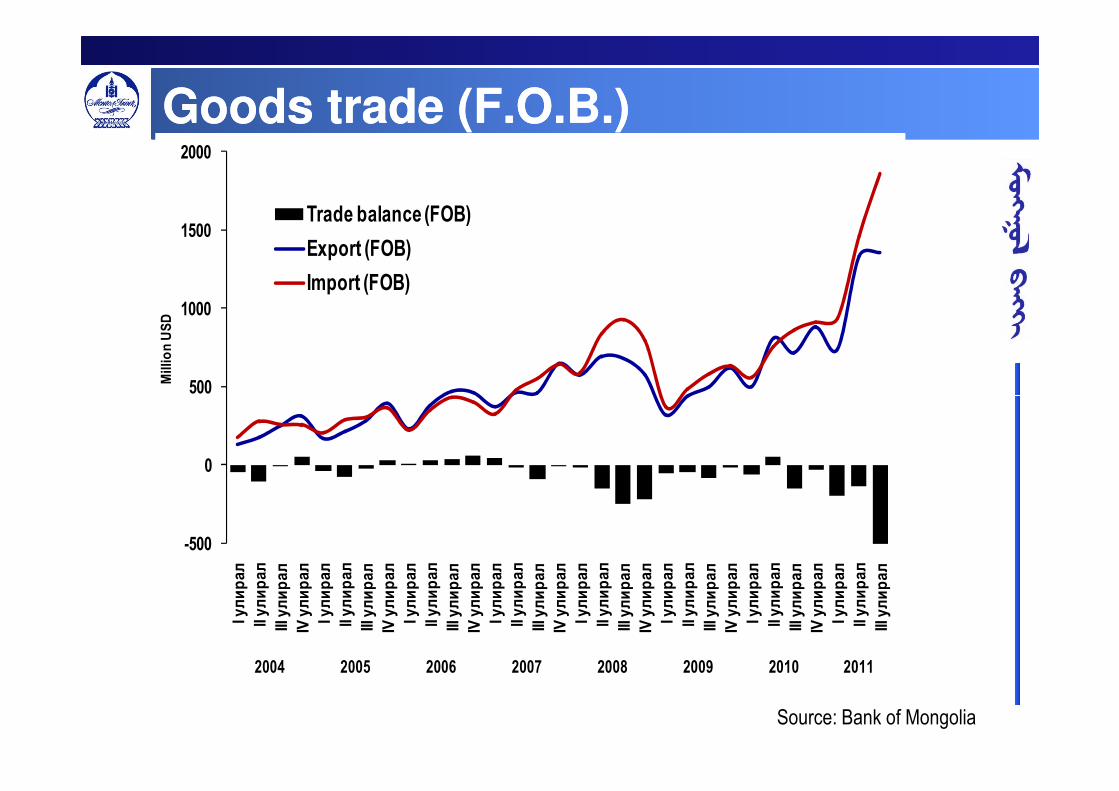
Goods trade (F.O.B.)Goods trade (F.O.B.)
500
1000
1500
2000Million USD
Trade balance (FOB)
Export (FOB)
Import (FOB)
Source: Bank of Mongolia
-500
0
500
I улирал
II улирал
III улирал
IV улирал
I улирал
II улирал
III улирал
IV улирал
I улирал
II улирал
III улирал
IV улирал
I улирал
II улирал
III улирал
IV улирал
I улирал
II улирал
III улирал
IV улирал
I улирал
II улирал
III улирал
IV улирал
I улирал
II улирал
III улирал
IV улирал
I улирал
II улирал
III улирал
2004 2005 2006 2007 2008 2009 2010 2011
2000
2500
3000
3500
4000million USD
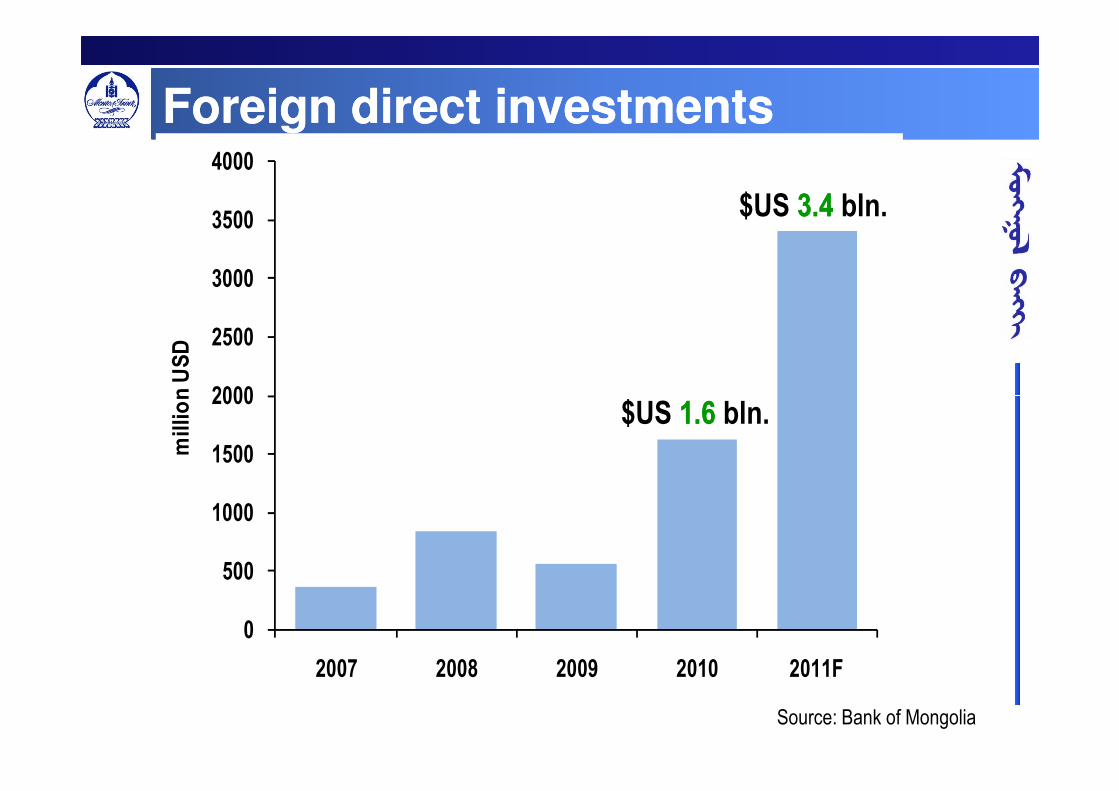
Foreign direct investments Foreign direct investments
$US 1.61.6 bln.
$US 3.43.4 bln.
0
500
1000
1500
2000
2007 2008 2009 2010 2011F
million USD
Source: Bank of Mongolia
$US 1.61.6 bln.

1,700
2,200
2,700
3,200m
illi
on
usd
Gross international reserves, $US Gross international reserves, $US mlnmln..
End-2006:
718End-2007:
1001End-2008:
657End-2009:
13271327End-2010:
22882288(39% ↑) (34% ↓) (102% ↑) (72% ↑)
Oct 2010:
26282628
200
700
1,200
20
06…
04
07
10
20
07…
04
07
10
20
08…
04
07
10
20
09…
04
07
10
20
10…
04
07
10
2011
…
04
07
10
mil
lio
n u
sd
Source: Bank of Mongolia

0.5%
1.0%
1.5%
2.0%
2.5%
3.0%
1,400
1,500
1,600
1,700 Reference rate
Daily volatility (R.Scale)
Reference rate: Stability Reference rate: Stability �������� since Aprsince Apr--0909
-2.5%
-2.0%
-1.5%
-1.0%
-0.5%
0.0%
1/1
/08
3/1
/08
5/1
/08
7/1
/08
9/1
/08
11/1
/08
1/1
/09
3/1
/09
5/1
/09
7/1
/09
9/1
/09
11/1
/09
1/1
/10
3/1
/10
5/1
/10
7/1
/10
9/1
/10
11/1
/10
1/1
/11
3/1
/11
5/1
/11
7/1
/11
9/1
/11
11/1
/11
1,100
1,200
1,300
1,400
Source: Bank of Mongolia
Crisis

BANKING SECTOR

MONGOLIAN FINANCIAL SECTOR CONSISTS OF:
14 domestic commercial banks;
177 non-banking financial institutions;
212 credit and savings unions;
48 security companies;
18 insurance companies;
353 listed companies.
NBFIs
2.1%
Credit &
savings
unions
1.0%
Insurance
0.9%
Security
0.5%
Foreign Banks:
ING (Rep. office)
Standard Chartered Bank ( Rep. office)
Development agencies:
Mongolian Development Bank
SME fund
Banks
95.6%
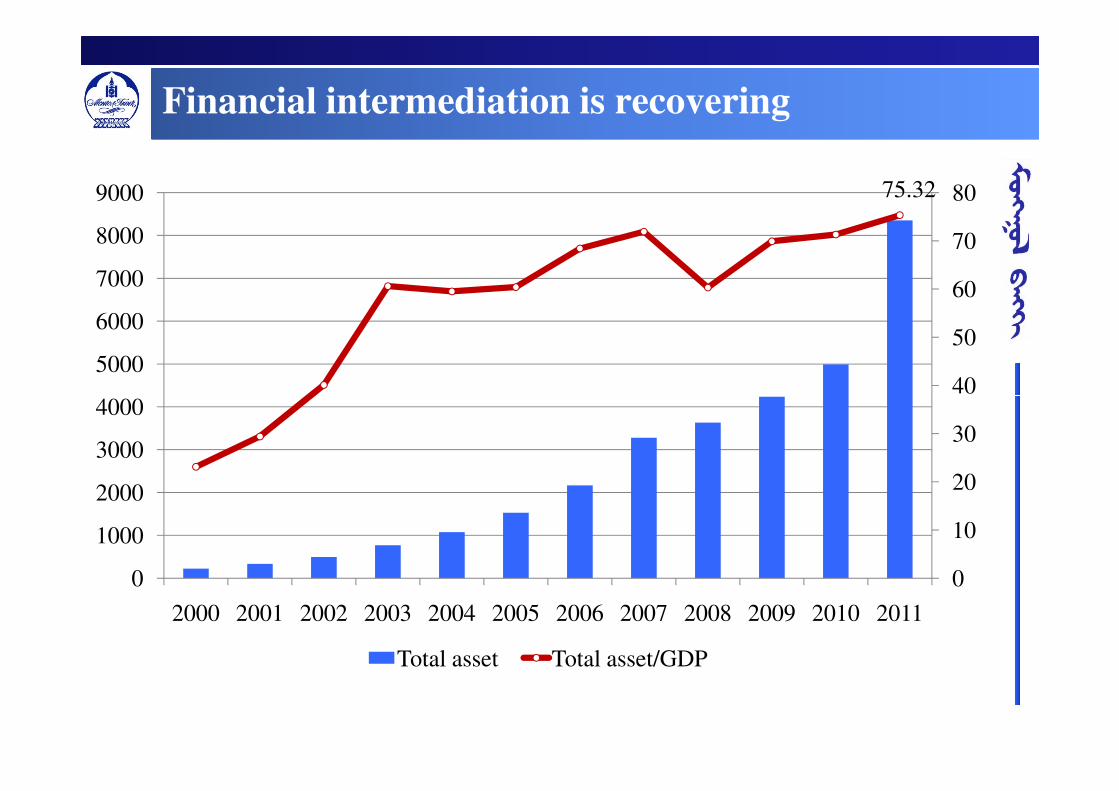
Financial intermediation is recovering
75.32
40
50
60
70
80
4000
5000
6000
7000
8000
9000
0
10
20
30
40
0
1000
2000
3000
4000
2000 2001 2002 2003 2004 2005 2006 2007 2008 2009 2010 2011
Total asset Total asset/GDP

Liquidity Indicators

LOAN OUTSTANDING BY SECTORS

Loan quality of banking sector

Domestic credit to GDP, by countries
293.0%
200.0%
250.0%
300.0%
350.0%
126.2% 126.1%112.6%
34.4%25.9%
0.0%
50.0%
100.0%
150.0%
200.0%
Japan China France Korea Mongolia Russia

Loan to Deposit Ratio

Deposits are stable
Billion.MNT
54.4
30
40
50
60
4000
5000
6000
7000
0
10
20
30
0
1000
2000
3000
2000 2001 2002 2003 2004 2005 2006 2007 2008 2009 2010 2011
Deposit Deposit/GDP

Capital Adequacy Ratio

Policy activity
• Liquidity ratio was reached by Bank of Mongolia from 18 percent to 25
percent
• The central bank of Mongolia are planning to implement countercyclical
Macroprudential policy tools .
• Increasing Tier 1 ratio

Money supply: Gradual expansionMoney supply: Gradual expansion
YoYYoY 57% 57% increasedincreased
10%
15%
20%
4,000
5,000
6,000
7,000
billion togrog
M2
M2, monthly changes (right scale)
Sep 2011
6,063.9 bill tog
Source: Bank of Mongolia
-10%
-5%
0%
5%
0
1,000
2,000
3,000
4,000
2004/01
05
09
2005/01
05
09
2006/01
05
09
2007/01
05
09
2008/01
05
09
2009/01
05
09
2010/01
05
09
2011/01
05
09
billion togrog

4,000
5,000
6,000
7,000
8,000
9,000
Banking sector total assetsBanking sector total assets
8.2 8.2 trillion togrog as of end Sep 2011:* 31% 31% increase since Jan 1, 2011* 47% 47% increase y-o-y
0
1,000
2,000
3,000
4,000
III VI IX XII III VI IX XII III VI IX XII III VI IX XII III VI IX XII III VI IX XII III VI IX XII III VI IX
2004 2005 2006 2007 2008 2009 2010 2011
Source: Bank of Mongolia

5%
6%
7%
8%
9%
2,500
3,000
3,500
4,000
4,500
5,000
In billions of MNT
Total loans outstanding (million MNT)
NPL/Loan ratio (R.Scale)
NPL / Loan ratio has rapidly been NPL / Loan ratio has rapidly been declining…declining…
0%
1%
2%
3%
4%
5%
0
500
1,000
1,500
2,000
2,500
2006 01040710
2007 01040710
2008 01040710
2009 01040710
2010 01040710
2011 010406
In billions of MNT
Source: Bank of Mongolia

LOAN OUTSTANDING BY SECTORS
3 large banks

LOAN TO DEPOSIT RATIO
110
120
130
140
150
4,000
5,000
6,000
per centbillion MNT
Loan Deposit LTD ratio
132%
50
60
70
80
90
100
-
1,000
2,000
3,000

LOAN TO DEPOSIT RATIO
0.50
1.00
1.50
2.00
2.50
3.00
3.50
4.00
0.20
0.40
0.60
0.80
1.00
1.20
0.61
Loan/Liability ratio
� Large banks – 0.61
� Medium banks – 0.63
� Small banks – 0.72
• Loan/Deposit ratio
• Large banks– 1.24
• Medium banks – 2.07
• Small banks – 2.00
--

Policy actions
• Minimum capital requirement increased from ₮8 bln to ₮16 bln.
• Deadline for existing banks to implement this requirement by May 2013.
• Capital adequacy ratio is 10%, with intention to increase to 14%
• Liquidity ratio was introduced at 18 %, with intention to increase to 25 %
• Supervisory measures will use countercyclical macro prudential policy
tools .

Policy support to banking sector
• Blanket deposit guarantee
• No tax on interest income earned by private people’s deposit
• No limit or restrictions on FX transactions
• Government comprehensive medium term • Government comprehensive medium term master plan to reduce loan interest rates and expenses:
Credit guarantee scheme
Credit information system ( private & public)
Transfer of Banking Training institute to MBA
Payment clearing centre privatization
I. State Monetary Policy Guideline for 2012
Under the framework of ensuring financial sector stability:
• The BOM will ensure the strengthening of financial capacity ofbanks and improving supervisory standards and regulationmethods in line with international best practices.
• The BOM will ensure disclosure and transparency of operations ofthe banking sector, enforce good governance principles at banks,the banking sector, enforce good governance principles at banks,maintain fair-competitiveness and tighten financial discipline in thesector.
• To prepare to introduce the limited deposit insurance scheme.
• To expand favorable conditions for investment banking andenhance supervision of the financial conglomerates.
• To establish legal frameworks for regulations and supervision offoreign bank branch and units.

I. State Monetary Policy Guideline for 2012
• To increase usage of non-cash payment instruments,such as debit- credit cards, mobile-internet banking, toensure uninterrupted and secure functioning of thepayment and settlement system.
• To implement recommendations and principles issuedby FATF for combating and preventing moneyby FATF for combating and preventing moneylaundering and financing of terrorism.

THANK YOU FOR YOUR
ATTENTIONATTENTION

Ms.Enke Enkhjargal Danzanbaljir
Chief Representative ( Director)
London Office, Bank of Mongolia
in UK Address:
3d Floor-D. 17 Lancaster Gate. London W2 3LH,
UK Tel/Fax +44 (0) 20-77063773
Mobile +44 (0) 7799641868Mobile +44 (0) 7799641868
in Mongolia Address:
Baga toiruu-9, Ulaanbaatar-46, Mongolia
Mobile +976-99115972
Fax +976(11)311471