090603 Biogas Manual bearb. END - European … Absorption Drying ..... 56 3.4.3 Condensation Drying...
92
REPORT Work package: WP09 Communication and Dissemination Start data of the action: 1 st of December 2006 End data of the action: 31 st of May 2009 Deliverable: D35 Brochure on “biogas utilization chains” Month of completion: 30 (May 2009) Responsible partner: Dipl.-Wi.-Ing. Ronny Erler DBI Gas- und Umwelttechnik GmbH - Fachgebiet Gasverwendung - +49-3731-4195 328; [email protected] Date: 20 th of May 2009 REDUBAR WP09 D35 EIE/06/221/SI2.442663
-
Upload
trankhuong -
Category
Documents
-
view
226 -
download
1
Transcript of 090603 Biogas Manual bearb. END - European … Absorption Drying ..... 56 3.4.3 Condensation Drying...

REPORT
Work package: WP09 Communication and Dissemination
Start data of the action: 1st of December 2006
End data of the action: 31st of May 2009
Deliverable: D35 Brochure on “biogas utilization chains”
Month of completion: 30 (May 2009)
Responsible partner: Dipl.-Wi.-Ing. Ronny Erler
DBI Gas- und Umwelttechnik GmbH - Fachgebiet Gasverwendung -
+49-3731-4195 328; [email protected]
Date: 20th of May 2009
REDUBAR WP09 D35
EIE/06/221/SI2.442663

2
Edition note
The Publisher:
DBI Gas- und Umwelttechnik GmbH
Theklaer Strasse 42
D-04347 Leipzig
Telephone no: (+49) 3731 - 4195 300
Fax: (+49) 3731 - 4195 309
E-mail: [email protected]
The Author:
Dipl.-Wi.-Ing. Ronny Erler
Design:
Dipl.-Geoökol. Sylvia Petzold
This manual does not claim to be either complete or exhaustive. Although the text and figures included have been compiled with the utmost care and neither moral nor legal responsibility, nor any other liability, can be assumed for any potential remaining incorrect details or for their consequences.
The documentation presented has been copyright protected.
Status as at 06/2008
© 2008 All rights reserved.

Table of Contents
3
Table of Contents
List of Figures.................................... ....................................................................... 5
List of Tables ..................................... ....................................................................... 7
List of common acronyms, abbreviations, symbols .... ......................................... 8
1 Introduction....................................... ......................................................... 10
2 Manufacturing and Composition of Raw Biogas ........ ............................ 11
2.1 Manufacturing Biogas by Fermentation ....................................................... 12 2.1.1 Wet Fermentation ................................................................................. 14 2.1.2 Dry Fermentation .................................................................................. 14
2.2 Standard Targets for Biogas Quality in Germany ........................................ 14
3 Biogas Processing Technology....................... ......................................... 16
3.1 Desulphurisation .......................................................................................... 16 3.1.1 Main Desulphurisation .......................................................................... 18
3.1.1.1 Sulphide Precipitation..................................................................... 18 3.1.1.2 Biological Desulphurisation ............................................................ 21
3.1.1.2.1 Desulphurisation in a Fermenter ................................................ 22 3.1.1.2.2 Trickle Bed Reactor System....................................................... 23 3.1.1.2.3 Bio-washer ................................................................................. 25 3.1.1.2.4 Bio-filter...................................................................................... 27
3.1.1.3 Desulphurisation with an Iron-Chelate............................................ 28 3.1.2 Fine Desulphurisation ........................................................................... 28
3.1.2.1 Activated Carbon............................................................................ 29 3.1.2.1.1 Activated Carbon Impregnated with Potassium Iodide ................. 30 3.1.2.1.2 Activated Carbon Impregnated with Potassium Carbonate........ 31 3.1.2.1.3 Activated Carbon Impregnated with Potassium Permanganate . 31 3.1.2.1.4 Zinc Oxide.................................................................................. 32 3.1.2.1.5 Hydrogen sulphide (H2S) Removal by means of an Iron Substrate ................................................................................................... 33
3.2 Carbon Dioxide Separation.......................................................................... 35 3.2.1 Pressure Swing Adsorption................................................................... 37 3.2.2 Absorptive C02 Separation Process...................................................... 41
3.2.2.1 Pressurised Water Wash................................................................ 42 3.2.2.2 Selexol Process.............................................................................. 45 3.2.2.3 Amine Wash................................................................................... 47 3.2.2.4 Membrane Separation Processes .................................................. 49 3.2.2.5 C02 Removal using a Cryogenic Process ...................................... 51
3.3 Gas Compression Compaction .................................................................... 52 3.4 Gas Drying dehydration ............................................................................... 54

Table of Contents
4
3.4.1 Adsorption Drying ................................................................................. 54 3.4.2 Absorption Drying ................................................................................. 56 3.4.3 Condensation Drying ............................................................................ 56
4 Biogas Supply Technology........................... ............................................ 57
4.1 Conditioning Systems plant, facility.............................................................. 57 4.2 Mixing Systems............................................................................................ 57 4.3 Gas Pressure Measurement and Regulation Systems ................................ 58 4.4 Gas Composition Measurement System...................................................... 59 4.5 Odour Control System ................................................................................. 59 4.6 Natural Gas Grid Connection....................................................................... 60
5 Procedural Routes for Biogas Processing and Biogas Supply............ 61
5.1 Processing a High Quality Exchange Gas from Biogas substitute............... 61 5.1.1 Pressure Swing Adsorption Processing ................................................ 62 5.1.2 Pressurised Water Wash Processing.................................................... 63 5.1.3 Pressure-less Amine-Water Wash Processing ..................................... 64
5.2 The Supply of the Processed Biogas as an Exchange Gas......................... 65 5.3 Processing an Additional Gas from Biogas.................................................. 67 5.4 Supply of Processed Biogas as an Additional Gas ...................................... 68
Appendix ........................................... ...................................................................... 70
Bibliographical Sources............................ ............................................................. 87

List of Figures
5
List of Figures
Figure 1: General procedure during biogas production [FNR 2008] ........... 11
Figure 2: Process scheme in a farm-based biogas plant [FNR 2008] ........ 12
Figure 3: Biogas yield and methane content of various substances (Source: Handreichung Biogas, FNR, 2006; Energiepflanzen, KTBL, 2006) [FNR 2008].................................................................................. 13
Figure 4: Sulphur conversion [RIES 1992] ................................................. 17
Figure 5: Trickle-bed reactor system.......................................................... 24
Figure 6: (a) Desulphurisation container (b) filler material of a trickle bed reactor system with sulphur deposits .......................................... 25
Figure 7: Bio-washer block diagram........................................................... 26
Figure 8: Schematic representation of an activated carbon filter [RÜDGERS 2003] ........................................................................................... 30
Figure 9: Illustration showing the difference between Adsorption and Absorption [CHEMVIRON 2007] ................................................. 36
Figure 10: Illustration showing the difference between Adsorption and Absorption [CHEMVIRON 2007] ................................................. 37
Figure 11: Simplified model of a carbon molecular sieve [RÜDGERS 2003] 37
Figure 12: Simplified model of a carbon molecular sieve [RÜDGERS 2003] 38
Figure 13: Processing principle of PSA [RÜDGERS 2003] .......................... 40
Figure 14: Flow diagram of the pressurized water wash process [TENTSCHER 2006a] ......................................................................................... 45
Figure 11: Flow diagram of the pressurized water wash process [TENTSCHER.................................................................................................... 46
Figure 16: Prinzipielles Verfahrensfließbild einer Aminwäsche [nach FIU 2005].................................................................................................... 48
Figure 17: Principle of separation by means of permeation [ENERGIE SYSTEM 2006] ........................................................................................... 49
Figure 18: Possible constructions for membrane separation process [FIU 2005].................................................................................................... 50
Figure 19: Relationship between methane yield and methane purity in a series of connected membranes............................................................ 50
Figure 20: Relationship between methane yield and methane purity in a series of connected membranes............................................................ 51
Figure 21: Membrane system [ENERGIESYSTEME 2006].......................... 52
Figure 22: Molecular sieve ........................................................................... 55
Figure 23: A detailed example of the layout of a gas pressure regulation system in combination with a gas meter [G 491] ..................................... 58
Figure 24: Example of the construction of an inoculation nozzle [G 280-1].. 60

List of Figures
6
Figure 25: Pressure swing adsorption flow diagram..................................... 62
Figure 26: Pressurised water wash process flow diagram ........................... 64
Figure 27: Pressure less amine water wash process flow diagram (E=heat exchanger, P=pump, F=separator/reactor) [MT-ENERGIE] ........ 65
Figure 28: Biogasaufbereitung und -einspeisung als Austauschgas ............ 66
Figure 29: Processing biogas to obtain additional gas ................................. 68
Figure 30: Processing biogas to obtain additional gas ................................. 69
Figure 31: Biogas processing and supply as an additional gas.................... 70

List of Tables
7
List of Tables
Table 1: Typical biogas composition ......................................................... 13
Table 2: Hydrogen Sulphide hazard classification..................................... 17
Table 3: Toxicological effects of hydrogen sulphide
[WASSERMANN 2007] ............................................................... 17
Table 4: Overview of CO2 removal processes.......................................... 35
Table 5: Solubility of biogas components in water [TENTSCHER 2006a]. 43
Table 6: Pressure regions in the natural gas grid
[CERBE 1999]............................................................................. 53

Abbreviations
8
List of common acronyms, abbreviations, symbols
Common Abbreviations
BHP Block Heat and Power Unit
Biomethane Natural gas quality processed biogas
REL Renewable Energy Laws
ND Nominal Diameter
DVGW German Technical and Scientific Association for Gas and Water
PWW Pressurized Water Wash
Natural gas H Natural gas High (WS,n=12.8 – 15.7 kWh/m³ according to DVGW G 260)
Natural gas L Natural gas Low (WS,n=10.5 – 13.0 kWh/m³ according to DVGW G 260)
GPRS Gas pressure regulation system
GGAR Gas Grid Access Regulation
GGRR Gas Grid Remuneration Regulation
Wt.-% Weight of one component as a fraction of the total substance weight
GMS Gas Measurement System
H-Gas Exchange gas with natural gas H-quality
HCAE Honorarium code for architects and engineers
CHP Combined Heat and Power Unit
L-Gas Exchange gas with natural gas L-quality
LPG Liquefied Petroleum Gas
m³ Normal cubic meter
M Million
GRM Grown raw material
pH-value Measure of the strength of the acidity or basicity of a liquid solution
ppb Parts per billion (ppb = 10-9)
ppm Parts per million (ppm = 10-6)

Abbreviations
9
PSA Pressure Swing Adsorption
NMI (PTB) National Metrology Institute (physical - technical) Federal Agency)
TA Luft Technical code of practice for the purification of air (technical instruction for the adoption of clean-air)
US$ U.S. Dollars
Vol-% Measure of the portion of a material in a mixture related to the volume
FWA Federal Water Act
Chemical Abbreviations
BTX Mixture of benzene, toluene, und xylene
DEA Diethanol Amine
DGA Diglycol Amine
DIPA Diisopropanol Amine
L Ligand
MDEA Methyl Diethanol Amine
MEA Monoethanol Amine
THT Tetrahydrothiophene (odourising agent)
Formula Symbols
β Demand factor
m Mass
M Molar Mass
n Number of moles
N Amount of material
Ws,n upper Wobbe-Index in normal conditions

Introduction
10
1 Introduction
Biogas is a renewable source of energy that can contribute to a reduction in green house gas emissions and consequently to the fulfilment of the Kyoto Protocol. An increased utilization of biogas as an energy source will lead to a reduction in the dependence upon gas imports and thus more self-sustainable economies.
At many biogas facilities, the generation of electricity takes place directly on-site in a block heat and power plant. The incidental heat generated by the combined heat and power units is often not used to its full extent due to a lack of consumers for it. This is not an optimal situation because, from an efficiency point of view, there is not a full utilization of the facilities. If the biogas is generated in a place where there is a corresponding demand for heat, a demonstrable increase in the degree of efficiency can be accomplished. Because the operating materials for biogas manufacturing (liquid manure, biological waste, renewable raw materials, etc.) have small energy densities it is not reasonable, for economic reasons, to transport them over long distances to places with high heating demands. A solution to this problem is the region separation of the manufacture and utilization of biogas. The transportation of the gas between the two different locations will be undertaken by the means of a gas grid. The advantage is there will be an increase in overall energy efficiency, however, additional processing and supply technology will be required as well as a gas grid to which it can be supplied. The investment and operating costs for such an endeavour are also increased.
This manual describes the technical possibilities for biogas processing and biogas supply as well as giving a brief mention to the nature of the costs involved. Different processing routes are described and various deployable technologies will be both introduced and compared.

Manufacturing and Composition of Raw Biogas
11
2 Manufacturing and Composition of Raw Biogas
The original energy source for biogas is the sun. Through the process of photosynthesis living creatures store this solar radiation in organic substances (such as carbohydrates and fat). The decomposition of this biomass comes about naturally as the result of two processes. In the first of the processes there is a conversion in the presence of oxygen (aerobic conversion) and the reaction products of this are carbon dioxide and water. No further useable energy will then be extracted from these products. The second process is an anaerobic process, where there is a transformation undertaken without the presence of oxygen and where the products (for example, an energy rich gas) have a potential for further energy extraction. In a biogas plant, this second path of degradation is harnessed by the use of technology. A biogas is thereby produced from the organic material, though the use of different bacteria cultures, which exhibits as its main components methane and carbon dioxide. This so called fermentation process occurs in four steps. During the first step, the long chain organic compounds are split. As a result of this short chain low molecular substances are derived and these go into a solution. It is for this reason that the first step is called the hydrolysis phrase. In the second step, the short-chained substances are decomposed within a fatty acid and hydrogen (the acidification phrase). Subsequently they are further converted under additional hydrogen formation in the following acetic acid phrase. In the fourth and final phrase (the methane formation phase) methogenic bacteria produce methane by the use of the products (organic acids, hydrogen) that were made as a consequence of the proceeding phrases.
Figure 2: General procedure during biogas production [FNR 2008]

Manufacturing and Composition of Raw Biogas
12
2.1 Manufacturing Biogas by Fermentation
The production of biogas is carried out in a biogas plant within a fermenter. A fermenter is a technical system (bio-reactor) in which specific micro-organisms, under optimal growth conditions, break down organic substrates and produce biogas.
Figure 3: Process scheme in a farm-based biogas pla nt [FNR 2008]
The charge materials range from industrial and household waste, to plants and plant waste, to animal waste and remains, as well as liquid manure and excrement. There are, in practice, two prevalent biogas systems. One variant uses renewable raw materials as its charge material, while the other uses liquefied manure. The charge material has a marked influence on the composition of the produced raw biogas. The following table and graph gives an overview of the composition of a typical biogas and biogas yield based on the utilized biomass.

Manufacturing and Composition of Raw Biogas
13
Table 1: Typical biogas composition
Biogas Component Compositional Limits
Methane 45 – 70 Vol.-%
Carbon Dioxide (CO 2) 25 – 55 Vol.-%
Nitrogen (N 2) 0.01 – 5 Vol.-%
Oxygen (O 2) 0.01 – 2 Vol.-%
Hydrogen Sulphide (H 2S) 10 – 30000 mg/m³
Ammonia (NH 3) 0.01 – 2.5 mg/m³
BTX (mixture of Benzene, Toluene and Xylene) < 0.1 – 5 mg/m³
Siloxane < 0.1 – 5 mg/m³
Water vapour (25°C and 1.013 mbar) 3.1 Vol.-% with 100 % relative humidity
Figure 4: Biogas yield and methane content of vario us substances (Source: Handreichung Biogas, FNR, 2006; Energiepflanzen, KT BL, 2006) [FNR 2008]

Manufacturing and Composition of Raw Biogas
14
From the table above it is apparent that the component compositions are subject to variation. The main responsibility for these variations is the fermented raw material and the process operation deployed. A careful selection of the raw materials will result in both a purer biogas, one containing high methane content, and less disturbing amounts of the bothersome material usually associated with biogas production. A reduction in the expenditure involved in overall biogas production can therefore be achieved during its manufacture.
2.1.1 Wet Fermentation
Wet fermentation is the current dominant fermentation process. The fundamental difference between dry and wet fermentation is that in wet fermentation the biomass is pumpable. Substrates with high water content are used for this type of fermentation (for example, liquefied manure and food waste). However moist substrates like cuttings, manure and silage can also be used in wet fermentation but they require prior additional processing. A prior cutting and sorting of the moist substrates occurs, followed by the wet fermentation. The cut up substances are placed in a fermentation container by means of a slowly rotating pipe and mixed with water.
2.1.2 Dry Fermentation
Dry fermentation is carried out for biomass that is not easily pumpable. The biomass material typically has a dry component fraction >25%. Substrates such as manure, silage, and greenery (green waste) are used.
2.2 Standard Targets for Biogas Quality in Germany
In order to supply the public gas grid with biogas the guidelines established by the DVGW-regulator (the German Technical and Scientific Association for Gas and Water) have to be complied with. Principally biogas can be supplied as either an additional gas or an exchange gas. If biogas is mixed with the existing gas in the national gas grid (the base gas), without adjusting it beforehand to the composition of the base gas, it is only useable as an additional gas. Additional gases are gas mixtures whose composition and burning characteristics are significantly different from that of the original base gas. One can supplement the original base gas with small quantities of another gas or one can make additions to the local gas supply. The homogeneity of the combustion behaviour is dependent upon the extent of the mixture of the additional gas [G 260].
Manufacturing and Composition of Raw Biogas
15
In order for the supply of biogas to be allowed as an exchange gas, attention must be paid to the requirements [G 260 and G 262] outlined by the DVGW (German Technical and Scientific Association for Gas and Water)-Regulation Board:
- Oxygen: max. 3 Vol.-% in dry distribution grids max. 0.5 Vol.-% in humid distribution grids
- Carbon Dioxide: max. 6 Vol.-%
- Hydrogen sulphide (H2S): max. 5 mg/m3 (in exceptional circumstances 10mg/m3 can temporarily be allowed)
- Water dewpoint: max. base temperature (dependent on the performance pressure)
- Adherence to the technical combustion variables (Wobbe-Index, calorific value of the fuel, relative density of the fuel).
Biogas in Germany is supplied to a grid that contains both natural gas-H and natural gas-L and they differ according to the Wobbe-Indexes (natural gas-H: Ws,n=12.8 to 15.7 kWh/m³, natural gas-L: Ws,n=10.5 to 13.0 kWh/m³). The (processed) biogas is often not in accordance with these grid specifications and therefore it requires adjustment (conditioned). To increase the calorific content of the gas one can add LPG (Liquefied Petroleum Gas), and to decrease the calorific content of the gas one can add air.
The application of biogas as an additional gas has to be undertaken in the manner that the “Requirements of public gas supply after the mixing point with regard to gas utilization and accounting” are complied with. The resulting gas mixture (original base gas + additional gas = mixed gas) must pass the DVGW regulations for gas composition (G 260) and any others laid out in the gas billing procedure (?) (G 685). A direct statement about the permissible composition of an additional gas has not yet been formulated. In principle, it has to be assumed that unprocessed biogas cannot be fed into the grid. In later chapters the minimum required desulphurisation and drying of the biogas will be considered. With either an preparation of an exchange gas or an additional gas it is essential that at the feed-in to the final consumer grid the odourisation regulations are complied with – they are stated in the G 280-1 work sheet.

Biogas Processing Technology
16
3 Biogas Processing Technology
Before raw biogas can be fed into the public gas grid, the requirements for the type of gas must be corresponded to (for example, G 262). Because biogas still does not meet the necessary regulations after its production a further stage of treatment is required. For exchange gas to be utilized successfully as biogas, desulphurisation, drying, carbon dioxide removal, and Wobbe-Index adjustment are all-necessary. Should the supply of additional gas take place the first two processing steps are be the most crucial. For each processing step there are a multitude of potential technical ways that it can be carried out, and as a result only the most commonly employed will be described in the following text.
3.1 Desulphurisation
In biogas systems, the raw substrate material typically contains sulphur in a variety of forms. Not only organic sulphur is present (org. S), but so too are various sulphates like, SO4
2-, and other sulphide components like H2S(aq), HS-, and S2-. It is during the fermentation process that these compounds are degraded and converted from one form to another. According to T. Ries et al. [RIES 1992] the following conversions take place in an anaerobic environment and they devised the following schematic.
Figure 5: Sulphur conversion [RIES 1992]
org. S
Des
ulph
uris
atio
n
−24SO
−23SO
−2S −HS )(2 aqSH
)(2 gasSH
Sul
phat
e re
duct
ion

Biogas Processing Technology
17
Hydrogen sulphide (H2S) is a very poisonous, highly flammable, and environmentally hazardous gas, which, even in small quantities is toxic for humans.
Table 2: Hydrogen Sulphide hazard classification
Hazard symbol:
Letter abbreviation : T+ F N
Description : Very Toxic Highly flammable Dangerous for the environment
Very small concentrations (20 ppm) will cause irritation of the mucous membrane in the eyes, and for concentrations greater than 500 pm (0.05 Vol.-%) cramping and loss of consciousness will occur. It is worth noting that humans can detect hydrogen sulphide at concentrations as low as 0.002-0.15 ppm (it has the odour of rotten eggs) [WASSERMANN 2007]. The toxicological effects of hydrogen sulphide are outlined in the following table.
Table 3: Toxicological effects of hydrogen sulphide [WASSERMANN 2007]
Hydrogen Sulphide Concentration Toxic Symptoms
< 100 ppm Impact within several hours
> 100 ppm Perilous to life within one hour
500 ppm Deadly within 30 minutes
1000 ppm (0.1 Vol.-%) Toxic effects within several minutes
5000 ppm (0.5 Vol.-%) Death within several seconds
Not only does hydrogen sulphide pose a threat to one’s health, but it also poses technical problems that adversely affect the components of the biogas plant. Examples include corrosion of ferrous metal and the degradation of lubrication oil. For these reasons is it necessary to keep the content of hydrogen sulphide in biogas to a minimum.

Biogas Processing Technology
18
The DVGW-regulation board outlined in process sheet G 260 a maximum hydrogen sulphide content of 5 mg/m3. If the biogas plant requires a licence based on pollutant control laws, the exhaust gas must comply with the emission levels established within the TA Luft (Technical Code of Practice of Air Purification). The Technical Code of Practice of Air Purification permits a maximum of 3 mg/m3, or 15 g/h, of hydrogen sulphide in biogas systems [TA LUFT 2002].
In its original composition, the biogas does not meet these requirements and a desulphurisation treatment is therefore required. It makes economical sense to carry out this desulphurisation of biogas in two steps, as there are large, fluctuating levels of hydrogen sulphide within its content. During the first step, known as main desulphurisation, the largest amount of the hydrogen sulphide in the biogas is removed. In the second step, referred to as fine desulphurisation, a smaller quantity of hydrogen sulphide is removed. In the following text, the technology used to carry out these desulphurisation steps will be introduced and explained in detail.
3.1.1 Main Desulphurisation
A main desulphurisation is recommended for the raw biogas’ that contain ≥100 ppm hydrogen sulphide. This desulphurisation can be undertaken either during the biogas production itself or it can be done later in the process. The most frequently used processes for main desulphurisation are explained in the following sections.
3.1.1.1 Sulphide Precipitation
This form of desulphurisation is based upon the chemical reactions between dissolved hydrogen sulphide and iron salts. Sulphide ions, which derive from the dissociation reaction of hydrogen sulphide, react with iron (II) ions to form an iron sulphide that is difficult to dissolve and which coagulates to create a black salt. This chemical reaction can be simply described through the following equation.
FeSSFe 22 →+ −+ (Equation 1)
The iron salts can be added into the collection tank prior to the fermenter or added to it directly in either a solid or dissolved form. For practical reasons the iron salt is normally added in the form of a solution made locally by mixing iron salt and water: applicable iron salts include iron (II) chloride (FeCl2) and iron (II) sulphate (FeSO4). The solution containing either salt has very low pH value.

Biogas Processing Technology
19
For example, a 20% iron (II) chloride solution has a pH value of less than one. Careful attention has therefore to be paid to the storage, the transport and the measurement of the solutions in order to prevent problems of corrosion. However, the iron salts do not negatively influence the biological activity in the fermenter. There is often an increase in methane production, as the less toxic hydrogen sulphide does not damage methane-generating bacteria.
The iron sulphide that is produced is then mixed with the added organic substrate and they are then withdrawn from the fermenter. Once exposed to the aerobic environment (i.e. open-air storage) in the fermenter, the iron sulphide forms iron sulphate, a good fertiliser for plants. For ecological reasons only heavy metal-deficient iron salts should be considered for use for sulphate precipitation.
The iron sulphide that is produced is then mixed with the added organic substrate and they are then withdrawn from the fermenter. Once exposed to the aerobic environment (i.e. open-air storage) in the fermenter, the iron sulphide forms iron sulphate, a good fertiliser for plants. For ecological reasons only heavy metal-deficient iron salts should be considered for use for sulphate precipitation.
To get an estimate of the operating costs it is necessary to know the iron salt consumption of the system. If we consider desulphurisation by iron (II) chloride the following reaction equation is the basis for the operating cost calculation.
HCl 2FeSSHFeCl 22 +→+ Equation 2
To get an estimate of the operating costs it is necessary to know the iron salt consumption of the system. If we consider desulphurisation by iron (II) chloride the following reaction equation is the basis for the operating cost calculation.
MNm ⋅= Equation 3
Iron chloride and hydrogen sulphide have the same molar ratio, 1:1 (NFeCl2=NH2S).
Based on equation three one can determine the correlation of the masses of the two substances.
SH
SH
FeCl
FeCl
2
2
2
2
M
m
M
m=
Equation 4
( 2FeClM=126.74 g/mol; SH2
M=34.74 g/mol)

Biogas Processing Technology
20
If the amount of hydrogen sulphide is known the theoretical requirement for iron chloride can be ascertained. The proportion of iron (II) ion is often stated within manufacturing information, instead of the proportion of iron salt. nd if such is the case, the following equation can be used.
Fe
Fe
FeCl
FeCl
M
m
M
m 2
2
2+
= Equation 5
( 2FeClM=126.74 g/mol; MFe=55.84 g/mol)
In the above equation, the theoretical amount of iron salt required can be determined. In practice, however, greater than stoichiometrical amounts of iron ions should be used as the amount calculated has to be multiplied by the demand factor β. T. Ries et al. [RIES 1992] determined, after a great deal of experimentation, that demand factor β equals 2.2. During a telephone call to a retailer of iron salts it was confirmed that this value is often used in practice.
Typically, through the aid of this technology, the end sulphur concentration from 50 to 150 ppm in the biogas can be achieved (and also lower). A brief compilation of the advantages and disadvantages follows:
Advantages:
- relatively low investment costs, because one essentially only requires a doser pump and a holding tank (if need be, one could manually add pure iron salt so further investment costs will not apply)
- an adjustment of the process temperature is not necessary
- a quick ability to react to hydrogen sulphide fractions with an appropriate measurement technique
- preventative corrosion protection
- a positive of the biological process within the fermenter (a lower toxic impact H2S)
- no additional air will be necessary
- suitable fertiliser from iron sulphides
Disadvantages:
- high operating costs
- a possibility for heavy metal in iron salt can damage the environment if it apart of the production of fertiliser

Biogas Processing Technology
21
3.1.1.2 Biological Desulphurisation
Biological desulphurisation relies on micro-organisms to breakdown the hydrogen sulphide. For the purification of the biogas the substances which require removal have to undergo a phase transformation from the gas phase to the aqueous phase before they can be decomposed. This phrase transition takes place through an adsorption or absorption process. These chemical compounds for micro-organisms can only be used if they are dissolved in water. The biological breakdown of the pollutants can occur via an extra cellular process or via an intracellular process. During the extra cellular transformation the enzymes of the micro-organisms will be released into an aqueous solution which then serves to alter the pollutants. The term intracellular means that the transformation of the pollutant takes place within cells. To be achieved it has to be absorbed by a micro-organism cell first. The overall transformation process begins within a few seconds, and usually lasts between 10 – 40 seconds. The micro-organisms benefit by acquiring energy from this dissociation reaction.
In the presence of oxygen the micro-organisms (sulphur bacteria) transform the hydrogen sulphide dissolved within water, by the means of biological oxidation, into elemental sulphur and finally into a sulphate. The following chemical reactions depict a simplified version of the process as they proceed.
OH 2S 2OSH 2 222 +→+ Equation 6
4222 SOH 2O 3OH 2S 2 →++ Equation 7
The direct oxidation of hydrogen sulphide to sulphate is also possible.
4222 SOHO 2SH →+ Equation 8
To establish optimal living conditions the sulphur bacteria (Thiobacillus and Sulfolobus) require nutrients and trace elements. It is standard practice to use nitrogen, phosphorous, sulphate, potassium, calcium, and iron, and they are often added externally. Furthermore the temperature is of importance as it should be maintained at a minimum of 20°C for ideal condition s [FIU 2005].

Biogas Processing Technology
22
Biological desulphurisation can either be carried out in a fermenter or outside of a fermenter in a bio-filter, in a bio-washer, or in a trickle-bed reactor system. The three commonly used processing applications are:
1. Bio-filter
2. Bio-washer
3. Bio-trickle filters (also called bio-percolating filter or bio-trickle bed reactors)
All three processing routes are biological procedures. The fundamental process conditions for all three applications are [ABAP 2007]:
- Temperature: 10-40°C (in certain systems tempera tures up to 55°C are possible)
- Humidity: The saturation of water vapour in the gas around the microorganisms should be at least 90%
- pH-value: Strongly acidic pH-values are reasonable
- Gas chemistry: An ample O2 supply
3.1.1.2.1 Desulphurisation in a Fermenter
Sulphur bacteria are usually contained in each fermenter substrate. Through an additional blast of air, an internal biological desulphurisation can be achieved without having to add specific micro-organisms. Usually a large input of air (between 8-12 Vol.-%) is necessary. The desulphurisation performance is therefore strongly dependent on the available contact surface area and this needs to be taken into consideration when air is added.
The advantage of this process is that it is a relatively simple process to realise because only a few system components are necessary (air bellows and a distribution system in the fermenter). Consequently, a cost-effective desulphurisation process can be realised for small biogas systems. The final desulphurisation grade is strongly dependant upon the respective circumstances. For example, some biogas systems, with an internal biological desulphurisation, are only capable of removing 50 Wt.-% of the total hydrogen sulphide from the raw biogas. However, good operations management can increase the degradation efficiency considerably. Aside from the few required building components, another advantage is that the sulphur that remains bonded to the fermenter waste can be returned directly into the natural cycle of matter. A disadvantage of this process is the high demand for air. The oxygen and inert gas (nitrogen) composition of the biogas is increased by the over stoichiometrical input of air which in turn lowers the quality of the biogas.

Biogas Processing Technology
23
Furthermore this process is based on the input of a very rough dosage of air and thus only an unreliable desulphurisation can be achieved for fluctuating hydrogen sulphide contents. Another disadvantage is that with such an air input there is a susceptibility of the fermenter to corrosion and a greatly increased risk of an explosion.
Base on the fact that the biogas supplied to the gas grid should preferably contain small quantities of air, that the regulation of the process is often very difficult and that after processing the biogas in order to achieve the level of quality of the exchange gas, this type of desulphurisation is not recommended.
3.1.1.2.2 Trickle Bed Reactor System
Unlike biological desulphurisation within a fermenter, this processing technique of biological transformation takes place in an external system. The trickle bed reactor (also referred to as bio-percolation filter system or bio-trickling filter) consists primarily of an inert filter material on which the sulphur bacteria settles. The other parts of the system are a circulation pump, an air supply, a measurement and regulation unit, a heat exchanger (if necessary), a holding tank for the nutrient solution, and a piping system with the necessary housing. The inert filter material is unable to absorb any moisture and does not biologically decompose, thereby giving it a very long operating life. Due to the shape and configuration of the trickle filter very large contact areas and long contact times can be obtained. The sulphur bacteria settle on the trickle filter and are suspended within the circulating solution. The necessary nutrients required to cover the demand for nitrogen and phosphorous will be added by an extra, metered addition of a nutrient solution. This can be undertaken either sporadically or continually. Both specialised fertiliser solutions and liquefied manure are possible as a nutrient solution. It is important, however, that a permanent water film for sulphur bacteria be warranted in order to have enough humidity at their disposal. Moreover, the pH value is made controllable by the added solution. This is very important as the biological desulphurisation occurs under very low pH values. The required oxygen enters via a controlled aeration, and is mixed with the biogas.
Figure 6: Trickle-bed reactor system

Biogas Processing Technology
24
Most regulations require that the volume fraction of air input to be as high as 2-6 Vol.-%. Due to the addition of such high air input, it is necessary to ensure that the lower explosion limit is not exceeded. The biogas then flows through the filter, in either a co-current or counter-current flow. Normally, a final purity of between 100-200 ppm or less of H2S can be guaranteed.
The products of decomposition, sulphur (approx. 75 Wt.-%) and sulphate (approx. 25 Wt.-%), are discharged with the nutrient solution from the trickle-bed reactor system and, along with the biogas system digestates, are spread out over fields. The nutrient solution, which circulates in a closed-loop process, must therefore be partly exchanged. The optimal operating temperature is between 28 and 32ºC. Therefore, the system often needs a heater for the winter and a cooler - for example water from a well - for the summer, and ideally thermal insulation or housing
Bio-trickle filters are built in either round reactors with diameters up to 8 metres and with a maximum bulk height of 2.5 metres per downpour, or they are designed to be built into containers. The containers can often be stacked on top of one another or installed on a hall roof to save space.
Advantages:
- a very long lifetime of the liner material (>5 years [ABAP 2007])
- constant dissociation performance over lifetime
- small pressure loss through the liner materials (<250 Pa/m [ABAP 2007])
- an adaptability of the nutrient solution to pollutant composition and loading
- a defined micro-organisms flora by having an inert liner material
- modular and flexible construction
- good process control is possible
- high dissociation rate (up to 99%)
Disadvantages:
- a high air entrainment in the biogas

Biogas Processing Technology
25
(a) [FARMATIC 2007]
(b) [FARMATIC 2007]
Figure 7: (a) Desulphurisation container (b) filler material of a trickle bed reactor system with sulphur deposits
3.1.1.2.3 Bio-washer
Biogas desulphurisation is carried out in a bio-washer in two steps. During the first step, the hydrogen sulphide in the biogas is dissolved by means of scrubbers in a washing solution. During the second step, the feeding in of oxygen causes the biological transformation of the dissolved hydrogen sulphide into elemental sulphur and sulphate. The first step is mainly carried out in a packed column in which the wash solution and the biogas pass by one another in counter-current flow. The hydrogen sulphide is consequently dissolved. The washing solution is a diluted, 20% sodium hydroxide solution. The advantages of using diluted sodium hydroxide, compared to using water, are respectively a higher dissolubility of hydrogen sulphide, a higher loading level and deposition rate. The solution contains bacteria and nutrients is normally led in a counter-currant flow from the inflowing biogas at the bottom to the out flowing biogas at the top. The hydrogen sulphide removal occurs as shown in the following chemical reaction.
OHNaHSNaOHSH 22 +→+ Equation 9
With time, the sodium hydroxide is consumed and must be regenerated. This occurs as a continuous process in a second stage that is separate from the first step.
Biogas Processing Technology
26
Raw biogas
Air
Trickle -bed Reactor System
Bio -reactor Biological
desulphurisation
Raw biogas (sulphur-free)
Air
Sulphur Filter Waste water
Sulphur slurry
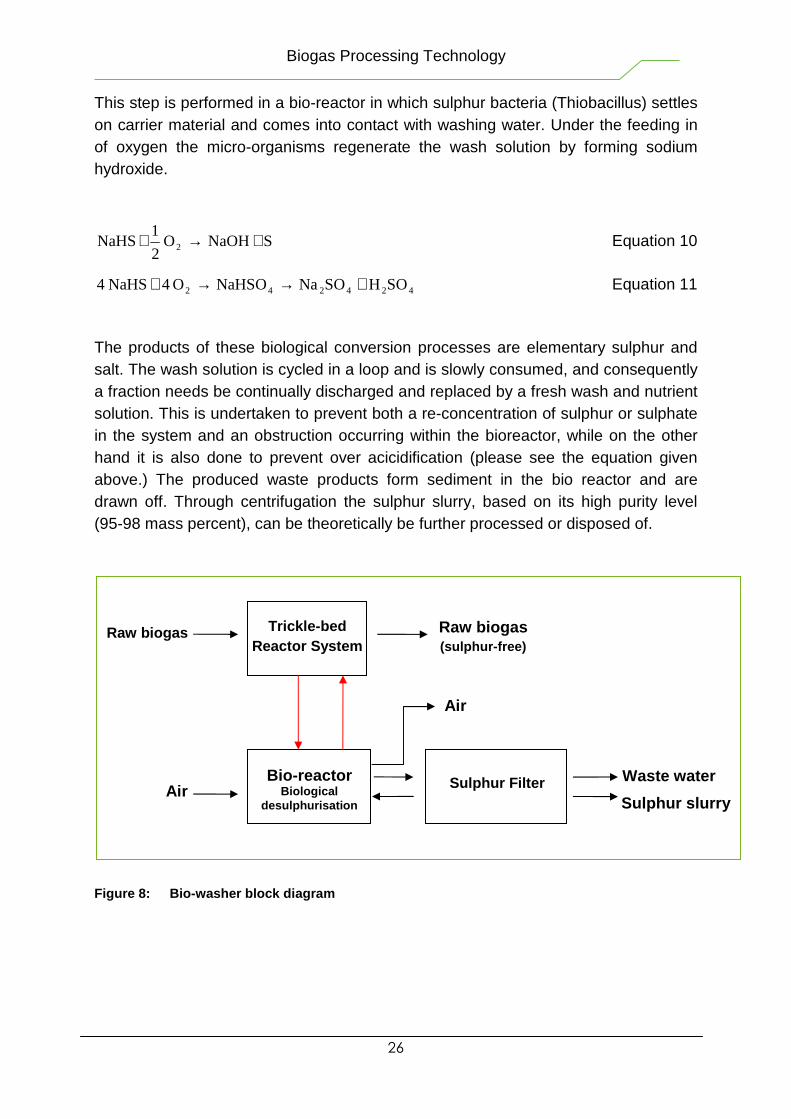
This step is performed in a bio-reactor in which sulphur bacteria (Thiobacillus) settles on carrier material and comes into contact with washing water. Under the feeding in of oxygen the micro-organisms regenerate the wash solution by forming sodium hydroxide.
SNaOHO 2
1NaHS 2 +→+ Equation 10
424242 SOHSONaNaHSOO 4NaHS 4 +→→+ Equation 11
The products of these biological conversion processes are elementary sulphur and salt. The wash solution is cycled in a loop and is slowly consumed, and consequently a fraction needs be continually discharged and replaced by a fresh wash and nutrient solution. This is undertaken to prevent both a re-concentration of sulphur or sulphate in the system and an obstruction occurring within the bioreactor, while on the other hand it is also done to prevent over acicidification (please see the equation given above.) The produced waste products form sediment in the bio reactor and are drawn off. Through centrifugation the sulphur slurry, based on its high purity level (95-98 mass percent), can be theoretically be further processed or disposed of.
Figure 8: Bio-washer block diagram

Biogas Processing Technology
27
As in all cases of biological desulphurisation processes, the micro-organisms must be supplied with nutrients and the respective process temperature must be maintained to ensure optimal growth and living conditions. The sulphur concentration achievable in the biogas at the end is between 50 and 100 ppm.
Advantages:
- no input of air in the biogas volume flow
- it is also appropriate for biogas with high sulphur loads (up to 30000 mg/m3) [FIU 2005]
Disadvantages:
- to low sulphur loadings are problematic for system operations
- a higher equipment cost in comparison with the trickle-bed reactor system
- only dissolved material can be processed
3.1.1.2.4 Bio-filter
A bio-filter is equivalent to the construction of a layer filter with a layer thickness of 1 to 3 metres. The biogas passes through a humidified organic fill made of such materials as peat, bark mulch, and wood chip. To provide optimal living conditions for the micro-organisms, a humidification is carried out by means of a sprinkler system. The sulphur bacterium settles on the fill material that converts, under the presence of oxygen, the hydrogen sulphide from the biogas. Because of the micro-organisms the organic fill material decomposes slowly. This decomposition takes place in parallel but independent of the decomposition of the hydrogen sulphide in the biogas. During times of operational shutdown, the micro-organisms are able to bypass any periods of ‘hunger’ by getting their energy supply from the decomposition of the filter material. At the same time, the filter material provides necessary nutrient salts making an additional supply of micro-organisms with nutrients unnecessary. The continual decomposition of the filter material increases the fine grain fractions and therefore the pressure increases. A filter change is typically necessary after a few years.

Biogas Processing Technology
28
3.1.1.3 Desulphurisation with an Iron-Chelate
A chemical process for biogas desulphurisation is the iron chelate process. Through an iron redox reaction hydrogen sulphide is converted into elementary sulphur. Iron chelate is a chemical substance consisting of an iron (III) ion (Fe3+), organic ligands (L) and chelate. This compound is dissolvable in water and is stored in a specifically designed container. The to be desulphurised biogas is blown into the container that holds the iron chelate. The subsequent chemical reactions occur and the iron (III) ion is reduced to the iron (II) ion.
+++ ++→+ H 2SLFe 2SHFe 2 22
3 Equation 12
The ligands ensures that the iron ion does not bond with a sulphide or a hydroxide ions and become unusable.
In parallel with the reduction the regeneration of the iron (II) ion with the help of oxygen takes place. The ligands makes it possible for the developed iron (II) ions to bond again with the original chelate compound allowing a new desulphurisation to occur. The oxidation reaction takes place as follows:
OHLFe 4H 4OLFe 4 23
22 +→++ +++ Equation 13
This process, which is known in practice under the term The “LO-CAT” process, can achieve a 99% desulphurisation degree [MERICHEM 2007].
3.1.2 Fine Desulphurisation
For a biogas that is processed as an exchange gas to be able to be supplied into the gas grid DVGW process sheet number G260 requires a maximum hydrogen sulphide content of 5 mg/m3 (in exceptional cases 10 mg/m3 is temporary permitted). In order to be able to obtain and guarantee these values a main desulphurisation alone is generally not adequate. An additional fine desulphurisation will be consequently necessary. For fine desulphurisation, zinc oxide, ferrous matter, and activated carbon can be used. The activated carbon is often impregnated because they allow a higher rate of sulphurisation and/or loading capacities.

Biogas Processing Technology
29
The most common impregnating materials used in practice are potassium iodide (KI), potassium carbonate (K2CO3) and potassium permanganate (KMnO4). Through the use of this procedure a main desulphurisation can be realized but with much higher operating costs incurred in comparison with the main desulphurisation processes already mentioned above. This is because during all these previous mentioned processes the desulphurisation medium is consumed by the removal of the hydrogen sulphide and must be continuously exchanged.
3.1.2.1 Activated Carbon
Activated carbon has a highly porous structure and a large inner surface area that is well-suited to be an adsorbent agent for biogas desulphurisation. The activated carbon functions as a catalyst, which under low temperatures causes a conversion of hydrogen sulphide and oxygen to water and elemental sulphur. Without the affect of this catalyst this chemical reaction would not occur at room temperature, but only for temperatures over 200ºC [GERMAN CARBON 2001].
OH 2S 4
1OSH 2 2822 +→+ Equation 14
The emergent sulphur is adsorbed on the inner surface area of the activated carbon. The sulphur loading capacity is hereby very differently stated, but in reality, a loading of 0.12 kgsulphur/kgactivated carbon is achievable. The water produced during the reaction is discharged with the biogas volume flow. Through the impregnation of the activated carbon, the sulphur loading capacity and the speed of the reaction of the chemical conversion can be both increased. The impregnation functions either as a catalyst or as a substance that is converted chemically with the hydrogen sulphide. The result of a catalytic oxidization is potassium iodide while, on the other hand, the potassium carbonate and the potassium permanganate are used up stoichiometrically during the hydrogen sulphide removal.

Biogas Processing Technology
30
Figure 9: Schematic representation of an activated carbon filter [RÜDGERS 2003]
3.1.2.1.1 Activated Carbon Impregnated with Potassium Iodide
Normally, the activated carbon should be impregnated with 1-10 Wt.-% potassium iodide. However, standard impregnations consist of 2-5 Wt.-%. At low temperatures (20-70ºC), the catalytic oxidation of hydrogen sulphide to elemental sulphur and water takes place. Oxygen is necessary for this reaction and must be contained in adequate amounts in the biogas. The general reaction is that shown by Equation 14.
KI functions as a catalyst and diminishes the formation of sulphuric acid because the oxidation potential of I2 [I2·KI] is not sufficient. The produced sulphur is stored on the activated carbon and continuously diminishes the catalyst as well as the input power. The activated carbon must therefore be exchanged in regular intervals. A regeneration of the loaded activated carbon is possible under hot gas or hot steam at temperatures above 450 ºC, however, there is always some residue remaining within the activated carbon. A waste removal step is therefore generally undertaken. Due to the evidence gained in laboratory tests and in practice it has been seen that with 2% potassium iodide impregnated activated carbon requires an oxygen content of 0.2-0.4 Vol.-%. The associated loading capacity is 0.43 kgsulphur/kgactivated carbon [ATZ 2004]. As an achievable end purity level, a pure gas concentration of less than 5 mg/m3 hydrogen sulphide is possible.
Thermal Insulation
Sulphur-loaded activated carbon
Conversion zone
Unloaded activated carbon
Biogas 60-90°C
H2S-free Biogas
Reactor

Biogas Processing Technology
31
The advantages of this kind of desulphurisation method are high loading capacities; high-end purity levels that can be achieved; and low operating temperatures. A disadvantage is the need for a sufficient level of oxygen within the biogas. It is for this reason that the process is therefore considered inappropriate for biogas free from air.
3.1.2.1.2 Activated Carbon Impregnated with Potassium Carbonate
Potassium carbonate impregnated active carbons have been deemed suitable for hydrogen sulphide removal for oxygen-containing biogases. The potassium carbonate does not function as a catalyst, but rather as an oxidation material. It is converted and consumed stoichiometrically during the desulphurisation process. The process occurs at temperatures above 50ºC. The reaction products include carbon dioxide, water and potassium sulphate.
42223222 SOKOHCOCOKO 2SH ++→++ Equation 15
In this chemical equation, it is obvious that the sulphur is bonded with potassium sulphate and manganese sulphate, the reaction products. This form of desulphurisation occurs at temperatures between 20-50ºC.
The activated carbon is often provided with impregnations between 1.5-5.5 Wt.-% but higher and lower impregnation amounts are possible on request. The loading capacity for a 1.5 Wt.-% impregnated material is approximately 0.1 kgsulphur/kgactivated carbon [AQUA 2007], whereas from other sources higher loading capacities have been reported. This process can definitely achieve an end purity level of less than a 5 mg/m3 hydrogen sulphide concentration.
3.1.2.1.3 Activated Carbon Impregnated with Potassium Permanganate
Oxygen-free biogases can be desulphurised with potassium permanganate impregnated (KMnO4)-activated carbon. Potassium permanganate does not function as a catalyst, but as an oxidizing agent. This leads to the fact that the impregnated material is consumed stoichiometrically during hydrogen sulphide removal. An idealised version of the chemical reaction is shown below.
OH 5MnO 7SOK 4MnSOKMnO 8SH 5 242442 +++→+ Equation 16

Biogas Processing Technology
32
In this chemical equation, it is obvious that the sulphur is bonded with potassium sulphate and manganese sulphate, the reaction products. This form of desulphurisation occurs at temperatures between 20-50ºC.
The activated carbon is often provided with impregnations between 1.5-5.5 Wt.-% but higher and lower impregnation amounts are possible on request. The loading capacity for a 1.5 Wt.-% impregnated material is approximately 0.1 kgsulphur/kgactivated carbon [AQUA 2007], whereas from other sources higher loading capacities have been reported. This process can definitely achieve an end purity level of less than a 5 mg/m3 hydrogen sulphide concentration.
An advantage of this process is that oxygen is not necessary for hydrogen sulphide removal and it is therefore applicable for biogas processing. However, a disadvantage of this process is a clear lower loading capacity when compared to the activated carbon impregnated with potassium iodide. This is due to the stoichiometrical consumption.
3.1.2.1.4 Zinc Oxide
Another adsorption material for carrying out hydrogen sulphide removal is zinc oxide (ZnO). Historically, zinc oxide has been used in the petrochemical industry. In this sector, zinc oxide is used for fine and ultra-fine desulphurisation, as well as for the removal of carbonyl sulphide, carbon disulphide and methanethiol. The chemical reaction that occurs is shown beneath. The reaction products include water and a not readily soluble zinc sulphide.
ZnSOHZnOSH 22 +→+ Equation 17
It is standard to obtain zinc oxide pellets in either a pure form (>99 Wt.-%), or in compound with other chemical additions. Typically, the ZnO based absorbent materials are used at raised temperatures because the loading capacity grows with increasingly high temperatures. The sulphur loading capacity at 100ºC is 0.025 kgsulphur/kgzinc oxide and at 350ºC it is 0.22 kgsulphur/kgzinc oxide. The reaction between ZnO and H2S takes place, with a sufficient tempo, only at a temperature of approx. 100ºC, therefore the use of a pure zinc oxide at room temperature is not suitable. For room temperature applications, mixing the zinc oxide with a catalyst can increase the loading capacity. Typically, copper or aluminium oxides are used as catalysts. At 25ºC, the sulphur capacity is 0.05 kgsulphur/kgzinc oxide in the presence of 2 Vol.-% carbon dioxide.

Biogas Processing Technology
33
In the absence of higher carbon dioxide amounts a higher capacity can be achieved. Furthermore, the gas flow will not be completely saturated by water vapour to allow the water produced from the chemical reaction to be transported away in the gas flow. It is recommended that there be a maximum relative humidity content of 70%. The consumed adsorbent material cannot be regenerated and must therefore be exchanged and disposed of. The advantages of using zinc oxide for hydrogen sulphide removal is an oxygen-free workability as well as a high achievable end purity levels – as low as only a few ppb. However, the operating
expenses based on the exchange costs are very high, and thus this process is only recommended for fine or ultra-fine desulphurisation.
3.1.2.1.5 Hydrogen sulphide (H2S) Removal by means of an Iron Substrate
For the desulphurisation of gases, it is also possible to use iron oxide or iron (III) hydroxide. H2S reacts with these materials to form iron sulphide. The iron matter is continuously consumed and thus a periodic regeneration is necessary. The exact processing principle for both of the iron substrates will explained in the following text.
Iron (III) Hydroxide
Iron (III) hydroxide, also referred to as bog iron ore or ‘luxmasse’, is a red-brown material that once in contact with hydrogen sulphide produces iron sulphide, elementary sulphur and water according to the following reaction.
OH 6S 8
1FeS 2SH 3Fe(OH) 2 2823 ++→+ Equation 18
During the operation, the iron (III) hydroxide is consumed. By adding oxygen through an air intake, regeneration is allowed to occur. In the presence of water, iron sulphide is converted back into iron (III) hydroxide and the adsorption can begin again. To make a continuous operation possible, two parallel connected cleaning units are necessary.
Figure 10 Zinc Oxide Pallets [GRASSLER 2007]

Biogas Processing Technology
34
8322 S8Fe(OH)O12H6O8FeS +→++ Equation 19
The sulphur formed during the adsorption and regeneration phases settles on the substrate surface area, thus reducing the overall reactive surface area. The efficiency of the hydrogen sulphide adsorption continuously decreases as a result. In general, an exchange and disposal of the substrates is necessary after a maximum of 10 regenerations. According to Dr. W. Althaus/W. Urban [FIU 2005] a loading capacity of 25 Wt.-% can be achieved and an end purity level of hydrogen sulphide of <1ppm and <100ppm from an initial concentration of between <1000ppm – and <5000ppm. Both the adsorption and the regeneration are carried out at room temperature in a desulphurisation tower. Based on the fact that the regeneration occurs a strongly exothermic process needs to be monitored in order that the formation of explosive mixtures be prevented.
Iron (III) Oxide
As in the process with iron (III) hydroxide, iron (III) oxide (Fe2O3) can also be used to desulphurise biogas. Iron (III) oxide is utilised in the form steel wool, impregnated wood chips or as pellets. Elementary sulphur and water are produced from the adsorption reaction, and during the regeneration process Iron (III) oxide and sulphur are produced in the presence of oxygen. The adsorption and regeneration reactions are shown in the following equations.
OH 3S 8
1FeS 2SH 3OFe 28232 ++→+ Equation 20
8322 S 2
1OFe 2O 3FeS 4 +→+ Equation 21
The produced sulphur is stored on the surface area of the adsorbers, which continually decreases its loading efficiency. In general, impregnated wood chips lose approximately a third of their loading capacity per regeneration and thus can only be regenerated twice at the maximum. This fact leads to a high chemical consumption. In addition, the regeneration reaction that precedes it is strongly exothermic, and consequently there is an increased danger of fire. As a result of these disadvantages, this processing method is becoming less popular.

Biogas Processing Technology
35
3.2 Carbon Dioxide Separation
In traditional biogas systems with block heat and power units, a methane enrichment is usually dispensed with, for these applications, because methane contents between 50-70% are sufficient. For a natural gas grid supply (as an exchange gas) however, higher methane contents are necessary to comply with the specifications of the DVGW process sheets G 260 (Wobbe-Index). For this reason the carbon dioxide, which is a component of the biogas at a rate of between 25 – 55 Vol.-% and therefore is the most important associated material, must be separated.
Processes for CO2 removal constitute adsorption, physical and chemical absorption, membrane separation, as well as cryogenic processing. The processes differ not only in terms of the utilized technique, but also in terms of the quality of the gas achievable, the processing control, as well as the experience previously gained within the area of biogas processing. A brief overview is given in the following table.
Table 4: Overview of CO 2 removal processes
Separation Method Process Functioning Principle
Final Methane Content
Adsorption Pressure swing adsorption
Adsorption of CO2 by a molecular sieve
> 96 Vol.-%
Pressurized Water Wash
Dissolution of CO2 in water under increased pressure
> 96 Vol.-% Physical absorption
Selexol-®, Rectisol®-, Purisol®-Processes
Dissolution of CO2 in special solvents
> 96 Vol.-%
Chemical absorption
Monoethanolamine (MEA)-Wash
Chemical reaction of CO2 with MEA
> 99 Vol.-%
Polymer membrane gas separation (dry)
> 80 Vol.-% Membrane separation Membrane gas
separation (wet)
Membrane permeability of H2S and CO2 is higher than CH4 > 96 Vol.-%
Cryogenic process
Low temperature process
Phase separation of liquid CO2 and gaseous CH4
> 99.9 Vol.-%

Biogas Processing Technology
36
The following text provides a description of the terms adsorption and absorption:
Adsorption
Adsorption is the attachment of molecules in the gas or liquid phase (adsorbent) on the surface area of a solid material. It leads to a concentration and compression increase at the phrase interface. The adsorption process is therefore an equilibrium process between the concentration of the adsorbent component in the gas and the component in the adsorber medium. During adsorption, energy is released, which must be re-supplied again during the regeneration process. Adsorbers with high loading capacities have a large amount of small and very small pores (micro pores). The micro pores are surrounded by a grid that consists of larger pores (macro pores) which serve to allow good accessibility to the micro pores. A selection can be achieved by the pore diameters. For example, an adsorber with predominantly small pore diameters can adsorb small molecules, whereas the larger molecules cannot be adsorbed, or can hardly enter the absorber. The selective adsorption ability of certain individual gas components is not only dependent on the pore diameter, but also on the polarity of the adsorbent. High polarity produces a high adsorption rate. It is for this reason that strongly polar substances like water can displace other adsorbed substances.
Absorption
Absorption is the constant permeation of gases (referred to as absorbate) into liquid or solid materials (absorption agent, absorbent) intake into the capacity [MEYER 2007].
Figure 11: Illustration showing the difference betw een Adsorption and Absorption [CHEMVIRON 2007]

Biogas Processing Technology
37
Figure 12: Methane enrichment in a carbon molecular sieve
3.2.1 Pressure Swing Adsorption
Pressure swing adsorption (PSA) is a process, which by means of activated carbon, zeolite, and carbon molecular sieves, reliably separates carbon dioxide and other properties, such as nitrogen or water, from the biogas,. The processing principle is based on the differences in the adsorption behaviour of methane (CH4) and carbon dioxide (CO2) at elevated pressures at the adsorber. Compared to methane, carbon dioxide attaches itself faster and stronger to the adsorber.
Carbon molecular sieves are a frequently used type of PSA adsorber, which are often manufactured from black coal due to its already existing pore system. Even so, it is necessary to technically prepare the black coal. During this process the black coal is finely ground, it is then pre-oxydated with air, mixed with pitch, extruded to form briquettes and subsequently thermally treated. The pore system is thereby both enhanced and supplemented by the sub micro pores. In this manner, a larger surface area can thus be obtained, leading to an increased adsorber capacity. The next figure shows a simplified model of a carbon molecular sieve.
Figure 13: Simplified model of a carbon molecular s ieve [RÜDGERS 2003]
Outer Surface Area
Inner Surface Area
Carbon Particle

Biogas Processing Technology
38
Aside from the main components, methane and carbon dioxide, biogas consists essentially of air (nitrogen and oxygen), water vapour and hydrogen sulphide. The chemical components of the raw gas have different molecular diameters. For example, methane has a molecular diameter of 0.4 nm and carbon dioxide of 0.26 nm. Based on the differences in molecular diameter, the smaller molecules like CO2, N2, O2 and H2O are more readily adsorbed into the pores than the methane. The adsorber assimilates these accompanying substances from the biogas, so that the methane can flow through nearly unhindered. In the flow direction methane is accumulated in greater and greater amounts. This effect is illustrated the following images. To achieve the high CO2 separation capacity of the adsorbers with minimal system sizes, it is necessary to remove most of the contained accompanying components in the biogas (especially water vapour and hydrogen sulphide). A dehumidification by means of a condensation cooler is therefore sufficient. It is also recommended that the hydrogen sulphide is removed prior to this process because the hydrogen sulphide attaches itself onto the adsorber and this is irreversible and the system would be increasingly damaged. A previous fine desulphurisation is therefore necessary.
The processing method for CO2 separation is described in the following text. PSA begins with gas compression. The raw biogas is typically compressed to a pressure between 6 - 10 bar. Attention needs to be paid to the fact that compression is carried out, if possible, oil-free in order to prevent impurities with long-chained hydrocarbons in the gas and the accompanying damage to the adsorber. If there is a high contamination with impurities, a filter will need to be installed to filter out the long-chained hydrocarbons, dust etc. Through this compression a heating up of the gas occurs. The adsorption efficiency increases with decreasing temperatures and therefore allow it to cool is sensible. Typically, adsorption is carried out at temperatures between 10 - 30°C. It is here that acc umulated condensate is isolated. A pre-drying to the dew point (3-5°C) should also b e undertaken to prevent condensate and corrosion in the successive parts of the system. Through these measures the adsorption performance can be increased alongside a constant adsorber size and a constant vacuum pump performance.
Figure 14: Adsorption behaviour of different biogas components [RÜDGERS 2003]

Biogas Processing Technology
39
The produced biogas is prepared in this manner then arrives at the PSA system, where the CO2 will then be removed through four cycles:
1. Carbon dioxide adsorption at high pressures
During the first step, the compressed gas flows through the adsorber, usually from bottom to top. The adsorber usually contains two layers: the lower one is made of zeolite, for adsorbing the remaining water vapour; the upper layer is made of carbon molecular sieves, and is therefore substantially longer, for the adsorption of the carbon dioxide. The second sieve binds the carbon dioxide that is contained in the biogas so that the product gas contains almost entirely CH4 and leaves the adsorber with a nearly constant flow rate and gas quality. However, during the adsorption, small amounts of CH4 become bonded. In the absence of an air leak, methane purity levels above 98 Vol.-% are possible.
2. Desorption at low pressure
Throughout the adsorption procedure, the adsorber becomes increasingly saturated. Before complete saturation, and the accompanying loss of its deposition function, a regeneration step needs to be carried out. Pressure reduction is carried out in co-current or counter current flow. It is during this stage that carbon dioxide and water vapour are desorbed. Because during the first pressure reduction, the emergent off-gas is quite methane-rich, the gas will then be passed through a further “fresh” adsorber to increase the methane yield during the new adsorption and to realise the first pressure increase in the second container (see phrase 4). Afterwards the pressure on the adsorber is released to an ambient pressure. As a result the bonded carbon dioxide and water vapour from the adsorber increasingly dissolves. The off-gas is thereafter allowed to escape into the environment.
3. Desorption by vacuum regeneration and rinsing
By means of a vacuum pump, the pressure is even further lowered in order to achieve a removal of as much of the water vapour as possible from the zeolites, thereby further potentially increasing the adsorption capacity. Normal evacuation pressure is situated at 100 mbar absolute. Furthermore, the adsorber is rinsed with raw and product gas. The additional off-gas is also released into the environment.
Biogas Processing Technology
40
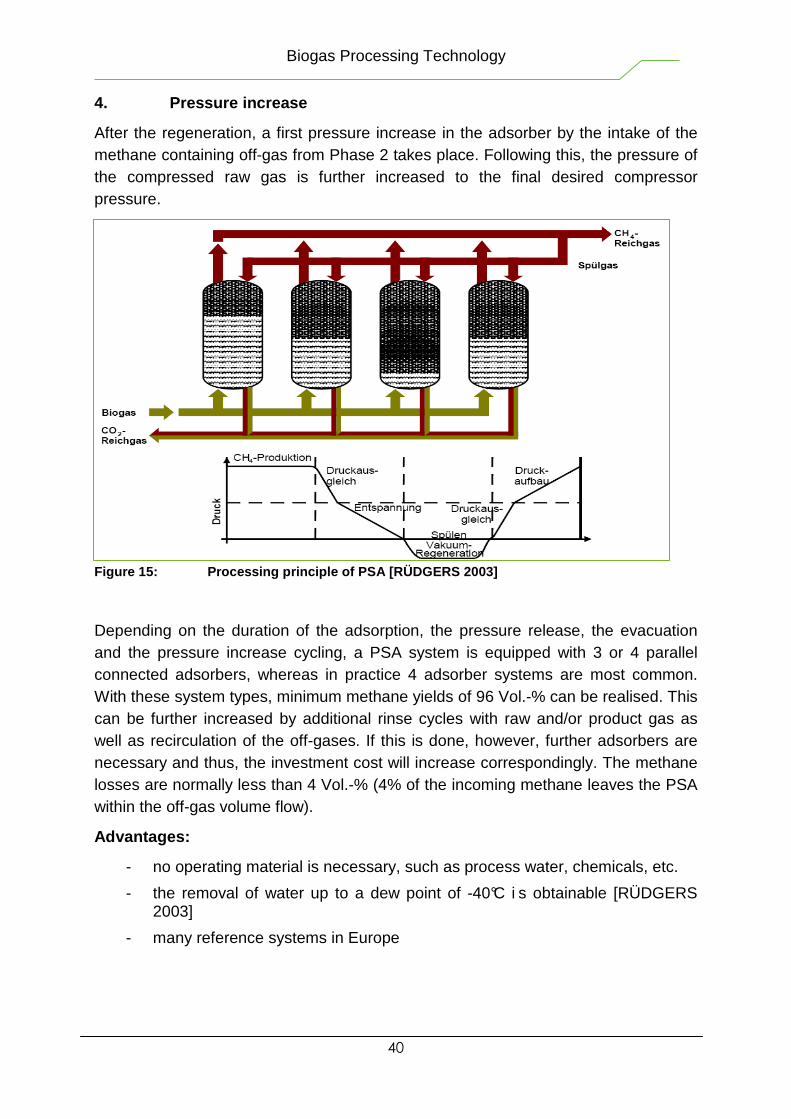
4. Pressure increase
After the regeneration, a first pressure increase in the adsorber by the intake of the methane containing off-gas from Phase 2 takes place. Following this, the pressure of the compressed raw gas is further increased to the final desired compressor pressure.
Figure 15: Processing principle of PSA [RÜDGERS 200 3]
Depending on the duration of the adsorption, the pressure release, the evacuation and the pressure increase cycling, a PSA system is equipped with 3 or 4 parallel connected adsorbers, whereas in practice 4 adsorber systems are most common. With these system types, minimum methane yields of 96 Vol.-% can be realised. This can be further increased by additional rinse cycles with raw and/or product gas as well as recirculation of the off-gases. If this is done, however, further adsorbers are necessary and thus, the investment cost will increase correspondingly. The methane losses are normally less than 4 Vol.-% (4% of the incoming methane leaves the PSA within the off-gas volume flow).
Advantages:
- no operating material is necessary, such as process water, chemicals, etc.
- the removal of water up to a dew point of -40°C i s obtainable [RÜDGERS 2003]
- many reference systems in Europe

Biogas Processing Technology
41
Disadvantages:
- high pressure is necessary (resulting in a high energy consumption)
- system must be able to operate safely at high pressure (high cost)
- relatively high methane losses
3.2.2 Absorptive C0 2 Separation Process
One understands the term absorption, as I have already mentioned, to mean the uptake or dissociation of atoms, molecules or ions. Absorption is not an attachment to a surface area as during adsorption, but is an uptake into the free volume of the absorber phase. Absorptive CO2 separation processes are those technologies in which one, or multiple, gas components pass over and are then absorbed when it/they come into contact with a fluid. In principle, there exist two methods for this: physical absorption (physisorption) and chemical absorption (chemisorption).
The term physisorption means that the absorption takes place through the bonding of the gas fractions with a deployed washing agent by Van der Waals forces. In principal, one can use a large variety of fluids as the cleaning agents. However, to achieve a high absorption capacity, it is important to keep in mind that the bonding forces of the wash solution for the respective gas components are high. The enhancement of the bonding forces leads to an increased solubility and an increased loading capacity of the wash fluid. Additionally another increase of the Adsorption can be achieved by a decrease in temperature and/or an increase in pressure. As these separation technologies do not serve to change the chemical structure, they are in principle completely reversible. In addition, the bonding force (Van der Waals forces), in comparison with other chemical bonding forces (i.e. ionic forces), are much lower and they often ensures that the regeneration requires less activating energy. Generally, the regeneration of the washing agent is done through heating and/or stripping the fluid. By the term, stripping the fluid, it is meant that the affiliated gas fractions are removed by a blast of inert gases. An example of physical absorption is the pressurized water wash (PWW).
During chemiosorption, in contrast to physisorption, a physical absorption based on Van der Waals forces and a chemical reaction with the wash solution occurs. The chemical bonding forces are many times stronger than the Van der Waals forces, and therefore the loading capacity is much higher with this process. Moreover, chemiosorption allows a selective absorption. This means that only a few components will react with the wash solution and as a result the absorbed quantity of the desired gas components is substantially larger than the absorbed quantity of the unwanted components. In all cases, a regeneration step follows the absorption step. Based on the strong bonding forces, the regeneration is considerably more complicated.

Biogas Processing Technology
42
In general, a higher thermal energy expense is necessary because the regeneration can be often only realised through boiling. A few examples of chemical absorption are the cold and hot base wash (by means of NaOH-base), the ammonia water wash, and the amine wash. A combination of chemical and physical absorbers is possible – an example of this is the Amisol wash application.
For biogas production in Germany, pressurized water wash, Selexol wash and amine wash are all relevant, and there will therefore be considered in the following text.
3.2.2.1 Pressurised Water Wash
Pressurized water wash (PWW) is the most applied process for methane enrichment and the CO2 removal of bio-generated gases in Europe. In Sweden, approximately 80-90% of biogas is produced in this manner. PWW is carried out in four process steps.
1. Filtering
A filtering is undertaken to separate such impurities as dust and water droplets from the biogas. This takes place through a gravel filter.
2. Compression
Often through the use of a two stage compressor a compression of the raw biogas to 8-15 bar occurs. In doing so, the gas temperature is increased to approximately 100°C, necessitating a subsequent gas cooling (at h igh temperatures the loading capacity of the wash water is lowered).
3. Absorption
The raw biogas flows in through the base of the absorption column and flows upwards, exiting through the top. In the column, typically a drip bed reactor type, the wash water flows counter-currently down to the base. In general, the water temperature is 25°C, but in some models the water t emperature is colder, approximately 5°C. In the absorption column, there are specialized internal components, which repeatedly redirect the gas, and as a result they allow as large a contact area as possible between the gas and water to be realised.

Biogas Processing Technology
43
The absorption behaviour of the biogas components is dependent on the pressure, the ratio of biogas to wash water, and the temperature. Increasing the pressures and decreasing the temperatures serves to increase the absorption capacity.
A temperature reduction of 25°C to a temperature ne ar the freezing point nearly leads to a doubling of the loading capacity of the wash solution. In the same way, the respective chemical characteristics of the biogas components each have a critical influence. Non-polar, hydrophobic components like methane dissolve considerably more poorly than hydrophilic components like carbon dioxide, hydrogen sulphide, or ammonia. An overview of different solubility’s at different temperatures is demonstrated in the following table.
Table 5: Solubility of biogas components in water [ TENTSCHER 2006a]
Solubility in water at 1 bar partial pressure of th e dissolved gas [mmol/(kg·bar) Biogas
components 0 °C 25 °C
CO2 75 34
H2S 205 102
NH3 53,000 28,000
CH4 2.45 1.32
Air 1.27 0.72
From this table it is apparent that carbon dioxide has a much higher solubility in water in comparison to the solubility of methane. This makes it possible for the CO2 to be washed out of the biogas with very small amounts of methane absorbed in the water. These small amounts can be retrieved once more through a regeneration of the wash water. It is also made clear in the table that biogas components like hydrogen sulphide and ammonia have even greater solubility than carbon dioxide. Based on this information, these components will be very well absorbed within the wash solution and thus removed from the biogas. From PWW the result is an end sulphur content in the product gas of less than 5 mg/m³ from an input sulphur concentration of up to 7500 mg/m³ [TENTSCHER 2006a].
At the top end of the absorption column, the cleaned biogas has a methane content of >96 Vol.-% and a carbon dioxide concentration of 1-2 Vol.-%. The escaping gas has a relative air humidity of 100%. The highest gas purity can be achieved when fresh wash water is always employed and no recirculation of the water is carried out. The availability of cost efficient water (i.e. well water) makes this processing route one of the most economically and energetically efficient. A further advantage in this case is the continuous discharge of soluble dust and possible sulphur depositions. This continuous discharge prevents obstructions within the system.

Biogas Processing Technology
44
The wastewater is then subsequently transferred to a purification plant. Should only expensive drinking water be available, it is normally continuously regenerated, and then partially exchanged.
4. Regeneration
The process of regeneration takes place in 2 steps. In the first step the wash water is expanded in a desorption column (expansion tank) to a moderate pressure (approx. 2 bar), whereby the mainly small quantities of methane and a part of the carbon dioxide escapes. This gas, which has high methane content, returns to the compressor, and through a new absorption cycle. These measures serve to reduce the methane losses to a maximum of 2 Vol.-% [TENTSCHER 2006a]. The second step then follows. The wash water arrives at a second desorption column (stripper) where - under atmospheric pressure and an air input - the CO2 and the H2S are removed from the wash solution. The air (strip air) meets in the counter-flow water, which has entered at the upper end of the column, bringing with it the escaping gas components. The off-gases, diluted with air, leave the desorption column at the top end with a CO2 content of approximately 30 Vol.-% and a maximum H2S concentration of 0.1 Vol.-% [FIU 2005]. 0.1 Vol.-% sulphur concentration, as was described previously in this manual, is deadly. According to TA Luft, the maximum hydrogen sulphide content may only be 3 mg/m³. If there has not been a prior desulphurisation, the system is then subject to approval by the TA, and it must have an exhaust-gas desulphurisation unit installed. After the desorption column the wash water is then cooled in a heat exchanger and returned to the adsorption column.
Advantages:
- great flexibility with system control through the fluctuations of the volume flow rate and the CO2 content (good controllability of the system through the compressor and the water circulation)
- the Silane and siloxane can be removed
- the NH3 can almost entirely be removed from the gas
- there us a continuous and fully automated operation
- it has been tested in practical state-of-the-art applications
- the requirements for raw biogas quality are not high
- using water as the washing agent is safe, cost-effective, and furthermore, the water is often available in unlimited amounts
Disadvantages:
- there is a high demand for water
- there is a high power consumption due to the circulation pump
- the system must be pressure-safe (at high cost)

Biogas Processing Technology
45
Figure 16: Flow diagram of the pressurized water wa sh process [TENTSCHER 2006a]
3.2.2.2 Selexol Process
Selexol is a chemical mixture consisting of dimethylether and polymethyleneglycol. This physically active dissolution agent has the ability to remove CO2, in the gaseous phrase, considerably better than water. Because Selexol has a low vapour pressure, it is possible for water vapour to be removed from the biogas and to complete a drying to approximately 0.07 g/m³ [THEISSING 2006]. Furthermore, in Selexol the solubility of H2S and COS are many times better than that in water, and they can therefore be more effectively removed. These characteristics mean that considerably lower amounts of washing agent and circulation energy are required in comparison to the PWW with water. For the absorption stage, the biogas is compressed to the pressure of 10-12 bar and blown in through the base of the absorption column. Selexol is fed in at the top part of the column, and contacts the gas in a counter-current flow. To achieve a good Selexol distribution throughout the column and thus a large absorption area, the column is equipped with filling material and specially inserted elements that serve to absorb the Selexol and maintain a uniform distribution.

Biogas Processing Technology
46
The cleaned biogas leaves the absorber at the top end with a methane concentration >98 Vol.-%, a carbon dioxide concentration <2 Vol.-% and a hydrogen sulphide content <5 mg/m³. The methane losses in technical literature are reported as 6.5 Vol.-% [THEISSING 2006]. The absorption takes place at a temperature between 20-35°C; lower temperatures near 0°C are also possible . The solubility of acidic biogas components (H2S, CO2) are therefore increased. Based on the viscosity of the solvent agent and the associated increase in the circulation energy required, temperatures under 0°C are to be avoided.
The regeneration occurs similarly to the pressurized water wash. The fluid is transported into a first desorption column (the flash tank) where the pressure is lowered to 2-5 bar. Since small quantities of methane are present in the Selexol, the methane-rich gas that escapes is again supplied to the absorption process in order to further reduce the methane losses. In the second desorption column, where from atmospheric to a strong low pressure (200 mbar absolute) the remaining CO2 is removed. In a similar manner to the PWW process, air is blown into the desorber at the bottom, exits the top with the dissolved CO2, after an optional downstream desulphurisation, and is released into the environment. The desorption column, like the absorber column, is filled with a filling material with specialised inserts.
A problem with regeneration is the removal of hydrogen sulphide because it is unable to escape completely through pressure reduction and therefore it is not possible to achieve a proper cleanliness of the washing agent. Hydrogen sulphide behaves similarly to the other biogas components, such as NH3 and COS, in that it dissolves in the Selexol. What is seen as an advantage for absorption in terms of the solubility, is in fact a problem for regeneration. To remove these components in sufficient amounts, they must be heated to their flash points, which exist between 200 and 350°C – this heating presents a significant demand for high energy. The application of biogas with a high fraction of other components like hydrogen sulphide is only sensible if a prior desulphurisation has been done.
Advantages:
- A high cleaning efficiency of CO2 and H2S
- low washing agent demands
- a drying of the gas is possible
Disadvantages:
- high heating demand for the removal of H2S and other components from the washing solution
- an expensive chemical is necessary (Selexol)
- high disposal costs for Selexol
- relatively little experience with biogas
- high methane losses

Biogas Processing Technology
47
3.2.2.3 Amine Wash
The amine wash is a chemical absorption process. This type of process involves both the absorption of particular gas components and a chemical reaction with the washing agent. The amine wash increases the loading capacity and the achievable product gas purity than that achieved through pure physical washings alone. Common amine washing agents include mono- and diethanolamine (MEA, DEA), diglycolamine (DGA), disopropanolamine (DIPA) and methyldiethanolamine (MDEA). These substances have an amine group, as well as a hydroxyl group. The amine group exhibits alkaline material characteristics, making it possible to absorb acidic gas components. Thereafter there is a reaction with CO2 and H2S to form hydrogen carbonate and hydrosulphide. This chemical reaction is reversible, making a regeneration possible. The hydroxyl group, on the other hand, leads to increased water solubility characteristics, as well as to low vapour pressures. Therefore, amine washes are able to dehumidify gases. The general process sequence of an amine wash is illustrated in the following figure.
Figure 17: Biogas production by means of the Selexo l process [according to SGC 2001]
(A: desulphurization (recommended), B: gas cooler, C: water separation, D: compressor, E: absorption column, F: 1st desorption container (flash tank), G: 2nd desorption container (desorption column), H: Selexol pump, I: air input, K: desulphurization (bio-filter), L: cooler)

Biogas Processing Technology
48
Figure 18: Prinzipielles Verfahrensfließbild einer Aminwäsche [nach FIU 2005]
(a: absorber; b: solvent cooler; c: pump; d: heat exchanger; e: regenerator; f: condenser; g: evaporator; I: raw biogas; II: cleaned gas; III: exhaust gas; IV: amine solution)
The conditioned biogas (I) flows through the absorber (a), where it comes into contact with the amine solution (IV). The solution absorbs the CO2 and the cleaned biogas (II) then leaves the absorber. The loaded amine solution subsequently is passed through a heat exchanger (d) to a regenerator (e). Under reduced pressure and increased temperatures (>100°C) the dissolved g as are desorbed. Afterwards the produced exhaust gas (II) leaves the regenerator. The vapour, which is used to strip the solvent, is segregated within the condenser (f) and returned to the regeneration process. Subsequently an additional purification of the exhaust gas is normally carried out to wash out the contained solvent residue.
According to information from one supplier of biogas amine washers, they complete CO2 separation and, including regeneration, the process can be carried out at near zero pressure (100 mbar gauge pressure). Methane concentrations within the product gas up to 99.5 Vol.-%, and methane losses of 0.1 Vol.-% can be achieved.
Advantages:
- lower pressures are necessary (almost zero pressure)
- there is a high gas purity
- there are low methane losses
- a flexible operation is possible
I
III
IV

Biogas Processing Technology
49
Disadvantages:
- there are high waste disposal costs for the washing agent
- few reference systems with long-term operating experience of biogas systems
3.2.2.4 Membrane Separation Processes
The fundamental principle of membrane separation derives from the fact that some biogas components can diffuse through a thin membrane (few µm), whereas others will be retained. The transport of material is thereby strongly dependent on the permeability of the particular components. This separation procedure is brought about by a difference in pressure on both sides of the membrane. To achieve a high separation, the membrane selectivity and the difference in permeability of the materials must both be high. Based upon the fact that the permeability of CO2 is approximately 20 times higher than that of methane, and the permeability of H2S is approximately 60 times higher than that of methane, membrane separation of methane from both of these components is possible; water behaves in the same way, and has an even higher permeability than H2S.
Figure 19: Principle of separation by means of perm eation [ENERGIE SYSTEM 2006]
Alongside the process of desulphurisation, a simultaneous drying of the raw biogas is also possible. The separated components enter the permeate flow, whereas the pure gas (retent) with a high methane content exits the biogas system. In order to increase the final methane content within the product gas, either the system can be expanded, or the number of interconnected systems can be increased.

Biogas Processing Technology
50
Raw gas
Permeate Retent
Permeate
Raw gas
Retent One-step Process
Two-step Cascade with recirculation
Figure 20: Possible constructions for membrane sepa ration process [FIU 2005]
In practice, however, small quantities of methane are also transported through the membrane. The consequence of this is that, with an increased methane content in the product gas, the methane yield decreases due to increased methane losses. Therefore, a compromise must be achieved between the methane yield and the methane purity within the product gas. This effect is displayed in the following diagram.
Figure 21: Relationship between methane yield and m ethane purity in a series of connected membranes

Biogas Processing Technology
51
In the same way, the design of the system also has an effect on the separation capacity. These design factors include the module interconnection (in series or parallel and recirculation), the used biogas, as well as the pressure conditions (high pressure, vacuum, etc.). Generally, the system is comprised of a tube membrane (pipe, hollow fibre, capillary) or a planar membrane (flat-, sleeve-, or cushion module). Two operational modes are preferred for its application. One is a high-pressure process that operates at a pressure between 25-40 bar, and the other is a low-pressure process; these cause the separation through the use of specialised material and low-pressure.
Advantages:
- very simple construction
- simple, maintenance-free operation
Disadvantages:
- a high compression performance is necessary for the high-pressure process
- there are few systems reference for natural gas and biogas processing
- short membrane lifetime (approximately 3 years [FIU 2005])
- high methane losses
3.2.2.5 C02 Removal using a Cryogenic Process
Cryogenic processes for carbon dioxide separation are based upon the differing behaviour of individual gas components during cooling. In principle, two processing routes can be pursed. In one method, the separation can be undertaken by the means of gas liquefaction (rectification), whereby the gaseous CO2 is converted into the liquid phase, while the methane remains in the gaseous phase. Care must be taken that the temperature reduction does not fall as low as the solid-vapour area of the CO2-CH4 mixture because obstruction of the system due to icing can then occur. A second processing route is based on the freezing of carbon dioxide. This process is intentionally undertaken in the solid-vapour region of the CO2-CH4 mixture. Both processing routes can achieve very high methane yields (>98 Vol.-%), as well as end methane purities of up to 99.99 Vol.-%.
Figure 22: Membrane system [ENERGIESYSTEME 2006]

Biogas Processing Technology
52
In addition, a higher end purity of CO2 is also achieved, and so further useful commercial utilization of the CO2 appears to be reasonable.
The extremely high investment and operating costs are a disadvantage. During the operation, the primary costs are especially incurred during cooling and compression of the gases. Such a processing system is only economically viable if it is run at a volume flow rate of 500,000 m³/h. The cost for a processing system with less than 1000 m³/h is listed in technical literature [FIU 2005] to be between € 4 – 8 M.
Advantages:
- there is a high end purity for methane and CO2
- high methane yields
- commercially utilisable by-product (CO2)
Disadvantages:
- it is technically a very complex process
- no practical attempts for biogas (only pilot systems)
- very high investment and operating costs
3.3 Gas Compression Compaction
Gas compression is necessary in order to meet the pressure requirements of the natural gas grid into which the gas is supplied and to meet the operating requirements of the selected processing processes. For example, the PWW or the PSA requires a gauge pressure of approximately 15 bar, allowing a technically and economically optimal operating mode to be achieved.
Natural gas grids are separated into 4 pressure regions [CERBE 1999]: low-pressure, middle pressure, high pressure and maximum pressure. High pressure grids are again further divided into two regions. An overview of these pressure regions can be seen in the following table.

Biogas Processing Technology
53
Table 6: Pressure regions in the natural gas grid [ CERBE 1999]
Description Gauge pressure region [bar]
Low pressure < 0.1 (max. 0.12)
Middle pressure 0.1 – 1
High pressure (1) 1 – 4
High pressure (2) 4 – 16
Maximum pressure > 16
In principle, the processed biogas can be supplied into each pressure region; however, with pressure increase the result is also an increase in compression costs (system and operating costs).
Aside from the main components, like methane and carbon dioxide, biogas contains such aggressive components as hydrogen sulphide and it is therefore important to monitor the corrosion and deterioration behaviour of the compressor. It is for this reason that all compressors are not suitable for biogas, and individual tests with the desired gas composition is recommended. In the same way, oil-lubricated compressors can pass impurities into the biogas. Oil can be entrained in the biogas that will negatively affect the downstream processing procedure, such as activated carbon filtering, the molecular sieve, or the PSA. Alternatively, it is possible for the utilisation of dry running compressors that operate without the need for oil-lubrication. The disadvantages of this form of compressors are the high gas losses and the material abrasion that can cause impurities to enter the gas. Attention, however, will have to paid to this during the compression of the saturated water vapour gases as condensate will form and this must be separated. This effect will be magnified if the compressor is cooled during the operation.

Biogas Processing Technology
54
3.4 Gas Drying dehydration
The biogas produced in a fermenter has a relative gas humidity of 100%. To avoid the corrosion caused by the accumulated condensate in downstream system components, it is recommended to carry out a dehumidification step. This is very important because the dissolved biogas components, such as CO2 and H2S, which are contained within the condensed water strongly enhance corrosion. Some conditioning processes, like pressure swing adsorption, require a low moisture content to allow an optimal operating behaviour. Aside from these technical reasons for gas dehumidification, there are also DVGW-regulations for the supply of biogas into the natural gas grid to be considered. Process sheets G 260 and G 262 state that prior to the supply of a gas, a water dew point - which is dependent on the respective line pressure and must be below the ground temperature (normally 4°C) of the distribution network - is required. In addition, a relative humidity of 60% should not be exceeded. Gas drying can be undertaken by means of adsorption, absorption or condensation drying.
3.4.1 Adsorption Drying
This gas drying process utilises the adsorptive characteristics of silica gel, aluminium oxide, and molecular sieves (man-made zeolite). These products are offered in the form of granules and balls.
In comparison with the two other adsorption agents, molecular sieves have precisely defined holes within their crystal lattice. The structure of this crystal lattice allows a higher selectivity in adsorption behaviour, and it makes it possible to achieve a lower water content in the gas. It is also possible to obtain dew point temperatures as low as -90°C. A disadvantage is the higher regeneration complexity in comparison to silica gel.
Due to its high loading capacity, Silica gel is suited for the drying of moist gases. The obtainable dew point temperature is situated about -60°C. The adsorption process must occur at ambient temperature and at a pressure lying between 6 - 10 bar, some models, however, in principle, require only a few bar gauge pressures. These measures, however, double the acquisition costs, at least, and the operating cost is between eight and nine times higher [SILICA 2007b], and therefore from an economical standpoint they are rarely employed.
Figure 23: Molecular sieve

Biogas Processing Technology
55
After the adsorption process, a regeneration is carried out where the water that has been taken up by the silica gel is then released again. The regeneration is undertaken under reduced pressure, and if need be, within an evacuated space. Additionally a rinsing by gas (a rinse gas) can take place. As a rinse gas, a component current of the dry gas is used, that flows counter-currently through the adsorber. The consequently moist rinse gas is often thereafter discarded and not reintroduced into the cycle again. In practice, cold (without heating of the rinse gas), and warm (temperature between 120-150°C) regenerati on processes are used. For a continuous operation, at least two adsorbers are necessary, which are alternately loaded and regenerated. The following graph shows the water adsorption capacity and the inner surface areas of the considered adsorbers.
Adsorber Inner Surface Area [m²/g]
Aluminium oxide 360 Silica gel 800 Molecular sieve 1,100
Figure 24: Water loading and inner surface area of several adsorption agents [SILICA 2007a]
Biogas Processing Technology
56
3.4.2 Absorption Drying
One of the most common absorptive drying processes is the glycol wash. Using triethylene as the absorber, with a pressure of between 20-40 bar, and an ambient temperature, both water vapour and higher hydrocarbons are physically absorbed from the raw biogas volume flow and a dew point as low as -100°C can be achieved. The necessary subsequent regeneration is completed at a temperature of 200°C [WEILAND 2003].
In a similar fashion to many other absorptive drying processes, this process, due to the high cost of the apparatus, must have a volume flow capacity above 10,000 m³/h in order to operate economically. Further consideration of these processes for biogas drying will therefore not be provided.
3.4.3 Condensation Drying
This technology is grounded upon a cooling procedure of the gas to be dried. By bringing the temperature below the water dew point, condensate forms, which is subsequently separated. The necessary low temperature is often provided by cold water. Typically, only dew points between 0.5 - 1°C can be realised, however through a prior gas compression (before the cooling), the dew point can be further reduced. From a technical perspective, this drying process is advantageous because it reliably reduces and/or prevents corrosion in downstream system components by condensation.

Biogas Supply Technology
57
4 Biogas Supply Technology
For the supply of processed biogas, further technical facilities are necessary. For the utilisation of biomethane as an exchange gas, aside from caloric value and gas composition measurements, an odourisation, a gas pressure regulation and a measurement system are required. It is also possible that a caloric value adjustment (conditioning), as well as an additional re-compression will also be required. For the utilisation of biomethane as an additional gas, an odourisation is often not applicable. However, an additional gas mixer will also be necessary in which the biomethane is mixed with the gas flow in the adjacent grid. For both supply options, the necessary pipeline construction and pipeline access to the gas grids are the same.
4.1 Conditioning Systems plant, facility
An adjustment and/or modification of the caloric characteristics of biomethane will be necessary for the utilisation of exchange gas, if the caloric characteristics differs from the specifications of the grid in question. Through additions of air and/or LPG, the Wobbe-index, the calorific value, as well as the relative density of the biomethane can be matched to the respective conditions of the grid in to which it will be supplied.
LPG-conditioning systems are comprised of a mixer (supplier), a measurement and regulation line, and a liquid gas storage container. For conditioning systems using air, a mixer, a compressed air generator, as well as measurement and regulation equipment are necessary.
4.2 Mixing Systems
For the supply of biomethane as additional gas, mixing equipment is a necessity. This mixing equipment is designed so that a good blending of the biomethane with the grid-side natural gas can be ensured.

Biogas Supply Technology
58
4.3 Gas Pressure Measurement and Regulation Systems
Gas pressure measurement and regulation systems are technical equipment units for the technical measurement of the gas (gas measurement system, in short GMS) and the regulation of its pressure. GPRSs (gas pressure regulation systems, in short GPRSs) are often situated at the interfaces of the different grid line sections where the volume flow rate and the gas pressure can be confined and regulated. The often fluctuating pressure at the entry point is eased to a lower, constant exit pressure. Additionally, the gas pressure regulation system comprises security facilities within the downstream grid in order to protect against unreliable operating pressures. Depending on the operating requirements, shut-off valves, pipelines, monitoring equipment, filters, separators, equipment for hindering hydrate formation and freezing, gas pre-heaters and noise control equipment can be included [G 491]. A schematic representation of the layout of a gas pressure regulation system, in combination with a gas meter, is illustrated in the following figure.
Figure 25: A detailed example of the layout of a ga s pressure regulation system in combination with a gas meter [G 491]
1 Shut-off control 2 Insulation connection 3 Filter/ Separator 4 Gas pre-heater 5 Security shut-off valve
6 Gas pressure regulator 7 Sound dampener 8 Gas meter 9 Safety let-off device for gas leaks

Biogas Supply Technology
59
4.4 Gas Composition Measurement System
The gas composition measurement system should be separated from the gas pressure measurement and regulation system. The task of this technical system is to collect information about the calorific value, the heating value, the density, the Wobbe-index and the composition of the gas. When the composition of the gas within the system is read, the fractions of methane, carbon dioxide, oxygen, the sulphur components should all be read, as well as any other accompanying substances. In the same way, the water dew point and the hydrocarbon-condensation point can be determined. Depending on the application, either all or some of the aforementioned characteristics can be ascertained.
The determination of the gas composition is of vital importance. This is for two reasons: to receive legal certification the introduced biomethane must meet the respective compositional specifications (i.e. G 260) and to take control of a possibly already existing gas conditioning system. Additionally, a calculation of the calorific value is of importance for the gas billing procedure (G 685).
The measuring equipment employed include gas chromatographers, calorimeters, dew point reflectors, moisture sensors, as well as other various individual measuring instruments (i.e. H2 and O2 sensors). For the utilised gas billing procedure, the gas measuring equipment must have a specialised accreditation (calibration authority, the National Metrology Institute). The technical guideline G 14 – “Measurement equipment for gas” from the National Metrology Institute, is to be followed.
One combination of the testing and measurement processes is further provided in G 261 (“Testing of gas composition”) and G 488 (“Systems for the measurement of gas composition – Planning, Installation, Operation”). Additionally consideration should be paid to, DIN EN ISO 13686 “Natural gas composition determination.”
4.5 Odour Control System
A simple method that is available in order to identify a natural gas leak within the public gas supply is to give the odourless natural gas a smell. This is also applicable for the supply of biomethane into the natural grid. If the gas is not supplied directly to the final customer a process of odourisation is also therefore not inapplicable; there would only be a case of odourisation, therefore, if the biomethane is fed into the national gas grid as an exchange gas. The basic components of any odorising system will consist of an odorising agent container, a doser-pump, an inoculation nozzle, as well as measurement and control technology. An example layout of an inoculation nozzle can be seen in the following image.

Biogas Supply Technology
60
Figure 26: Example of the construction of an inocul ation nozzle [G 280-1]
G 280-1 and G 281 regulate the requirements of the odouriser system and the odouriser agent. Odorising agents can be divided into two types: those that are sulphur-based, such as tetrahydrothophene (THT), or those that are sulphur-free, such as those that are acrylate based. Both of these types have in common high odour intensity and therefore warning properties. In G 280-1, the minimal odouriser agent concentration (per volume of gas) is specified. In practice, however, often two to three times as much odouriser is added to the gas. Historically, THT-concentrations within the Mosel-Eifel region of Germany were as high as 27 mg/m³ [GWF 2005]. While in comparison - according to DVGW-regulation G 280-1 - in the end consumption gas grid, a minimal odorising agent concentration for THT of 10 mg/m³ is actually required.
4.6 Natural Gas Grid Connection
To supply the natural gas grid, a connecting line and a connection point are required. Since the pressure loss in the short connection line is negligible, it can be assumed that these access lines are constructed for higher flow rates. It is important for the supply that the connection pressure is always higher than the pressure in the line concerned so that a back flow of gas into the biogas processing and supply systems can be avoided.

Procedural Routes for Biogas Processing and Biogas Supply
61
5 Procedural Routes for Biogas Processing and Biogas Supply
In principal, the biogas can be supplied into the natural gas grid as either an additional gas or an exchange gas. The relative quality of the gas is outlined by different requirements. The result of this factor is that the processing route for each type of gas significantly differs. The following sections outline and explain the possible production routes.
5.1 Processing a High Quality Exchange Gas from Biogas substitute
In order to be able to input raw biogas as an exchange gas into the gas grid, it must comply with certain specific requirements [i.e. G 260, G 262]. Consequently, the adherence to such requirements means that a desulphurisation stage, a drying stage, a carbon dioxide removal stage, and possibly a Wobbe-Index adjustment must be carried out. The respective technical sequence and method for implementing these processing steps is however quite different and often depends in large part upon the type of carbon dioxide separation process.
In practice, pressurised water washes and pressure-swing adsorptions are the most commonly used, though de-pressured amine washing is becoming increasingly popular. A cost-comparison for these three aforementioned technologies only takes place because the operating and information costs can be realistically and easily determined. It is the case that all three of the applicable processes are either not able or are only slightly able to separate the oxygen and nitrogen that is contained within the biogas. Therefore, it is important that the entrainment of such components into the processed biogas be kept to a minimum – any failure to monitor the composition of the biogas may result in a violation of the supply requirements (DVGW-Process Sheets). This is all the more important because, through the removal of CO2, the relative fraction of the irremovable components that remain within the biogas increases, and thus the supply into a gas grid with higher caloric content is made either difficult or impossible. Additionally, a high inert gas fraction serves to increase the conditioning costs by increasing the required heating value and consequently, for economical reasons, it is therefore not beneficial. A high air input should generally therefore be avoided. A selection of specific processing technology has evolved from the nature of these requirements. It is therefore critical to monitor the internal biological desulphurisation because it is through this technology that especially high air intakes into the biogas are to be expected. Similarly, one must also watch for the same occurrence within the trickle-bed-reactor system, especially when the raw biogas has already high air fractions.

Procedural Routes for Biogas Processing and Biogas Supply
62
5.1.1 Pressure Swing Adsorption Processing
For pressure swing adsorption (PSA) it is necessary that the biogas has a minimal fraction of impurities, such as hydrogen sulphide (H2S), in order to ensure that the adsorbers have a long operating life-time. For all biogas with a high hydrogen sulphide loading, a prior desulphurisation, consisting of a two-stage main and fine desulphurisation is necessary. The aim for a maximal hydrogen sulphide (H2S) content is less than 5 mg/m3 in order to strain a pressure swing adsorption system as little as possible, and to meet the regulations of the DVGW. The drying of the water vapour saturated biogas is also very critical. A pre-drying of the biogas, due to it being saturated by water vapour, is required in order to avoid a quick loading of the adsorbers with water and a thereafter resulting loss of performance in the CO2 adsorption rate. The pre-drying is undertaken by means of a condensation dryer. The dew point attained should be between 5°C and 15°C ( 10°C is most often attained). Another important component in the processing route is a compressor, which increases the gas pressure from 6-10 bar. In the compressor, the gas is heated and it is therefore recommended that the compressor be run cooled in order to have an additional gas cooling in case there is an insufficient cooling performance. This cooling must be carried out because the biogas needs to enter the PSA with a low temperature. Furthermore, it is recommended that a protective filter (e.g. activated carbon) be installed. This filter has the task of removing such unwanted biogas constituents as Siloxane, upper hydrocarbons, oil droplets, and dust in order to protect the PSA process. The deterioration of the molecular sieves within the PSA requires that they be changed simultaneously with the protective filters. This is due to the fact that the PSA system has the capacity to separate H2O from the gas flow and therefore a deep drying is carried out in parallel with the CO2 separation. Water dew points may reach as low as -40°C and thus an ad ditional gas drying is not necessary. The generated biomethane is now able to be supplied into the gas grid. A route for biogas processing with exchange gas quality is shown in the following diagram.
Figure 27: Pressure swing adsorption flow diagram
Procedural Routes for Biogas Processing and Biogas Supply
63
5.1.2 Pressurised Water Wash Processing
In a similar manner to the processing route of PSA, raw biogas can be refined to a natural gas-H or to a natural gas- L quality through the aid of a pressurised water washing. The requirements of the pressurised water wash (PWW), in regard to the biogas, are less in comparison to that of the PSA technique. A prior desulphurisation is unnecessary as this can, in principal, be undertaken by a pressurised water washing. To guarantee that the biogas exits the system there has to be a typical hydrogen sulphide (H2S) concentration less than 5 mg/m3 and thus in compliance with the DVGW regulations a main desulphurisation is recommended for hydrogen sulphide concentrations that are greater than 300 mg/m³. The theoretical processing route begins with an optional main desulphurisation, followed by a compression step and a pressurised water wash step, and ends with a gas drying step. It is important that during the drying of the gas that the dew point of the gas be lowered and, therefore, a condensation drying is not by itself adequate. Adsorption dryers are frequently used because they are effective at achieving very low dew points. From a safety point of view, the processed biomethane should pass through an additional fine desulphurisation filter to ensure the definite removal of any remaining H2S fractions, thus ensuring a maximum H2S content of 5mg/m3. One issue with the processing route, as described, is the conditioning of the CO2 that and H2S enriched exhaust gas produced by the pressurised water wash stage. The composition of the gas in the systems that require official approval for their operation, is that it must not violate the emission regulation guidelines outlined by the Technical Code of Practice of Air Purification. This code of practice dictates that the maximum H2S concentration in the exhaust gas cannot exceed 3mg/m3 but because the exhaust gas contains the H2S of the biogas a desulphurisation is necessary at this point. The desulphurisation of the exhaust gas can be undertaken in two steps depending upon the hydrogen sulphide, the first being a main desulphurisation which is followed by a fine desulphurisation.
One question worth considering is whether a downstream fine desulphurisation is necessary, because a prior main desulphurisation of the raw biogas has already been conducted, followed by another fine desulphurisation of the processed biomethane. It might be worth considering carrying out the desulphurisation of the raw biogas analogously to the PSA processing route from the beginning, using the same desulphurisation regulations of the DVGW and Technical Code of Practice of Air Purification. Discussions with several PWW system manufacturers have shown that this issue is carried out in different ways. Many factors play apart. The most important criteria is the average H2S content of the raw biogas, which is strongly dependent upon the deployed substrate, the reliability of the system, and whether or not the system is subject to any emission regulation guidelines. The following diagram illustrates the previously described processing route.

Procedural Routes for Biogas Processing and Biogas Supply
64
Figure 28: Pressurised water wash process flow diag ram
5.1.3 Pressure-less Amine-Water Wash Processing
The information obtained from amine wash system manufacturers demonstrates that the processing of raw biogas begins with a desulphurisation – a fine desulphurisation and an optional main desulphurisation are carried out. Following this desulphurisation is a pressure-less amine wash, a CO2 removal step, and finally there is a drying step. Due to the fact that the biogas should have a low water dew point, a dehumidification step (undertaken in an adsorption dryer) is inconsequence often undertaken. These require, as described in the above text, higher pressures and therefore a prior compression is necessary to achieve this fact. The exhaust gas that is released from the CO2 separation is very low in hydrogen sulphide concentration due to the prior desulphurisation and is generally therefore discharged into the environment.
The following diagram illustrates a simplified version of the process route prior to the moment of CO2 removal.
Raw biogas
Product gas
Input air
Pump
Compression
Exhaust gas
(CO2-rich)
Desulphurisation (optional)
Dry ing
Des
orpt
ion
1
Des
orpt
ion
2
PWW

Procedural Routes for Biogas Processing and Biogas Supply
65
Figure 29: Pressure less amine water wash process f low diagram (E=heat exchanger, P=pump, F=separator/reactor) [MT-ENERGIE]
5.2 The Supply of the Processed Biogas as an Exchange Gas
In order to be supplied into the adjacent gas grid the processed biogas must have a higher pressure than its gas. Regardless as to which of the three biogas processing techniques has been employed the biomethane leaves the process with a gauge pressure and therefore an additional recompression stage is only required if the grid pressure is higher than that of the processing pressure. Often, an additional calorific value adjustment to the conditions of the local adjacent grid (L- or H- gas area) is necessary. As mentioned previously, the adjustment of the calorific value can be carried out through the addition of air (to decrease the calorific value) or through the addition of LPG (to increase the calorific value). Thereafter measurements of the gas composition, the calorific value, and the gas volume have to take place, according to the specifications of the responsible calibration authority. In the same way an odourisation and, by means of a gas pressure regulation system, a pressure adjustment needs to be carried out. Accordingly, safety facilities (i.e. shut-off system) need to be installed to ensure that, on one hand, the operational safety of the system is realised, and that on the other hand, to avoid a reverse flow of the gas back into the processing and supply systems.
The following diagram illustrates the described processing and feed-in possibility.

Procedural Routes for Biogas Processing and Biogas Supply
66
Figure 30: Biogasaufbereitung und -einspeisung als Austauschgas

Procedural Routes for Biogas Processing and Biogas Supply
67
5.3 Processing an Additional Gas from Biogas
Biogas processing to yield additional gas quality is in contrast with the processing required to obtain exchange gas quality both significantly shorter and not as complex. The supply is, however, only permissible under certain conditions. The supply of additional gas as a mixed gas (original gas + additional gas = mixed gas) occurs to gas that has had its combustion characteristics altered when compared to that of the original base gas. The resulting mixed gas must be able to meet the gas composition regulations of the DVGW (see chapter relating to gas quality targets). The gas must also be able to meet the process sheet requirements G 685 (gas billing procedure) which state that the maximum calorific value fluctuations of the gas cannot exceed 1.5-2% (depending upon the billing technique). It is evident that a (partial) raw biogas processing must take place, however, it does not need be as complex as the processing that is in place for the supply of biogas as an exchange gas. These requirements also imply that indefinite amounts of additional gas cannot be added to the original gas. The supply of an additional gas must always occur at a minimum flow rate of the gas grid. This is all the more important because biogas production is virtually independent of the seasons and constant over the whole year, while the volume flow rate of the gas grid fluctuates drastically according to the season. The supply of additional gas does not have the potential to occur everywhere. Therefore, the emergence of an additional gas supply is likely in high-pressure gas grids and is more possible in middle-pressure gas grids, but is unlikely for low-pressure grids. A precise assessment of the particular situation will be strongly dependent upon the nature of the conditions which surround the grid in question (for example, its grid construction, grid consumption structure and gas quality) and this requires closer cooperation to be initiated with the grid operators.
In general, for additional gas processing the following steps are important. Firstly there is a desulphurisation of the biogas (to a minimum of 5mg/m3), then a drying and compression takes place. The desulphurisation can be carried out in two separate steps (a main and fine desulphurisation), which is recommended for those biogas’ with high H2S concentrations, if an economical rational is used. It needs to be ensured that the compression step occurs at pressures that are higher than the highest operating pressure of the respective gas grid. The actual drying cost is principally dependent on the respective grid operator, whom is in turn responsible for the selection of the water dew point of the additional gas. A potential process flow diagram for the processing of biogas for additional gas-quality is illustrated in the following figure.

Procedural Routes for Biogas Processing and Biogas Supply
68
Figure 31: Processing biogas to obtain additional g as
5.4 Supply of Processed Biogas as an Additional Gas
Just as in its processing, the supply of the additional gas is less complex and costly in comparison to that of an exchange gas. The supply begins with an additional recompression of the gas, which is necessary if the respective grid pressure is greater than the processing pressure, and is followed by a gas composition measurement (it is possible to determine the calorific value of the gas) and a gas volume measurement. In addition, a gas pressure regulation system, a pipeline and an associated line connection are all necessary. Another necessary component, that ensures that the supply of the additional gas is possible, is a gas mixer, which is essential to complete a proper mixing of the additional gas with the original gas. An odourisation of the gas just prior to its supply into the end consumption grid is required if it is not possible to ensure that a minimum concentration of the odouriser agent is in the mixed gas (G 280). Based on the fact that additional gas supply occurs most often into grids with high minimum volume flow rates, the importance of additional odourisation is often not stated. In such grids, the change in odouriser agent concentration is quite low and the DVGW requirements can still be circumvented. Furthermore, odouriser additions are rarely made in those cases where there is a supply into a high-pressure grid because such additions are often undertaken on one side of the grid on a downstream grid level.
It is for these reasons that I have disregarded in this analysis an odourisation during additional gas processing. Further components of a supply system are security and shut-off facilities, and these ensure a safe operation of the overall system and avoid gas flow backs from the grid itself into the system.

Procedural Routes for Biogas Processing and Biogas Supply
69
In the following diagram the steps that are required for of the additional gas processing and supply are briefly shown.
Figure 32: Biogas processing and supply as an addit ional gas
Gas
sup
ply
Gas
P
roce
ssin
g
Main desulphurisation (if needed )
Fine desulphurisation
Drying
Recompression (possibly)
Gas Pressure Regulation System
Component Measurement
Raw biogas
Line Net Access
Compression (cooling)
Gas Mixer

Appendix
70
Appendix
Appendix A: Costs of the Biogas Generation.................................................................71
Appendix B: Costs of the Main Desulphurisation...........................................................72
Appendix C: Costs of the Fine Desulphurisation ...........................................................73
Appendix D: Costs of the CO2 Separation ....................................................................75
Appendix E: Costs of the Gas Drying ............................................................................76
Appendix F: Costs of the Gas Compression..................................................................77
Appendix G: Costs of the Air Conditioning ....................................................................78
Appendix H: Costs of the Measurement of Calorific Value ............................................79
Appendix I: Costs of the Measurement of the Composition...........................................80
Appendix J: Costs of the Gas Odourization...................................................................81
Appendix K: Costs of the Gas Pressure Regulation System .........................................82
Appendix L: Costs of the Gas Mixture (at Additional Gas Feed-in)................................83
Appendix M: Costs for the Pipeline Access ...................................................................84
Appendix N: Costs for the Pipeline Construction (Averages, Estimates).......................85
Appendix O: Investment and Operating Costs of a CHP ...............................................86

Appendix
71
Appendix A: Costs of the Biogas Generation
Substrate
Raw Biogas Volume Flow[Nm³/h]
Sum Investment Costs
Sum Operating Costs[/a]
Maintenance Costs
Operating Material
Personnel Costs
Miscellaneous
Data Origin
Liqu
id M
anur
e50
345,
800
€
85,3
20 €
5,20
0 €
51,2
20 €
27
,000
€
1,90
0 €
FIU
200
5Li
quid
Man
ure
250
1,21
2,76
0 €
293,
440
€
13,8
90 €
233,
950
€
39,8
00 €
5,
800
€
FI
U 2
005
Liqu
id M
anur
e50
02,
119,
100
€
57
7,29
0 €
22
,420
€
44
9,27
0 €
95
,000
€
10,6
00 €
FIU
200
5Li
quid
Man
ure
750
3,17
8,65
0 €
865,
935
€
33,6
30 €
67
3,90
5 €
142,
500
€
15
,900
€
own
estim
ate
Liqu
id M
anur
e10
004,
238,
200
€
1,
154,
580
€
44
,840
€
898,
540
€
19
0,00
0 €
21,2
00 €
ow
n es
timat
eR
enew
able
Prim
ary
Pro
duct
s50
358,
970
€
129,
530
€
4,52
0 €
88,3
10 €
34
,900
€
1,80
0 €
FIU
200
5R
enew
able
Prim
ary
Pro
duct
s25
01,
120,
900
€
51
0,36
0 €
10
,950
€
41
5,91
0 €
78
,000
€
5,50
0 €
FIU
200
5R
enew
able
Prim
ary
Pro
duct
s50
02,
180,
250
€
98
2,58
0 €
20
,460
€
82
7,12
0 €
12
4,50
0 €
10,5
00 €
FIU
200
5R
enew
able
Prim
ary
Pro
duct
s75
03,
270,
375
€
1,
473,
870
€
30
,690
€
1,24
0,68
0 €
18
6,75
0 €
15,7
50 €
ow
n es
timat
eR
enew
able
Prim
ary
Pro
duct
s10
004,
360,
500
€
1,
965,
160
€
40
,920
€
1,65
4,24
0 €
24
9,00
0 €
21,0
00 €
ow
n es
timat
e

Appendix
72
Appendix B: Costs of the Main Desulphurisation
Company
Main Desulphurisation Type
Biogas Volume Flow [Nm³/h]
Sum Investment Costs
Sum Operating Costs [/a]
Maintenance Costs
Operating Material
Electricity Costs
Personnel Costs
Notes
Sup
plie
r 1S
ulph
ide
Pre
cipi
tatio
n50
28,5
796,
961
€97
0 €
4,63
6 €
249
€1,
106
€S
uppl
ier 1
Sul
phid
e P
reci
pita
tion
250
71,1
5828
,002
€2,
470
€23
,182
€1,
244
€1,
106
€S
uppl
ier 1
Sul
phid
e P
reci
pita
tion
500
71,1
5852
,428
€2,
470
€46
,364
€2,
489
€1,
106
€S
uppl
ier 1
Sul
phid
e P
reci
pita
tion
750
71,1
5876
,855
€2,
470
€69
,546
€3,
733
€1,
106
€S
uppl
ier 1
Sul
phid
e P
reci
pita
tion
1000
71,1
5710
1,28
1 €
2,47
0 €
92,7
28 €
4,97
7 €
1,10
6 €
Sup
plie
r 2Tr
ickl
e B
ed R
eact
or S
yste
m50
33,9
001,
900
€67
8 €
87 €
221
€91
4 €
Sup
plie
r 2Tr
ickl
e B
ed R
eact
or S
yste
m25
043
,900
3,33
2 €87
8 €
433
€1,
106
€91
4 €
Sup
plie
r 2Tr
ickl
e B
ed R
eact
or S
yste
m50
050
,400
5,00
1 €1,
008
€86
7 €
2,21
2 €
914
€S
uppl
ier 2
Tric
kle
Bed
Rea
ctor
Sys
tem
750
58,5
006,
702 €
1,17
0 €
1,30
0 €
3,31
8 €
914
€S
uppl
ier 2
Tric
kle
Bed
Rea
ctor
Sys
tem
1000
67,4
678,
421
€1,
349
€1,
733
€4,
424
€91
4 €
own
estim
ate
Sup
plie
r 3Tr
ickl
e B
ed R
eact
or S
yste
m50
33,0
001,
886
€66
0 €
87 €
31 €
1,10
9 €
Sup
plie
r 3Tr
ickl
e B
ed R
eact
or S
yste
m25
062
,000
2,93
5 €1,
240
€43
3 €
153
€1,
109
€S
uppl
ier 3
Tric
kle
Bed
Rea
ctor
Sys
tem
500
90,0
004,
082 €
1,80
0 €
867
€30
7 €
1,10
9 €
Sup
plie
r 3Tr
ickl
e B
ed R
eact
or S
yste
m75
010
5,00
04,
969
€2,
100
€1,
300
€46
0 €
1,10
9 €
Sup
plie
r 3Tr
ickl
e B
ed R
eact
or S
yste
m10
0013
5,59
86,
168
€2,
712
€1,
733
€61
4 €
1,10
9 €
own
estim
ate
Sup
plie
r 4Tr
ickl
e B
ed R
eact
or S
yste
m25
047
,000
3,09
2 €94
0 €
433
€99
5 €
723
€S
uppl
ier 4
Tric
kle
Bed
Rea
ctor
Sys
tem
500
82,5
004,
235 €
1,65
0 €
867
€99
5 €
723
€S
uppl
ier 5
Bio
-was
her
5010
5,22
612
,710
€2,
898
€1,
200
€2,
787
€5,
825
€S
uppl
ier 5
Bio
-was
her
250
105,
226
17,2
39 €
2,89
8 €
4,80
0 €
3,71
6 €
5,82
5 €
Sup
plie
r 5B
io-w
ashe
r50
011
4,05
426
,292
€2,
898
€10
,800
€6,
769
€5,
825
€S
uppl
ier 5
Bio
-was
her
750
130,
904
26,9
82 €
2,89
8 €
10,2
96 €
7,96
3 €
5,82
5 €
Sup
plie
r 5B
io-w
ashe
r10
0013
3,35
431
,606
€2,
898
€14
,256
€8,
627
€5,
825
€

Appendix
73
Appendix C: Costs of the Fine Desulphurisation
Com
pany
max
imal
In
com
ing
Bio
gas
Vol
ume
Flo
w
[Nm
³/h]
Sum
Inve
stm
ent
Cos
ts
Not
es
Supplier 6 25 2,000 € Supplier 6 50 3,500 € Supplier 6 125 13,000 € Supplier 6 250 13,000 € Supplier 6 375 13,000 € Supplier 6 500 26,000 € 2 Adsorber Supplier 6 750 48,000 € 3 Adsorber Supplier 6 1000 64,000 € 4 Adsorber Supplier 7 25 2,150 € Supplier 7 50 2,150 € Supplier 7 125 2,150 € Supplier 7 250 2,150 € Supplier 7 375 2,150 € Supplier 7 500 2,150 € Supplier 7 750 4,300 € 2 Adsorber Supplier 7 1000 4,300 € 2 Adsorber Supplier 7 25 10,600 € Supplier 7 50 10,600 € Supplier 7 125 10,600 € Supplier 7 250 10,600 € Supplier 7 375 10,600 € Supplier 7 500 10,600 € Supplier 7 750 21,200 € 2 Adsorber Supplier 7 1000 21,200 € 2 Adsorber Supplier 8 25 1,150 € Supplier 8 50 1,150 € Supplier 8 125 1,150 € Supplier 8 250 1,150 € Supplier 8 375 2,300 € 2 Adsorber Supplier 8 500 2,300 € 2 Adsorber Supplier 8 750 3,450 € 3 Adsorber Supplier 8 1000 4,600 € 4 Adsorber Supplier 9 25 19,800 €

Appendix
74
Com
pany
max
imal
In
com
ing
Bio
gas
Vol
ume
Flo
w
[Nm
³/h]
Sum
Inve
stm
ent
Cos
ts
Not
es
Supplier 9 50 19,800 € Supplier 9 125 29,800 € Supplier 9 250 29,800 € Supplier 9 375 39,800 € Supplier 9 500 39,800 € Supplier 9 750 39,800 € Supplier 9 1000 79,600 €

Appendix
75
Appendix D: Costs of the CO2 Separation
Company
Separation Type
Incoming Biogas Volume Flow [Nm³/h]
Sum Investment Costs
Sum Operating Costs [/a]
Maintenance Costs
Operating Material
Electricity Costs
Personnel Costs
Notes
Su
pplie
r 1
2P
ress
ure
Sw
ing
Ads
orpt
ion
5059
0,00
057
,938
€18,0
00 €
0 €
35,8
34 €
4,1
03 €
ow
n e
stim
ate
Su
pplie
r 1
2P
ress
ure
Sw
ing
Ad
sorp
tion
100
590,
000
57,9
38
€18,0
00 €
0 €
35,8
34 €
4,1
03 €
Su
pplie
r 1
2P
ress
ure
Sw
ing
Ad
sorp
tion
250
840,
000
112,
371
€22,0
00 €
0 €
86,2
68 €
4,1
03 €
Su
pplie
r 1
2P
ress
ure
Sw
ing
Ad
sorp
tion
500
1,04
5,00
019
6,0
03 €
26,0
00 €
0 €
16
5,9
00 €
4,1
03 €
Su
pplie
r 1
2P
ress
ure
Sw
ing
Ad
sorp
tion
750
1,19
5,00
027
8,6
35 €
29,0
00 €
0 €
24
5,5
32 €
4,1
03 €
Su
pplie
r 1
2P
ress
ure
Sw
ing
Ad
sorp
tion
100
01,
350,
000
354,6
31 €
32,0
00 €
0 €
31
8,5
28 €
4,1
03 €
Su
pplie
r 1
3A
min
e W
ash
(u
npr
ess
uris
ed)
5042
6,93
218
,84
1 €
7,7
64 €
3,3
48
€3,8
49 €
3,8
80 €
ow
n e
stim
ate
Su
pplie
r 1
3A
min
e W
ash
(u
np
ress
uris
ed)
250
578,
774
53,007
€18,6
50 €
11,2
33
€1
9,2
44 €
3,8
80 €
Su
pplie
r 1
3A
min
e W
ash
(u
np
ress
uris
ed)
500
758,
266
92,519
€30,6
50 €
19,5
00
€3
8,4
89 €
3,8
80 €
Su
pplie
r 1
3A
min
e W
ash
(u
npr
ess
uris
ed)
750
948,
754
135,
439
€44,3
65 €
29,4
62
€5
7,7
33 €
3,8
80 €
ow
n e
stim
ate
Su
pplie
r 1
3A
min
e W
ash
(u
np
ress
uris
ed)
100
01,
136,
496
177
,508
€57,6
50 €
39,0
00
€7
6,9
78 €
3,8
80 €
Su
pplie
r 1
4P
ress
uriz
ed
Wat
er
Was
h50
595,
526
59,0
55 €1
6,7
75 €
0 €
38,4
00 €
3,8
80 €
ow
n e
stim
ate
Su
pplie
r 1
4P
ress
uriz
ed W
ate
r W
ash
100
553,
900
85,8
70 €
15,6
30 €
0 €
66,3
60 €
3,8
80 €
Su
pplie
r 1
4P
ress
uriz
ed W
ate
r W
ash
200
699,
900
118,
023
€
19,5
80 €
0 €
94,5
63 €
3,8
80 €
Su
pplie
r 1
4P
ress
uriz
ed
Wat
er
Was
h25
071
1,95
414
0,8
36
€19,3
35 €
0 €
98,2
04 €
3,8
80 €
ow
n e
stim
ate
Su
pplie
r 1
4P
ress
uriz
ed W
ate
r W
ash
400
881,
100
140,
836
€
22,9
00 €
0 €
11
4,0
56 €
3,8
80 €
Su
pplie
r 1
4P
ress
uriz
ed
Wat
er
Was
h50
085
7,48
922
8,9
14
€22,5
34 €
0 €
17
2,9
58 €
3,8
80 €
ow
n e
stim
ate
Su
pplie
r 1
4P
ress
uriz
ed W
ate
r W
ash
600
901,
100
228,
914
€
23,3
00 €
0 €
20
1,7
34 €
3,8
80 €
Su
pplie
r 1
4P
ress
uriz
ed
Wat
er
Was
h75
01,
003,
024
516,
77
2 €
25,7
34 €
0 €
24
7,7
13 €
3,8
80 €
ow
n e
stim
ate
Su
pplie
r 1
4P
ress
uriz
ed
Wat
er
Was
h10
001,
148,
559
516,
772
€28,9
33 €
0 €
32
2,4
67 €
3,8
80 €
ow
n e
stim
ate
Su
pplie
r 1
4P
ress
uriz
ed W
ate
r W
ash
150
01,
426,
100
516,
772
€35,1
00 €
0 €
47
7,7
92 €
3,8
80 €
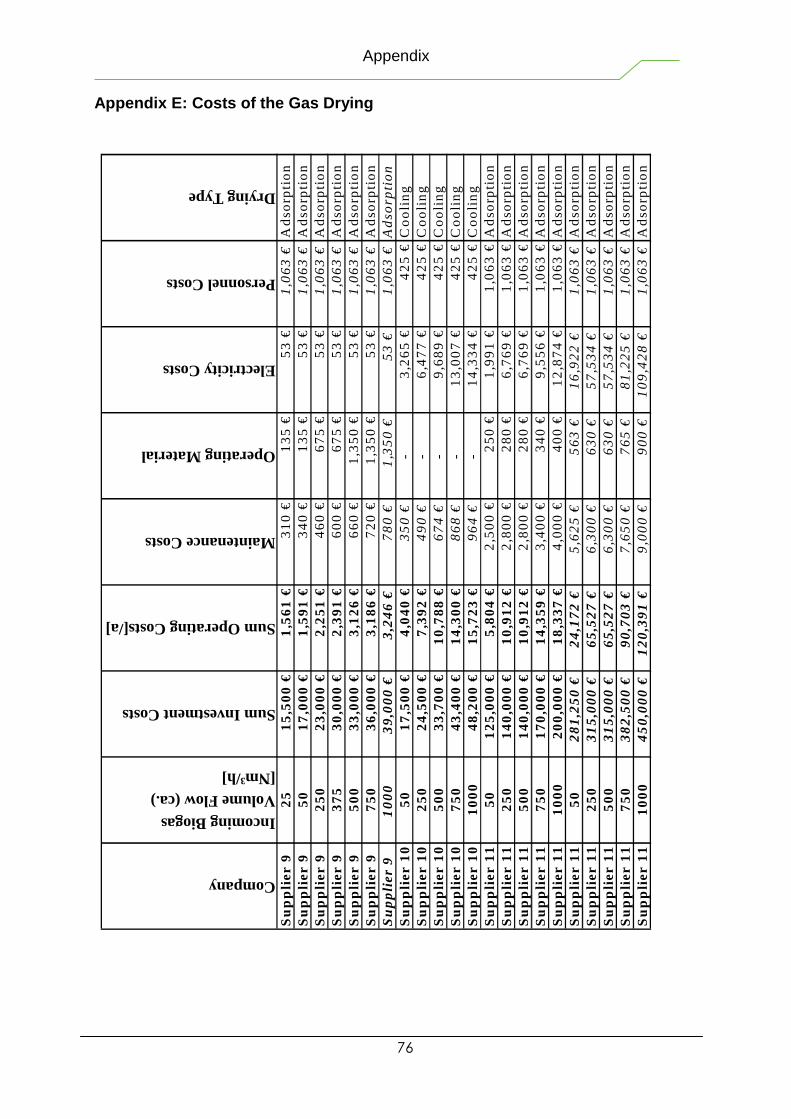
Appendix
76
Appendix E: Costs of the Gas Drying
Company
Incoming Biogas Volume Flow (ca.) [Nm³/h]
Sum Investment Costs
Sum Operating Costs[/a]
Maintenance Costs
Operating Material
Electricity Costs
Personnel Costs
Drying Type
Su
pp
lier
92
51
5,5
00
€1
,56
1 €
31
0 €
13
5 €
53
€1
,06
3 €
Ad
so
rpti
on
Su
pp
lier
95
01
7,0
00
€1
,59
1 €
34
0 €
13
5 €
53
€1
,06
3 €
Ad
so
rpti
on
Su
pp
lier
92
50
23
,00
0 €
2,2
51
€4
60
€6
75
€5
3 €
1,0
63
€A
ds
orp
tio
nS
up
plie
r 9
37
53
0,0
00
€2
,39
1 €
60
0 €
67
5 €
53
€1
,06
3 €
Ad
so
rpti
on
Su
pp
lier
95
00
33
,00
0 €
3,1
26
€6
60
€1
,35
0 €
53
€1
,06
3 €
Ad
so
rpti
on
Su
pp
lier
97
50
36
,00
0 €
3,1
86
€7
20
€1
,35
0 €
53
€1
,06
3 €
Ad
so
rpti
on
Su
pp
lier
91
00
03
9,0
00
€3
,24
6 €
78
0 €
1,3
50
€5
3 €
1,0
63
€A
ds
orp
tio
nS
up
plie
r 1
05
01
7,5
00
€4
,04
0 €
35
0 €
-3
,26
5 €
42
5 €
Co
oli
ng
Su
pp
lier
10
25
02
4,5
00
€7
,39
2 €
49
0 €
-6
,47
7 €
42
5 €
Co
oli
ng
Su
pp
lier
10
50
03
3,7
00
€1
0,7
88
€6
74
€-
9,6
89
€4
25
€C
oo
lin
gS
up
plie
r 1
07
50
43
,40
0 €
14
,30
0 €
86
8 €
-1
3,0
07
€4
25
€C
oo
lin
gS
up
plie
r 1
01
00
04
8,2
00
€1
5,7
23
€9
64
€-
14
,33
4 €
42
5 €
Co
oli
ng
Su
pp
lier
11
50
12
5,0
00
€5
,80
4 €
2,5
00
€2
50
€1
,99
1 €
1,0
63
€A
ds
orp
tio
nS
up
plie
r 1
12
50
14
0,0
00
€1
0,9
12
€2
,80
0 €
28
0 €
6,7
69
€1
,06
3 €
Ad
so
rpti
on
Su
pp
lier
11
50
01
40
,00
0 €
10
,91
2 €
2,8
00
€2
80
€6
,76
9 €
1,0
63
€A
ds
orp
tio
nS
up
plie
r 1
17
50
17
0,0
00
€1
4,3
59
€3
,40
0 €
34
0 €
9,5
56
€1
,06
3 €
Ad
so
rpti
on
Su
pp
lier
11
10
00
20
0,0
00
€1
8,3
37
€4
,00
0 €
40
0 €
12
,87
4 €
1,0
63
€A
ds
orp
tio
nS
up
plie
r 1
15
02
81
,25
0 €
24
,17
2 €
5,6
25
€5
63
€1
6,9
22
€1
,06
3 €A
ds
orp
tio
nS
up
plie
r 1
12
50
31
5,0
00
€6
5,5
27
€6
,30
0 €
63
0 €
57
,53
4 €
1,0
63
€Ad
so
rpti
on
Su
pp
lier
11
50
03
15
,00
0 €
65
,52
7 €
6,3
00
€6
30
€5
7,5
34
€1
,06
3 €A
ds
orp
tio
nS
up
plie
r 1
17
50
38
2,5
00
€9
0,7
03
€7
,65
0 €
76
5 €
81
,22
5 €
1,0
63
€Ad
so
rpti
on
Su
pp
lier
11
10
00
45
0,0
00
€1
20
,39
1 €
9,0
00
€9
00
€1
09
,42
8 €
1,0
63
€Ad
so
rpti
on

Appendix
77
Appendix F: Costs of the Gas Compression
Com
pany
max
imal
Fin
al P
ssur
e [b
ar
abso
lut]
Inco
min
g B
ioga
s V
olum
e F
low
(ca
.) [N
m³/h
]
Sum
Inve
stm
ent C
osts
Sum
Ope
ratin
g C
osts
[/a]
Par
t Ele
ctric
ity C
osts
Not
es
Supplier 15 11 50 56,000 € 12,100 € 9,300 € Supplier 15 11 250 86,000 € 49,400 € 45,100 € Supplier 15 11 375 139,000 € 93,300 € 86,300 € Supplier 15 11 500 139,000 € 93,300 € 86,300 € Supplier 15 11 750 161,000 € 14,700 € 132,700 € Supplier 15 11 1000 211,600 € 189,700 € 179,200 € Estimate Supplier 15 17 25 81,000 € 19,900 € 15,900 € Supplier 15 17 50 81,000 € 19,900 € 15,900 € Supplier 15 17 125 111,000 € 57,300 € 51,800 € Supplier 15 17 250 120,000 € 61,700 € 55,700 € Supplier 15 17 375 174,000 € 110,900 € 102,200 € Supplier 15 17 500 198,000 € 136,600 € 126,700 € Estimate Supplier 15 17 750 261,100 € 198,200 € 185,200 € Estimate Supplier 15 17 1000 324,200 € 259,900 € 243,700 € Estimate Supplier 16 11 25 63,200 € 19,000 € 13,300 € Supplier 16 11 50 63,200 € 23,000 € 17,300 € Supplier 16 11 125 76,200 € 40,800 € 31,900 € Supplier 16 16 25 118,700 € 29,900 € 18,600 € Supplier 16 16 50 118,700 € 31,700 € 20,400 € Supplier 16 16 125 119,000 € 35,700 € 24,400 € Supplier 16 16 250 160,300 € 87,000 € 69,000 € Supplier 16 4 25 60,800 € 20,200 € 14,600 € Supplier 16 4 50 60,800 € 20,200 € 14,600 € Supplier 16 4 125 60,800 € 24,200 € 18,600 € Supplier 16 4 125 72,500 € 39,300 € 31,900 € Supplier 16 4 250 79,200 € 44,800 € 35,800 € Supplier 17 26 500 420,000 € 87,400 € 66,400 € Supplier 17 46 500 460,000 € 122,500 € 99,500 € Supplier 17 71 500 690,000 € 147,300 € 112,800 €

Appendix
78
Appendix G: Costs of the Air Conditioning
Com
pany
Inco
min
g B
ioga
s V
olum
e F
low
(c
a.)
[Nm
³/h]
Sum
Inve
stm
ent
Cos
ts
Sum
Ope
ratin
g C
osts
[/a]
Mai
nten
ance
C
osts
Ele
ctric
ity C
osts
Per
sonn
el C
osts
Supplier 18 25 43,200 € 16,200 € 900 € 14,000 € 1,300 € Supplier 18 50 43,200 € 16,200 € 900 € 14,000 € 1,300 € Supplier 18 125 43,200 € 16,200 € 900 € 14,000 € 1,300 € Supplier 18 250 43,200 € 16,200 € 900 € 14,000 € 1,300 € Supplier 18 375 43,200 € 16,200 € 900 € 14,000 € 1,300 € Supplier 18 500 43,200 € 16,200 € 900 € 14,000 € 1,300 € Supplier 18 750 43,200 € 16,200 € 900 € 14,000 € 1,300 € Supplier 18 1000 43,200 € 16,200 € 900 € 14,000 € 1,300 €

Appendix
79
Appendix H: Costs of the Measurement of Calorific V alue
Com
pany
Sum
Inve
stm
ent
Cos
ts
Sum
Ope
ratin
g C
osts
[/a]
Supplier 19 34,300 € 600 €

Appendix
80
Appendix I: Costs of the Measurement of the Composi tion
Com
pany
Sum
Inve
stm
ent
Cos
ts
Sum
Ope
ratin
g C
osts
Mai
nten
ance
C
osts
Per
sonn
el C
osts
Supplier 20 37,000 € 1,800 € 700 € 1,100 €

Appendix
81
Appendix J: Costs of the Gas Odourization
Com
pany
Sum
Inve
stm
ent
Cos
ts
Sum
Ope
ratin
g C
osts
[/a]
Mai
nten
ance
C
osts
Ope
ratin
g M
ater
ial
(Odo
uriz
ing
Age
nt )
Ele
ctric
ity C
osts
Per
sonn
el C
osts
Supplier 20 17,700 € 1,450 € 250 € 1,000 € 100 € 100 € Supplier 21 26,500 € 1,750 € 250 € 1,000 € 400 € 100 € Supplier 22 16,300 € 1,450 € 250 € 1,000 € 100 € 100 €

Appendix
82
Appendix K: Costs of the Gas Pressure Regulation Sy stem
Com
pany
Inco
min
g B
ioga
s V
olum
e F
low
(ca
.)
[Nm
³/h]
Sum
Inve
stm
ent
Cos
ts
Sum
Ope
ratin
g C
osts
[/a
]
Mai
nten
ance
Cos
ts
Per
sonn
el C
osts
Supplier 23 25 8,500 € 500 € 200 € 300 € Supplier 23 50 9,000 € 500 € 200 € 300 € Supplier 23 125 11,000 € 500 € 200 € 300 € Supplier 23 250 11,000 € 500 € 200 € 300 € Supplier 23 375 14,000 € 600 € 300 € 300 € Supplier 23 500 15,000 € 600 € 300 € 300 € Supplier 23 750 18,500 € 700 € 400 € 300 € Supplier 23 1000 21,000 € 700 € 400 € 300 € Supplier 24 500 12,300 € 600 € 200 € 300 € Supplier 24 500 18,500 € 700 € 400 € 300 €

Appendix
83
Appendix L: Costs of the Gas Mixture (at Additional Gas Feed-in)
Com
pany
Inco
min
g B
ioga
s V
olum
e F
low
ca.
) [N
m³/h
]
Sum
Inve
stm
ent
Cos
ts
Supplier 18 25 – 1,000 2,000 €

Appendix
84
Appendix M: Costs for the Pipeline Access
Com
pany
/ Dat
a O
rigin
Pre
ssur
e [b
ar
abso
lut]
Sum
Inve
stm
ent
Cos
ts
Supplier 25 1.1 1,000 € Supplier 25 2 5,000 € Supplier 25 17 5,000 €

Appendix
85
Appendix N: Costs for the Pipeline Construction (Av erages, Estimates)
Pre
ssur
e S
tage
Nom
inal
Siz
e
Layi
ng C
osts
per
M
etre
ND DN100 110 € ND DN150 140 € ND DN200 180 € ND DN250 200 € ND DN300 240 € ND DN400 320 € ND DN500 400 € ND DN600 520 € MD DN100 120 € MD DN150 160 € MD DN200 190 € MD DN250 210 € MD DN300 250 € MD DN400 335 € MD DN500 415 € MD DN600 530 €
HD (<4 bar) DN100 150 € HD (<4 bar) DN150 180 € HD (<4 bar) DN200 210 € HD (<4 bar) DN250 230 € HD (<4 bar) DN300 275 € HD (<4 bar) DN400 360 € HD (<4 bar) DN500 440 € HD (<4 bar) DN600 550 € HD (>4 bar) DN100 160 € HD (>4 bar) DN150 200 € HD (>4 bar) DN200 230 € HD (>4 bar) DN250 250 € HD (>4 bar) DN300 290 € HD (>4 bar) DN400 420 € HD (>4 bar) DN500 560 € HD (>4 bar) DN600 710 €

Appendix
86
Appendix O: Investment and Operating Costs of a CHP
E
lect
ric P
ower
[kW
]
Sum
Inve
stm
ent C
osts
Sum
Ope
ratin
g C
osts
[/a
]
Mai
nten
ance
Cos
ts
Ope
ratin
g M
ater
ial
Dat
a O
rigin
25 189,000 € 12,600 € 11,700 € 900 € Estimate 50 200,800 € 14,600 € 13,500 € 1,100 € Estimate
100 157,200 € 16,000 € 15,000 € 1,000 € FNR-STUDY 2006 125 236,200 € 20,700 € 19,200 € 1,500 € Estimate 250 295,300 € 30,800 € 28,500 € 2,300 € Estimate 375 354,300 € 40,900 € 37,800 € 3,100 € Estimate 500 433,300 € 54,700 € 50,800 € 3,900 € FNR-STUDY 2006 550 462,900 € 56,00 € 52,100 € 4,400 € FNR-STUDY 2006 750 531,500 € 71,300€ 65,900 € 5,400 € Estimate
1.000 681,500 € 92,700€ 85,600 € 7,100 € FNR-STUDY 2006 1.100 728,100 € 95,600€ 87,800 € 7,800 € FNR-STUDY 2006 2.000 1,080,000 € 173,000€ 160,000 € 13,000 € FNR-STUDY 2006

Bibliographical Sources
87
Bibliographical Sources
ACTOR 2007 ACTOR Gesellschaft für Anlagenbau mbH; schriftliches Angebot, 2007
ADFIS 2007 AdFiS products GmbH; schriftliches Angebot, 2007
ADSORBENS- adsorbens-chemicals GmbH; schriftliche Auskunft, 2007
CHEMICALS 2007
AQUA 2007 Aqua Air Adsorbens GmbH & Co. KG; schriftliches Angebot, 2007
ASUE 2005 ASUE Arbeitsgemeinschaft für sparsamen und umweltfreundlichen Energieverbrauch e.V.: BHKW-Kenndaten 2005; Frankfurt 2005; Best.Nr. 050505
ATZ 2004 ATZ Entwicklungszentrum: Grundlegende Untersuchungen zur effektiven, kostengünstigen Entfernung von Schwefelwasserstoff aus Biogas; Projektbericht im Auftrag des Bayrischen Landesamtes für Umweltschutz; Augsburg, Sulzbach-Rosenberg 2004
AURELIO 2007 Aurelio - Fachhandel für Restaurierungsbedarf; schriftliches Angebot, 2007
ABAP 2007 a-bap e.V.; Homepageabruf unter: http://www.a-bap.de; 3. April 2007
BASF 2007 BASF AG; Emailauskunft, April 2007
BGNE 2007 Hornbachner Energie Innovation; Homepageabruf unter: www.biogas-netzeinspeisung.at; 3. April 2007
BMWT 2007 Bundesministerium für Wirtschaft und Technologie; Zahlen und Fakten, Energiedaten, Nationale und Internationale Entwicklung; T abelle 26; eigene Berechnungen; 13.06.2007; Homepageabruf unter:www.bmwi.de/BMWi/Redaktion/Binaer/energie-daten- gesamt,property=blob,bereich=bmwi,sprache=de,rwb=true.xls; 05.07.2007
BRENNSTOFF- Brennstoffspiegel, Homepageabruf unter:
SPIEGEL 2007 http://www.brennstoffspiegel.de/images/files/174/ pvgl_hel_gas_fw_brd.jpg?bsid=
a088257a8513c88b976a69f288a5ac62; 20.07.2007
CARBOTECH CarboTech AC GmbH; schriftliche Auskunft, April/Mai 2007
AK 2007
CARBOTECH CarboTech Engineering GmbH; schriftliches Angebot, 2007
ENGINEERING 2007
CHEMVIRON Homepageabruf unter: http://www.chemvironcarbon.com/img/
CARBON 2007 adsorptionvsabsorption2.gif, 12.06.2007
Bibliographical Sources
88
D&S 2007 Diringer & Scheidel Rohrsanierung GmbH & Co. KG; telefonische Auskunft vom 19.06.2007
DÄUMLER 1994 Däumler, Klaus-Dieter: Grundlagen der Investitions- und Wirtschaftlichkeitsrechnung; 8., neubearbeitete und erweiterte Auflage; 1994; Herne/Berlin; Verlag Neue Wirtschafts-Briefe GmbH&Co; ISBN 3-482-56368-3
DIN EN ISO 13686 DIN EN ISO 13686; Erdgas Beschaffenheitsbestimmung, Oktober 2006
DRY 2005 Dry &
Safe GmbH: Datenblatt Molekularsieb 4 Å; Oensingen 2005
EGSS 2007 Erdgas Südsachsen GmbH; schriftliche Angebote, April/Juni 2007
EGSS 2007b Erdgas Südsachsen GmbH; Homepageabruf unter: http://www.erdgas-suedsachsen.de/content/
netznutzung_preise.php; 04.07.2007
ENERGIE-21 2007 energy-21; schriftliche Auskunft im Juni/Juli 2007
ENERGIESYSTEME 2006 Energiesysteme der Zukunft; Tagungsband: Biogas – Innovative Ansätze für die Netzeinspeisung; Wien 2006
EUROSPARGAS 2007 EuroSparGas GmbH; schriftliches Angebot, 2007
EUROSTAT 2007 Statistisches Amt der Europäischen Gemeinschaften; Eurostat; Homepageabruf unter: http://epp.eurostat.ec.europa.eu; 16.07.2007
FAIRENERGIE 2007 FairEnergie GmbH; Homepageabruf unter: https://www.stadtwerke- reutlingen.de/fairenergie/06_netz/pdf/
Tarife&Preise_Netznutzung_Erdgas.pdf ; 04.07.2007
FARMATIC 2007 FARMATIC Anlagenbau GmbH; schriftliches Angebot, 2007
FIU 2005 Althaus, Wilhelm; Urban, Wolfgang: Analyse und Bewertung der Nutzungsmöglichkeiten von Biomasse, Band 3: Biomassevergasung, Technologien und Kosten der Gasaufbereitung und Potenziale der Biogaseinspeisung in Deutschland; Untersuchung im Auftrag von BGW und DVGW; Fraunhofer Institut Umwelt-, Sicherheits-, Energietechnik (UMSICHT); Wuppertal, Leipzig, Oberhausen, Essen 2005
FNR-HANDREICHUNG 2006 Handreichung Biogasgewinnung und –nutzung; Fachagentur Nachwachsende Rohstoffe e.V. (FNR); erstellt durch: Institut für Energetik und Umwelt gGmbH, Bundesforschungsanstalt für Landwirtschaft, Kuratorium für Technik und Bauwesen in der Landwirtschaft e.V.; 3., überarbeitete Auflage; Gülzow 2006
FNR-STUDY 2006 Klinski, Stefan: STUDY Einspeisung von Biogas in das Erdgasnetz; Fachagentur Nachwachsende Rohstoffe e.V. (FNR); Leipzig 2006
G 260 DVGW-Arbeitsblatt G 260; Gasbeschaffenheit; Januar 2000

Bibliographical Sources
89
G 261 DVGW-Arbeitsblatt G 261; Prüfung der Gasbeschaffenheit; August 1985
G 262 DVGW-Arbeitsblatt G 262; Nutzung von Gasen aus regenerativen Quellen in der öffentlichen Gasversorgung; November 2004
G 280-1 DVGW-Arbeitsblatt G 280-1; Gasodorierung; August 2004
G 281 DVGW-Arbeitsblatt G 281; Odoriermittel; August 1985
G 488 DVGW-Arbeitsblatt G 288; Anlagen für die Gasbeschaffenheitsmessung – Planung, Errichtung, Betrieb; Juli 1999
G 491 DVGW-Arbeitsblatt G 491; Gas-Druckregelanlagen für Eingangsdrücke über 4 bis 100 bar - Planung, Fertigung, Errichtung, Prüfung, Inbetriebnahme; Januar 2004
G 685 DVGW-Arbeitsblatt G 685; Gasabrechnung; März 1993
GERMAN Guderian, Joachim; Horn, Christian: Imprägnierte
CARBON 2001 Adsorbentien; German Carbon Teterow GmbH; 2001
GÖTZE 2002 Götze, Uwe; Bloech, Jürgen: Investitionsrechnung, Modelle und Analysen zu Beurteilung von Investitionsvorhaben; dritte, verbesserte und erweiterte Auflage;2002; Springer-Verlag; Berlin Heidelberg; ISBN 3-540-42466-0
GREENLANE 2006 Fa. Flotech: Greenlane™ Biogas Upgrading Systems; Nov. 2006 - Produktinformationen
GWF 2005 Schmeer, Frank; Reimert, Rainer; Kaesler, Heribert: Schwefelfreie Odorierung – Erfahrungsberichte; gwf Gas Erdgas; Jahrgang:146; S. 219 – 226; 2005
GWF 2005 Weber, Horst; Müller, Arndt; Schmeer, Frank: Die zentrale schwefelfreie Odorierung in ein Hochdrucknetz, Ein Erfahrungsbericht über den Feldversuch Mosel-Eifel; gwf Gas - Erdgas; Jahrgang: 146, Nr.1,S. 23-32; 2005
GWI 2005 Burmeister, Frank: Analyse und Bewertung der Nutzungsmöglichkeiten von Biomasse, Band 4: Technologien, Kosten und Restriktionen der Biogaseinspeisung ins Erdgasnetz; Untersuchung im Auftrag von BGW und DVGW; Gaswärme- Institut e.V. Essen; Wuppertal, Leipzig, Oberhausen, Essen 2005
HAUG 2007 Fritz Haug GmbH; schriftliches Angebot, 2007
HKT 2007 Holstein-Kunststoff-Technik GmbH; telefonische Auskunft vom 17.04.2007
HOAI 2001 Honorarordnung für Architekten und Ingenieure - HOAI (idFv 10. November 2001); Homepageabruf unter: http://www.hoai.de/online/HOAI-Text/HOAI1996.php; 04.07.2007
HOFFMEISTER 2000 Hoffmeister, Wolfgang: Investitionsrechnung und Nutzwertanalyse: eine entscheidungsorientierte Darstellung mit vielen Beispielen und Übungen; Stuttgart, Berlin, Köln; 2000; ISBN 3-17-016353-1

Bibliographical Sources
90
IE 2005 Kaltschmitt, Martin; Scholwin, Frank; Hofmann, Frank; Plättner, Andrè; Kalies, Martin; Lulies, Sönke; Schröder, Gerd: Analyse und Bewertung der Nutzungsmöglichkeiten von Biomasse, Band 2: Biomassepotenziale in Deutschland, Nutzungstechniken und ökonomisch-ökologische Bewertung ausgewählter Nutzungspfade; Untersuchung im Auftrag von BGW und DVGW; Institut für Energetik und Umwelt gGmbH; Wuppertal, Leipzig, Oberhausen, Essen 2005
INNOGAS 2006 Wecks, M.: Wertstoffrückgewinnung bei der Biogasreinigung; Fachtagung INNOGAS: Herstellung von Biomethan aus Biogas, Lutherstadt Wittenberg, 2006
IPU 2007 Renner; Ipu Dr. Born Dr. Ermel GmbH; telefonische Auskunft, März 2007
KRONOS 2004 KRONOS INTERNATIONAL, Inc. KRONOS ecochem: Technische Information 1.05, KRONOFLOC Eisen-II-chlorid-Lösung; 2004
LEWA 2007 LEWA GmbH; schriftliches Angebot, 2007
MEHRER 2007 Josef Mehrer GmbH & Co KG Maschinenfabrik; schriftliches Angebot, 2007
MERICHEM 2007 Merichem Chemicals & Refinery Services LLC; schriftliches Angebot, 2007
MEYER 2007 Meyer Lexikon online; Homepageabruf unter: http://lexikon.meyers.de/; 30.05.2007
MMT 2007 MMT Supergas GmbH; schriftliches Angebot, 2007
MT ENERGIE 2007 MT-ENERGIE GmbH & Co.KG: MT-BIOMETHAN-Broschüre; 2007 - Firmenschrift
NHA 2007 Nickelhütte Aue GmbH; telefonische Auskunft, 2007
OEKOBIT 2007 ÖKOBiT GmbH: Technische Beschreibung ÖKOBiT- BioErdgasanlage; 2007
OEKOSTROM 2007 AgroNet Gesellschaft für modernes Agrarmanagement und - technik mbH; Homepageabruf unter: www.agronet- vsp.de/Wirtschaftlk3.PDF; 04.05.2007
PAQUES 2007 Paques Environmental Technology Co., Ltd; schriftliches Angebot, 2007
R&M 2007R&M E.M.S. GmbH; schriftliches Angebot, 2007
RIES 1992 Ries, T., Orth, H., Niehoff, H.H.: Bemessungsansatz für die Reduzierung von Schwefelwasserstoff im Faulgas durch Sulfidfällung mit Eisenchlorid; Korrespondenz Abwasser 39, S. 1156-1163; 1992
RMG 2007 RMG Messtechnik GmbH; schriftliches Angebot, 2007
RÜDGERS 2003 Schulte-Schulze Berndt, Alfons: Gasaufbereitung mittels Druckwechseladsorption; RÜTGERS CarboTech Engineering; In Gülzower Fachgespräche: Band 21; Workshop "Aufbereitung von Biogas" 17./18. Juni 2003; Herausgegeben von der Fachagentur für Nachwachsende Rohstoffe e.V. (FNR); Essen 2003

Bibliographical Sources
91
SCG 2001 Hagen, Martin; Polman, Erik; Myken, Asger; Jensen, Jan; Jönsson, Owe; Dahl, Anders: Adding Gas from Biomass to the Gas Grid; GASTEC NV, Danish Gas Technology Centre a/s, Swedish Gas Center; Contract No: XVII/4.1030/Z/99-412, 2001
SCHARR TEC 2007 SCHARR TEC GmbH & Co.KG; schriftliches Angebot, 2007
SCHULZ 2004 Schulz, Wolfgang: Untersuchung zur Aufbereitung von Biogas zur Erweiterung der Nutzungsmöglichkeiten; bremer energie institut; 2004; Gutachten im Auftrag der Bremer Energie-Konsens GmbH
SELECTA 2007 SELECTA Bioenergie GmbH; schriftliches Angebot, 2007
SH-UMWELT 2007 S&H GmbH & Co. Umweltengineering KG; schriftliches Angebot, 2007
SILICA 2007a Silica Verfahrenstechnik GmbH: Trocknung durch Adsorption; 2007
SILICA 2007b Silica Verfahrenstechnik GmbH; schriftliches Angebot, 2007
SQAP 2002 Schneider, Ralf; Quicker, P.; Anzer, T.; Prechtl. S.; Faulstich, M.: Grundlegende Untersuchung zur effektiven, kostengünstigen Entfernung von Schwefelwasserstoff aus Biogas; Bayerisches Landesamt für Umweltschutz; Veranstaltung: Biogasanlagen - Anforderungen zur Luftreinhaltung (Augsburg 17.Oktober 2002); Augsburg 2002
STAT BUND 2007 Statistisches Bundesamt, Wiesbaden; Erzeugerpreisindizes gewerblicher Produkte: Deutschland, Jahr, Güterverzeichnis; GENESIS-Online; 05.07.2007
SWB 2007 Städtische Werke Borna GmbH; Homepageabruf unter: http://www.stadtwerke-borna.de/NetznutzungGas_Bed.pdf; 04.07.2007
TALUFT 2002 Bundesministerium für Umwelt, Naturschutz und Reaktorsicherheit: Erste Allgemeine Verwaltungsvorschrift zum Bundes–Immissionsschutzgesetz (Technische Anleitung zur Reinhaltung der Luft – TA Luft); 24. Juli 2002
TENTSCHER 2006a Tentscher, Wolfgang: Anforderungen und Aufbereitung von Biogas zur Einspeisung in Erdgasnetze; erschienen in DVWG Energie- Wasser-Praxis, Ausgabe 11, 57. Jahrgang, Nov. 2006, Seite 32- 37
TENTSCHER 2006b eco Naturgas Handels GmbH; telefonische Auskunft im Mai 2007
THEIßING 2006 Theißing, Matthias: Biogas Einspeisung und Systemintegration in bestehende Gasnetze; FH JOANNEUM Gesellschaft mbH; Projektbericht im Auftrag des Bundesministeriums für Verkehr, Innovation und Technologie; Wien, Jänner 2006
THIEL 2007 Anlagentechnik Thiel Gmbh & Co. KG; schriftliches Angebot, 2007
THIELEMANN 2007a PETER W. THIELEMANN GMBH, telefonische Auskunft, 2007

Bibliographical Sources
92
THIELEMANN 2007b PETER W. THIELEMANN GMBH: Pflanzenverfügbarkeit von Eisensulfid FeS im Gärrückstand von Biogasanlagen; 2007 - Firmenschrift
THOLANDER 2007 THOLANDER Ablufttechnik GmbH; schriftliches Angebot, 2007
TUD 2006 Mollekopf, Norbert; Polster, Andreas; Brummack, Joachim: Verbesserung von Entschwefelungsverfahren in landwirtschaftlichen Biogasanlagen; Technische Universität Dresden, Institut für Verfahrenstechnik und Umwelttechnik, Lehrstuhl für Thermische Verfahrenstechnik und Umwelttechnik; Forschungs- und Entwicklungsprojekt, Projekträger: Sächsisches Staatsministerium für Umwelt und Landwirtschaft / Sächsische Landesanstalt für Landwirtschaft, Fachbereich Agrarökonomie, Ländlicher Raum; Dresden 2005
VARIAN 2007 VARIAN Deutschland GmbH; schriftliches Angebot, 2007
VDI 6025 VDI-Richtlinie 6025; Betriebswirtschaftliche Berechnungen für Investitionsgüter und Anlagen, 2004
VIK 2007 VIK Verband der Industriellen Energie- und Kraftwirtschaft e.V.; Homepageabruf unter: www.vik-online.de; 05.07.2007
WAEGA 2007 WÄGA Wärme-Gastechnik GmbH; telefonische Auskunft am 20.06.2007
WASSERMANN 2007 Wassermann, Carl; Homepageabruf unter: http://www.h-2-s.de; 20.04.2007
WEILAND 2003 Weiland, P.: Notwendigkeit der Biogasaufbereitung, Ansprüche einzelner Nutzungsrouten und Stand der Technik; In Gülzower Fachgespräche: Band 21; Workshop "Aufbereitung von Biogas" 17./18. Juni 2003; Herausgegeben von der Fachagentur für Nachwachsende Rohstoffe e.V. (FNR); Essen 2003
WHG 1987 Gesetz zur Ordnung des Wasserhaushalts (Wasserhaushaltsgesetz - WHG); Januar 1987 (idFv 25.06.2005)
ZANDER 2007 ZANDER Aufbereitungstechnik GmbH; schriftliches Angebot, 2007