05/07/2013 - 1Q13 Earnings Conference Call
17
1Q13 Earnings Release Conference Call May 7, 2013
-
Upload
kianne-paganini -
Category
Economy & Finance
-
view
150 -
download
6
Transcript of 05/07/2013 - 1Q13 Earnings Conference Call

1Q13 Earnings Release Conference Call
May 7, 2013

Agenda
1Q13 Events and Highlights 3Q g g
1Q13 Financial Highlights 4
Product and Revenue Diversification 5
N t I t t M i 6Net Interest Margin 6
Expenses and Efficiency Ratio 7
Loan Portfolio 8
Continuous Loan Portfolio Management 9
Loan Portfolio Quality 10
FICC 11
PINE Investimentos 12
Funding 13
Asset & Liability Management 14Asset & Liability Management 14
Capital Adequacy Ratio (BIS) 15
PINE4 16
2/17Investor Relations | 1Q13 |

Recurring results.
1Q13 Events and Highlights
Positive revenue contributions from all business lines in the quarter: 56.6% from Corporate Credit, 34.1% fromFICC, 7.6% from PINE Investimentos, and 1.7% from Treasury.
1, , y
Positive liquidity gap maintained for over 11 quarters: 15 months for credit, versus 17 months for funding.2
Liquid balance sheet, with cash position of R$1.4 billion, equivalent to 42% of time deposits.
PINE continues to be ranked among the 15 largest players in derivative transactions and the 2nd largest indi d i i di CETIP (OTC Cl i H )
3
4commodity derivatives according to CETIP (OTC Clearing House).
On April 19, the Central Bank of Brazil approved the capital increase made by Proparco in the Bank. Thetransaction resulted in the issuance of 2,211,213 preferred shares, totaling approximately R$32 million, with the
5, , p , g pp y ,
participation of other shareholders who exercised their preemptive rights at the price of R$14.28 per share. Thetransaction resulted in a BIS ratio improvement of 40 bps.
On April 25, DEG disbursed the first transaction of the PINE-DEG partnership, totaling US$16 million with an eight-year term for a company in the autoparts sector
6year term for a company in the autoparts sector.
On April 30, we concluded our first DCM transaction through our New York broker dealer. The deal amounted toUS$250 million for a Sugar and Ethanol company in the state of São Paulo.
7
3/17Investor Relations | 1Q13 |
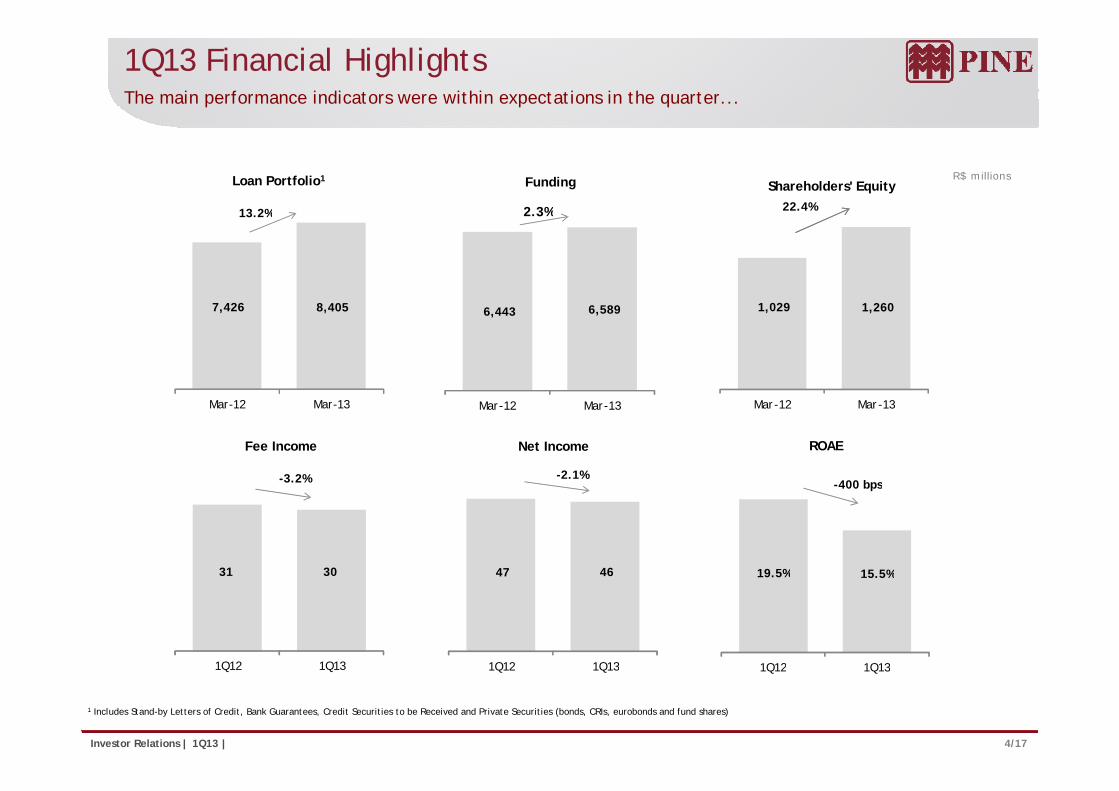
1Q13 Financial HighlightsThe main performance indicators were within expectations in the quarter...
R$ millionsLoan Portfolio1
13.2%
Shareholders' Equity22.4%
Funding
2.3%
7 426 8 405
13.2%
1 029 1 260 6 589
2.3%
7,426 8,405 1,029 1,260 6,443 6,589
Mar-12 Mar-13 Mar-12 Mar-13
Fee Income
-3.2%
Net Income
-2.1%
ROAE
-400 bps
Mar-12 Mar-13
31 30 47 46 19 5% 15 5%
-400 bps
31 30
1Q12 1Q13
47 46
1Q12 1Q13
19.5% 15.5%
1Q12 1Q13
4/17Investor Relations | 1Q13 |
1 Includes Stand-by Letters of Credit, Bank Guarantees, Credit Securities to be Received and Private Securities (bonds, CRIs, eurobonds and fund shares)
1Q12 1Q13 1Q12 1Q13 1Q12 1Q13

Product and Revenue Diversification... with contributions from all business lines, fruit of the strategy of complete service to clients.
More than 1 product 1 product
3 0
Clients with more than one product Penetration Ratio – Clients with more than one product
56% 42% 42%2.7
3.02.8
44% 58% 58%
M 11 M 12 M 13 M 11 M 12 M 13Mar -11 Mar -12 Mar -13 Mar -11 Mar -12 Mar -13
Revenue Mix
1Q12 1Q13
Corporate Credit57.3%
PINE Investimentos
Corporate Credit56.6%
Treasury1.7%
PINE Investimentos
7.6%
Treasury8.2%
10.2%
FICC34.1%
5/17Investor Relations | 1Q13 |
FICC24.3%
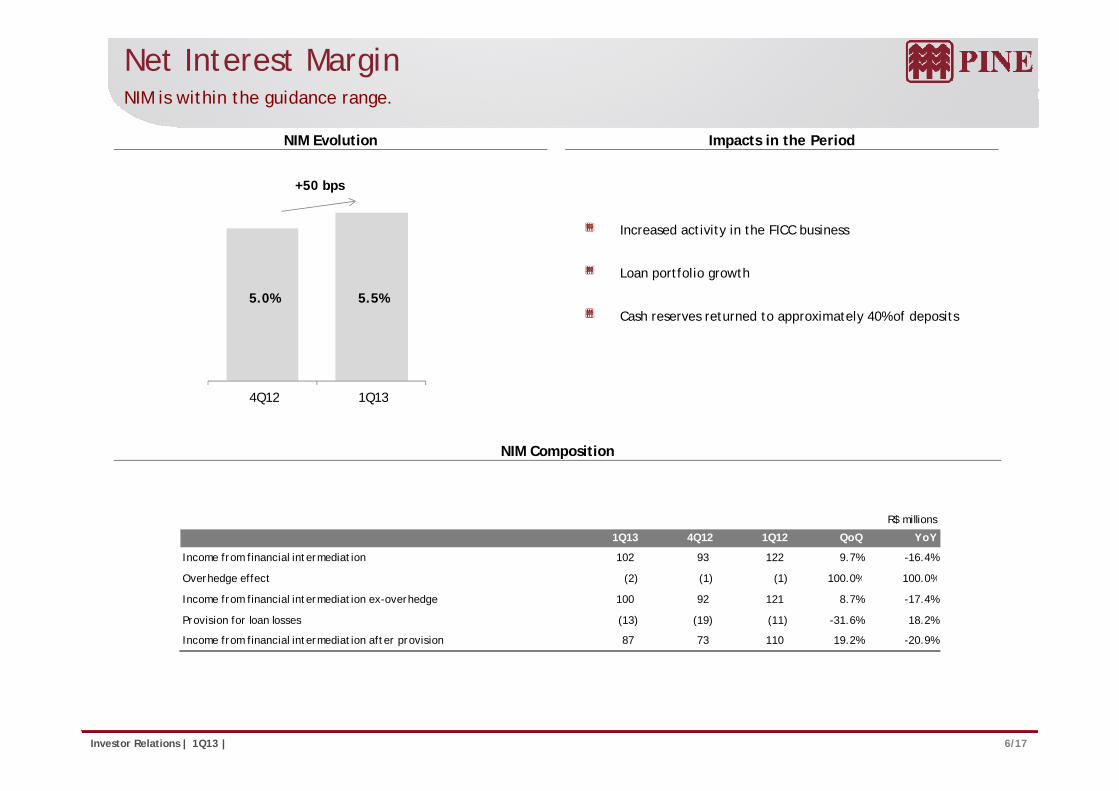
Net Interest MarginNIM is within the guidance range.
+50 bps
NIM Evolution Impacts in the Period
5.0% 5.5%
Increased activity in the FICC business
Loan portfolio growth
4Q12 1Q13
Cash reserves returned to approximately 40% of deposits
4Q12 1Q13
NIM Composition
R$ millions
1Q13 4Q12 1Q12 QoQ YoY
Income from financial intermediation 102 93 122 9.7% -16.4%
O h d ff t (2) (1) (1) 100 0% 100 0%Overhedge effect (2) (1) (1) 100.0% 100.0%
Income from financial intermediation ex-overhedge 100 92 121 8.7% -17.4%
Provision for loan losses (13) (19) (11) -31.6% 18.2%
Income from financial intermediation after provision 87 73 110 19.2% -20.9%
6/17Investor Relations | 1Q13 |
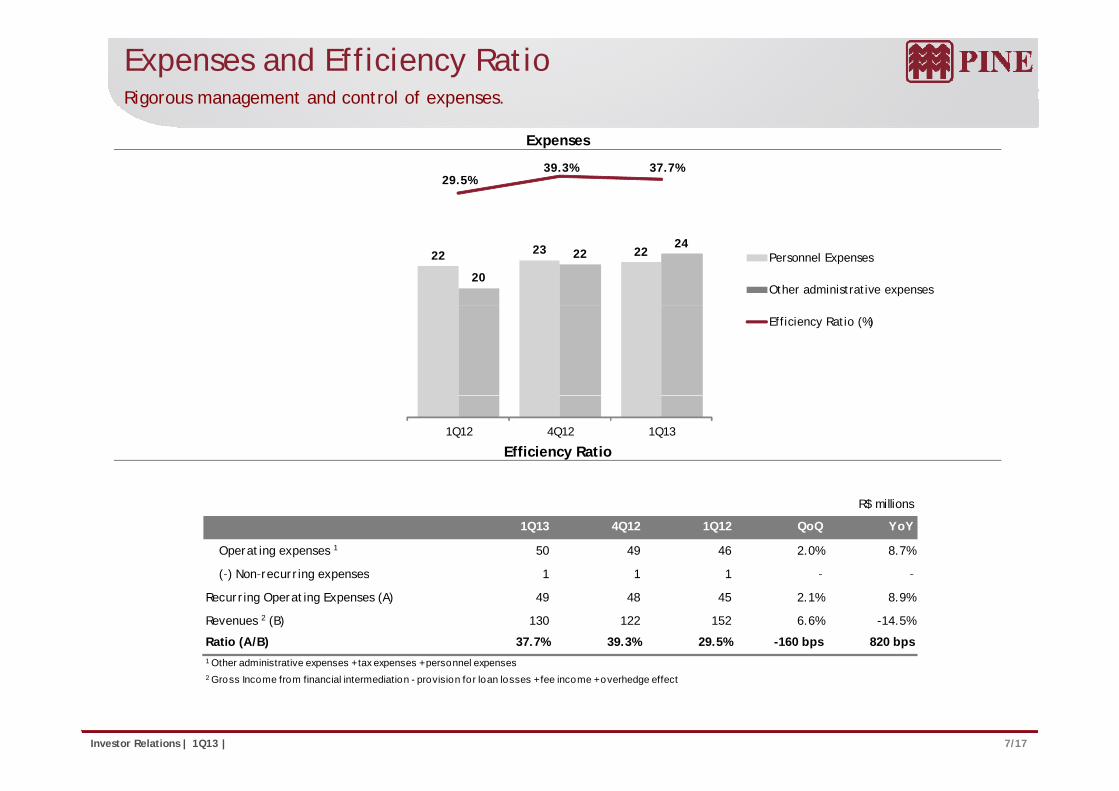
Expenses and Efficiency RatioRigorous management and control of expenses.
Expenses
29.5%39.3% 37.7%
22 23 22
20
2224
Personnel Expenses
Other administrative expenses
Efficiency Ratio (%)
Efficiency Ratio1Q12 4Q12 1Q13
R$ millions
1Q13 4Q12 1Q12 QoQ YoY
Operating expenses 1 50 49 46 2.0% 8.7%
(-) Non-recurring expenses 1 1 1 - -( ) Non recurring expenses 1 1 1
Recurring Operating Expenses (A) 49 48 45 2.1% 8.9%
Revenues 2 (B) 130 122 152 6.6% -14.5%
Ratio (A/B) 37.7% 39.3% 29.5% -160 bps 820 bps1 Other administrative expenses +tax expenses +personnel expenses
7/17Investor Relations | 1Q13 |
Other administrative expenses + tax expenses + personnel expenses2 Gross Income from financial intermediation - provision for loan losses + fee income + overhedge effect
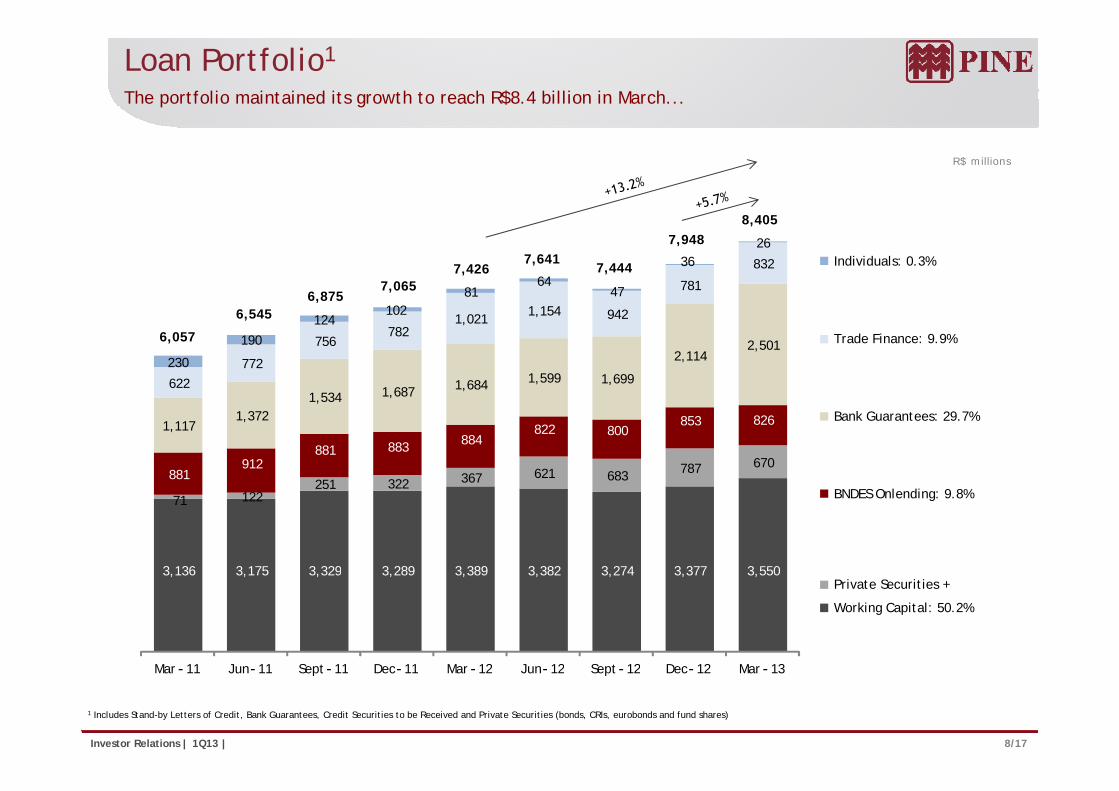
Loan Portfolio1
The portfolio maintained its growth to reach R$8.4 billion in March...
R$ millions
8 405
781
832
102 81
64 47
36 26
Individuals: 0.3%
6,875 7,065
7,426 7,641
7,444
7,948 8,405
1 534 1,687 1,684 1,599 1,699
2,114 2,501
622 772
756 782
1,021 1,154 942
230
190
124 102
Trade Finance: 9.9%
6,545
6,057
251 322 367 621 683 787 670 881
912 881 883 884
822 800 853 826 1,117
1,372 1,534 1,687
Bank Guarantees: 29.7%
3,136 3,175 3,329 3,289 3,389 3,382 3,274 3,377 3,550
71 122 251 322
BNDES Onlending: 9.8%
3,136 3,175 3,329 3,289 3,389 3,382 3,274 3,377 3,550
M 11 J 11 S t 11 D 11 M 12 J 12 S t 12 D 12 M 13
Private Securities +
Working Capital: 50.2%
8/17Investor Relations | 1Q13 |
Mar - 11 Jun- 11 Sept- 11 Dec- 11 Mar - 12 Jun- 12 Sept- 12 Dec- 12 Mar - 13
1 Includes Stand-by Letters of Credit, Bank Guarantees, Credit Securities to be Received and Private Securities (bonds, CRIs, eurobonds and fund shares)
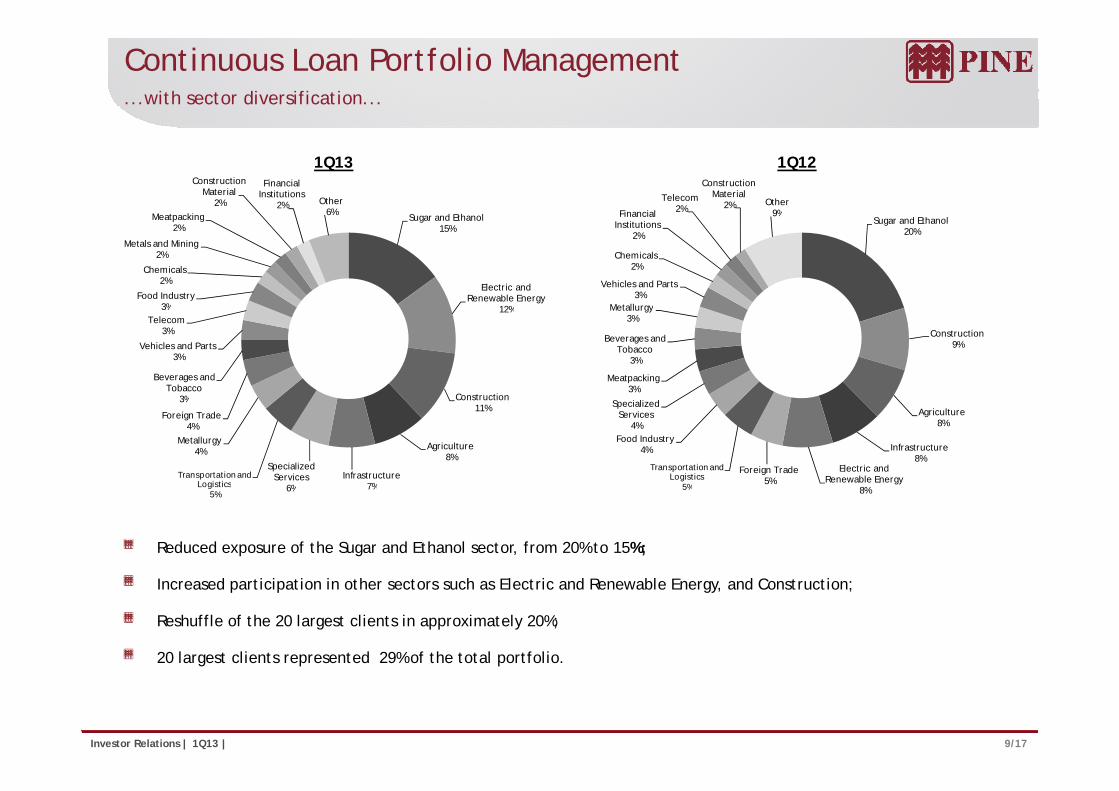
Continuous Loan Portfolio Management...with sector diversification...
Sugar and EthanolMeatpacking
Construction Material
2%
Financial Institutions
2% Other6% Financial
Telecom2%
Construction Material
2% Other9%
1Q13 1Q12
Sugar and Ethanol15%
Electric and Renewable Energy
12%Food Industry
3%
Chemicals2%
Metals and Mining2%
Meatpacking2%
Sugar and Ethanol20%
Metallurgy
Vehicles and Parts3%
Chemicals2%
Financial Institutions
2%
9%
12%
Construction
Beverages and Tobacco
3%
Vehicles and Parts3%
Telecom3%
3%
Construction9%
Meatpacking3%
Beverages and Tobacco
3%
Metallurgy3%
Construction11%
Agriculture8%
Infrastructure7%
Specialized Services
6%Transportation and
Logistics
Metallurgy4%
Foreign Trade4%
3%Agriculture
8%
Infrastructure8%
Electric and Renewable Energy
Foreign Trade5%
Transportation and Logistics
5%
Food Industry4%
Specialized Services
4%
7%6%Logistics5% 8%5%
Reduced exposure of the Sugar and Ethanol sector, from 20% to 15%;
Increased participation in other sectors such as Electric and Renewable Energy, and Construction;
Reshuffle of the 20 largest clients in approximately 20%;
20 largest clients represented 29% of the total portfolio.
9/17Investor Relations | 1Q13 |
g p p

Loan Portfolio Quality... quality, collaterals, and adequate credit coverage.
B
March 31, 2013
1.2% 1.2%Contracts overdue
Installments overdue
Loan Portfolio Quality Non Performing Loans > 90 days
AA-A56 0%
30.4%
0.7%0.6%
0.8%
0.2% 0.2%
0.4%
0.6% 0.6%
56.0%
C9.2%
D-E1.4%
F-H
Mar-12 Jun-12 Sept-12 Dec-12 Mar-13
Contracts Overdue: total amount of the contracts overdue for more than 90 days / Loan Portfolioexcluding Bank Guarantees and Stand-by Letters of Credit.F H
3.0%
3.7% 3 5%
Installents Overdue: total amount of installments overdue for more than 90 days / Loan Portfolioexcluding Bank Guarantees and Stand-by Letters of Credit.
Credit Coverage Collaterals
3.4%3.7% 3.5%
3.3% 3.4% Products Pledge
39%Investments2%
Guarantees1%
Properties
10/17Investor Relations | 1Q13 |
Mar-12 Jun-12 Sept-12 Dec-12 Mar-13
Credit Coverage: Provision / Loan Portfolio excluding Bank Guarantees and Stand-by Letters ofCredit.
Receivables28%
Properties Pledge
30%

FICCProven trackrecord: 2nd in commodity derivatives1.
March 31, 2013 R$ millions
Client Notional Derivatives Portfolio by Market Notional Value and MtM
Fixed Income Currencies
Notional valueMtMStressed MtM
20% 60%
354
597 629
498
298
Commodities20% 4 287 4 720 4 875 5 036 5 180
126
256 238 197 174
Scenario on March 31:Fixed Income: Fixed Floating Inflation Libor
Market Segments Portfolio Profile
20% 4,287 4,720 4,875 5,036 5,180
Mar-12 Jun-12 Sept-12 Dec-12 Mar-13
Scenario on March, 31:
Duration: 149 days
Mark-To-Market : R$174 million
Fixed Income: Fixed, Floating, Inflation, Libor
Currencies: Dollar, Euro, Yen, Pound, Canadian Dollar,Australian Dollar
Stress Scenario (Dollar: +31% and Commodities Prices: -30%):
Stressed MTM: R$298 million
Commodities: Sugar, Soybean (Grain, Meal and Oil), Corn,Cotton, Metals, Energy
11/17Investor Relations | 1Q13 |
1Source: Cetip Report, March 2013
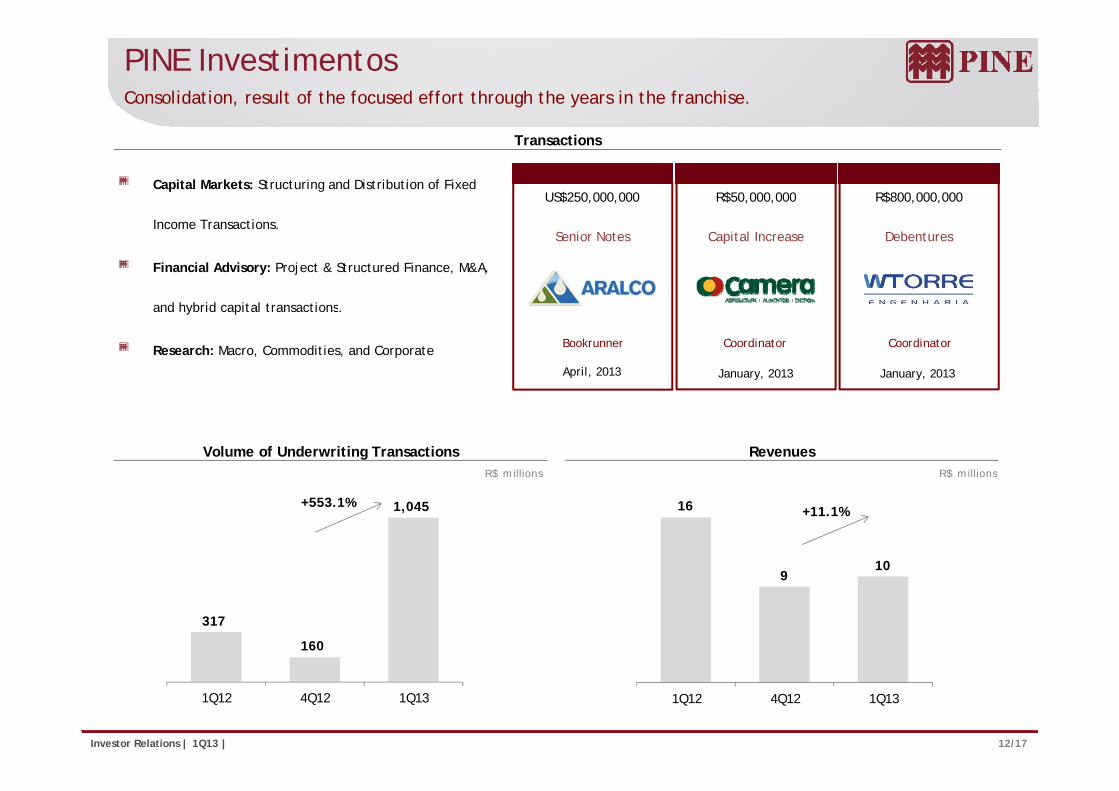
PINE InvestimentosConsolidation, result of the focused effort through the years in the franchise.
Capital Markets: Structuring and Distribution of Fixed R$50,000,000US$250,000,000 R$800,000,000
Transactions
Income Transactions.
Financial Advisory: Project & Structured Finance, M&A,
and hybrid capital transactions
Capital IncreaseSenior Notes Debentures
and hybrid capital transactions.
Research: Macro, Commodities, and Corporate
January, 2013
Coordinator
April, 2013
Bookrunner
January, 2013
Coordinator
R$ millions R$ millions
Volume of Underwriting Transactions Revenues
16
910
+11.1%1,045 +553.1%
9
317
160
12/17Investor Relations | 1Q13 |
1Q12 4Q12 1Q131Q12 4Q12 1Q13
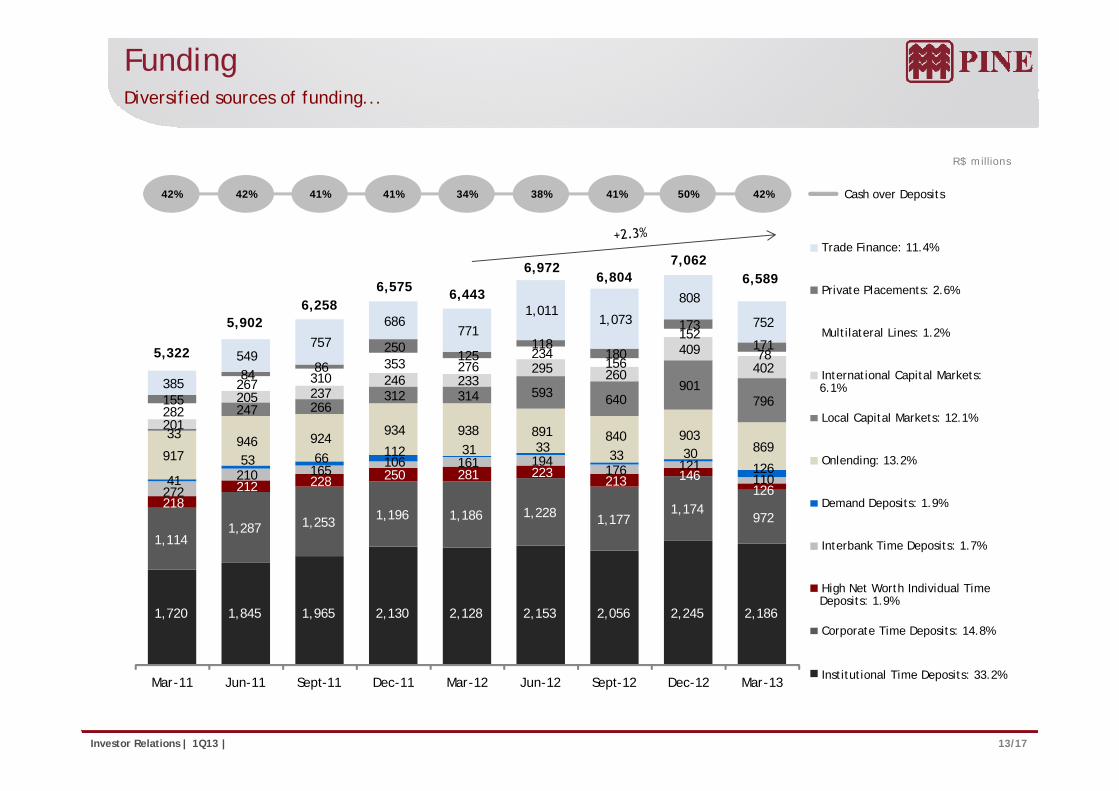
FundingDiversified sources of funding...
R$ millions
42% 42% 41% 41% 41%34% 38% 50% 42% Cash over Deposits
1 011 808
Trade Finance: 11.4%
Private Placements: 2.6%
7,062
6 258 6,575 6,443
6,9726,804 6,589
312 314 593 640 901
205 237 246 233
295 260
409 402
267 310 353 276
234 156
152
78
155
84 86 250
125 118
180
173
171
385
549 757
686 771
1,011 1,073 752
Multilateral Lines: 1.2%
International Capital Markets: 6.1%
5,322
5,902 6,258
212 228 250 281 223 213 146
126 210 165
106 161 194 176 121
110 41
53 66 112 31 33 33 30
126 917
946 924 934 938 891 840 903
869 33
247 266 312 314 593 640 796
201
205 237 282 155
Local Capital Markets: 12.1%
Onlending: 13.2%
1,114 1,287 1,253 1,196 1,186 1,228 1,177
1,174 972
218 212 228 213
126 272 Demand Deposits: 1.9%
Interbank Time Deposits: 1.7%
1,720 1,845 1,965 2,130 2,128 2,153 2,056 2,245 2,186
High Net Worth Individual Time Deposits: 1.9%
Corporate Time Deposits: 14.8%
13/17Investor Relations | 1Q13 |
Mar-11 Jun-11 Sept-11 Dec-11 Mar-12 Jun-12 Sept-12 Dec-12 Mar-13Institutional Time Deposits: 33.2%

Asset & Liability Management... keeping a positive gap between credit and funding.
7.2x 7.3x
6.1x 6.5x 6.7x
Leverage Credit over Funding Ratio
86% 84% 83% 82%87%
Mar-12 Jun-12 Sept-12 Dec-12 Mar-13 Mar-12 Jun-12 Sept-12 Dec-12 Mar-13
R$ millions
ALM – Average Maturity Total Deposits over Total Funding
Leverage: Total Loan Portfolio / Shareholders’ Equity Credit over Funding ratio: Loan Portfolio excluding Bank Guarantees and Stand-by Letters ofCredit / Total Funding
months
41% 45% 46% 47% 47%
Total Deposits Others
6,589 7,062 6,804 6,972 6,443 17
16 16 17 17
59% 55% 54% 53% 53%
14 13
14 14 15
Funding
L P tf li
14/17Investor Relations | 1Q13 |
Mar -12 Jun -12 Sept -12 Dec-12 Mar -13Mar-12 Jun-12 Sept-12 Dec-12 Mar-13
Loan Portfolio

Capital Adequacy Ratio (BIS)BIS ratio reached 17.1%.
Tier I Tier II
4.5%4.2%
3 0% 2.1%
17.1% 16.6%
19.6%18.5%
16.4% 15.9%17.0%
16.2%17.1%
Minimum RegulatoryCapital (11%)
3.7% 3.4% 3.1% 3.3%3.0% 2.8%
2.1%
13.4% 13.2% 15.1% 14.3% 13.3% 12.6% 14.0% 13.4% 15.0%
Mar-11 Jun-11 Sept-11 Dec-11 Mar-12 Jun-12 Sept-12 Dec-12 Mar-13
R$ millions Basel (%)
Tier I 15.0%
Tier II 2.1%
Total 17.1%
1,268
185
1,454
15/17Investor Relations | 1Q13 |
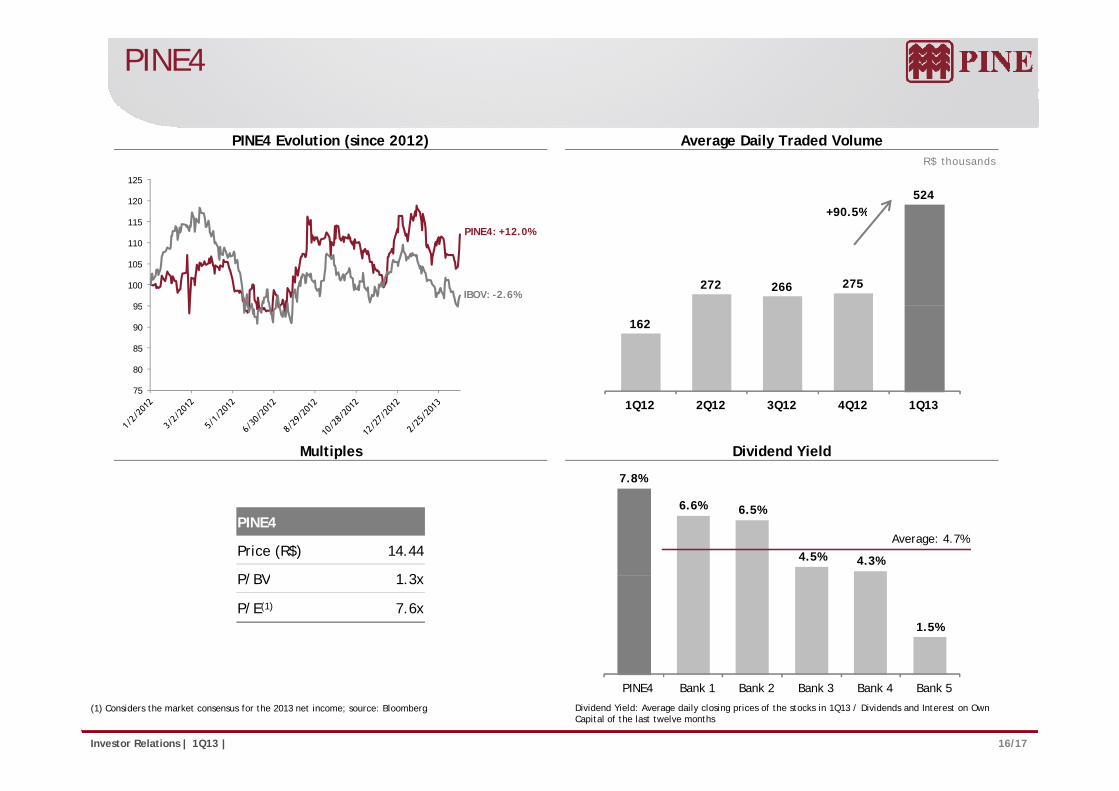
PINE4
R$ thousands
PINE4 Evolution (since 2012) Average Daily Traded Volume
120
125
524 +90.5%
95
100
105
110
115PINE4: +12.0%
IBOV: -2.6%272 266 275
90.5%
75
80
85
90
95
162
7.8%
Multiples Dividend Yield
1Q12 2Q12 3Q12 4Q12 1Q13
PINE4
Price (R$) 14.44
P/BV 1 3
6.6% 6.5%
4.5% 4.3%
Average: 4.7%
P/BV 1.3x
P/E(1) 7.6x1.5%
16/17Investor Relations | 1Q13 |
PINE4 Bank 1 Bank 2 Bank 3 Bank 4 Bank 5
Dividend Yield: Average daily closing prices of the stocks in 1Q13 / Dividends and Interest on OwnCapital of the last twelve months
(1) Considers the market consensus for the 2013 net income; source: Bloomberg

Investor Relations
Noberto N. Pinheiro Junior
CEO
Norberto Zaiet Junior Susana Waldeck
COO CFO / IRO
Raquel Varela
Head of Investor Relations
Alejandra Hidalgo
Investor Relations Managerg
Eduardo Pinotti
Investor Relations Analyst
Ana Lopes
Investor Relations Analyst
Fone: +55 (11) 3372-5343
www.pine.com/ir
17/17Investor Relations | 1Q13 |
This report may contain forward-looking statements concerning the business prospects, projections of operating and financial results and growth outlook of PINE. These are merelyprojections and as such are based solely on management’s expectations regarding the future of the business. These statements depend substantially on market conditions, theperformance of the sector and the Brazilian economy (political and economic changes, volatility in interest and exchange rates, technological changes, inflation, financialdisintermediation, competitive pressures on products and prices and changes in tax legislation) and therefore are subject to change without prior notice..