4Q20 Earnings Call
32
4Q20 Earnings Call February 2, 2021 1
Transcript of 4Q20 Earnings Call

4Q20 Earnings Call
February 2, 2021
1

Scott Childress
Investor Relations Officer
2

© 2021 United Parcel Service of America, Inc. UPS, the UPS brandmark, and the color dark brown tone are trademarks of United Parcel Service of America, Inc. All rights reserved.
UPSSpeakers
Carol B. Tomé
Chief Executive Officer
Brian Newman
Chief Financial Officer
3
© 2021 United Parcel Service of America, Inc. UPS, the UPS brandmark, and the color dark brown tone are trademarks of United Parcel Service of America, Inc. All rights reserved.
Forward-Looking Statements
This release and our other filings with the Securities and Exchange Commission contain and in the future maycontain “forward-looking statements” within the meaning of the Private Securities Litigation Reform Act of 1995.Statements other than those of current or historical fact, and all statements accompanied by terms such as “will,”“believe,” “project,” “expect,” “estimate,” “assume,” “intend,” “anticipate,” “target,” “plan,” and similar terms, areintended to be forward-looking statements. Forward-looking statements are made subject to the safe harborprovisions of the federal securities laws pursuant to Section 27A of the Securities Act of 1933 and Section 21E ofthe Securities Exchange Act of 1934.
From time to time, we also include written or oral forward-looking statements in other publicly disclosed materials.Such statements may relate to our intent, belief and current expectations about our strategic direction, prospectsand future results, and give our current expectations or forecasts of future events; they do not relate strictly tohistorical or current facts. Management believes that these forward-looking statements are reasonable as andwhen made. However, caution should be taken not to place undue reliance on any forward-looking statementsbecause such statements speak only as of the date when made.
Forward-looking statements are subject to certain risks and uncertainties that could cause actual results to differmaterially from our historical experience and our present expectations or anticipated results. These risks anduncertainties, include, but are not limited to: continued uncertainties related to the impact of the COVID-19pandemic on our business and operations, financial performance and liquidity, our customers and suppliers, andon the global economy; changes in general economic conditions, in the U.S. or internationally; significantcompetition on a local, regional, national and international basis; changes in our relationships with our significantcustomers; changes in the regulatory environment in the U.S. or internationally; increased or more complexphysical or data security requirements; legal, regulatory or market responses to global climate change; results ofnegotiations and ratifications of labor contracts; strikes, work stoppages or slowdowns by our employees; theeffects of changing prices of energy, including gasoline, diesel and jet fuel, and interruptions in supplies of thesecommodities; changes in exchange rates or interest rates; uncertainty from the expected discontinuance ofLIBOR and transition to any other interest rate benchmark; our ability to maintain our brand image; our ability toattract and retain qualified employees; breaches in data security; disruptions to the Internet or our technologyinfrastructure; interruptions in or impacts on our business from natural or man-made events or disasters includingterrorist attacks, epidemics or pandemics; our ability to accurately forecast our future capital investment needs;exposure to changing economic, political and social developments in international and emerging markets;changes in business strategy, government regulations, or economic or market conditions that may result inimpairment of our assets; increases in our expenses or funding obligations relating to employee health, retiree
health and/or pension benefits; potential additional U.S. or international tax liabilities; potential claims or litigationrelated to labor and employment, personal injury, property damage, business practices, environmental liabilityand other matters; our ability to realize the anticipated benefits from acquisitions, dispositions, joint ventures orstrategic alliances; our ability to realize the anticipated benefits from our transformation initiatives; cyclical andseasonal fluctuations in our operating results; our ability to manage insurance and claims expenses; and otherrisks discussed in our filings with the Securities and Exchange Commission from time to time, including ourAnnual Report on Form 10-K for the year ended December 31, 2019, our Quarterly Report on Form 10-Q for thequarter ended March 31, 2020 and subsequently filed reports. You should consider the limitations on, and risksassociated with, forward-looking statements and not unduly rely on the accuracy of predictions contained in suchforward-looking statements. We do not undertake any obligation to update forward-looking statements to reflectevents, circumstances, changes in expectations, or the occurrence of unanticipated events after the date of thosestatements.
Information, including comparisons to prior periods, may reflect adjusted results. See the appendix forreconciliations of adjusted results and other non-GAAP financial measures.
Forward-Looking Statements and Non-GAAP Reconciliations
4
© 2021 United Parcel Service of America, Inc. UPS, the UPS brandmark, and the color dark brown tone are trademarks of United Parcel Service of America, Inc. All rights reserved.
-$5.00
-$4.00
-$3.00
-$2.00
-$1.00
$0.00
$1.00
$2.00
$3.00
4Q19 EPS Defined BenefitPlans MTMChanges
Transformation& Other
LegalContingenciesand Expenses
4Q19 Adj. EPS*
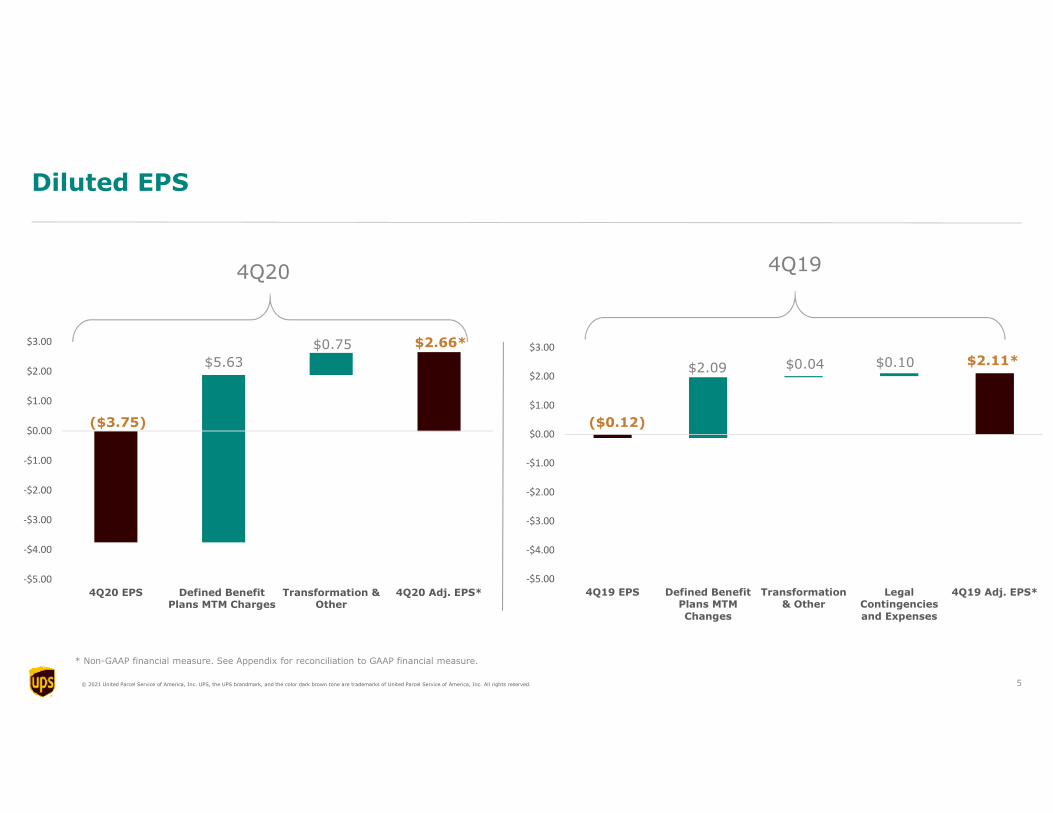
Diluted EPS
* Non-GAAP financial measure. See Appendix for reconciliation to GAAP financial measure.
($0.12)
$2.11*$2.09 $0.04 $0.10
4Q19
-$5.00
-$4.00
-$3.00
-$2.00
-$1.00
$0.00
$1.00
$2.00
$3.00
4Q20 EPS Defined BenefitPlans MTM Charges
Transformation &Other
4Q20 Adj. EPS*
($3.75)
$2.66*
$5.63
$0.75
4Q20
5

Chief Executive Officer
Carol Tomé
6

© 2021 United Parcel Service of America, Inc. UPS, the UPS brandmark, and the color dark brown tone are trademarks of United Parcel Service of America, Inc. All rights reserved.
Thank YouUPSers
7
© 2021 United Parcel Service of America, Inc. UPS, the UPS brandmark, and the color dark brown tone are trademarks of United Parcel Service of America, Inc. All rights reserved.
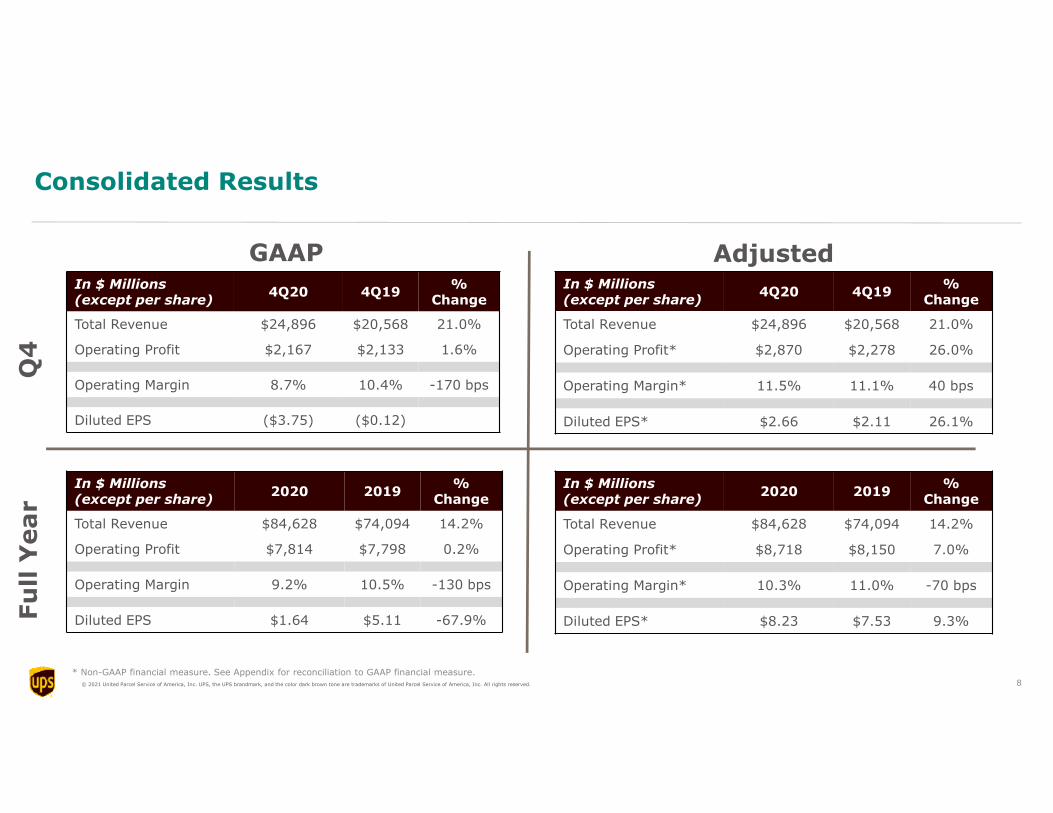
Consolidated Results
In $ Millions(except per share)
4Q20 4Q19%
Change
Total Revenue $24,896 $20,568 21.0%
Operating Profit $2,167 $2,133 1.6%
Operating Margin 8.7% 10.4% -170 bps
Diluted EPS ($3.75) ($0.12)
GAAP Adjusted
* Non-GAAP financial measure. See Appendix for reconciliation to GAAP financial measure.
In $ Millions(except per share)
4Q20 4Q19%
Change
Total Revenue $24,896 $20,568 21.0%
Operating Profit* $2,870 $2,278 26.0%
Operating Margin* 11.5% 11.1% 40 bps
Diluted EPS* $2.66 $2.11 26.1%
Q4
Fu
llY
ear
In $ Millions(except per share)
2020 2019%
Change
Total Revenue $84,628 $74,094 14.2%
Operating Profit $7,814 $7,798 0.2%
Operating Margin 9.2% 10.5% -130 bps
Diluted EPS $1.64 $5.11 -67.9%
In $ Millions(except per share)
2020 2019%
Change
Total Revenue $84,628 $74,094 14.2%
Operating Profit* $8,718 $8,150 7.0%
Operating Margin* 10.3% 11.0% -70 bps
Diluted EPS* $8.23 $7.53 9.3%
8
© 2021 United Parcel Service of America, Inc. UPS, the UPS brandmark, and the color dark brown tone are trademarks of United Parcel Service of America, Inc. All rights reserved.
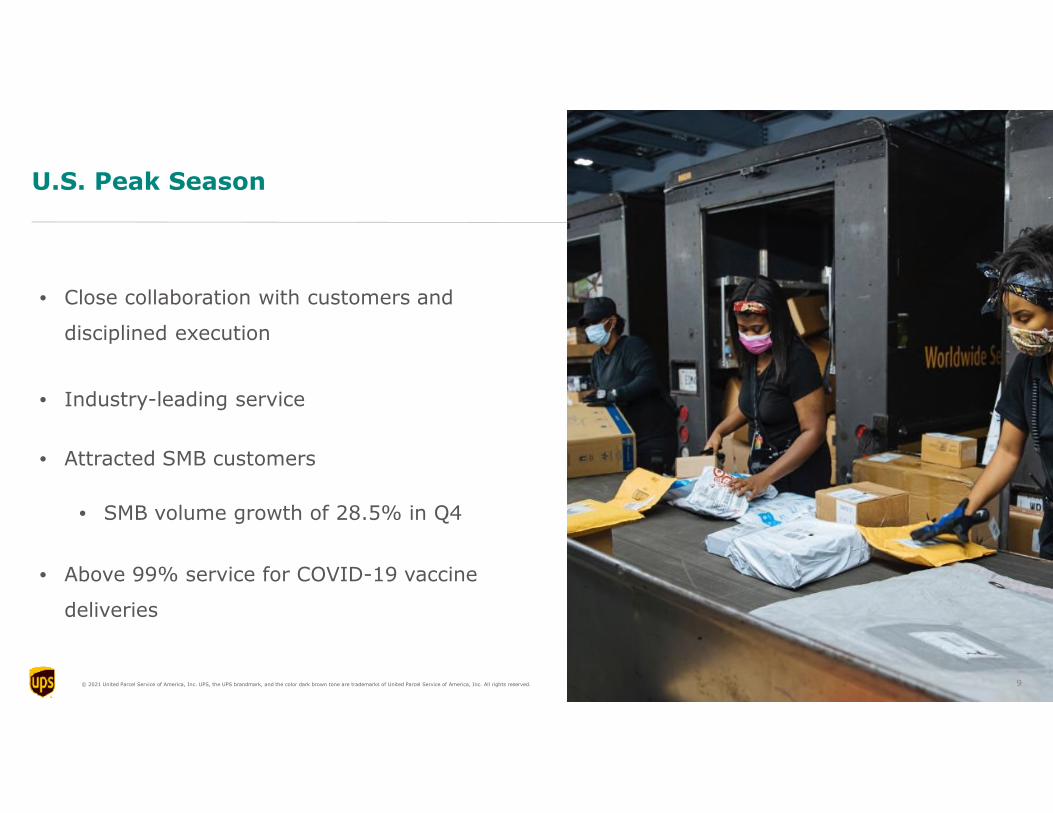
U.S. Peak Season
• Close collaboration with customers and
disciplined execution
• Industry-leading service
• Attracted SMB customers
• SMB volume growth of 28.5% in Q4
• Above 99% service for COVID-19 vaccine
deliveries
9
© 2021 United Parcel Service of America, Inc. UPS, the UPS brandmark, and the color dark brown tone are trademarks of United Parcel Service of America, Inc. All rights reserved.
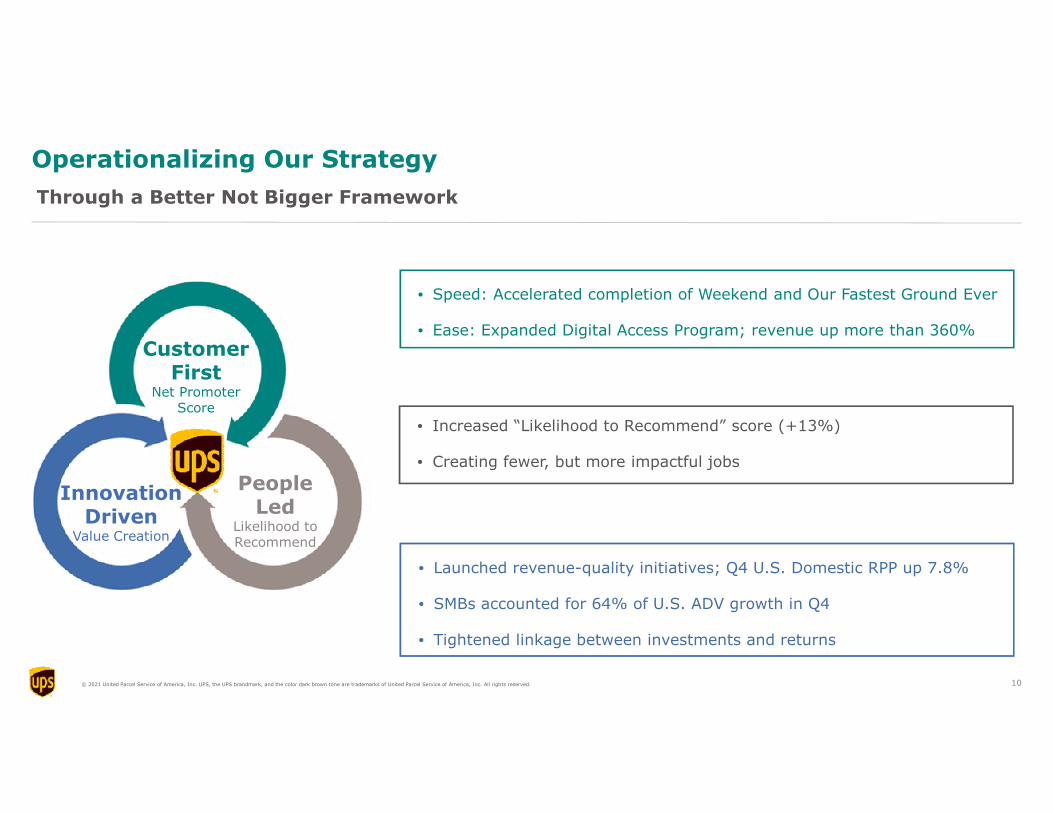
Operationalizing Our Strategy
Through a Better Not Bigger Framework
CustomerFirst
Net PromoterScore
InnovationDriven
Value Creation
PeopleLed
Likelihood toRecommend
• Speed: Accelerated completion of Weekend and Our Fastest Ground Ever
• Ease: Expanded Digital Access Program; revenue up more than 360%
• Launched revenue-quality initiatives; Q4 U.S. Domestic RPP up 7.8%
• SMBs accounted for 64% of U.S. ADV growth in Q4
• Tightened linkage between investments and returns
• Increased “Likelihood to Recommend” score (+13%)
• Creating fewer, but more impactful jobs
10
© 2021 United Parcel Service of America, Inc. UPS, the UPS brandmark, and the color dark brown tone are trademarks of United Parcel Service of America, Inc. All rights reserved.
Everything is Under Review
Better Not Bigger
• We entered an agreement to sell UPS Freight
• Divestiture is expected to improve overall
company margin and return on invested capital
• Proceeds will be used to pay down long-term debt
11
© 2021 United Parcel Service of America, Inc. UPS, the UPS brandmark, and the color dark brown tone are trademarks of United Parcel Service of America, Inc. All rights reserved.
Looking Ahead to 2021
• We are optimistic about the future
• Revenue-quality and productivity initiativesshould result in:
• Operating margin expansion
• Increased ROIC
• We are not providing revenue or EPSguidance due to continuing uncertainty onvaccine rollout and macro-environment
12

Chief Financial Officer
Brian Newman
13
© 2021 United Parcel Service of America, Inc. UPS, the UPS brandmark, and the color dark brown tone are trademarks of United Parcel Service of America, Inc. All rights reserved.
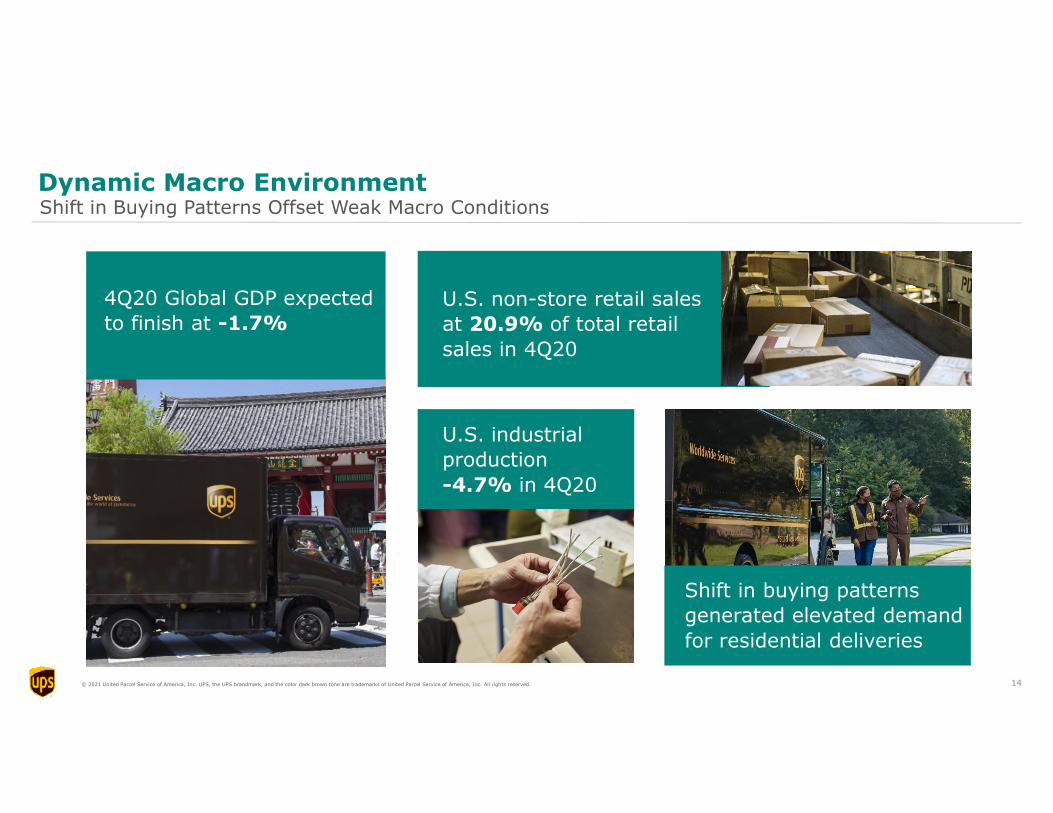
U.S. non-store retail sales
at 20.9% of total retail
sales in 4Q20
Dynamic Macro EnvironmentShift in Buying Patterns Offset Weak Macro Conditions
4Q20 Global GDP expected
to finish at -1.7%
U.S. industrial
production
-4.7% in 4Q20
Shift in buying patterns
generated elevated demand
for residential deliveries
14
© 2021 United Parcel Service of America, Inc. UPS, the UPS brandmark, and the color dark brown tone are trademarks of United Parcel Service of America, Inc. All rights reserved.
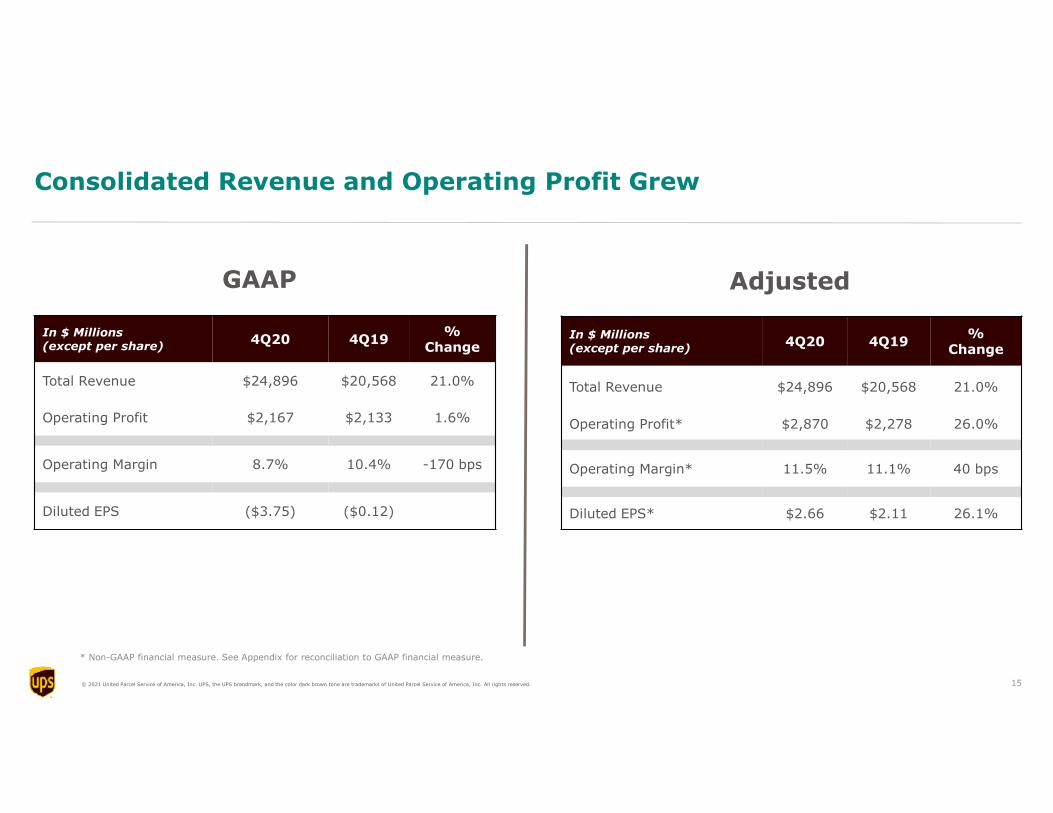
Consolidated Revenue and Operating Profit Grew
GAAP Adjusted
* Non-GAAP financial measure. See Appendix for reconciliation to GAAP financial measure.
In $ Millions(except per share)
4Q20 4Q19%
Change
Total Revenue $24,896 $20,568 21.0%
Operating Profit $2,167 $2,133 1.6%
Operating Margin 8.7% 10.4% -170 bps
Diluted EPS ($3.75) ($0.12)
In $ Millions(except per share)
4Q20 4Q19%
Change
Total Revenue $24,896 $20,568 21.0%
Operating Profit* $2,870 $2,278 26.0%
Operating Margin* 11.5% 11.1% 40 bps
Diluted EPS* $2.66 $2.11 26.1%
15
© 2021 United Parcel Service of America, Inc. UPS, the UPS brandmark, and the color dark brown tone are trademarks of United Parcel Service of America, Inc. All rights reserved.
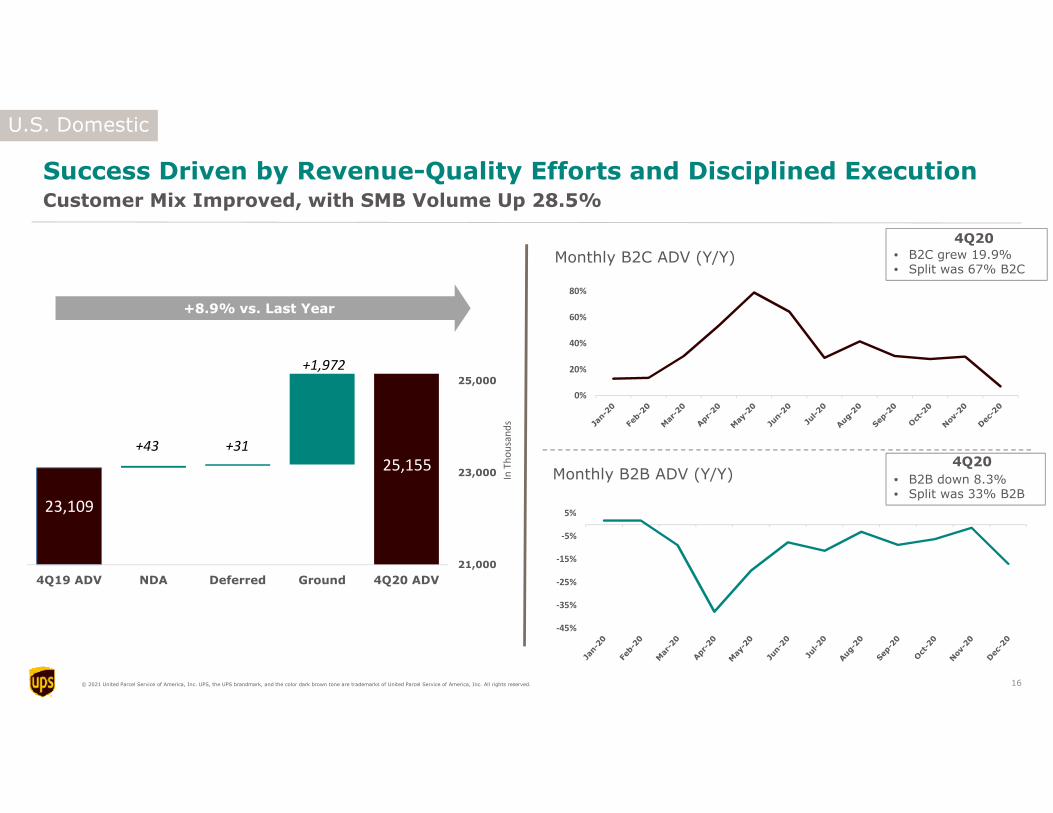
Success Driven by Revenue-Quality Efforts and Disciplined Execution
21,000
23,000
25,000
4Q20 ADVGroundDeferredNDA4Q19 ADV
InTh
ou
san
ds
+43
23,109
25,155+31
+8.9% vs. Last Year
+1,972
Monthly B2C ADV (Y/Y)
Monthly B2B ADV (Y/Y)
U.S. Domestic
Customer Mix Improved, with SMB Volume Up 28.5%
• B2C grew 19.9%• Split was 67% B2C
• B2B down 8.3%• Split was 33% B2B
4Q20
4Q20
0%
20%
40%
60%
80%
-45%
-35%
-25%
-15%
-5%
5%
16
© 2021 United Parcel Service of America, Inc. UPS, the UPS brandmark, and the color dark brown tone are trademarks of United Parcel Service of America, Inc. All rights reserved.
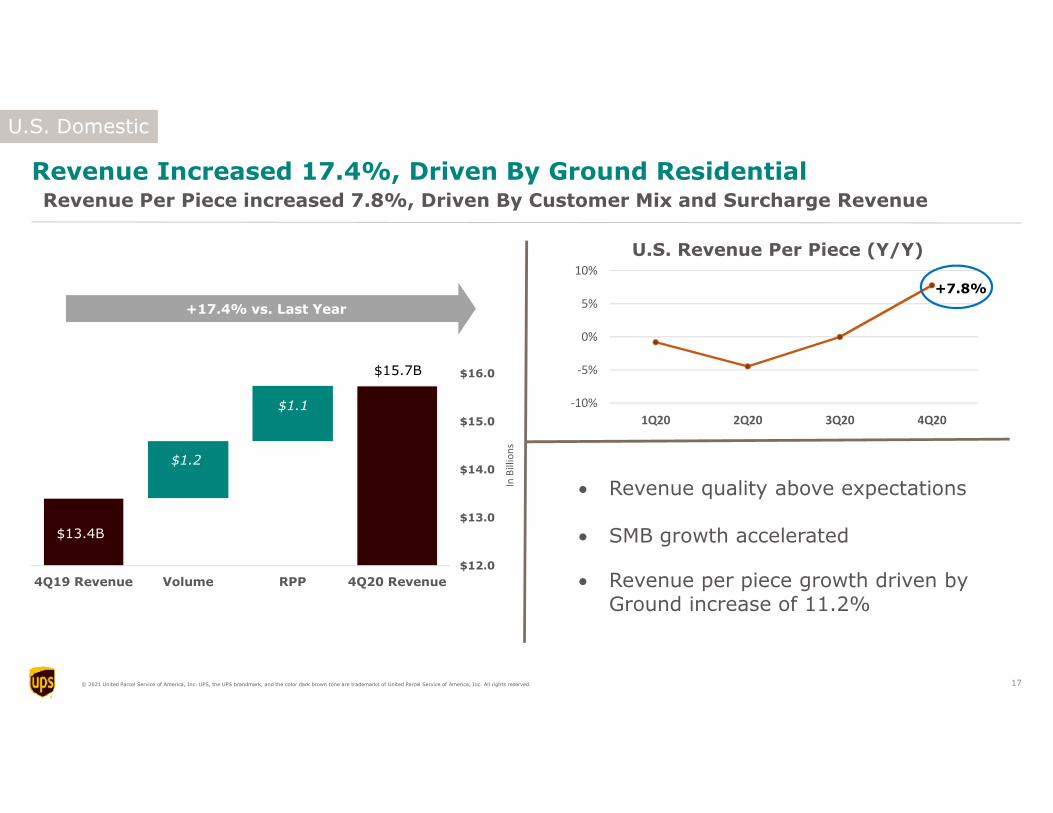
Revenue quality above expectations
SMB growth accelerated
Revenue per piece growth driven byGround increase of 11.2%
Revenue Increased 17.4%, Driven By Ground Residential
U.S. Domestic
$12.0
$13.0
$14.0
$15.0
$16.0
4Q20 RevenueRPPVolume4Q19 Revenue
InB
illio
ns
$1.1
$13.4B
$15.7B
$1.2
+17.4% vs. Last Year
Revenue Per Piece increased 7.8%, Driven By Customer Mix and Surcharge Revenue
-10%
-5%
0%
5%
10%
1Q20 2Q20 3Q20 4Q20
U.S. Revenue Per Piece (Y/Y)
+7.8%
17
© 2021 United Parcel Service of America, Inc. UPS, the UPS brandmark, and the color dark brown tone are trademarks of United Parcel Service of America, Inc. All rights reserved.
4Q20 OperatingProfit
Performance4Q19 OperatingProfit
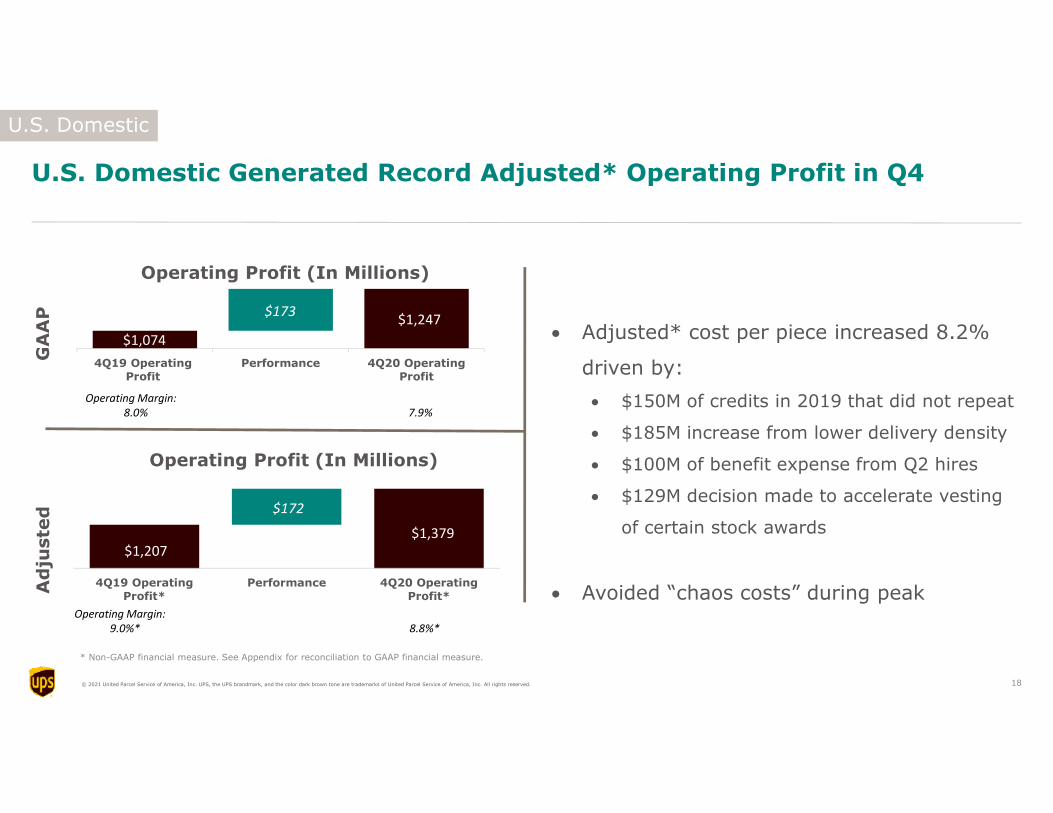
$173$1,247
$1,074
Operating Margin:8.0% 7.9%
U.S. Domestic Generated Record Adjusted* Operating Profit in Q4
U.S. Domestic
GA
AP
Operating Profit (In Millions)
4Q20 OperatingProfit*
Performance4Q19 OperatingProfit*
$172
$1,379$1,207
Operating Margin:9.0%* 8.8%*
Operating Profit (In Millions)
* Non-GAAP financial measure. See Appendix for reconciliation to GAAP financial measure.
Ad
juste
d
Adjusted* cost per piece increased 8.2%
driven by:
$150M of credits in 2019 that did not repeat
$185M increase from lower delivery density
$100M of benefit expense from Q2 hires
$129M decision made to accelerate vesting
of certain stock awards
Avoided “chaos costs” during peak
18
© 2021 United Parcel Service of America, Inc. UPS, the UPS brandmark, and the color dark brown tone are trademarks of United Parcel Service of America, Inc. All rights reserved.
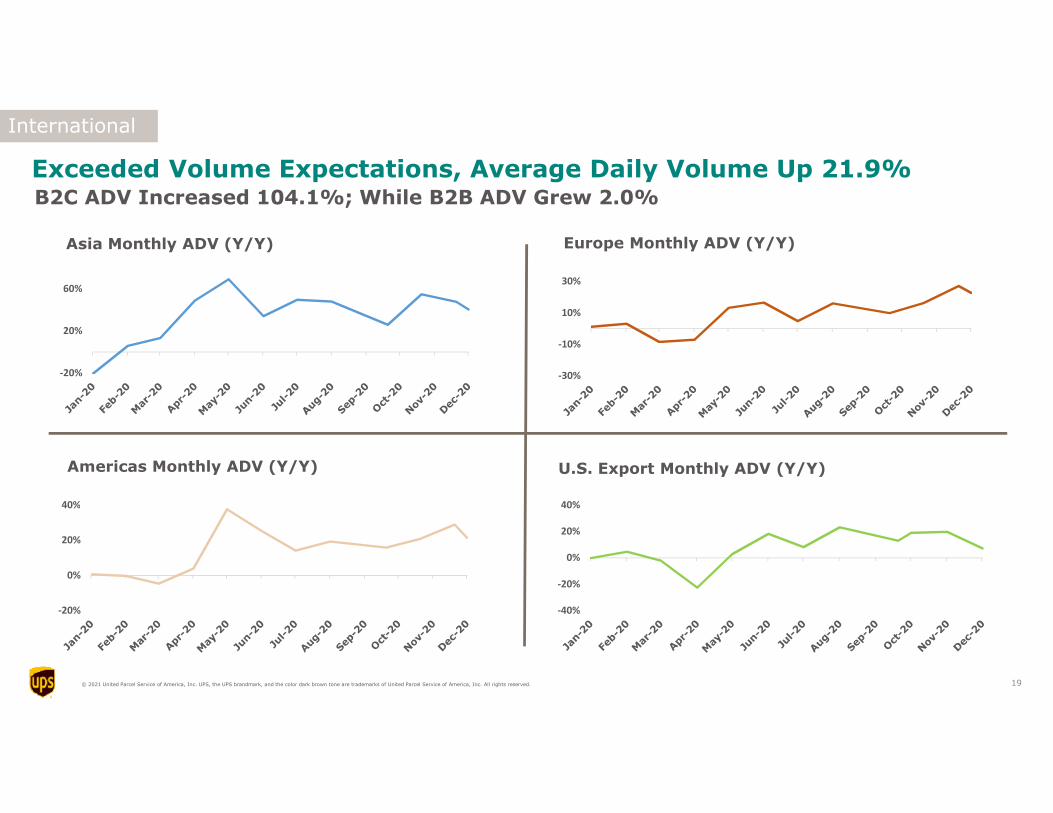
Exceeded Volume Expectations, Average Daily Volume Up 21.9%
Asia Monthly ADV (Y/Y)
Americas Monthly ADV (Y/Y) U.S. Export Monthly ADV (Y/Y)
Europe Monthly ADV (Y/Y)
B2C ADV Increased 104.1%; While B2B ADV Grew 2.0%
International
-20%
20%
60%
-30%
-10%
10%
30%
-20%
0%
20%
40%
-40%
-20%
0%
20%
40%
19
© 2021 United Parcel Service of America, Inc. UPS, the UPS brandmark, and the color dark brown tone are trademarks of United Parcel Service of America, Inc. All rights reserved. 20
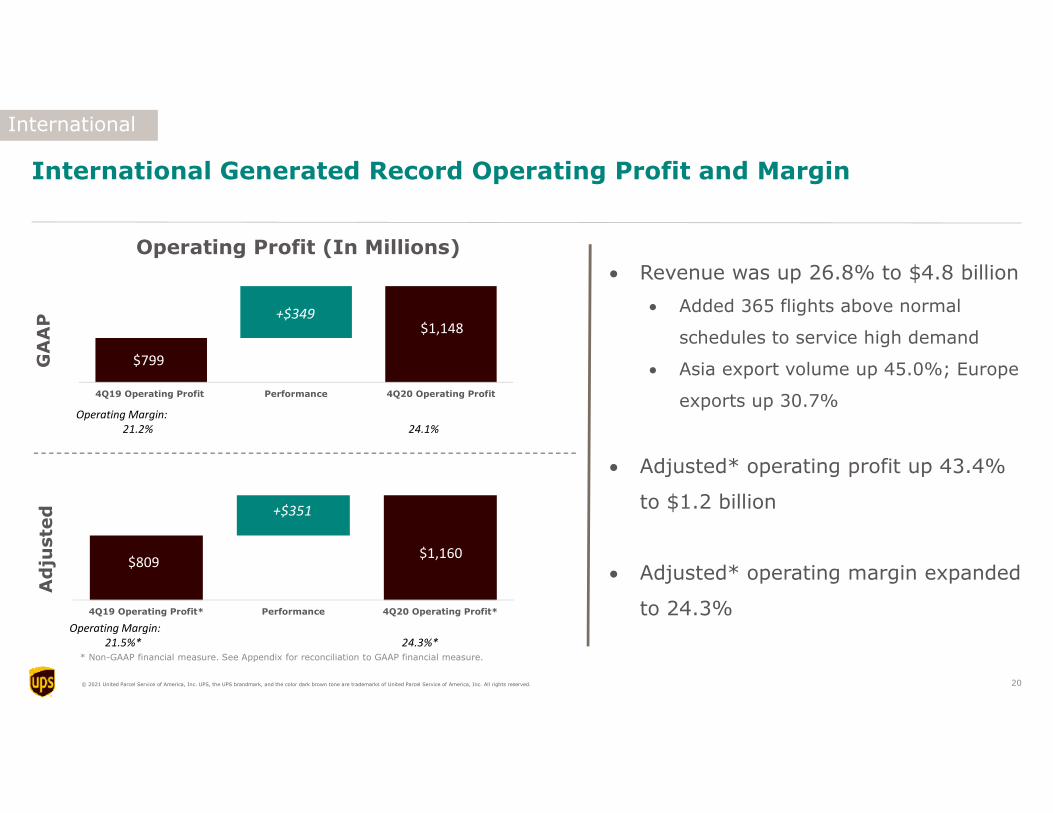
International Generated Record Operating Profit and Margin
International
4Q20 Operating Profit*Performance4Q19 Operating Profit*
$809$1,160
+$351
Operating Margin:21.5%* 24.3%*
Operating Profit (In Millions)
GA
AP
Ad
juste
d
4Q20 Operating ProfitPerformance4Q19 Operating Profit
$1,148
$799
+$349
Operating Margin:21.2% 24.1%
Revenue was up 26.8% to $4.8 billion
Added 365 flights above normal
schedules to service high demand
Asia export volume up 45.0%; Europe
exports up 30.7%
Adjusted* operating profit up 43.4%
to $1.2 billion
Adjusted* operating margin expanded
to 24.3%
* Non-GAAP financial measure. See Appendix for reconciliation to GAAP financial measure.
© 2021 United Parcel Service of America, Inc. UPS, the UPS brandmark, and the color dark brown tone are trademarks of United Parcel Service of America, Inc. All rights reserved.
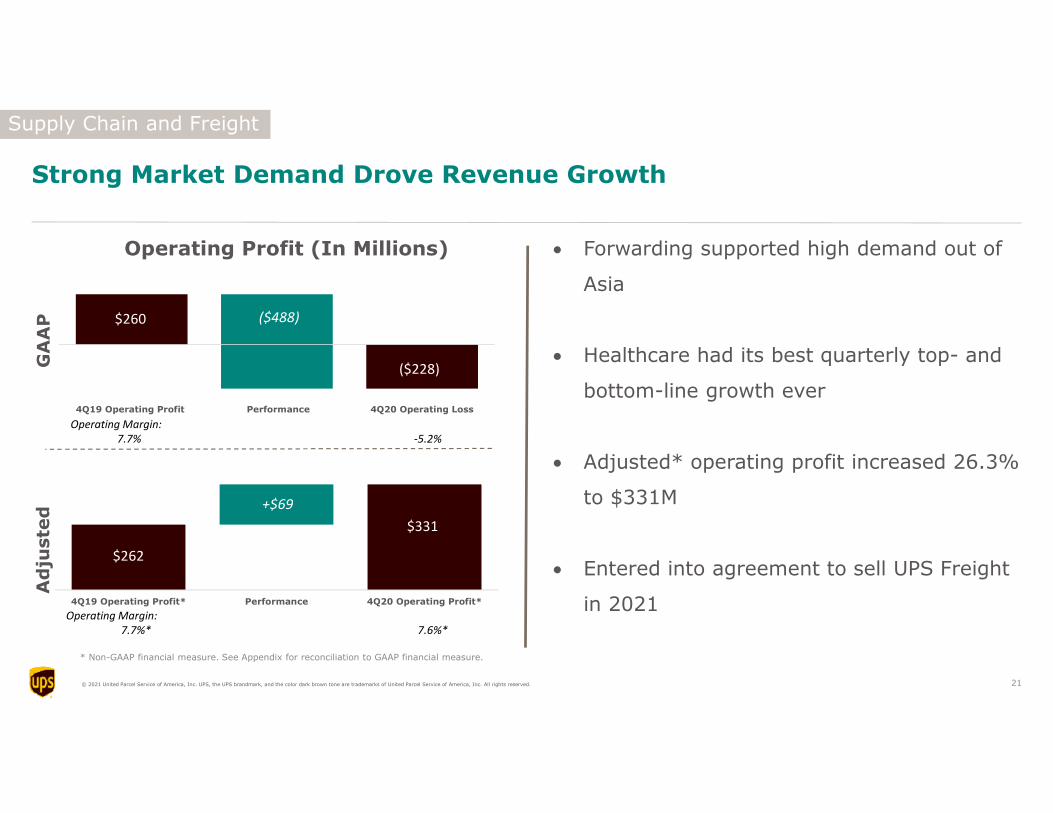
Strong Market Demand Drove Revenue Growth
Supply Chain and Freight
4Q20 Operating LossPerformance4Q19 Operating Profit
($228)
$260 ($488)
Operating Margin:7.7% -5.2%
Operating Profit (In Millions)
4Q20 Operating Profit*Performance4Q19 Operating Profit*
$331
$262
+$69
Operating Margin:7.7%* 7.6%*
GA
AP
Ad
juste
d
* Non-GAAP financial measure. See Appendix for reconciliation to GAAP financial measure.
Forwarding supported high demand out of
Asia
Healthcare had its best quarterly top- and
bottom-line growth ever
Adjusted* operating profit increased 26.3%
to $331M
Entered into agreement to sell UPS Freight
in 2021
21
© 2021 United Parcel Service of America, Inc. UPS, the UPS brandmark, and the color dark brown tone are trademarks of United Parcel Service of America, Inc. All rights reserved.
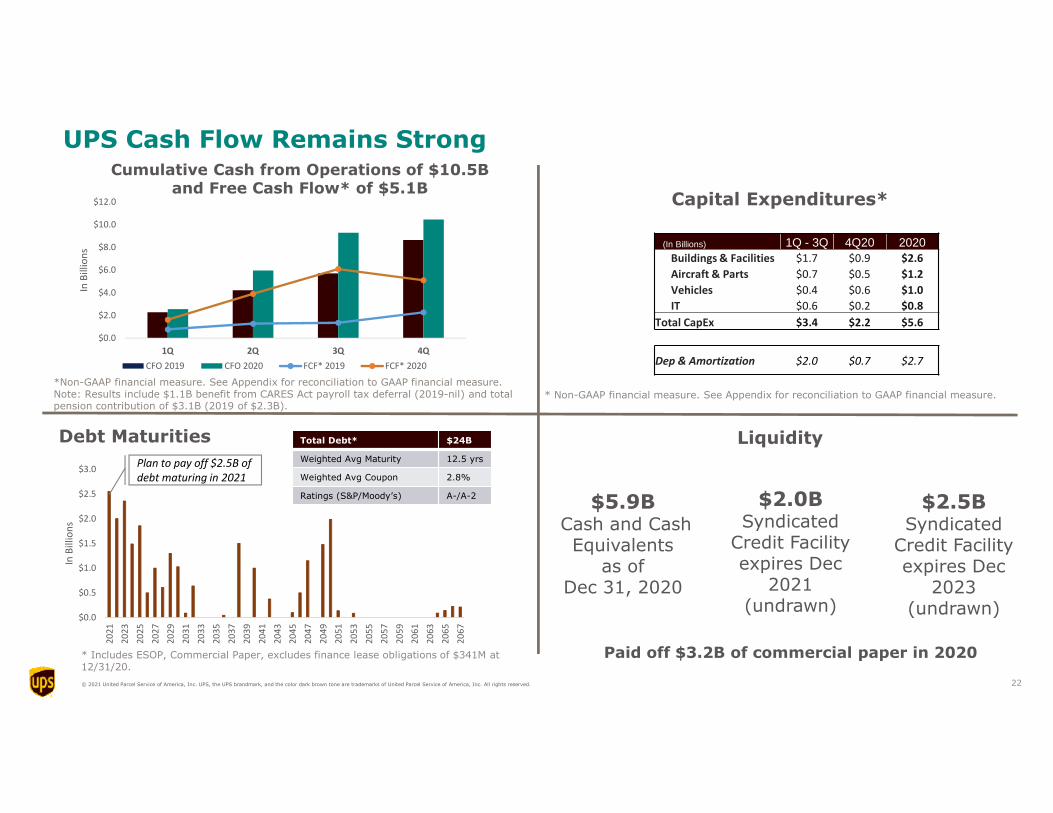
UPS Cash Flow Remains Strong
Capital Expenditures*
Cumulative Cash from Operations of $10.5Band Free Cash Flow* of $5.1B
*Non-GAAP financial measure. See Appendix for reconciliation to GAAP financial measure.Note: Results include $1.1B benefit from CARES Act payroll tax deferral (2019-nil) and totalpension contribution of $3.1B (2019 of $2.3B).
Debt Maturities Total Debt* $24B
Weighted Avg Maturity 12.5 yrs
Weighted Avg Coupon 2.8%
Ratings (S&P/Moody’s) A-/A-2
* Non-GAAP financial measure. See Appendix for reconciliation to GAAP financial measure.
Liquidity
$5.9BCash and CashEquivalents
as ofDec 31, 2020
$2.0BSyndicated
Credit Facilityexpires Dec
2021(undrawn)
$2.5BSyndicated
Credit Facilityexpires Dec
2023(undrawn)
* Includes ESOP, Commercial Paper, excludes finance lease obligations of $341M at12/31/20.
$0.0
$2.0
$4.0
$6.0
$8.0
$10.0
$12.0
1Q 2Q 3Q 4Q
InB
illio
ns
CFO 2019 CFO 2020 FCF* 2019 FCF* 2020
(In Billions) 1Q - 3Q 4Q20 2020
Buildings & Facilities $1.7 $0.9 $2.6
Aircraft & Parts $0.7 $0.5 $1.2
Vehicles $0.4 $0.6 $1.0
IT $0.6 $0.2 $0.8
Total CapEx $3.4 $2.2 $5.6
Dep & Amortization $2.0 $0.7 $2.7
$0.0
$0.5
$1.0
$1.5
$2.0
$2.5
$3.0
20
21
20
23
20
25
20
27
20
29
20
31
20
33
20
35
20
37
20
39
20
41
20
43
20
45
20
47
20
49
20
51
20
53
20
55
20
57
20
59
20
61
20
63
20
65
20
67
InB
illio
ns
Plan to pay off $2.5B ofdebt maturing in 2021
Paid off $3.2B of commercial paper in 2020
22
© 2021 United Parcel Service of America, Inc. UPS, the UPS brandmark, and the color dark brown tone are trademarks of United Parcel Service of America, Inc. All rights reserved.
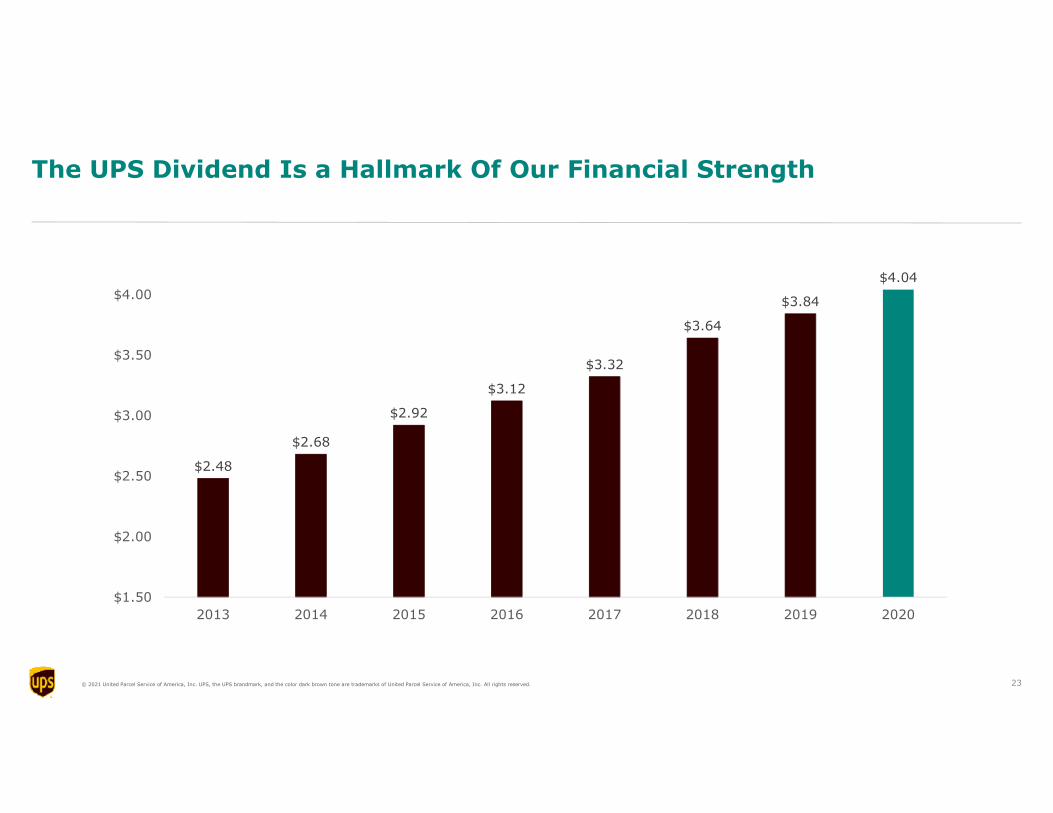
The UPS Dividend Is a Hallmark Of Our Financial Strength
$2.48
$2.68
$2.92
$3.12
$3.32
$3.64
$3.84
$4.04
$1.50
$2.00
$2.50
$3.00
$3.50
$4.00
2013 2014 2015 2016 2017 2018 2019 2020
23
© 2021 United Parcel Service of America, Inc. UPS, the UPS brandmark, and the color dark brown tone are trademarks of United Parcel Service of America, Inc. All rights reserved.
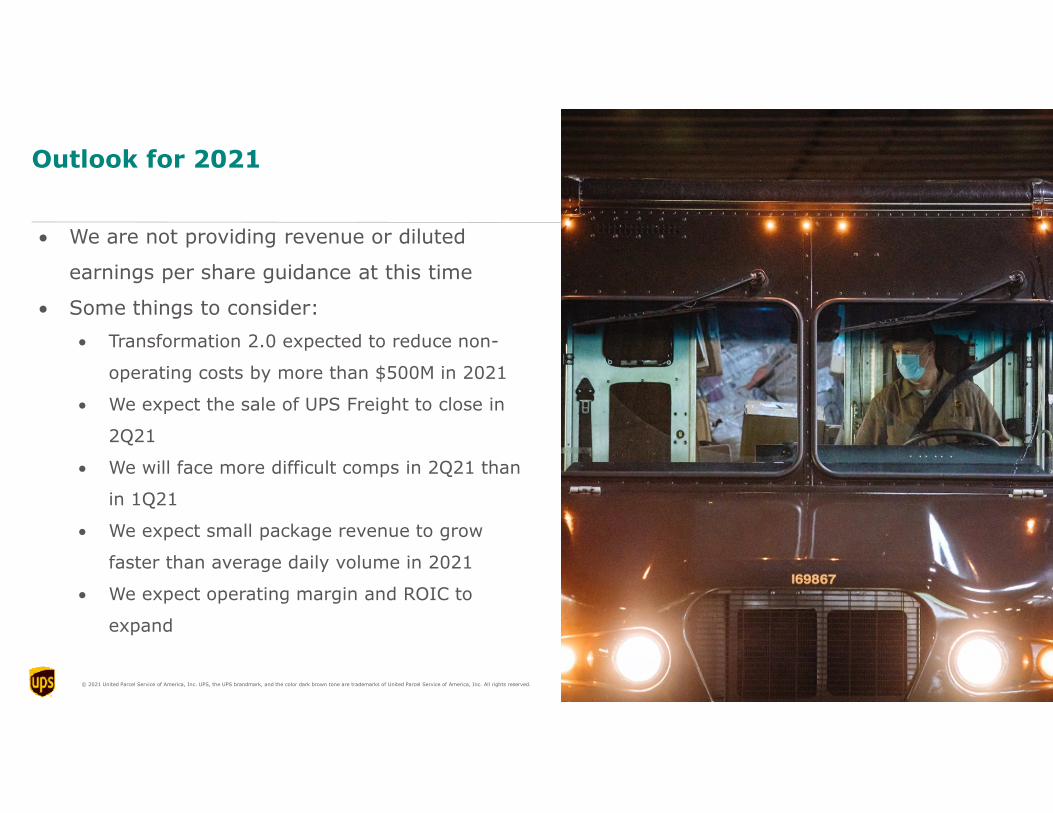
Outlook for 2021
We are not providing revenue or diluted
earnings per share guidance at this time
Some things to consider:
Transformation 2.0 expected to reduce non-
operating costs by more than $500M in 2021
We expect the sale of UPS Freight to close in
2Q21
We will face more difficult comps in 2Q21 than
in 1Q21
We expect small package revenue to grow
faster than average daily volume in 2021
We expect operating margin and ROIC to
expand
24
© 2021 United Parcel Service of America, Inc. UPS, the UPS brandmark, and the color dark brown tone are trademarks of United Parcel Service of America, Inc. All rights reserved.
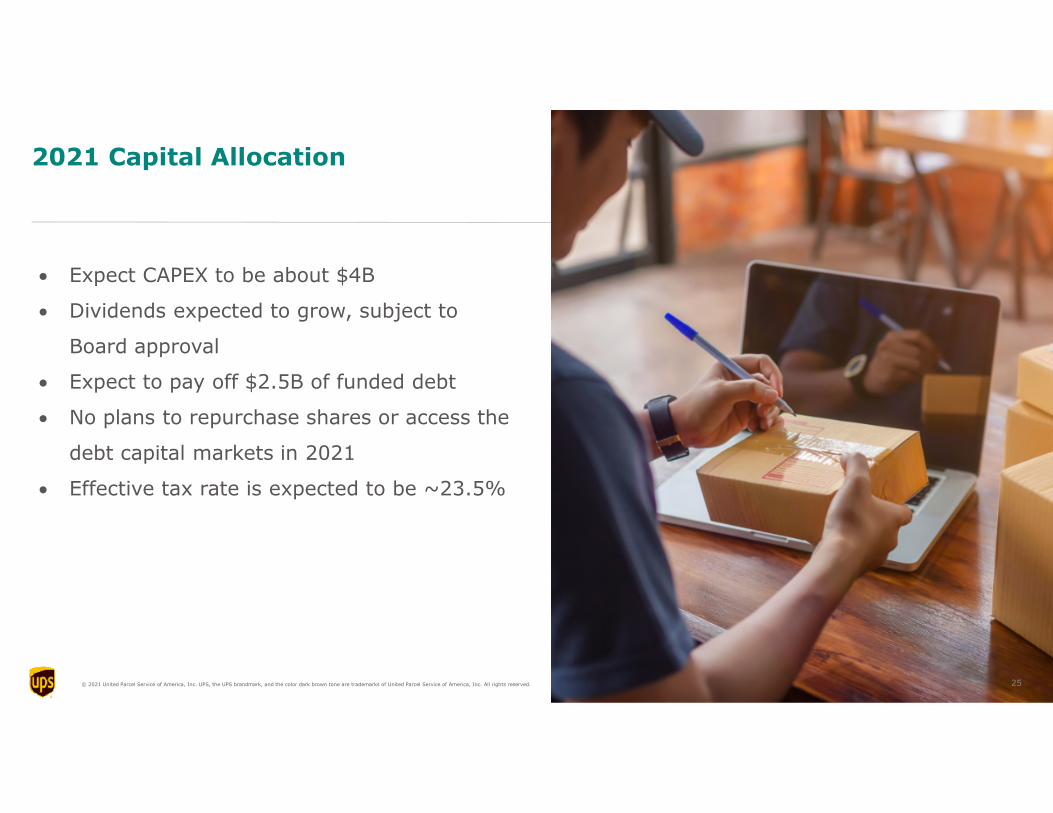
2021 Capital Allocation
Expect CAPEX to be about $4B
Dividends expected to grow, subject to
Board approval
Expect to pay off $2.5B of funded debt
No plans to repurchase shares or access the
debt capital markets in 2021
Effective tax rate is expected to be ~23.5%
25

© 2021 United Parcel Service of America, Inc. UPS, the UPS brandmark, and the color dark brown tone are trademarks of United Parcel Service of America, Inc. All rights reserved.
UPS Investor Meeting
Wednesday, June 9
Investor Day
UPS Investor Day
26

© 2021 United Parcel Service of America, Inc. UPS, the UPS brandmark, and the color dark brown tone are trademarks of United Parcel Service of America, Inc. All rights reserved.
Questions &Answers
27
© 2021 United Parcel Service of America, Inc. UPS, the UPS brandmark, and the color dark brown tone are trademarks of United Parcel Service of America, Inc. All rights reserved.
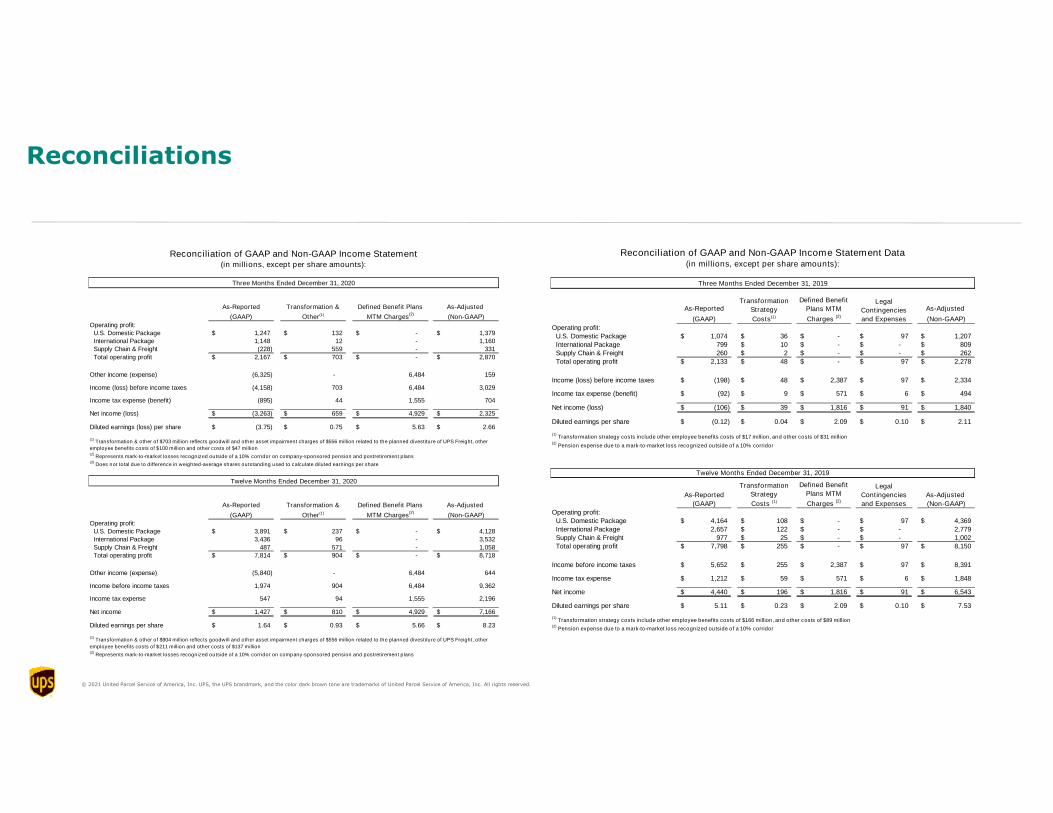
Reconciliation of GAAP and Non-GAAP Financial MeasuresReconciliation of GAAP and non-GAAP Financial Measures
We supplement the reporting of our financial information determined under generally acceptedaccounting principles ("GAAP") with certain non-GAAP financial measures, including "adjusted"compensation and benefits, operating expenses, operating profit, operating margin, other income and(expense), income before income taxes, income tax expense, effective tax rate, net income andearnings per share. We also supplement the reporting of revenue, revenue per piece and operatingprofit with non-GAAP measures that exclude the period over period impact of foreign currencyexchange rate changes, pension discount rate changes and hedging activities. Additionally, weperiodically disclose free cash flow, free cash flow excluding discretionary pension contributions, andcapital expenditures including principal repayments of finance lease obligations. The equivalentmeasures determined in accordance with GAAP are also referred to as "reported" or "unadjusted.”
We believe that these non-GAAP measures provide additional meaningful information to assist users ofour financial statements in understanding our financial results and cash flows and assessing ourongoing performance, because they exclude items that may not be indicative of, or are unrelated to,our underlying operations and may provide a useful baseline for analyzing trends in our underlyingbusinesses. These non-GAAP measures are used internally by management for business unit operatingperformance analysis, business unit resource allocation and in connection with incentive compensationaward determinations.
Restructuring and Other Charges
Adjusted operating profit, operating margin, income before income taxes, net income and earningsper share exclude the impact of charges related to restructuring programs, including Transformationstrategy costs and asset impairments.
Impact of Changes in Foreign Currency Exchange Rates and Hedging Activities
Currency-neutral revenue, revenue per piece and operating profit are calculated by dividing currentperiod reported U.S. dollar revenue, revenue per piece and operating profit by the current periodaverage exchange rates to derive current period local currency revenue, revenue per piece andoperating profit. The derived amounts are then multiplied by the average foreign exchange rates usedto translate the comparable results for each month in the prior year period (including the period overperiod impact of foreign currency hedging activities). The difference between the current periodreported U.S. dollar revenue, revenue per piece and operating profit and the derived current periodU.S. dollar revenue, revenue per piece and operating profit is the period over period impact ofcurrency fluctuations.
Impact of Changes in Pension Discount Rates
Non-GAAP pension discount rate-neutral operating profit excludes the period over period impact ofdiscount rate changes on pension service cost.
Pension discount rate-neutral operating profit is calculated by discounting the value of benefitsattributable to employee service in the current period utilizing the prior year discount rate applicableto each of our company-sponsored defined benefit plans. The difference between this derived amountand the current period reported service cost is the period over period impact of pension discount ratemovements on operating profit.
Mark-To-Market Pension and Postretirement Adjustments
We recognize changes in the fair value of plan assets and net actuarial gains and losses in excess of a10% corridor for our pension and postretirement defined benefit plans immediately as part of otherpension income (expense). We supplement the presentation of our income before income taxes, netincome and earnings per share with non-GAAP measures that exclude the impact of gains and lossesrecognized in excess of the 10% corridor and the related income tax effects. We believe excludingthese mark-to-market impacts provides important supplemental information by removing the volatilityassociated with short-term changes in market interest rates, equity values, and similar factors.
This adjusted net periodic benefit cost ($641 million in 2020 and $754 million in 2019) is comparableto the accounting for our defined benefit plans in our quarterly reporting under U.S. GAAP, utilizingthe expected return on plan assets (7.70% in 2020 and 7.68% in 2019) and the discount rate used todetermine net periodic benefit cost (3.55% in 2020 and 4.45% in 2019). The unadjusted net periodicbenefit cost reflects the actual return on plan assets (12.54% in 2020 and 17.57% in 2019) and thediscount rate used to measure the projected benefit obligation at the December 31 measurement date(2.87% in 2020 and 3.55% in 2019).
The deferred income tax effects of these mark-to-market pension and postretirement adjustments arecalculated by multiplying the statutory tax rates applicable in each tax jurisdiction, including the U.S.federal jurisdiction and various U.S. state and non-U.S. jurisdictions, by the adjustments. The blendedaverage of the applicable statutory tax rates in 2020 and 2019 was 24.0% and 23.9%, respectively.
Free Cash Flow and Adjusted Capital Expenditures
We calculate free cash flow as cash flows from operating activities less capital expenditures, proceedsfrom disposals of property, plant and equipment, and plus or minus the net changes in financereceivables and other investing activities. Free cash flow excluding discretionary pension contributionsadds back any discretionary pension contributions made during the period. We believe free cash flow,free cash flow excluding discretionary pension contributions and free cash flow adjusted for principalrepayments of finance lease obligations are important indicators of how much cash is generated byregular business operations and we use them as a measure of incremental cash available to invest inour business, meet our debt obligations and return cash to shareowners. Additionally, we believe thatadjusting capital expenditures for principal repayments of finance lease obligations more appropriatelyreflects the overall cash that we have invested in capital assets.
Non-GAAP financial measures should be considered in addition to, and not as an alternative for, ourreported results prepared in accordance with GAAP. Our non-GAAP financial information does notrepresent a comprehensive basis of accounting. Therefore, our non-GAAP financial information maynot be comparable to similarly titled measures reported by other companies.
© 2021 United Parcel Service of America, Inc. UPS, the UPS brandmark, and the color dark brown tone are trademarks of United Parcel Service of America, Inc. All rights reserved.
Reconciliations
As-Reported As-Adjusted
(GAAP) (Non-GAAP)
Operating profit:
U.S. Domestic Package 1,074$ 36$ -$ 97$ 1,207$
International Package 799 10$ -$ -$ 809$
Supply Chain & Freight 260 2$ -$ -$ 262$
Total operating profit 2,133$ 48$ -$ 97$ 2,278$
Income (loss) before income taxes (198)$ 48$ 2,387$ 97$ 2,334$
Income tax expense (benefit) (92)$ 9$ 571$ 6$ 494$
Net income (loss) (106)$ 39$ 1,816$ 91$ 1,840$
Diluted earnings per share (0.12)$ 0.04$ 2.09$ 0.10$ 2.11$
(1)Transformation strategy costs include other employee benefits costs of $17 million, and other costs of $31 million
(2)Pension expense due to a mark-to-market loss recognized outside of a 10% corridor
As-Reported As-Adjusted
(GAAP) (Non-GAAP)
Operating profit:
U.S. Domestic Package 4,164$ 108$ -$ 97$ 4,369$
International Package 2,657 122$ -$ -$ 2,779Supply Chain & Freight 977 25$ -$ -$ 1,002
Total operating profit 7,798$ 255$ -$ 97$ 8,150$
Income before income taxes 5,652$ 255$ 2,387$ 97$ 8,391$
Income tax expense 1,212$ 59$ 571$ 6$ 1,848$
Net income 4,440$ 196$ 1,816$ 91$ 6,543$
Diluted earnings per share 5.11$ 0.23$ 2.09$ 0.10$ 7.53$
(1)Transformation strategy costs include other employee benefits costs of $166 million, and other costs of $89 million
(2)Pension expense due to a mark-to-market loss recognized outside of a 10% corridor
Twelve Months Ended December 31, 2019
Transformation
Strategy
Costs (1)
Transformation
Strategy
Costs(1)
Three Months Ended December 31, 2019
Reconciliation of GAAP and Non-GAAP Income Statement Data(in millions, except per share amounts):
Defined Benefit
Plans MTM
Charges (2)
Legal
Contingencies
and Expenses
Defined Benefit
Plans MTM
Charges (2)
Legal
Contingencies
and Expenses
As-Reported Transformation & Defined Benefit Plans As-Adjusted
(GAAP) Other(1) MTM Charges(2)
(Non-GAAP)
Operating profit:U.S. Domestic Package 1,247$ 132$ -$ 1,379$International Package 1,148 12 - 1,160Supply Chain & Freight (228) 559 - 331
Total operating profit 2,167$ 703$ -$ 2,870$
Other income (expense) (6,325) - 6,484 159
Income (loss) before income taxes (4,158) 703 6,484 3,029
Income tax expense (benefit) (895) 44 1,555 704
Net income (loss) (3,263)$ 659$ 4,929$ 2,325$
Diluted earnings (loss) per share (3.75)$ 0.75$ 5.63$ 2.66$
(2)Represents mark-to-market losses recognized outside of a 10% corridor on company-sponsored pension and postretirement plans
(3)Does not total due to difference in weighted-average shares outstanding used to calculate diluted earnings per share
As-Reported Transformation & Defined Benefit Plans As-Adjusted
(GAAP) Other(1) MTM Charges(2)
(Non-GAAP)
Operating profit:U.S. Domestic Package 3,891$ 237$ -$ 4,128$International Package 3,436 96 - 3,532
Supply Chain & Freight 487 571 - 1,058Total operating profit 7,814$ 904$ -$ 8,718$
Other income (expense) (5,840) - 6,484 644
Income before income taxes 1,974 904 6,484 9,362
Income tax expense 547 94 1,555 2,196
Net income 1,427$ 810$ 4,929$ 7,166$
Diluted earnings per share 1.64$ 0.93$ 5.66$ 8.23$
(2)Represents mark-to-market losses recognized outside of a 10% corridor on company-sponsored pension and postretirement plans
(1)Transformation & other of $904 million reflects goodwill and other asset impairment charges of $556 million related to the planned divestiture of UPS Freight, other
employee benefits costs of $211 million and other costs of $137 million
Three Months Ended December 31, 2020
(in millions, except per share amounts):
Reconciliation of GAAP and Non-GAAP Income Statement
Twelve Months Ended December 31, 2020
(1)Transformation & other of $703 million reflects goodwill and other asset impairment charges of $556 million related to the planned divestiture of UPS Freight, other
employee benefits costs of $100 million and other costs of $47 million
© 2021 United Parcel Service of America, Inc. UPS, the UPS brandmark, and the color dark brown tone are trademarks of United Parcel Service of America, Inc. All rights reserved.
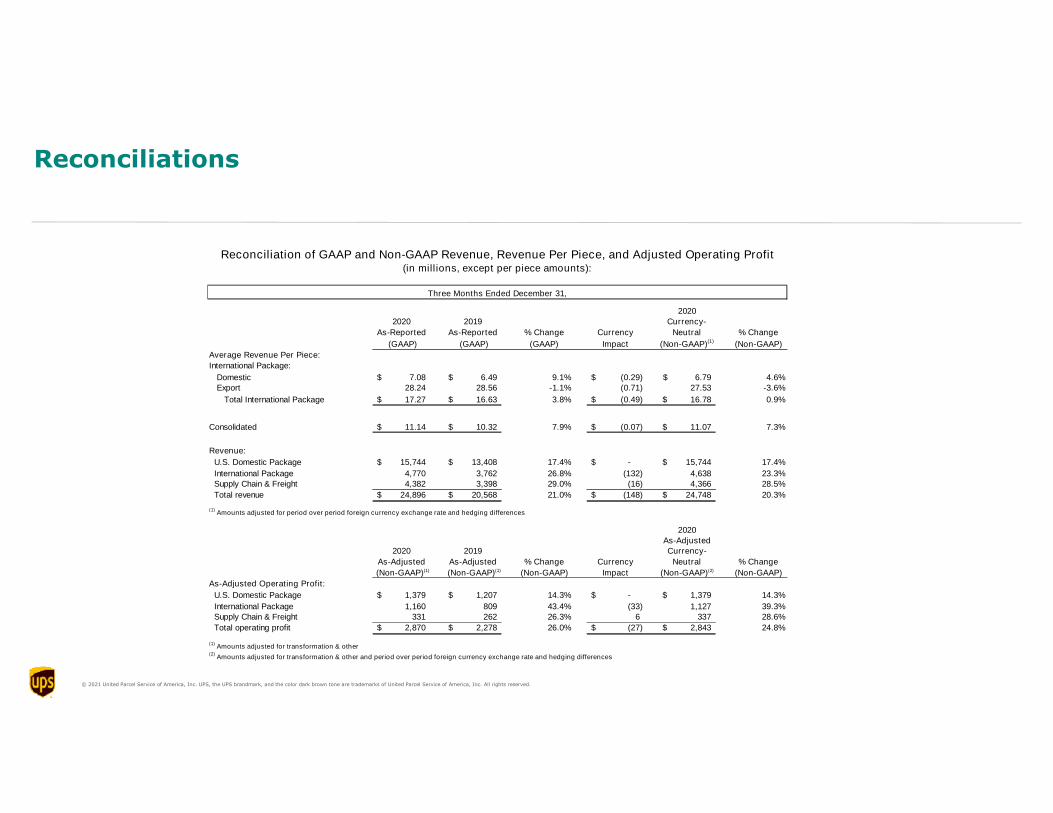
Reconciliations
2020
2020 2019 Currency-
As-Reported As-Reported % Change Currency Neutral % Change
(GAAP) (GAAP) (GAAP) Impact (Non-GAAP)(1) (Non-GAAP)
Average Revenue Per Piece:
International Package:
Domestic 7.08$ 6.49$ 9.1% (0.29)$ 6.79$ 4.6%Export 28.24 28.56 -1.1% (0.71) 27.53 -3.6%
Total International Package 17.27$ 16.63$ 3.8% (0.49)$ 16.78$ 0.9%
Consolidated 11.14$ 10.32$ 7.9% (0.07)$ 11.07$ 7.3%
Revenue:
U.S. Domestic Package 15,744$ 13,408$ 17.4% -$ 15,744$ 17.4%
International Package 4,770 3,762 26.8% (132) 4,638 23.3%Supply Chain & Freight 4,382 3,398 29.0% (16) 4,366 28.5%
Total revenue 24,896$ 20,568$ 21.0% (148)$ 24,748$ 20.3%
(1)Amounts adjusted for period over period foreign currency exchange rate and hedging differences
2020
As-Adjusted2020 2019 Currency-
As-Adjusted As-Adjusted % Change Currency Neutral % Change
(Non-GAAP)(1) (Non-GAAP)(1) (Non-GAAP) Impact (Non-GAAP)(2) (Non-GAAP)
As-Adjusted Operating Profit:
U.S. Domestic Package 1,379$ 1,207$ 14.3% -$ 1,379$ 14.3%
International Package 1,160 809 43.4% (33) 1,127 39.3%Supply Chain & Freight 331 262 26.3% 6 337 28.6%
Total operating profit 2,870$ 2,278$ 26.0% (27)$ 2,843$ 24.8%
(1)Amounts adjusted for transformation & other
(2)Amounts adjusted for transformation & other and period over period foreign currency exchange rate and hedging differences
(in millions, except per piece amounts):
Three Months Ended December 31,
Reconciliation of GAAP and Non-GAAP Revenue, Revenue Per Piece, and Adjusted Operating Profit
© 2021 United Parcel Service of America, Inc. UPS, the UPS brandmark, and the color dark brown tone are trademarks of United Parcel Service of America, Inc. All rights reserved.
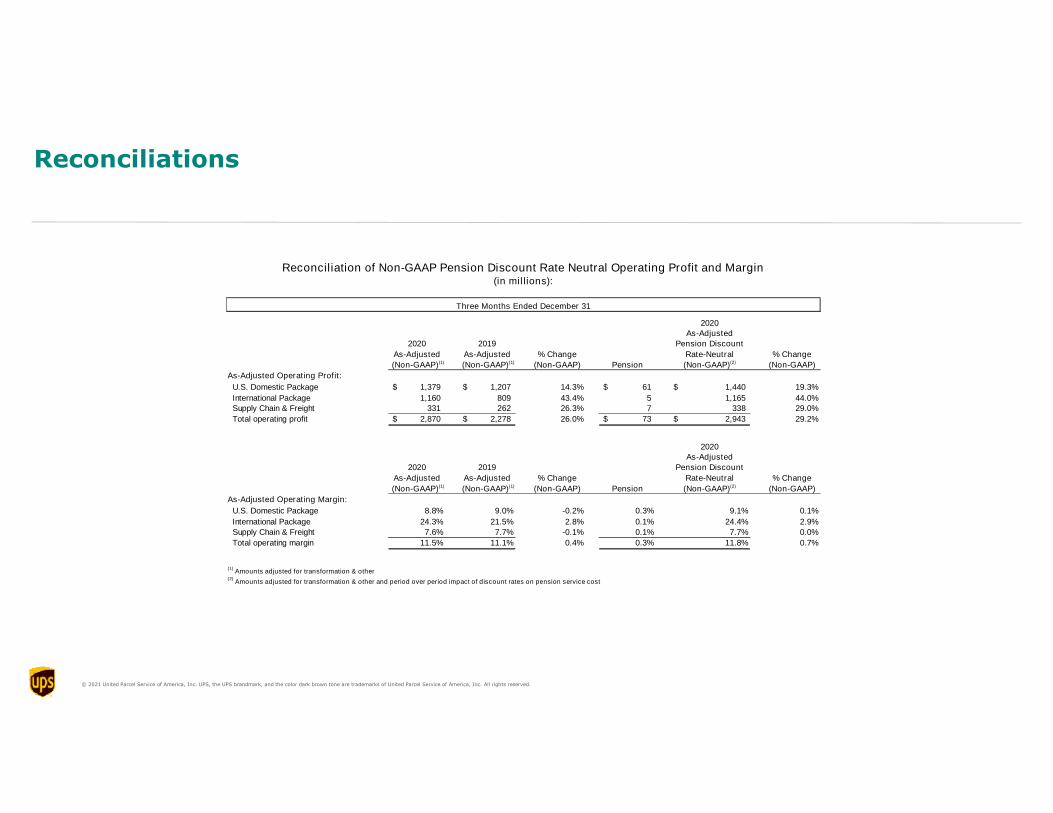
Reconciliations
2020As-Adjusted
2020 2019 Pension Discount
As-Adjusted As-Adjusted % Change Rate-Neutral % Change
(Non-GAAP)(1) (Non-GAAP)(1) (Non-GAAP) Pension (Non-GAAP)(2) (Non-GAAP)
As-Adjusted Operating Profit:
U.S. Domestic Package 1,379$ 1,207$ 14.3% 61$ 1,440$ 19.3%
International Package 1,160 809 43.4% 5 1,165 44.0%Supply Chain & Freight 331 262 26.3% 7 338 29.0%
Total operating profit 2,870$ 2,278$ 26.0% 73$ 2,943$ 29.2%
2020As-Adjusted
2020 2019 Pension Discount
As-Adjusted As-Adjusted % Change Rate-Neutral % Change
(Non-GAAP)(1) (Non-GAAP)(1) (Non-GAAP) Pension (Non-GAAP)(2) (Non-GAAP)
As-Adjusted Operating Margin:
U.S. Domestic Package 8.8% 9.0% -0.2% 0.3% 9.1% 0.1%
International Package 24.3% 21.5% 2.8% 0.1% 24.4% 2.9%
Supply Chain & Freight 7.6% 7.7% -0.1% 0.1% 7.7% 0.0%
Total operating margin 11.5% 11.1% 0.4% 0.3% 11.8% 0.7%
(1)Amounts adjusted for transformation & other
(2)Amounts adjusted for transformation & other and period over period impact of discount rates on pension service cost
Reconciliation of Non-GAAP Pension Discount Rate Neutral Operating Profit and Margin(in millions):
Three Months Ended December 31
© 2021 United Parcel Service of America, Inc. UPS, the UPS brandmark, and the color dark brown tone are trademarks of United Parcel Service of America, Inc. All rights reserved.
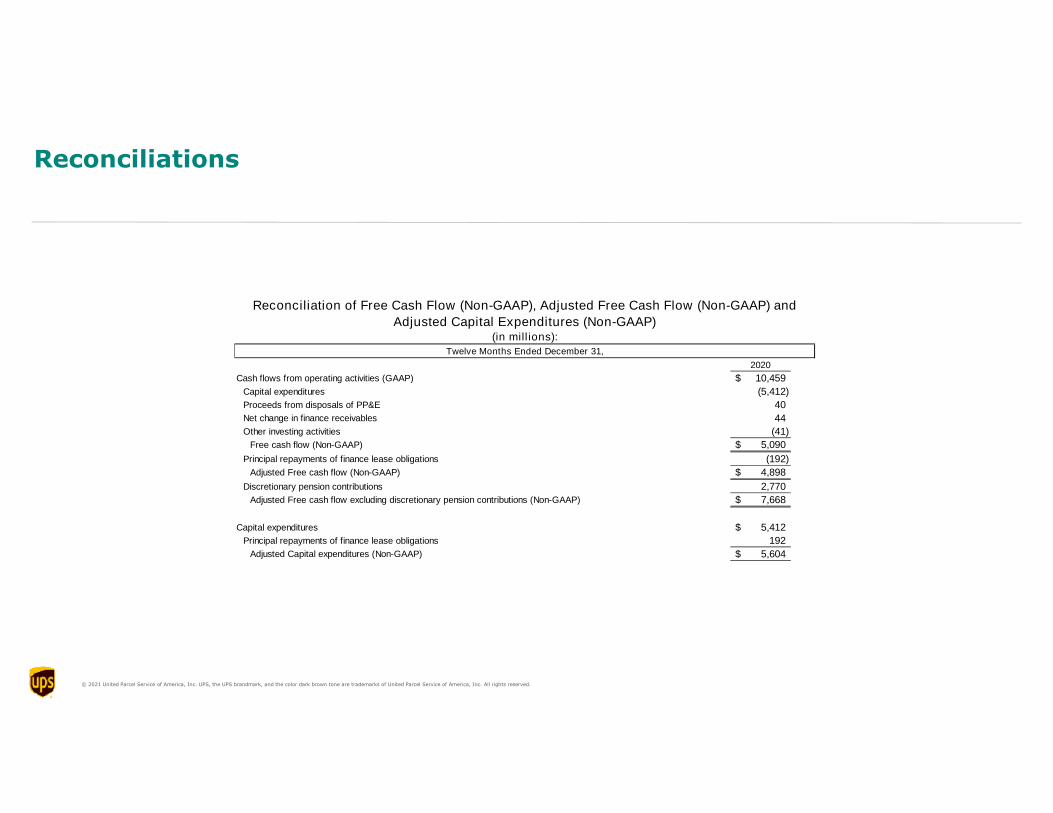
Reconciliations
2020
Cash flows from operating activities (GAAP) 10,459$
Capital expenditures (5,412)
Proceeds from disposals of PP&E 40
Net change in finance receivables 44
Other investing activities (41)
Free cash flow (Non-GAAP) 5,090$
Principal repayments of finance lease obligations (192)
Adjusted Free cash flow (Non-GAAP) 4,898$
Discretionary pension contributions 2,770
Adjusted Free cash flow excluding discretionary pension contributions (Non-GAAP) 7,668$
Capital expenditures 5,412$
Principal repayments of finance lease obligations 192
Adjusted Capital expenditures (Non-GAAP) 5,604$
(in millions):
Twelve Months Ended December 31,
Reconciliation of Free Cash Flow (Non-GAAP), Adjusted Free Cash Flow (Non-GAAP) and
Adjusted Capital Expenditures (Non-GAAP)