041-2013: A First Look at the ODS Destination for...
20
1 Paper 041-2013 A First Look at the ODS Destination for PowerPoint Tim Hunter, SAS Institute Inc., Cary, NC ABSTRACT This paper introduces the ODS destination for PowerPoint, one of the next generation of ODS destinations. Using our new PowerPoint destination you can send proc output directly into native PowerPoint format. See examples of slides created by ODS. Learn how to create presentations using ODS, how to use ODS style templates to customize the look of your presentations and how to use pre-defined layouts to make title slides and two-column slides. Find out how the PowerPoint destination is like other ODS destinations and how it’s different. Stop cutting and pasting and let the ODS destination for PowerPoint do the work for you! INTRODUCTION Starting with Office 2007, Microsoft abandoned the binary formats used by older versions of Office and replaced them with a new set of document formats collectively named Office Open XML. Microsoft supplies complete documentation for these formats, making it possible for 3 rd -party developers to create Office documents without needing to reverse- engineer their format. The Office Open XML format for Word is called WordprocessingML, for Excel is called SpreadsheetML, and for PowerPoint is called PresentationML. The ODS destination for PowerPoint is the ODS way to put SAS procedure output into the PresentationML format used by PowerPoint 2010. This paper shows slides that contain tables, graphs, lists, and text blocks, arranged individually and in pairs. The example slides use both ODS predefined style templates and custom style templates that you can create. This paper describes some of the ways that you can customize style templates to enhance the presentation of your data. You will learn how the destination for PowerPoint is like other ODS destinations, how it is different, and what to watch out for when creating presentations. ODS has a long history of support for third-party formats, including PDF, RTF, HTML, and Excel. In SAS 9.4 ODS adds EPUB and HTML5 destinations and the destination for PowerPoint. Like all ODS destinations, the destination for PowerPoint uses table templates and style templates to display the tables, graphs, and other output produced by SAS procedures. Using the destination for PowerPoint in a SAS program just like using any other ODS destination. Simply specify the POWERPOINT keyword in the ODS statement and use the FILE= option to name the presentation file. ODS POWERPOINT FILE=”example.pptx”; <SAS code> ODS POWERPOINT CLOSE; Beyond the Basics SAS Global Forum 2013
-
Upload
truongtram -
Category
Documents
-
view
222 -
download
1
Transcript of 041-2013: A First Look at the ODS Destination for...

1
Paper 041-2013
A First Look at the ODS Destination for PowerPoint
Tim Hunter, SAS Institute Inc., Cary, NC
ABSTRACT
This paper introduces the ODS destination for PowerPoint, one of the next generation of ODS destinations. Using our new PowerPoint destination you can send proc output directly into native PowerPoint format. See examples of slides created by ODS. Learn how to create presentations using ODS, how to use ODS style templates to customize the look of your presentations and how to use pre-defined layouts to make title slides and two-column slides. Find out how the PowerPoint destination is like other ODS destinations and how it’s different. Stop cutting and pasting and let the ODS destination for PowerPoint do the work for you!
INTRODUCTION
Starting with Office 2007, Microsoft abandoned the binary formats used by older versions of Office and replaced them with a new set of document formats collectively named Office Open XML. Microsoft supplies complete documentation for these formats, making it possible for 3
rd-party developers to create Office documents without needing to reverse-
engineer their format. The Office Open XML format for Word is called WordprocessingML, for Excel is called SpreadsheetML, and for PowerPoint is called PresentationML. The ODS destination for PowerPoint is the ODS way to put SAS procedure output into the PresentationML format used by PowerPoint 2010. This paper shows slides that contain tables, graphs, lists, and text blocks, arranged individually and in pairs. The example slides use both ODS predefined style templates and custom style templates that you can create. This paper describes some of the ways that you can customize style templates to enhance the presentation of your data. You will learn how the destination for PowerPoint is like other ODS destinations, how it is different, and what to watch out for when creating presentations.
ODS has a long history of support for third-party formats, including PDF, RTF, HTML, and Excel. In SAS 9.4 ODS adds EPUB and HTML5 destinations and the destination for PowerPoint. Like all ODS destinations, the destination for PowerPoint uses table templates and style templates to display the tables, graphs, and other output produced by SAS procedures. Using the destination for PowerPoint in a SAS program just like using any other ODS destination. Simply specify the POWERPOINT keyword in the ODS statement and use the FILE= option to name the presentation file.
ODS POWERPOINT FILE=”example.pptx”;
<SAS code>
ODS POWERPOINT CLOSE;
Beyond the BasicsSAS Global Forum 2013

2
BASIC PRESENTATIONS
Figure 1 shows a typical slide with a statistical table.
Figure 1. Simple Tabular Output
As you can see in Figure 1, the PowerPoint presentations created by ODS have a lot in common with other paged ODS destinations such as PDF and RTF. By default, the destination for PowerPoint creates a slide for each table or graph. As you would expect, the title or titles appear at the top and the footnotes at the bottom. The date appears at the bottom left and the slide number on the bottom right
The DATE and NUMBER system options control the presence of the date and slide number on the slide. If the DATE system option is in effect, the destination for PowerPoint adds a date and time field to the slide. If the NUMBER option is in effect, the destination for PowerPoint adds a slide number field. The position of these two fields is different from their position in other ODS destinations. In PDF, for example, the date and time and the page number typically appear at the top of every page surrounding the title. However, in keeping with standard PowerPoint slide layouts these fields appear at the bottom along with
the footnotes. The values of the date and time and slide number fields are dynamic. This means that every time you open the presentation PowerPoint updates the date and time to the current date and time. PowerPoint also formats the date and time field based on the current selection in its Header and Footer dialog box. If you insert new slides or
rearrange the slides in your presentation, PowerPoint updates the slide numbers.
The destination for PowerPoint borrows the SASDATE option from the RTF destination. If you use this option in the ODS POWERPOINT statement, the date and time is static instead of dynamic. That is, it is the date and time that your SAS program started and cannot be updated by PowerPoint. The format of the date and time is the same as the format used in the SAS log.
Beyond the BasicsSAS Global Forum 2013
3
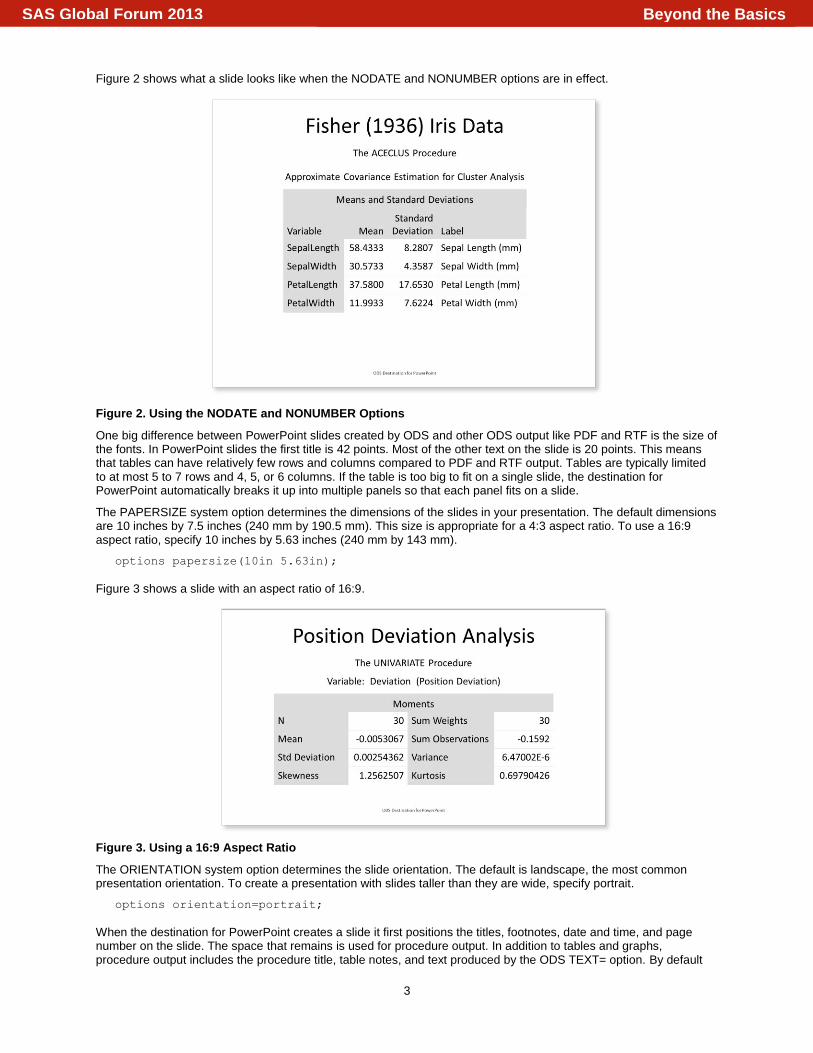
Figure 2 shows what a slide looks like when the NODATE and NONUMBER options are in effect.
Figure 2. Using the NODATE and NONUMBER Options
One big difference between PowerPoint slides created by ODS and other ODS output like PDF and RTF is the size of the fonts. In PowerPoint slides the first title is 42 points. Most of the other text on the slide is 20 points. This means that tables can have relatively few rows and columns compared to PDF and RTF output. Tables are typically limited to at most 5 to 7 rows and 4, 5, or 6 columns. If the table is too big to fit on a single slide, the destination for PowerPoint automatically breaks it up into multiple panels so that each panel fits on a slide.
The PAPERSIZE system option determines the dimensions of the slides in your presentation. The default dimensions are 10 inches by 7.5 inches (240 mm by 190.5 mm). This size is appropriate for a 4:3 aspect ratio. To use a 16:9 aspect ratio, specify 10 inches by 5.63 inches (240 mm by 143 mm).
options papersize(10in 5.63in);
Figure 3 shows a slide with an aspect ratio of 16:9.
Figure 3. Using a 16:9 Aspect Ratio
The ORIENTATION system option determines the slide orientation. The default is landscape, the most common presentation orientation. To create a presentation with slides taller than they are wide, specify portrait.
options orientation=portrait;
When the destination for PowerPoint creates a slide it first positions the titles, footnotes, date and time, and page number on the slide. The space that remains is used for procedure output. In addition to tables and graphs, procedure output includes the procedure title, table notes, and text produced by the ODS TEXT= option. By default
Beyond the BasicsSAS Global Forum 2013

4
graphs are sized to fit the amount of space available after everything else has been added to the slide. Figure 4 shows how a typical graph looks on a slide.
Figure 4. Simple Graphical Output I
SAS user interface designers chose the colors used in graphs especially for PowerPoint presentations. Of course you can choose your own colors as well. Figure 5 shows a pie chart created by PROC SGRENDER using a custom template.
Figure 5. Simple Graphical Output II
No presentation would be complete without bulleted lists and text boxes. You can use the new ODSTEXT and ODSLIST procedures to make these slides. The destination for PowerPoint tries to put the entire list or all the text boxes on one slide. If the list or text is too big to fit some of the list items or text boxes overflow onto the next slide.
Figure 6 shows examples of bulleted lists and text boxes.
Beyond the BasicsSAS Global Forum 2013

5
Figure 6. Bulleted Lists and Text Boxes
SUMMARY
By default, the destination for PowerPoint creates a slide for each table, graph, list, or text block. The output is centered horizontally. Every slide has the current titles and footnotes. If the DATE option is in effect, the date and time appear on the bottom left of every slide in the format specified by your current PowerPoint setting. PowerPoint updates the date and time every time your edit your presentation. If the NUMBER option is in effect, the slide number appears on the bottom right of every slide. If you rearrange your slides, PowerPoint updates the slide numbers. The PAPERSIZE option determines the slide dimensions. By default slides are 10 inches (240mm) wide and 7.5 inches (190.5mm) tall. The ORIENTATION option determines the slide orientation. By default slides use the landscape orientation. The titles, footnotes, date and time, and page number are added to the slide first. The remaining space is available for your output. If a table, list, or text block is too big to fit on a single slide the destination for PowerPoint divides it into pieces that fit on multiple slides. Graphs without a fixed size are shrunk to fit.
POWERPOINT STYLE TEMPLATES
Unlike other ODS destinations, such as HTML and PDF, which can use almost any of the predefined style templates, the destination for PowerPoint can use only a style template designed for presentations. There are two pre-defined presentation style templates in SAS 9.4. The style template used for all the examples so far, with a white background and black text, is called PowerPointLight. The PowerPointDark style template is the same but has a black background and white text. PowerPointDark uses the same fonts and font sizes as PowerPointLight. Figures 7 and 8 show slides that use the PowerPointDark style template.
Figure 7. A Table in the PowerPointDark Style Template
Beyond the BasicsSAS Global Forum 2013

6
The graph colors are the same in both PowerPointLight and PowerPointDark. The colors are selected to look good on both black and white backgrounds.
Figure 8. A Graph in the PowerPointDark Style Template
Both the PowerPointLight and PowerPointDark style templates define two fonts, the heading font and the body font. These two fonts differ in size only. The heading font is used for titles and footnotes. The first title is 42 points, the second title is 24 points, and titles 3 through 10 are 20 points. All footnotes are 9 points. The body font, used for PROC titles, table notes, BY lines, headers, cell data, and paragraph text, is 20 points. List items are rendered in the body font at 32 points. For a typeface, the style templates choose a sans-serif font from the set of fonts you have installed. On Windows the templates prefer Calibri if it’s available. Calibri is the default typeface for Microsoft Office 2007 and 2010. On other hosts or If Calibri is not available the style templates fall back to the sans-serif font specified in the SAS registry, typically Arial or a font supplied by SAS, such as Albany AMT.
Each style template defines twelve colors. The first four are paired light and dark colors, white and black, and light gray and dark gray. These four colors are the same in both templates. Each style template defines its own pair of colors for hyperlinks, one for hyperlinks that have not been clicked and the other for hyperlinks that have been clicked. The last six colors are accent colors. The accent colors are the same as the first six GraphData colors used in graphs. Normally the accent colors only appear in graphs but if you edit your presentation by hand you will find that PowerPoint lists them in dialog boxes as part of the theme colors.
When you use PowerPoint to create a presentation, one of the first things you do is choose a theme. PowerPoint comes with several dozen built-in themes, or you can use your own theme. The theme becomes part of the presentation along with the slide content. However, when you create a presentation using the destination for PowerPoint, the theme is created from the style template. When you use the PowerPointLight style template, the theme is named ODS Light. When you use the PowerPointDark style template, the theme is named ODS Dark. You can create your own presentation style template by creating a new presentation template that uses one PowerPointLight or PowerPointDark as its parent template. The Advanced Styling section below has more
information about custom presentation style templates.
PRE-DEFINED LAYOUTS
You can create slides that contain more than one table, graph, list, or text block using ODS LAYOUT statements to create a gridded layout. Also, the destination for PowerPoint supports predefined layouts for common slide layouts. There are three predefined layouts: TitleSlide, TitleAndContent, and TwoContent. To use a predefined layout, specify its name on the LAYOUT= option in the ODS POWERPOINT statement, like this:
ods powerpoint file=”example.pptx” layout=<name>;
Each time you use an ODS POWERPOINT statement with a LAYOUT= option, the destination for PowerPoint finishes the current slide and starts a new slide. You can also stop using the current layout by specifying _NULL_ as the layout name, like this:
ods powerpoint layout=_null_;
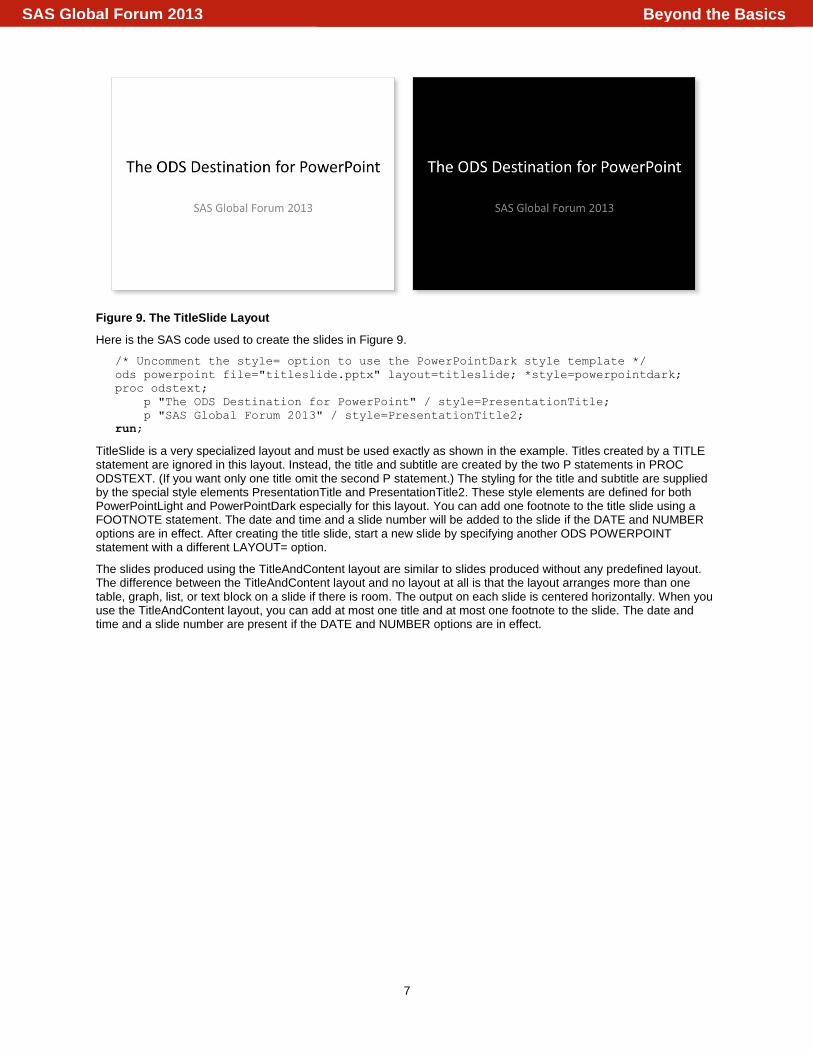
The TitleSlide layout is used to create a title slide for your presentation. Figure 9 shows what a title slide looks like in both the PowerPointLight and PowerPointDark style templates.
Beyond the BasicsSAS Global Forum 2013
7
Figure 9. The TitleSlide Layout
Here is the SAS code used to create the slides in Figure 9.
/* Uncomment the style= option to use the PowerPointDark style template */
ods powerpoint file="titleslide.pptx" layout=titleslide; *style=powerpointdark;
proc odstext;
p "The ODS Destination for PowerPoint" / style=PresentationTitle;
p "SAS Global Forum 2013" / style=PresentationTitle2;
run;
TitleSlide is a very specialized layout and must be used exactly as shown in the example. Titles created by a TITLE statement are ignored in this layout. Instead, the title and subtitle are created by the two P statements in PROC ODSTEXT. (If you want only one title omit the second P statement.) The styling for the title and subtitle are supplied by the special style elements PresentationTitle and PresentationTitle2. These style elements are defined for both PowerPointLight and PowerPointDark especially for this layout. You can add one footnote to the title slide using a FOOTNOTE statement. The date and time and a slide number will be added to the slide if the DATE and NUMBER options are in effect. After creating the title slide, start a new slide by specifying another ODS POWERPOINT statement with a different LAYOUT= option.
The slides produced using the TitleAndContent layout are similar to slides produced without any predefined layout. The difference between the TitleAndContent layout and no layout at all is that the layout arranges more than one table, graph, list, or text block on a slide if there is room. The output on each slide is centered horizontally. When you use the TitleAndContent layout, you can add at most one title and at most one footnote to the slide. The date and time and a slide number are present if the DATE and NUMBER options are in effect.
Beyond the BasicsSAS Global Forum 2013

8
Here is an example of using the TitleAndContent layout to put two graphs on a slide.
Figure 10. The TitleAndContent Layout
To create two-column slides use the TwoContent layout. When you use the TwoContent layout, the first table, graph, list, or text block occupies the left-hand column and the second occupies the right-hand column. You can add at most one title and one footnote to the slide The date and time and a slide number are present if the DATE and NUMBER options are in effect.
Here are two examples of the TwoContent layout.
Figure 11. The TwoContent Layout
ADVANCED STYLING
You can easily change the colors and fonts your presentation uses by creating a custom style template. As you read earlier, the PowerPointLight and PowerPointDark style templates are the only two presentation templates shipped with SAS 9.4. However, you can also create your own style template based on one of those two templates. Like all ODS style templates, presentation style templates are created with PROC TEMPLATE.
THE SCHEME STATEMENT
The SCHEME statement is a new addition to PROC TEMPLATE for presentation style templates. The most important style attributes in PowerPointLight and PowerPointDark are defined by the SCHEME statement. These are
Beyond the BasicsSAS Global Forum 2013
9
The heading font and body font
Two pairs of light and dark colors
Six accent colors
A pair of hyperlink colors
The SCHEME statement assigns logical names to specific fonts and colors. The other style elements in PowerPointLight and PowerPointDark refer to the fonts and colors by the logical names. Therefore, you can change these basic style attributes throughout the entire style template by assigning new values to the logical names in the SCHEME statement. For example, here is the SCHEME statement used in PowerPointLight.
scheme 'ODS Light' /
light1 = cxffffff
dark1 = cx000000
light2 = cxd8d8d8
dark2 = cx646464
accent6 = cx5E6C10
accent5 = cx6590CD
accent4 = cxF8B93C
accent3 = cx9D2E14
accent2 = cx90B328
accent1 = cx3D5AAE
followed_hyperlink = cx7A40A6
hyperlink = cx00709f
body_font = ("Calibri, <MTsans-serif>, <sans-serif>",20pt)
heading_font = ("Calibri, <MTsans-serif>, <sans-serif>",42pt);
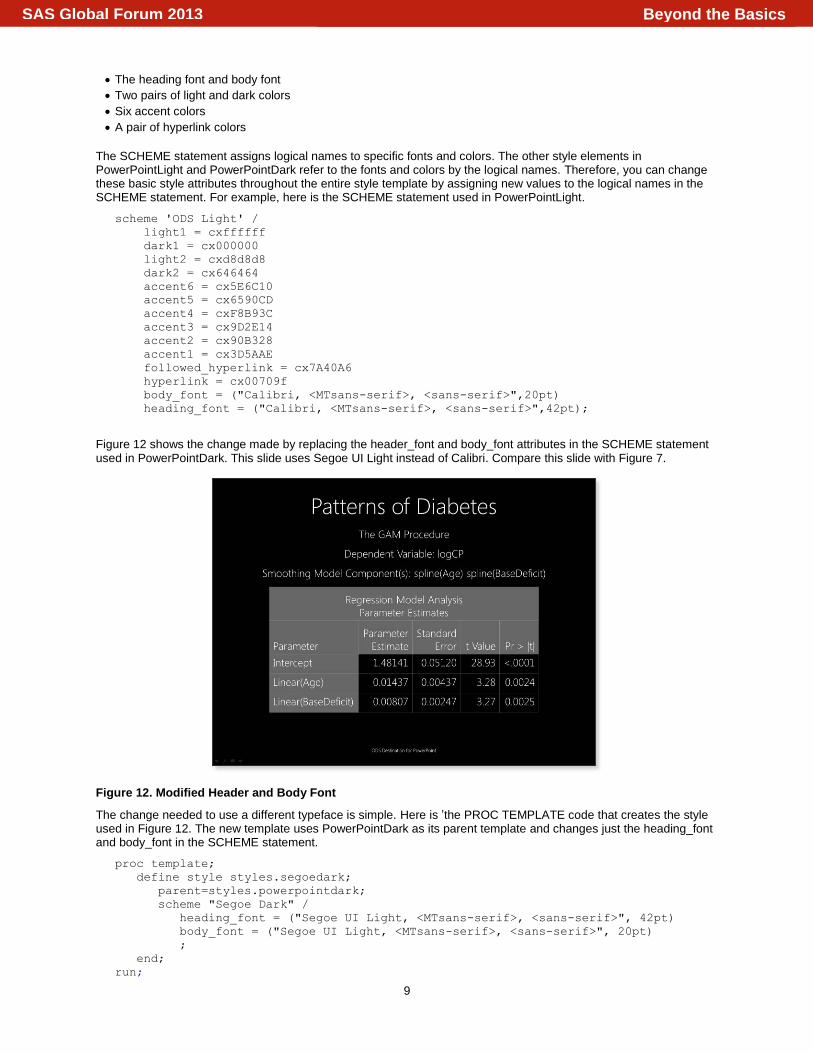
Figure 12 shows the change made by replacing the header_font and body_font attributes in the SCHEME statement used in PowerPointDark. This slide uses Segoe UI Light instead of Calibri. Compare this slide with Figure 7.
Figure 12. Modified Header and Body Font
The change needed to use a different typeface is simple. Here is ’the PROC TEMPLATE code that creates the style used in Figure 12. The new template uses PowerPointDark as its parent template and changes just the heading_font and body_font in the SCHEME statement.
proc template;
define style styles.segoedark;
parent=styles.powerpointdark;
scheme "Segoe Dark" /
heading_font = ("Segoe UI Light, <MTsans-serif>, <sans-serif>", 42pt)
body_font = ("Segoe UI Light, <MTsans-serif>, <sans-serif>", 20pt)
;
end;
run;
Beyond the BasicsSAS Global Forum 2013
10
GRADIENT FILLS
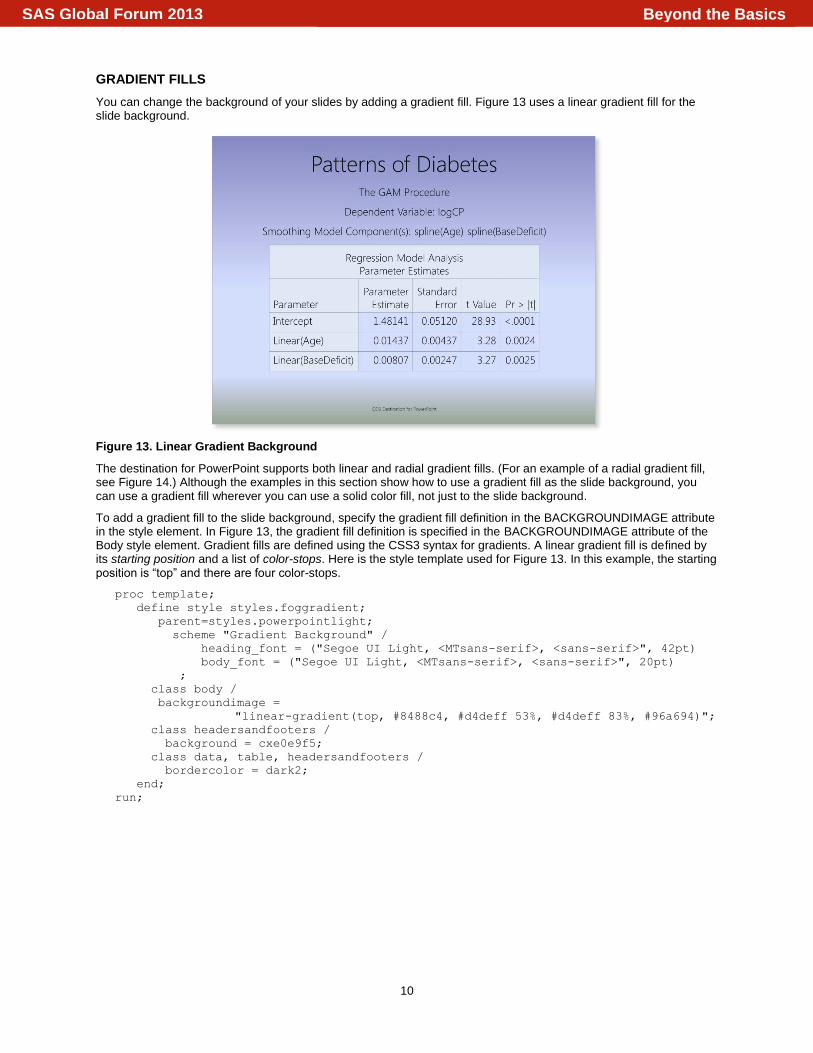
You can change the background of your slides by adding a gradient fill. Figure 13 uses a linear gradient fill for the slide background.
Figure 13. Linear Gradient Background
The destination for PowerPoint supports both linear and radial gradient fills. (For an example of a radial gradient fill, see Figure 14.) Although the examples in this section show how to use a gradient fill as the slide background, you can use a gradient fill wherever you can use a solid color fill, not just to the slide background.
To add a gradient fill to the slide background, specify the gradient fill definition in the BACKGROUNDIMAGE attribute in the style element. In Figure 13, the gradient fill definition is specified in the BACKGROUNDIMAGE attribute of the Body style element. Gradient fills are defined using the CSS3 syntax for gradients. A linear gradient fill is defined by its starting position and a list of color-stops. Here is the style template used for Figure 13. In this example, the starting position is “top” and there are four color-stops.
proc template;
define style styles.foggradient;
parent=styles.powerpointlight;
scheme "Gradient Background" /
heading_font = ("Segoe UI Light, <MTsans-serif>, <sans-serif>", 42pt)
body_font = ("Segoe UI Light, <MTsans-serif>, <sans-serif>", 20pt)
;
class body /
backgroundimage =
"linear-gradient(top, #8488c4, #d4deff 53%, #d4deff 83%, #96a694)";
class headersandfooters /
background = cxe0e9f5;
class data, table, headersandfooters /
bordercolor = dark2;
end;
run;
Beyond the BasicsSAS Global Forum 2013
11
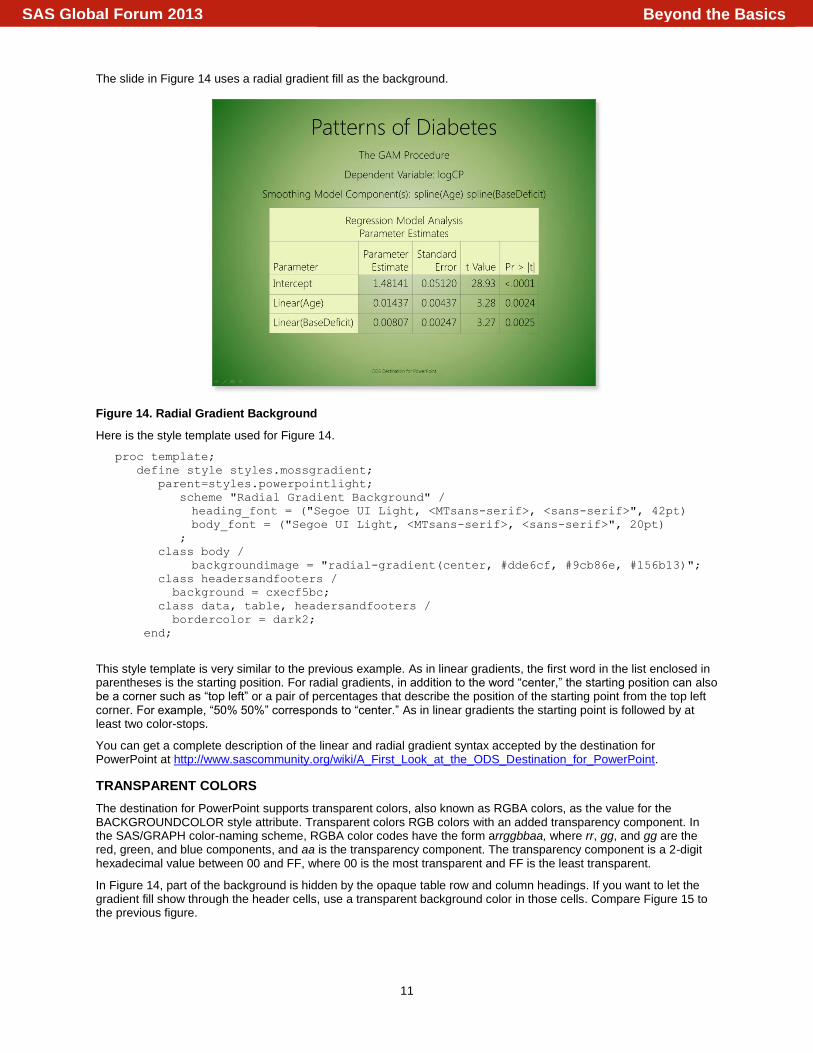
The slide in Figure 14 uses a radial gradient fill as the background.
Figure 14. Radial Gradient Background
Here is the style template used for Figure 14.
proc template;
define style styles.mossgradient;
parent=styles.powerpointlight;
scheme "Radial Gradient Background" /
heading_font = ("Segoe UI Light, <MTsans-serif>, <sans-serif>", 42pt)
body_font = ("Segoe UI Light, <MTsans-serif>, <sans-serif>", 20pt)
;
class body /
backgroundimage = "radial-gradient(center, #dde6cf, #9cb86e, #156b13)";
class headersandfooters /
background = cxecf5bc;
class data, table, headersandfooters /
bordercolor = dark2;
end;
This style template is very similar to the previous example. As in linear gradients, the first word in the list enclosed in parentheses is the starting position. For radial gradients, in addition to the word “center,” the starting position can also be a corner such as “top left” or a pair of percentages that describe the position of the starting point from the top left corner. For example, “50% 50%” corresponds to “center.” As in linear gradients the starting point is followed by at least two color-stops.
You can get a complete description of the linear and radial gradient syntax accepted by the destination for PowerPoint at http://www.sascommunity.org/wiki/A_First_Look_at_the_ODS_Destination_for_PowerPoint.
TRANSPARENT COLORS
The destination for PowerPoint supports transparent colors, also known as RGBA colors, as the value for the BACKGROUNDCOLOR style attribute. Transparent colors RGB colors with an added transparency component. In the SAS/GRAPH color-naming scheme, RGBA color codes have the form arrggbbaa, where rr, gg, and gg are the red, green, and blue components, and aa is the transparency component. The transparency component is a 2-digit hexadecimal value between 00 and FF, where 00 is the most transparent and FF is the least transparent.
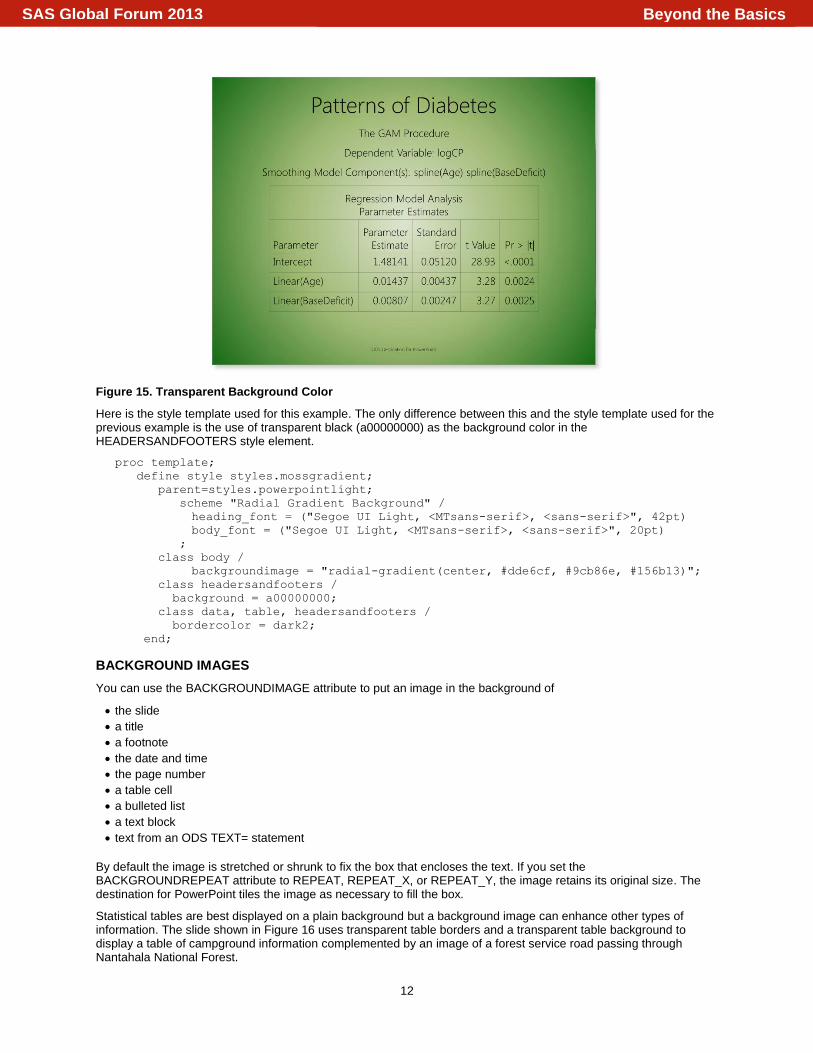
In Figure 14, part of the background is hidden by the opaque table row and column headings. If you want to let the gradient fill show through the header cells, use a transparent background color in those cells. Compare Figure 15 to the previous figure.
Beyond the BasicsSAS Global Forum 2013
12
Figure 15. Transparent Background Color
Here is the style template used for this example. The only difference between this and the style template used for the previous example is the use of transparent black (a00000000) as the background color in the HEADERSANDFOOTERS style element.
proc template;
define style styles.mossgradient;
parent=styles.powerpointlight;
scheme "Radial Gradient Background" /
heading_font = ("Segoe UI Light, <MTsans-serif>, <sans-serif>", 42pt)
body_font = ("Segoe UI Light, <MTsans-serif>, <sans-serif>", 20pt)
;
class body /
backgroundimage = "radial-gradient(center, #dde6cf, #9cb86e, #156b13)";
class headersandfooters /
background = a00000000;
class data, table, headersandfooters /
bordercolor = dark2;
end;
BACKGROUND IMAGES
You can use the BACKGROUNDIMAGE attribute to put an image in the background of
the slide
a title
a footnote
the date and time
the page number
a table cell
a bulleted list
a text block
text from an ODS TEXT= statement
By default the image is stretched or shrunk to fix the box that encloses the text. If you set the BACKGROUNDREPEAT attribute to REPEAT, REPEAT_X, or REPEAT_Y, the image retains its original size. The destination for PowerPoint tiles the image as necessary to fill the box.
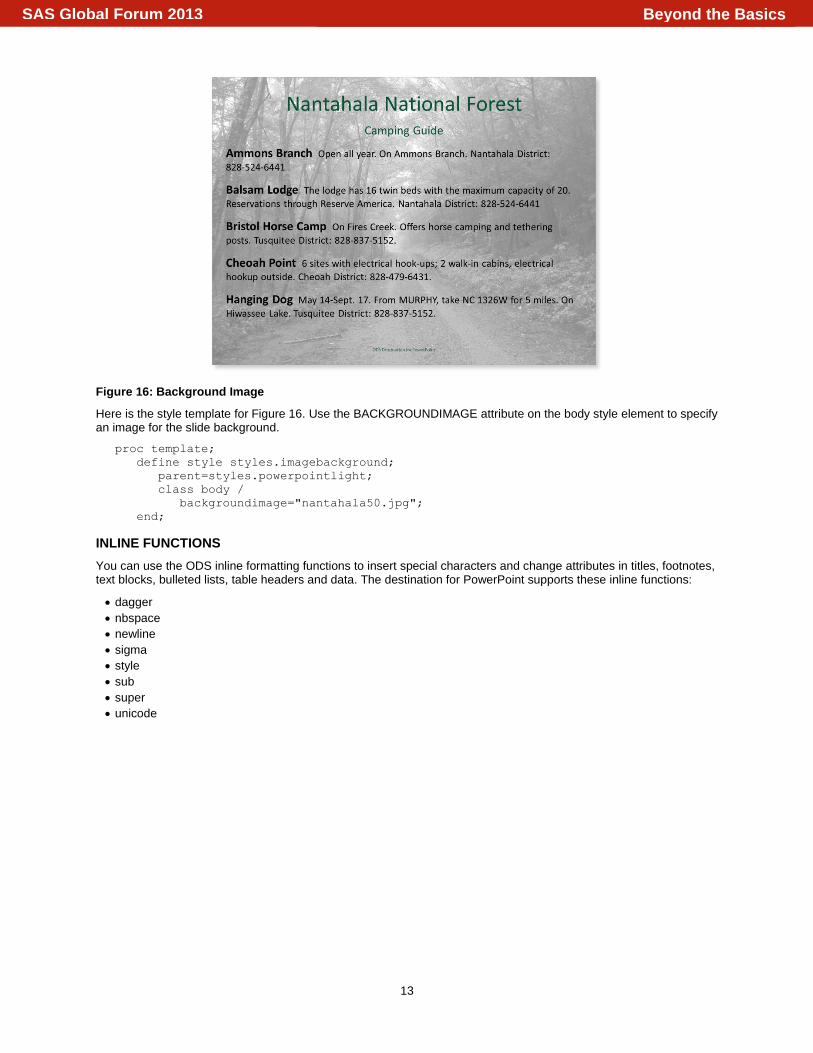
Statistical tables are best displayed on a plain background but a background image can enhance other types of information. The slide shown in Figure 16 uses transparent table borders and a transparent table background to display a table of campground information complemented by an image of a forest service road passing through Nantahala National Forest.
Beyond the BasicsSAS Global Forum 2013
13
Figure 16: Background Image
Here is the style template for Figure 16. Use the BACKGROUNDIMAGE attribute on the body style element to specify an image for the slide background.
proc template;
define style styles.imagebackground;
parent=styles.powerpointlight;
class body /
backgroundimage="nantahala50.jpg";
end;
INLINE FUNCTIONS
You can use the ODS inline formatting functions to insert special characters and change attributes in titles, footnotes, text blocks, bulleted lists, table headers and data. The destination for PowerPoint supports these inline functions:
dagger
nbspace
newline
sigma
style
sub
super
unicode
Beyond the BasicsSAS Global Forum 2013

14
The next two examples demonstrate some of the things you can do with these functions. Figure 17 shows the effect of all the inline functions except the style function.
Figure 17: Inline Functions
Figure 18 shows the types of things you can do with the style function.
Figure 18: Inline Styles
TITLES AND FOOTNOTES
Titles and footnotes do not have to always be in the center. The destination for PowerPoint is quite versatile. Although titles must always appear at the top and footnotes at the bottom, they can be left- or right-adjusted. The date and time and page number can be placed in any corner or in the top center or bottom center. In Figure 19, the title and footnote have been left-adjusted, the page number moved to the top left corner, and the date moved to the top right corner.
Beyond the BasicsSAS Global Forum 2013

15
Figure 19: Repositioned Title, Footnote, Page Number, Date
Here is the important part of the style template used for Figure 19. The style elements shown in the example control the positions of the title, footnote, page number, and date. The horizontal position is controlled by the JUST= attribute. The vertical position is controlled by the VJUST= attribute. To move the titles or footnotes left or right, change the JUST= attribute in the SystemTitle or SystemFooter style element. To move the page number, change the JUST= attribute in the PAGENO style element. To move it to the top or bottom, change the VJUST= attribute in the PAGENO style element. To reposition of the date and time, change the JUST= and VJUST= attributes in the BodyDate style element. By default, the titles occupy 100% of the slide width. In the normal case, when the footnote, page number, and date are on the same line, the footnotes occupy the middle 50%, and the page number and date and time occupy 25% on each side of the footnote. You can change these values with the WIDTH= attribute in the appropriate style element. In Figure 19, the destination for PowerPoint automatically set the footnote width to 100% because the footnote occupies a line by itself.
proc template;
define style styles.example;
parent=styles.powerpointlight;
class systemtitle, systemfooter /
just=left;
class bodydate /
just=right vjust=top width=50%;
class pageno /
just=left vjust=top width=50%;
end;
Because the position and width of each element has an effect on the position and width of the other elements, it can be difficult to predict the effect of any single change. To understand how a change to one of the elements affects the others, it helps to know how the destination for PowerPoint lays out a page. The destination for PowerPoint
1. first places the page number on the page. The page number always abuts the top or bottom margin. No other element can occupy the same position as the page number.
2. then places the date and time. If the date and time have the same vertical and horizontal justifications as the page number, it moves the date and time to the nearest unoccupied position.
3. then places the titles as near as possible to the top margin.
4. finally places the footnotes as near as possible to the bottom margin.
When adjusting the position of these page elements, it helps to temporarily assign a background color or margin (like in Figure 19) to the elements so that you can see their exact dimensions.
THE DESTINATION FOR POWERPOINT COMPARED TO OTHER ODS DESTINATIONS
ODS supports many destinations, including PDF, HTML, RTF, SAS data sets, even the primordial SAS listing. The destination for PowerPoint has many similarities with other destinations but it also has its quirks. Your experience producing reports with other destinations can help you to make presentations using the destination for PowerPoint if
Beyond the BasicsSAS Global Forum 2013

16
you keep those quirks in mind. PDF and RTF documents have pages the way presentations have slides, so it’s more helpful to compare a presentation to one of those destinations than to compare it to a web page or spreadsheet.
Let us start by looking at a typical page of ODS PDF output. Compare the PDF page shown in Figure 20 with the presentation slide shown in Figure 2. Both examples were created using the default style template for the destination.
Figure 20: ODS PDF Output
Notice that both examples display SAS procedure output, in this case tables created by the ACECLUS procedure. Yes that is obvious, but it bears emphasizing that the purpose of ODS is to display the output of SAS procedures in a range of useful formats. However, the older ODS destinations such as PDF, RTF, HTML, and even the SAS listing are intended for creating reports to be read by individuals from a printed page or viewed on a computer screen. You use the destination for PowerPoint to create presentations narrated by a speaker and usually viewed by groups of people on a relatively large display.
Regarding Figure 20, notice that the PDF page has a portrait orientation. A presentation slide has landscape orientation. Of course, a page of PDF and RTF output tends to look like a page in a book. A presentation slide is presented on a movie- or television-shaped screen. (How often do you see presentations in portrait orientation?) As a result, the presentation slide has less vertical space for output than a PDF or RTF page. Secondly, the font sizes used in PDF and RTF output are much smaller than those used by the destination for PowerPoint. In PDF and RTF, the font size used for the first title is 11 points. The font size used for table cell data is 8 points. Compare this to the presentation output, which uses a 42 point font for the first title and a 20 point font for table cell data. PDF and RTF output is designed to be read at typical reading distances of 15”-25” and therefore can use small fonts, but presentations are designed to be viewed from many feet away. The use of large fonts in presentations also reduces the amount of output that can fit on a slide, both vertically and horizontally, than on a PDF or RTF page. The effect of less vertical space and larger fonts is why the destination for PowerPoint puts one table on a slide by default when PDF and RTF usually put as many tables as will fit.
Another difference is that the date, time, and page number appear at the top of PDF and RTF output, to the left of the title. The presentation style template puts these items on the bottom of the slide. The date and time are on the left
Beyond the BasicsSAS Global Forum 2013
17
and the page number on the right. The PDF and RTF page matches the look of traditional SAS listing output. The presentation style template mimics the Office theme found in Microsoft Office 2010.
In both examples the data in the table cells is surrounded by 5 points of padding. In PDF and RTF pages, with their small fonts and vertical orientation, the padding contributes to a “clean” look that still allows plenty of room for output. Space for data on presentation slides is already precious, though, and the padding makes it even more so.
BEST PRACTICES
The destination for PowerPoint uses large fonts, landscape orientation, and ample cell padding to help you make good presentations, but these features limit the amount of space available for your data on a slide. Typically, tables with more than 5 to 7 rows and 4, 5, or 6 columns are too big to fit on a single slide, especially if the table has a caption. If there is not enough room on the slide to fit the entire table, the destination for PowerPoint divides the table into sections that are small enough to fit. If the table is too long each section contains a subset of the rows. If the table is too wide, each section contains a subset of the columns. Each section appears on a separate slide. Avoid this condition. It’s a lot to ask of your audience to remember the content from an earlier slide when they are looking at a later section of the table. Too-big tables are especially easy to create with the PRINT, REPORT, FREQ, and TABULATE procedures because the table dimensions are open-ended.
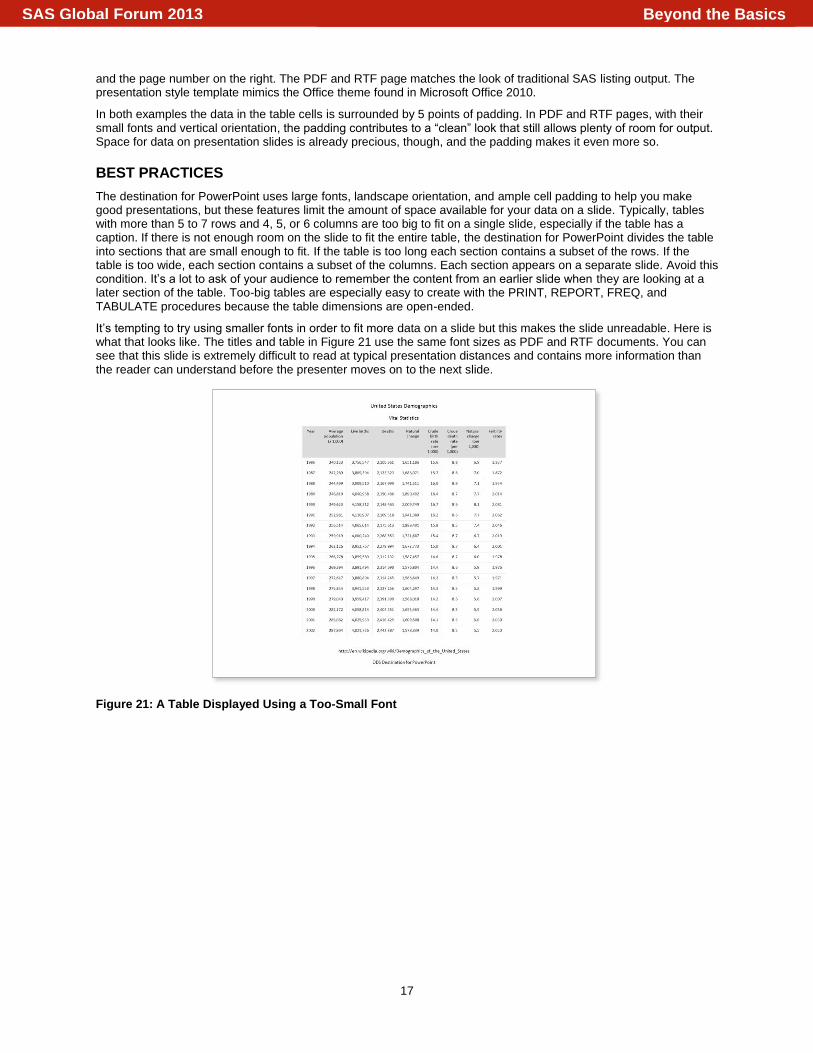
It’s tempting to try using smaller fonts in order to fit more data on a slide but this makes the slide unreadable. Here is what that looks like. The titles and table in Figure 21 use the same font sizes as PDF and RTF documents. You can see that this slide is extremely difficult to read at typical presentation distances and contains more information than the reader can understand before the presenter moves on to the next slide.
Figure 21: A Table Displayed Using a Too-Small Font
Beyond the BasicsSAS Global Forum 2013

18
Tabular data is not the only type of information that suffers when you use too-small fonts. Though it is useful to show short snippets of SAS code in a presentation about SAS, it’s tempting to try to squeeze more code into a single slide by shrinking the font. Figure 22 is a slide that lists the SAS program code that created Figure 21. The text is in an 8 point font. You can immediately see that the text is too small to read, much less understand. This is a bad slide.
Figure 22: SAS Program Code Displayed Using a Too-Small Font
Here are some best practices for creating a presentation using the destination for PowerPoint.
Presentations are very different from reports. It will probably be impractical to produce a good presentation and a good report with the same SAS program. If you want to produce both a report and a presentation from the same output, use the ODS DOCUMENT destination to capture the output and replay it separately for each destination, customizing it specifically for the report and the presentation.
Choose a style template to use for the entire presentation, either one of the presentation style templates supplied by SAS or a custom style template. Match your template to the type of information in your presentation. Statistical tables are best displayed on plain backgrounds. Use a colorful gradient or image background for informal presentations.
If you want to use your presentation on computers other than the one that you created it with, use fonts that are installed on those computers. The destination for PowerPoint does not embed your fonts into the presentation file. If your font choices are not available, PowerPoint will choose from the fonts that are available and those choices will change the way your slides look.
Determine what you want to appear on each slide. Use ODS SELECT and ODS EXCLUDE to choose the tables and graphs you want to display and suppress the others.
Use at most two titles and at most one footnote on a slide.
Keep tables contained to a single slide.
Avoid batch output.
Do not succumb to the temptation to use smaller fonts to fit more information on a slide.
Use a ODS POWERPOINT LAYOUT=”layout”; statement to end the current slide and start a new slide with the
specified layout.
Beyond the BasicsSAS Global Forum 2013

19
PRACTICAL CONSIDERATIONS
So far you have seen a lot of examples of the types of presentations you can make with the destination for PowerPoint and learned techniques for making custom presentation style templates. Here are a few practical considerations you should keep in mind as you start to use this new destination.
Like all ODS destination, the destination for PowerPoint creates new, self-contained documents. You cannot update an existing presentation. Of course you can create a presentation and then copy tables or graphs into from that presentation into another presentation.
The destination for PowerPoint creates the presentation theme from the style template. You cannot use a theme created in PowerPoint.
The destination for PowerPoint has no support for notes pages, animations, or slide transitions.
Some inline functions that are supported by other ODS destinations are not supported by the destination for PowerPoint. Specifically, the DATE, DEST, LASTPAGE, LEADERS, PAGEOF, RAW, THISPAGE, TOCENTRYINDENT, and TOCENTRYPAGE functions are not supported. Some of these functions, like DATE and LEADERS, are specific to another destination. Some, like TOCENTRYINDENT and TOCENTRYPAGE, do not make sense in a presentation. DEST and RAW are not useful when creating Office Open XML.
If PowerPoint does not support a style attribute, then the destination for PowerPoint cannot support it either. This means that some things you might be used to doing with in HTML or PDF will not work in a presentation. For example, although you can use the inline style function to change the color of a single word in a longer section of text, you cannot change the background color of that word. The pre-image and post-image style attributes cannot be used inside a table cell. In general, if you cannot do it using PowerPoint interactively, you cannot do it with the destination for PowerPoint.
Background images are resized or tiled to fit the box (text box, table cell, and so on) in which they are placed. The box is not sized to fit the image.
CONCLUSION
The destination for PowerPoint, a new ODS destination for SAS 9.4, creates presentations suitable for display using Microsoft PowerPoint 2010. You can use one of two presentation style templates supplied by SAS or a custom style based on one of the style templates supplied by SAS. You can create title slides and two-column slides with pre-defined layout templates. You can customize your presentations by using background gradient fills or images, inline functions, or by re-positioning the titles, footnotes, page number, and date and time.
The slides created by the destination for PowerPoint have landscape orientation, use large fonts, and have limited space for tables and graphs compared to PDF or RTF pages. These differences influence the types of output suitable for presentations and how the output is displayed.
REFERENCES
The photo used in Figure 16 is by Doug Bradley, Doug Bradley Photography, available at http://www.flickr.com/photos/dougandbecky/2837294812/.
SAS Institute Inc, “Sample 48144: Use transparent (RGBA) colors with SAS/GRAPH®,” http://support.sas.com/kb/48/144.html
van Vugt, Wouter, Open XML The Markup Explained, http://openxmldeveloper.org/blog/b/openxmldeveloper/archive/2007/08/13/1970.aspx.
World Wide Web Consortium, ”CSS Image Values and Replaced Content Module Level 3,” http://www.w3.org/TR/2011/WD-css3-images-20110217/
ACKNOWLEDGMENTS
The ODS destination for PowerPoint could not have been created without the contributions of Wayne Hester, Senior Software Developer, and Nancy Goodling, Principal Development Tester.
Beyond the BasicsSAS Global Forum 2013
20
CONTACT INFORMATION
Tim Hunter SAS Institute Inc. SAS Campus Drive Cary, NC 27513 E-mail: [email protected]
SAS and all other SAS Institute Inc. product or service names are registered trademarks or trademarks of SAS Institute Inc. in the USA and other countries. ® indicates USA registration.
Other brand and product names are trademarks of their respective companies.
Beyond the BasicsSAS Global Forum 2013