03 Business Revenue
38
4 1 0011 0010 1010 1101 0001 0100 1011 Economics – Unit 3 Business revenues
-
Upload
saridenasoumya3486 -
Category
Documents
-
view
219 -
download
0
Transcript of 03 Business Revenue

7/31/2019 03 Business Revenue
http://slidepdf.com/reader/full/03-business-revenue 1/37
41
0011 0010 1010 1101 0001 0100 1011Economics – Unit 3
Business revenues

7/31/2019 03 Business Revenue
http://slidepdf.com/reader/full/03-business-revenue 2/37
41
0011 0010 1010 1101 0001 0100 1011
Syllabus requirements
• Illustrate and perform simple calculations using
total revenue, average revenue and marginal
revenue.
• Students will need to be able to draw and interpret
revenue curves and to understand the relationships
between total revenue, price elasticity of demand
and marginal revenue.

7/31/2019 03 Business Revenue
http://slidepdf.com/reader/full/03-business-revenue 3/37
41
0011 0010 1010 1101 0001 0100 1011
How does each of the following earn
their revenues?• Market trader• Amazon
• Channel Tunnel
• Restaurant• Thorpe park
• Farmer
• Royal Mail• Google

7/31/2019 03 Business Revenue
http://slidepdf.com/reader/full/03-business-revenue 4/37
41
0011 0010 1010 1101 0001 0100 1011
Revenues from the Channel Tunnel

7/31/2019 03 Business Revenue
http://slidepdf.com/reader/full/03-business-revenue 5/37
41
0011 0010 1010 1101 0001 0100 1011
Revenues from a local market trader

7/31/2019 03 Business Revenue
http://slidepdf.com/reader/full/03-business-revenue 6/37
41
0011 0010 1010 1101 0001 0100 1011
Revenues by Amazon.com

7/31/2019 03 Business Revenue
http://slidepdf.com/reader/full/03-business-revenue 7/37
41
0011 0010 1010 1101 0001 0100 1011
Revenues from a restaurateur

7/31/2019 03 Business Revenue
http://slidepdf.com/reader/full/03-business-revenue 8/37
41
0011 0010 1010 1101 0001 0100 1011
Revenues from a theme park eg
Thorpe Park

7/31/2019 03 Business Revenue
http://slidepdf.com/reader/full/03-business-revenue 9/37
41
0011 0010 1010 1101 0001 0100 1011
Revenues from for a ‘typical
farmer’!

7/31/2019 03 Business Revenue
http://slidepdf.com/reader/full/03-business-revenue 10/37
41
0011 0010 1010 1101 0001 0100 1011
Revenues from Royal Mail

7/31/2019 03 Business Revenue
http://slidepdf.com/reader/full/03-business-revenue 11/37
41
0011 0010 1010 1101 0001 0100 1011
Revenues from Google

7/31/2019 03 Business Revenue
http://slidepdf.com/reader/full/03-business-revenue 12/37
41
0011 0010 1010 1101 0001 0100 1011
Revenues for a football club

7/31/2019 03 Business Revenue
http://slidepdf.com/reader/full/03-business-revenue 13/37
41
0011 0010 1010 1101 0001 0100 1011
Revenues for a football club
Going down….
Going up!
Going down….

7/31/2019 03 Business Revenue
http://slidepdf.com/reader/full/03-business-revenue 14/37
41
0011 0010 1010 1101 0001 0100 1011
What is Revenue?• Revenue = money that comes in to the business
from the sale of goods and services over a period of
time.

7/31/2019 03 Business Revenue
http://slidepdf.com/reader/full/03-business-revenue 15/37
41
0011 0010 1010 1101 0001 0100 1011
Google revenue• Google has over sixty per cent of internet searches - it dwarfs the competition
and will continue to do so for the time being - and its stable-mate You Tube isestimated to carry 40% of all videos watched online worldwide. Annually YouTube is estimated to serve up 75 billion video streams to 375 million uniquevisitors.
• Digital popularity does not equal monopoly profits!
• Google’s challenge is to create a sustainable revenue model from the You Tubeinvestment.
• The business model is heavily focused on driving advertising revenues fromhome page ads, in-video overlay ads, banner ads, sponsored videos andsponsored links.
• But You Tube is an expensive business to operate - the costs of running the site
including bandwidth, content acquisition and licensing and other costsamount to over $700m a year.
• “Credit Suisse estimate YouTube’s total running costs will be between $500m and $1bn this year, while revenues will only be in the region of $240m.
• Even with the addition of more professionally created content, the economicsappear unsustainable.”
7/31/2019 03 Business Revenue
http://slidepdf.com/reader/full/03-business-revenue 16/37
41
0011 0010 1010 1101 0001 0100 1011
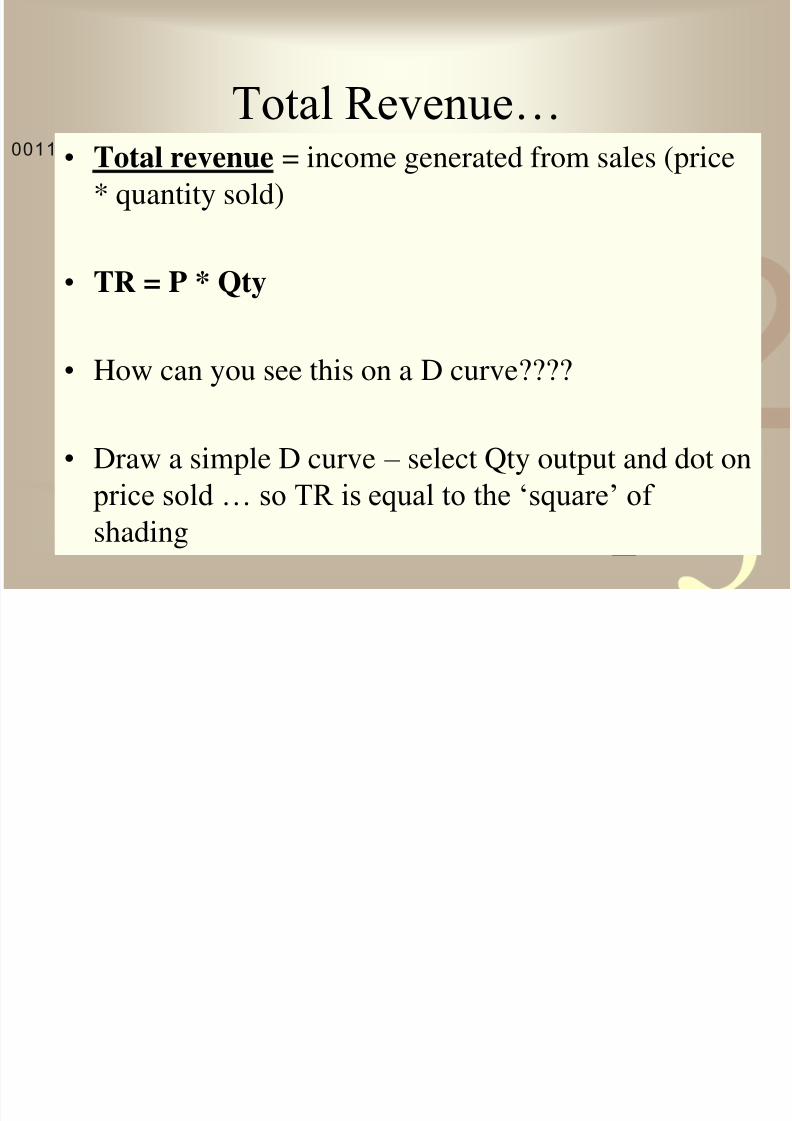
Total Revenue… • Total revenue = income generated from sales (price
* quantity sold)
• TR = P * Qty
• How can you see this on a D curve????
• Draw a simple D curve – select Qty output and dot on
price sold … so TR is equal to the ‘square’ of
shading

7/31/2019 03 Business Revenue
http://slidepdf.com/reader/full/03-business-revenue 17/37
41
0011 0010 1010 1101 0001 0100 1011
Demand curve…
Price
Output
Demand
P1
Q1

7/31/2019 03 Business Revenue
http://slidepdf.com/reader/full/03-business-revenue 18/37
41
0011 0010 1010 1101 0001 0100 1011
Total revenue = P x Qty…
Price
Output
Demand
P1
Q1

7/31/2019 03 Business Revenue
http://slidepdf.com/reader/full/03-business-revenue 19/37
41
0011 0010 1010 1101 0001 0100 1011
Revenue concepts
• Revenue (or turnover) is the income generated from thesale of output in product markets.
• There are two main revenue concepts to grasp at this stage:
– Average Revenue (AR) = Price per unit = total revenueoutput
– Marginal Revenue (MR) = the change in revenue fromselling one extra unit of output
• Total revenue (TR) = price per unit x output

7/31/2019 03 Business Revenue
http://slidepdf.com/reader/full/03-business-revenue 20/37
41
0011 0010 1010 1101 0001 0100 1011
Total revenue – constant price…
• This shows TR when priceis constant.
• What will the TR curve look like?
• What will the AVERAGE
REVENUE curve look like?
• What will the MARGINALREVENUE curve look like?
output TR
0 0
1 5
2 10
3 15
4 20
5 25
6 30
7 35
8 40
9 45
10 50

7/31/2019 03 Business Revenue
http://slidepdf.com/reader/full/03-business-revenue 21/37
41
0011 0010 1010 1101 0001 0100 1011
How can a business increase sales?
• Its not always the case that a company will
only use one PRICE for their customers.
• Many companies use a range of prices to
increase their sales…. Such as???
• Price is not always constant!

7/31/2019 03 Business Revenue
http://slidepdf.com/reader/full/03-business-revenue 22/37
41
0011 0010 1010 1101 0001 0100 1011
Price discriminating companies…
Sometimes toincreasesales, acompanymight reduceprice at‘certaintimes’.

7/31/2019 03 Business Revenue
http://slidepdf.com/reader/full/03-business-revenue 23/37
41
0011 0010 1010 1101 0001 0100 1011
Calculating AR & MR
output AR TR MR
1 30
2 54
3 72 4 84
5 90
6 90
7 84 8 72
9 54
10 30

7/31/2019 03 Business Revenue
http://slidepdf.com/reader/full/03-business-revenue 24/37
41
0011 0010 1010 1101 0001 0100 1011
Calculating AR & MR
output AR TR MR
1 30 30
2 27 54 24 3 24 72 18
4 21 84 12
5 18 90 6
6 15 90 0 7 12 84 -6
8 9 72 -12
9 6 54 -18
10 3 30 -24
Why is this also the‘price’?
What would
this look like as
a line diagram?
What would you
recommend as
their max sales
qty?
`

7/31/2019 03 Business Revenue
http://slidepdf.com/reader/full/03-business-revenue 25/37
41
0011 0010 1010 1101 0001 0100 1011
-40
-20
0
20
40
60
80
100
1 2 3 4 5 6 7 8 9 10
AR
TR
MR
Optimum sales…
7/31/2019 03 Business Revenue
http://slidepdf.com/reader/full/03-business-revenue 26/37
41
0011 0010 1010 1101 0001 0100 1011
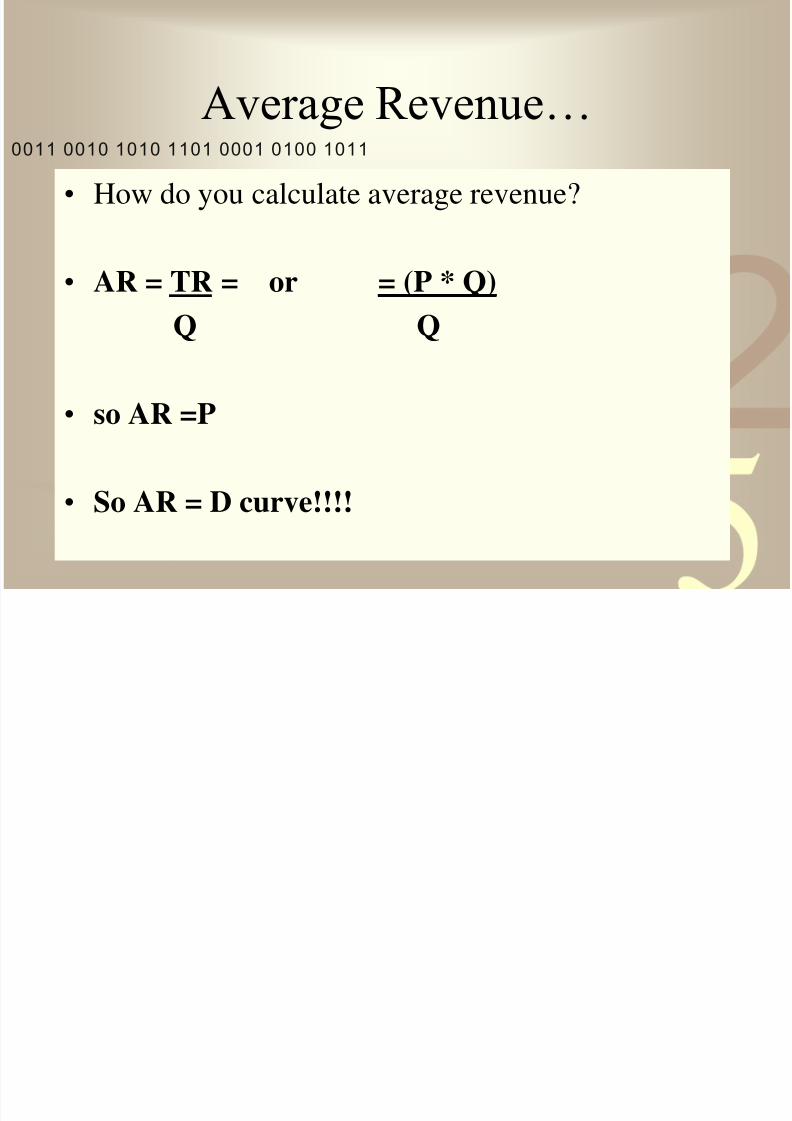
Average Revenue…
• How do you calculate average revenue?
• AR = TR = or = (P * Q)
Q Q
• so AR =P
• So AR = D curve!!!!

7/31/2019 03 Business Revenue
http://slidepdf.com/reader/full/03-business-revenue 27/37
41
0011 0010 1010 1101 0001 0100 1011
Average Revenue
Revenue
Output
Average
revenue
P1
P2
Q1 Q2
What happens ifPrices arelowered?

7/31/2019 03 Business Revenue
http://slidepdf.com/reader/full/03-business-revenue 28/37
41
0011 0010 1010 1101 0001 0100 1011
Average Revenue
Revenue
Output
Average
revenue
P1
P2
Q1 Q2
Lost revenue
from lower price
Increased
revenuefrom selling
more
How does abusiness decideon the ‘optimum’price to charge?

7/31/2019 03 Business Revenue
http://slidepdf.com/reader/full/03-business-revenue 29/37
41
0011 0010 1010 1101 0001 0100 1011
Marginal & Average Revenue
Revenue
Output
Average
revenue
P1
P2
Q1 Q2
Marginal
revenue
It dependson the
‘marginal’
revenue

7/31/2019 03 Business Revenue
http://slidepdf.com/reader/full/03-business-revenue 30/37
41
0011 0010 1010 1101 0001 0100 1011
Maximising Total RevenueRevenue
Output
AR
MR
P1
Q1
Total revenue maximised when MR = zero

7/31/2019 03 Business Revenue
http://slidepdf.com/reader/full/03-business-revenue 31/37
41
0011 0010 1010 1101 0001 0100 1011Your go…. A numerical example..

7/31/2019 03 Business Revenue
http://slidepdf.com/reader/full/03-business-revenue 32/37
41
0011 0010 1010 1101 0001 0100 1011
Fill
inthe
gaps
…
price per unit
SALES AR
(TR/quantity) TR MR
1 20
2 36
3 48
4 565 60
6 60
7 56
8 48
9 36
10 20

7/31/2019 03 Business Revenue
http://slidepdf.com/reader/full/03-business-revenue 33/37
41
0011 0010 1010 1101 0001 0100 1011
The answers..
Why would
you not want anegative MR?
Why accept a
0 MR rather than a MR of
4?
price per unit
SALES
AR
(TR/quantity
) TR MR
1 20 20
2 18 36 16
3 16 48 12
4 14 56 8
5 12 60 4
6 10 60 0
7 8 56 -4
8 6 48 -8
9 4 36 -12
10 2 20 -16
Which is better 5
sales with 60 TR
or 6 sales with
60 TR?

7/31/2019 03 Business Revenue
http://slidepdf.com/reader/full/03-business-revenue 34/37
41
0011 0010 1010 1101 0001 0100 1011
The diagram…
-20
-10
0
10
20
30
40
50
60
70
1 2 3 4 5 6 7 8 9 10
AR
TR
MR
Total revenue maximised when MR = zero
Once MR isnegative…TRstarts to fall!

7/31/2019 03 Business Revenue
http://slidepdf.com/reader/full/03-business-revenue 35/37
41
0011 0010 1010 1101 0001 0100 1011
A Shift in Revenue Curves
Revenue
Output
AR1
MR1
AR2
MR2
A shift in the demandcurve for a business(i.e. an outward shift ofAR) will also cause anoutward shift of MR
The reverse is true foran inward shift indemand. I.e. revenueswill tend to fall if there
is an industry widerecession affecting thedemand of a business

7/31/2019 03 Business Revenue
http://slidepdf.com/reader/full/03-business-revenue 36/37
41
0011 0010 1010 1101 0001 0100 1011
Importance of revenues
• Revenues affect the profitability of a business
• When demand is price inelastic, a fall in price
causes a fall in TR (marginal revenue will benegative)
• The elasticity of demand (AR) has an effect on the
profit margins of businesses in competitive and
concentrated markets
• When demand is perfectly elastic, then the AR and
the MR curves are the same

7/31/2019 03 Business Revenue
http://slidepdf.com/reader/full/03-business-revenue 37/37
41
0011 0010 1010 1101 0001 0100 1011
HWK
• Finchfield Cycles
• Andertain p 303
• Complete Q 1a, b, c & Q2