Revenue & Business Model Nepal EA
13
Strictly private and confidential Revenue & Business Model Nepal EA
Transcript of Revenue & Business Model Nepal EA

Strictly private and confidential
Revenue & Business Model
Nepal EA

2 Error! No text of specified style in document. | Error! No text of specified style in document.
Contents
1. VISOR Business & Revenue Model .................................................................... 4
1.1. Value Proposition .......................................................................................... 4
1.2. Interface ........................................................................................................... 5
1.3. Service Platform ............................................................................................. 5
1.4. Organizing Model ........................................................................................... 5
1.5. Revenue & Cost Optimization model - ...................................................... 5
2. Revenue Impact Assessment................................................................................ 7
2.1. E-services ......................................................................................................... 7
2.2. Shared infrastructure model ...................................................................... 7
2.3. Cost savings with shared human resources ........................................... 8
2.4. Cost Savings with cloud infrastructure .................................................. 8
2.5. Key Drivers and Potential Benefits of EA ............................................... 10
2.6. Ease of Doing Business ............................................................................... 12
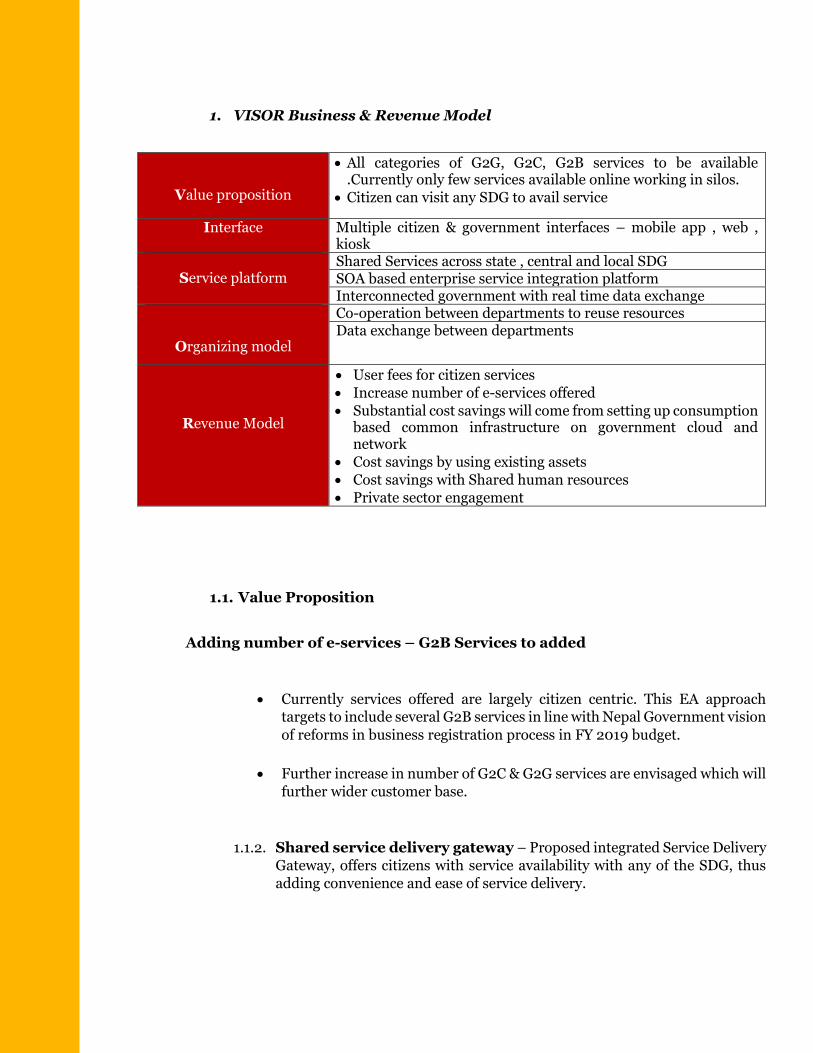
1. VISOR Business & Revenue Model
Value proposition
All categories of G2G, G2C, G2B services to be available .Currently only few services available online working in silos.
Citizen can visit any SDG to avail service
Interface Multiple citizen & government interfaces – mobile app , web , kiosk
Service platform
Shared Services across state , central and local SDG SOA based enterprise service integration platform Interconnected government with real time data exchange
Organizing model
Co-operation between departments to reuse resources Data exchange between departments
Revenue Model
User fees for citizen services
Increase number of e-services offered
Substantial cost savings will come from setting up consumption based common infrastructure on government cloud and network
Cost savings by using existing assets
Cost savings with Shared human resources
Private sector engagement
1.1. Value Proposition
Adding number of e-services – G2B Services to added
Currently services offered are largely citizen centric. This EA approach targets to include several G2B services in line with Nepal Government vision
of reforms in business registration process in FY 2019 budget.
Further increase in number of G2C & G2G services are envisaged which will
further wider customer base.
1.1.2. Shared service delivery gateway – Proposed integrated Service Delivery
Gateway, offers citizens with service availability with any of the SDG, thus
adding convenience and ease of service delivery.
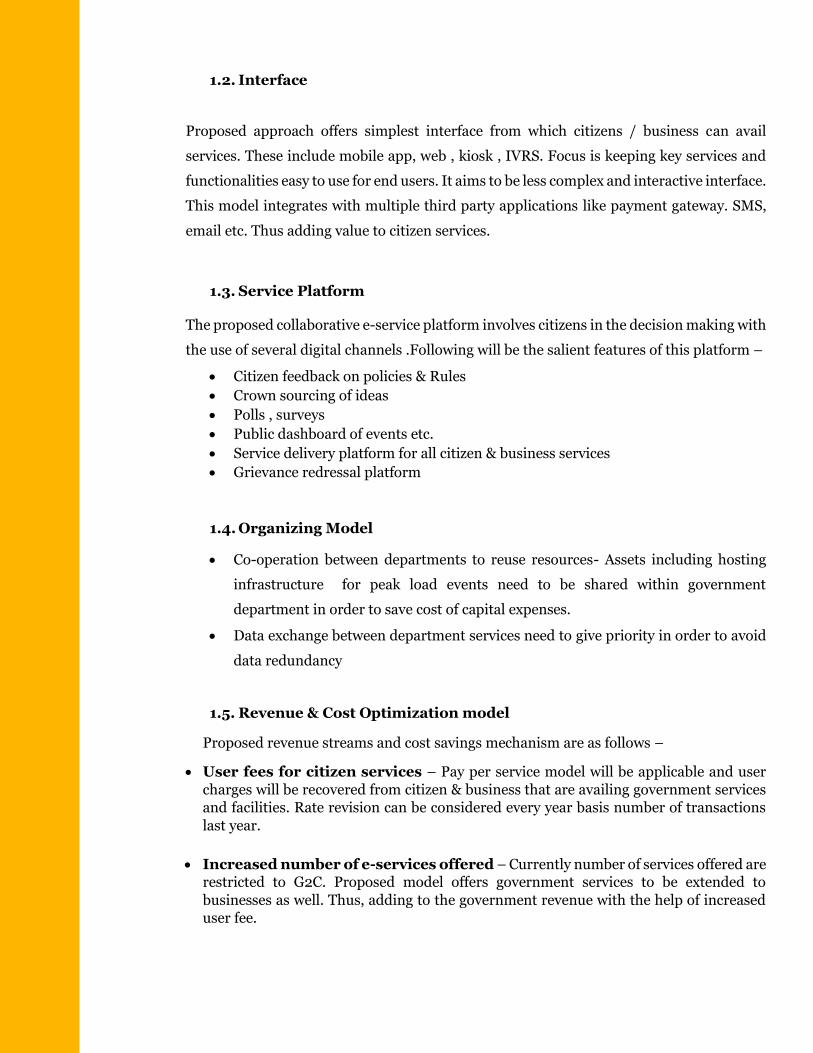
1.2. Interface
Proposed approach offers simplest interface from which citizens / business can avail
services. These include mobile app, web , kiosk , IVRS. Focus is keeping key services and
functionalities easy to use for end users. It aims to be less complex and interactive interface.
This model integrates with multiple third party applications like payment gateway. SMS,
email etc. Thus adding value to citizen services.
1.3. Service Platform
The proposed collaborative e-service platform involves citizens in the decision making with
the use of several digital channels .Following will be the salient features of this platform –
Citizen feedback on policies & Rules
Crown sourcing of ideas
Polls , surveys
Public dashboard of events etc.
Service delivery platform for all citizen & business services
Grievance redressal platform
1.4. Organizing Model
Co-operation between departments to reuse resources- Assets including hosting
infrastructure for peak load events need to be shared within government
department in order to save cost of capital expenses.
Data exchange between department services need to give priority in order to avoid
data redundancy
1.5. Revenue & Cost Optimization model
Proposed revenue streams and cost savings mechanism are as follows –
User fees for citizen services – Pay per service model will be applicable and user
charges will be recovered from citizen & business that are availing government services
and facilities. Rate revision can be considered every year basis number of transactions
last year.
Increased number of e-services offered – Currently number of services offered are restricted to G2C. Proposed model offers government services to be extended to
businesses as well. Thus, adding to the government revenue with the help of increased
user fee.

Common cloud infrastructure to be used - Substantial cost savings will come from
setting up consumption based infrastructure on government cloud and network. Each
department instead of hosting their application on segregated data centres, will host on
GIDC which will decrease procurement cost of government departments substantially.
Further hosting on cloud environment reduces capex substantially as compared to on
premise model.
Cost savings by using existing assets- Existing infrastructure can be reused to
considerably reduce capital expenditure costs. This includes End user computing
Components, existing Servers , network components and bandwidth available
Cost savings with shared human resources- Government can share high demand
IT resources working in same technology ecosystem. Thus, negating cost of hiring new
resources for each IT initiative undertaken.
Private sector engagement- Government can rope in private players to invest in key Projects across department and implement on pay per transaction model. Thus , saving
government cost.
‒
Increase d number of Services offered
Common Cloud
Infrastructure
(GIDC)
Use of existing assets
Shared human resources
Private Sector Investment
Revenue Model & Cost optimization
User fees for government services & facilities

2. Revenue Impact Assessment
2.1. E-services
Augmentation in number of e services will substantially increase government revenue.
Table below shows sector wise estimate of number of e-services and projected yearly
revenue collection.
2.2. Shared infrastructure model
Component wise list of CAPEX & OPEX for an IT engagement is given below. Considering
5 IT engagement, given below are cost savings that can be achieved on shared infrastructure
model. Incremental cost for infra, network and operations is considered as 5 percent for
each IT engagement.
Category
Tentative Cost for one IT project
(in Crore NPR)
Separate cost of each IT project
(considering 5 IT
projects)
Shared common Infrastructure
model (5% increment)
Shared common Infrastructure
model (Considering 5 % contingency
on reduced cost) (in Crore NPR)
Sector
Expected number
of services
Per month Transaction
(for all states)
Indicative user charge per service
per transaction
(NPR)
Tentative User
charges collection per month
Tentative User charges
collection per year
Agriculture & Allied 15 200000 10 3 Cr. 36 Cr. Government
Procurement 5 12000 100 60 Lakh 7.2 Cr.
Health 15 300000 10 4.5 Cr. 54 Cr. Industry &
Commerce 10 10000 100 1 Cr. 12 Cr.
Transport 10 700000 10 7 Cr. 84 Cr. Licenses & Permits 5 10000 100 50 Lakh 6 Cr.
Utility Services 5 200000 10 1 Cr. 12 Cr. Passport 7 25000 15 ~ 26 Lakh 3.1 Cr.
Civil Services 15 500000 15 11.25 Cr. 135 Cr. Education 15 300000 10 4.5 Cr. 54 Cr.
Public Service
Commission 10 100000 20 2 Cr. 24 Cr.
Total NPR 430 Cr.

Application Development 200 1000 1000
1000
Infrastructure 70 350 17.5 ~ 183
Network 20 100 5 ~ 52.5
Operations 25 125 6.25 ~ 65.63
Total 315 1575 1028.75 ~ 1300
Savings
~ NPR 275
Cr.
2.3. Cost savings with shared human resources
Position wise list of resources required in an IT project are given below. With shared
resources model, considering 50 percent reusability of development and operations team,
hiring requirement is considerably less.
2.4. Cost Savings with cloud infrastructure
Position
Number of Resources (for one IT
engagement)
Number of Resources (for
five IT engagements)
Shared resources
model Remarks
Program Director 1 5 5 Project Manager 1 5 5 Business Analyst 2 10 10 Development &
testing Team 15 75 37 (50% resources shared) Operation &
Helpdesk Team 20 100 50
Total 39 195 107
Difference 88

S. No.
Items Estimated On
Premise cost (5 Years)
Estimated Cloud Cost (5 years)
Remarks
1 Compute cost 662532385.94 3477616.04
Compute Cost include hosting Web portal to rollout G2G ,G2C application including AMC for 5 yrs
2 Data Centre cost
12119924.00 0.00 Rental Cost it may vary as per location
3 Networking cost
1521707.50 32757.30 Supporting infra e.g. DNS, DHCP & proxy servers
4 Storage cost 20602201.13 10689701.57
Storage Cost include Usable 100 TB considering RAID 5 with HA controller including AMC for 5 yrs
5 IT labour cost 19058542.08 70,28,061.50
It Labour Cost include L1 & L2 Engineer for Computing , Storage,Network & Security. Support Include 8*5
715834760.65 14200074.91
A total savings of ₹ 68,27,89,537.16
Assumptions:
Data centre setup include structure cabling & OFC cabling for Server farm
connectivity
Data centre security solution include NextGen security solution (e.g. Gateway
firewall, Web application firewall, VPN gateway, Data protection etc.)
Considered 100 TB storage capacity after configuring RAID 5
Servers for web, Application & Database and other miscellaneous services (e.g.
DNS, DHCP, NMS etc.)
IT labour cost include full time administrator cost
All core components have been considered in High availability mode

2.5. Key Drivers and Potential Benefits of EA

Value Drivers Typical Benefits
• Benefit realisation through
traceability
• Governance and delivery
assurance
• Improved compliance, disaster
recovery, and security
• 60-70% improvement in delivering
business value of projects
• 30-40% of IT budget reallocated to
strategic investments
• Richer customer experience,
satisfaction, and retention
• Shared business data and
platforms
• Accelerated adoption of
pioneering technologies
• 10-15% improvement in customer
conversion rates
• 7-10% increase in sales revenue
• 45-60% improvement in product
design to launch cycle time
• Re-use through repeatable, scalable
solutions
• Accelerated acquisition integration
• Reduced complexity and operating
cost
• Disciplined execution with reduced
delivery time and cost
• 15-25% reduction in operating
costs
• 20-25% reduction in system
support and maintenance costs
• 20-30% improvement in service
levels
Governance
Innovation
Reusability
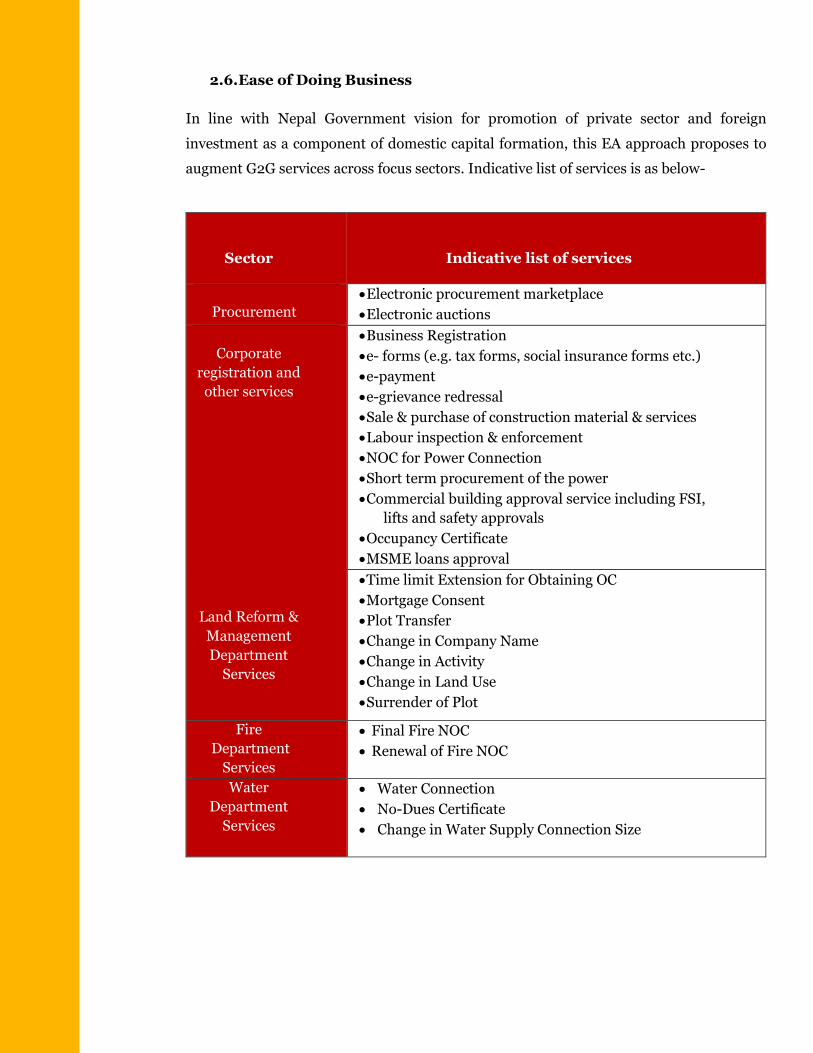
2.6. Ease of Doing Business
In line with Nepal Government vision for promotion of private sector and foreign
investment as a component of domestic capital formation, this EA approach proposes to
augment G2G services across focus sectors. Indicative list of services is as below-
Sector Indicative list of services
Procurement
Electronic procurement marketplace
Electronic auctions
Corporate
registration and
other services
Business Registration
e- forms (e.g. tax forms, social insurance forms etc.)
e-payment
e-grievance redressal
Sale & purchase of construction material & services
Labour inspection & enforcement
NOC for Power Connection
Short term procurement of the power
Commercial building approval service including FSI,
lifts and safety approvals
Occupancy Certificate
MSME loans approval
Land Reform &
Management
Department
Services
Time limit Extension for Obtaining OC
Mortgage Consent
Plot Transfer
Change in Company Name
Change in Activity
Change in Land Use
Surrender of Plot
Fire
Department
Services
Final Fire NOC
Renewal of Fire NOC
Water
Department
Services
Water Connection
No-Dues Certificate
Change in Water Supply Connection Size