01 ENERGY SUPPLY SINGAPORE · 2018-10-04 · Market Share for Natural Gas Retail Natural Gas...
136
SINGAPORE ENERGY STATISTICS
Transcript of 01 ENERGY SUPPLY SINGAPORE · 2018-10-04 · Market Share for Natural Gas Retail Natural Gas...
ENERGY SUPPLY01
S I NGAPOREE NERGYS TATISTICS
ENERGY SUPPLY02
ENERGY MARKET AUTHORITY
DIRECTORRESEARCH & STATISTICS UNITENERGY TECHNOLOGY & DATA DEPARTMENT
The Energy Market Authority (EMA) is a statutory board under the Ministry of Trade and Industry. Our main goals are to ensure a reliable and secure energy supply, promote effective competition in the energy market, and develop a dynamic energy sector in Singapore. Through our work, EMA seeks to forge a progressive energy landscape for sustained growth.
ISSN 2251-2624
©Research and Statistics Unit, Energy Market Authority
All rights reserved. No part of this publication may be reproduced in any material form (including photocopy or storing it in any medium by electronic means and whether or not transiently or incidentally to some other use of this publication) without prior written permission of the copyright owner except in accordance with the provision of the Copyright Act (Cap. 63). Applications for the copyright owner’s written permission to reproduce any part of this publication should be addressed to:
Energy Market Authority991G Alexandra Road #02-29Singapore 119975Republic of Singapore
PREFACE
BERNARD NEE
Deputy Chief ExecutiveEnergy Planning & Development DivisionEnergy Market AuthoritySingaporeAugust 2018
* http://www.ema.gov.sg/Singapore_Energy_Statistics.aspx^ https://www.ema.gov.sg/Statistics.aspx
I am pleased to present to you the eighth edition of the Singapore Energy Statistics (SES) report with an additional dataset that provides an overview of the number of electricity accounts over the years.
With the inclusion of this new dataset, the 47 data tables across seven energy-related topics will provide you with a comprehensive understanding of Singapore’s energy landscape.
In April this year, EMA commenced the soft launch of the Open Electricity Market (OEM) in Jurong to allow over 100,000 electricity accounts, comprising both households and businesses, to choose who they wish to buy electricity from. A full rollout to the remaining 1.3 million accounts in Singapore will follow starting from the second half of 2018. This publication also provides a short commentary on our OEM journey thus far.
The SES 2018 report can be accessed online via a dedicated micro-site*. Additional energy-related statistics not covered in this report can also be found online^.
I wish to extend my deepest gratitude to the organisations, government ministries and statutory boards that provided the key information, without which this publication would not have been possible. We look forward to your continued support.
iii
Imports of Energy ProductsExports of Energy Products Domestic Exports of Energy Products Re-Exports of Energy ProductsStock Change
ENERGY SNAPSHOT OF SINGAPORE 2018
PREFACE
EXECUTIVE SUMMARY
ENERGY SUPPLY
1.11.21.2.11.2.21.3
6789
10
iii
vi
viii
101
TABLE OF CONTENTS
Energy Flows for Electricity GenerationAnnual Fuel Mix for Electricity Generation by Energy Products Monthly Fuel Mix for Electricity Generation by Energy ProductsElectricity Generation Capacity by Technology Type Electricity Generation Capacity by GeneratorPlant Technology Share of Electricity GenerationMarket Share of Electricity GenerationEnergy Flows in the Oil Refining Sector
Market Share of Electricity Retail Based on Electricity SalesElectricity Consumption by Sub-Sector (Total) Electricity Consumption by Sub-Sector (Contestable Consumers) Electricity Consumption by Sub-Sector (Non-Contestable Consumers)Number of Electricity Accounts by Sub-Sector (Total)Total Household Electricity Consumption by Dwelling TypeAverage Monthly Household Electricity Consumption by Dwelling TypeAverage Monthly Electricity Consumption by Planning Area and Dwelling Type (Annual)Market Share for Natural Gas RetailNatural Gas Consumption by Sub-SectorTotal Household Town Gas Consumption by Dwelling TypeAverage Monthly Household Town Gas Consumption by Dwelling TypeAverage Monthly Household Town Gas Consumption by Planning Area and Dwelling Type (Annual)Total Oil Consumption by SectorTotal Final Energy Consumption
ENERGY TRANSFORMATION
ENERGY CONSUMPTION
2.12.22.2.12.32.3.12.42.52.6
3.13.23.2.13.2.23.33.43.53.6
3.73.83.93.103.11
3.123.13
2021222324252626
3940414243454953
5858596367
7273
1102
2703
iv
Electricity Grid Emission Factor And Upstream Fugitive Methane Emission FactorPeak System DemandNumber Of Power Sector Employees By OccupationNumber Of Power Sector Employees By Residency StatusNumber Of Licensed Electrical, Gas Service & Cable Detection Workers
TABLE OF CONTENTS
Electricity Balance TableNatural Gas Balance Table
ENERGY BALANCES
4.14.2
79 80
Electricity and Town Gas TariffsMonthly Electricity Tariffs (Low Tension Tariffs)Annual Electricity Tariffs by Components (Low Tension Tariffs)Average Monthly Uniform Singapore Energy Price (USEP)Monthly Town Gas TariffsConsumer Price Index for Selected Energy Products (Base Index Of 100 At 2014)Producer and International Trade Price Indices of Mineral Fuels, Lubricants and Related Materials (Base Index of 100 At 2012)
ENERGY PRICES
5.15.25.35.45.55.6
5.7
85 85 86 86 87 88
88
Installed Capacity of Grid-Connected Solar Photovoltaic (PV) Systems by User TypeInstalled Capacity of Grid-Connected Solar Photovoltaic (PV) Systems by ContestabilityNumber of Grid-Connected Solar Photovoltaic (PV) Installations by User TypeNumber of Grid-Connected Solar Photovoltaic (PV) Installations by ContestabilitySolar Photovoltaic (PV) Installations by Planning Region
SOLAR
93
94
949595
OTHER ENERGY-RELATED STATISTICS7.1
7.27.37.47.5
103
103104104104
TECHNICAL NOTES
GLOSSARY
10508
11109
Notes: a. Statistics published are the most recently available at the time of preparation. b. Numbers may not add up to the totals due to rounding. c. Some statistics, particularly for the most recent time periods, are provisional and may be subject to revision in later issues.d. All statistical tables above are available in machine-readable format on http://www.ema.gov.sg/singapore_energy_statistics.aspx.
Notations used in data tables: “-”— nil, negligible or not applicable“s” — suppressed to avoid disclosure of individual data
7504
8105
8906
9907
v
6.1
6.2
6.36.46.5
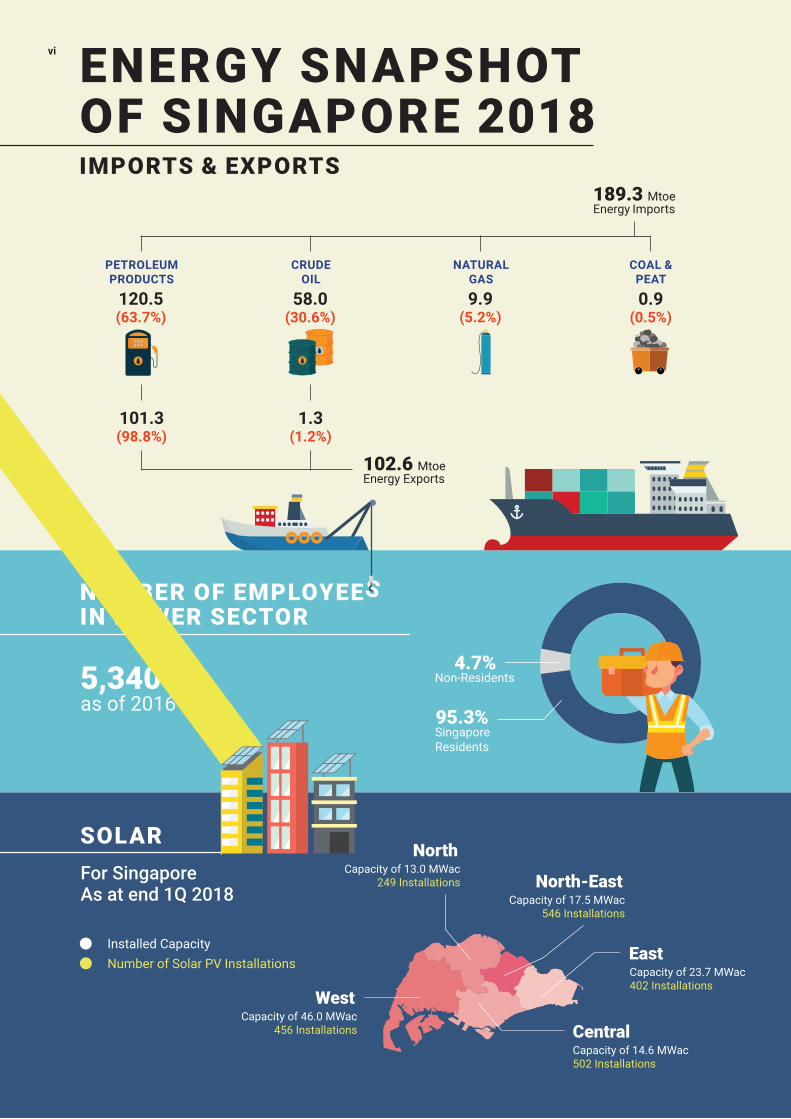
ENERGY SUPPLY06 ENERGY SNAPSHOTOF SINGAPORE 2018IMPORTS & EXPORTS
For Singapore As at end 1Q 2018
4.7%5,340 Non-Residents
as of 2016
PETROLEUM PRODUCTS
CRUDEOIL
NATURALGAS
COAL & PEAT
SOLAR
West
North
North-East
East
CentralCapacity of 46.0 MWac
456 Installations
Capacity of 13.0 MWac249 Installations
Capacity of 17.5 MWac546 Installations
Capacity of 23.7 MWac402 Installations
Capacity of 14.6 MWac502 Installations
Installed CapacityNumber of Solar PV Installations
NUMBER OF EMPLOYEE IN POWER SECTOR
S
95.3%Singapore Residents
189.3 MtoeEnergy Imports
102.6 MtoeEnergy Exports
vi
0.9(0.5%)
9.9(5.2%)
58.0(30.6%)
120.5(63.7%)
101.3(98.8%)
1.3(1.2%)
SINGAPORE ENERGY STATISTICS 2018 07
49,643.7
60,226.6
9.6 4.5
GWh
TJ
of Electricity
of Natural Gas
Total Energy Inputs into Generation Companies
Total Gross Electricity Generated by the
Generation Companies1 Mtoe= 11,630 GWh
Mtoe Mtoe
Annual Fuel Mix for Electricity Generation by Energy Products
Singapore Consumed
ENERGY FLOWS
ENERGY CONSUMPTION
Electricity Generation Capacity by Technology Type
20181
Natural Gas
1 Data for 2018 as at end 1Q 2018.
Petroleum Products Coal Others
INDUSTRIAL -RELATED
TRANSPORT-RELATED HOUSEHOLD OTHERS
COMMERCE & SERVICES-RELATED
20153.0%
0.7%1.3%
95.0%
20102.6%
20.2%
77.2%
2.9%
95.3%
0.7%1.2%
vii
20181
2015
2010
13,614.4 MW
13,394.6 MW
9,931.3 MW 3.7%
1.3%
1.3%
0.3%
0.8%
2.6%
1.9%
1.9%
62.0%
77.3%
77.2%
31.7%
19.1%
18.8%
CCGT/Co-Gen/Tri-Gen
Steam Turbine
Solar PV
Open Cycle Gas Turbine
Waste-to-Energy
21,516.3(43.3%)
17,804.3(35.9%)
2,750.8(5.5%)
7,295.8(14.7%)
276.5(0.6%)
102.0(0.2%)
2,604.3(4.3%)
288.4(0.5%)
3,706.9(6.2%)
53,525.0(88.9%)
ENERGY SUPPLY08
ENERGY FLOWS
• Singapore’s imports of energy products grew by 7.4% from 176.3 Mtoe in 2016 to 189.3 Mtoe in 2017. The exports of energy products registered a 3.3% increase from 99.3 Mtoe in 2016 to 102.6 Mtoe in 2017. The bulk of energy imports and exports were Petroleum Products.
• Imports of Natural Gas (NG) increased by 2.0% from 9.7 Mtoe in 2016 to 9.9 Mtoe in 2017, with Liquefied Natural Gas (LNG) accounting for 27.6% of NG imports.
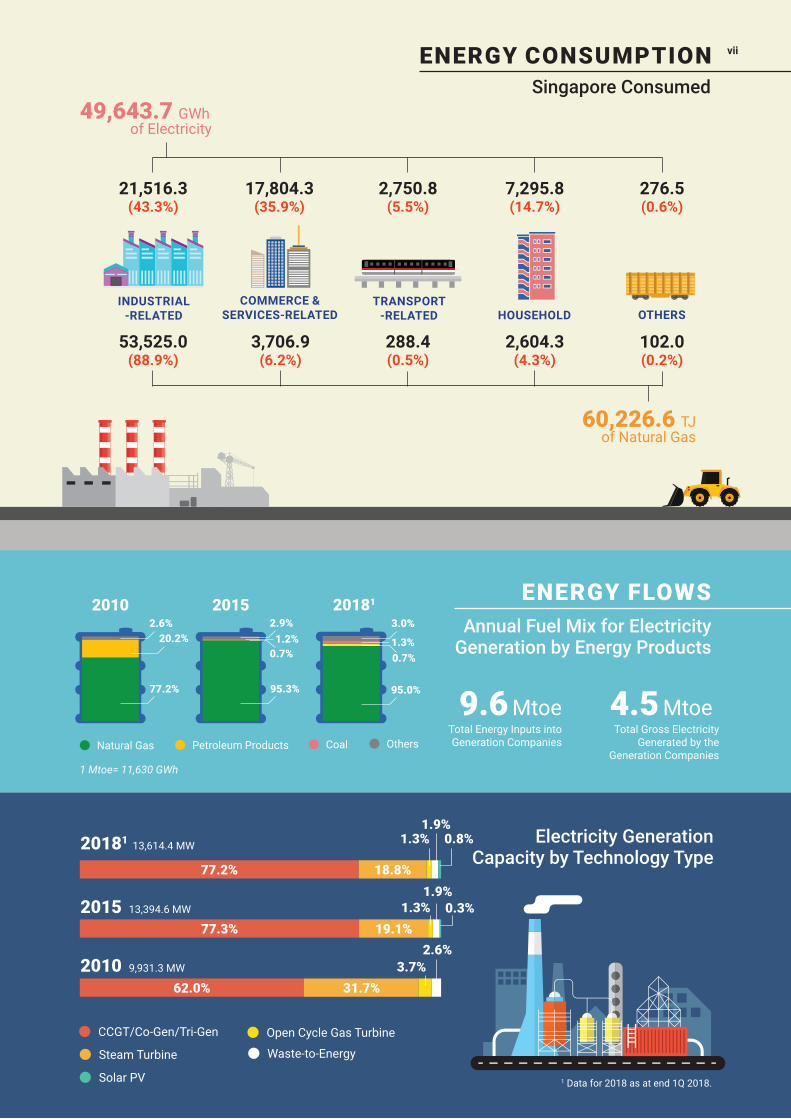
• Electricity generation rose by 1.2% from 51.6 TWh in 2016 to 52.2 TWh in 2017. In 2017, NG accounted for 95.2% of the fuel mix. Main Power Producers in Singapore accounted for 92.4% of total electricity generated. The remaining 7.6% was attributed to Autoproducers.
• Total electricity generation capacity in Singapore was 13,614.4 MW as at end March 2018. More than three quarters (10,508.2 MW or 77.2% of total capacity) was attributed to Combined Cycle Gas Turbines, Co-Generation Plants and/or Tri-Generation Plants.
• Electricity consumption grew by 2.1% from 48.6 TWh in 2016 to 49.6 TWh in 2017. Industrial-related sectors, Commerce & Services-related sectors and Households comprised 43.3%, 35.9% and 14.7% of total consumption respectively.
• End-users’ consumption of NG increased by 5.8%, from 56,949.2 TJ in 2016 to 60,226.6 TJ in 2017, due to stronger demand by the Industrial-related sector.
EXECUTIVESUMMARY
viii
SINGAPORE ENERGY STATISTICS 2018 09
SOLAR AND OTHER ENERGY STATISTICS
• While Grid-connected installed capacity grew sharply from 7.7 MWac in 2012 to 96.7 MWac in 2016, its growth had moderated recently and total installed capacity stood at 114.8 MWac in 1Q 2018. This growth is likely to increase. The Housing & Development Board (HDB) and the Economic Development Board (EDB) are jointly spearheading the acceleration of the deployment of solar PV systems in Singapore through the SolarNova project, which was launched in 2014. As part of this effort, three solar leasing tenders have been called to-date. Singapore is expected to reach the committed solar PV capacity of 350 MWp via this project by 2020.
• As at end 1Q 2018, the west region of Singapore had the highest concentration of solar PV, with a total capacity of 46.0 MWac (40.1%) distributed across 456 installations.
• Singapore’s Grid Emission Factor (GEF), which measures emissions per unit of electricity generated, remained relatively constant in 2017 at 0.4192 kg CO2/kWh.
ix
ENERGY SUPPLY01
01ENERGYSUPPLY

SINGAPORE ENERGY STATISTICS 2018 02
ENERGY SUPPLY03
0
40,000
80,000
120,000
160,000
200,000
20172016201520102005
IMPORTS & EXPORTS OF ENERGY PRODUCTS
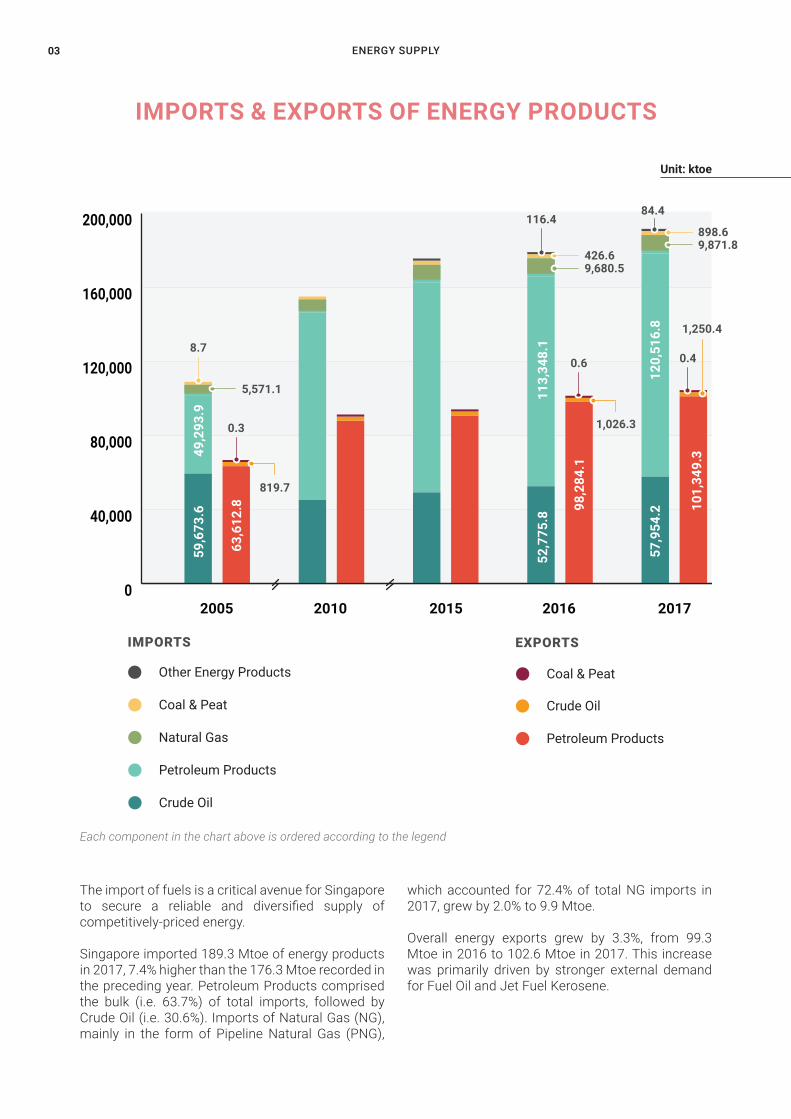
The import of fuels is a critical avenue for Singapore to secure a reliable and diversified supply of competitively-priced energy.
Singapore imported 189.3 Mtoe of energy products in 2017, 7.4% higher than the 176.3 Mtoe recorded in the preceding year. Petroleum Products comprised the bulk (i.e. 63.7%) of total imports, followed by Crude Oil (i.e. 30.6%). Imports of Natural Gas (NG), mainly in the form of Pipeline Natural Gas (PNG),
which accounted for 72.4% of total NG imports in 2017, grew by 2.0% to 9.9 Mtoe.
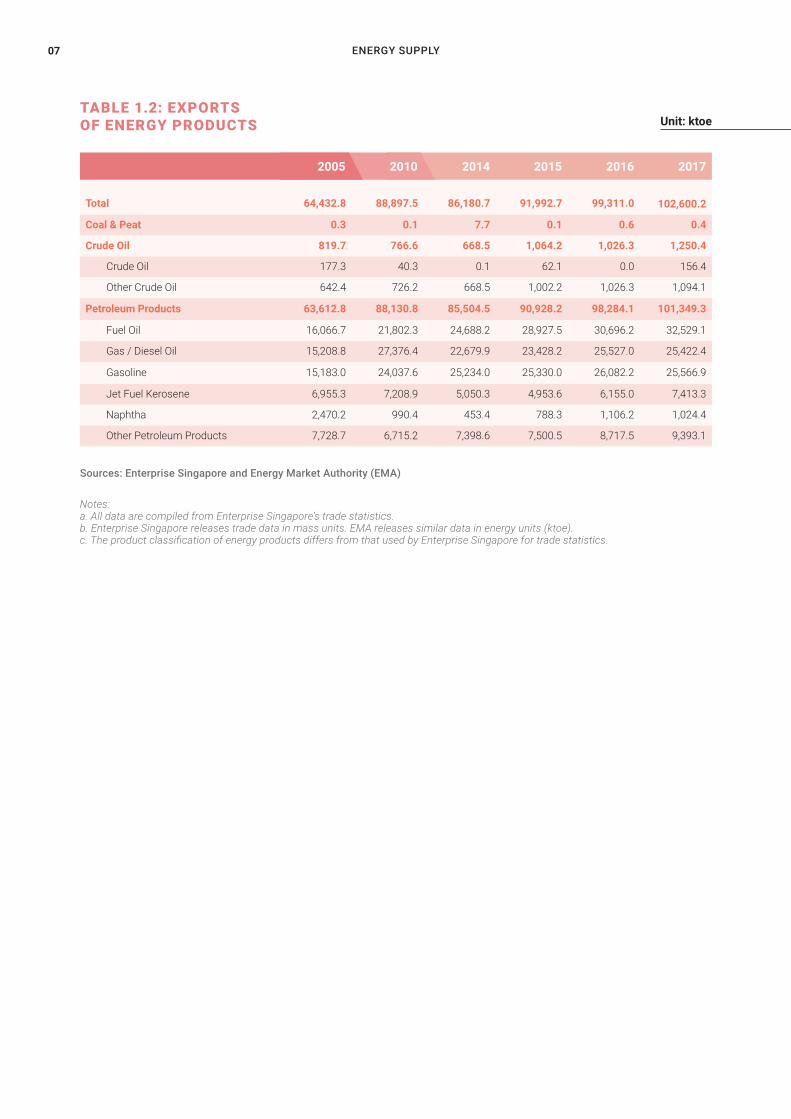
Overall energy exports grew by 3.3%, from 99.3 Mtoe in 2016 to 102.6 Mtoe in 2017. This increase was primarily driven by stronger external demand for Fuel Oil and Jet Fuel Kerosene.
Unit: ktoe
Crude Oil
Petroleum Products
Petroleum Products
Crude Oil
Coal & PeatOther Energy Products
Coal & Peat
Natural Gas
IMPORTS EXPORTS
Each component in the chart above is ordered according to the legend
9,680.5
9,871.8426.6
898.6116.4
84.459
,673
.649
,293
.9
113,
348.
1
120,
516.
8
52,7
75.8
57,9
54.2
8.7
5,571.1
0.3
0.6 0.4
63,6
12.8 98
,284
.1
101,
349.
3
819.7
1,026.3
1,250.4

SINGAPORE ENERGY STATISTICS 2018 04
ENERGY SUPPLY05
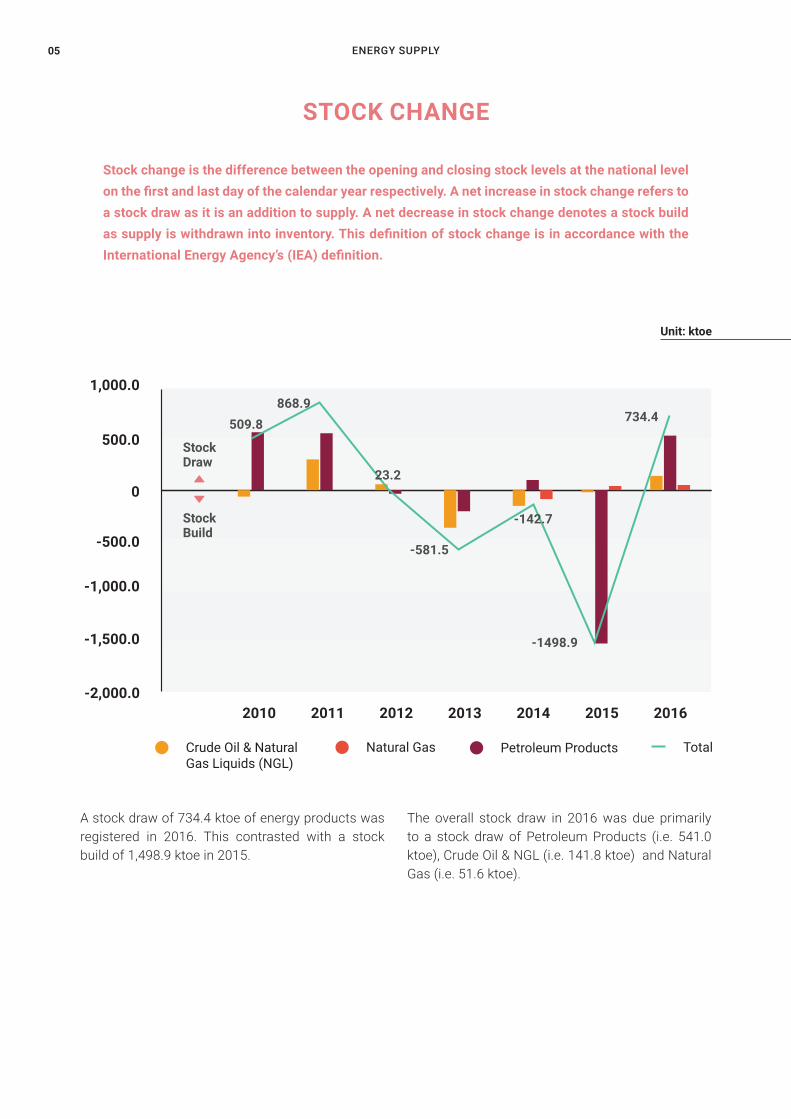
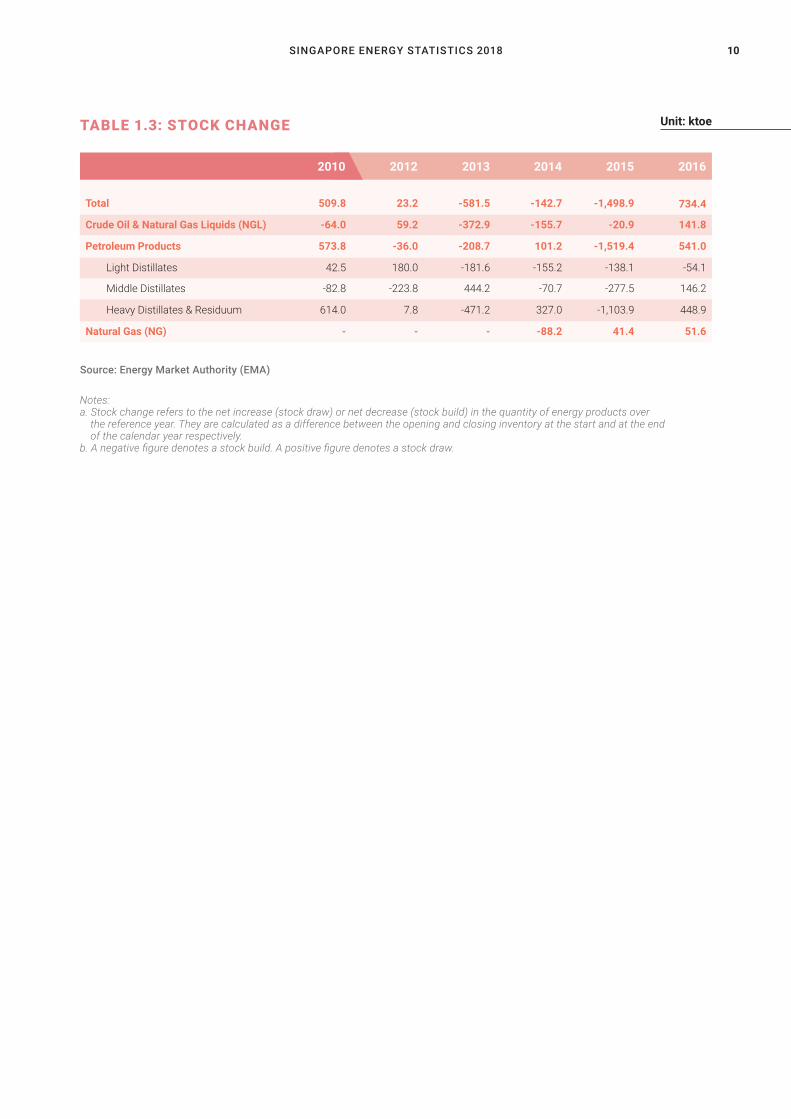
A stock draw of 734.4 ktoe of energy products was registered in 2016. This contrasted with a stock build of 1,498.9 ktoe in 2015.
The overall stock draw in 2016 was due primarily to a stock draw of Petroleum Products (i.e. 541.0 ktoe), Crude Oil & NGL (i.e. 141.8 ktoe) and Natural Gas (i.e. 51.6 ktoe).
Stock change is the difference between the opening and closing stock levels at the national level on the first and last day of the calendar year respectively. A net increase in stock change refers to a stock draw as it is an addition to supply. A net decrease in stock change denotes a stock build as supply is withdrawn into inventory. This definition of stock change is in accordance with the International Energy Agency’s (IEA) definition.
Unit: ktoe
STOCK CHANGE
Crude Oil & Natural Gas Liquids (NGL)
Petroleum ProductsNatural Gas Total
2010 20132011 20142012 2015 2016-2,000.0
-1,500.0
-1,000.0
500.0
1,000.0
-500.0
0
Stock Draw
Stock Build
734.4
-142.7
-1498.9
-581.5
868.9509.8
23.2
SINGAPORE ENERGY STATISTICS 2018 06
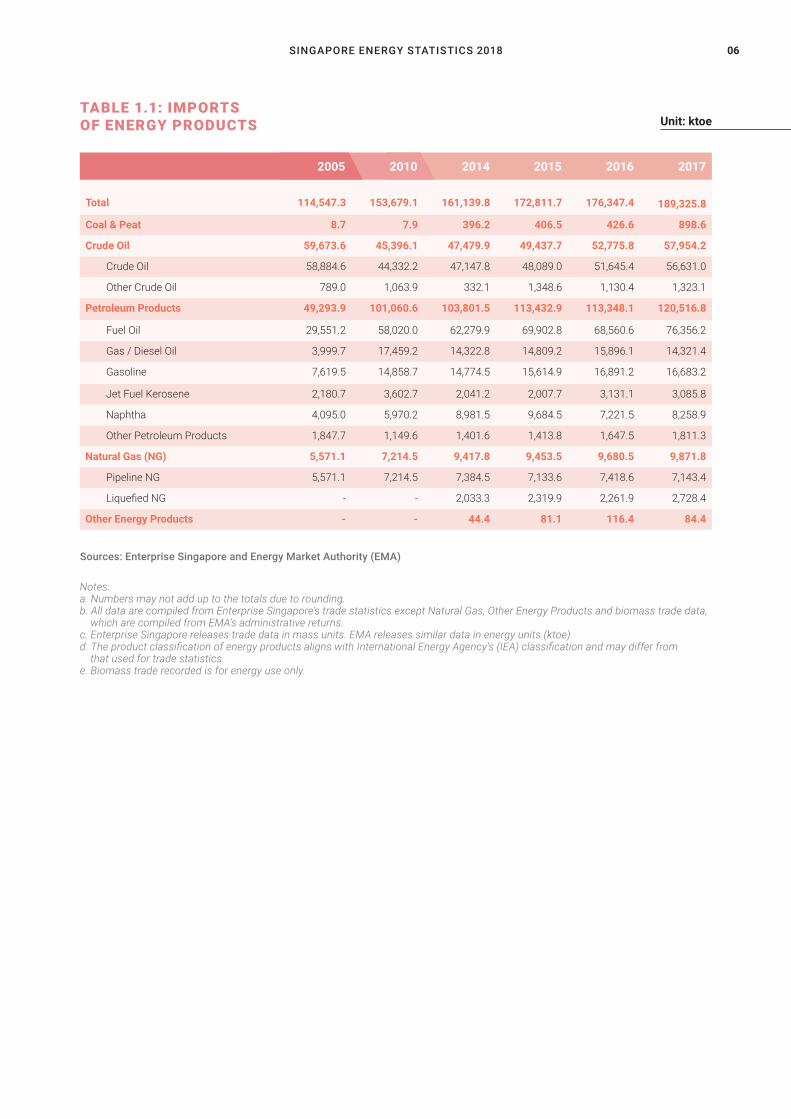
TABLE 1.1: IMPORTSOF ENERGY PRODUCTS
Total
114,547.3
153,679.1
161,139.8
172,811.7
176,347.4 189,325.8
Coal & Peat 8.7 7.9 396.2 406.5 426.6 898.6
Crude Oil 59,673.6 45,396.1 47,479.9 49,437.7 52,775.8 57,954.2
Crude Oil 58,884.6 44,332.2 47,147.8 48,089.0 51,645.4 56,631.0
Other Crude Oil 789.0 1,063.9 332.1 1,348.6 1,130.4 1,323.1
Petroleum Products 49,293.9 101,060.6 103,801.5 113,432.9 113,348.1 120,516.8
Fuel Oil 29,551.2 58,020.0 62,279.9 69,902.8 68,560.6 76,356.2
Gas / Diesel Oil 3,999.7 17,459.2 14,322.8 14,809.2 15,896.1 14,321.4
Gasoline 7,619.5 14,858.7 14,774.5 15,614.9 16,891.2 16,683.2
Jet Fuel Kerosene 2,180.7 3,602.7 2,041.2 2,007.7 3,131.1 3,085.8
Naphtha 4,095.0 5,970.2 8,981.5 9,684.5 7,221.5 8,258.9
Other Petroleum Products 1,847.7 1,149.6 1,401.6 1,413.8 1,647.5 1,811.3
Natural Gas (NG) 5,571.1 7,214.5 9,417.8 9,453.5 9,680.5 9,871.8
Pipeline NG 5,571.1 7,214.5 7,384.5 7,133.6 7,418.6 7,143.4
Liquefied NG - - 2,033.3 2,319.9 2,261.9 2,728.4
Other Energy Products - - 44.4 81.1 116.4 84.4
2005 2010 2014 2015 2016 2017
Notes: a. Numbers may not add up to the totals due to rounding. b. All data are compiled from Enterprise Singapore’s trade statistics except Natural Gas, Other Energy Products and biomass trade data, which are compiled from EMA’s administrative returns. c. Enterprise Singapore releases trade data in mass units. EMA releases similar data in energy units (ktoe). d. The product classification of energy products aligns with International Energy Agency’s (IEA) classification and may differ from that used for trade statistics. e. Biomass trade recorded is for energy use only.
Sources: Enterprise Singapore and Energy Market Authority (EMA)
Unit: ktoe
ENERGY SUPPLY07
TABLE 1.2: EXPORTS OF ENERGY PRODUCTS
Total 64,432.8
88,897.5
86,180.7
91,992.7
99,311.0 102,600.2
Coal & Peat 0.3 0.1 7.7 0.1 0.6 0.4
Crude Oil 819.7 766.6 668.5 1,064.2 1,026.3 1,250.4
Crude Oil 177.3 40.3 0.1 62.1 0.0 156.4
Other Crude Oil 642.4 726.2 668.5 1,002.2 1,026.3 1,094.1
Petroleum Products 63,612.8 88,130.8 85,504.5 90,928.2 98,284.1 101,349.3
Fuel Oil 16,066.7 21,802.3 24,688.2 28,927.5 30,696.2 32,529.1
Gas / Diesel Oil 15,208.8 27,376.4 22,679.9 23,428.2 25,527.0 25,422.4
Gasoline 15,183.0 24,037.6 25,234.0 25,330.0 26,082.2 25,566.9
Jet Fuel Kerosene 6,955.3 7,208.9 5,050.3 4,953.6 6,155.0 7,413.3
Naphtha 2,470.2 990.4 453.4 788.3 1,106.2 1,024.4
Other Petroleum Products 7,728.7 6,715.2 7,398.6 7,500.5 8,717.5 9,393.1
Notes: a. All data are compiled from Enterprise Singapore’s trade statistics. b. Enterprise Singapore releases trade data in mass units. EMA releases similar data in energy units (ktoe). c. The product classification of energy products differs from that used by Enterprise Singapore for trade statistics.
Sources: Enterprise Singapore and Energy Market Authority (EMA)
Unit: ktoe
2005 2010 2014 2015 2016 2017
SINGAPORE ENERGY STATISTICS 2018 08
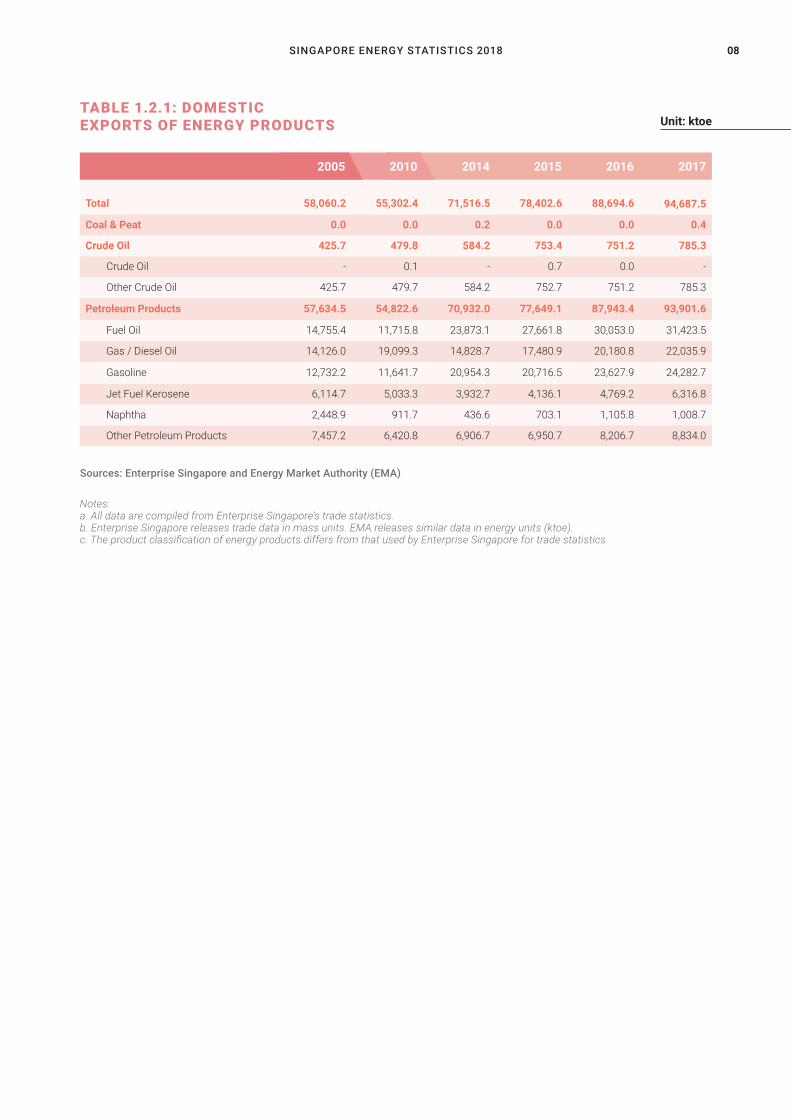
TABLE 1.2.1: DOMESTIC EXPORTS OF ENERGY PRODUCTS
Total
58,060.2
55,302.4
71,516.5
78,402.6
88,694.6 94,687.5
Coal & Peat 0.0 0.0 0.2 0.0 0.0 0.4
Crude Oil 425.7 479.8 584.2 753.4 751.2 785.3
Crude Oil - 0.1 - 0.7 0.0 -
Other Crude Oil 425.7 479.7 584.2 752.7 751.2 785.3
Petroleum Products 57,634.5 54,822.6 70,932.0 77,649.1 87,943.4 93,901.6
Fuel Oil 14,755.4 11,715.8 23,873.1 27,661.8 30,053.0 31,423.5
Gas / Diesel Oil 14,126.0 19,099.3 14,828.7 17,480.9 20,180.8 22,035.9
Gasoline 12,732.2 11,641.7 20,954.3 20,716.5 23,627.9 24,282.7
Jet Fuel Kerosene 6,114.7 5,033.3 3,932.7 4,136.1 4,769.2 6,316.8
Naphtha 2,448.9 911.7 436.6 703.1 1,105.8 1,008.7
Other Petroleum Products 7,457.2 6,420.8 6,906.7 6,950.7 8,206.7 8,834.0
Notes: a. All data are compiled from Enterprise Singapore’s trade statistics. b. Enterprise Singapore releases trade data in mass units. EMA releases similar data in energy units (ktoe). c. The product classification of energy products differs from that used by Enterprise Singapore for trade statistics.
Sources: Enterprise Singapore and Energy Market Authority (EMA)
Unit: ktoe
2005 2010 2014 2015 2016 2017

ENERGY SUPPLY09
TABLE 1.2.2: RE-EXPORTS OF ENERGY PRODUCTS
Total
6,372.6
33,595.0
14,664.2
13,590.1
10,616.5 7,912.8
Coal & Peat 0.3 0.0 7.5 0.1 0.6 0.1
Crude Oil 394.0 286.8 84.3 310.8 275.1 465.1
Crude Oil 177.3 40.2 0.0 61.4 0.0 156.4
Other Crude Oil 216.7 246.6 84.3 249.5 275.1 308.7
Petroleum Products 5,978.3 33,308.2 14,572.4 13,279.1 10,340.8 7,447.7
Fuel Oil 1,311.3 10,086.5 815.1 1,265.7 643.2 1,105.6
Gas / Diesel Oil 1,082.8 8,277.1 7,851.2 5,947.3 5,346.2 3,386.6
Gasoline 2,450.7 12,395.9 4,279.8 4,613.5 2,454.4 1,284.2
Jet Fuel Kerosene 840.6 2,175.7 1,117.6 817.5 1,385.8 1,096.4
Naphtha 21.4 78.7 16.9 85.2 0.4 15.7
Other Petroleum Products 271.5 294.4 491.9 549.8 510.8 559.1
Notes: a. All data are compiled from Enterprise Singapore’s trade statistics. b. Enterprise Singapore releases trade data in mass units. EMA releases similar data in energy units (ktoe). c. The product classification of energy products differs from that used by Enterprise Singapore for trade statistics.
Sources: Enterprise Singapore and Energy Market Authority (EMA)
Unit: ktoe
2005 2010 2014 2015 2016 2017
SINGAPORE ENERGY STATISTICS 2018 10
TABLE 1.3: STOCK CHANGE
Total
509.8
23.2 -581.5 -142.7 -1,498.9 734.4
Crude Oil & Natural Gas Liquids (NGL) -64.0 59.2 -372.9 -155.7 -20.9 141.8
Petroleum Products 573.8 -36.0 -208.7 101.2 -1,519.4 541.0
Light Distillates 42.5 180.0 -181.6 -155.2 -138.1 -54.1
Middle Distillates -82.8 -223.8 444.2 -70.7 -277.5 146.2
Heavy Distillates & Residuum 614.0 7.8 -471.2 327.0 -1,103.9 448.9
Natural Gas (NG) - - - -88.2 41.4 51.6
Notes: a. Stock change refers to the net increase (stock draw) or net decrease (stock build) in the quantity of energy products over the reference year. They are calculated as a difference between the opening and closing inventory at the start and at the end of the calendar year respectively. b. A negative figure denotes a stock build. A positive figure denotes a stock draw.
Source: Energy Market Authority (EMA)
Unit: ktoe
2010 2012 2013 2014 2015 2016
ENERGY TRANSFORMATION11
02ENE RGYTRANSFORMATION

SINGAPORE ENERGY STATISTICS 2018 12
ENERGY TRANSFORMATION13
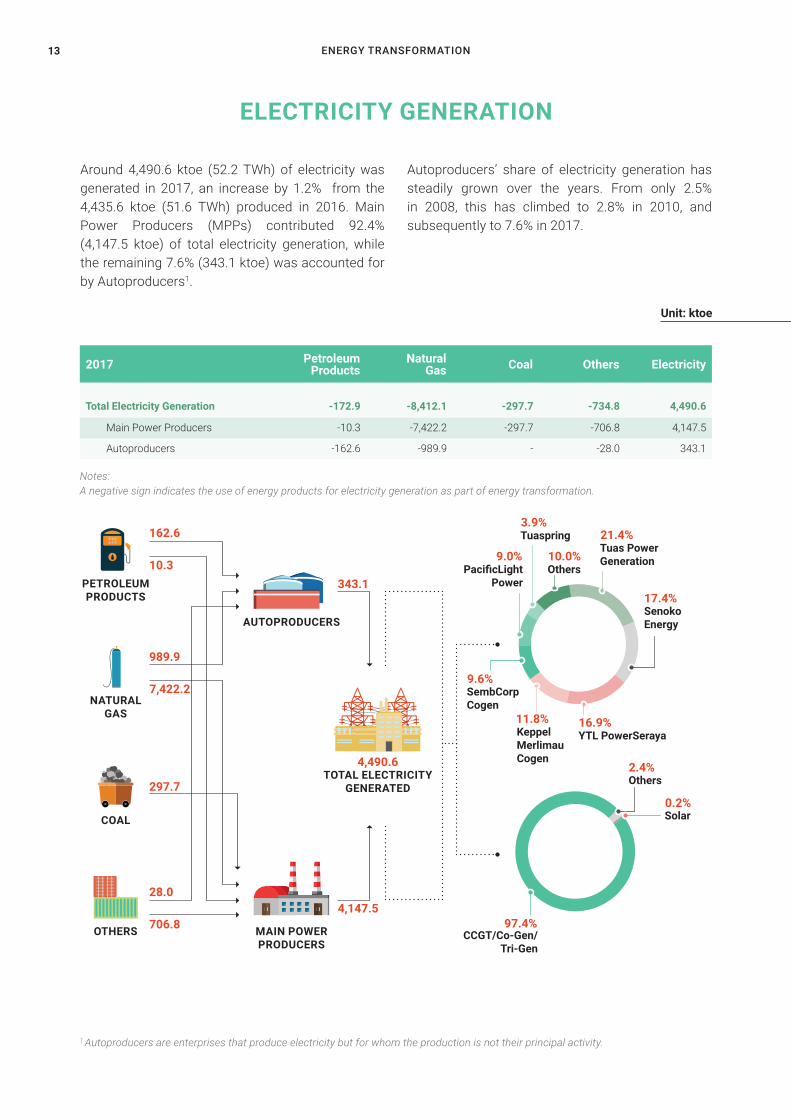
Around 4,490.6 ktoe (52.2 TWh) of electricity was generated in 2017, an increase by 1.2% from the 4,435.6 ktoe (51.6 TWh) produced in 2016. Main Power Producers (MPPs) contributed 92.4% (4,147.5 ktoe) of total electricity generation, while the remaining 7.6% (343.1 ktoe) was accounted for by Autoproducers1.
Autoproducers’ share of electricity generation has steadily grown over the years. From only 2.5% in 2008, this has climbed to 2.8% in 2010, and subsequently to 7.6% in 2017.
Unit: ktoe
ELECTRICITY GENERATION
1 Autoproducers are enterprises that produce electricity but for whom the production is not their principal activity.
Notes: A negative sign indicates the use of energy products for electricity generation as part of energy transformation.
PETROLEUM PRODUCTS
162.6
989.9
28.0
10.3 343.1
4,147.5
7,422.2
706.8
297.7
NATURALGAS
COAL
OTHERS MAIN POWERPRODUCERS
AUTOPRODUCERS
Total Electricity Generation
-172.9
-8,412.1
-297.7
-734.8
4,490.6
Main Power Producers -10.3 -7,422.2 -297.7 -706.8 4,147.5
Autoproducers -162.6 -989.9 - -28.0 343.1
Petroleum Products Coal2017 Natural
Gas Others Electricity
4,490.6TOTAL ELECTRICITY
GENERATED
21.4%
17.4%
2.4%
0.2%
9.6%
11.8% 16.9%
9.0% 10.0%Tuas Power Generation
Senoko Energy
Others
Solar
SembCorp Cogen
Keppel Merlimau Cogen
YTL PowerSeraya
PacificLightPower
Others
3.9%Tuaspring
97.4%CCGT/Co-Gen/
Tri-Gen
SINGAPORE ENERGY STATISTICS 2018 14
0%
10%
20%
30%
40%
50%
60%
70%
80%
90%
100%Others
Coal
Natural Gas
Petroleum Products
2018120172016201520102005
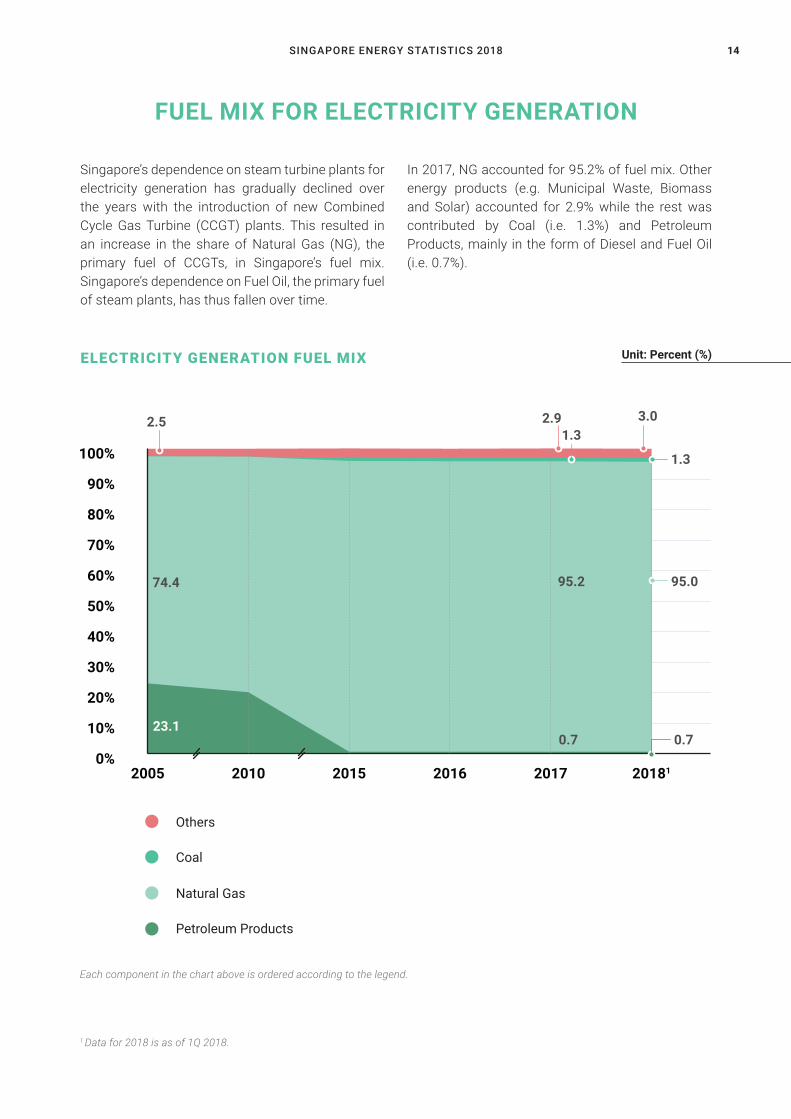
Singapore’s dependence on steam turbine plants for electricity generation has gradually declined over the years with the introduction of new Combined Cycle Gas Turbine (CCGT) plants. This resulted in an increase in the share of Natural Gas (NG), the primary fuel of CCGTs, in Singapore’s fuel mix. Singapore’s dependence on Fuel Oil, the primary fuel of steam plants, has thus fallen over time.
FUEL MIX FOR ELECTRICITY GENERATION
1 Data for 2018 is as of 1Q 2018.
Each component in the chart above is ordered according to the legend.
In 2017, NG accounted for 95.2% of fuel mix. Other energy products (e.g. Municipal Waste, Biomass and Solar) accounted for 2.9% while the rest was contributed by Coal (i.e. 1.3%) and Petroleum Products, mainly in the form of Diesel and Fuel Oil (i.e. 0.7%).
Unit: Percent (%)
Others
Coal
Natural Gas
Petroleum Products
0.70.7
95.0
1.3
3.01.3
2.5 2.9
95.2
ELECTRICITY GENERATION FUEL MIX
23.1
74.4
ENERGY TRANSFORMATION15
-
2,000
4,000
6,000
8,000
10,000
12,000
14,000
16,000
201820172016201520102005
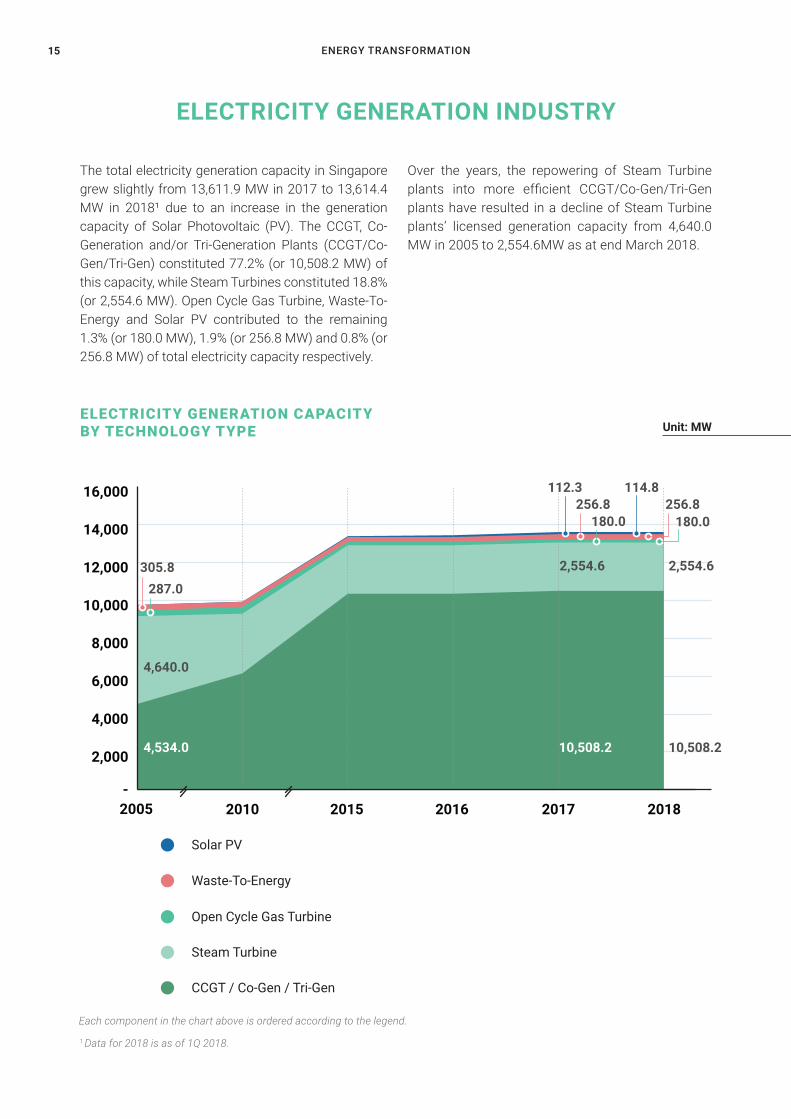
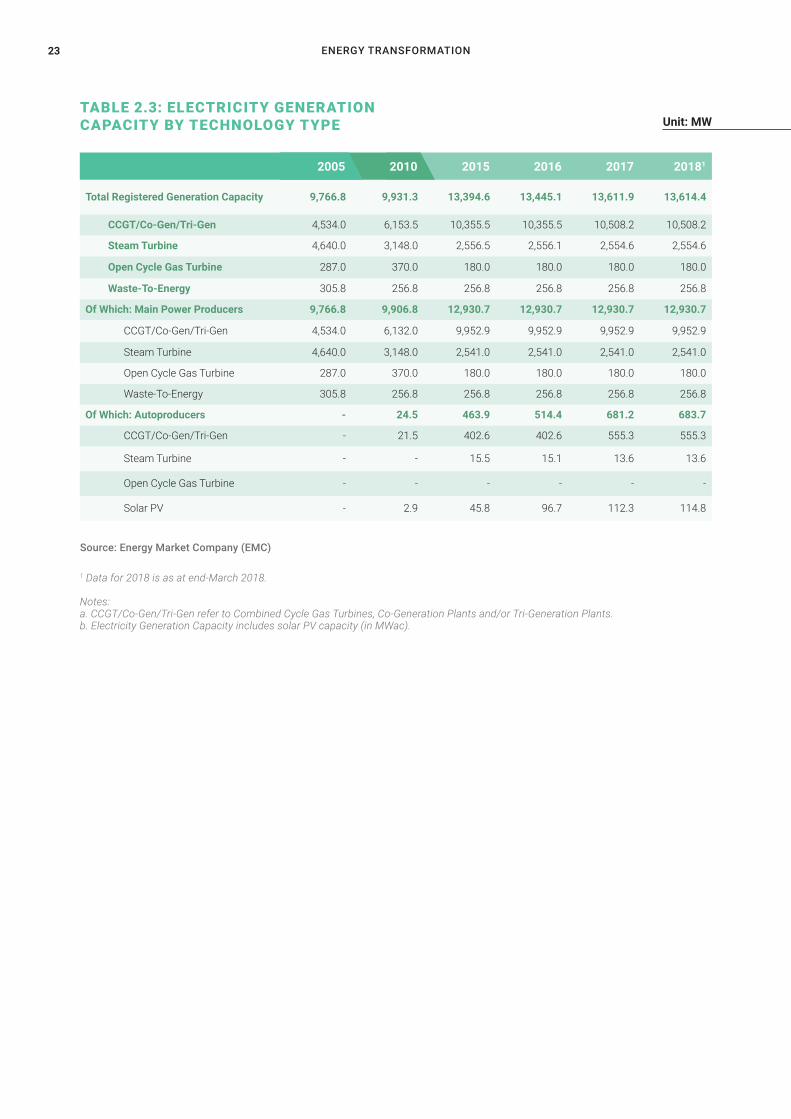
The total electricity generation capacity in Singapore grew slightly from 13,611.9 MW in 2017 to 13,614.4 MW in 2018¹ due to an increase in the generation capacity of Solar Photovoltaic (PV). The CCGT, Co-Generation and/or Tri-Generation Plants (CCGT/Co-Gen/Tri-Gen) constituted 77.2% (or 10,508.2 MW) of this capacity, while Steam Turbines constituted 18.8% (or 2,554.6 MW). Open Cycle Gas Turbine, Waste-To-Energy and Solar PV contributed to the remaining 1.3% (or 180.0 MW), 1.9% (or 256.8 MW) and 0.8% (or 256.8 MW) of total electricity capacity respectively.
Over the years, the repowering of Steam Turbine plants into more efficient CCGT/Co-Gen/Tri-Gen plants have resulted in a decline of Steam Turbine plants’ licensed generation capacity from 4,640.0 MW in 2005 to 2,554.6MW as at end March 2018.
ELECTRICITY GENERATION INDUSTRY
1 Data for 2018 is as of 1Q 2018.
Unit: MWELECTRICITY GENERATION CAPACITY BY TECHNOLOGY TYPE
Waste-To-Energy
CCGT / Co-Gen / Tri-Gen
Solar PV
Open Cycle Gas Turbine
Steam Turbine
Each component in the chart above is ordered according to the legend.
4,640.0
4,534.0
287.0305.8 2,554.6 2,554.6
10,508.2 10,508.2
180.0
114.8112.3256.8
180.0256.8

SINGAPORE ENERGY STATISTICS 2018 16
2018120172016201520102005-
2,000
4,000
6,000
8,000
10,000
12,000
14,000
16,000
MPPs accounted for 95.0% (or 12,930.7 MW) of total electricity generation capacity, while Autoproducers made up the remaining 5.0% ( 683.7 MW).
1 Data for 2018 is as of 1Q 2018.
Unit: MWELECTRICITY GENERATION CAPACITY BY MAIN POWER PRODUCER (MPP) AND AUTOPRODUCER
Each component in the chart above is ordered according to the legend.
MPP
Autoproducer
9766.8
12,930.7
681.2 683.7
12,930.7
ENERGY TRANSFORMATION17
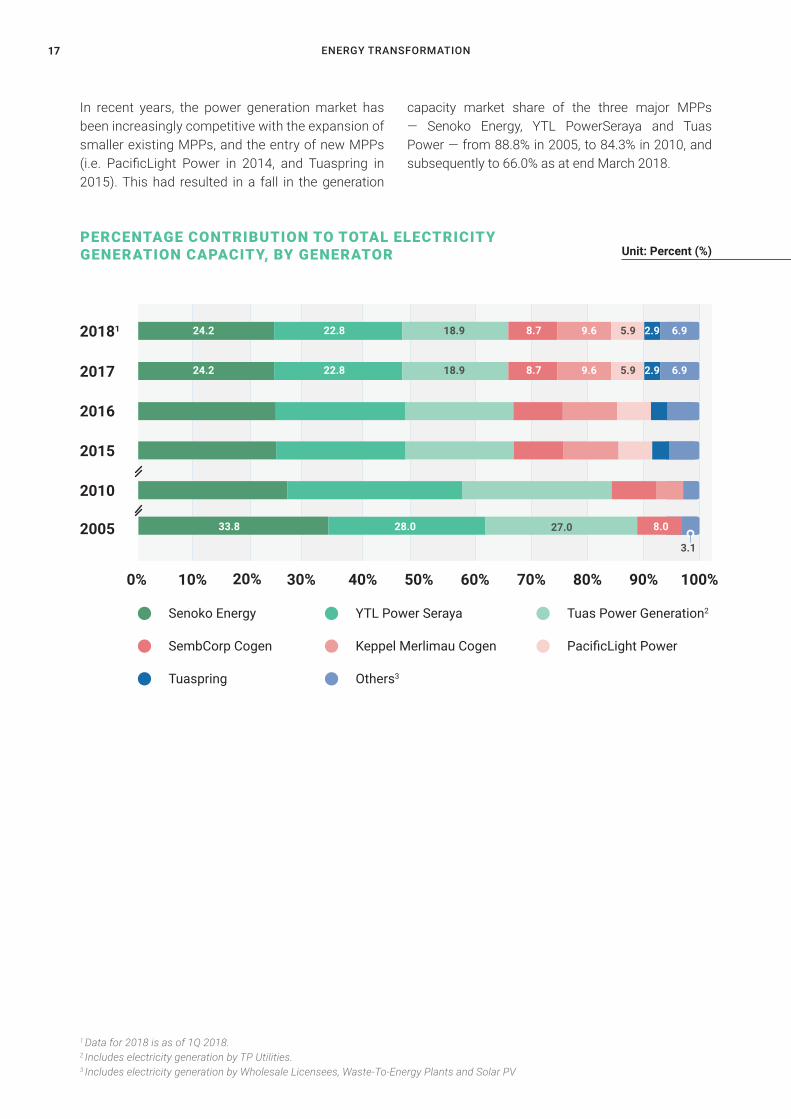
In recent years, the power generation market has been increasingly competitive with the expansion of smaller existing MPPs, and the entry of new MPPs (i.e. PacificLight Power in 2014, and Tuaspring in 2015). This had resulted in a fall in the generation
1 Data for 2018 is as of 1Q 2018.2 Includes electricity generation by TP Utilities.3 Includes electricity generation by Wholesale Licensees, Waste-To-Energy Plants and Solar PV
Unit: Percent (%)PERCENTAGE CONTRIBUTION TO TOTAL ELECTRICITY GENERATION CAPACITY, BY GENERATOR
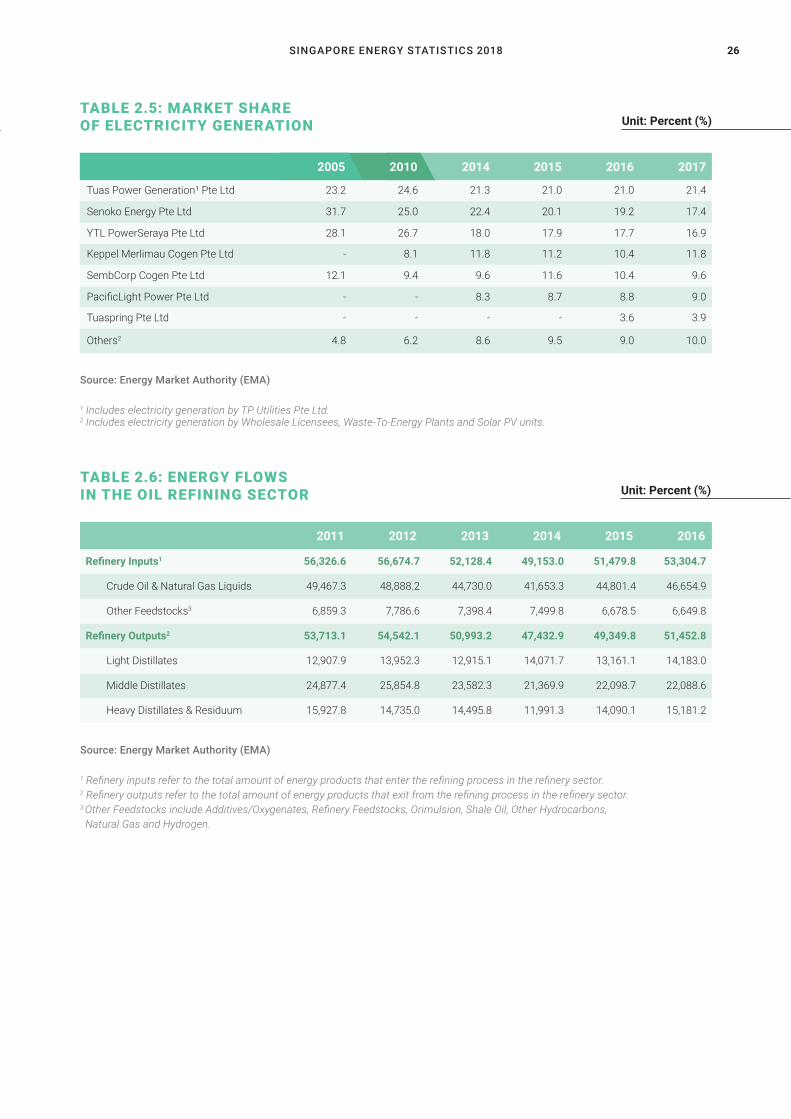
capacity market share of the three major MPPs — Senoko Energy, YTL PowerSeraya and Tuas Power — from 88.8% in 2005, to 84.3% in 2010, and subsequently to 66.0% as at end March 2018.
Senoko Energy YTL Power Seraya Tuas Power Generation2
Tuaspring Others3
SembCorp Cogen Keppel Merlimau Cogen PacificLight Power
0% 10% 30%20% 40% 50% 60% 70% 80% 90% 100%
20053.1
27.0 8.028.033.8
2017
20181 18.9
18.9
22.8
22.8
8.7
8.7
9.6
9.6
2.9
2.9
6.9
6.9
5.9
5.9
24.2
24.2
2016
2015
2010
SINGAPORE ENERGY STATISTICS 2018 18
2016
2017
2010
2015
2005
2014
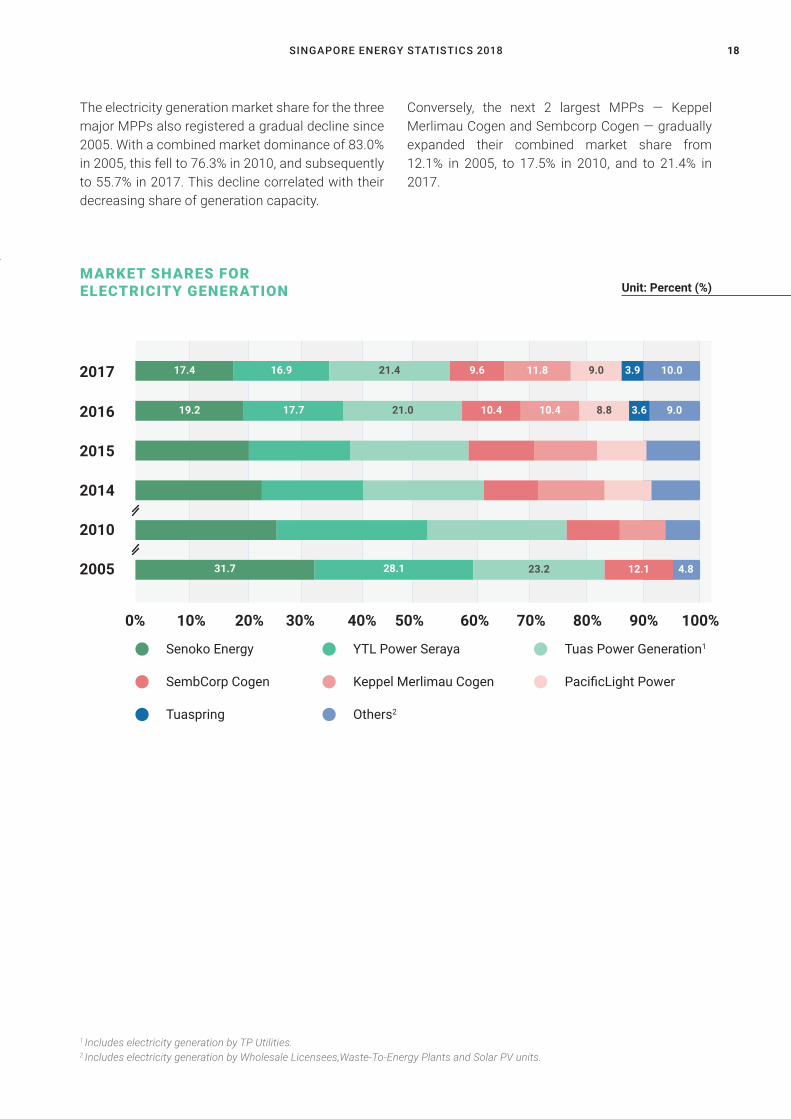
The electricity generation market share for the three major MPPs also registered a gradual decline since 2005. With a combined market dominance of 83.0% in 2005, this fell to 76.3% in 2010, and subsequently to 55.7% in 2017. This decline correlated with their decreasing share of generation capacity.
1 Includes electricity generation by TP Utilities.2 Includes electricity generation by Wholesale Licensees,Waste-To-Energy Plants and Solar PV units.
Unit: Percent (%)MARKET SHARES FORELECTRICITY GENERATION
Conversely, the next 2 largest MPPs — Keppel Merlimau Cogen and Sembcorp Cogen — gradually expanded their combined market share from 12.1% in 2005, to 17.5% in 2010, and to 21.4% in 2017.
0% 10% 20% 30% 40% 50% 60% 70% 80% 90% 100%
Senoko Energy YTL Power Seraya Tuas Power Generation1
Tuaspring Others2
SembCorp Cogen Keppel Merlimau Cogen PacificLight Power
19.2
17.4
17.7
16.9
10.4
9.6
12.131.7 28.1
21.0
21.4
23.2
8.8
9.0 3.9
3.610.4
11.8
9.0
10.0
4.8
ENERGY TRANSFORMATION19
53.3
49.2
51.5
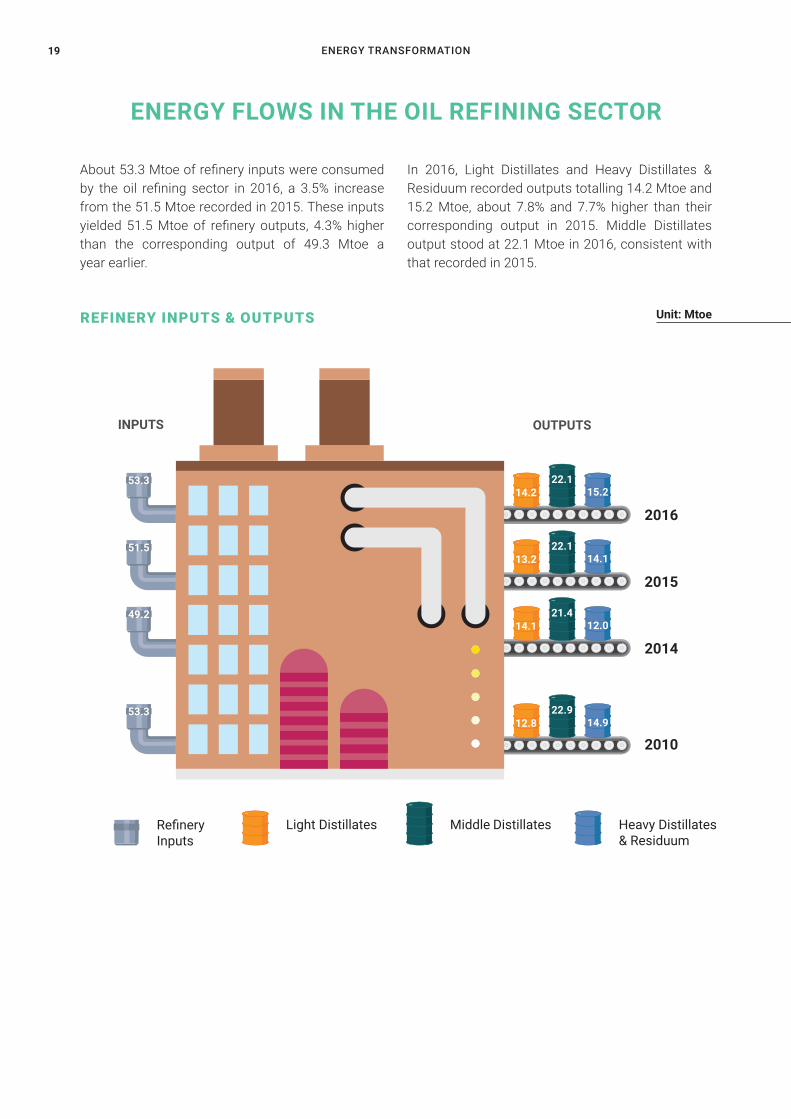
About 53.3 Mtoe of refinery inputs were consumed by the oil refining sector in 2016, a 3.5% increase from the 51.5 Mtoe recorded in 2015. These inputs yielded 51.5 Mtoe of refinery outputs, 4.3% higher than the corresponding output of 49.3 Mtoe a year earlier.
ENERGY FLOWS IN THE OIL REFINING SECTOR
Unit: MtoeREFINERY INPUTS & OUTPUTS
2015
2014
2010
2016
In 2016, Light Distillates and Heavy Distillates & Residuum recorded outputs totalling 14.2 Mtoe and 15.2 Mtoe, about 7.8% and 7.7% higher than their corresponding output in 2015. Middle Distillates output stood at 22.1 Mtoe in 2016, consistent with that recorded in 2015.
14.2
13.2
14.1
12.8
22.1
22.1
21.4
22.9
15.2
14.1
12.0
14.9
OUTPUTSINPUTS
53.3
Refinery Inputs
Heavy Distillates & Residuum
Light Distillates Middle Distillates
SINGAPORE ENERGY STATISTICS 2018 20
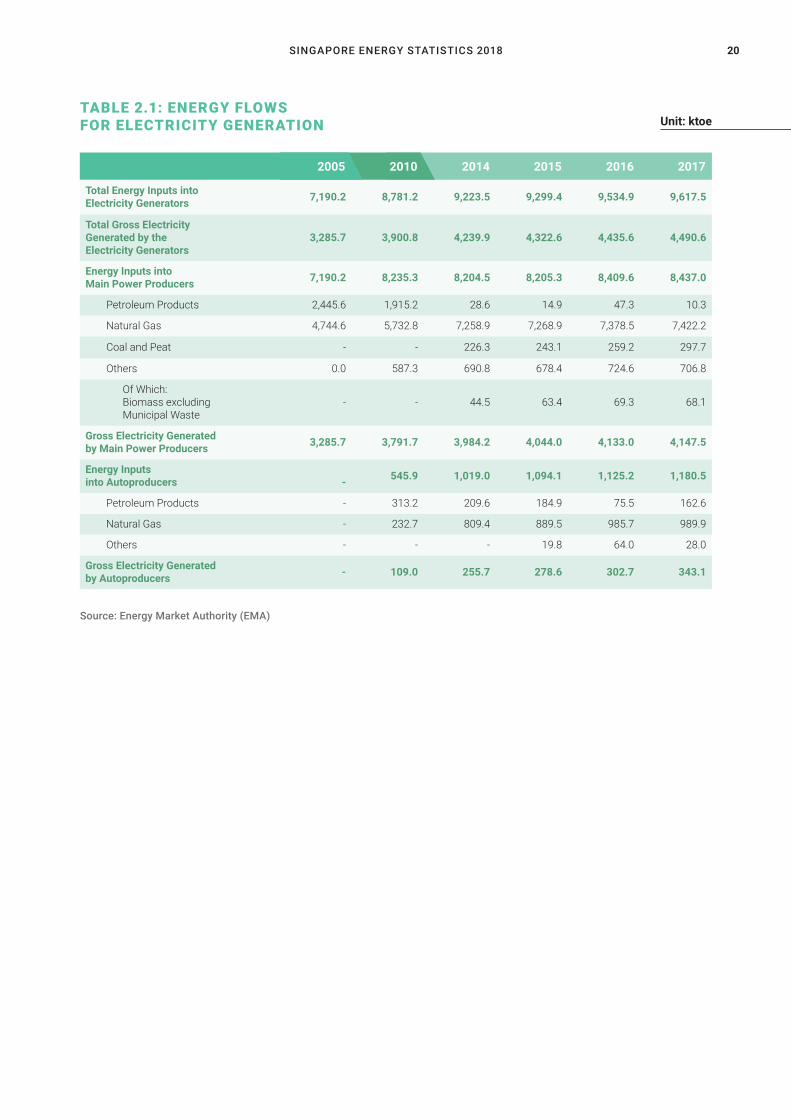
TABLE 2.1: ENERGY FLOWSFOR ELECTRICITY GENERATION
Total Energy Inputs intoElectricity Generators 7,190.2 8,781.2 9,223.5 9,299.4 9,534.9 9,617.5
Total Gross Electricity Generated by the Electricity Generators
3,285.7 3,900.8 4,239.9 4,322.6 4,435.6 4,490.6
Energy Inputs into Main Power Producers 7,190.2 8,235.3 8,204.5 8,205.3 8,409.6 8,437.0
Petroleum Products 2,445.6 1,915.2 28.6 14.9 47.3 10.3
Natural Gas 4,744.6 5,732.8 7,258.9 7,268.9 7,378.5 7,422.2
Coal and Peat - - 226.3 243.1 259.2 297.7
Others 0.0 587.3 690.8 678.4 724.6 706.8
Of Which:Biomass excludingMunicipal Waste
- - 44.5 63.4 69.3 68.1
Gross Electricity Generated by Main Power Producers 3,285.7 3,791.7 3,984.2 4,044.0 4,133.0 4,147.5
Energy Inputs into Autoproducers - 545.9 1,019.0 1,094.1 1,125.2 1,180.5
Petroleum Products - 313.2 209.6 184.9 75.5 162.6
Natural Gas - 232.7 809.4 889.5 985.7 989.9
Others - - - 19.8 64.0 28.0
Gross Electricity Generated by Autoproducers - 109.0 255.7 278.6 302.7 343.1
2005 2010 2014 2015 2016 2017
Source: Energy Market Authority (EMA)
Unit: ktoe
ENERGY TRANSFORMATION21
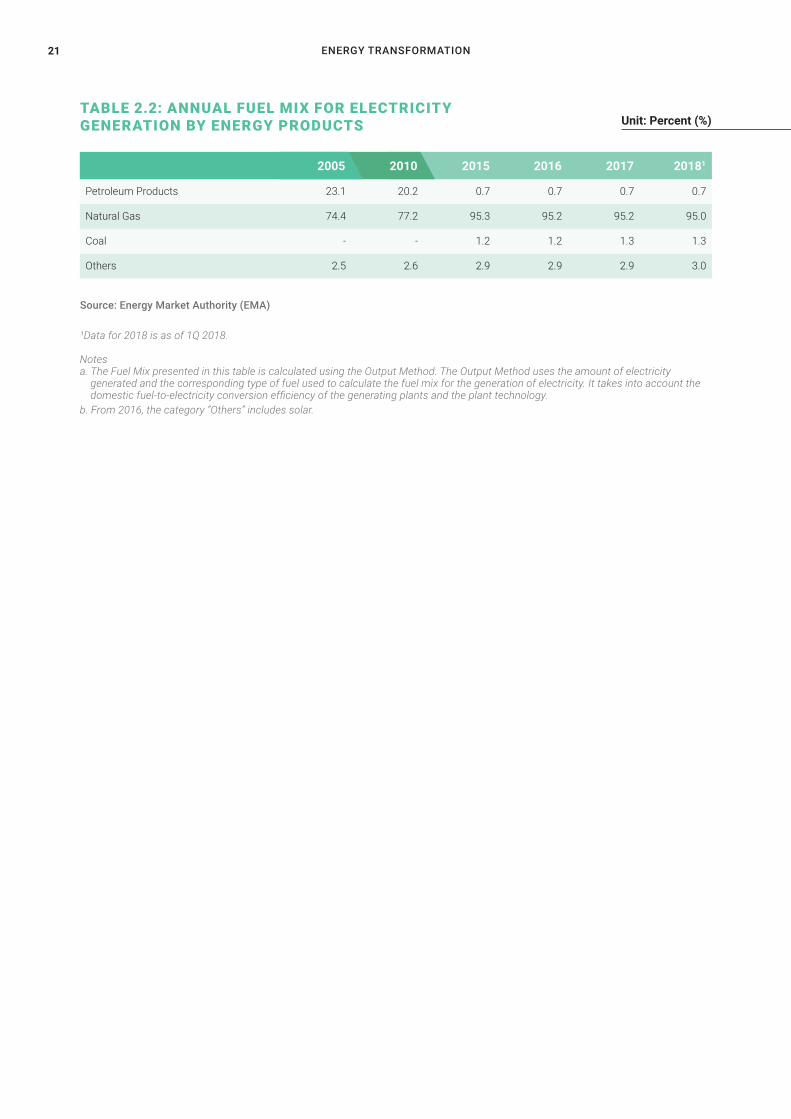
TABLE 2.2: ANNUAL FUEL MIX FOR ELECTRICITY GENERATION BY ENERGY PRODUCTS
Petroleum Products 23.1 20.2 0.7 0.7 0.7 0.7
Natural Gas 74.4 77.2 95.3 95.2 95.2 95.0
Coal - - 1.2 1.2 1.3 1.3
Others 2.5 2.6 2.9 2.9 2.9 3.0
2005 2010 2015 2016 2017 20181
¹Data for 2018 is as of 1Q 2018.
Notes a. The Fuel Mix presented in this table is calculated using the Output Method. The Output Method uses the amount of electricity generated and the corresponding type of fuel used to calculate the fuel mix for the generation of electricity. It takes into account the domestic fuel-to-electricity conversion efficiency of the generating plants and the plant technology. b. From 2016, the category “Others” includes solar.
Source: Energy Market Authority (EMA)
Unit: Percent (%)
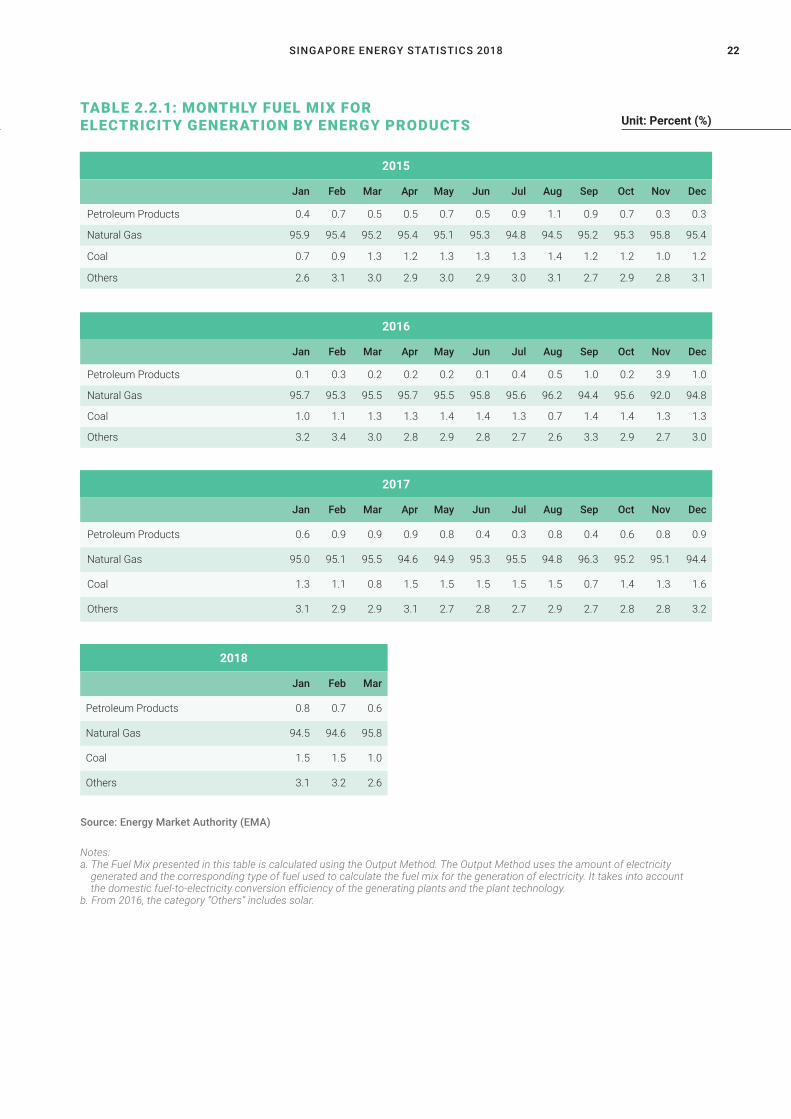
SINGAPORE ENERGY STATISTICS 2018 22
TABLE 2.2.1: MONTHLY FUEL MIX FOR ELECTRICITY GENERATION BY ENERGY PRODUCTS
Jan Feb Mar Apr May Jun Jul Aug Sep Oct Nov Dec
Petroleum Products 0.4 0.7 0.5 0.5 0.7 0.5 0.9 1.1 0.9 0.7 0.3 0.3
Natural Gas 95.9 95.4 95.2 95.4 95.1 95.3 94.8 94.5 95.2 95.3 95.8 95.4
Coal 0.7 0.9 1.3 1.2 1.3 1.3 1.3 1.4 1.2 1.2 1.0 1.2
Others 2.6 3.1 3.0 2.9 3.0 2.9 3.0 3.1 2.7 2.9 2.8 3.1
2015
Jan Feb Mar Apr May Jun Jul Aug Sep Oct Nov Dec
Petroleum Products 0.1 0.3 0.2 0.2 0.2 0.1 0.4 0.5 1.0 0.2 3.9 1.0
Natural Gas 95.7 95.3 95.5 95.7 95.5 95.8 95.6 96.2 94.4 95.6 92.0 94.8
Coal 1.0 1.1 1.3 1.3 1.4 1.4 1.3 0.7 1.4 1.4 1.3 1.3
Others 3.2 3.4 3.0 2.8 2.9 2.8 2.7 2.6 3.3 2.9 2.7 3.0
2016
Jan Feb Mar Apr May Jun Jul Aug Sep Oct Nov Dec
Petroleum Products 0.6 0.9 0.9 0.9 0.8 0.4 0.3 0.8 0.4 0.6 0.8 0.9
Natural Gas 95.0 95.1 95.5 94.6 94.9 95.3 95.5 94.8 96.3 95.2 95.1 94.4
Coal 1.3 1.1 0.8 1.5 1.5 1.5 1.5 1.5 0.7 1.4 1.3 1.6
Others 3.1 2.9 2.9 3.1 2.7 2.8 2.7 2.9 2.7 2.8 2.8 3.2
2017
Jan Feb Mar
Petroleum Products 0.8 0.7 0.6
Natural Gas 94.5 94.6 95.8
Coal 1.5 1.5 1.0
Others 3.1 3.2 2.6
2018
Notes: a. The Fuel Mix presented in this table is calculated using the Output Method. The Output Method uses the amount of electricity generated and the corresponding type of fuel used to calculate the fuel mix for the generation of electricity. It takes into account the domestic fuel-to-electricity conversion efficiency of the generating plants and the plant technology. b. From 2016, the category “Others” includes solar.
Source: Energy Market Authority (EMA)
Unit: Percent (%)
ENERGY TRANSFORMATION23
TABLE 2.3: ELECTRICITY GENERATION CAPACITY BY TECHNOLOGY TYPE
Total Registered Generation Capacity 9,766.8 9,931.3 13,394.6 13,445.1 13,611.9 13,614.4
CCGT/Co-Gen/Tri-Gen 4,534.0 6,153.5 10,355.5 10,355.5 10,508.2 10,508.2
Steam Turbine 4,640.0 3,148.0 2,556.5 2,556.1 2,554.6 2,554.6
Open Cycle Gas Turbine 287.0 370.0 180.0 180.0 180.0 180.0
Waste-To-Energy 305.8 256.8 256.8 256.8 256.8 256.8
Of Which: Main Power Producers 9,766.8 9,906.8 12,930.7 12,930.7 12,930.7 12,930.7
CCGT/Co-Gen/Tri-Gen 4,534.0 6,132.0 9,952.9 9,952.9 9,952.9 9,952.9
Steam Turbine 4,640.0 3,148.0 2,541.0 2,541.0 2,541.0 2,541.0
Open Cycle Gas Turbine 287.0 370.0 180.0 180.0 180.0 180.0
Waste-To-Energy 305.8 256.8 256.8 256.8 256.8 256.8
Of Which: Autoproducers - 24.5 463.9 514.4 681.2 683.7
CCGT/Co-Gen/Tri-Gen - 21.5 402.6 402.6 555.3 555.3
Steam Turbine - - 15.5 15.1 13.6 13.6
Open Cycle Gas Turbine - - - - - -
Solar PV - 2.9 45.8 96.7 112.3 114.8
1 Data for 2018 is as at end-March 2018.
Notes: a. CCGT/Co-Gen/Tri-Gen refer to Combined Cycle Gas Turbines, Co-Generation Plants and/or Tri-Generation Plants.b. Electricity Generation Capacity includes solar PV capacity (in MWac).
Source: Energy Market Company (EMC)
2005 2010 2015 2016 2017 20181
Unit: MW

SINGAPORE ENERGY STATISTICS 2018 24
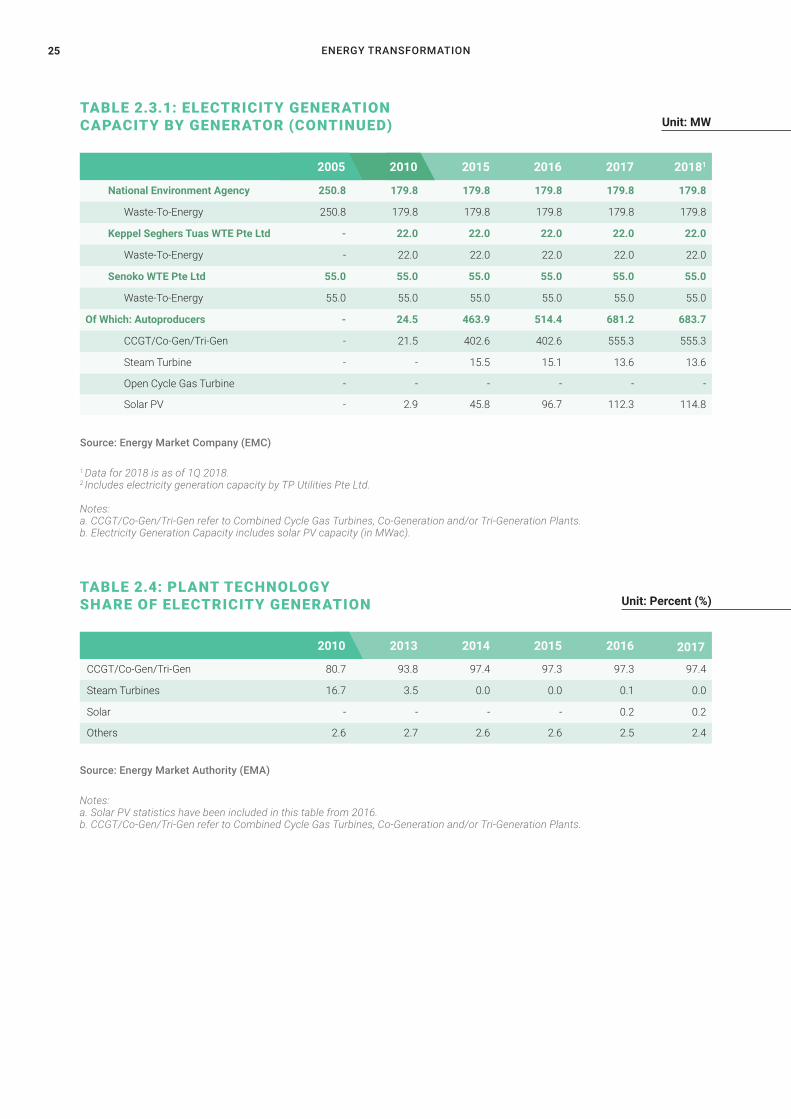
TABLE 2.3.1: ELECTRICITY GENERATION CAPACITY BY GENERATOR
Total Registered Generation Capacity 9,766.8 9,931.3 13,394.6 13,445.1 13,611.9 13,614.4
Of Which: Main Power Producers
Senoko Energy Pte Ltd 3,300.0 2,635.0 3,300.0 3,300.0 3,300.0 3,300.0
CCGT/Co-Gen/Tri-Gen 1,945.0 1,945.0 2,807.0 2,807.0 2,807.0 2,807.0
Steam Turbine 1,250.0 500.0 493.0 493.0 493.0 493.0
Open Cycle Gas Turbine 105.0 190.0 - - - -
YTL PowerSeraya Pte Ltd 2,736.0 3,100.0 3,100.0 3,100.0 3,100.0 3,100.0
CCGT/Co-Gen/Tri-Gen 364.0 1,472.0 1,472.0 1,472.0 1,472.0 1,472.0
Steam Turbine 2,190.0 1,448.0 1,448.0 1,448.0 1,448.0 1,448.0
Open Cycle Gas Turbine 182.0 180.0 180.0 180.0 180.0 180.0
Tuas Power Generation² Pte Ltd 2,640.0 2,640.0 2,579.4 2,579.4 2,579.4 2,579.4
CCGT/Co-Gen/Tri-Gen 1,440.0 1,440.0 1,979.4 1,979.4 1,979.4 1,979.4
Steam Turbine 1,200.0 1,200.0 600.0 600.0 600.0 600.0
Open Cycle Gas Turbine - - - - - -
SembCorp Cogen Pte Ltd 785.0 785.0 1,188.8 1,188.8 1,188.8 1,188.8
CCGT/Co-Gen/Tri-Gen 785.0 785.0 1,188.8 1,188.8 1,188.8 1,188.8
Steam Turbine - - - - - -
Open Cycle Gas Turbine - - - - - -
Keppel Merlimau Cogen Pte Ltd - 490.0 1,310.0 1,310.0 1,310.0 1,310.0
CCGT/Co-Gen/Tri-Gen - 490.0 1,310.0 1,310.0 1,310.0 1,310.0
Steam Turbine - - - - - -
Open Cycle Gas Turbine - - - - - -
PacificLight Power Pte Ltd - - 800.0 800.0 800.0 800.0
CCGT/Co-Gen/Tri-Gen - - 800.0 800.0 800.0 800.0
Steam Turbine - - - - - -
Open Cycle Gas Turbine - - - - - -
Tuaspring Pte Ltd - - 395.7 395.7 395.7 395.7
CCGT/Co-Gen/Tri-Gen - - 395.7 395.7 395.7 395.7
Steam Turbine - - - - - -
Open Cycle Gas Turbine - - - - - -
2005 2010
Unit: MW
2015 2016 2017 20181
ENERGY TRANSFORMATION25
National Environment Agency 250.8 179.8 179.8 179.8 179.8 179.8
Waste-To-Energy 250.8 179.8 179.8 179.8 179.8 179.8
Keppel Seghers Tuas WTE Pte Ltd - 22.0 22.0 22.0 22.0 22.0
Waste-To-Energy - 22.0 22.0 22.0 22.0 22.0
Senoko WTE Pte Ltd 55.0 55.0 55.0 55.0 55.0 55.0
Waste-To-Energy 55.0 55.0 55.0 55.0 55.0 55.0
Of Which: Autoproducers - 24.5 463.9 514.4 681.2 683.7
CCGT/Co-Gen/Tri-Gen - 21.5 402.6 402.6 555.3 555.3
Steam Turbine - - 15.5 15.1 13.6 13.6
Open Cycle Gas Turbine - - - - - -
Solar PV - 2.9 45.8 96.7 112.3 114.8
TABLE 2.3.1: ELECTRICITY GENERATION CAPACITY BY GENERATOR (CONTINUED)
TABLE 2.4: PLANT TECHNOLOGYSHARE OF ELECTRICITY GENERATION
Unit: MW
Unit: Percent (%)
2005 2010 2015 2016 2017 20181
1 Data for 2018 is as of 1Q 2018. 2 Includes electricity generation capacity by TP Utilities Pte Ltd.
Notes: a. CCGT/Co-Gen/Tri-Gen refer to Combined Cycle Gas Turbines, Co-Generation and/or Tri-Generation Plants.b. Electricity Generation Capacity includes solar PV capacity (in MWac).
Notes: a. Solar PV statistics have been included in this table from 2016.b. CCGT/Co-Gen/Tri-Gen refer to Combined Cycle Gas Turbines, Co-Generation and/or Tri-Generation Plants.
Source: Energy Market Company (EMC)
Source: Energy Market Authority (EMA)
CCGT/Co-Gen/Tri-Gen 80.7 93.8 97.4 97.3 97.3 97.4
Steam Turbines 16.7 3.5 0.0 0.0 0.1 0.0
Solar - - - - 0.2 0.2
Others 2.6 2.7 2.6 2.6 2.5 2.4
2010 2013 2014 2015 2016 2017
SINGAPORE ENERGY STATISTICS 2018 26
TABLE 2.5: MARKET SHARE OF ELECTRICITY GENERATION
TABLE 2.6: ENERGY FLOWSIN THE OIL REFINING SECTOR
Tuas Power Generation¹ Pte Ltd 23.2 24.6 21.3 21.0 21.0 21.4
Senoko Energy Pte Ltd 31.7 25.0 22.4 20.1 19.2 17.4
YTL PowerSeraya Pte Ltd 28.1 26.7 18.0 17.9 17.7 16.9
Keppel Merlimau Cogen Pte Ltd - 8.1 11.8 11.2 10.4 11.8
SembCorp Cogen Pte Ltd 12.1 9.4 9.6 11.6 10.4 9.6
PacificLight Power Pte Ltd - - 8.3 8.7 8.8 9.0
Tuaspring Pte Ltd - - - - 3.6 3.9
Others2 4.8 6.2 8.6 9.5 9.0 10.0
Refinery Inputs1 56,326.6 56,674.7 52,128.4 49,153.0 51,479.8 53,304.7
Crude Oil & Natural Gas Liquids 49,467.3 48,888.2 44,730.0 41,653.3 44,801.4 46,654.9
Other Feedstocks3 6,859.3 7,786.6 7,398.4 7,499.8 6,678.5 6,649.8
Refinery Outputs2 53,713.1 54,542.1 50,993.2 47,432.9 49,349.8 51,452.8
Light Distillates 12,907.9 13,952.3 12,915.1 14,071.7 13,161.1 14,183.0
Middle Distillates 24,877.4 25,854.8 23,582.3 21,369.9 22,098.7 22,088.6
Heavy Distillates & Residuum 15,927.8 14,735.0 14,495.8 11,991.3 14,090.1 15,181.2
2005
2011
2010
2012
1 Includes electricity generation by TP Utilities Pte Ltd. 2 Includes electricity generation by Wholesale Licensees, Waste-To-Energy Plants and Solar PV units.
1 Refinery inputs refer to the total amount of energy products that enter the refining process in the refinery sector. 2 Refinery outputs refer to the total amount of energy products that exit from the refining process in the refinery sector. 3 Other Feedstocks include Additives/Oxygenates, Refinery Feedstocks, Orimulsion, Shale Oil, Other Hydrocarbons, Natural Gas and Hydrogen.
Source: Energy Market Authority (EMA)
Source: Energy Market Authority (EMA)
Unit: Percent (%)
Unit: Percent (%)
2014
2013
2015
2014
2016
2015
2017
2016
ENERGY CONSUMPTION27
03ENE RGYC ONSUMPTION

SINGAPORE ENERGY STATISTICS 2018 28
ENERGY CONSUMPTION29
0%
20%
40%
60%
80%
100%
20172016201520102005
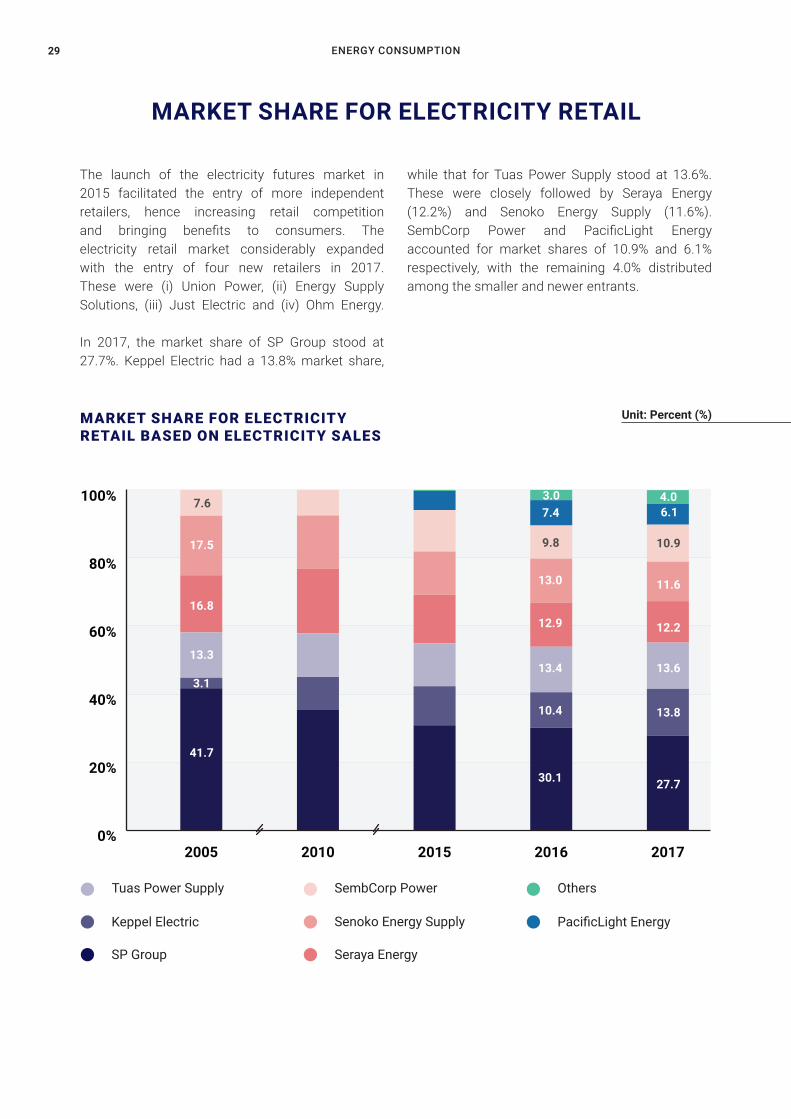
MARKET SHARE FOR ELECTRICITY RETAIL
Unit: Percent (%)MARKET SHARE FOR ELECTRICITY RETAIL BASED ON ELECTRICITY SALES
The launch of the electricity futures market in 2015 facilitated the entry of more independent retailers, hence increasing retail competition and bringing benefits to consumers. The electricity retail market considerably expanded with the entry of four new retailers in 2017. These were (i) Union Power, (ii) Energy Supply Solutions, (iii) Just Electric and (iv) Ohm Energy.
In 2017, the market share of SP Group stood at 27.7%. Keppel Electric had a 13.8% market share,
while that for Tuas Power Supply stood at 13.6%. These were closely followed by Seraya Energy (12.2%) and Senoko Energy Supply (11.6%). SembCorp Power and PacificLight Energy accounted for market shares of 10.9% and 6.1% respectively, with the remaining 4.0% distributed among the smaller and newer entrants.
3.0 4.06.17.4
27.730.1
41.7
13.810.4
13.3
3.113.613.4
16.8
12.212.9
17.5
11.613.0
10.99.8
7.6
SembCorp Power Others
SP Group Seraya Energy
Keppel Electric
Tuas Power Supply
Senoko Energy Supply PacificLight Energy
SINGAPORE ENERGY STATISTICS 2018 30
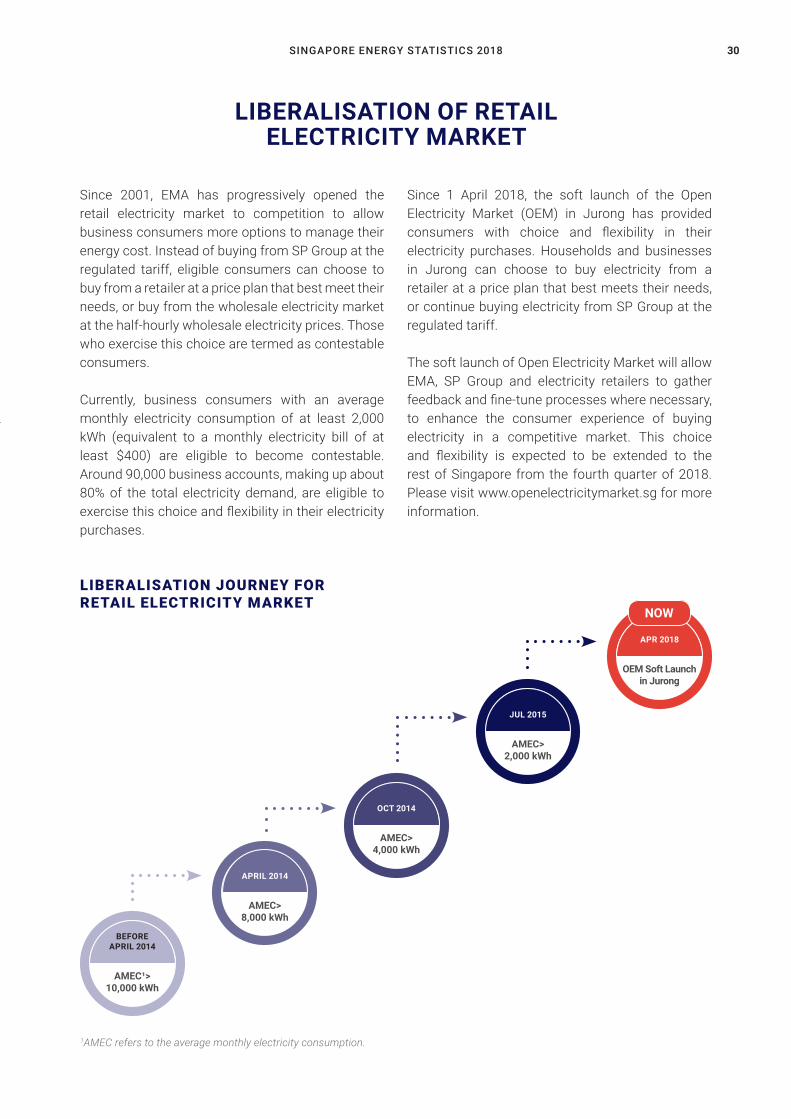
Since 2001, EMA has progressively opened the retail electricity market to competition to allow business consumers more options to manage their energy cost. Instead of buying from SP Group at the regulated tariff, eligible consumers can choose to buy from a retailer at a price plan that best meet their needs, or buy from the wholesale electricity market at the half-hourly wholesale electricity prices. Those who exercise this choice are termed as contestable consumers.
Currently, business consumers with an average monthly electricity consumption of at least 2,000 kWh (equivalent to a monthly electricity bill of at least $400) are eligible to become contestable. Around 90,000 business accounts, making up about 80% of the total electricity demand, are eligible to exercise this choice and flexibility in their electricity purchases.
LIBERALISATION OF RETAIL ELECTRICITY MARKET
Since 1 April 2018, the soft launch of the Open Electricity Market (OEM) in Jurong has provided consumers with choice and flexibility in their electricity purchases. Households and businesses in Jurong can choose to buy electricity from a retailer at a price plan that best meets their needs, or continue buying electricity from SP Group at the regulated tariff.
The soft launch of Open Electricity Market will allow EMA, SP Group and electricity retailers to gather feedback and fine-tune processes where necessary, to enhance the consumer experience of buying electricity in a competitive market. This choice and flexibility is expected to be extended to the rest of Singapore from the fourth quarter of 2018. Please visit www.openelectricitymarket.sg for more information.
LIBERALISATION JOURNEY FOR RETAIL ELECTRICITY MARKET
1AMEC refers to the average monthly electricity consumption.
BEFORE APRIL 2014
AMEC¹>10,000 kWh
APRIL 2014
AMEC>8,000 kWh
JUL 2015
AMEC>2,000 kWh
OCT 2014
AMEC>4,000 kWh
APR 2018
OEM Soft Launch in Jurong
NOW

ENERGY CONSUMPTION31
SINGAPORE ENERGY STATISTICS 2018 32
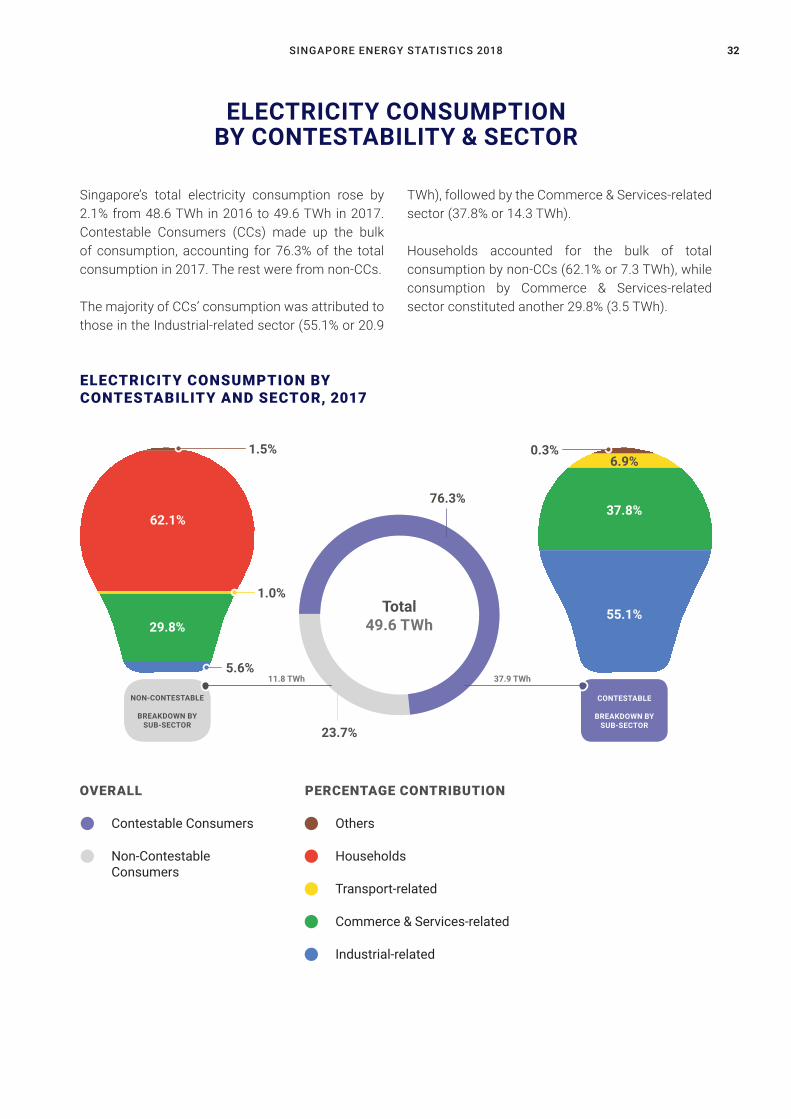
OVERALL
Singapore’s total electricity consumption rose by 2.1% from 48.6 TWh in 2016 to 49.6 TWh in 2017. Contestable Consumers (CCs) made up the bulk of consumption, accounting for 76.3% of the total consumption in 2017. The rest were from non-CCs.
The majority of CCs’ consumption was attributed to those in the Industrial-related sector (55.1% or 20.9
ELECTRICITY CONSUMPTION BY CONTESTABILITY & SECTOR
TWh), followed by the Commerce & Services-related sector (37.8% or 14.3 TWh).
Households accounted for the bulk of total consumption by non-CCs (62.1% or 7.3 TWh), while consumption by Commerce & Services-related sector constituted another 29.8% (3.5 TWh).
ELECTRICITY CONSUMPTION BY CONTESTABILITY AND SECTOR, 2017
Contestable Consumers
PERCENTAGE CONTRIBUTION
Others
Non-ContestableConsumers
Households
Commerce & Services-related
Transport-related
Industrial-related
Total49.6 TWh
37.9 TWh11.8 TWh
23.7%
76.3%
55.1%29.8%
62.1%37.8%
6.9%0.3%
CONTESTABLE
BREAKDOWN BY SUB-SECTOR
NON-CONTESTABLE
BREAKDOWN BY SUB-SECTOR
1.5%
1.0%
5.6%
ENERGY CONSUMPTION33
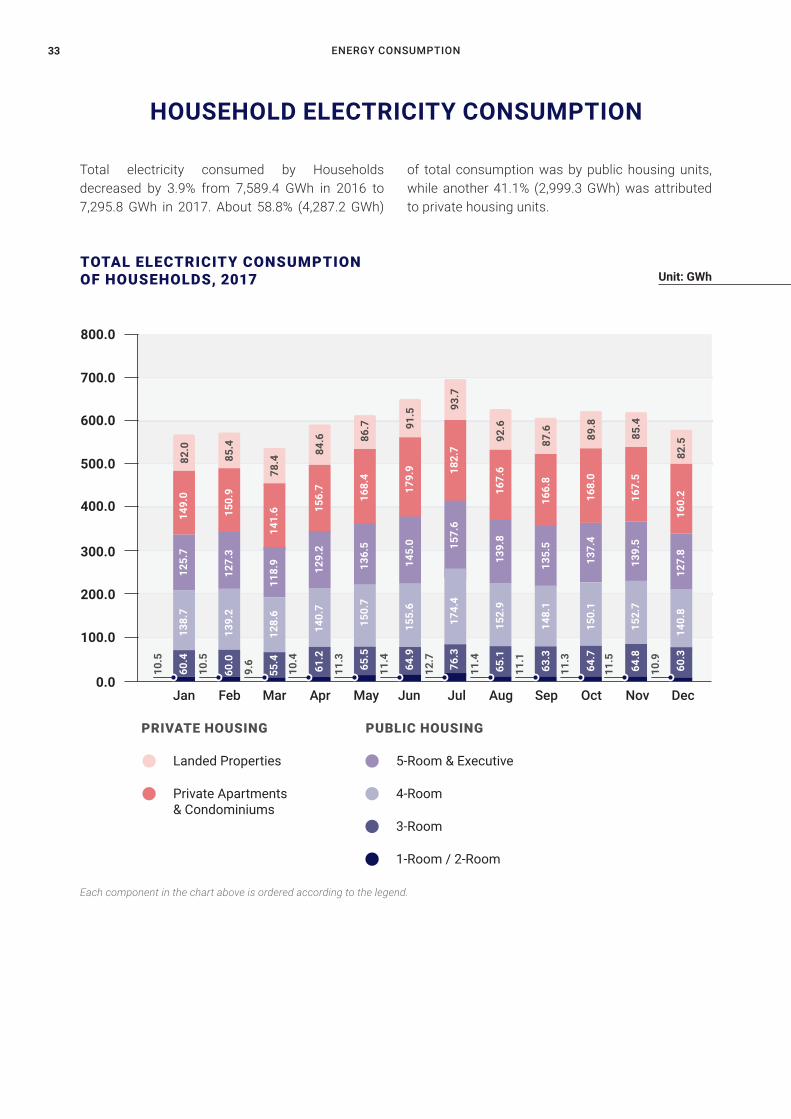
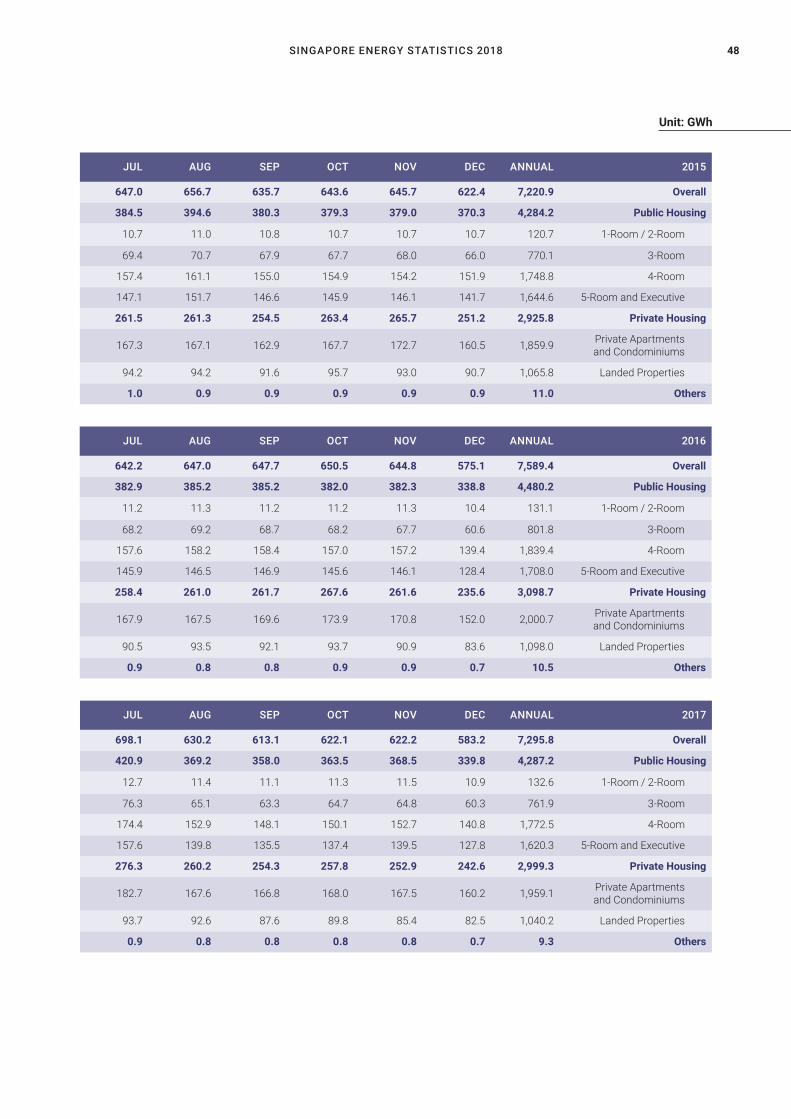
Total electricity consumed by Households decreased by 3.9% from 7,589.4 GWh in 2016 to 7,295.8 GWh in 2017. About 58.8% (4,287.2 GWh)
HOUSEHOLD ELECTRICITY CONSUMPTION
of total consumption was by public housing units, while another 41.1% (2,999.3 GWh) was attributed to private housing units.
Unit: GWhTOTAL ELECTRICITY CONSUMPTION OF HOUSEHOLDS, 2017
PRIVATE HOUSING
Landed Properties
PUBLIC HOUSING
5-Room & Executive
3-Room
Private Apartments & Condominiums
4-Room
1-Room / 2-Room
Jan AprFeb MayMar Jun Jul OctAug NovSep Dec
800.0
500.0
700.0
400.0
600.0
300.0
200.0
100.0
0.0
138.
760
.4
60.0
55.4
128.
6
139.
2
140.
761
.2
150.
765
.5
155.
664
.9
174.
476
.3
152.
965
.1
148.
163
.3
150.
164
.7
152.
764
.8
140.
860
.3
125.
7
118.
9
127.
3
129.
2
136.
5
145.
0 157.
6
139.
8
135.
5
137.
4
139.
5
127.
8
149.
0
141.
6150.
9
156.
7
168.
4
179.
9 182.
7
167.
6
166.
8
168.
0
167.
5
160.
2
82.0
78.485
.4 84.6 86
.7 91.5 93
.7
92.6
87.6 89
.8
85.4
82.5
10.5
9.6
10.4
11.4
12.7
11.4
11.3
11.5
10.9
11.1
11.3
10.5
Each component in the chart above is ordered according to the legend.
SINGAPORE ENERGY STATISTICS 2018 34
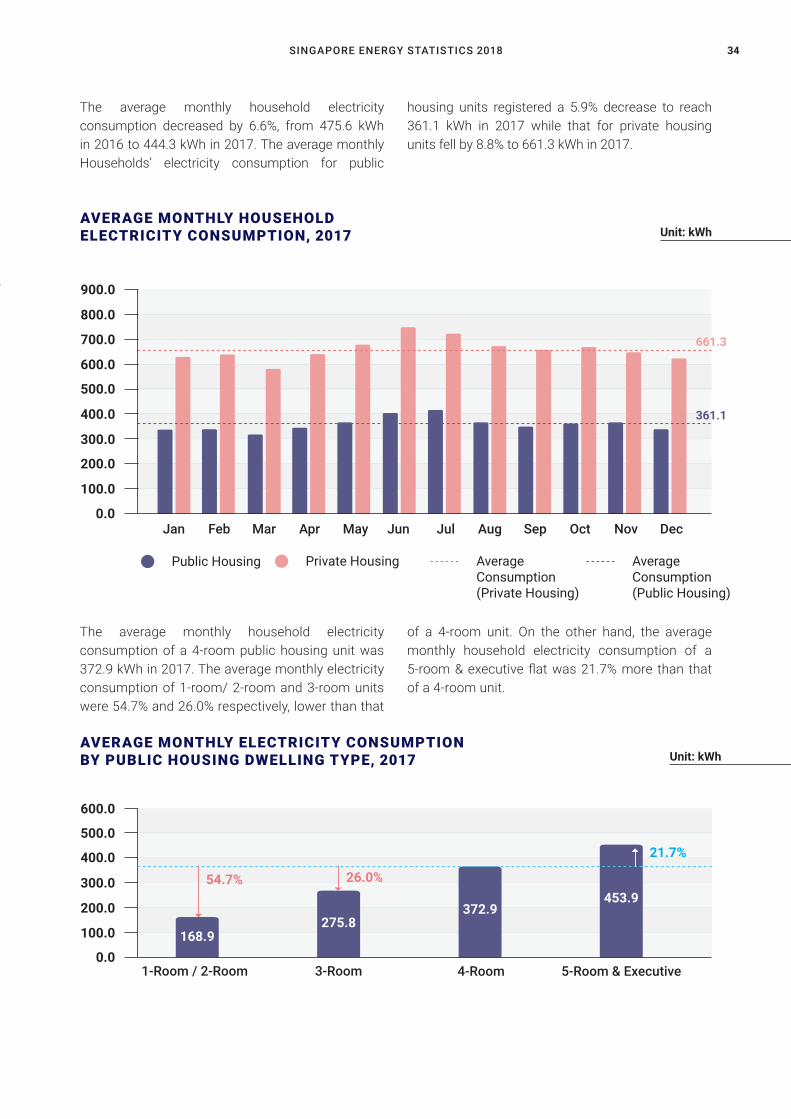
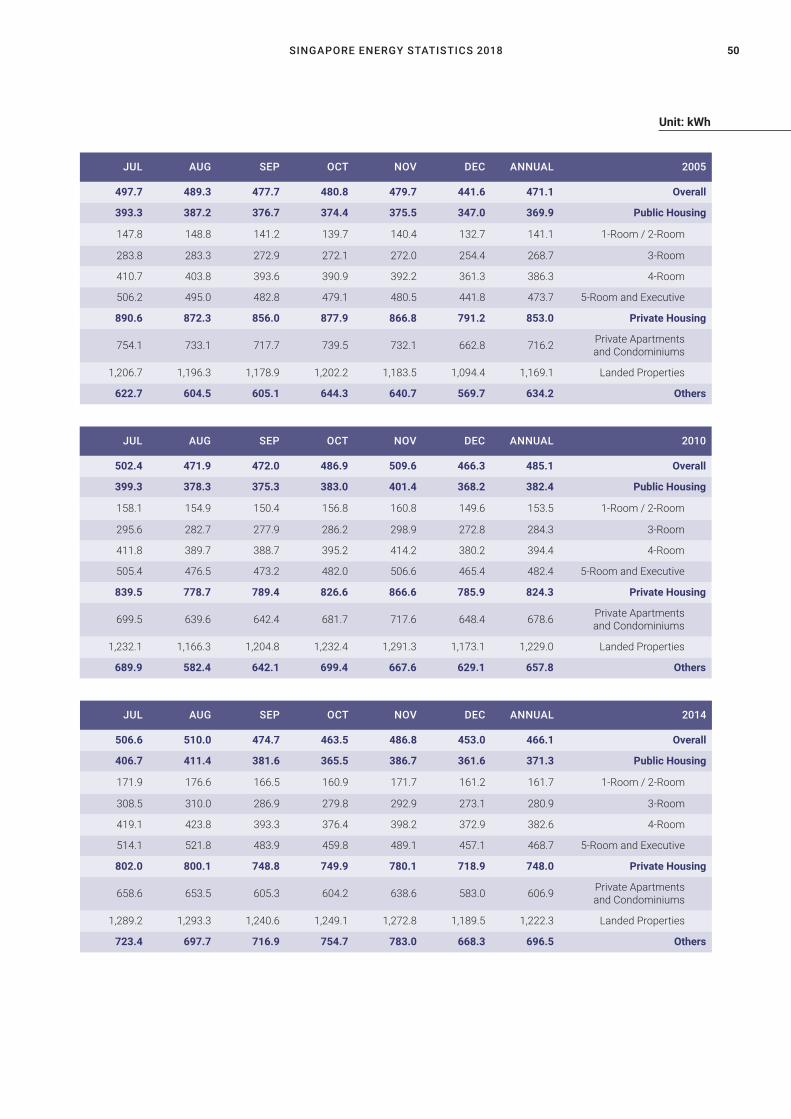
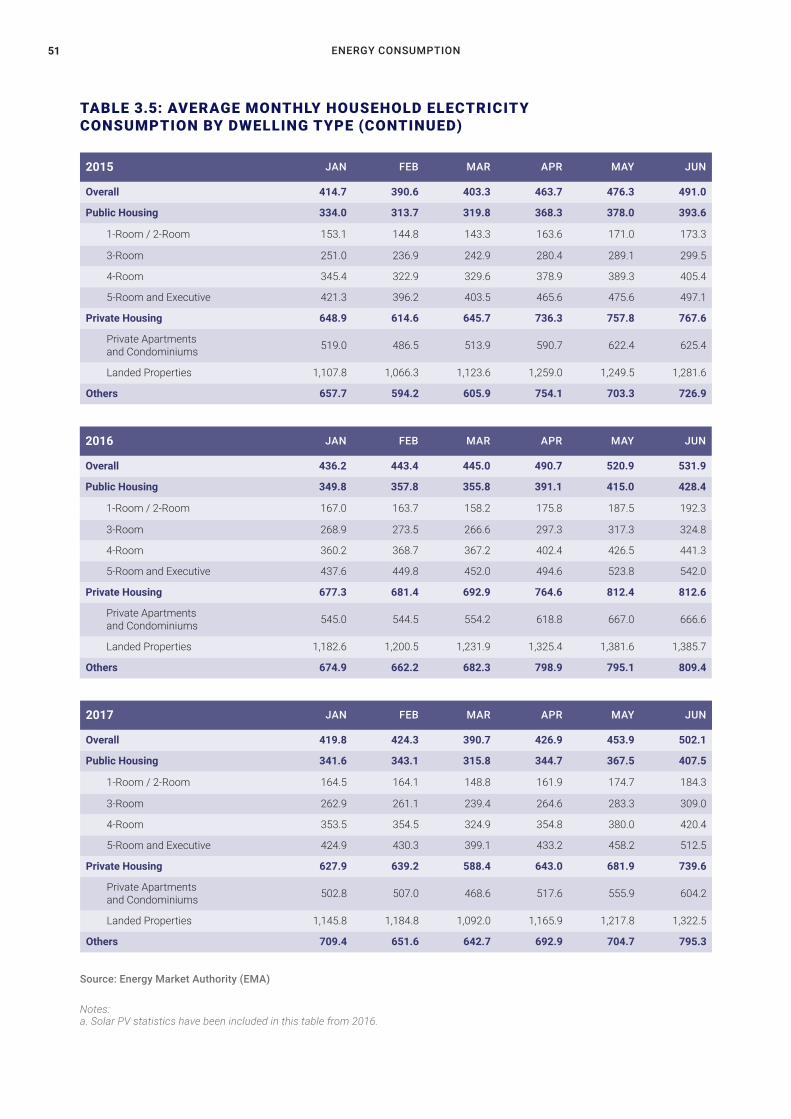
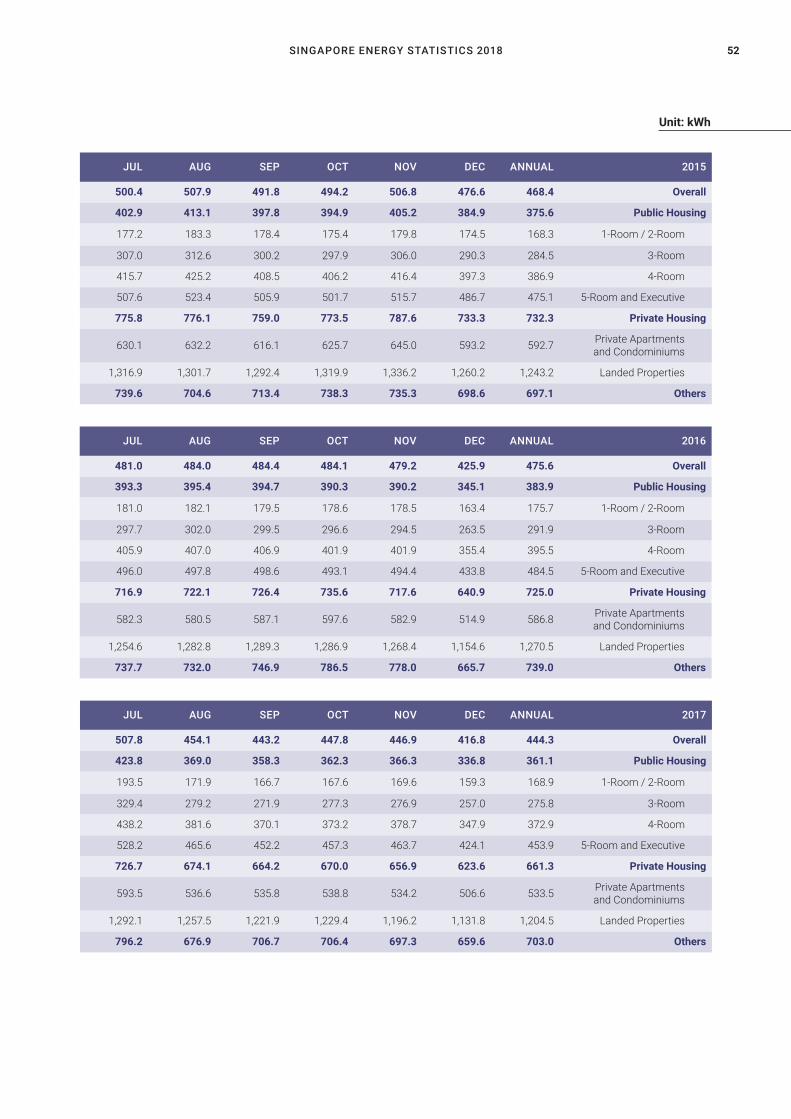
The average monthly household electricity consumption decreased by 6.6%, from 475.6 kWh in 2016 to 444.3 kWh in 2017. The average monthly Households’ electricity consumption for public
The average monthly household electricity consumption of a 4-room public housing unit was 372.9 kWh in 2017. The average monthly electricity consumption of 1-room/ 2-room and 3-room units were 54.7% and 26.0% respectively, lower than that
Unit: kWh
Unit: kWh
AVERAGE MONTHLY HOUSEHOLDELECTRICITY CONSUMPTION, 2017
AVERAGE MONTHLY ELECTRICITY CONSUMPTION BY PUBLIC HOUSING DWELLING TYPE, 2017
housing units registered a 5.9% decrease to reach 361.1 kWh in 2017 while that for private housing units fell by 8.8% to 661.3 kWh in 2017.
of a 4-room unit. On the other hand, the average monthly household electricity consumption of a 5-room & executive flat was 21.7% more than that of a 4-room unit.
Jan AprFeb MayMar Jun Jul OctAug NovSep Dec
900.0
800.0
700.0
600.0
500.0
400.0
300.0
200.0
100.0
0.0
661.3
361.1
Public Housing Private Housing AverageConsumption (Private Housing)
AverageConsumption (Public Housing)
5-Room & Executive4-Room3-Room1-Room / 2-Room
600.0
500.0
400.0
300.0
200.0
100.0
0.0168.9
275.8372.9
453.9
21.7%
26.0%54.7%
ENERGY CONSUMPTION35
0.1%
1Final end-users or consumers exclude those involved in power generation (as Main Power Producers or Autoproducers) and oil refining.
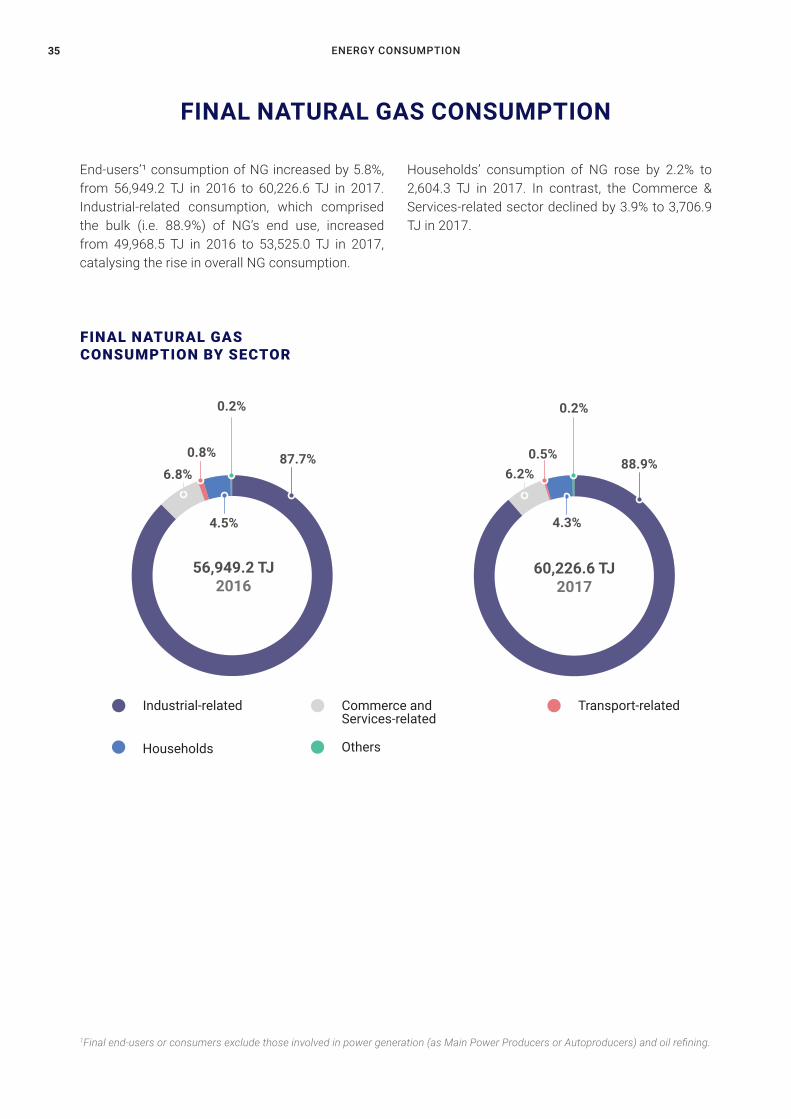
End-users’¹ consumption of NG increased by 5.8%, from 56,949.2 TJ in 2016 to 60,226.6 TJ in 2017. Industrial-related consumption, which comprised the bulk (i.e. 88.9%) of NG’s end use, increased from 49,968.5 TJ in 2016 to 53,525.0 TJ in 2017, catalysing the rise in overall NG consumption.
FINAL NATURAL GAS CONSUMPTION
Households’ consumption of NG rose by 2.2% to 2,604.3 TJ in 2017. In contrast, the Commerce & Services-related sector declined by 3.9% to 3,706.9 TJ in 2017.
FINAL NATURAL GASCONSUMPTION BY SECTOR
Commerce and Services-related
Transport-related
Households Others
56,949.2 TJ2016
60,226.6 TJ2017
0.2%
87.7%0.8%6.8%
4.5%
88.9%0.5%
0.2%
6.2%
4.3%
Industrial-related
SINGAPORE ENERGY STATISTICS 2018 36
31.5%17.2%
6.5%
51.862.6
75.6 80.5
5-Room & Executive4-Room3-Room1-Room / 2-Room
90.0
50.0
70.0
30.0
10.0
80.0
40.0
60.0
20.0
0.0
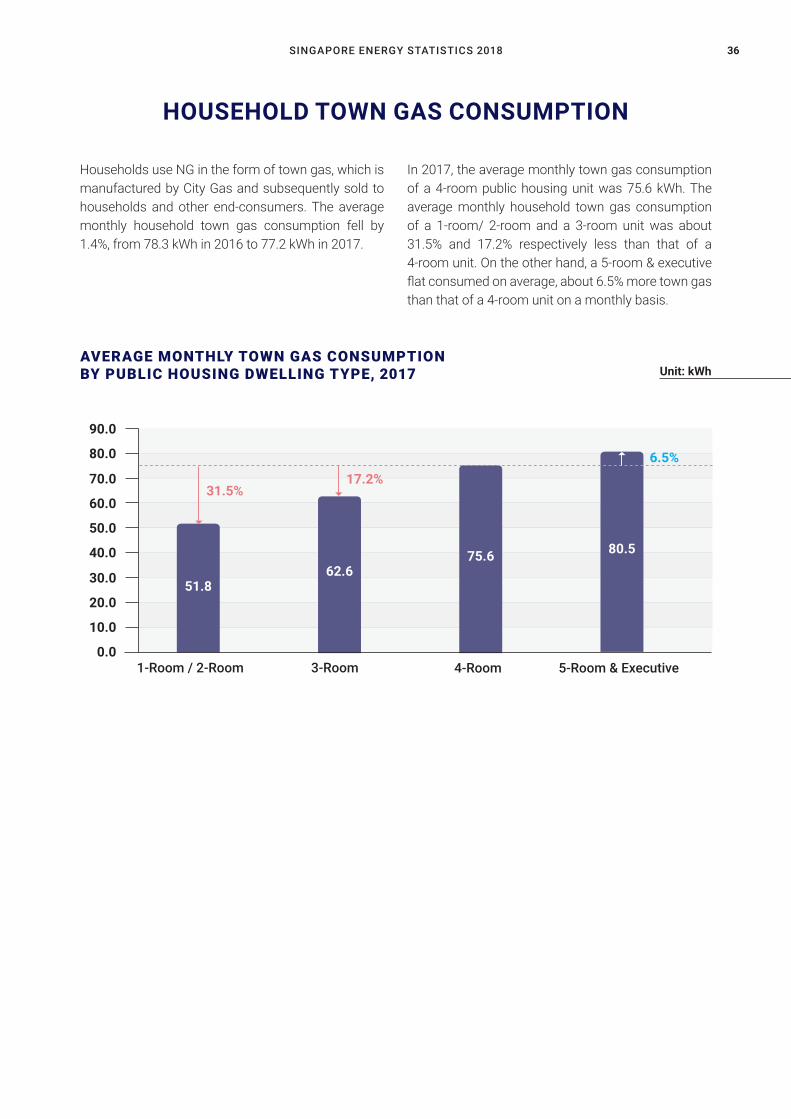
Households use NG in the form of town gas, which is manufactured by City Gas and subsequently sold to households and other end-consumers. The average monthly household town gas consumption fell by 1.4%, from 78.3 kWh in 2016 to 77.2 kWh in 2017.
HOUSEHOLD TOWN GAS CONSUMPTION
Unit: kWhAVERAGE MONTHLY TOWN GAS CONSUMPTION BY PUBLIC HOUSING DWELLING TYPE, 2017
In 2017, the average monthly town gas consumption of a 4-room public housing unit was 75.6 kWh. The average monthly household town gas consumption of a 1-room/ 2-room and a 3-room unit was about 31.5% and 17.2% respectively less than that of a 4-room unit. On the other hand, a 5-room & executive flat consumed on average, about 6.5% more town gas than that of a 4-room unit on a monthly basis.
ENERGY CONSUMPTION37
1Final end-users or consumers exclude those involved in power generation (as Main Power Producers or Autoproducers) and oil refining.
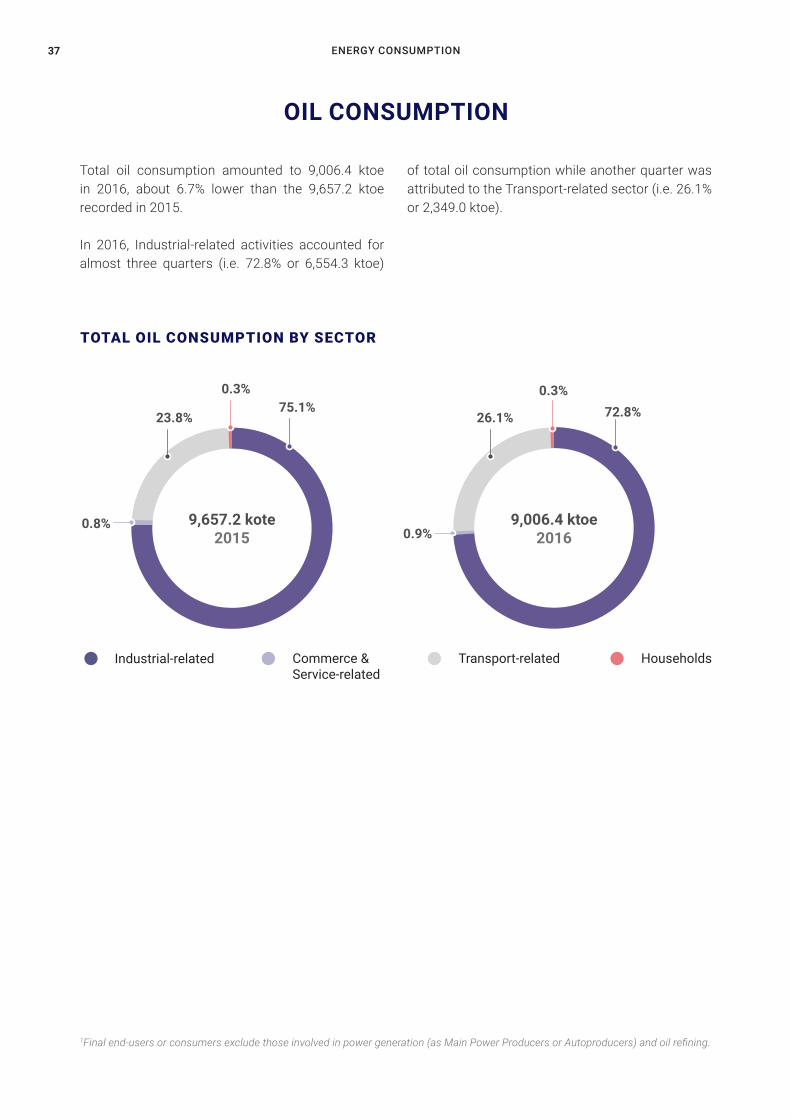
Total oil consumption amounted to 9,006.4 ktoe in 2016, about 6.7% lower than the 9,657.2 ktoe recorded in 2015.
In 2016, Industrial-related activities accounted for almost three quarters (i.e. 72.8% or 6,554.3 ktoe)
OIL CONSUMPTION
of total oil consumption while another quarter was attributed to the Transport-related sector (i.e. 26.1% or 2,349.0 ktoe).
TOTAL OIL CONSUMPTION BY SECTOR
9,657.2 kote2015
9,006.4 ktoe2016
23.8% 26.1%
Industrial-related HouseholdsCommerce & Service-related
Transport-related
0.8%0.9%
0.3% 0.3%75.1% 72.8%
SINGAPORE ENERGY STATISTICS 2018 38
0
2,000
4,000
6,000
8,000
10,000
HouseholdsTransport-related
Commerce and Services-related
Industrial-related
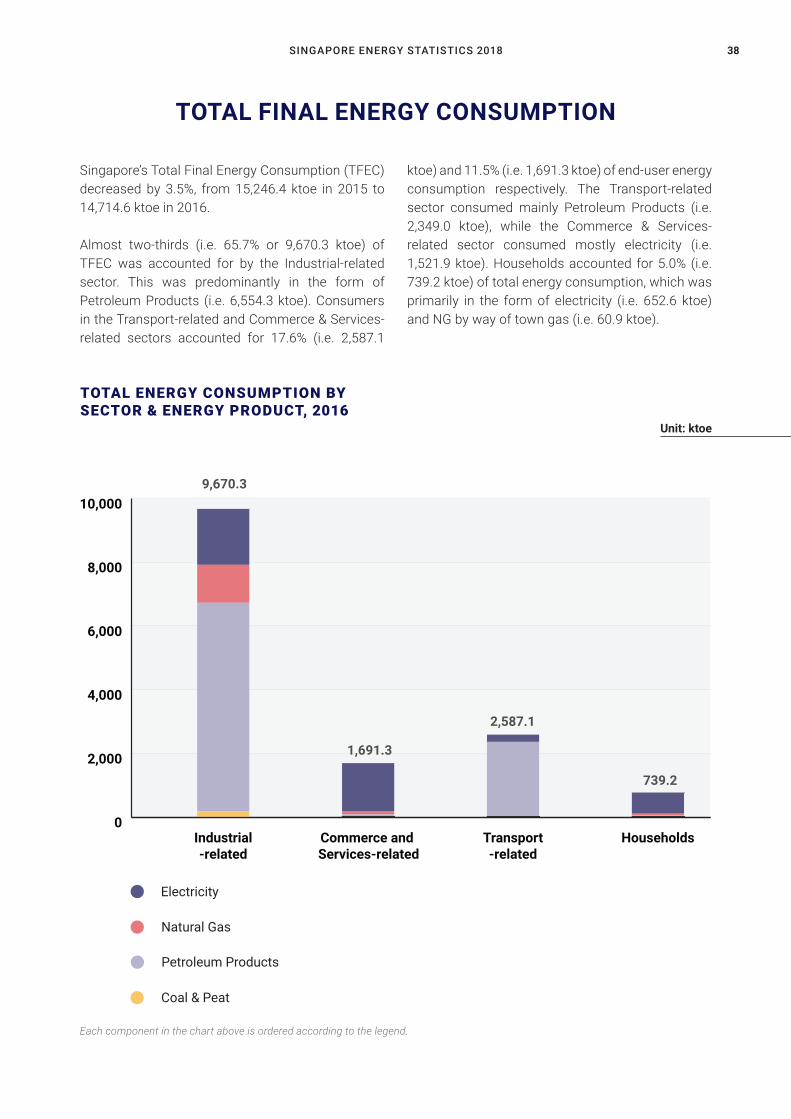
Singapore’s Total Final Energy Consumption (TFEC) decreased by 3.5%, from 15,246.4 ktoe in 2015 to 14,714.6 ktoe in 2016.
Almost two-thirds (i.e. 65.7% or 9,670.3 ktoe) of TFEC was accounted for by the Industrial-related sector. This was predominantly in the form of Petroleum Products (i.e. 6,554.3 ktoe). Consumers in the Transport-related and Commerce & Services-related sectors accounted for 17.6% (i.e. 2,587.1
TOTAL FINAL ENERGY CONSUMPTION
Unit: ktoe
TOTAL ENERGY CONSUMPTION BY SECTOR & ENERGY PRODUCT, 2016
ktoe) and 11.5% (i.e. 1,691.3 ktoe) of end-user energy consumption respectively. The Transport-related sector consumed mainly Petroleum Products (i.e. 2,349.0 ktoe), while the Commerce & Services-related sector consumed mostly electricity (i.e. 1,521.9 ktoe). Households accounted for 5.0% (i.e. 739.2 ktoe) of total energy consumption, which was primarily in the form of electricity (i.e. 652.6 ktoe) and NG by way of town gas (i.e. 60.9 ktoe).
9,670.3
1,691.3
2,587.1
739.2
Each component in the chart above is ordered according to the legend.
Petroleum Products
Coal & Peat
Natural Gas
Electricity

ENERGY CONSUMPTION39
TABLE 3.1: MARKET SHARE OF ELECTRICITY RETAIL BASED ON ELECTRICITY SALES
SP Group 41.7 35.5 33.0 30.8 30.1 27.7
Keppel Electric Pte Ltd 3.1 9.5 13.4 11.5 10.4 13.8
Tuas Power Supply Pte Ltd 13.3 12.8 12.7 12.6 13.4 13.6
Seraya Energy Pte Ltd 16.8 19.1 14.2 14.3 12.9 12.2
Senoko Energy Supply Pte Ltd 17.5 15.6 14.6 12.7 13.0 11.6
SembCorp Power Pte Ltd 7.6 7.5 8.3 12.2 9.8 10.9
PacificLight Energy Pte Ltd - - 3.8 5.6 7.4 6.1
Red Dot Power Pte Ltd - - - 0.0 0.8 1.4
I Switch Pte Ltd - - - - 0.3 0.8
Hyflux Energy Pte Ltd - - - 0.3 1.6 0.7
Sunseap Energy Pte Ltd - - - - 0.2 0.4
Best Electricity Supply Pte Ltd - - - - 0.1 0.4
Charis Electric Pte Ltd - - - - 0.0 0.2
Union Power Pte Ltd - - - - - 0.1
Sun Electric Power Pte Ltd - - - - 0.0 0.0
Environmental Solutions (Asia) Pte Ltd - - - - 0.0 0.0
Energy Supply Solutions Pte Ltd - - - - - 0.0
Just Electric Pte Ltd - - - - - 0.0
Ohm Energy Pte Ltd - - - - - 0.0
2005 2010
Source: Energy Market Authority (EMA)
Unit: Percent (%)
2014 2015 2016 2017

SINGAPORE ENERGY STATISTICS 2018 40
TABLE 3.2: ELECTRICITY CONSUMPTION BY SUB-SECTOR (TOTAL)
Overall 35,489.3 42,251.7 46,403.0 47,513.9 48,626.6 49,643.7
Industrial-related 14,509.0 17,662.6 19,753.2 20,088.0 20,418.4 21,516.3
Manufacturing 13,836.1 16,448.0 17,989.0 18,277.6 18,370.9 19,581.7
Construction 234.8 337.8 527.1 531.0 551.6 484.3
Utilities 411.0 843.4 1,198.0 1,237.2 1,450.1 1,402.6
Other Industrial-related 27.2 33.3 39.2 42.2 45.8 47.7
Commerce and Services-related 13,075.6 15,469.7 17,046.6 17,481.0 17,699.3 17,804.3
Wholesale and Retail Trade 2,109.8 1,923.0 2,020.5 2,107.4 2,073.4 1,994.5
Accommodation and Food Services 1,031.3 1,219.6 1,332.3 1,350.2 1,453.2 1,444.9
Information and Communications 667.2 925.5 1,294.5 1,426.7 1,848.0 1,873.5
Financial and Insurance Activities 1,291.9 1,927.0 2,574.1 2,718.1 2,361.7 2,342.8
Real Estate Activities 3,712.4 4,346.2 4,485.7 4,454.6 4,497.0 4,700.9
Professional, Scientific & Technical, Administration & Support Activities 650.2 885.8 681.0 713.7 683.4 703.8
Other Commerce and Services-related 3,612.7 4,242.7 4,658.5 4,710.3 4,782.6 4,743.9
Transport-related 1,200.0 2,098.7 2,441.0 2,444.8 2,639.4 2,750.8
Households 6,092.5 6,636.0 6,924.4 7,220.9 7,589.4 7,295.8
Others 612.1 384.8 237.7 279.1 280.1 276.5
2005 2010
Notes: a. Solar PV statistics have been included in this table from 2016.
Source: Energy Market Authority (EMA)
Unit: GWh
2014 2015 2016 2017
ENERGY CONSUMPTION41
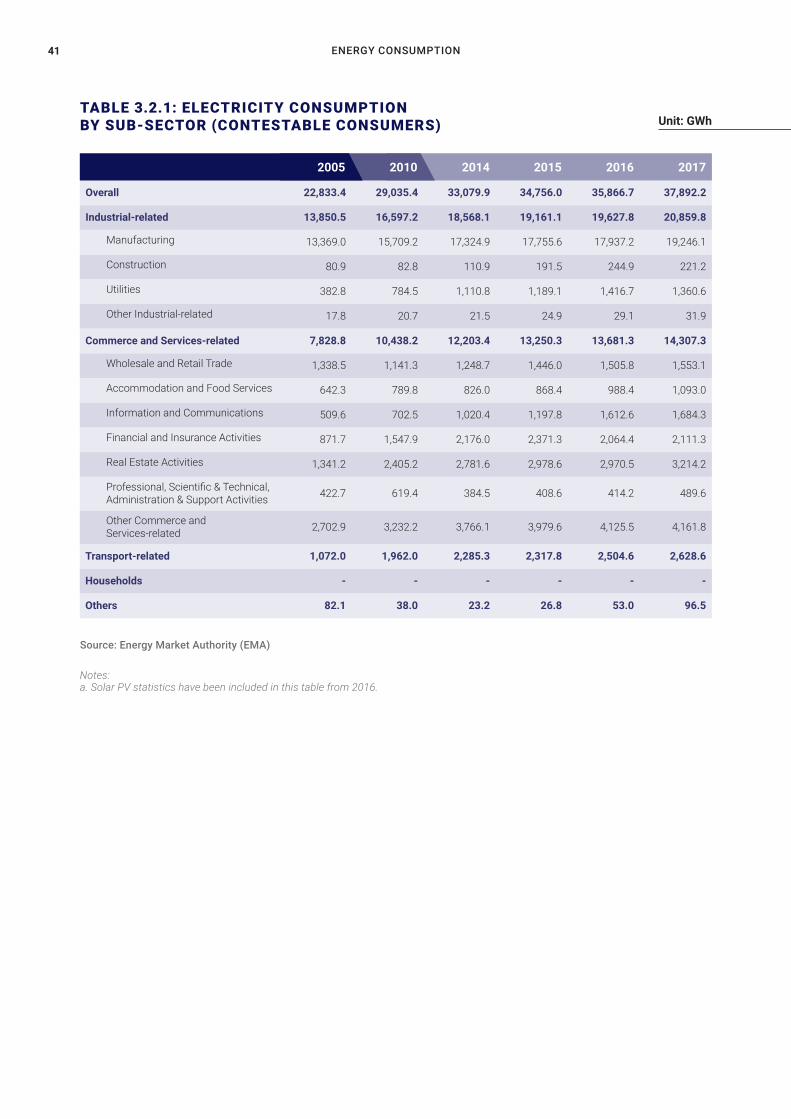
TABLE 3.2.1: ELECTRICITY CONSUMPTION BY SUB-SECTOR (CONTESTABLE CONSUMERS)
Overall 22,833.4 29,035.4 33,079.9 34,756.0 35,866.7 37,892.2
Industrial-related 13,850.5 16,597.2 18,568.1 19,161.1 19,627.8 20,859.8
Manufacturing 13,369.0 15,709.2 17,324.9 17,755.6 17,937.2 19,246.1
Construction 80.9 82.8 110.9 191.5 244.9 221.2
Utilities 382.8 784.5 1,110.8 1,189.1 1,416.7 1,360.6
Other Industrial-related 17.8 20.7 21.5 24.9 29.1 31.9
Commerce and Services-related 7,828.8 10,438.2 12,203.4 13,250.3 13,681.3 14,307.3
Wholesale and Retail Trade 1,338.5 1,141.3 1,248.7 1,446.0 1,505.8 1,553.1
Accommodation and Food Services 642.3 789.8 826.0 868.4 988.4 1,093.0
Information and Communications 509.6 702.5 1,020.4 1,197.8 1,612.6 1,684.3
Financial and Insurance Activities 871.7 1,547.9 2,176.0 2,371.3 2,064.4 2,111.3
Real Estate Activities 1,341.2 2,405.2 2,781.6 2,978.6 2,970.5 3,214.2
Professional, Scientific & Technical, Administration & Support Activities 422.7 619.4 384.5 408.6 414.2 489.6
Other Commerce and Services-related 2,702.9 3,232.2 3,766.1 3,979.6 4,125.5 4,161.8
Transport-related 1,072.0 1,962.0 2,285.3 2,317.8 2,504.6 2,628.6
Households - - - - - -
Others 82.1 38.0 23.2 26.8 53.0 96.5
2005 2010
Notes: a. Solar PV statistics have been included in this table from 2016.
Source: Energy Market Authority (EMA)
Unit: GWh
2014 2015 2016 2017

SINGAPORE ENERGY STATISTICS 2018 42
TABLE 3.2.2: ELECTRICITY CONSUMPTION BY SUB-SECTOR (NON-CONTESTABLE CONSUMERS)
Overall 12,655.8 13,216.3 13,323.1 12,757.9 12,759.9 11,751.5
Industrial-related 658.5 1,065.4 1,185.2 926.9 790.6 656.5
Manufacturing 467.1 738.8 664.1 522.0 433.7 335.6
Construction 153.9 255.1 416.2 339.5 306.7 263.2
Utilities 28.2 58.9 87.2 48.1 33.5 42.1
Other Industrial-related 9.4 12.6 17.7 17.3 16.7 15.7
Commerce and Services-related 5,246.8 5,031.5 4,843.3 4,230.7 4,018.0 3,497.0
Wholesale and Retail Trade 771.2 781.7 771.8 661.4 567.6 441.4
Accommodation and Food Services 389.1 429.8 506.2 481.8 464.9 351.9
Information and Communications 157.6 223.0 274.2 229.0 235.4 189.2
Financial and Insurance Activities 420.3 379.1 398.1 346.8 297.3 231.5
Real Estate Activities 2,371.2 1,940.9 1,704.1 1,476.0 1,526.6 1,486.7
Professional, Scientific & Technical, Administration & Support Activities 227.6 266.3 296.4 305.1 269.2 214.2
Other Commerce and Services-related 909.8 1,010.5 892.5 730.7 657.1 582.1
Transport-related 128.0 136.6 155.7 127.1 134.7 122.1
Households 6,092.5 6,636.0 6,924.4 7,220.9 7,589.4 7,295.8
Others 530.0 346.8 214.5 252.3 227.1 180.0
2005 2010
Notes: a. Solar PV statistics have been included in this table from 2016.
Source: Energy Market Authority (EMA)
Unit: GWh
2014 2015 2016 2017
ENERGY CONSUMPTION43
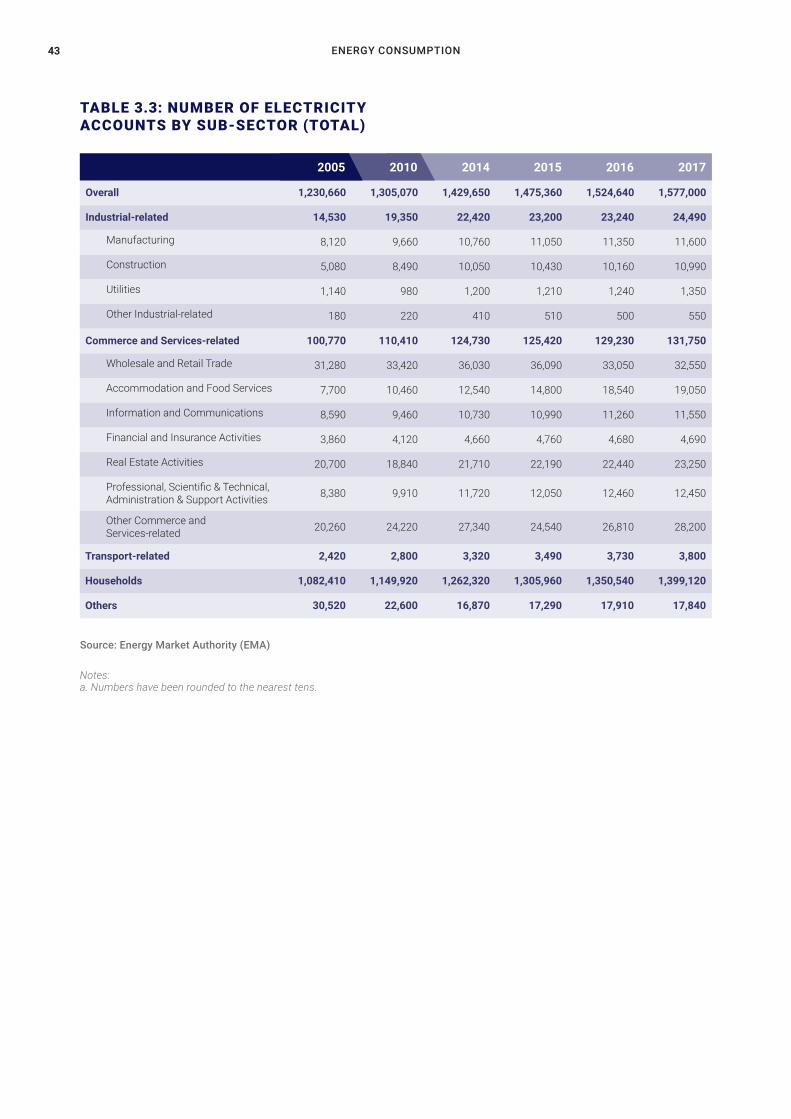
TABLE 3.3: NUMBER OF ELECTRICITY ACCOUNTS BY SUB-SECTOR (TOTAL)
Overall 1,230,660 1,305,070 1,429,650 1,475,360 1,524,640 1,577,000
Industrial-related 14,530 19,350 22,420 23,200 23,240 24,490
Manufacturing 8,120 9,660 10,760 11,050 11,350 11,600
Construction 5,080 8,490 10,050 10,430 10,160 10,990
Utilities 1,140 980 1,200 1,210 1,240 1,350
Other Industrial-related 180 220 410 510 500 550
Commerce and Services-related 100,770 110,410 124,730 125,420 129,230 131,750
Wholesale and Retail Trade 31,280 33,420 36,030 36,090 33,050 32,550
Accommodation and Food Services 7,700 10,460 12,540 14,800 18,540 19,050
Information and Communications 8,590 9,460 10,730 10,990 11,260 11,550
Financial and Insurance Activities 3,860 4,120 4,660 4,760 4,680 4,690
Real Estate Activities 20,700 18,840 21,710 22,190 22,440 23,250
Professional, Scientific & Technical, Administration & Support Activities 8,380 9,910 11,720 12,050 12,460 12,450
Other Commerce and Services-related 20,260 24,220 27,340 24,540 26,810 28,200
Transport-related 2,420 2,800 3,320 3,490 3,730 3,800
Households 1,082,410 1,149,920 1,262,320 1,305,960 1,350,540 1,399,120
Others 30,520 22,600 16,870 17,290 17,910 17,840
2005 2010
Notes: a. Numbers have been rounded to the nearest tens.
Source: Energy Market Authority (EMA)
2014 2015 2016 2017

SINGAPORE ENERGY STATISTICS 2018 44
ENERGY CONSUMPTION45
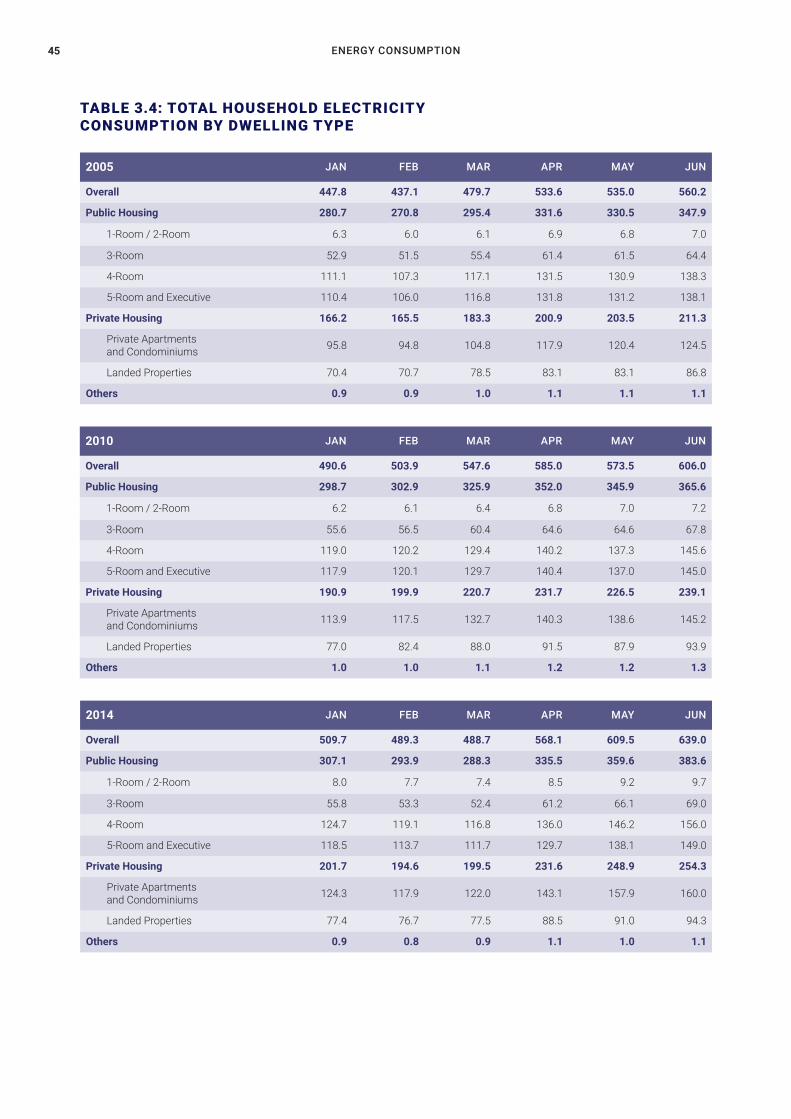
TABLE 3.4: TOTAL HOUSEHOLD ELECTRICITYCONSUMPTION BY DWELLING TYPE
2005 JAN FEB MAR APR MAY JUN
Overall 447.8 437.1 479.7 533.6 535.0 560.2
Public Housing 280.7 270.8 295.4 331.6 330.5 347.9
1-Room / 2-Room 6.3 6.0 6.1 6.9 6.8 7.0
3-Room 52.9 51.5 55.4 61.4 61.5 64.4
4-Room 111.1 107.3 117.1 131.5 130.9 138.3
5-Room and Executive 110.4 106.0 116.8 131.8 131.2 138.1
Private Housing 166.2 165.5 183.3 200.9 203.5 211.3
Private Apartments and Condominiums 95.8 94.8 104.8 117.9 120.4 124.5
Landed Properties 70.4 70.7 78.5 83.1 83.1 86.8
Others 0.9 0.9 1.0 1.1 1.1 1.1
2010 JAN FEB MAR APR MAY JUN
Overall 490.6 503.9 547.6 585.0 573.5 606.0
Public Housing 298.7 302.9 325.9 352.0 345.9 365.6
1-Room / 2-Room 6.2 6.1 6.4 6.8 7.0 7.2
3-Room 55.6 56.5 60.4 64.6 64.6 67.8
4-Room 119.0 120.2 129.4 140.2 137.3 145.6
5-Room and Executive 117.9 120.1 129.7 140.4 137.0 145.0
Private Housing 190.9 199.9 220.7 231.7 226.5 239.1
Private Apartments and Condominiums 113.9 117.5 132.7 140.3 138.6 145.2
Landed Properties 77.0 82.4 88.0 91.5 87.9 93.9
Others 1.0 1.0 1.1 1.2 1.2 1.3
2014 JAN FEB MAR APR MAY JUN
Overall 509.7 489.3 488.7 568.1 609.5 639.0
Public Housing 307.1 293.9 288.3 335.5 359.6 383.6
1-Room / 2-Room 8.0 7.7 7.4 8.5 9.2 9.7
3-Room 55.8 53.3 52.4 61.2 66.1 69.0
4-Room 124.7 119.1 116.8 136.0 146.2 156.0
5-Room and Executive 118.5 113.7 111.7 129.7 138.1 149.0
Private Housing 201.7 194.6 199.5 231.6 248.9 254.3
Private Apartments and Condominiums 124.3 117.9 122.0 143.1 157.9 160.0
Landed Properties 77.4 76.7 77.5 88.5 91.0 94.3
Others 0.9 0.8 0.9 1.1 1.0 1.1
SINGAPORE ENERGY STATISTICS 2018 46
Unit: GWh
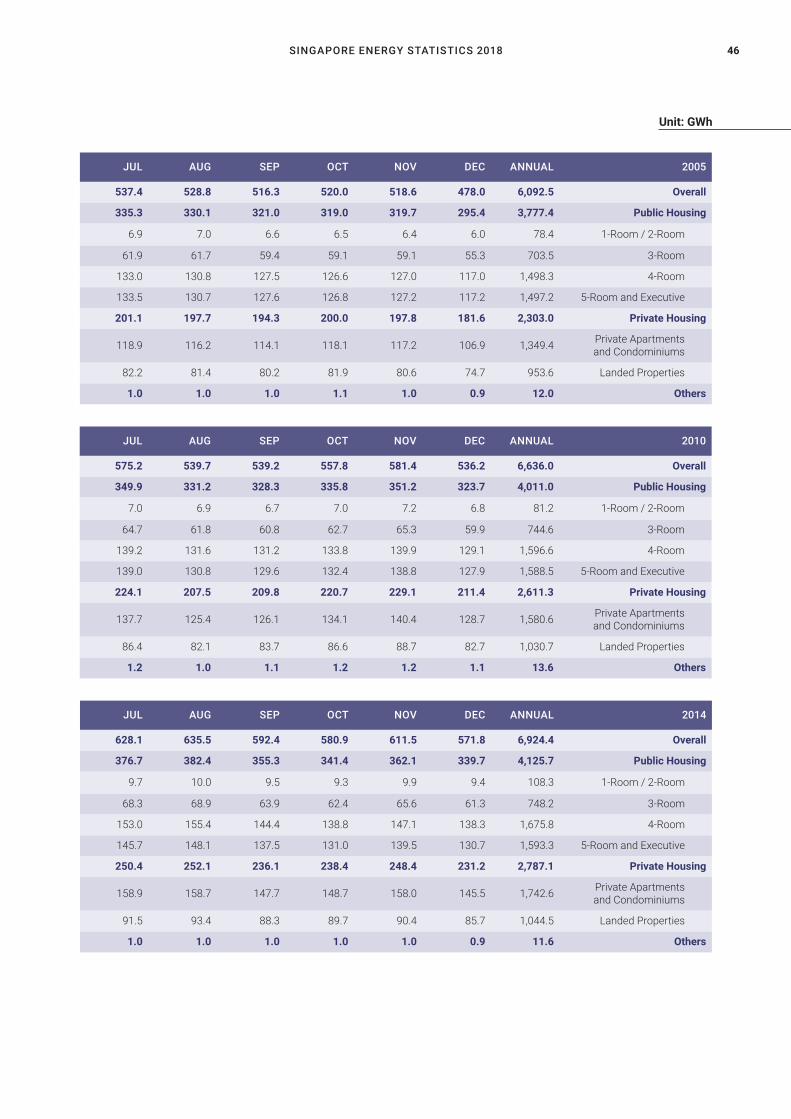
JUL AUG SEP OCT NOV DEC ANNUAL 2005
537.4 528.8 516.3 520.0 518.6 478.0 6,092.5 Overall
335.3 330.1 321.0 319.0 319.7 295.4 3,777.4 Public Housing
6.9 7.0 6.6 6.5 6.4 6.0 78.4 1-Room / 2-Room
61.9 61.7 59.4 59.1 59.1 55.3 703.5 3-Room
133.0 130.8 127.5 126.6 127.0 117.0 1,498.3 4-Room
133.5 130.7 127.6 126.8 127.2 117.2 1,497.2 5-Room and Executive
201.1 197.7 194.3 200.0 197.8 181.6 2,303.0 Private Housing
118.9 116.2 114.1 118.1 117.2 106.9 1,349.4 Private Apartments and Condominiums
82.2 81.4 80.2 81.9 80.6 74.7 953.6 Landed Properties
1.0 1.0 1.0 1.1 1.0 0.9 12.0 Others
JUL AUG SEP OCT NOV DEC ANNUAL 2010
575.2 539.7 539.2 557.8 581.4 536.2 6,636.0 Overall
349.9 331.2 328.3 335.8 351.2 323.7 4,011.0 Public Housing
7.0 6.9 6.7 7.0 7.2 6.8 81.2 1-Room / 2-Room
64.7 61.8 60.8 62.7 65.3 59.9 744.6 3-Room
139.2 131.6 131.2 133.8 139.9 129.1 1,596.6 4-Room
139.0 130.8 129.6 132.4 138.8 127.9 1,588.5 5-Room and Executive
224.1 207.5 209.8 220.7 229.1 211.4 2,611.3 Private Housing
137.7 125.4 126.1 134.1 140.4 128.7 1,580.6 Private Apartments and Condominiums
86.4 82.1 83.7 86.6 88.7 82.7 1,030.7 Landed Properties
1.2 1.0 1.1 1.2 1.2 1.1 13.6 Others
JUL AUG SEP OCT NOV DEC ANNUAL 2014
628.1 635.5 592.4 580.9 611.5 571.8 6,924.4 Overall
376.7 382.4 355.3 341.4 362.1 339.7 4,125.7 Public Housing
9.7 10.0 9.5 9.3 9.9 9.4 108.3 1-Room / 2-Room
68.3 68.9 63.9 62.4 65.6 61.3 748.2 3-Room
153.0 155.4 144.4 138.8 147.1 138.3 1,675.8 4-Room
145.7 148.1 137.5 131.0 139.5 130.7 1,593.3 5-Room and Executive
250.4 252.1 236.1 238.4 248.4 231.2 2,787.1 Private Housing
158.9 158.7 147.7 148.7 158.0 145.5 1,742.6 Private Apartments and Condominiums
91.5 93.4 88.3 89.7 90.4 85.7 1,044.5 Landed Properties
1.0 1.0 1.0 1.0 1.0 0.9 11.6 Others
ENERGY CONSUMPTION47
TABLE 3.4: TOTAL HOUSEHOLD ELECTRICITYCONSUMPTION BY DWELLING TYPE (CONTINUED)
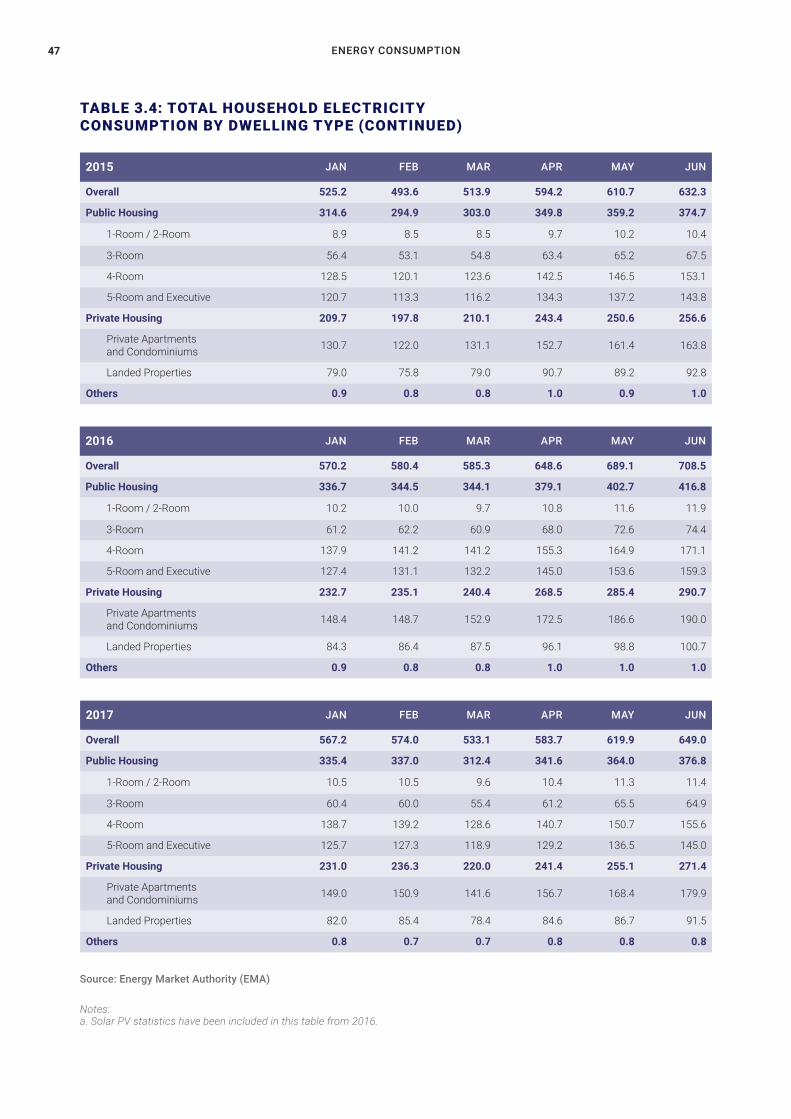
2015 JAN FEB MAR APR MAY JUN
Overall 525.2 493.6 513.9 594.2 610.7 632.3
Public Housing 314.6 294.9 303.0 349.8 359.2 374.7
1-Room / 2-Room 8.9 8.5 8.5 9.7 10.2 10.4
3-Room 56.4 53.1 54.8 63.4 65.2 67.5
4-Room 128.5 120.1 123.6 142.5 146.5 153.1
5-Room and Executive 120.7 113.3 116.2 134.3 137.2 143.8
Private Housing 209.7 197.8 210.1 243.4 250.6 256.6
Private Apartments and Condominiums 130.7 122.0 131.1 152.7 161.4 163.8
Landed Properties 79.0 75.8 79.0 90.7 89.2 92.8
Others 0.9 0.8 0.8 1.0 0.9 1.0
2016 JAN FEB MAR APR MAY JUN
Overall 570.2 580.4 585.3 648.6 689.1 708.5
Public Housing 336.7 344.5 344.1 379.1 402.7 416.8
1-Room / 2-Room 10.2 10.0 9.7 10.8 11.6 11.9
3-Room 61.2 62.2 60.9 68.0 72.6 74.4
4-Room 137.9 141.2 141.2 155.3 164.9 171.1
5-Room and Executive 127.4 131.1 132.2 145.0 153.6 159.3
Private Housing 232.7 235.1 240.4 268.5 285.4 290.7
Private Apartments and Condominiums 148.4 148.7 152.9 172.5 186.6 190.0
Landed Properties 84.3 86.4 87.5 96.1 98.8 100.7
Others 0.9 0.8 0.8 1.0 1.0 1.0
2017 JAN FEB MAR APR MAY JUN
Overall 567.2 574.0 533.1 583.7 619.9 649.0
Public Housing 335.4 337.0 312.4 341.6 364.0 376.8
1-Room / 2-Room 10.5 10.5 9.6 10.4 11.3 11.4
3-Room 60.4 60.0 55.4 61.2 65.5 64.9
4-Room 138.7 139.2 128.6 140.7 150.7 155.6
5-Room and Executive 125.7 127.3 118.9 129.2 136.5 145.0
Private Housing 231.0 236.3 220.0 241.4 255.1 271.4
Private Apartments and Condominiums 149.0 150.9 141.6 156.7 168.4 179.9
Landed Properties 82.0 85.4 78.4 84.6 86.7 91.5
Others 0.8 0.7 0.7 0.8 0.8 0.8
Notes: a. Solar PV statistics have been included in this table from 2016.
Source: Energy Market Authority (EMA)
SINGAPORE ENERGY STATISTICS 2018 48
Unit: GWh
JUL AUG SEP OCT NOV DEC ANNUAL 2015
647.0 656.7 635.7 643.6 645.7 622.4 7,220.9 Overall
384.5 394.6 380.3 379.3 379.0 370.3 4,284.2 Public Housing
10.7 11.0 10.8 10.7 10.7 10.7 120.7 1-Room / 2-Room
69.4 70.7 67.9 67.7 68.0 66.0 770.1 3-Room
157.4 161.1 155.0 154.9 154.2 151.9 1,748.8 4-Room
147.1 151.7 146.6 145.9 146.1 141.7 1,644.6 5-Room and Executive
261.5 261.3 254.5 263.4 265.7 251.2 2,925.8 Private Housing
167.3 167.1 162.9 167.7 172.7 160.5 1,859.9 Private Apartments and Condominiums
94.2 94.2 91.6 95.7 93.0 90.7 1,065.8 Landed Properties
1.0 0.9 0.9 0.9 0.9 0.9 11.0 Others
JUL AUG SEP OCT NOV DEC ANNUAL 2016
642.2 647.0 647.7 650.5 644.8 575.1 7,589.4 Overall
382.9 385.2 385.2 382.0 382.3 338.8 4,480.2 Public Housing
11.2 11.3 11.2 11.2 11.3 10.4 131.1 1-Room / 2-Room
68.2 69.2 68.7 68.2 67.7 60.6 801.8 3-Room
157.6 158.2 158.4 157.0 157.2 139.4 1,839.4 4-Room
145.9 146.5 146.9 145.6 146.1 128.4 1,708.0 5-Room and Executive
258.4 261.0 261.7 267.6 261.6 235.6 3,098.7 Private Housing
167.9 167.5 169.6 173.9 170.8 152.0 2,000.7 Private Apartments and Condominiums
90.5 93.5 92.1 93.7 90.9 83.6 1,098.0 Landed Properties
0.9 0.8 0.8 0.9 0.9 0.7 10.5 Others
JUL AUG SEP OCT NOV DEC ANNUAL 2017
698.1 630.2 613.1 622.1 622.2 583.2 7,295.8 Overall
420.9 369.2 358.0 363.5 368.5 339.8 4,287.2 Public Housing
12.7 11.4 11.1 11.3 11.5 10.9 132.6 1-Room / 2-Room
76.3 65.1 63.3 64.7 64.8 60.3 761.9 3-Room
174.4 152.9 148.1 150.1 152.7 140.8 1,772.5 4-Room
157.6 139.8 135.5 137.4 139.5 127.8 1,620.3 5-Room and Executive
276.3 260.2 254.3 257.8 252.9 242.6 2,999.3 Private Housing
182.7 167.6 166.8 168.0 167.5 160.2 1,959.1 Private Apartments and Condominiums
93.7 92.6 87.6 89.8 85.4 82.5 1,040.2 Landed Properties
0.9 0.8 0.8 0.8 0.8 0.7 9.3 Others

ENERGY CONSUMPTION49
TABLE 3.5: AVERAGE MONTHLY HOUSEHOLDELECTRICITY CONSUMPTION BY DWELLING TYPE
2005 JAN FEB MAR APR MAY JUN
Overall 418.1 408.3 446.9 496.2 496.8 519.7
Public Housing 330.9 319.1 347.6 389.7 388.0 408.2
1-Room / 2-Room 135.2 129.0 131.5 148.0 147.0 151.1
3-Room 241.7 235.2 253.1 280.3 281.0 294.7
4-Room 345.6 333.6 363.4 407.4 404.9 427.4
5-Room and Executive 422.0 405.1 445.4 501.9 498.9 524.4
Private Housing 751.4 749.8 825.2 900.8 909.9 941.9
Private Apartments and Condominiums 624.8 619.2 679.3 759.2 772.9 796.0
Landed Properties 1,037.7 1,044.8 1,157.1 1,224.8 1,224.2 1,277.9
Others 594.2 572.7 637.1 723.3 693.5 711.8
2010 JAN FEB MAR APR MAY JUN
Overall 433.4 446.1 482.1 513.5 505.4 531.5
Public Housing 343.2 348.4 373.2 402.6 396.8 418.5
1-Room / 2-Room 143.2 142.7 146.6 156.0 159.5 163.3
3-Room 255.8 260.1 277.1 296.0 296.8 311.2
4-Room 354.8 358.4 384.3 415.2 408.1 431.5
5-Room and Executive 429.8 438.5 471.8 510.9 500.1 528.4
Private Housing 734.7 773.4 845.7 880.6 866.5 903.2
Private Apartments and Condominiums 598.9 622.4 693.8 728.3 721.5 747.2
Landed Properties 1,105.4 1,182.4 1,262.0 1,296.4 1,268.6 1,333.7
Others 607.0 617.5 621.8 719.0 671.9 743.9
2014 JAN FEB MAR APR MAY JUN
Overall 420.2 402.5 400.0 462.4 494.6 516.2
Public Housing 336.4 321.5 313.9 364.1 389.5 414.6
1-Room / 2-Room 151.4 144.7 137.2 154.8 167.4 173.3
3-Room 253.6 242.2 237.1 276.5 298.4 311.5
4-Room 347.5 331.0 323.0 374.9 401.8 427.8
5-Room and Executive 422.3 405.2 396.4 459.4 488.4 525.7
Private Housing 675.5 648.0 661.3 757.1 808.7 816.9
Private Apartments and Condominiums 544.0 513.7 525.9 610.8 666.1 669.0
Landed Properties 1,104.0 1,082.9 1,111.9 1,234.6 1,285.8 1,307.5
Others 581.9 587.3 605.4 746.8 734.9 777.1
SINGAPORE ENERGY STATISTICS 2018 50
Unit: kWh
JUL AUG SEP OCT NOV DEC ANNUAL 2005
497.7 489.3 477.7 480.8 479.7 441.6 471.1 Overall
393.3 387.2 376.7 374.4 375.5 347.0 369.9 Public Housing
147.8 148.8 141.2 139.7 140.4 132.7 141.1 1-Room / 2-Room
283.8 283.3 272.9 272.1 272.0 254.4 268.7 3-Room
410.7 403.8 393.6 390.9 392.2 361.3 386.3 4-Room
506.2 495.0 482.8 479.1 480.5 441.8 473.7 5-Room and Executive
890.6 872.3 856.0 877.9 866.8 791.2 853.0 Private Housing
754.1 733.1 717.7 739.5 732.1 662.8 716.2 Private Apartments and Condominiums
1,206.7 1,196.3 1,178.9 1,202.2 1,183.5 1,094.4 1,169.1 Landed Properties
622.7 604.5 605.1 644.3 640.7 569.7 634.2 Others
JUL AUG SEP OCT NOV DEC ANNUAL 2010
502.4 471.9 472.0 486.9 509.6 466.3 485.1 Overall
399.3 378.3 375.3 383.0 401.4 368.2 382.4 Public Housing
158.1 154.9 150.4 156.8 160.8 149.6 153.5 1-Room / 2-Room
295.6 282.7 277.9 286.2 298.9 272.8 284.3 3-Room
411.8 389.7 388.7 395.2 414.2 380.2 394.4 4-Room
505.4 476.5 473.2 482.0 506.6 465.4 482.4 5-Room and Executive
839.5 778.7 789.4 826.6 866.6 785.9 824.3 Private Housing
699.5 639.6 642.4 681.7 717.6 648.4 678.6 Private Apartments and Condominiums
1,232.1 1,166.3 1,204.8 1,232.4 1,291.3 1,173.1 1,229.0 Landed Properties
689.9 582.4 642.1 699.4 667.6 629.1 657.8 Others
JUL AUG SEP OCT NOV DEC ANNUAL 2014
506.6 510.0 474.7 463.5 486.8 453.0 466.1 Overall
406.7 411.4 381.6 365.5 386.7 361.6 371.3 Public Housing
171.9 176.6 166.5 160.9 171.7 161.2 161.7 1-Room / 2-Room
308.5 310.0 286.9 279.8 292.9 273.1 280.9 3-Room
419.1 423.8 393.3 376.4 398.2 372.9 382.6 4-Room
514.1 521.8 483.9 459.8 489.1 457.1 468.7 5-Room and Executive
802.0 800.1 748.8 749.9 780.1 718.9 748.0 Private Housing
658.6 653.5 605.3 604.2 638.6 583.0 606.9 Private Apartments and Condominiums
1,289.2 1,293.3 1,240.6 1,249.1 1,272.8 1,189.5 1,222.3 Landed Properties
723.4 697.7 716.9 754.7 783.0 668.3 696.5 Others
ENERGY CONSUMPTION51
TABLE 3.5: AVERAGE MONTHLY HOUSEHOLD ELECTRICITY CONSUMPTION BY DWELLING TYPE (CONTINUED)
2015 JAN FEB MAR APR MAY JUN
Overall 414.7 390.6 403.3 463.7 476.3 491.0
Public Housing 334.0 313.7 319.8 368.3 378.0 393.6
1-Room / 2-Room 153.1 144.8 143.3 163.6 171.0 173.3
3-Room 251.0 236.9 242.9 280.4 289.1 299.5
4-Room 345.4 322.9 329.6 378.9 389.3 405.4
5-Room and Executive 421.3 396.2 403.5 465.6 475.6 497.1
Private Housing 648.9 614.6 645.7 736.3 757.8 767.6
Private Apartments and Condominiums 519.0 486.5 513.9 590.7 622.4 625.4
Landed Properties 1,107.8 1,066.3 1,123.6 1,259.0 1,249.5 1,281.6
Others 657.7 594.2 605.9 754.1 703.3 726.9
2016 JAN FEB MAR APR MAY JUN
Overall 436.2 443.4 445.0 490.7 520.9 531.9
Public Housing 349.8 357.8 355.8 391.1 415.0 428.4
1-Room / 2-Room 167.0 163.7 158.2 175.8 187.5 192.3
3-Room 268.9 273.5 266.6 297.3 317.3 324.8
4-Room 360.2 368.7 367.2 402.4 426.5 441.3
5-Room and Executive 437.6 449.8 452.0 494.6 523.8 542.0
Private Housing 677.3 681.4 692.9 764.6 812.4 812.6
Private Apartments and Condominiums 545.0 544.5 554.2 618.8 667.0 666.6
Landed Properties 1,182.6 1,200.5 1,231.9 1,325.4 1,381.6 1,385.7
Others 674.9 662.2 682.3 798.9 795.1 809.4
2017 JAN FEB MAR APR MAY JUN
Overall 419.8 424.3 390.7 426.9 453.9 502.1
Public Housing 341.6 343.1 315.8 344.7 367.5 407.5
1-Room / 2-Room 164.5 164.1 148.8 161.9 174.7 184.3
3-Room 262.9 261.1 239.4 264.6 283.3 309.0
4-Room 353.5 354.5 324.9 354.8 380.0 420.4
5-Room and Executive 424.9 430.3 399.1 433.2 458.2 512.5
Private Housing 627.9 639.2 588.4 643.0 681.9 739.6
Private Apartments and Condominiums 502.8 507.0 468.6 517.6 555.9 604.2
Landed Properties 1,145.8 1,184.8 1,092.0 1,165.9 1,217.8 1,322.5
Others 709.4 651.6 642.7 692.9 704.7 795.3
Notes: a. Solar PV statistics have been included in this table from 2016.
Source: Energy Market Authority (EMA)
SINGAPORE ENERGY STATISTICS 2018 52
Unit: kWh
JUL AUG SEP OCT NOV DEC ANNUAL 2015
500.4 507.9 491.8 494.2 506.8 476.6 468.4 Overall
402.9 413.1 397.8 394.9 405.2 384.9 375.6 Public Housing
177.2 183.3 178.4 175.4 179.8 174.5 168.3 1-Room / 2-Room
307.0 312.6 300.2 297.9 306.0 290.3 284.5 3-Room
415.7 425.2 408.5 406.2 416.4 397.3 386.9 4-Room
507.6 523.4 505.9 501.7 515.7 486.7 475.1 5-Room and Executive
775.8 776.1 759.0 773.5 787.6 733.3 732.3 Private Housing
630.1 632.2 616.1 625.7 645.0 593.2 592.7 Private Apartments and Condominiums
1,316.9 1,301.7 1,292.4 1,319.9 1,336.2 1,260.2 1,243.2 Landed Properties
739.6 704.6 713.4 738.3 735.3 698.6 697.1 Others
JUL AUG SEP OCT NOV DEC ANNUAL 2016
481.0 484.0 484.4 484.1 479.2 425.9 475.6 Overall
393.3 395.4 394.7 390.3 390.2 345.1 383.9 Public Housing
181.0 182.1 179.5 178.6 178.5 163.4 175.7 1-Room / 2-Room
297.7 302.0 299.5 296.6 294.5 263.5 291.9 3-Room
405.9 407.0 406.9 401.9 401.9 355.4 395.5 4-Room
496.0 497.8 498.6 493.1 494.4 433.8 484.5 5-Room and Executive
716.9 722.1 726.4 735.6 717.6 640.9 725.0 Private Housing
582.3 580.5 587.1 597.6 582.9 514.9 586.8 Private Apartments and Condominiums
1,254.6 1,282.8 1,289.3 1,286.9 1,268.4 1,154.6 1,270.5 Landed Properties
737.7 732.0 746.9 786.5 778.0 665.7 739.0 Others
JUL AUG SEP OCT NOV DEC ANNUAL 2017
507.8 454.1 443.2 447.8 446.9 416.8 444.3 Overall
423.8 369.0 358.3 362.3 366.3 336.8 361.1 Public Housing
193.5 171.9 166.7 167.6 169.6 159.3 168.9 1-Room / 2-Room
329.4 279.2 271.9 277.3 276.9 257.0 275.8 3-Room
438.2 381.6 370.1 373.2 378.7 347.9 372.9 4-Room
528.2 465.6 452.2 457.3 463.7 424.1 453.9 5-Room and Executive
726.7 674.1 664.2 670.0 656.9 623.6 661.3 Private Housing
593.5 536.6 535.8 538.8 534.2 506.6 533.5 Private Apartments and Condominiums
1,292.1 1,257.5 1,221.9 1,229.4 1,196.2 1,131.8 1,204.5 Landed Properties
796.2 676.9 706.7 706.4 697.3 659.6 703.0 Others

ENERGY CONSUMPTION53
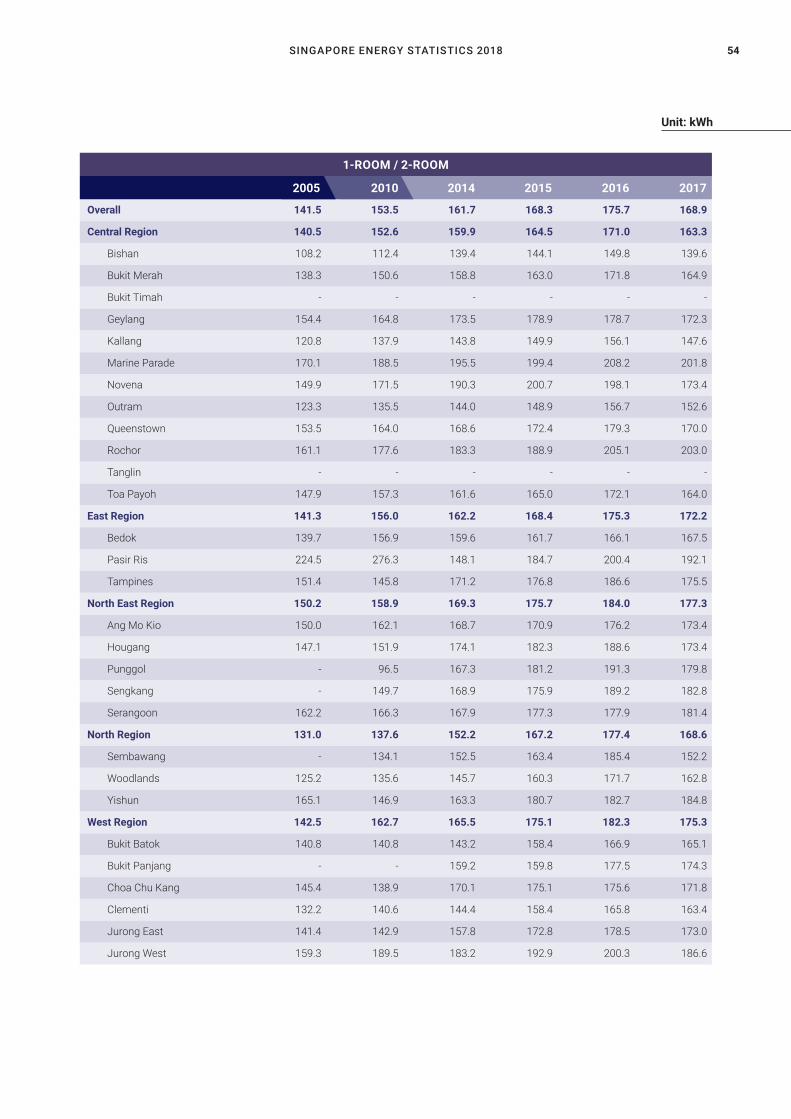
TABLE 3.6: AVERAGE MONTHLY ELECTRICITY CONSUMPTIONBY PLANNING AREA AND DWELLING TYPE (ANNUAL)
Overall 370.1 382.4 371.3 375.6 383.9 361.1
Central Region 319.4 333.0 331.2 334.8 342.7 319.7
Bishan 417.4 423.7 405.7 410.9 416.6 389.3
Bukit Merah 302.4 324.0 321.6 323.4 334.0 312.1
Bukit Timah 409.1 405.9 395.9 399.6 399.2 371.7
Geylang 332.4 345.0 344.6 348.5 356.3 334.7
Kallang 301.8 316.6 317.5 324.4 329.4 303.0
Marine Parade 309.5 323.3 318.7 321.0 331.1 308.5
Novena 339.1 356.9 351.8 359.4 363.3 329.5
Outram 228.7 230.6 273.9 280.4 289.9 276.6
Queenstown 289.8 303.7 304.2 303.8 312.6 294.5
Rochor 312.7 333.3 331.7 339.8 352.5 330.3
Tanglin 448.8 448.4 416.8 413.1 411.6 377.4
Toa Payoh 319.5 336.0 331.1 336.1 343.8 320.2
East Region 410.6 415.6 403.5 406.8 415.6 390.6
Bedok 348.7 358.6 351.7 357.6 363.5 342.4
Pasir Ris 490.3 493.1 478.0 475.1 490.9 459.5
Tampines 434.2 435.9 419.0 421.2 429.7 403.7
North East Region 375.0 391.8 371.7 372.5 382.3 362.7
Ang Mo Kio 310.1 323.3 321.6 324.3 331.2 319.3
Hougang 405.9 417.1 394.8 397.4 405.6 378.9
Punggol 389.6 420.9 368.8 358.8 371.5 355.5
Sengkang 398.2 417.6 386.5 386.6 399.5 375.5
Serangoon 401.7 410.1 398.2 406.6 410.6 394.2
North Region 386.5 403.8 388.2 400.5 408.6 383.1
Sembawang 386.2 411.7 397.4 411.8 424.7 376.3
Woodlands 397.3 413.4 402.6 412.7 425.5 397.5
Yishun 373.3 388.8 368.0 382.5 384.1 369.7
West Region 378.9 389.7 378.8 382.7 389.4 366.6
Bukit Batok 361.1 372.1 364.1 373.3 376.1 350.3
Bukit Panjang 379.4 395.8 377.1 371.4 383.6 365.7
Choa Chu Kang 412.9 419.9 407.7 407.6 400.6 383.5
Clementi 318.1 328.8 320.3 322.5 329.8 307.7
Jurong East 377.1 377.1 363.6 368.9 378.6 356.0
Jurong West 390.1 403.5 394.8 403.4 415.9 388.4
2005 2010 2014 2015 2016 2017
OVERALL PUBLIC HOUSING
SINGAPORE ENERGY STATISTICS 2018 54
Unit: kWh
Overall 141.5 153.5 161.7 168.3 175.7 168.9
Central Region 140.5 152.6 159.9 164.5 171.0 163.3
Bishan 108.2 112.4 139.4 144.1 149.8 139.6
Bukit Merah 138.3 150.6 158.8 163.0 171.8 164.9
Bukit Timah - - - - - -
Geylang 154.4 164.8 173.5 178.9 178.7 172.3
Kallang 120.8 137.9 143.8 149.9 156.1 147.6
Marine Parade 170.1 188.5 195.5 199.4 208.2 201.8
Novena 149.9 171.5 190.3 200.7 198.1 173.4
Outram 123.3 135.5 144.0 148.9 156.7 152.6
Queenstown 153.5 164.0 168.6 172.4 179.3 170.0
Rochor 161.1 177.6 183.3 188.9 205.1 203.0
Tanglin - - - - - -
Toa Payoh 147.9 157.3 161.6 165.0 172.1 164.0
East Region 141.3 156.0 162.2 168.4 175.3 172.2
Bedok 139.7 156.9 159.6 161.7 166.1 167.5
Pasir Ris 224.5 276.3 148.1 184.7 200.4 192.1
Tampines 151.4 145.8 171.2 176.8 186.6 175.5
North East Region 150.2 158.9 169.3 175.7 184.0 177.3
Ang Mo Kio 150.0 162.1 168.7 170.9 176.2 173.4
Hougang 147.1 151.9 174.1 182.3 188.6 173.4
Punggol - 96.5 167.3 181.2 191.3 179.8
Sengkang - 149.7 168.9 175.9 189.2 182.8
Serangoon 162.2 166.3 167.9 177.3 177.9 181.4
North Region 131.0 137.6 152.2 167.2 177.4 168.6
Sembawang - 134.1 152.5 163.4 185.4 152.2
Woodlands 125.2 135.6 145.7 160.3 171.7 162.8
Yishun 165.1 146.9 163.3 180.7 182.7 184.8
West Region 142.5 162.7 165.5 175.1 182.3 175.3
Bukit Batok 140.8 140.8 143.2 158.4 166.9 165.1
Bukit Panjang - - 159.2 159.8 177.5 174.3
Choa Chu Kang 145.4 138.9 170.1 175.1 175.6 171.8
Clementi 132.2 140.6 144.4 158.4 165.8 163.4
Jurong East 141.4 142.9 157.8 172.8 178.5 173.0
Jurong West 159.3 189.5 183.2 192.9 200.3 186.6
2005 2010 2014 2015 2016 2017
1-ROOM / 2-ROOM
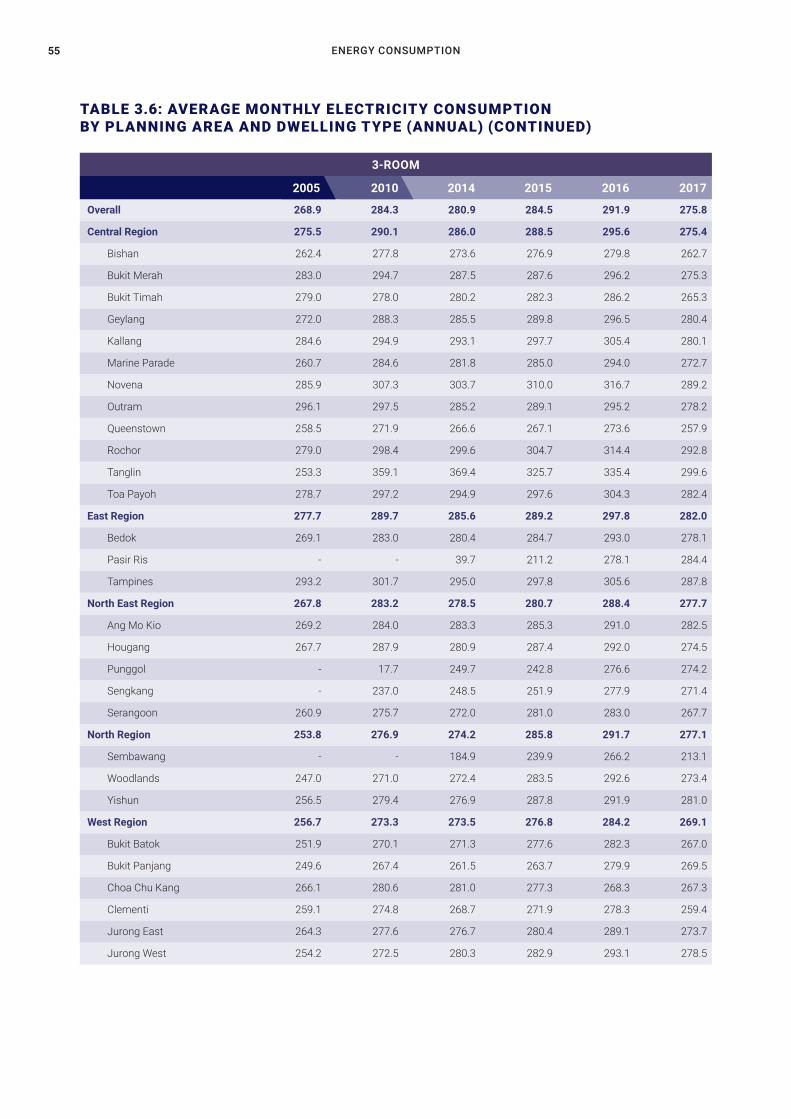
ENERGY CONSUMPTION55
TABLE 3.6: AVERAGE MONTHLY ELECTRICITY CONSUMPTIONBY PLANNING AREA AND DWELLING TYPE (ANNUAL) (CONTINUED)
Overall 268.9 284.3 280.9 284.5 291.9 275.8
Central Region 275.5 290.1 286.0 288.5 295.6 275.4
Bishan 262.4 277.8 273.6 276.9 279.8 262.7
Bukit Merah 283.0 294.7 287.5 287.6 296.2 275.3
Bukit Timah 279.0 278.0 280.2 282.3 286.2 265.3
Geylang 272.0 288.3 285.5 289.8 296.5 280.4
Kallang 284.6 294.9 293.1 297.7 305.4 280.1
Marine Parade 260.7 284.6 281.8 285.0 294.0 272.7
Novena 285.9 307.3 303.7 310.0 316.7 289.2
Outram 296.1 297.5 285.2 289.1 295.2 278.2
Queenstown 258.5 271.9 266.6 267.1 273.6 257.9
Rochor 279.0 298.4 299.6 304.7 314.4 292.8
Tanglin 253.3 359.1 369.4 325.7 335.4 299.6
Toa Payoh 278.7 297.2 294.9 297.6 304.3 282.4
East Region 277.7 289.7 285.6 289.2 297.8 282.0
Bedok 269.1 283.0 280.4 284.7 293.0 278.1
Pasir Ris - - 39.7 211.2 278.1 284.4
Tampines 293.2 301.7 295.0 297.8 305.6 287.8
North East Region 267.8 283.2 278.5 280.7 288.4 277.7
Ang Mo Kio 269.2 284.0 283.3 285.3 291.0 282.5
Hougang 267.7 287.9 280.9 287.4 292.0 274.5
Punggol - 17.7 249.7 242.8 276.6 274.2
Sengkang - 237.0 248.5 251.9 277.9 271.4
Serangoon 260.9 275.7 272.0 281.0 283.0 267.7
North Region 253.8 276.9 274.2 285.8 291.7 277.1
Sembawang - - 184.9 239.9 266.2 213.1
Woodlands 247.0 271.0 272.4 283.5 292.6 273.4
Yishun 256.5 279.4 276.9 287.8 291.9 281.0
West Region 256.7 273.3 273.5 276.8 284.2 269.1
Bukit Batok 251.9 270.1 271.3 277.6 282.3 267.0
Bukit Panjang 249.6 267.4 261.5 263.7 279.9 269.5
Choa Chu Kang 266.1 280.6 281.0 277.3 268.3 267.3
Clementi 259.1 274.8 268.7 271.9 278.3 259.4
Jurong East 264.3 277.6 276.7 280.4 289.1 273.7
Jurong West 254.2 272.5 280.3 282.9 293.1 278.5
2005 2010 2014 2015 2016 2017
3-ROOM
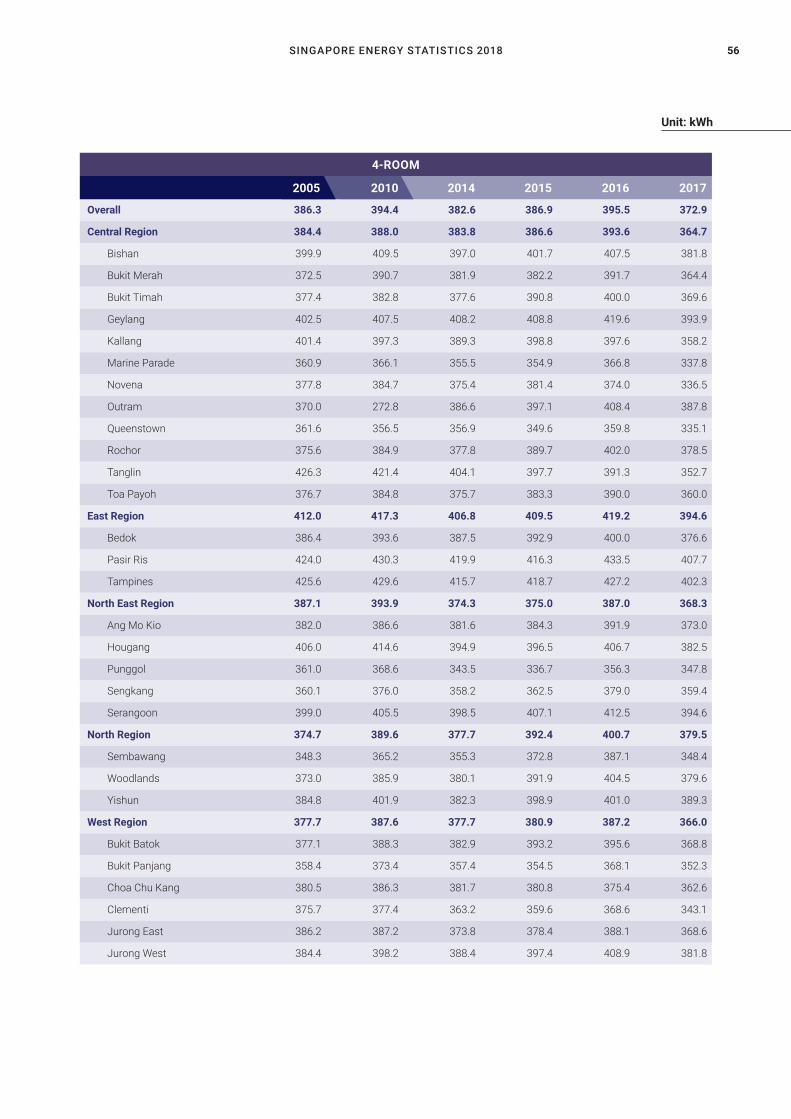
SINGAPORE ENERGY STATISTICS 2018 56
Unit: kWh
Overall 386.3 394.4 382.6 386.9 395.5 372.9
Central Region 384.4 388.0 383.8 386.6 393.6 364.7
Bishan 399.9 409.5 397.0 401.7 407.5 381.8
Bukit Merah 372.5 390.7 381.9 382.2 391.7 364.4
Bukit Timah 377.4 382.8 377.6 390.8 400.0 369.6
Geylang 402.5 407.5 408.2 408.8 419.6 393.9
Kallang 401.4 397.3 389.3 398.8 397.6 358.2
Marine Parade 360.9 366.1 355.5 354.9 366.8 337.8
Novena 377.8 384.7 375.4 381.4 374.0 336.5
Outram 370.0 272.8 386.6 397.1 408.4 387.8
Queenstown 361.6 356.5 356.9 349.6 359.8 335.1
Rochor 375.6 384.9 377.8 389.7 402.0 378.5
Tanglin 426.3 421.4 404.1 397.7 391.3 352.7
Toa Payoh 376.7 384.8 375.7 383.3 390.0 360.0
East Region 412.0 417.3 406.8 409.5 419.2 394.6
Bedok 386.4 393.6 387.5 392.9 400.0 376.6
Pasir Ris 424.0 430.3 419.9 416.3 433.5 407.7
Tampines 425.6 429.6 415.7 418.7 427.2 402.3
North East Region 387.1 393.9 374.3 375.0 387.0 368.3
Ang Mo Kio 382.0 386.6 381.6 384.3 391.9 373.0
Hougang 406.0 414.6 394.9 396.5 406.7 382.5
Punggol 361.0 368.6 343.5 336.7 356.3 347.8
Sengkang 360.1 376.0 358.2 362.5 379.0 359.4
Serangoon 399.0 405.5 398.5 407.1 412.5 394.6
North Region 374.7 389.6 377.7 392.4 400.7 379.5
Sembawang 348.3 365.2 355.3 372.8 387.1 348.4
Woodlands 373.0 385.9 380.1 391.9 404.5 379.6
Yishun 384.8 401.9 382.3 398.9 401.0 389.3
West Region 377.7 387.6 377.7 380.9 387.2 366.0
Bukit Batok 377.1 388.3 382.9 393.2 395.6 368.8
Bukit Panjang 358.4 373.4 357.4 354.5 368.1 352.3
Choa Chu Kang 380.5 386.3 381.7 380.8 375.4 362.6
Clementi 375.7 377.4 363.2 359.6 368.6 343.1
Jurong East 386.2 387.2 373.8 378.4 388.1 368.6
Jurong West 384.4 398.2 388.4 397.4 408.9 381.8
2005 2010 2014 2015 2016 2017
4-ROOM

ENERGY CONSUMPTION57
TABLE 3.6: AVERAGE MONTHLY ELECTRICITY CONSUMPTIONBY PLANNING AREA AND DWELLING TYPE (ANNUAL) (CONTINUED) Unit: kWh
2005 2010 2014 2015 2016 2017
5-ROOM / EXECUTIVE
Notes: a. Planning Areas refer to areas demarcated in the Urban Redevelopment Authority’s Master Plan 2008.
Source: Energy Market Authority (EMA)
Overall 473.3 482.4 468.7 475.1 484.5 453.9
Central Region 477.2 476.1 460.4 466.2 476.4 444.5
Bishan 508.7 506.8 476.2 483.0 489.5 458.1
Bukit Merah 438.4 457.1 446.3 450.3 465.1 431.2
Bukit Timah 492.2 481.1 461.7 462.9 472.1 445.0
Geylang 504.4 499.2 495.2 499.2 512.1 476.2
Kallang 467.6 472.8 457.9 468.3 471.9 438.0
Marine Parade 443.5 438.9 428.5 431.3 442.0 412.4
Novena 493.3 495.6 484.2 493.7 506.1 466.5
Outram 653.0 276.1 449.5 465.6 486.4 458.6
Queenstown 458.5 460.0 448.9 449.5 455.4 429.8
Rochor 490.1 494.1 491.1 505.5 541.1 493.5
Tanglin 512.8 492.8 438.8 446.5 447.6 418.0
Toa Payoh 489.3 486.3 450.1 458.7 469.7 441.1
East Region 522.7 519.2 504.9 511.1 521.1 488.7
Bedok 495.4 491.1 472.5 484.1 487.7 455.7
Pasir Ris 533.6 533.9 524.3 528.0 544.0 507.9
Tampines 530.5 524.4 509.2 513.9 523.3 493.3
North East Region 451.3 475.3 457.0 457.9 466.9 439.3
Ang Mo Kio 460.1 459.4 443.1 452.3 462.8 440.4
Hougang 502.3 510.1 491.4 493.5 502.7 469.4
Punggol 399.5 454.6 435.4 428.7 435.9 411.7
Sengkang 423.7 456.6 440.8 442.8 454.4 424.7
Serangoon 512.4 518.3 501.3 511.9 518.8 508.9
North Region 462.2 482.8 471.5 485.8 498.5 465.7
Sembawang 413.9 451.1 448.0 465.2 478.9 433.3
Woodlands 465.9 485.8 479.9 492.9 509.9 477.1
Yishun 499.9 508.4 474.2 488.9 491.0 470.4
West Region 461.3 466.6 457.2 464.4 471.9 442.2
Bukit Batok 480.1 481.7 467.5 481.9 483.7 443.0
Bukit Panjang 429.9 445.6 435.1 434.1 445.1 421.7
Choa Chu Kang 462.3 471.1 462.9 466.2 460.3 439.0
Clementi 478.7 469.9 448.6 448.8 451.2 417.9
Jurong East 469.7 459.5 446.7 454.2 467.5 434.7
Jurong West 466.6 470.9 465.2 478.1 493.8 459.4
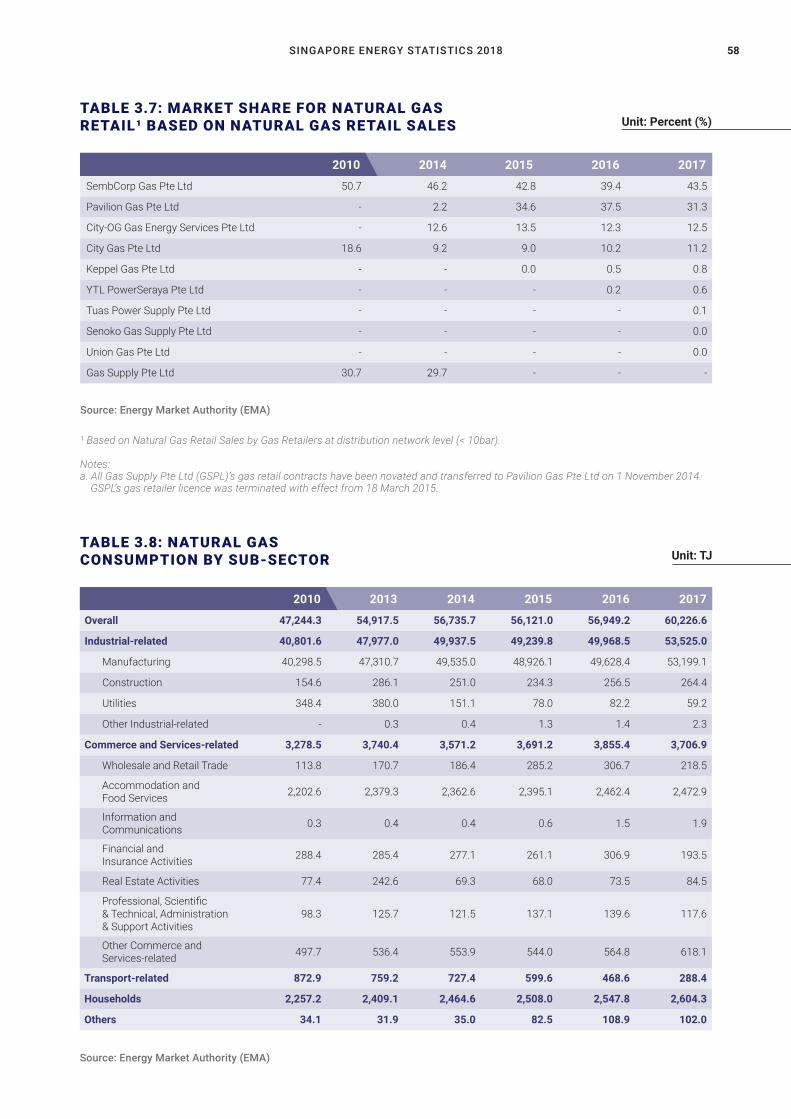
SINGAPORE ENERGY STATISTICS 2018 58
2014 2015 2016 2017
Unit: Percent (%)
SembCorp Gas Pte Ltd 50.7 46.2 42.8 39.4 43.5
Pavilion Gas Pte Ltd - 2.2 34.6 37.5 31.3
City-OG Gas Energy Services Pte Ltd - 12.6 13.5 12.3 12.5
City Gas Pte Ltd 18.6 9.2 9.0 10.2 11.2
Keppel Gas Pte Ltd - - 0.0 0.5 0.8
YTL PowerSeraya Pte Ltd - - - 0.2 0.6
Tuas Power Supply Pte Ltd - - - - 0.1
Senoko Gas Supply Pte Ltd - - - - 0.0
Union Gas Pte Ltd - - - - 0.0
Gas Supply Pte Ltd 30.7 29.7 - - -
TABLE 3.7: MARKET SHARE FOR NATURAL GAS RETAIL¹ BASED ON NATURAL GAS RETAIL SALES
TABLE 3.8: NATURAL GAS CONSUMPTION BY SUB-SECTOR
2010
¹ Based on Natural Gas Retail Sales by Gas Retailers at distribution network level (< 10bar).
Notes: a. All Gas Supply Pte Ltd (GSPL)’s gas retail contracts have been novated and transferred to Pavilion Gas Pte Ltd on 1 November 2014. GSPL’s gas retailer licence was terminated with effect from 18 March 2015.
Source: Energy Market Authority (EMA)
Unit: TJ
2014 2015 2016 2017
Source: Energy Market Authority (EMA)
Overall 47,244.3 54,917.5 56,735.7 56,121.0 56,949.2 60,226.6
Industrial-related 40,801.6 47,977.0 49,937.5 49,239.8 49,968.5 53,525.0
Manufacturing 40,298.5 47,310.7 49,535.0 48,926.1 49,628.4 53,199.1
Construction 154.6 286.1 251.0 234.3 256.5 264.4
Utilities 348.4 380.0 151.1 78.0 82.2 59.2
Other Industrial-related - 0.3 0.4 1.3 1.4 2.3
Commerce and Services-related 3,278.5 3,740.4 3,571.2 3,691.2 3,855.4 3,706.9
Wholesale and Retail Trade 113.8 170.7 186.4 285.2 306.7 218.5
Accommodation and Food Services 2,202.6 2,379.3 2,362.6 2,395.1 2,462.4 2,472.9
Information and Communications 0.3 0.4 0.4 0.6 1.5 1.9
Financial and Insurance Activities 288.4 285.4 277.1 261.1 306.9 193.5
Real Estate Activities 77.4 242.6 69.3 68.0 73.5 84.5
Professional, Scientific & Technical, Administration & Support Activities
98.3 125.7 121.5 137.1 139.6 117.6
Other Commerce and Services-related 497.7 536.4 553.9 544.0 564.8 618.1
Transport-related 872.9 759.2 727.4 599.6 468.6 288.4
Households 2,257.2 2,409.1 2,464.6 2,508.0 2,547.8 2,604.3
Others 34.1 31.9 35.0 82.5 108.9 102.0
20132010
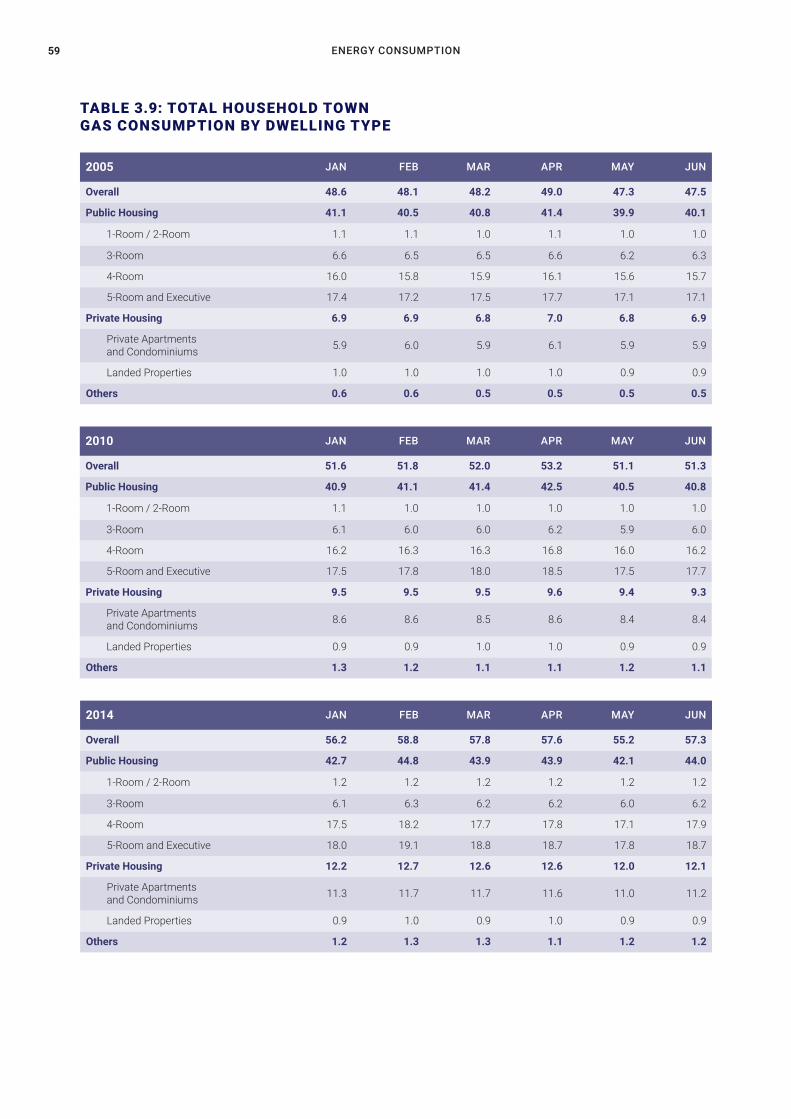
ENERGY CONSUMPTION59
TABLE 3.9: TOTAL HOUSEHOLD TOWN GAS CONSUMPTION BY DWELLING TYPE
2005 JAN FEB MAR APR MAY JUN
Overall 48.6 48.1 48.2 49.0 47.3 47.5
Public Housing 41.1 40.5 40.8 41.4 39.9 40.1
1-Room / 2-Room 1.1 1.1 1.0 1.1 1.0 1.0
3-Room 6.6 6.5 6.5 6.6 6.2 6.3
4-Room 16.0 15.8 15.9 16.1 15.6 15.7
5-Room and Executive 17.4 17.2 17.5 17.7 17.1 17.1
Private Housing 6.9 6.9 6.8 7.0 6.8 6.9
Private Apartments and Condominiums 5.9 6.0 5.9 6.1 5.9 5.9
Landed Properties 1.0 1.0 1.0 1.0 0.9 0.9
Others 0.6 0.6 0.5 0.5 0.5 0.5
2010 JAN FEB MAR APR MAY JUN
Overall 51.6 51.8 52.0 53.2 51.1 51.3
Public Housing 40.9 41.1 41.4 42.5 40.5 40.8
1-Room / 2-Room 1.1 1.0 1.0 1.0 1.0 1.0
3-Room 6.1 6.0 6.0 6.2 5.9 6.0
4-Room 16.2 16.3 16.3 16.8 16.0 16.2
5-Room and Executive 17.5 17.8 18.0 18.5 17.5 17.7
Private Housing 9.5 9.5 9.5 9.6 9.4 9.3
Private Apartments and Condominiums 8.6 8.6 8.5 8.6 8.4 8.4
Landed Properties 0.9 0.9 1.0 1.0 0.9 0.9
Others 1.3 1.2 1.1 1.1 1.2 1.1
2014 JAN FEB MAR APR MAY JUN
Overall 56.2 58.8 57.8 57.6 55.2 57.3
Public Housing 42.7 44.8 43.9 43.9 42.1 44.0
1-Room / 2-Room 1.2 1.2 1.2 1.2 1.2 1.2
3-Room 6.1 6.3 6.2 6.2 6.0 6.2
4-Room 17.5 18.2 17.7 17.8 17.1 17.9
5-Room and Executive 18.0 19.1 18.8 18.7 17.8 18.7
Private Housing 12.2 12.7 12.6 12.6 12.0 12.1
Private Apartments and Condominiums 11.3 11.7 11.7 11.6 11.0 11.2
Landed Properties 0.9 1.0 0.9 1.0 0.9 0.9
Others 1.2 1.3 1.3 1.1 1.2 1.2
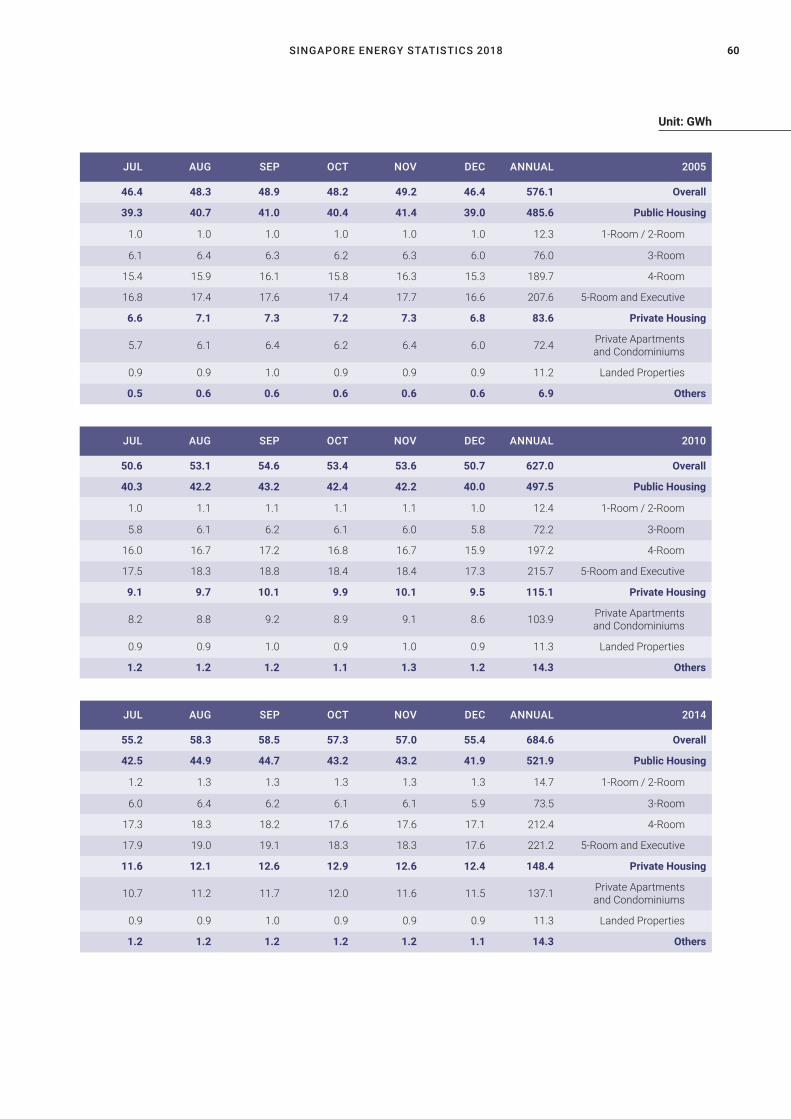
SINGAPORE ENERGY STATISTICS 2018 60
Unit: GWh
JUL AUG SEP OCT NOV DEC ANNUAL 2005
46.4 48.3 48.9 48.2 49.2 46.4 576.1 Overall
39.3 40.7 41.0 40.4 41.4 39.0 485.6 Public Housing
1.0 1.0 1.0 1.0 1.0 1.0 12.3 1-Room / 2-Room
6.1 6.4 6.3 6.2 6.3 6.0 76.0 3-Room
15.4 15.9 16.1 15.8 16.3 15.3 189.7 4-Room
16.8 17.4 17.6 17.4 17.7 16.6 207.6 5-Room and Executive
6.6 7.1 7.3 7.2 7.3 6.8 83.6 Private Housing
5.7 6.1 6.4 6.2 6.4 6.0 72.4 Private Apartments and Condominiums
0.9 0.9 1.0 0.9 0.9 0.9 11.2 Landed Properties
0.5 0.6 0.6 0.6 0.6 0.6 6.9 Others
JUL AUG SEP OCT NOV DEC ANNUAL 2010
50.6 53.1 54.6 53.4 53.6 50.7 627.0 Overall
40.3 42.2 43.2 42.4 42.2 40.0 497.5 Public Housing
1.0 1.1 1.1 1.1 1.1 1.0 12.4 1-Room / 2-Room
5.8 6.1 6.2 6.1 6.0 5.8 72.2 3-Room
16.0 16.7 17.2 16.8 16.7 15.9 197.2 4-Room
17.5 18.3 18.8 18.4 18.4 17.3 215.7 5-Room and Executive
9.1 9.7 10.1 9.9 10.1 9.5 115.1 Private Housing
8.2 8.8 9.2 8.9 9.1 8.6 103.9 Private Apartments and Condominiums
0.9 0.9 1.0 0.9 1.0 0.9 11.3 Landed Properties
1.2 1.2 1.2 1.1 1.3 1.2 14.3 Others
JUL AUG SEP OCT NOV DEC ANNUAL 2014
55.2 58.3 58.5 57.3 57.0 55.4 684.6 Overall
42.5 44.9 44.7 43.2 43.2 41.9 521.9 Public Housing
1.2 1.3 1.3 1.3 1.3 1.3 14.7 1-Room / 2-Room
6.0 6.4 6.2 6.1 6.1 5.9 73.5 3-Room
17.3 18.3 18.2 17.6 17.6 17.1 212.4 4-Room
17.9 19.0 19.1 18.3 18.3 17.6 221.2 5-Room and Executive
11.6 12.1 12.6 12.9 12.6 12.4 148.4 Private Housing
10.7 11.2 11.7 12.0 11.6 11.5 137.1 Private Apartments and Condominiums
0.9 0.9 1.0 0.9 0.9 0.9 11.3 Landed Properties
1.2 1.2 1.2 1.2 1.2 1.1 14.3 Others
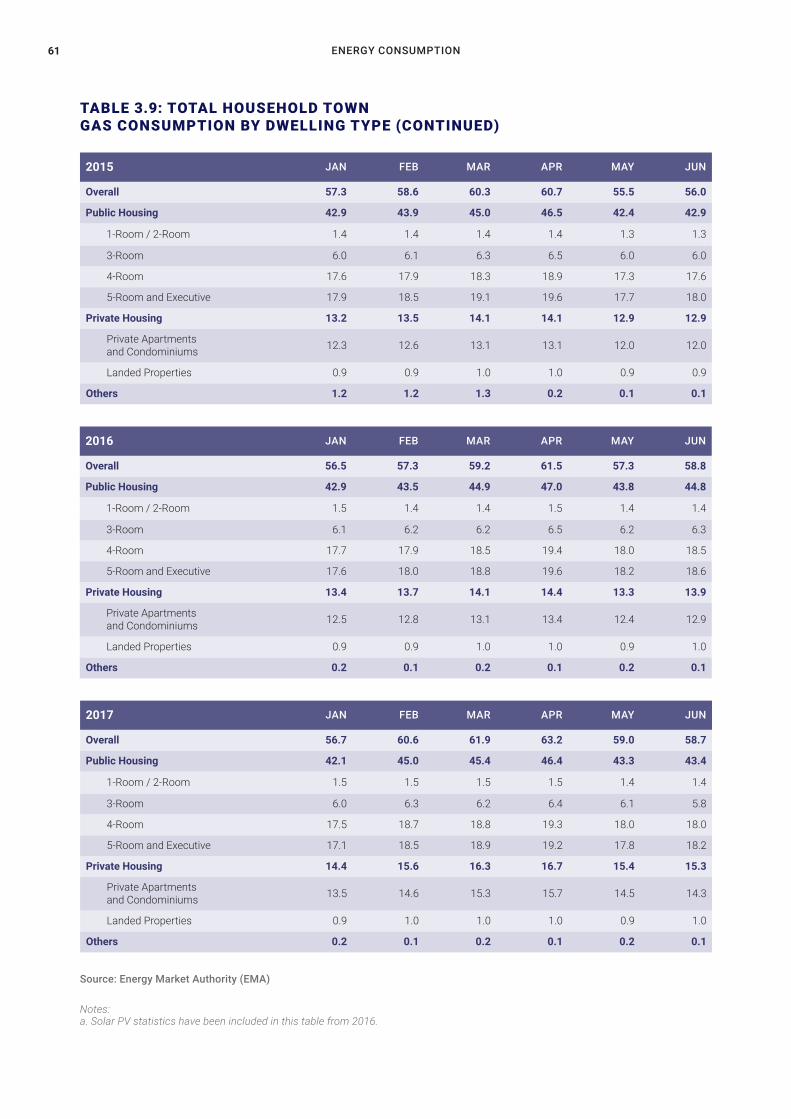
ENERGY CONSUMPTION61
TABLE 3.9: TOTAL HOUSEHOLD TOWN GAS CONSUMPTION BY DWELLING TYPE (CONTINUED)
2015 JAN FEB MAR APR MAY JUN
Overall 57.3 58.6 60.3 60.7 55.5 56.0
Public Housing 42.9 43.9 45.0 46.5 42.4 42.9
1-Room / 2-Room 1.4 1.4 1.4 1.4 1.3 1.3
3-Room 6.0 6.1 6.3 6.5 6.0 6.0
4-Room 17.6 17.9 18.3 18.9 17.3 17.6
5-Room and Executive 17.9 18.5 19.1 19.6 17.7 18.0
Private Housing 13.2 13.5 14.1 14.1 12.9 12.9
Private Apartments and Condominiums 12.3 12.6 13.1 13.1 12.0 12.0
Landed Properties 0.9 0.9 1.0 1.0 0.9 0.9
Others 1.2 1.2 1.3 0.2 0.1 0.1
2016 JAN FEB MAR APR MAY JUN
Overall 56.5 57.3 59.2 61.5 57.3 58.8
Public Housing 42.9 43.5 44.9 47.0 43.8 44.8
1-Room / 2-Room 1.5 1.4 1.4 1.5 1.4 1.4
3-Room 6.1 6.2 6.2 6.5 6.2 6.3
4-Room 17.7 17.9 18.5 19.4 18.0 18.5
5-Room and Executive 17.6 18.0 18.8 19.6 18.2 18.6
Private Housing 13.4 13.7 14.1 14.4 13.3 13.9
Private Apartments and Condominiums 12.5 12.8 13.1 13.4 12.4 12.9
Landed Properties 0.9 0.9 1.0 1.0 0.9 1.0
Others 0.2 0.1 0.2 0.1 0.2 0.1
2017 JAN FEB MAR APR MAY JUN
Overall 56.7 60.6 61.9 63.2 59.0 58.7
Public Housing 42.1 45.0 45.4 46.4 43.3 43.4
1-Room / 2-Room 1.5 1.5 1.5 1.5 1.4 1.4
3-Room 6.0 6.3 6.2 6.4 6.1 5.8
4-Room 17.5 18.7 18.8 19.3 18.0 18.0
5-Room and Executive 17.1 18.5 18.9 19.2 17.8 18.2
Private Housing 14.4 15.6 16.3 16.7 15.4 15.3
Private Apartments and Condominiums 13.5 14.6 15.3 15.7 14.5 14.3
Landed Properties 0.9 1.0 1.0 1.0 0.9 1.0
Others 0.2 0.1 0.2 0.1 0.2 0.1
Notes: a. Solar PV statistics have been included in this table from 2016.
Source: Energy Market Authority (EMA)
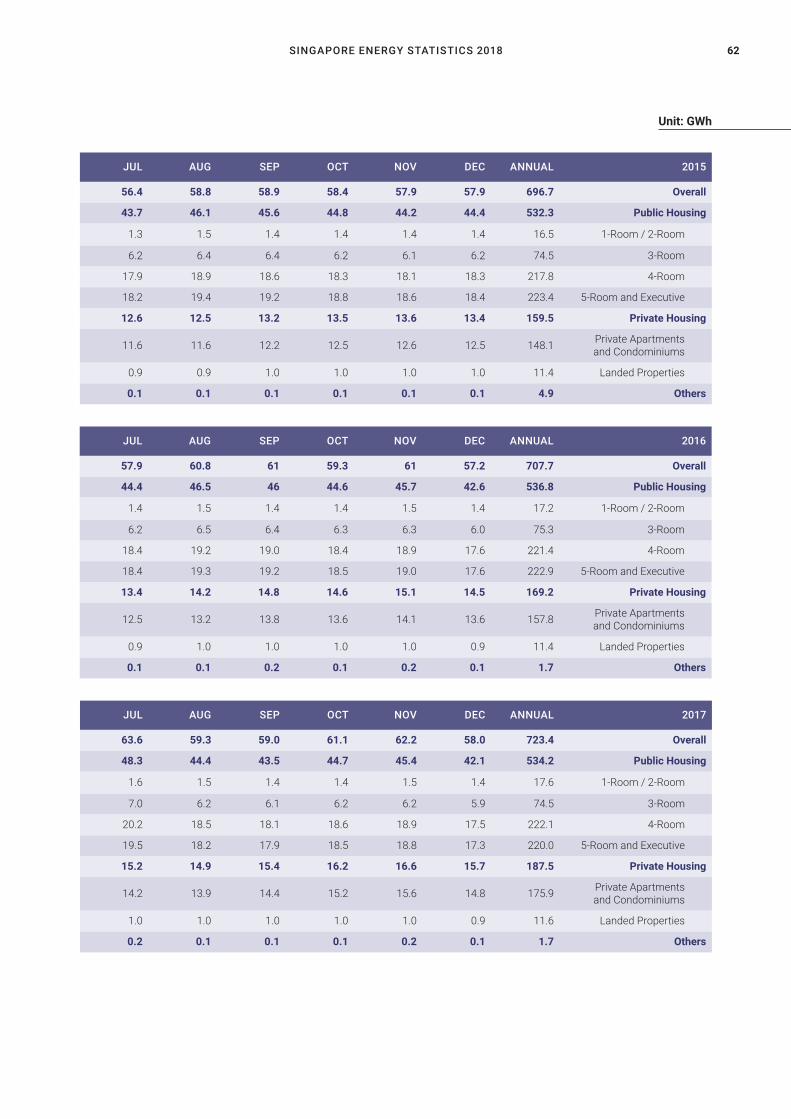
SINGAPORE ENERGY STATISTICS 2018 62
Unit: GWh
JUL AUG SEP OCT NOV DEC ANNUAL 2015
56.4 58.8 58.9 58.4 57.9 57.9 696.7 Overall
43.7 46.1 45.6 44.8 44.2 44.4 532.3 Public Housing
1.3 1.5 1.4 1.4 1.4 1.4 16.5 1-Room / 2-Room
6.2 6.4 6.4 6.2 6.1 6.2 74.5 3-Room
17.9 18.9 18.6 18.3 18.1 18.3 217.8 4-Room
18.2 19.4 19.2 18.8 18.6 18.4 223.4 5-Room and Executive
12.6 12.5 13.2 13.5 13.6 13.4 159.5 Private Housing
11.6 11.6 12.2 12.5 12.6 12.5 148.1 Private Apartments and Condominiums
0.9 0.9 1.0 1.0 1.0 1.0 11.4 Landed Properties
0.1 0.1 0.1 0.1 0.1 0.1 4.9 Others
JUL AUG SEP OCT NOV DEC ANNUAL 2016
57.9 60.8 61 59.3 61 57.2 707.7 Overall
44.4 46.5 46 44.6 45.7 42.6 536.8 Public Housing
1.4 1.5 1.4 1.4 1.5 1.4 17.2 1-Room / 2-Room
6.2 6.5 6.4 6.3 6.3 6.0 75.3 3-Room
18.4 19.2 19.0 18.4 18.9 17.6 221.4 4-Room
18.4 19.3 19.2 18.5 19.0 17.6 222.9 5-Room and Executive
13.4 14.2 14.8 14.6 15.1 14.5 169.2 Private Housing
12.5 13.2 13.8 13.6 14.1 13.6 157.8 Private Apartments and Condominiums
0.9 1.0 1.0 1.0 1.0 0.9 11.4 Landed Properties
0.1 0.1 0.2 0.1 0.2 0.1 1.7 Others
JUL AUG SEP OCT NOV DEC ANNUAL 2017
63.6 59.3 59.0 61.1 62.2 58.0 723.4 Overall
48.3 44.4 43.5 44.7 45.4 42.1 534.2 Public Housing
1.6 1.5 1.4 1.4 1.5 1.4 17.6 1-Room / 2-Room
7.0 6.2 6.1 6.2 6.2 5.9 74.5 3-Room
20.2 18.5 18.1 18.6 18.9 17.5 222.1 4-Room
19.5 18.2 17.9 18.5 18.8 17.3 220.0 5-Room and Executive
15.2 14.9 15.4 16.2 16.6 15.7 187.5 Private Housing
14.2 13.9 14.4 15.2 15.6 14.8 175.9 Private Apartments and Condominiums
1.0 1.0 1.0 1.0 1.0 0.9 11.6 Landed Properties
0.2 0.1 0.1 0.1 0.2 0.1 1.7 Others
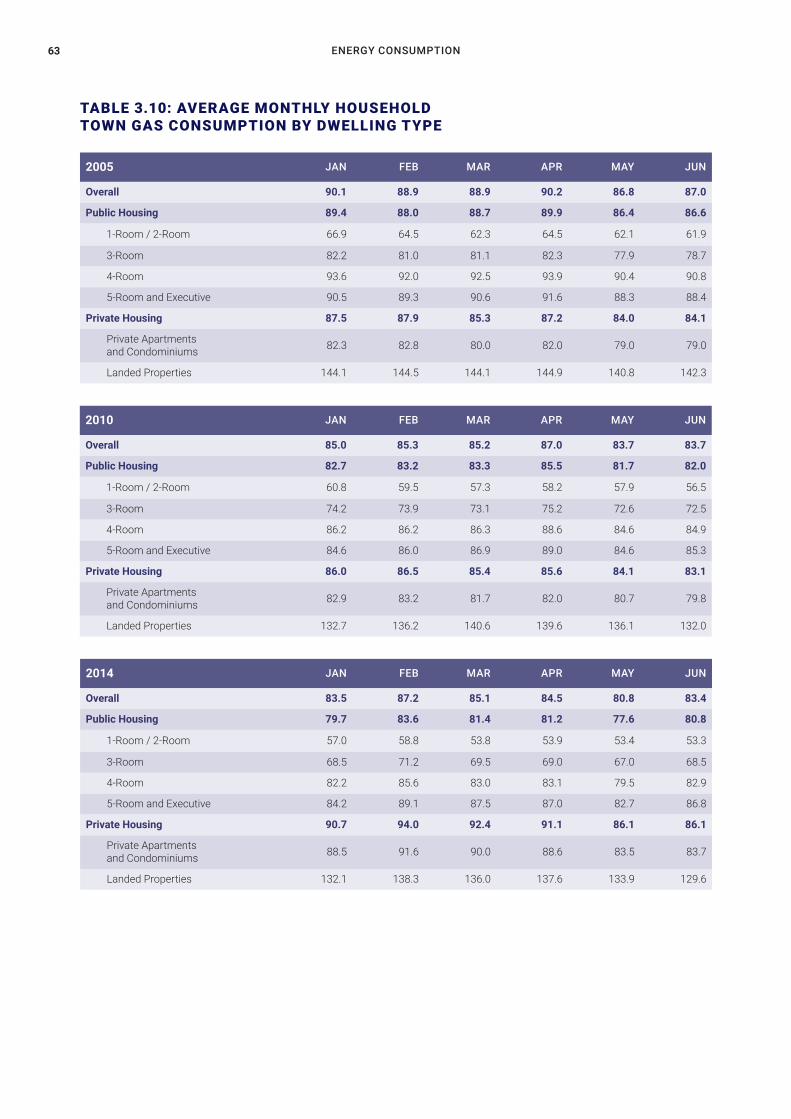
ENERGY CONSUMPTION63
TABLE 3.10: AVERAGE MONTHLY HOUSEHOLD TOWN GAS CONSUMPTION BY DWELLING TYPE
2005 JAN FEB MAR APR MAY JUN
Overall 90.1 88.9 88.9 90.2 86.8 87.0
Public Housing 89.4 88.0 88.7 89.9 86.4 86.6
1-Room / 2-Room 66.9 64.5 62.3 64.5 62.1 61.9
3-Room 82.2 81.0 81.1 82.3 77.9 78.7
4-Room 93.6 92.0 92.5 93.9 90.4 90.8
5-Room and Executive 90.5 89.3 90.6 91.6 88.3 88.4
Private Housing 87.5 87.9 85.3 87.2 84.0 84.1
Private Apartments and Condominiums 82.3 82.8 80.0 82.0 79.0 79.0
Landed Properties 144.1 144.5 144.1 144.9 140.8 142.3
2010 JAN FEB MAR APR MAY JUN
Overall 85.0 85.3 85.2 87.0 83.7 83.7
Public Housing 82.7 83.2 83.3 85.5 81.7 82.0
1-Room / 2-Room 60.8 59.5 57.3 58.2 57.9 56.5
3-Room 74.2 73.9 73.1 75.2 72.6 72.5
4-Room 86.2 86.2 86.3 88.6 84.6 84.9
5-Room and Executive 84.6 86.0 86.9 89.0 84.6 85.3
Private Housing 86.0 86.5 85.4 85.6 84.1 83.1
Private Apartments and Condominiums 82.9 83.2 81.7 82.0 80.7 79.8
Landed Properties 132.7 136.2 140.6 139.6 136.1 132.0
2014 JAN FEB MAR APR MAY JUN
Overall 83.5 87.2 85.1 84.5 80.8 83.4
Public Housing 79.7 83.6 81.4 81.2 77.6 80.8
1-Room / 2-Room 57.0 58.8 53.8 53.9 53.4 53.3
3-Room 68.5 71.2 69.5 69.0 67.0 68.5
4-Room 82.2 85.6 83.0 83.1 79.5 82.9
5-Room and Executive 84.2 89.1 87.5 87.0 82.7 86.8
Private Housing 90.7 94.0 92.4 91.1 86.1 86.1
Private Apartments and Condominiums 88.5 91.6 90.0 88.6 83.5 83.7
Landed Properties 132.1 138.3 136.0 137.6 133.9 129.6

SINGAPORE ENERGY STATISTICS 2018 64
Unit: kWh
JUL AUG SEP OCT NOV DEC ANNUAL 2005
84.8 88.1 88.9 87.5 89.1 83.7 87.8 Overall
84.8 87.6 88.3 86.9 88.8 83.5 87.4 Public Housing
60.2 62.1 61.8 60.6 62.1 61.3 62.5 1-Room / 2-Room
77.1 79.9 79.8 78.8 79.6 76.1 79.5 3-Room
89.0 91.7 92.4 90.9 93.4 87.6 91.5 4-Room
86.3 89.3 90.3 88.9 90.6 84.6 89.1 5-Room and Executive
80.2 85.1 87.4 85.3 85.9 79.7 84.9 Private Housing
75.3 80.0 82.5 80.4 81.2 75.4 80.0 Private Apartments and Condominiums
137.3 143.9 144.4 142.1 140.7 131.8 141.8 Landed Properties
JUL AUG SEP OCT NOV DEC ANNUAL 2010
82.3 86.4 88.9 86.7 87.1 81.7 85.3 Overall
80.8 84.6 86.8 84.9 84.7 79.8 83.3 Public Housing
55.6 59.4 59.3 61.4 59.6 56.2 58.5 1-Room / 2-Room
70.9 74.3 75.1 73.7 73.0 69.7 73.2 3-Room
84.0 87.6 90.1 87.9 87.7 82.8 86.4 4-Room
83.9 88.0 90.8 88.7 88.8 83.1 86.6 5-Room and Executive
80.2 85.6 89.0 86.5 88.2 82.2 85.2 Private Housing
76.9 82.5 85.7 83.3 84.9 79.3 81.9 Private Apartments and Condominiums
129.8 133.3 139.5 134.5 139.2 125.9 134.9 Landed Properties
JUL AUG SEP OCT NOV DEC ANNUAL 2014
80.2 84.2 84.3 82.1 81.4 78.7 82.9 Overall
78.1 82.2 81.6 78.4 78.3 75.6 79.9 Public Housing
53.0 55.8 54.9 52.8 54.5 52.5 54.4 1-Room / 2-Room
67.2 70.2 68.3 66.5 66.5 64.8 68.1 3-Room
80.2 84.1 83.4 80.2 79.9 77.4 81.8 4-Room
83.2 87.9 88.2 84.4 84.2 80.8 85.5 5-Room and Executive
81.7 85.2 88.3 89.5 86.7 84.5 88.0 Private Housing
79.2 82.8 85.9 87.2 84.4 82.3 85.6 Private Apartments and Condominiums
129.1 131.4 134.8 133.7 132.3 127.6 133.0 Landed Properties
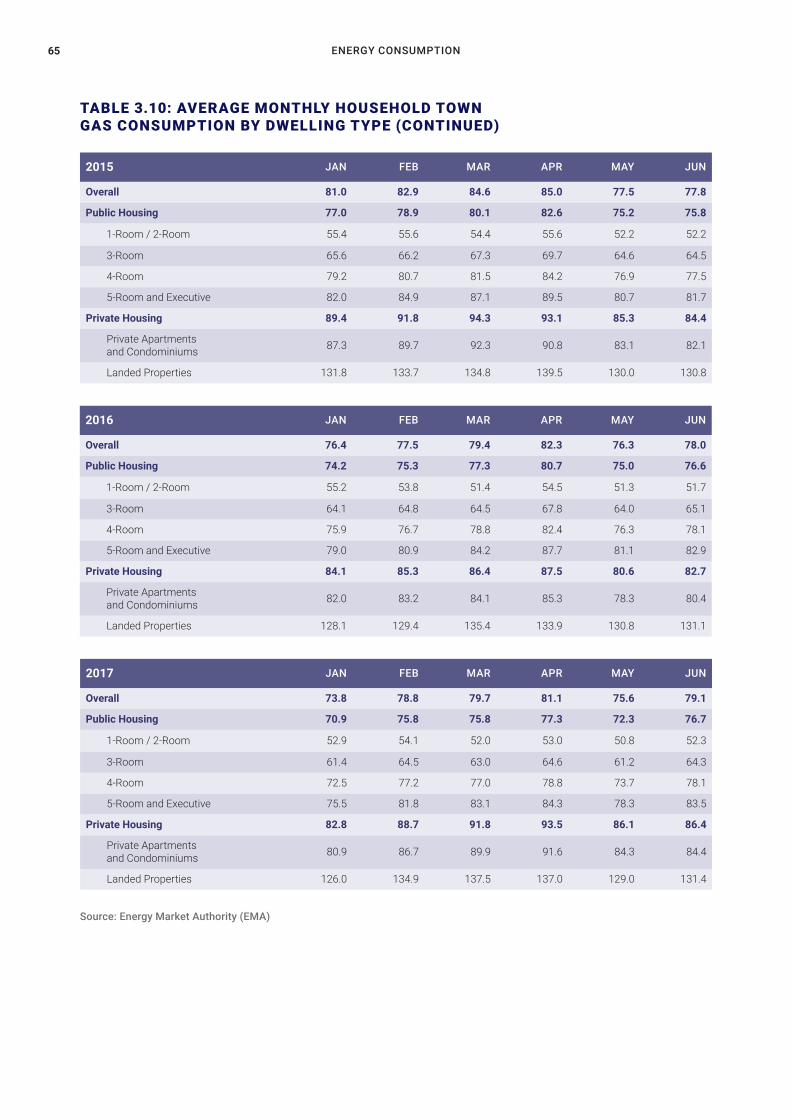
ENERGY CONSUMPTION65
TABLE 3.10: AVERAGE MONTHLY HOUSEHOLD TOWN GAS CONSUMPTION BY DWELLING TYPE (CONTINUED)
2015 JAN FEB MAR APR MAY JUN
Overall 81.0 82.9 84.6 85.0 77.5 77.8
Public Housing 77.0 78.9 80.1 82.6 75.2 75.8
1-Room / 2-Room 55.4 55.6 54.4 55.6 52.2 52.2
3-Room 65.6 66.2 67.3 69.7 64.6 64.5
4-Room 79.2 80.7 81.5 84.2 76.9 77.5
5-Room and Executive 82.0 84.9 87.1 89.5 80.7 81.7
Private Housing 89.4 91.8 94.3 93.1 85.3 84.4
Private Apartments and Condominiums 87.3 89.7 92.3 90.8 83.1 82.1
Landed Properties 131.8 133.7 134.8 139.5 130.0 130.8
2016 JAN FEB MAR APR MAY JUN
Overall 76.4 77.5 79.4 82.3 76.3 78.0
Public Housing 74.2 75.3 77.3 80.7 75.0 76.6
1-Room / 2-Room 55.2 53.8 51.4 54.5 51.3 51.7
3-Room 64.1 64.8 64.5 67.8 64.0 65.1
4-Room 75.9 76.7 78.8 82.4 76.3 78.1
5-Room and Executive 79.0 80.9 84.2 87.7 81.1 82.9
Private Housing 84.1 85.3 86.4 87.5 80.6 82.7
Private Apartments and Condominiums 82.0 83.2 84.1 85.3 78.3 80.4
Landed Properties 128.1 129.4 135.4 133.9 130.8 131.1
2017 JAN FEB MAR APR MAY JUN
Overall 73.8 78.8 79.7 81.1 75.6 79.1
Public Housing 70.9 75.8 75.8 77.3 72.3 76.7
1-Room / 2-Room 52.9 54.1 52.0 53.0 50.8 52.3
3-Room 61.4 64.5 63.0 64.6 61.2 64.3
4-Room 72.5 77.2 77.0 78.8 73.7 78.1
5-Room and Executive 75.5 81.8 83.1 84.3 78.3 83.5
Private Housing 82.8 88.7 91.8 93.5 86.1 86.4
Private Apartments and Condominiums 80.9 86.7 89.9 91.6 84.3 84.4
Landed Properties 126.0 134.9 137.5 137.0 129.0 131.4
Source: Energy Market Authority (EMA)
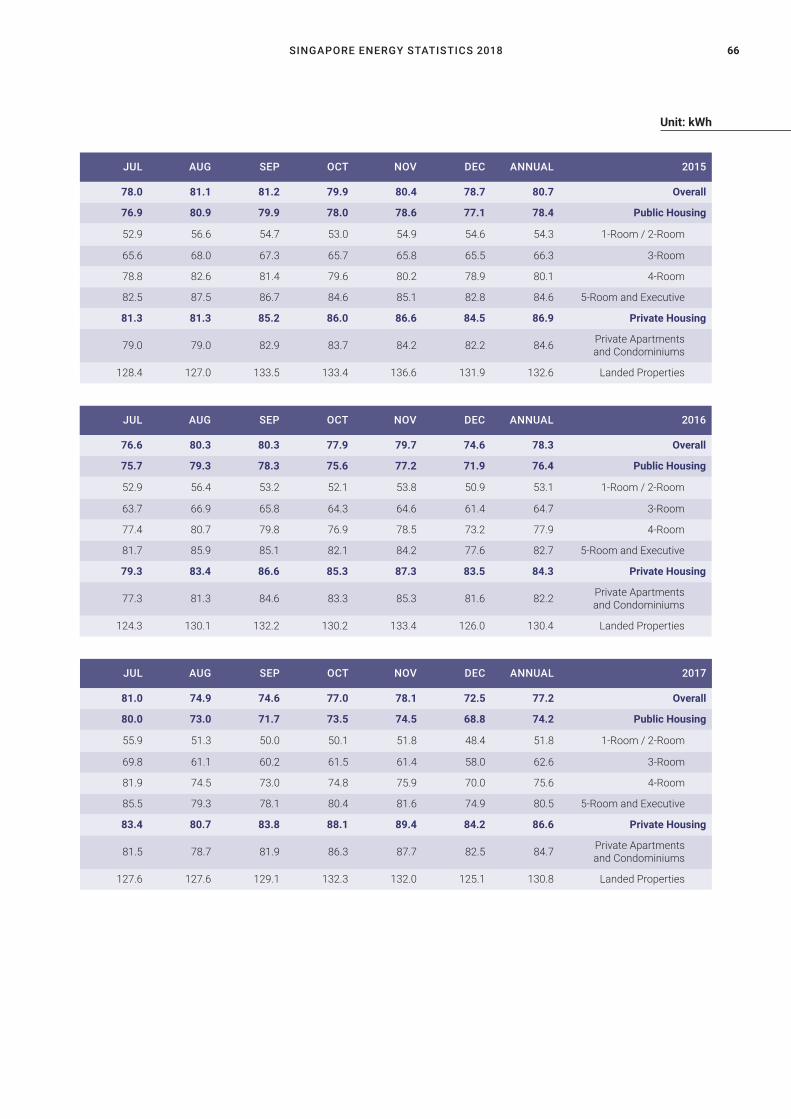
SINGAPORE ENERGY STATISTICS 2018 66
Unit: kWh
JUL AUG SEP OCT NOV DEC ANNUAL 2015
78.0 81.1 81.2 79.9 80.4 78.7 80.7 Overall
76.9 80.9 79.9 78.0 78.6 77.1 78.4 Public Housing
52.9 56.6 54.7 53.0 54.9 54.6 54.3 1-Room / 2-Room
65.6 68.0 67.3 65.7 65.8 65.5 66.3 3-Room
78.8 82.6 81.4 79.6 80.2 78.9 80.1 4-Room
82.5 87.5 86.7 84.6 85.1 82.8 84.6 5-Room and Executive
81.3 81.3 85.2 86.0 86.6 84.5 86.9 Private Housing
79.0 79.0 82.9 83.7 84.2 82.2 84.6 Private Apartments and Condominiums
128.4 127.0 133.5 133.4 136.6 131.9 132.6 Landed Properties
JUL AUG SEP OCT NOV DEC ANNUAL 2016
76.6 80.3 80.3 77.9 79.7 74.6 78.3 Overall
75.7 79.3 78.3 75.6 77.2 71.9 76.4 Public Housing
52.9 56.4 53.2 52.1 53.8 50.9 53.1 1-Room / 2-Room
63.7 66.9 65.8 64.3 64.6 61.4 64.7 3-Room
77.4 80.7 79.8 76.9 78.5 73.2 77.9 4-Room
81.7 85.9 85.1 82.1 84.2 77.6 82.7 5-Room and Executive
79.3 83.4 86.6 85.3 87.3 83.5 84.3 Private Housing
77.3 81.3 84.6 83.3 85.3 81.6 82.2 Private Apartments and Condominiums
124.3 130.1 132.2 130.2 133.4 126.0 130.4 Landed Properties
JUL AUG SEP OCT NOV DEC ANNUAL 2017
81.0 74.9 74.6 77.0 78.1 72.5 77.2 Overall
80.0 73.0 71.7 73.5 74.5 68.8 74.2 Public Housing
55.9 51.3 50.0 50.1 51.8 48.4 51.8 1-Room / 2-Room
69.8 61.1 60.2 61.5 61.4 58.0 62.6 3-Room
81.9 74.5 73.0 74.8 75.9 70.0 75.6 4-Room
85.5 79.3 78.1 80.4 81.6 74.9 80.5 5-Room and Executive
83.4 80.7 83.8 88.1 89.4 84.2 86.6 Private Housing
81.5 78.7 81.9 86.3 87.7 82.5 84.7 Private Apartments and Condominiums
127.6 127.6 129.1 132.3 132.0 125.1 130.8 Landed Properties
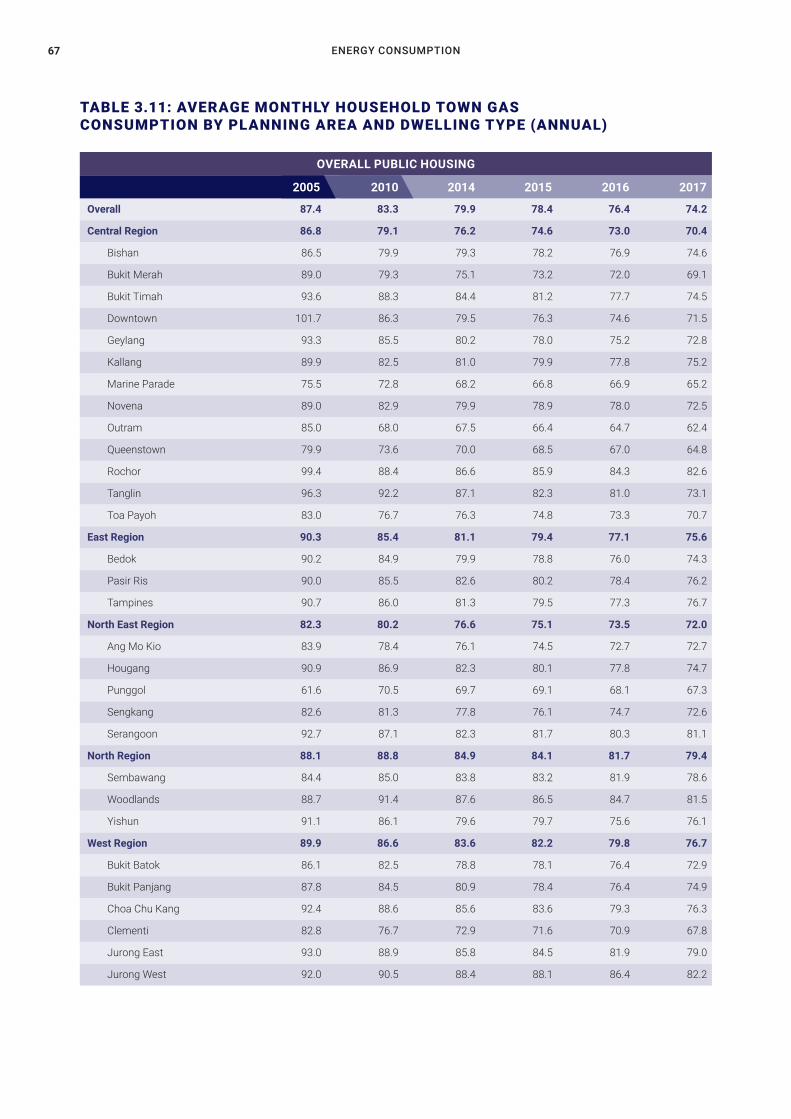
ENERGY CONSUMPTION67
TABLE 3.11: AVERAGE MONTHLY HOUSEHOLD TOWN GAS CONSUMPTION BY PLANNING AREA AND DWELLING TYPE (ANNUAL)
Overall 87.4 83.3 79.9 78.4 76.4 74.2
Central Region 86.8 79.1 76.2 74.6 73.0 70.4
Bishan 86.5 79.9 79.3 78.2 76.9 74.6
Bukit Merah 89.0 79.3 75.1 73.2 72.0 69.1
Bukit Timah 93.6 88.3 84.4 81.2 77.7 74.5
Downtown 101.7 86.3 79.5 76.3 74.6 71.5
Geylang 93.3 85.5 80.2 78.0 75.2 72.8
Kallang 89.9 82.5 81.0 79.9 77.8 75.2
Marine Parade 75.5 72.8 68.2 66.8 66.9 65.2
Novena 89.0 82.9 79.9 78.9 78.0 72.5
Outram 85.0 68.0 67.5 66.4 64.7 62.4
Queenstown 79.9 73.6 70.0 68.5 67.0 64.8
Rochor 99.4 88.4 86.6 85.9 84.3 82.6
Tanglin 96.3 92.2 87.1 82.3 81.0 73.1
Toa Payoh 83.0 76.7 76.3 74.8 73.3 70.7
East Region 90.3 85.4 81.1 79.4 77.1 75.6
Bedok 90.2 84.9 79.9 78.8 76.0 74.3
Pasir Ris 90.0 85.5 82.6 80.2 78.4 76.2
Tampines 90.7 86.0 81.3 79.5 77.3 76.7
North East Region 82.3 80.2 76.6 75.1 73.5 72.0
Ang Mo Kio 83.9 78.4 76.1 74.5 72.7 72.7
Hougang 90.9 86.9 82.3 80.1 77.8 74.7
Punggol 61.6 70.5 69.7 69.1 68.1 67.3
Sengkang 82.6 81.3 77.8 76.1 74.7 72.6
Serangoon 92.7 87.1 82.3 81.7 80.3 81.1
North Region 88.1 88.8 84.9 84.1 81.7 79.4
Sembawang 84.4 85.0 83.8 83.2 81.9 78.6
Woodlands 88.7 91.4 87.6 86.5 84.7 81.5
Yishun 91.1 86.1 79.6 79.7 75.6 76.1
West Region 89.9 86.6 83.6 82.2 79.8 76.7
Bukit Batok 86.1 82.5 78.8 78.1 76.4 72.9
Bukit Panjang 87.8 84.5 80.9 78.4 76.4 74.9
Choa Chu Kang 92.4 88.6 85.6 83.6 79.3 76.3
Clementi 82.8 76.7 72.9 71.6 70.9 67.8
Jurong East 93.0 88.9 85.8 84.5 81.9 79.0
Jurong West 92.0 90.5 88.4 88.1 86.4 82.2
2005 2010 2014 2015 2016 2017
OVERALL PUBLIC HOUSING

SINGAPORE ENERGY STATISTICS 2018 68
Unit: kWh
Overall 62.5 58.5 54.4 54.3 53.1 51.8
Central Region 63.1 58.1 54.5 53.0 51.9 50.3
Bishan 53.1 49.3 53.8 50.6 50.5 48.5
Bukit Merah 63.5 59.0 55.7 53.8 52.6 50.9
Bukit Timah - - - - - 29.4
Downtown - - - - - -
Geylang 68.3 61.9 57.3 56.9 54.8 54.0
Kallang 59.0 53.8 50.3 48.7 46.7 46.9
Marine Parade 70.5 65.2 61.2 58.8 59.3 60.0
Novena 65.6 63.4 61.2 61.7 63.6 57.0
Outram 65.6 57.8 51.5 51.1 49.2 47.2
Queenstown 60.9 57.0 53.7 52.7 53.1 50.5
Rochor 66.3 57.9 55.7 62.0 54.7 56.4
Tanglin - - - - - -
Toa Payoh 61.2 56.1 52.8 51.0 50.4 48.2
East Region 59.9 59.5 52.2 53.4 51.1 52.7
Bedok 59.0 59.5 51.8 51.0 48.5 49.7
Pasir Ris 50.8 47.0 50.1 58.6 53.1 52.6
Tampines 67.0 60.3 54.0 56.6 55.6 58.7
North East Region 60.4 59.4 54.2 55.1 53.4 51.3
Ang Mo Kio 60.2 60.1 54.6 54.6 52.7 52.5
Hougang 64.5 64.4 68.4 67.4 62.7 52.1
Punggol - s 54.3 54.1 53.3 53.2
Sengkang - 42.6 46.0 50.8 50.0 48.4
Serangoon 60.4 57.6 53.7 52.8 53.4 42.5
North Region 52.8 52.8 57.2 59.0 58.5 56.6
Sembawang - - 45.5 46.7 44.3 37.2
Woodlands - - 64.1 61.9 63.9 62.6
Yishun 52.8 52.8 53.2 58.8 55.7 55.8
West Region 65.0 63.2 55.1 57.9 56.4 55.6
Bukit Batok - - 47.2 54.8 54.7 54.3
Bukit Panjang - - 47.7 58.9 61.2 62.5
Choa Chu Kang 74.4 90.8 56.5 56.3 54.2 53.5
Clementi 63.2 59.5 53.4 55.4 52.4 49.7
Jurong East 65.4 59.0 57.1 52.0 48.7 48.3
Jurong West 65.3 63.5 57.1 61.7 58.6 56.8
2005 2010 2014 2015 2016 2017
1-ROOM / 2-ROOM

ENERGY CONSUMPTION69
TABLE 3.11: AVERAGE MONTHLY HOUSEHOLD TOWN GAS CONSUMPTION BY PLANNING AREA AND DWELLING TYPE (ANNUAL) (CONTINUED)
Overall 79.5 73.2 68.1 66.3 64.7 62.6
Central Region 82.6 74.5 69.1 67.2 65.8 62.8
Bishan 69.2 64.0 59.3 56.5 54.1 51.7
Bukit Merah 88.1 77.4 70.7 67.5 66.8 63.2
Bukit Timah 73.1 59.9 58.4 56.3 57.6 53.3
Downtown 94.8 82.9 75.6 74.4 71.7 -
Geylang 88.9 81.4 73.7 71.7 69.4 66.8
Kallang 91.5 81.7 76.6 74.8 73.6 69.9
Marine Parade 59.7 59.4 55.2 54.4 54.7 53.4
Novena 84.9 79.9 75.9 75.5 74.6 70.9
Outram 90.5 77.9 69.6 67.9 65.6 60.8
Queenstown 75.0 67.5 62.1 60.5 59.0 56.8
Rochor 91.3 81.1 79.2 79.7 76.6 74.9
Tanglin 86.5 91.1 79.3 79.7 82.2 85.9
Toa Payoh 75.9 69.9 66.6 65.2 63.6 60.5
East Region 78.5 73.6 69.6 67.4 65.6 64.3
Bedok 78.9 74.0 70.1 68.2 66.3 64.4
Pasir Ris - - s 53.9 62.2 65.9
Tampines 69.7 66.5 62.7 62.1 60.1 62.4
North East Region 75.4 70.6 65.7 63.9 62.7 61.9
Ang Mo Kio 74.8 70.5 66.7 65.3 63.7 63.5
Hougang 83.8 78.6 73.1 69.0 68.5 65.6
Punggol - s 56.6 56.4 57.4 57.0
Sengkang - 54.0 59.5 58.7 59.3 58.3
Serangoon 80.2 73.7 65.4 63.7 61.9 59.0
North Region 63.6 63.6 59.8 62.2 59.8 59.7
Sembawang - - 56.3 56.1 55.3 51.8
Woodlands 76.6 72.7 57.3 60.6 59.8 58.6
Yishun 62.2 62.7 61.1 63.5 60.3 61.2
West Region 75.2 72.0 68.1 66.7 64.7 61.9
Bukit Batok - - - - - 38.3
Bukit Panjang 69.7 69.1 64.8 62.9 60.6 59.8
Choa Chu Kang 80.8 79.8 72.9 67.8 60.8 59.3
Clementi 70.9 67.6 64.4 63.1 62.2 58.8
Jurong East 79.4 77.1 72.7 71.4 69.7 67.8
Jurong West 89.9 84.3 76.1 74.9 71.9 69.4
2005 2010 2014 2015 2016 2017
3-ROOM
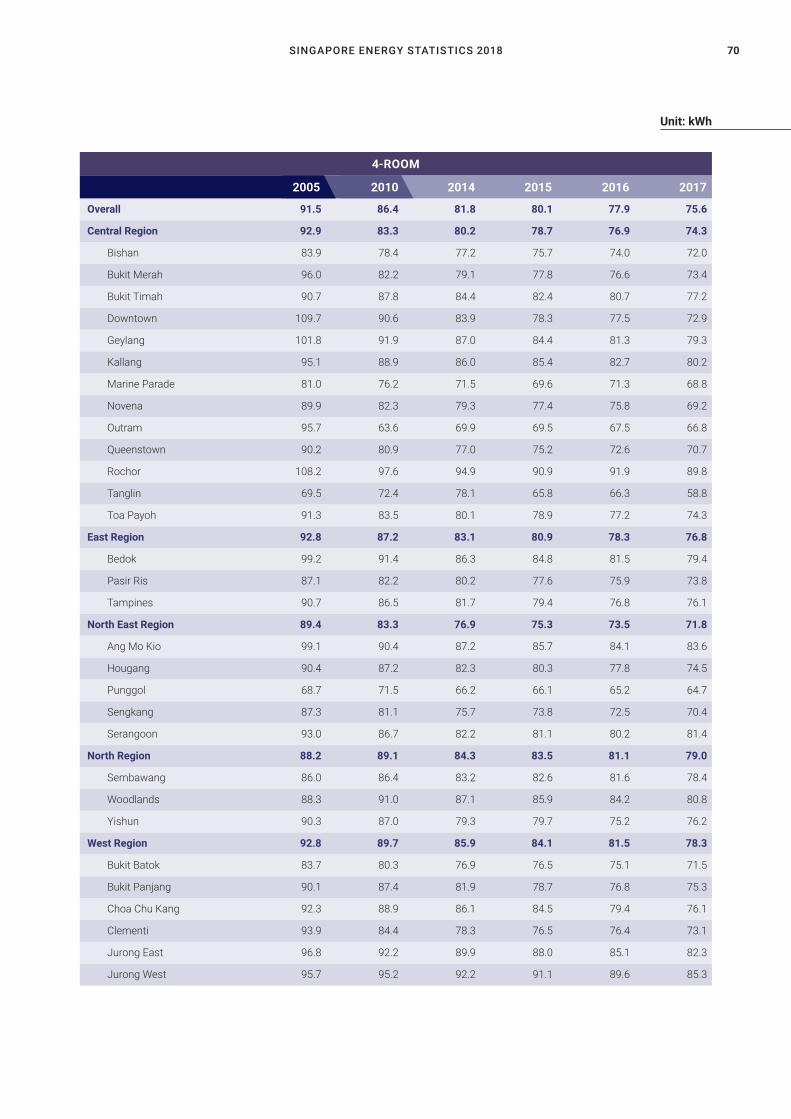
SINGAPORE ENERGY STATISTICS 2018 70
Unit: kWh
Overall 91.5 86.4 81.8 80.1 77.9 75.6
Central Region 92.9 83.3 80.2 78.7 76.9 74.3
Bishan 83.9 78.4 77.2 75.7 74.0 72.0
Bukit Merah 96.0 82.2 79.1 77.8 76.6 73.4
Bukit Timah 90.7 87.8 84.4 82.4 80.7 77.2
Downtown 109.7 90.6 83.9 78.3 77.5 72.9
Geylang 101.8 91.9 87.0 84.4 81.3 79.3
Kallang 95.1 88.9 86.0 85.4 82.7 80.2
Marine Parade 81.0 76.2 71.5 69.6 71.3 68.8
Novena 89.9 82.3 79.3 77.4 75.8 69.2
Outram 95.7 63.6 69.9 69.5 67.5 66.8
Queenstown 90.2 80.9 77.0 75.2 72.6 70.7
Rochor 108.2 97.6 94.9 90.9 91.9 89.8
Tanglin 69.5 72.4 78.1 65.8 66.3 58.8
Toa Payoh 91.3 83.5 80.1 78.9 77.2 74.3
East Region 92.8 87.2 83.1 80.9 78.3 76.8
Bedok 99.2 91.4 86.3 84.8 81.5 79.4
Pasir Ris 87.1 82.2 80.2 77.6 75.9 73.8
Tampines 90.7 86.5 81.7 79.4 76.8 76.1
North East Region 89.4 83.3 76.9 75.3 73.5 71.8
Ang Mo Kio 99.1 90.4 87.2 85.7 84.1 83.6
Hougang 90.4 87.2 82.3 80.3 77.8 74.5
Punggol 68.7 71.5 66.2 66.1 65.2 64.7
Sengkang 87.3 81.1 75.7 73.8 72.5 70.4
Serangoon 93.0 86.7 82.2 81.1 80.2 81.4
North Region 88.2 89.1 84.3 83.5 81.1 79.0
Sembawang 86.0 86.4 83.2 82.6 81.6 78.4
Woodlands 88.3 91.0 87.1 85.9 84.2 80.8
Yishun 90.3 87.0 79.3 79.7 75.2 76.2
West Region 92.8 89.7 85.9 84.1 81.5 78.3
Bukit Batok 83.7 80.3 76.9 76.5 75.1 71.5
Bukit Panjang 90.1 87.4 81.9 78.7 76.8 75.3
Choa Chu Kang 92.3 88.9 86.1 84.5 79.4 76.1
Clementi 93.9 84.4 78.3 76.5 76.4 73.1
Jurong East 96.8 92.2 89.9 88.0 85.1 82.3
Jurong West 95.7 95.2 92.2 91.1 89.6 85.3
2005 2010 2014 2015 2016 2017
4-ROOM
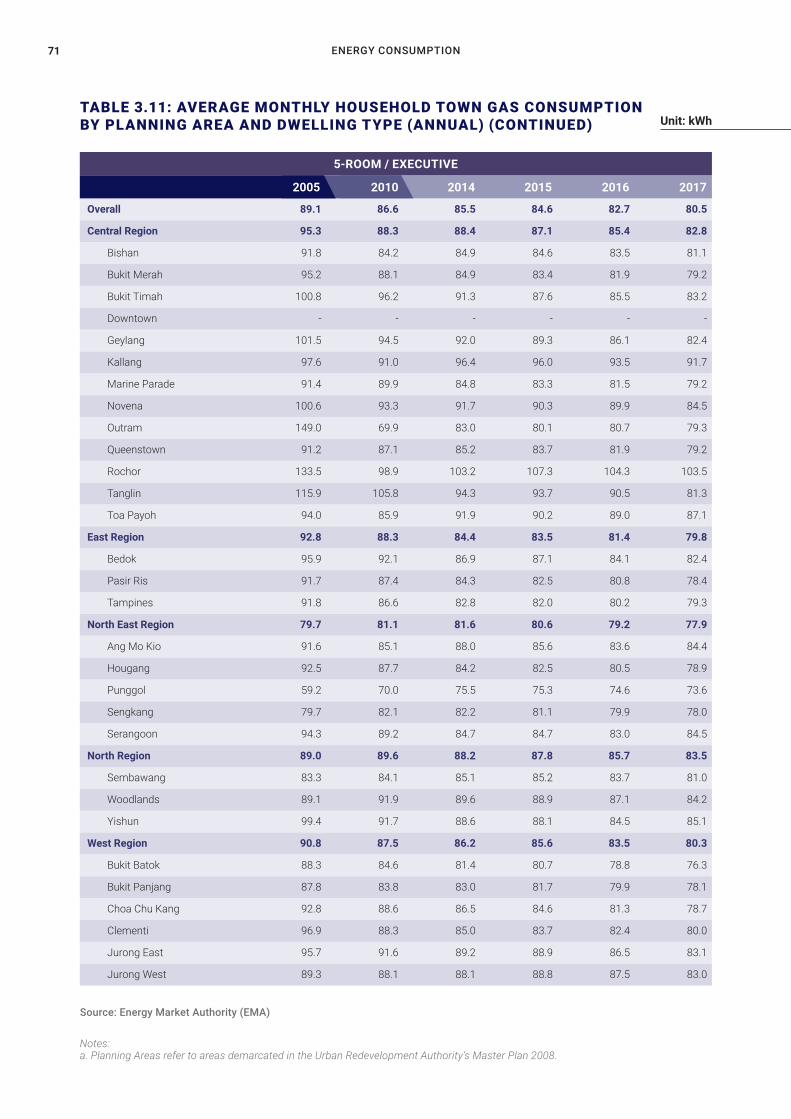
ENERGY CONSUMPTION71
TABLE 3.11: AVERAGE MONTHLY HOUSEHOLD TOWN GAS CONSUMPTION BY PLANNING AREA AND DWELLING TYPE (ANNUAL) (CONTINUED) Unit: kWh
Notes: a. Planning Areas refer to areas demarcated in the Urban Redevelopment Authority’s Master Plan 2008.
Source: Energy Market Authority (EMA)
Overall 89.1 86.6 85.5 84.6 82.7 80.5
Central Region 95.3 88.3 88.4 87.1 85.4 82.8
Bishan 91.8 84.2 84.9 84.6 83.5 81.1
Bukit Merah 95.2 88.1 84.9 83.4 81.9 79.2
Bukit Timah 100.8 96.2 91.3 87.6 85.5 83.2
Downtown - - - - - -
Geylang 101.5 94.5 92.0 89.3 86.1 82.4
Kallang 97.6 91.0 96.4 96.0 93.5 91.7
Marine Parade 91.4 89.9 84.8 83.3 81.5 79.2
Novena 100.6 93.3 91.7 90.3 89.9 84.5
Outram 149.0 69.9 83.0 80.1 80.7 79.3
Queenstown 91.2 87.1 85.2 83.7 81.9 79.2
Rochor 133.5 98.9 103.2 107.3 104.3 103.5
Tanglin 115.9 105.8 94.3 93.7 90.5 81.3
Toa Payoh 94.0 85.9 91.9 90.2 89.0 87.1
East Region 92.8 88.3 84.4 83.5 81.4 79.8
Bedok 95.9 92.1 86.9 87.1 84.1 82.4
Pasir Ris 91.7 87.4 84.3 82.5 80.8 78.4
Tampines 91.8 86.6 82.8 82.0 80.2 79.3
North East Region 79.7 81.1 81.6 80.6 79.2 77.9
Ang Mo Kio 91.6 85.1 88.0 85.6 83.6 84.4
Hougang 92.5 87.7 84.2 82.5 80.5 78.9
Punggol 59.2 70.0 75.5 75.3 74.6 73.6
Sengkang 79.7 82.1 82.2 81.1 79.9 78.0
Serangoon 94.3 89.2 84.7 84.7 83.0 84.5
North Region 89.0 89.6 88.2 87.8 85.7 83.5
Sembawang 83.3 84.1 85.1 85.2 83.7 81.0
Woodlands 89.1 91.9 89.6 88.9 87.1 84.2
Yishun 99.4 91.7 88.6 88.1 84.5 85.1
West Region 90.8 87.5 86.2 85.6 83.5 80.3
Bukit Batok 88.3 84.6 81.4 80.7 78.8 76.3
Bukit Panjang 87.8 83.8 83.0 81.7 79.9 78.1
Choa Chu Kang 92.8 88.6 86.5 84.6 81.3 78.7
Clementi 96.9 88.3 85.0 83.7 82.4 80.0
Jurong East 95.7 91.6 89.2 88.9 86.5 83.1
Jurong West 89.3 88.1 88.1 88.8 87.5 83.0
2005 2010 2014 2015 2016 2017
5-ROOM / EXECUTIVE
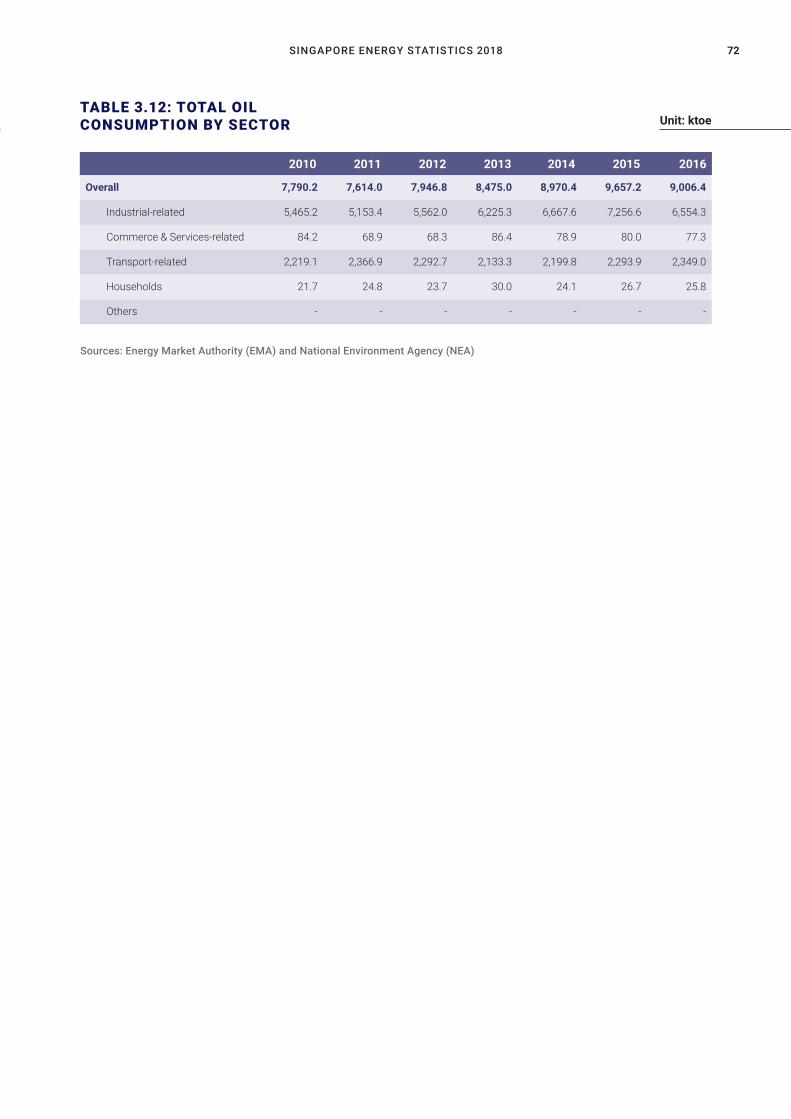
SINGAPORE ENERGY STATISTICS 2018 72
20112010 2012 2013 2014 2015 2016
TABLE 3.12: TOTAL OIL CONSUMPTION BY SECTOR Unit: ktoe
Sources: Energy Market Authority (EMA) and National Environment Agency (NEA)
Overall 7,790.2 7,614.0 7,946.8 8,475.0 8,970.4 9,657.2 9,006.4
Industrial-related 5,465.2 5,153.4 5,562.0 6,225.3 6,667.6 7,256.6 6,554.3
Commerce & Services-related 84.2 68.9 68.3 86.4 78.9 80.0 77.3
Transport-related 2,219.1 2,366.9 2,292.7 2,133.3 2,199.8 2,293.9 2,349.0
Households 21.7 24.8 23.7 30.0 24.1 26.7 25.8
Others - - - - - - -
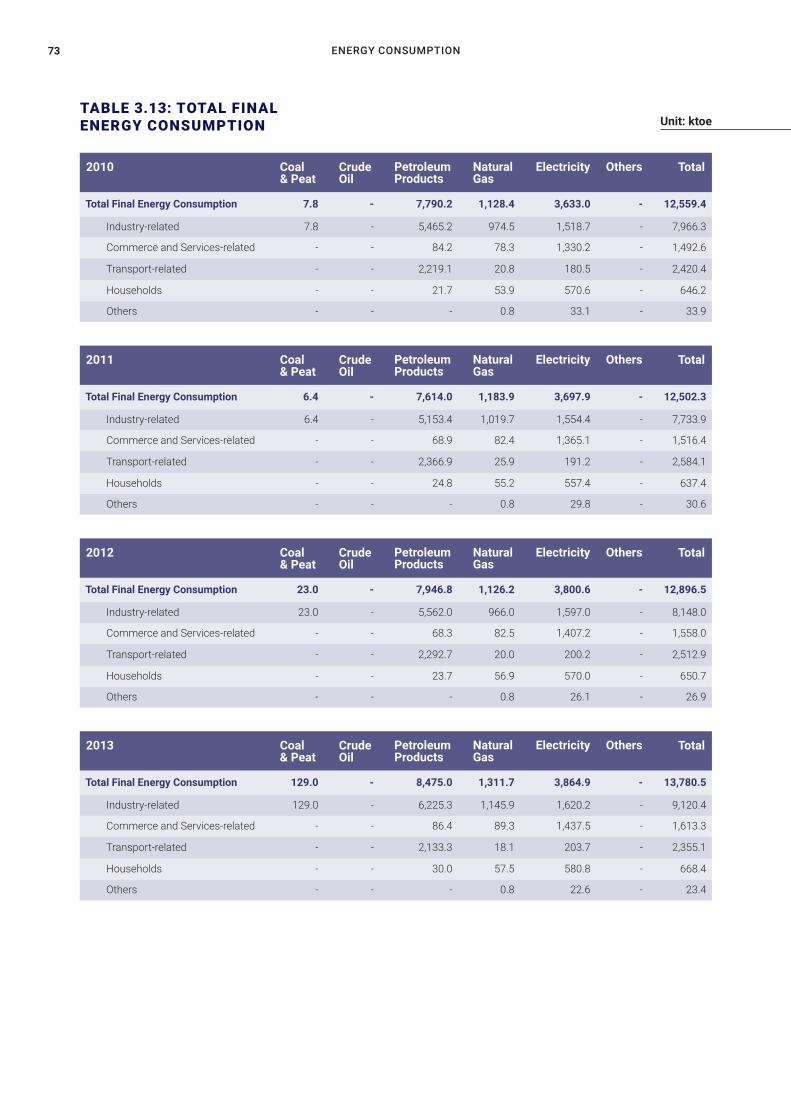
ENERGY CONSUMPTION73
TABLE 3.13: TOTAL FINAL ENERGY CONSUMPTION
Total Final Energy Consumption 6.4 - 7,614.0 1,183.9 3,697.9 - 12,502.3
Industry-related 6.4 - 5,153.4 1,019.7 1,554.4 - 7,733.9
Commerce and Services-related - - 68.9 82.4 1,365.1 - 1,516.4
Transport-related - - 2,366.9 25.9 191.2 - 2,584.1
Households - - 24.8 55.2 557.4 - 637.4
Others - - - 0.8 29.8 - 30.6
Total Final Energy Consumption 23.0 - 7,946.8 1,126.2 3,800.6 - 12,896.5
Industry-related 23.0 - 5,562.0 966.0 1,597.0 - 8,148.0
Commerce and Services-related - - 68.3 82.5 1,407.2 - 1,558.0
Transport-related - - 2,292.7 20.0 200.2 - 2,512.9
Households - - 23.7 56.9 570.0 - 650.7
Others - - - 0.8 26.1 - 26.9
Total Final Energy Consumption 129.0 - 8,475.0 1,311.7 3,864.9 - 13,780.5
Industry-related 129.0 - 6,225.3 1,145.9 1,620.2 - 9,120.4
Commerce and Services-related - - 86.4 89.3 1,437.5 - 1,613.3
Transport-related - - 2,133.3 18.1 203.7 - 2,355.1
Households - - 30.0 57.5 580.8 - 668.4
Others - - - 0.8 22.6 - 23.4
Total Final Energy Consumption 7.8 - 7,790.2 1,128.4 3,633.0 - 12,559.4
Industry-related 7.8 - 5,465.2 974.5 1,518.7 - 7,966.3
Commerce and Services-related - - 84.2 78.3 1,330.2 - 1,492.6
Transport-related - - 2,219.1 20.8 180.5 - 2,420.4
Households - - 21.7 53.9 570.6 - 646.2
Others - - - 0.8 33.1 - 33.9
Coal & Peat
Coal & Peat
Coal & Peat
Coal & Peat
2011
2012
2013
2010
CrudeOil
CrudeOil
CrudeOil
CrudeOil
PetroleumProducts
PetroleumProducts
PetroleumProducts
PetroleumProducts
NaturalGas
NaturalGas
NaturalGas
NaturalGas
Electricity
Electricity
Electricity
Electricity
Others
Others
Others
Others
Total
Total
Total
Total
Unit: ktoe
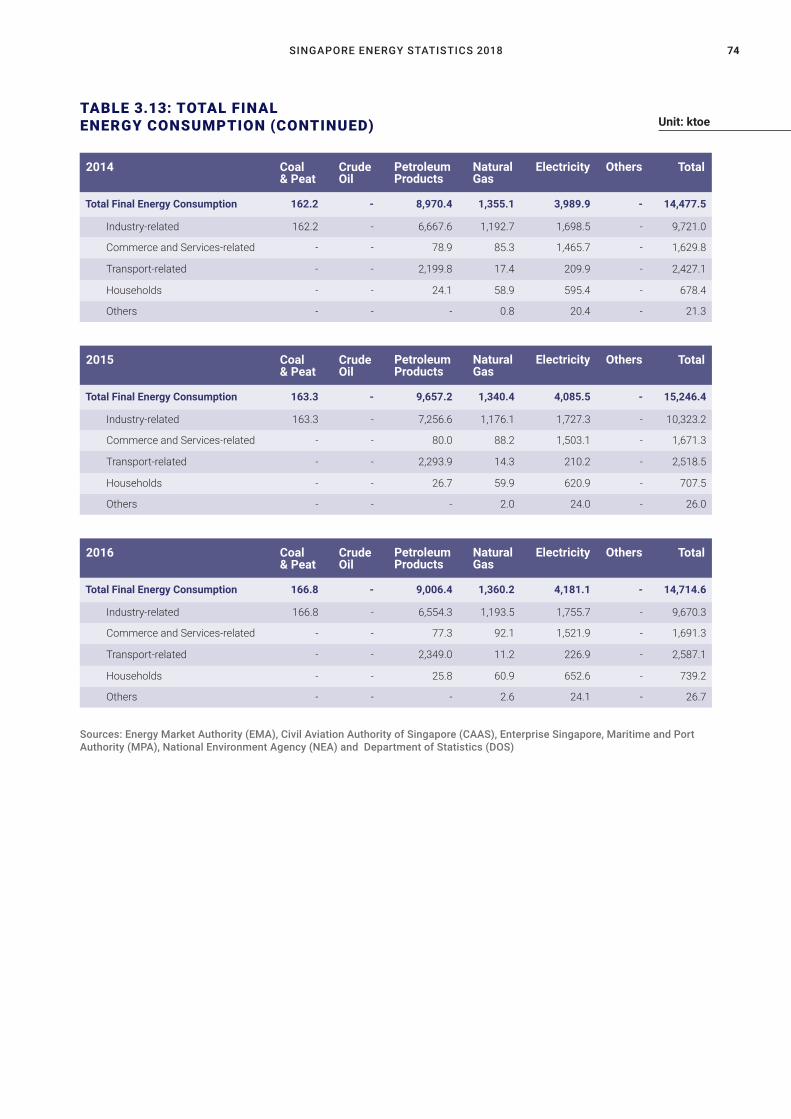
SINGAPORE ENERGY STATISTICS 2018 74
TABLE 3.13: TOTAL FINAL ENERGY CONSUMPTION (CONTINUED)
Total Final Energy Consumption 163.3 - 9,657.2 1,340.4 4,085.5 - 15,246.4
Industry-related 163.3 - 7,256.6 1,176.1 1,727.3 - 10,323.2
Commerce and Services-related - - 80.0 88.2 1,503.1 - 1,671.3
Transport-related - - 2,293.9 14.3 210.2 - 2,518.5
Households - - 26.7 59.9 620.9 - 707.5
Others - - - 2.0 24.0 - 26.0
Total Final Energy Consumption 166.8 - 9,006.4 1,360.2 4,181.1 - 14,714.6
Industry-related 166.8 - 6,554.3 1,193.5 1,755.7 - 9,670.3
Commerce and Services-related - - 77.3 92.1 1,521.9 - 1,691.3
Transport-related - - 2,349.0 11.2 226.9 - 2,587.1
Households - - 25.8 60.9 652.6 - 739.2
Others - - - 2.6 24.1 - 26.7
Total Final Energy Consumption 162.2 - 8,970.4 1,355.1 3,989.9 - 14,477.5
Industry-related 162.2 - 6,667.6 1,192.7 1,698.5 - 9,721.0
Commerce and Services-related - - 78.9 85.3 1,465.7 - 1,629.8
Transport-related - - 2,199.8 17.4 209.9 - 2,427.1
Households - - 24.1 58.9 595.4 - 678.4
Others - - - 0.8 20.4 - 21.3
Coal & Peat
Coal & Peat
Coal & Peat
2015
2016
2014
CrudeOil
CrudeOil
CrudeOil
PetroleumProducts
PetroleumProducts
PetroleumProducts
NaturalGas
NaturalGas
NaturalGas
Electricity
Electricity
Electricity
Others
Others
Others
Total
Total
Total
Unit: ktoe
Sources: Energy Market Authority (EMA), Civil Aviation Authority of Singapore (CAAS), Enterprise Singapore, Maritime and Port Authority (MPA), National Environment Agency (NEA) and Department of Statistics (DOS)
ENERGY BALANCES75
04ENE RGYBA L ANCES

SINGAPORE ENERGY STATISTICS 2018 76
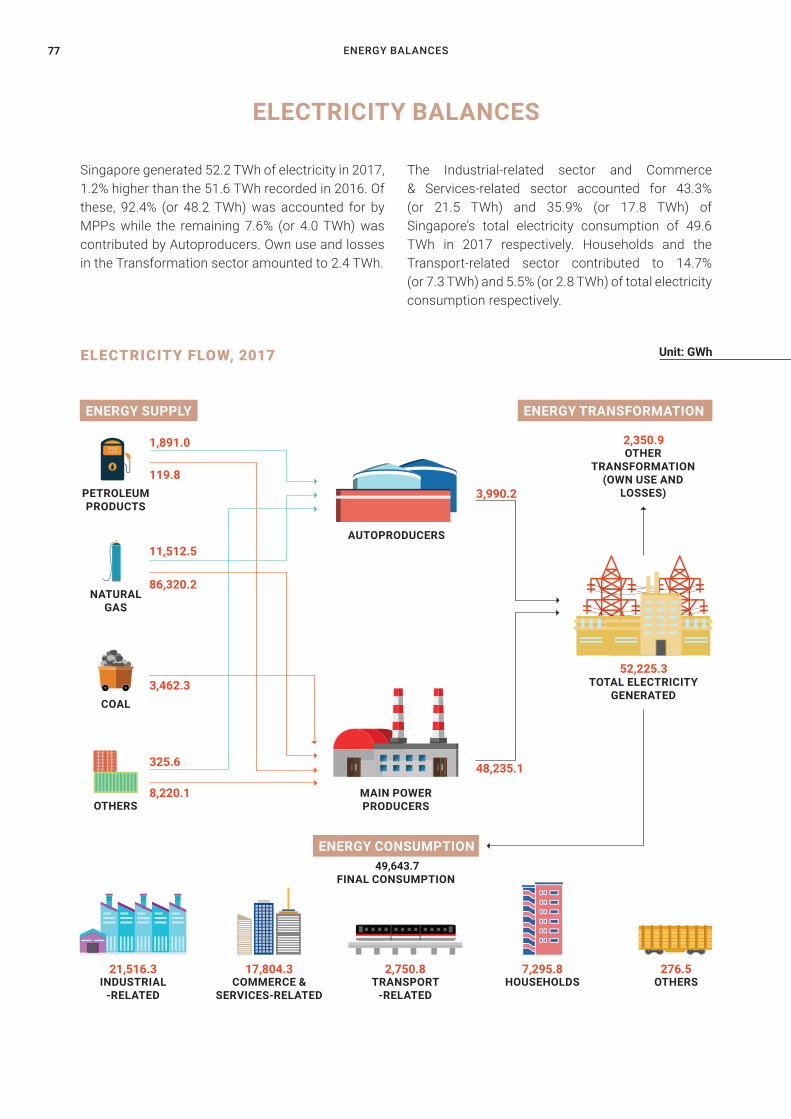
ENERGY BALANCES77
ENERGY CONSUMPTION
Singapore generated 52.2 TWh of electricity in 2017, 1.2% higher than the 51.6 TWh recorded in 2016. Of these, 92.4% (or 48.2 TWh) was accounted for by MPPs while the remaining 7.6% (or 4.0 TWh) was contributed by Autoproducers. Own use and losses in the Transformation sector amounted to 2.4 TWh.
The Industrial-related sector and Commerce & Services-related sector accounted for 43.3% (or 21.5 TWh) and 35.9% (or 17.8 TWh) of Singapore’s total electricity consumption of 49.6 TWh in 2017 respectively. Households and the Transport-related sector contributed to 14.7% (or 7.3 TWh) and 5.5% (or 2.8 TWh) of total electricity consumption respectively.
Unit: GWh
ELECTRICITY BALANCES
PETROLEUM PRODUCTS
INDUSTRIAL-RELATED
HOUSEHOLDSCOMMERCE & SERVICES-RELATED
OTHERSTRANSPORT-RELATED
ENERGY SUPPLY ENERGY TRANSFORMATION
1,891.0
11,512.5
325.6
119.8
3,990.2
48,235.1
21,516.3 7,295.8 17,804.3 276.5 2,750.8
86,320.2
8,220.1
3,462.3
NATURALGAS
COAL
OTHERSMAIN POWERPRODUCERS
52,225.3 TOTAL ELECTRICITY
GENERATED
2,350.9OTHER
TRANSFORMATION(OWN USE AND
LOSSES)
ELECTRICITY FLOW, 2017
AUTOPRODUCERS
49,643.7FINAL CONSUMPTION
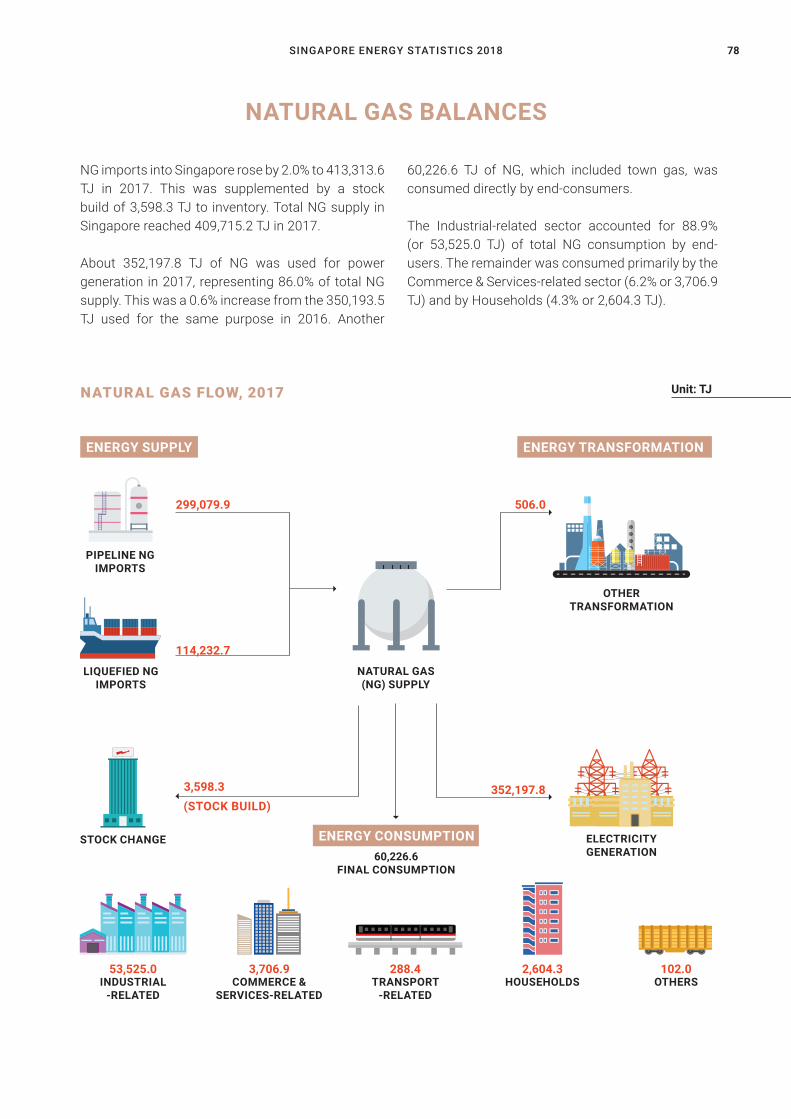
SINGAPORE ENERGY STATISTICS 2018 78
60,226.6 FINAL CONSUMPTION
ENERGY CONSUMPTION
NG imports into Singapore rose by 2.0% to 413,313.6 TJ in 2017. This was supplemented by a stock build of 3,598.3 TJ to inventory. Total NG supply in Singapore reached 409,715.2 TJ in 2017.
About 352,197.8 TJ of NG was used for power generation in 2017, representing 86.0% of total NG supply. This was a 0.6% increase from the 350,193.5 TJ used for the same purpose in 2016. Another
NATURAL GAS BALANCES
INDUSTRIAL-RELATED
HOUSEHOLDSCOMMERCE & SERVICES-RELATED
OTHERSTRANSPORT-RELATED
53,525.0 2,604.3 3,706.9 102.0 288.4
LIQUEFIED NG IMPORTS
NATURAL GAS (NG) SUPPLY
STOCK CHANGE
PIPELINE NG IMPORTS
ELECTRICITYGENERATION
OTHERTRANSFORMATION
60,226.6 TJ of NG, which included town gas, was consumed directly by end-consumers.
The Industrial-related sector accounted for 88.9% (or 53,525.0 TJ) of total NG consumption by end-users. The remainder was consumed primarily by the Commerce & Services-related sector (6.2% or 3,706.9 TJ) and by Households (4.3% or 2,604.3 TJ).
Unit: TJNATURAL GAS FLOW, 2017
299,079.9 506.0
352,197.8
114,232.7
3,598.3(STOCK BUILD)
ENERGY SUPPLY ENERGY TRANSFORMATION
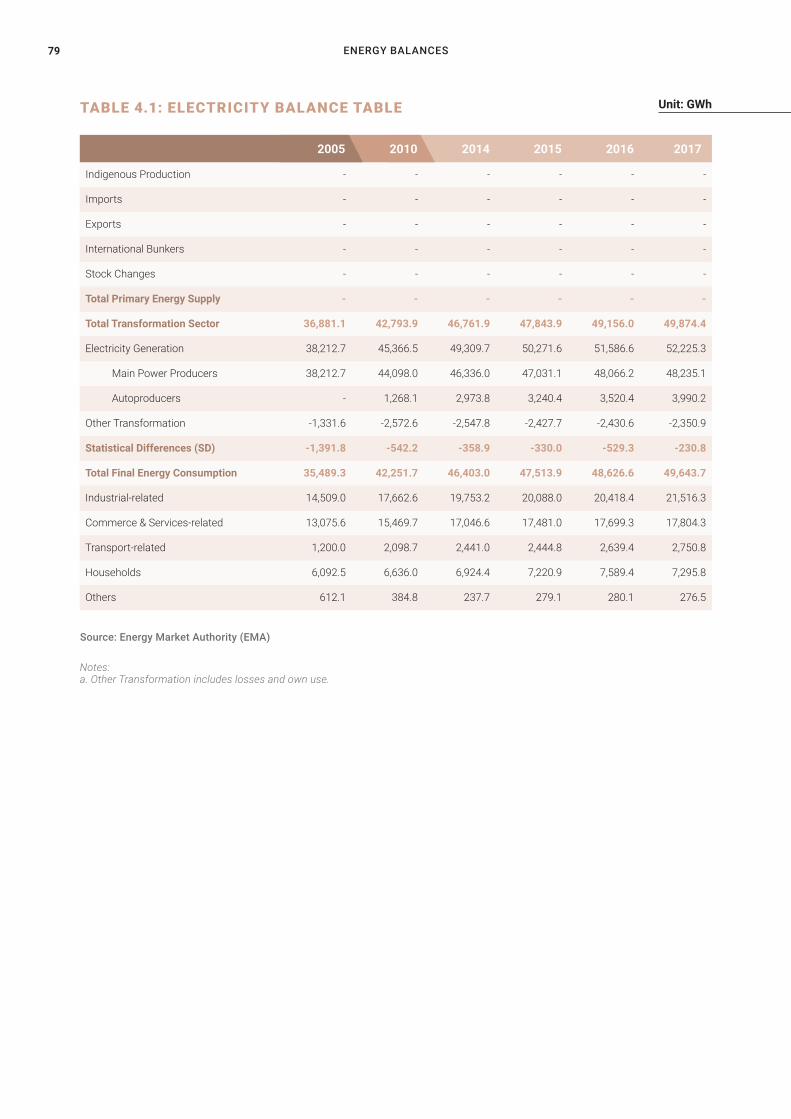
ENERGY BALANCES79
TABLE 4.1: ELECTRICITY BALANCE TABLE
Indigenous Production - - - - - -
Imports - - - - - -
Exports - - - - - -
International Bunkers - - - - - -
Stock Changes - - - - - -
Total Primary Energy Supply - - - - - -
Total Transformation Sector 36,881.1 42,793.9 46,761.9 47,843.9 49,156.0 49,874.4
Electricity Generation 38,212.7 45,366.5 49,309.7 50,271.6 51,586.6 52,225.3
Main Power Producers 38,212.7 44,098.0 46,336.0 47,031.1 48,066.2 48,235.1
Autoproducers - 1,268.1 2,973.8 3,240.4 3,520.4 3,990.2
Other Transformation -1,331.6 -2,572.6 -2,547.8 -2,427.7 -2,430.6 -2,350.9
Statistical Differences (SD) -1,391.8 -542.2 -358.9 -330.0 -529.3 -230.8
Total Final Energy Consumption 35,489.3 42,251.7 46,403.0 47,513.9 48,626.6 49,643.7
Industrial-related 14,509.0 17,662.6 19,753.2 20,088.0 20,418.4 21,516.3
Commerce & Services-related 13,075.6 15,469.7 17,046.6 17,481.0 17,699.3 17,804.3
Transport-related 1,200.0 2,098.7 2,441.0 2,444.8 2,639.4 2,750.8
Households 6,092.5 6,636.0 6,924.4 7,220.9 7,589.4 7,295.8
Others 612.1 384.8 237.7 279.1 280.1 276.5
2005 2010
Notes: a. Other Transformation includes losses and own use.
Source: Energy Market Authority (EMA)
Unit: GWh
2014 2015 2016 2017
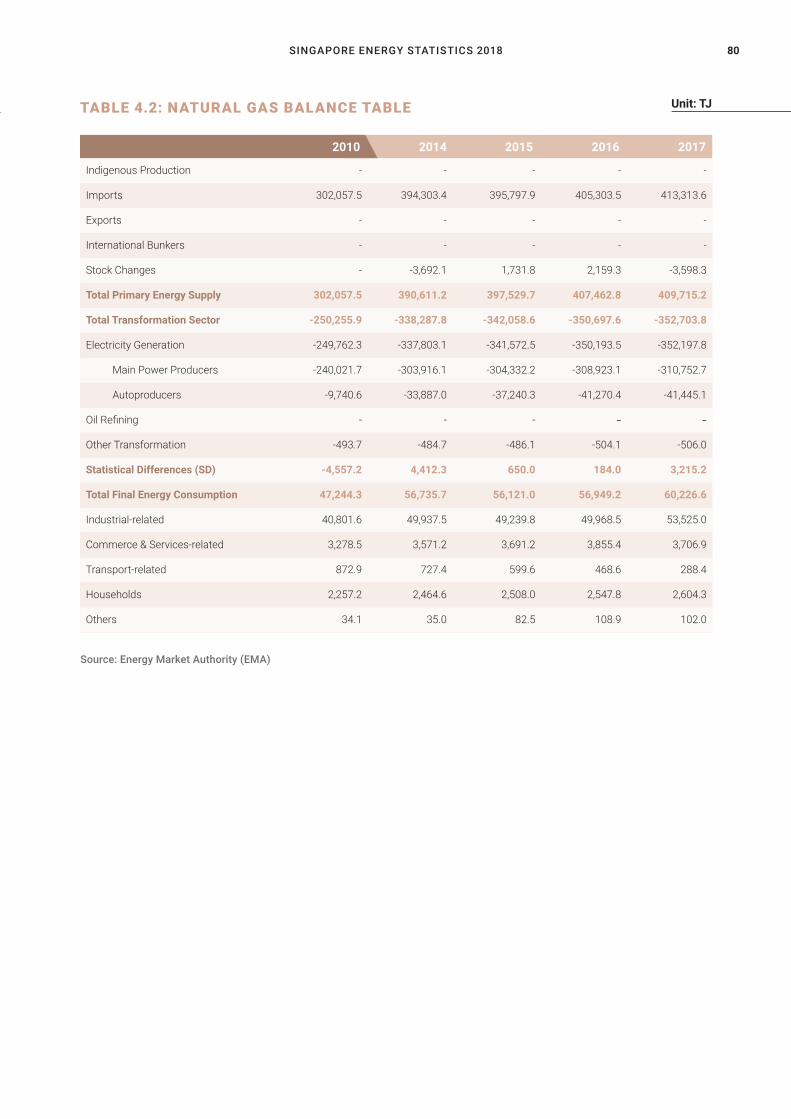
SINGAPORE ENERGY STATISTICS 2018 80
TABLE 4.2: NATURAL GAS BALANCE TABLE
Indigenous Production - - - - -
Imports 302,057.5 394,303.4 395,797.9 405,303.5 413,313.6
Exports - - - - -
International Bunkers - - - - -
Stock Changes - -3,692.1 1,731.8 2,159.3 -3,598.3
Total Primary Energy Supply 302,057.5 390,611.2 397,529.7 407,462.8 409,715.2
Total Transformation Sector -250,255.9 -338,287.8 -342,058.6 -350,697.6 -352,703.8
Electricity Generation -249,762.3 -337,803.1 -341,572.5 -350,193.5 -352,197.8
Main Power Producers -240,021.7 -303,916.1 -304,332.2 -308,923.1 -310,752.7
Autoproducers -9,740.6 -33,887.0 -37,240.3 -41,270.4 -41,445.1
Oil Refining - - - - - Other Transformation -493.7 -484.7 -486.1 -504.1 -506.0
Statistical Differences (SD) -4,557.2 4,412.3 650.0 184.0 3,215.2
Total Final Energy Consumption 47,244.3 56,735.7 56,121.0 56,949.2 60,226.6
Industrial-related 40,801.6 49,937.5 49,239.8 49,968.5 53,525.0
Commerce & Services-related 3,278.5 3,571.2 3,691.2 3,855.4 3,706.9
Transport-related 872.9 727.4 599.6 468.6 288.4
Households 2,257.2 2,464.6 2,508.0 2,547.8 2,604.3
Others 34.1 35.0 82.5 108.9 102.0
Source: Energy Market Authority (EMA)
Unit: TJ
2010 2014 2015 2016 2017
ENERGY PRICES81
05ENE RGYPRICES

SINGAPORE ENERGY STATISTICS 2018 82

ENERGY PRICES83
5
10
15
20
25
30Power System Operation & Market Administration Fees
Market Support Service Fees
Grid Changes
Energy Costs
201720162015201420132012201120100
ANNUAL ELECTRICITY TARIFFS BY COMPONENTS (LOW TENSION TARIFFS) Unit: Cents/kWh
ELECTRICITY TARIFFS
Electricity tariffs for non-contestable consumers in Singapore are regulated by the EMA. These are updated quarterly to reflect changes in the cost of power generation. Energy cost constitutes the largest component of electricity tariffs, and is calculated using the average of daily NG prices in the first two-and-a-half month period in the preceding quarter.
The four main components of electricity tariffs in Singapore are (i) Energy Costs (paid to the generation companies), (ii) Grid Charges (paid to
SP PowerAssets), (iii) Market Support Services Fees (paid to SP Services), and (iv) Market Administration and Power System Operation Fees (paid to the Energy Market Company and the Power System Operator).
In 2017, the annual electricity tariffs increased by 9.5%, from 18.9 cents per kWh in 2016 to 20.7 cents per kWh in 2017. This was mainly due to higher energy costs, which increased by about 1.6 cents from 13.3 cents per kWh in 2016 to 14.9 cents per kWh in 2017, as a result of higher gas prices.
Each component in the chart above is ordered according to the legend.
Market Support Service Fees
Energy Costs
18.3
4.9
0.10.2
13.3
5.3
0.10.2
0.10.4
5.3
14.9
Power System Operation & Market Administration Fees
Grid Charges
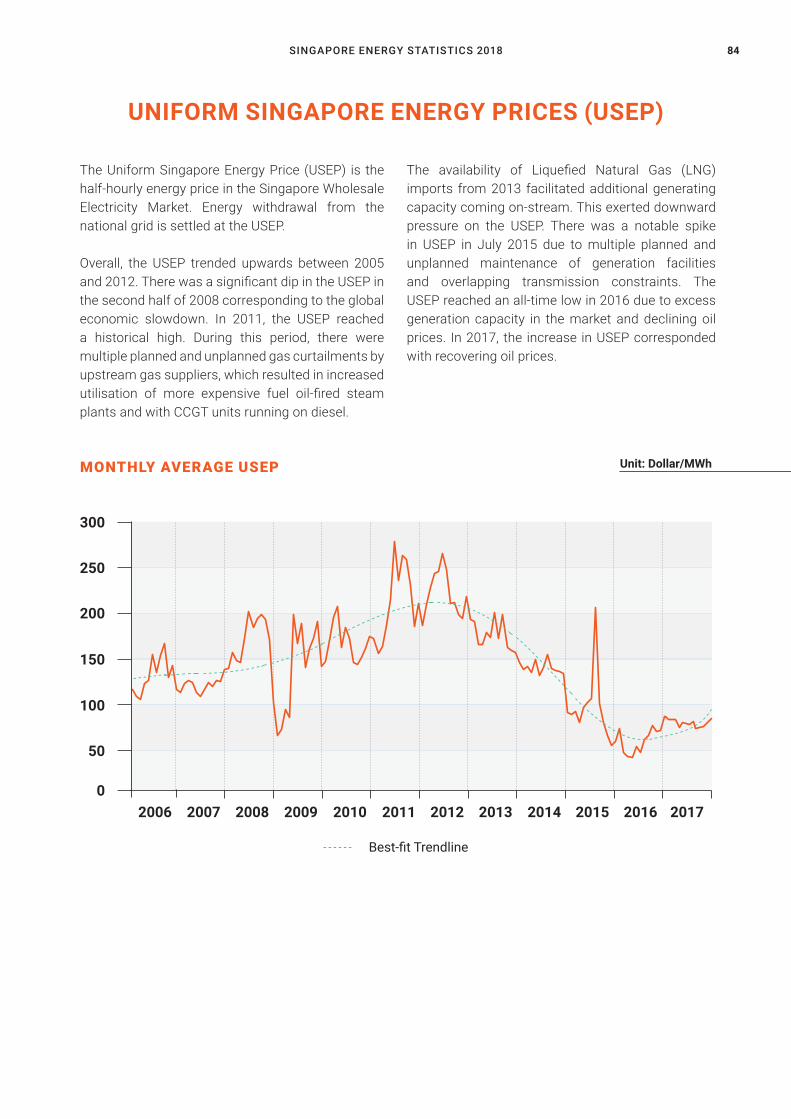
SINGAPORE ENERGY STATISTICS 2018 84
MONTHLY AVERAGE USEP
2017
Unit: Dollar/MWh
UNIFORM SINGAPORE ENERGY PRICES (USEP)
The Uniform Singapore Energy Price (USEP) is the half-hourly energy price in the Singapore Wholesale Electricity Market. Energy withdrawal from the national grid is settled at the USEP.
Overall, the USEP trended upwards between 2005 and 2012. There was a significant dip in the USEP in the second half of 2008 corresponding to the global economic slowdown. In 2011, the USEP reached a historical high. During this period, there were multiple planned and unplanned gas curtailments by upstream gas suppliers, which resulted in increased utilisation of more expensive fuel oil-fired steam plants and with CCGT units running on diesel.
The availability of Liquefied Natural Gas (LNG) imports from 2013 facilitated additional generating capacity coming on-stream. This exerted downward pressure on the USEP. There was a notable spike in USEP in July 2015 due to multiple planned and unplanned maintenance of generation facilities and overlapping transmission constraints. The USEP reached an all-time low in 2016 due to excess generation capacity in the market and declining oil prices. In 2017, the increase in USEP corresponded with recovering oil prices.
300
250
200
150
100
50
0
Best-fit Trendline
2006 2007 2008 2009 2010 2011 2012 2013 2014 2015 2016
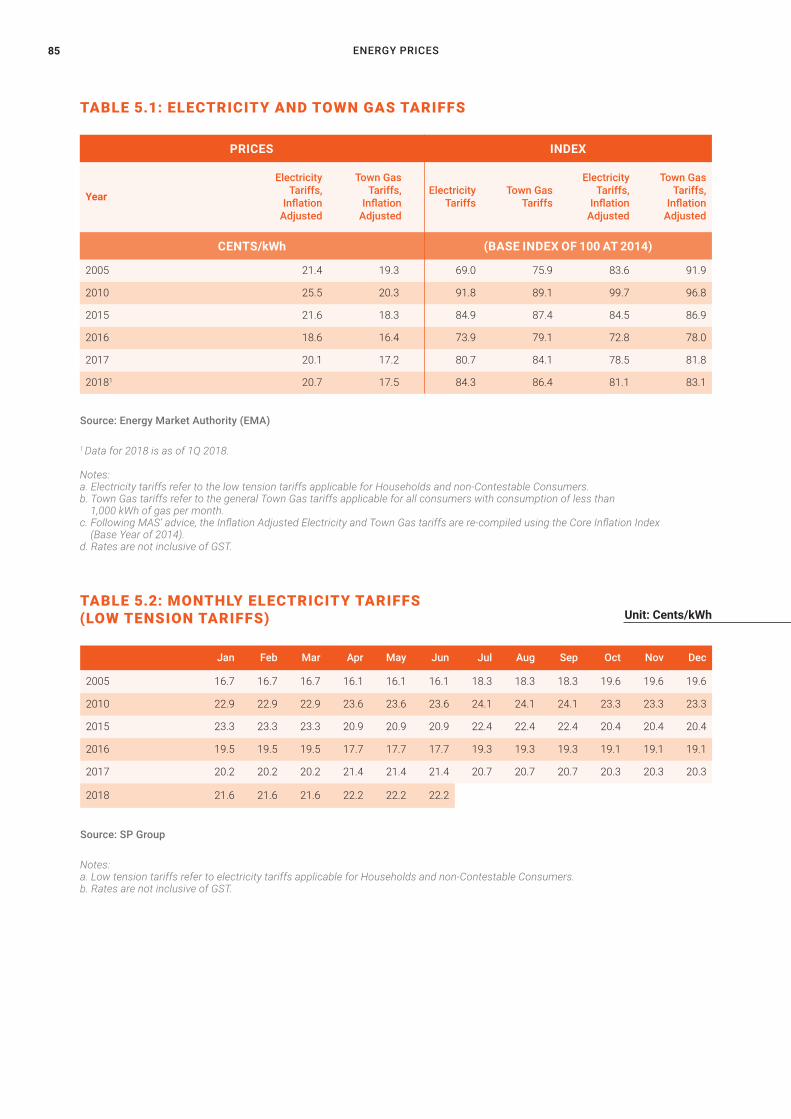
ENERGY PRICES85
TABLE 5.1: ELECTRICITY AND TOWN GAS TARIFFS
TABLE 5.2: MONTHLY ELECTRICITY TARIFFS (LOW TENSION TARIFFS)
2005 21.4 19.3 69.0 75.9 83.6 91.9
2010 25.5 20.3 91.8 89.1 99.7 96.8
2015 21.6 18.3 84.9 87.4 84.5 86.9
2016 18.6 16.4 73.9 79.1 72.8 78.0
2017 20.1 17.2 80.7 84.1 78.5 81.8
20181 20.7 17.5 84.3 86.4 81.1 83.1
Year
Electricity Tariffs,
Inflation Adjusted
Town Gas Tariffs,
Inflation Adjusted
Electricity Tariffs
Town Gas Tariffs
Electricity Tariffs,
Inflation Adjusted
Town Gas Tariffs,
Inflation Adjusted
INDEX
(BASE INDEX OF 100 AT 2014)
PRICES
CENTS/kWh
1 Data for 2018 is as of 1Q 2018.
Notes: a. Electricity tariffs refer to the low tension tariffs applicable for Households and non-Contestable Consumers. b. Town Gas tariffs refer to the general Town Gas tariffs applicable for all consumers with consumption of less than 1,000 kWh of gas per month. c. Following MAS’ advice, the Inflation Adjusted Electricity and Town Gas tariffs are re-compiled using the Core Inflation Index (Base Year of 2014).d. Rates are not inclusive of GST.
Notes: a. Low tension tariffs refer to electricity tariffs applicable for Households and non-Contestable Consumers.b. Rates are not inclusive of GST.
Source: Energy Market Authority (EMA)
Source: SP Group
Unit: Cents/kWh
Jan Feb Mar Apr May Jun Jul Aug Sep Oct Nov Dec
2005 16.7 16.7 16.7 16.1 16.1 16.1 18.3 18.3 18.3 19.6 19.6 19.6
2010 22.9 22.9 22.9 23.6 23.6 23.6 24.1 24.1 24.1 23.3 23.3 23.3
2015 23.3 23.3 23.3 20.9 20.9 20.9 22.4 22.4 22.4 20.4 20.4 20.4
2016 19.5 19.5 19.5 17.7 17.7 17.7 19.3 19.3 19.3 19.1 19.1 19.1
2017 20.2 20.2 20.2 21.4 21.4 21.4 20.7 20.7 20.7 20.3 20.3 20.3
2018 21.6 21.6 21.6 22.2 22.2 22.2
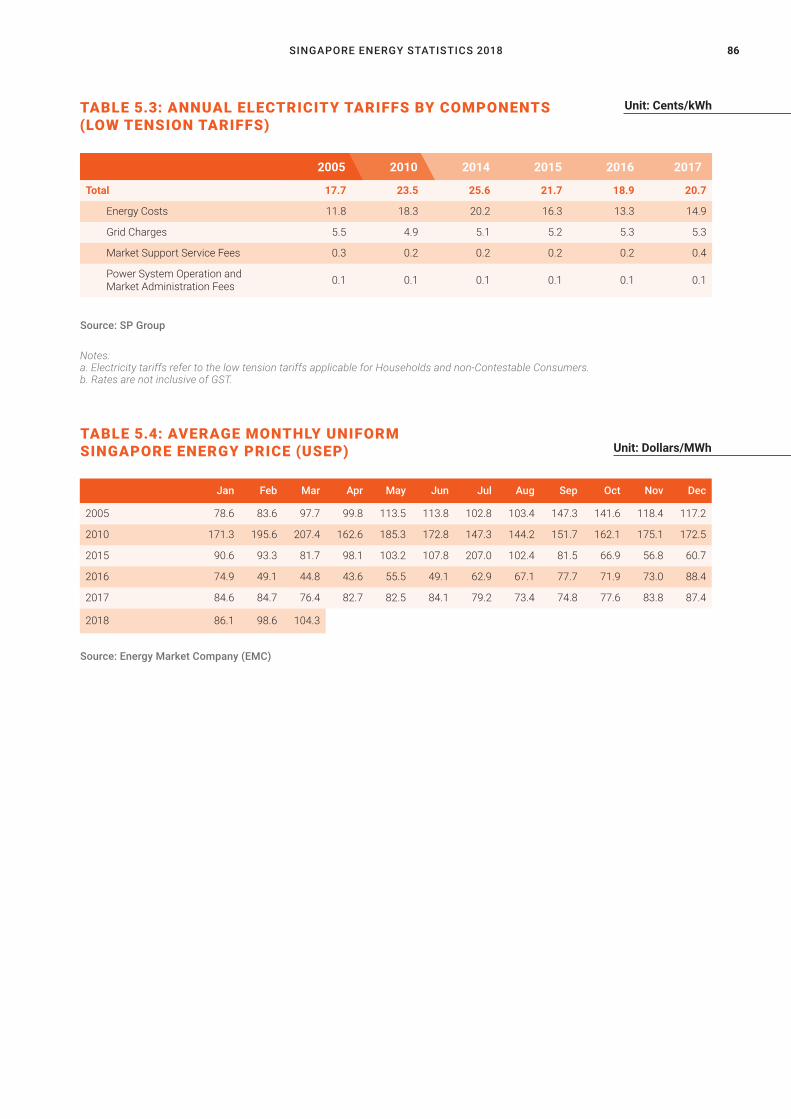
SINGAPORE ENERGY STATISTICS 2018 86
2005 2010 2014 2015 2016 2017
TABLE 5.4: AVERAGE MONTHLY UNIFORM SINGAPORE ENERGY PRICE (USEP)
TABLE 5.3: ANNUAL ELECTRICITY TARIFFS BY COMPONENTS(LOW TENSION TARIFFS)
Total 17.7 23.5 25.6 21.7 18.9 20.7
Energy Costs 11.8 18.3 20.2 16.3 13.3 14.9
Grid Charges 5.5 4.9 5.1 5.2 5.3 5.3
Market Support Service Fees 0.3 0.2 0.2 0.2 0.2 0.4
Power System Operation and Market Administration Fees 0.1 0.1 0.1 0.1 0.1 0.1
Notes: a. Electricity tariffs refer to the low tension tariffs applicable for Households and non-Contestable Consumers.b. Rates are not inclusive of GST.
Source: SP Group
Source: Energy Market Company (EMC)
Unit: Dollars/MWh
Jan Feb Mar Apr May Jun Jul Aug Sep Oct Nov Dec
2005 78.6 83.6 97.7 99.8 113.5 113.8 102.8 103.4 147.3 141.6 118.4 117.2
2010 171.3 195.6 207.4 162.6 185.3 172.8 147.3 144.2 151.7 162.1 175.1 172.5
2015 90.6 93.3 81.7 98.1 103.2 107.8 207.0 102.4 81.5 66.9 56.8 60.7
2016 74.9 49.1 44.8 43.6 55.5 49.1 62.9 67.1 77.7 71.9 73.0 88.4
2017 84.6 84.7 76.4 82.7 82.5 84.1 79.2 73.4 74.8 77.6 83.8 87.4
2018 86.1 98.6 104.3
Unit: Cents/kWh
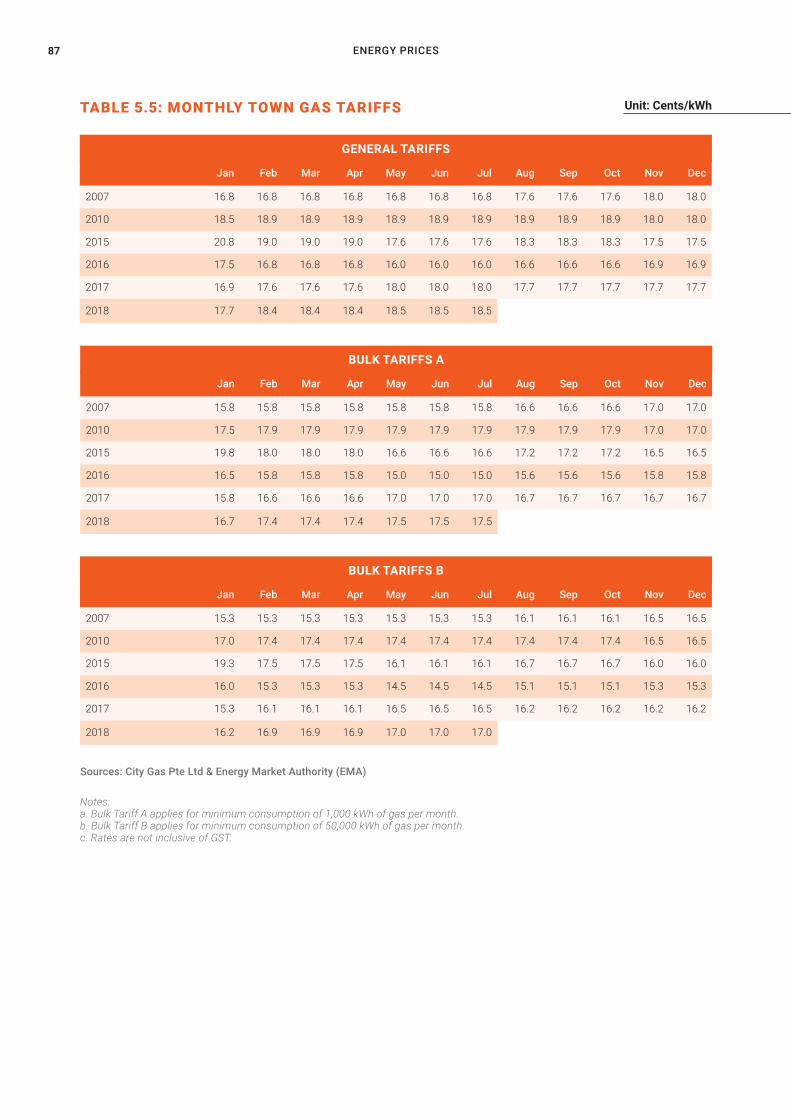
ENERGY PRICES87
TABLE 5.5: MONTHLY TOWN GAS TARIFFS
Notes: a. Bulk Tariff A applies for minimum consumption of 1,000 kWh of gas per month. b. Bulk Tariff B applies for minimum consumption of 50,000 kWh of gas per month. c. Rates are not inclusive of GST.
Sources: City Gas Pte Ltd & Energy Market Authority (EMA)
Unit: Cents/kWh
Jan Feb Mar Apr May Jun Jul Aug Sep Oct Nov Dec
2007 16.8 16.8 16.8 16.8 16.8 16.8 16.8 17.6 17.6 17.6 18.0 18.0
2010 18.5 18.9 18.9 18.9 18.9 18.9 18.9 18.9 18.9 18.9 18.0 18.0
2015 20.8 19.0 19.0 19.0 17.6 17.6 17.6 18.3 18.3 18.3 17.5 17.5
2016 17.5 16.8 16.8 16.8 16.0 16.0 16.0 16.6 16.6 16.6 16.9 16.9
2017 16.9 17.6 17.6 17.6 18.0 18.0 18.0 17.7 17.7 17.7 17.7 17.7
2018 17.7 18.4 18.4 18.4 18.5 18.5 18.5
Jan Feb Mar Apr May Jun Jul Aug Sep Oct Nov Dec
2007 15.8 15.8 15.8 15.8 15.8 15.8 15.8 16.6 16.6 16.6 17.0 17.0
2010 17.5 17.9 17.9 17.9 17.9 17.9 17.9 17.9 17.9 17.9 17.0 17.0
2015 19.8 18.0 18.0 18.0 16.6 16.6 16.6 17.2 17.2 17.2 16.5 16.5
2016 16.5 15.8 15.8 15.8 15.0 15.0 15.0 15.6 15.6 15.6 15.8 15.8
2017 15.8 16.6 16.6 16.6 17.0 17.0 17.0 16.7 16.7 16.7 16.7 16.7
2018 16.7 17.4 17.4 17.4 17.5 17.5 17.5
Jan Feb Mar Apr May Jun Jul Aug Sep Oct Nov Dec
2007 15.3 15.3 15.3 15.3 15.3 15.3 15.3 16.1 16.1 16.1 16.5 16.5
2010 17.0 17.4 17.4 17.4 17.4 17.4 17.4 17.4 17.4 17.4 16.5 16.5
2015 19.3 17.5 17.5 17.5 16.1 16.1 16.1 16.7 16.7 16.7 16.0 16.0
2016 16.0 15.3 15.3 15.3 14.5 14.5 14.5 15.1 15.1 15.1 15.3 15.3
2017 15.3 16.1 16.1 16.1 16.5 16.5 16.5 16.2 16.2 16.2 16.2 16.2
2018 16.2 16.9 16.9 16.9 17.0 17.0 17.0
GENERAL TARIFFS
BULK TARIFFS A
BULK TARIFFS B
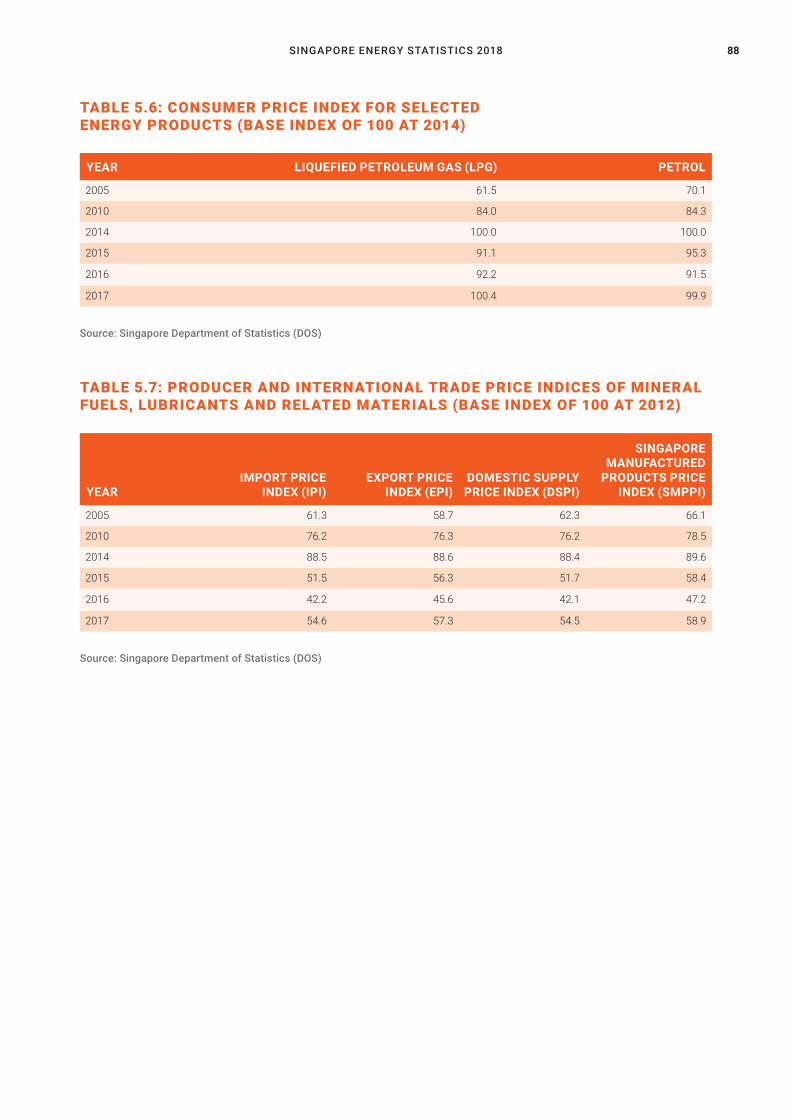
SINGAPORE ENERGY STATISTICS 2018 88
TABLE 5.6: CONSUMER PRICE INDEX FOR SELECTED ENERGY PRODUCTS (BASE INDEX OF 100 AT 2014)
TABLE 5.7: PRODUCER AND INTERNATIONAL TRADE PRICE INDICES OF MINERAL FUELS, LUBRICANTS AND RELATED MATERIALS (BASE INDEX OF 100 AT 2012)
2005 61.3 58.7 62.3 66.1
2010 76.2 76.3 76.2 78.5
2014 88.5 88.6 88.4 89.6
2015 51.5 56.3 51.7 58.4
2016 42.2 45.6 42.1 47.2
2017 54.6 57.3 54.5 58.9
2005 61.5 70.1
2010 84.0 84.3
2014 100.0 100.0
2015 91.1 95.3
2016 92.2 91.5
2017 100.4 99.9
Source: Singapore Department of Statistics (DOS)
Source: Singapore Department of Statistics (DOS)
YEAR
YEAR
DOMESTIC SUPPLY PRICE INDEX (DSPI)
EXPORT PRICE INDEX (EPI)
IMPORT PRICE INDEX (IPI)
LIQUEFIED PETROLEUM GAS (LPG)
SINGAPORE MANUFACTURED
PRODUCTS PRICE INDEX (SMPPI)
PETROL

SOLAR89
06SOL AR
SINGAPORE ENERGY STATISTICS 2018 90
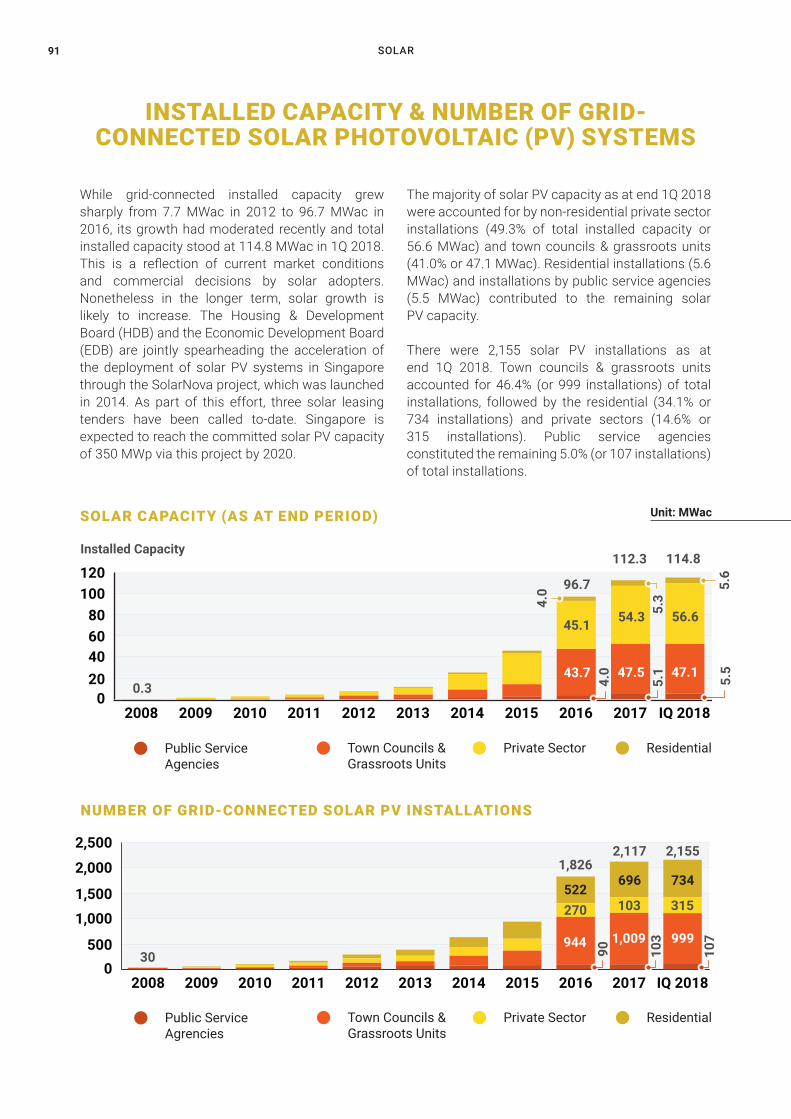
SOLAR91
INSTALLED CAPACITY & NUMBER OF GRID-CONNECTED SOLAR PHOTOVOLTAIC (PV) SYSTEMS
While grid-connected installed capacity grew sharply from 7.7 MWac in 2012 to 96.7 MWac in 2016, its growth had moderated recently and total installed capacity stood at 114.8 MWac in 1Q 2018. This is a reflection of current market conditions and commercial decisions by solar adopters. Nonetheless in the longer term, solar growth is likely to increase. The Housing & Development Board (HDB) and the Economic Development Board (EDB) are jointly spearheading the acceleration of the deployment of solar PV systems in Singapore through the SolarNova project, which was launched in 2014. As part of this effort, three solar leasing tenders have been called to-date. Singapore is expected to reach the committed solar PV capacity of 350 MWp via this project by 2020.
The majority of solar PV capacity as at end 1Q 2018 were accounted for by non-residential private sector installations (49.3% of total installed capacity or 56.6 MWac) and town councils & grassroots units (41.0% or 47.1 MWac). Residential installations (5.6 MWac) and installations by public service agencies (5.5 MWac) contributed to the remaining solar PV capacity.
There were 2,155 solar PV installations as at end 1Q 2018. Town councils & grassroots units accounted for 46.4% (or 999 installations) of total installations, followed by the residential (34.1% or 734 installations) and private sectors (14.6% or 315 installations). Public service agencies constituted the remaining 5.0% (or 107 installations) of total installations.
SOLAR CAPACITY (AS AT END PERIOD)
NUMBER OF GRID-CONNECTED SOLAR PV INSTALLATIONS
Unit: MWac
Residential
Private Sector
Town Councils & Grassroots Units
Public Service Agencies
020406080
100120
IQ 20182017201620152014201320122011201020092008
ResidentialPublic Service Agencies
Town Councils & Grassroots Units
Private Sector
Installed Capacity
5.3
5.6
4.0
5.1
5.5
4.0
112.3
96.7
114.8
54.3 56.645.1
47.5 47.143.70.3
Residential
Private Sector
Town Councils & Grassroots Units
Public Service Agencies
IQ 201820172016201520142013201220112010200920080
500
1,000
1,500
2,000
2,500
ResidentialPublic Service Agrencies
Town Councils & Grassroots Units
Private Sector
2,1171,826
2,155
103 315
696 734
1,009 999
103
107
30
270522
944
90
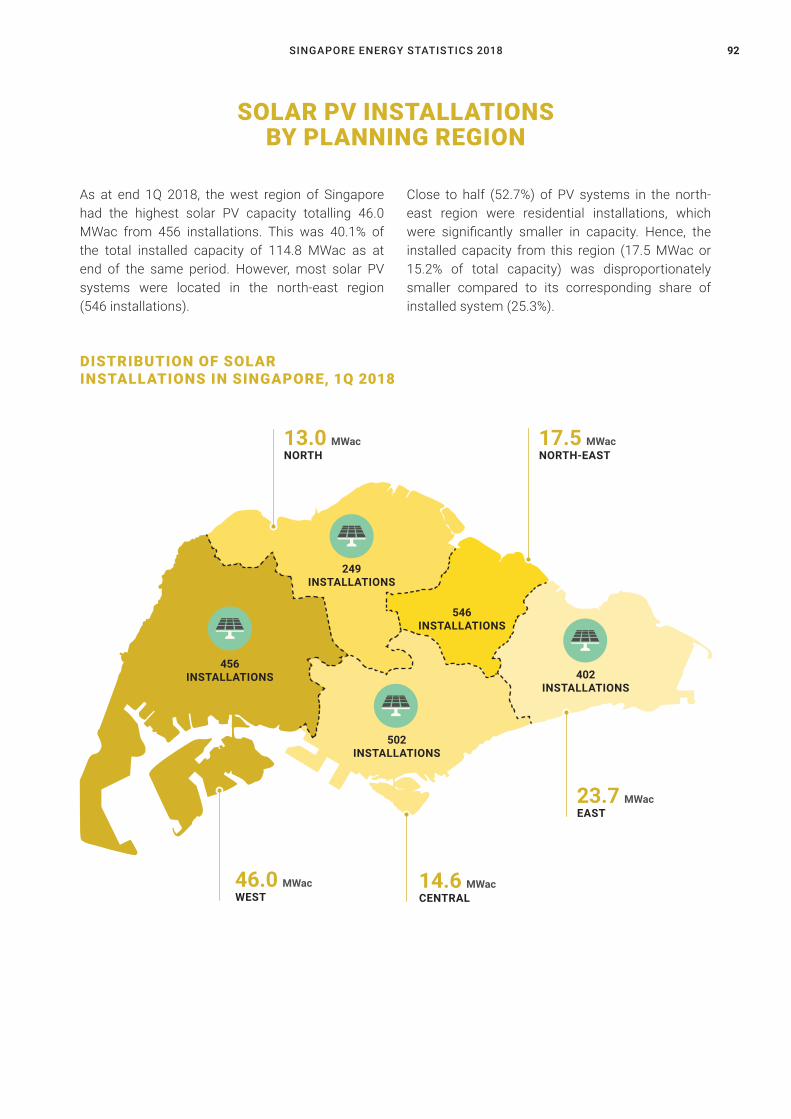
SINGAPORE ENERGY STATISTICS 2018 92
DISTRIBUTION OF SOLAR INSTALLATIONS IN SINGAPORE, 1Q 2018
SOLAR PV INSTALLATIONS BY PLANNING REGION
As at end 1Q 2018, the west region of Singapore had the highest solar PV capacity totalling 46.0 MWac from 456 installations. This was 40.1% of the total installed capacity of 114.8 MWac as at end of the same period. However, most solar PV systems were located in the north-east region (546 installations).
Close to half (52.7%) of PV systems in the north-east region were residential installations, which were significantly smaller in capacity. Hence, the installed capacity from this region (17.5 MWac or 15.2% of total capacity) was disproportionately smaller compared to its corresponding share of installed system (25.3%).
NORTH-EAST
EAST
CENTRALWEST
NORTH
546 INSTALLATIONS
402 INSTALLATIONS
502 INSTALLATIONS
456 INSTALLATIONS
249 INSTALLATIONS
17.5 MWac
23.7 MWac
14.6 MWac46.0 MWac
13.0 MWac
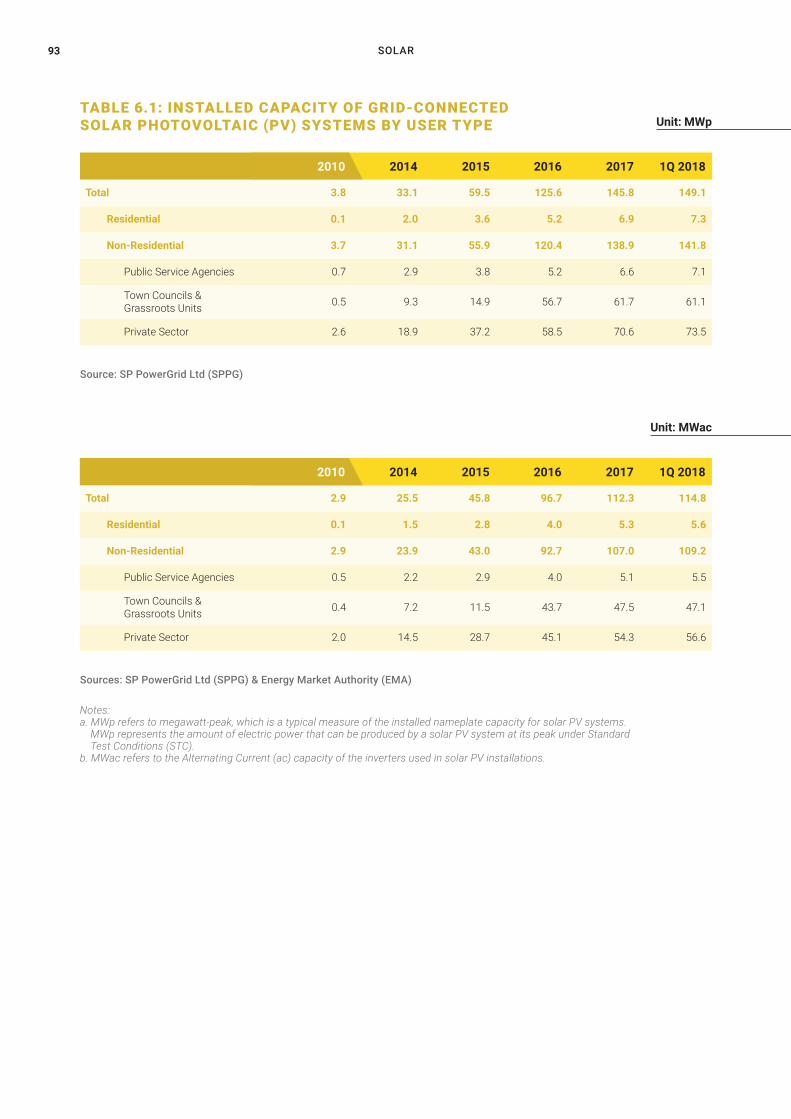
SOLAR93
TABLE 6.1: INSTALLED CAPACITY OF GRID-CONNECTED SOLAR PHOTOVOLTAIC (PV) SYSTEMS BY USER TYPE
Total 3.8 33.1 59.5 125.6 145.8 149.1
Residential 0.1 2.0 3.6 5.2 6.9 7.3
Non-Residential 3.7 31.1 55.9 120.4 138.9 141.8
Public Service Agencies 0.7 2.9 3.8 5.2 6.6 7.1
Town Councils & Grassroots Units 0.5 9.3 14.9 56.7 61.7 61.1
Private Sector 2.6 18.9 37.2 58.5 70.6 73.5
Total 2.9 25.5 45.8 96.7 112.3 114.8
Residential 0.1 1.5 2.8 4.0 5.3 5.6
Non-Residential 2.9 23.9 43.0 92.7 107.0 109.2
Public Service Agencies 0.5 2.2 2.9 4.0 5.1 5.5
Town Councils & Grassroots Units 0.4 7.2 11.5 43.7 47.5 47.1
Private Sector 2.0 14.5 28.7 45.1 54.3 56.6
2010 2014
Unit: MWp
Unit: MWac
2015 2016 2017 1Q 2018
Notes: a. MWp refers to megawatt-peak, which is a typical measure of the installed nameplate capacity for solar PV systems. MWp represents the amount of electric power that can be produced by a solar PV system at its peak under Standard Test Conditions (STC). b. MWac refers to the Alternating Current (ac) capacity of the inverters used in solar PV installations.
Source: SP PowerGrid Ltd (SPPG)
Sources: SP PowerGrid Ltd (SPPG) & Energy Market Authority (EMA)
2010 2014 2015 2016 2017 1Q 2018
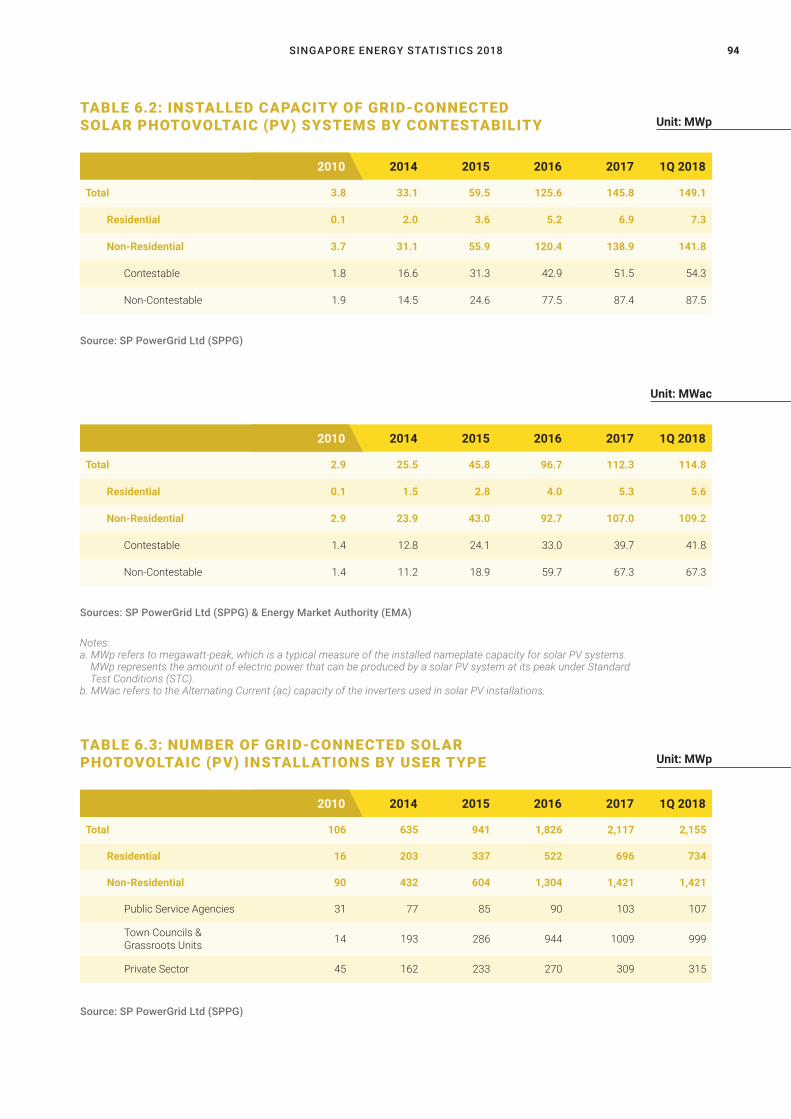
SINGAPORE ENERGY STATISTICS 2018 94
TABLE 6.2: INSTALLED CAPACITY OF GRID-CONNECTED SOLAR PHOTOVOLTAIC (PV) SYSTEMS BY CONTESTABILITY
Total 3.8 33.1 59.5 125.6 145.8 149.1
Residential 0.1 2.0 3.6 5.2 6.9 7.3
Non-Residential 3.7 31.1 55.9 120.4 138.9 141.8
Contestable 1.8 16.6 31.3 42.9 51.5 54.3
Non-Contestable 1.9 14.5 24.6 77.5 87.4 87.5
Total 2.9 25.5 45.8 96.7 112.3 114.8
Residential 0.1 1.5 2.8 4.0 5.3 5.6
Non-Residential 2.9 23.9 43.0 92.7 107.0 109.2
Contestable 1.4 12.8 24.1 33.0 39.7 41.8
Non-Contestable 1.4 11.2 18.9 59.7 67.3 67.3
Unit: MWp
Unit: MWac
Notes: a. MWp refers to megawatt-peak, which is a typical measure of the installed nameplate capacity for solar PV systems. MWp represents the amount of electric power that can be produced by a solar PV system at its peak under Standard Test Conditions (STC). b. MWac refers to the Alternating Current (ac) capacity of the inverters used in solar PV installations.
Source: SP PowerGrid Ltd (SPPG)
Sources: SP PowerGrid Ltd (SPPG) & Energy Market Authority (EMA)
TABLE 6.3: NUMBER OF GRID-CONNECTED SOLAR PHOTOVOLTAIC (PV) INSTALLATIONS BY USER TYPE
Total 106 635 941 1,826 2,117 2,155
Residential 16 203 337 522 696 734
Non-Residential 90 432 604 1,304 1,421 1,421
Public Service Agencies 31 77 85 90 103 107
Town Councils & Grassroots Units 14 193 286 944 1009 999
Private Sector 45 162 233 270 309 315
Unit: MWp
Source: SP PowerGrid Ltd (SPPG)
2010 2014 2015 2016 2017 1Q 2018
2010 2014 2015 2016 2017 1Q 2018
2010 2014 2015 2016 2017 1Q 2018
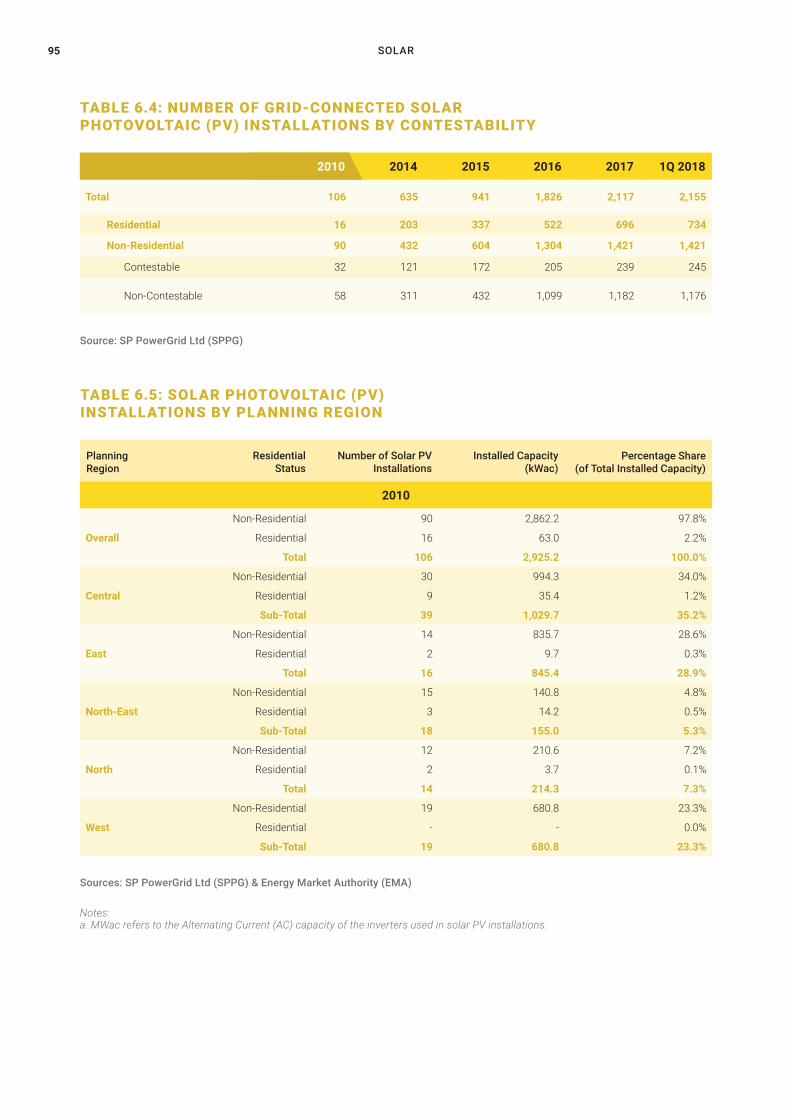
SOLAR95
TABLE 6.4: NUMBER OF GRID-CONNECTED SOLAR PHOTOVOLTAIC (PV) INSTALLATIONS BY CONTESTABILITY
TABLE 6.5: SOLAR PHOTOVOLTAIC (PV) INSTALLATIONS BY PLANNING REGION
Total 106 635 941 1,826 2,117 2,155
Residential 16 203 337 522 696 734
Non-Residential 90 432 604 1,304 1,421 1,421
Contestable 32 121 172 205 239 245
Non-Contestable 58 311 432 1,099 1,182 1,176
Source: SP PowerGrid Ltd (SPPG)
2010 2014
2010
2015 2016 2017 1Q 2018
Non-Residential 90 2,862.2 97.8%
Overall Residential 16 63.0 2.2%
Total 106 2,925.2 100.0%
Non-Residential 30 994.3 34.0%
Central Residential 9 35.4 1.2%
Sub-Total 39 1,029.7 35.2%
Non-Residential 14 835.7 28.6%
East Residential 2 9.7 0.3%
Total 16 845.4 28.9%
Non-Residential 15 140.8 4.8%
North-East Residential 3 14.2 0.5%
Sub-Total 18 155.0 5.3%
Non-Residential 12 210.6 7.2%
North Residential 2 3.7 0.1%
Total 14 214.3 7.3%
Non-Residential 19 680.8 23.3%
West Residential - - 0.0%
Sub-Total 19 680.8 23.3%
Planning Region
Installed Capacity (kWac)
Number of Solar PV Installations
Residential Status
Percentage Share (of Total Installed Capacity)
Notes: a. MWac refers to the Alternating Current (AC) capacity of the inverters used in solar PV installations.
Sources: SP PowerGrid Ltd (SPPG) & Energy Market Authority (EMA)
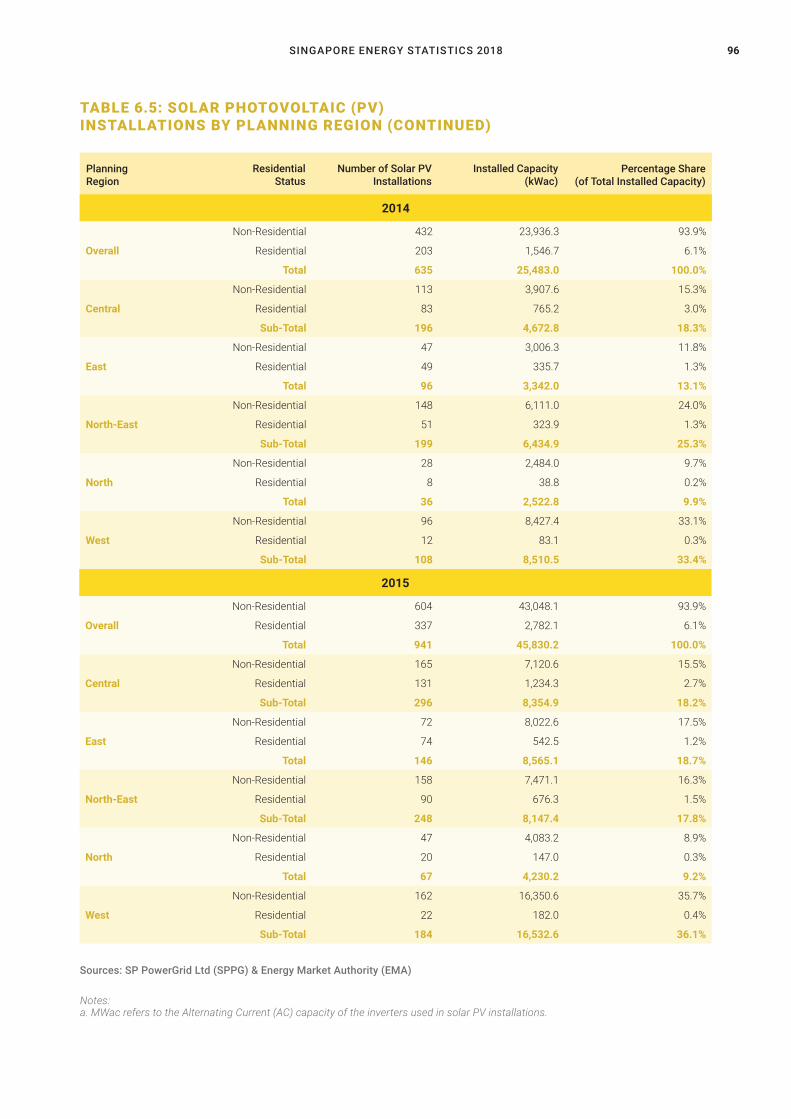
SINGAPORE ENERGY STATISTICS 2018 96
TABLE 6.5: SOLAR PHOTOVOLTAIC (PV) INSTALLATIONS BY PLANNING REGION (CONTINUED)
2014
2015
Non-Residential 432 23,936.3 93.9%
Overall Residential 203 1,546.7 6.1%
Total 635 25,483.0 100.0%
Non-Residential 113 3,907.6 15.3%
Central Residential 83 765.2 3.0%
Sub-Total 196 4,672.8 18.3%
Non-Residential 47 3,006.3 11.8%
East Residential 49 335.7 1.3%
Total 96 3,342.0 13.1%
Non-Residential 148 6,111.0 24.0%
North-East Residential 51 323.9 1.3%
Sub-Total 199 6,434.9 25.3%
Non-Residential 28 2,484.0 9.7%
North Residential 8 38.8 0.2%
Total 36 2,522.8 9.9%
Non-Residential 96 8,427.4 33.1%
West Residential 12 83.1 0.3%
Sub-Total 108 8,510.5 33.4%
Non-Residential 604 43,048.1 93.9%
Overall Residential 337 2,782.1 6.1%
Total 941 45,830.2 100.0%
Non-Residential 165 7,120.6 15.5%
Central Residential 131 1,234.3 2.7%
Sub-Total 296 8,354.9 18.2%
Non-Residential 72 8,022.6 17.5%
East Residential 74 542.5 1.2%
Total 146 8,565.1 18.7%
Non-Residential 158 7,471.1 16.3%
North-East Residential 90 676.3 1.5%
Sub-Total 248 8,147.4 17.8%
Non-Residential 47 4,083.2 8.9%
North Residential 20 147.0 0.3%
Total 67 4,230.2 9.2%
Non-Residential 162 16,350.6 35.7%
West Residential 22 182.0 0.4%
Sub-Total 184 16,532.6 36.1%
Planning Region
Installed Capacity (kWac)
Number of Solar PV Installations
Residential Status
Percentage Share (of Total Installed Capacity)
Notes: a. MWac refers to the Alternating Current (AC) capacity of the inverters used in solar PV installations.
Sources: SP PowerGrid Ltd (SPPG) & Energy Market Authority (EMA)
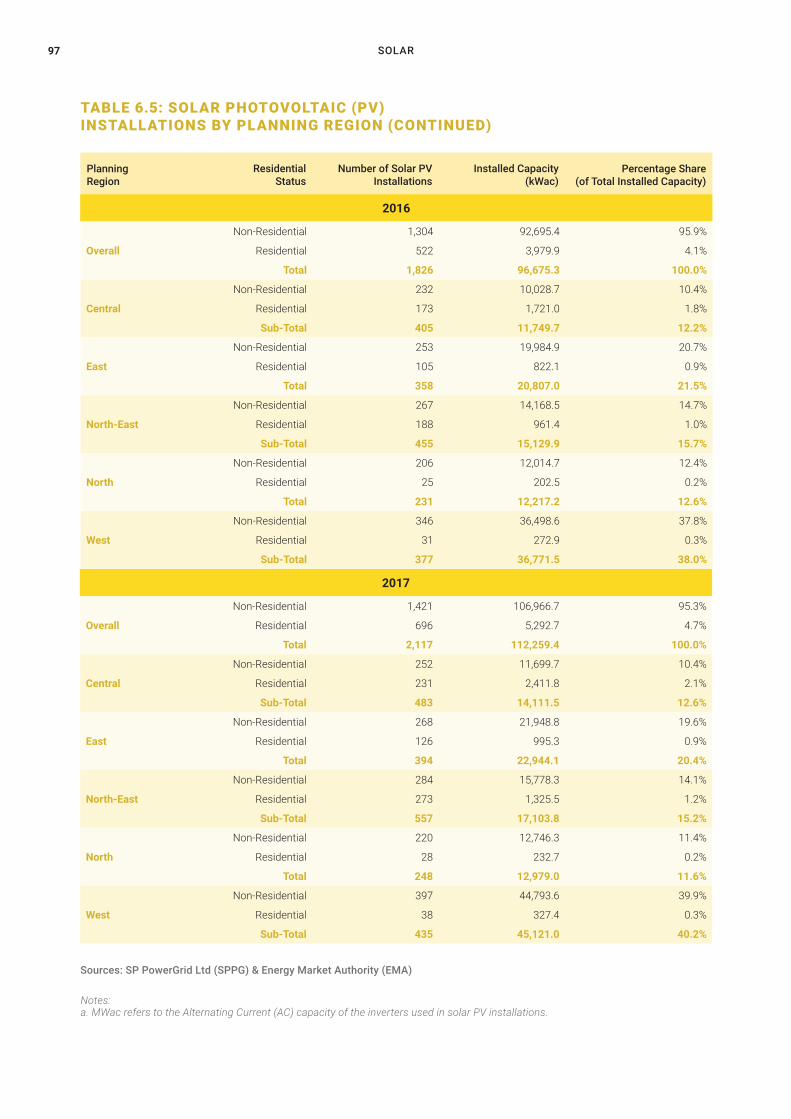
SOLAR97
TABLE 6.5: SOLAR PHOTOVOLTAIC (PV) INSTALLATIONS BY PLANNING REGION (CONTINUED)
2016
2017
Non-Residential 1,304 92,695.4 95.9%
Overall Residential 522 3,979.9 4.1%
Total 1,826 96,675.3 100.0%
Non-Residential 232 10,028.7 10.4%
Central Residential 173 1,721.0 1.8%
Sub-Total 405 11,749.7 12.2%
Non-Residential 253 19,984.9 20.7%
East Residential 105 822.1 0.9%
Total 358 20,807.0 21.5%
Non-Residential 267 14,168.5 14.7%
North-East Residential 188 961.4 1.0%
Sub-Total 455 15,129.9 15.7%
Non-Residential 206 12,014.7 12.4%
North Residential 25 202.5 0.2%
Total 231 12,217.2 12.6%
Non-Residential 346 36,498.6 37.8%
West Residential 31 272.9 0.3%
Sub-Total 377 36,771.5 38.0%
Non-Residential 1,421 106,966.7 95.3%
Overall Residential 696 5,292.7 4.7%
Total 2,117 112,259.4 100.0%
Non-Residential 252 11,699.7 10.4%
Central Residential 231 2,411.8 2.1%
Sub-Total 483 14,111.5 12.6%
Non-Residential 268 21,948.8 19.6%
East Residential 126 995.3 0.9%
Total 394 22,944.1 20.4%
Non-Residential 284 15,778.3 14.1%
North-East Residential 273 1,325.5 1.2%
Sub-Total 557 17,103.8 15.2%
Non-Residential 220 12,746.3 11.4%
North Residential 28 232.7 0.2%
Total 248 12,979.0 11.6%
Non-Residential 397 44,793.6 39.9%
West Residential 38 327.4 0.3%
Sub-Total 435 45,121.0 40.2%
Planning Region
Installed Capacity (kWac)
Number of Solar PV Installations
Residential Status
Percentage Share (of Total Installed Capacity)
Notes: a. MWac refers to the Alternating Current (AC) capacity of the inverters used in solar PV installations.
Sources: SP PowerGrid Ltd (SPPG) & Energy Market Authority (EMA)
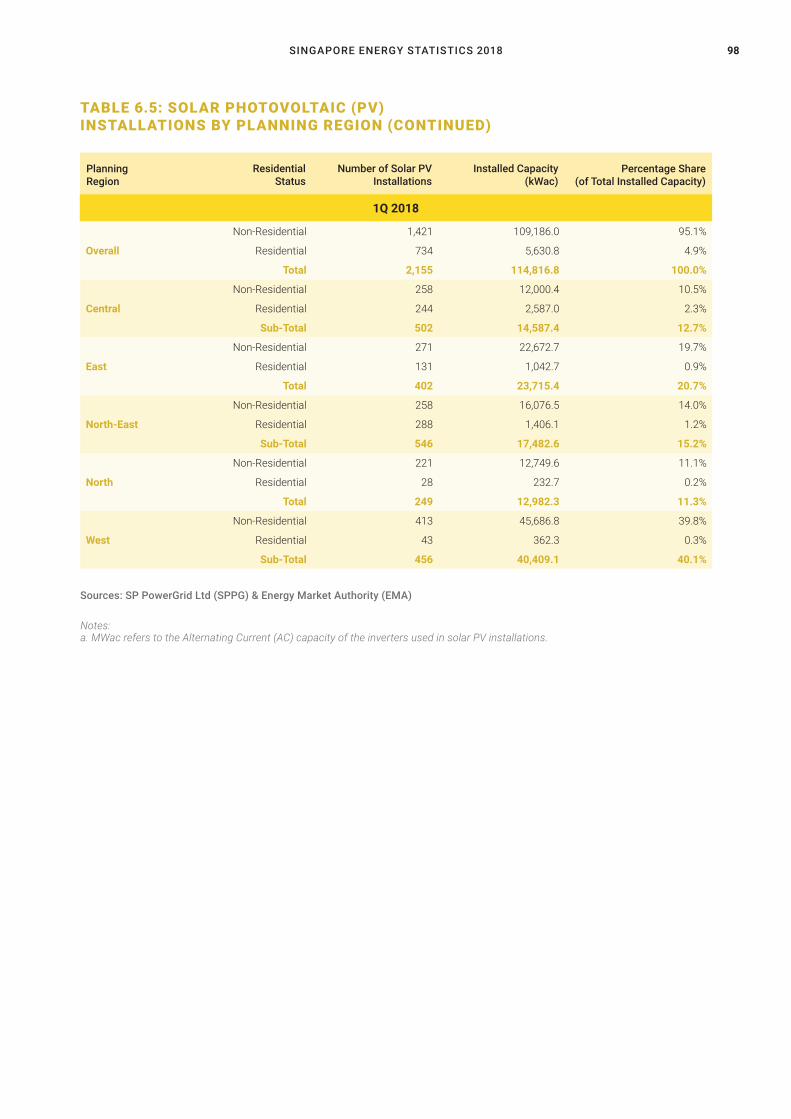
SINGAPORE ENERGY STATISTICS 2018 98
TABLE 6.5: SOLAR PHOTOVOLTAIC (PV) INSTALLATIONS BY PLANNING REGION (CONTINUED)
1Q 2018
Non-Residential 1,421 109,186.0 95.1%
Overall Residential 734 5,630.8 4.9%
Total 2,155 114,816.8 100.0%
Non-Residential 258 12,000.4 10.5%
Central Residential 244 2,587.0 2.3%
Sub-Total 502 14,587.4 12.7%
Non-Residential 271 22,672.7 19.7%
East Residential 131 1,042.7 0.9%
Total 402 23,715.4 20.7%
Non-Residential 258 16,076.5 14.0%
North-East Residential 288 1,406.1 1.2%
Sub-Total 546 17,482.6 15.2%
Non-Residential 221 12,749.6 11.1%
North Residential 28 232.7 0.2%
Total 249 12,982.3 11.3%
Non-Residential 413 45,686.8 39.8%
West Residential 43 362.3 0.3%
Sub-Total 456 40,409.1 40.1%
Planning Region
Installed Capacity (kWac)
Number of Solar PV Installations
Residential Status
Percentage Share (of Total Installed Capacity)
Notes: a. MWac refers to the Alternating Current (AC) capacity of the inverters used in solar PV installations.
Sources: SP PowerGrid Ltd (SPPG) & Energy Market Authority (EMA)
OTHER ENERGY-RELATED STATISTICS99
04ENERGYB AL ANCE
07
OTHER ENE RGY-RELATED STATISTICS

SINGAPORE ENERGY STATISTICS 2018 100
04EN ERGYBA L A N C E
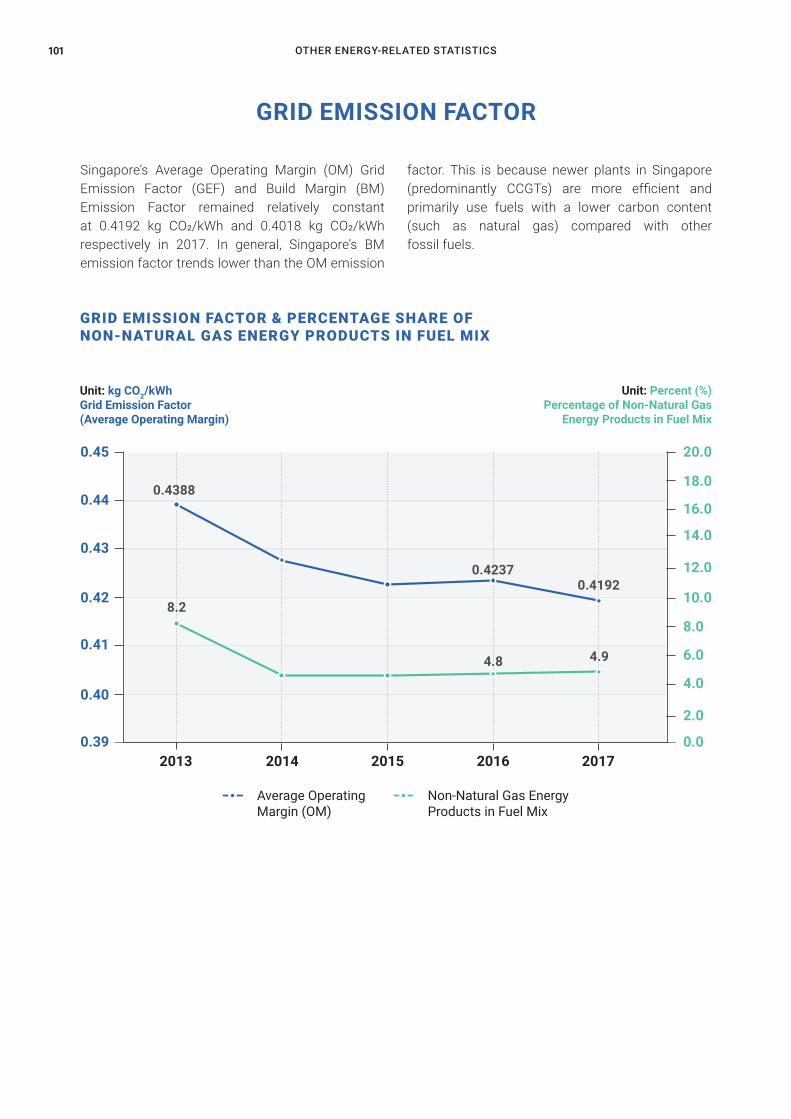
OTHER ENERGY-RELATED STATISTICS101
20.0
16.0
12.0
8.0
4.0
0.0
2.0
18.0
14.0
6.0
10.0
0.45
0.44
0.43
0.42
0.41
0.40
0.392013 2014 2015 2016 2017
GRID EMISSION FACTOR & PERCENTAGE SHARE OF NON-NATURAL GAS ENERGY PRODUCTS IN FUEL MIX
GRID EMISSION FACTOR
Singapore’s Average Operating Margin (OM) Grid Emission Factor (GEF) and Build Margin (BM) Emission Factor remained relatively constant at 0.4192 kg CO2/kWh and 0.4018 kg CO2/kWh respectively in 2017. In general, Singapore’s BM emission factor trends lower than the OM emission
factor. This is because newer plants in Singapore (predominantly CCGTs) are more efficient and primarily use fuels with a lower carbon content (such as natural gas) compared with other fossil fuels.
Average Operating Margin (OM)
Non-Natural Gas Energy Products in Fuel Mix
Unit: Percent (%)Percentage of Non-Natural Gas
Energy Products in Fuel Mix
Unit: kg CO2/kWhGrid Emission Factor(Average Operating Margin)
0.4388
0.41920.4237
4.94.8
8.2
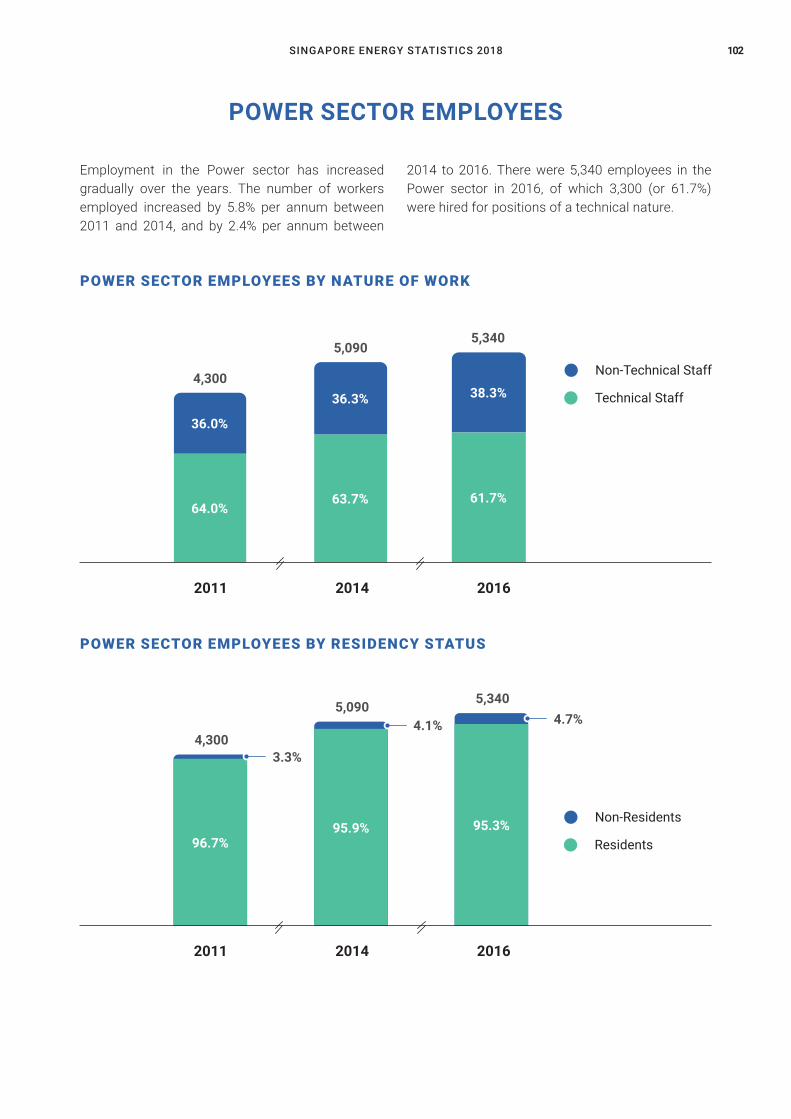
SINGAPORE ENERGY STATISTICS 2018 102
4,300
POWER SECTOR EMPLOYEES BY NATURE OF WORK
POWER SECTOR EMPLOYEES BY RESIDENCY STATUS
Non-Technical Staff
Non-Residents
Technical Staff
Residents
2011
2011
2014
2014
2016
2016
POWER SECTOR EMPLOYEES
Employment in the Power sector has increased gradually over the years. The number of workers employed increased by 5.8% per annum between 2011 and 2014, and by 2.4% per annum between
2014 to 2016. There were 5,340 employees in the Power sector in 2016, of which 3,300 (or 61.7%) were hired for positions of a technical nature.
5,3405,090
4,30038.3%36.3%
36.0%
61.7%63.7%64.0%
5,3405,0904.7%4.1%
95.3%95.9%96.7%
3.3%
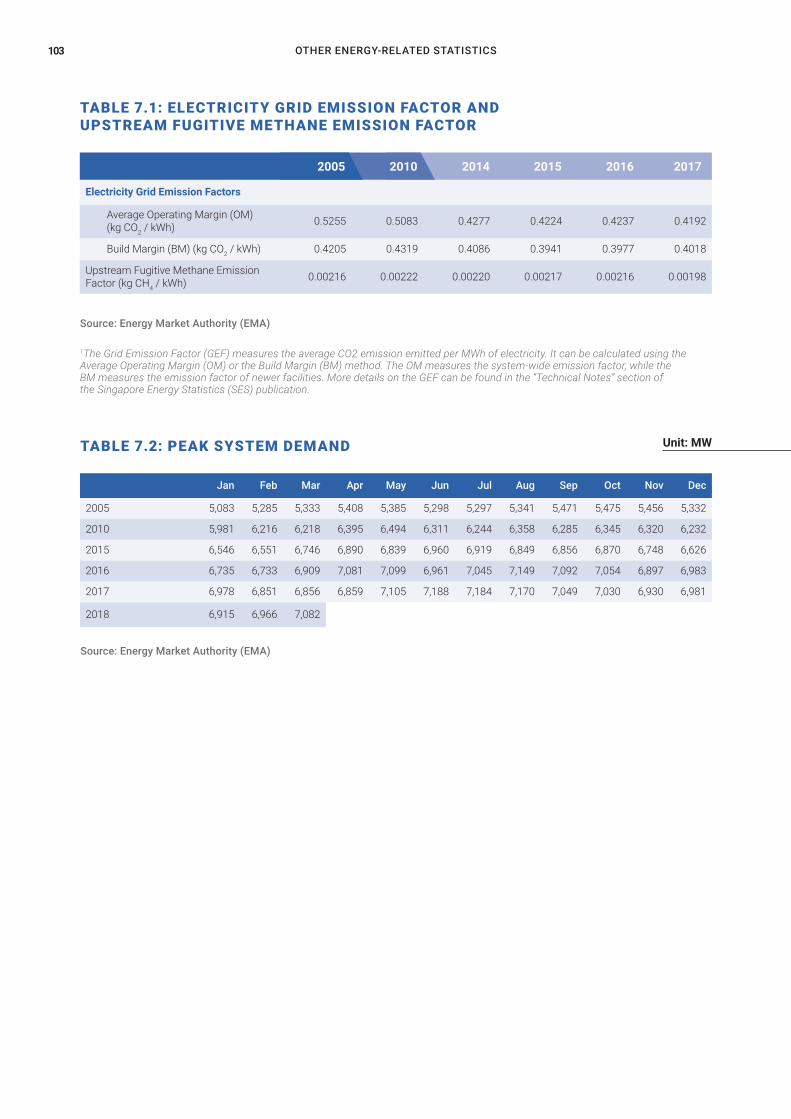
OTHER ENERGY-RELATED STATISTICS103
Jan Feb Mar Apr May Jun Jul Aug Sep Oct Nov Dec
2005 5,083 5,285 5,333 5,408 5,385 5,298 5,297 5,341 5,471 5,475 5,456 5,332
2010 5,981 6,216 6,218 6,395 6,494 6,311 6,244 6,358 6,285 6,345 6,320 6,232
2015 6,546 6,551 6,746 6,890 6,839 6,960 6,919 6,849 6,856 6,870 6,748 6,626
2016 6,735 6,733 6,909 7,081 7,099 6,961 7,045 7,149 7,092 7,054 6,897 6,983
2017 6,978 6,851 6,856 6,859 7,105 7,188 7,184 7,170 7,049 7,030 6,930 6,981
2018 6,915 6,966 7,082
TABLE 7.1: ELECTRICITY GRID EMISSION FACTOR AND UPSTREAM FUGITIVE METHANE EMISSION FACTOR
TABLE 7.2: PEAK SYSTEM DEMAND
Electricity Grid Emission Factors
Average Operating Margin (OM) (kg CO2 / kWh) 0.5255 0.5083 0.4277 0.4224 0.4237 0.4192
Build Margin (BM) (kg CO2 / kWh) 0.4205 0.4319 0.4086 0.3941 0.3977 0.4018
Upstream Fugitive Methane Emission Factor (kg CH4 / kWh) 0.00216 0.00222 0.00220 0.00217 0.00216 0.00198
Source: Energy Market Authority (EMA)
2005 2010 2014 2015 2016 2017
1The Grid Emission Factor (GEF) measures the average CO2 emission emitted per MWh of electricity. It can be calculated using the Average Operating Margin (OM) or the Build Margin (BM) method. The OM measures the system-wide emission factor, while the BM measures the emission factor of newer facilities. More details on the GEF can be found in the “Technical Notes” section of the Singapore Energy Statistics (SES) publication.
Unit: MW
Source: Energy Market Authority (EMA)
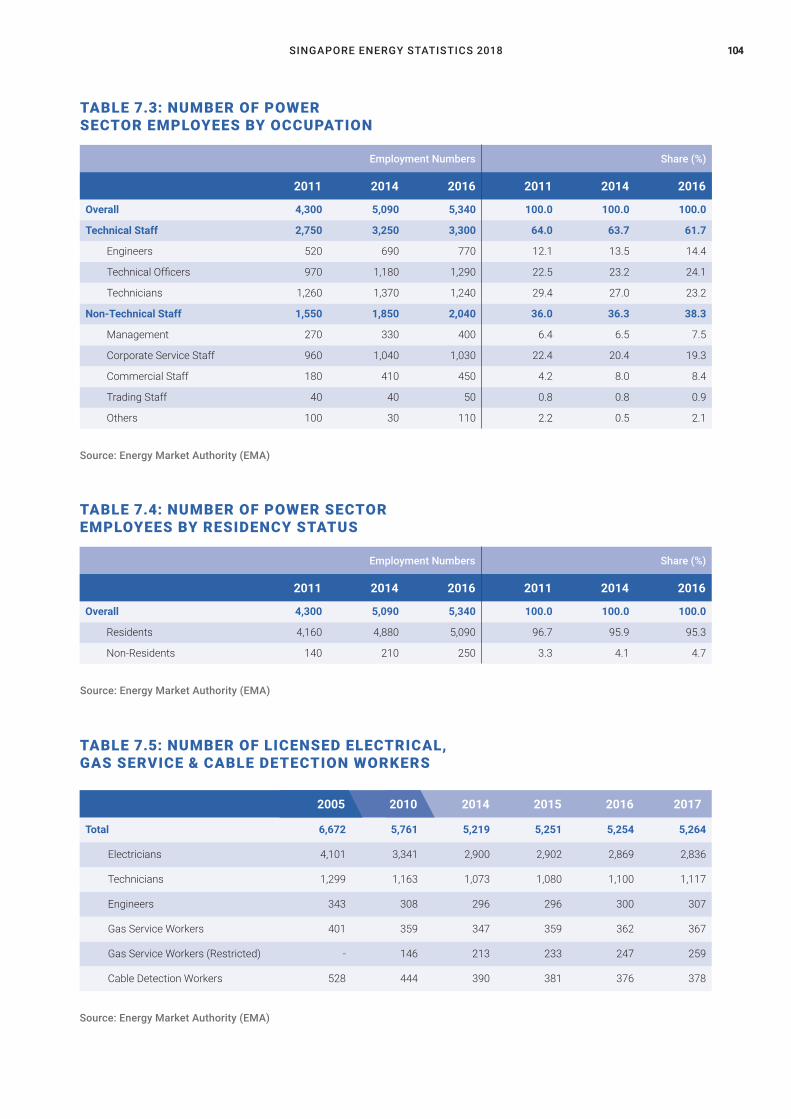
SINGAPORE ENERGY STATISTICS 2018 104
Overall 4,300 5,090 5,340 100.0 100.0 100.0
Technical Staff 2,750 3,250 3,300 64.0 63.7 61.7
Engineers 520 690 770 12.1 13.5 14.4
Technical Officers 970 1,180 1,290 22.5 23.2 24.1
Technicians 1,260 1,370 1,240 29.4 27.0 23.2
Non-Technical Staff 1,550 1,850 2,040 36.0 36.3 38.3
Management 270 330 400 6.4 6.5 7.5
Corporate Service Staff 960 1,040 1,030 22.4 20.4 19.3
Commercial Staff 180 410 450 4.2 8.0 8.4
Trading Staff 40 40 50 0.8 0.8 0.9
Others 100 30 110 2.2 0.5 2.1
Overall 4,300 5,090 5,340 100.0 100.0 100.0
Residents 4,160 4,880 5,090 96.7 95.9 95.3
Non-Residents 140 210 250 3.3 4.1 4.7
Employment Numbers
Employment Numbers
Share (%)
Share (%)
2011
2011
2014
2014
2016
2016
2011
2011
2014
2014
2016
2016
TABLE 7.5: NUMBER OF LICENSED ELECTRICAL, GAS SERVICE & CABLE DETECTION WORKERS
TABLE 7.3: NUMBER OF POWER SECTOR EMPLOYEES BY OCCUPATION
TABLE 7.4: NUMBER OF POWER SECTOR EMPLOYEES BY RESIDENCY STATUS
Total 6,672 5,761 5,219 5,251 5,254 5,264
Electricians 4,101 3,341 2,900 2,902 2,869 2,836
Technicians 1,299 1,163 1,073 1,080 1,100 1,117
Engineers 343 308 296 296 300 307
Gas Service Workers 401 359 347 359 362 367
Gas Service Workers (Restricted) - 146 213 233 247 259
Cable Detection Workers 528 444 390 381 376 378
2005 2010 2014 2015 2016 2017
Source: Energy Market Authority (EMA)
Source: Energy Market Authority (EMA)
Source: Energy Market Authority (EMA)

OTHER ENERGY-RELATED STATISTICS105
08TECHNICALNOTES

SINGAPORE ENERGY STATISTICS 2018 106

TECHNICAL NOTES107
OBJECTIVES
SOURCES OF DATA
COMPILATION FRAMEWORK & METHODOLOGY
UNITS OF MEASUREMENT
Singapore Energy Statistics 2018 provides users with findings and statistics relating to Singapore’s energy supply, transformation and demand.
The data used in the publication were mainly obtained through administrative returns from licensees and through surveys. EMA licensees are required to submit regulatory returns under the Electricity and Gas Acts. Energy statistics collected through the Joint Energy and Emissions Statistics Survey were also used in this publication. This survey is conducted by EMA Research and Statistics Unit (RSU) together with those of the Economic Development Board (EDB) and the National Environment Agency (NEA) under the Statistics Act.
Other sources of data featured in this publication include energy products trade statistics from the Enterprise Singapore, energy consumption statistics from the NEA and prices statistics from the Singapore Department of Statistics (DOS).
In compiling the energy statistics, EMA closely follows the recommended principles and methodologies set out in the International Energy Agency (IEA)’s Energy Statistics Manual. For the computation of the electricity grid emission factors and upstream fugitive methane emission factor, methodologies recommended by the Intergovernmental Panel on Climate Change (IPCC) are adopted.
Energy products are recorded in their original units of measure. As these units of measure vary, quantities of energy products need to be converted into a common unit to allow for comparison and aggregation. The common unit of measurement used to measure energy products in this publication is the tonne of oil equivalent (toe). According to the IEA, the tonne of oil equivalent is defined as follows:
The tonne of oil equivalent should be regarded as a measure of energy content rather than a physical quantity. One tonne of oil is not equal to one tonne of oil equivalent.
1 tonne of oil equivalent = 41.868 gigajoules (GJ) = 11,630 kilowatt hours (kWh)
108SINGAPORE ENERGY STATISTICS 2018
CALORIFIC VALUES
ENERGY BALANCE
EMA uses Net Calorific Values (NCV) to convert all fuels from their original units to tonnes of oil equivalent (toe), unless otherwise stated. This change seeks to standardise the conversion practice for all fuel types, as natural gas, notably in the derivation of import values and electricity generated, was previously derived using the Gross Calorific Values (GCV).
The following prefixes are used for multiples of the various units of measure:
An energy balance is an accounting framework for compilation and reconciliation of data on all energy products entering, exiting, and used within the national territory of a given country during a reference period.
It expresses all forms of energy in a common accounting unit, and shows the relationships between the inputs to, and the outputs from the energy transformation industries.
The balance is divided into three main blocks:
All prices and tariffs are presented in Singapore dollars.
a) The top block (Energy Supply). This shows the flow representing energy entering and leaving the national territory. It also includes stock changes to provide information on total energy supply on the national territory during the reference period;
b) The middle block (Energy Transformation). This shows how energy is transformed, transferred, and used by energy industries for their own use and losses in distribution and transmission; and
c) The bottom block (Final Consumption). This shows final energy consumption by energy consumers.
kilo (k) = 1,000 or 103
mega (M) = 1,000,000 or 106
giga (G) = 1,000,000,000 or 109
tera (T) = 1,000,000,000,000 or 1012
TECHNICAL NOTES109
RE-REFERENCING PRICE INDICES
GRID EMISSION FACTOR & METHANE EMISSION FACTOR
To allow comparisons between the movements of different prices, price indices series are pegged to a reference year. This is because of the shift from expressing the price indices in relation to a specific base year, to expressing the price indices in relation to a reference year common across all price indices.
The methodologies for the compilation of Grid Emission Factor (GEF) are based on the United Nations Framework Convention on Climate Change (UNFCCC) Clean Development Mechanism (CDM) Methodological Tool. This is the “Tool to calculate the emission factor for an electricity system” and the UNFCCC CDM Approved Baseline Methodology (AM) 0029 Baseline Methodology for grid connected electricity generation plants using natural gas.
GEF measures average CO2 emissions emitted per unit net electricity generated. It is calculated using the Average Operating Margin (OM) method. This is the generation-weighted average CO2 emission per unit of
ELECTRICITY & GAS TARIFFS
FUEL MIX FOR ELECTRICITY GENERATION
Annual and quarterly electricity and gas tariffs refer to the weighted average of tariffs for the specific periods as they may be adjusted at various periods throughout the year.
The fuel mix for electricity generation can be calculated using either the input or output method.This publication presents fuel mix data compiled by the output method.
The input method calculates the fuel mix for electricity generation based on the ratio of volume of fuel input to generation units. It does not take into account variations in energy content of fuel used by different companies for electricity generation, nor variations in fuel-to-electricity conversion efficiency of the generating plants.
The output method uses the amount of electricity generated and the corresponding type of fuel used to calculate the fuel mix for electricity generation. It takes the domestic fuel-to-electricity conversion efficiency of the generating plants and the type of plants used into account.
110SINGAPORE ENERGY STATISTICS 2018
ENERGY PRODUCTS
INDUSTRIAL ACTIVITY
PLANNING REGION/AREA
Energy products refer to products exclusively or mainly used as a source of energy. They include energy in forms suitable for direct use (for instance, electricity and heat) and energy products that release energy while undergoing some chemical or other process (such as combustion). The classification of energy products is based on the Singapore Trade Classification, Customs & Excise Duties 2012 (STCCED 2012 or HS 2012). STCCED classification adopts the ASEAN Harmonised Tariff Nomenclature 2012 (AHTN 2012). This is based on the 6-digit Harmonised Commodity Description and Coding System developed by the World Customs Organisation (WCO) for the classification of goods.
Industrial activity refers to the principal activity undertaken by the enterprise. This is where the enterprise devotes most of its resources; or from which it derives most of its income. The classification of the principal activity of the enterprise in the SES 2016 is based on the Singapore Standard Industrial Classification, 2015 (SSIC 2015). SSIC 2015 adopts the basic framework and principles of the International Standard Industrial Classification of all Economic Activities (ISIC).
Planning Region/Area refers to those demarcated in the Urban Redevelopment Authority’s Master Plan 2014.
CLASSIFICATION
net electricity generation of all generating power plants serving the electricity grid. GEF by Build Margin (BM) method refers to the generation-weighted average CO2 emission per unit of net electricity generation of the five most recently built power units and/or the set of power capacity additions that comprise at least 20% of the total system electricity generation.
Upstream fugitive Methane Emission Factor (MEF) from electricity generation measures the average CH4 emission per unit of net electricity generated. The methodology is similar to the BM method. However, it is based on the five most recently built power units that run on natural gas. These five plants should also generate at least 20% of total system electricity generation.

OTHER ENERGY-RELATED STATISTICS111
09GLOSSARY

SINGAPORE ENERGY STATISTICS 2018 112
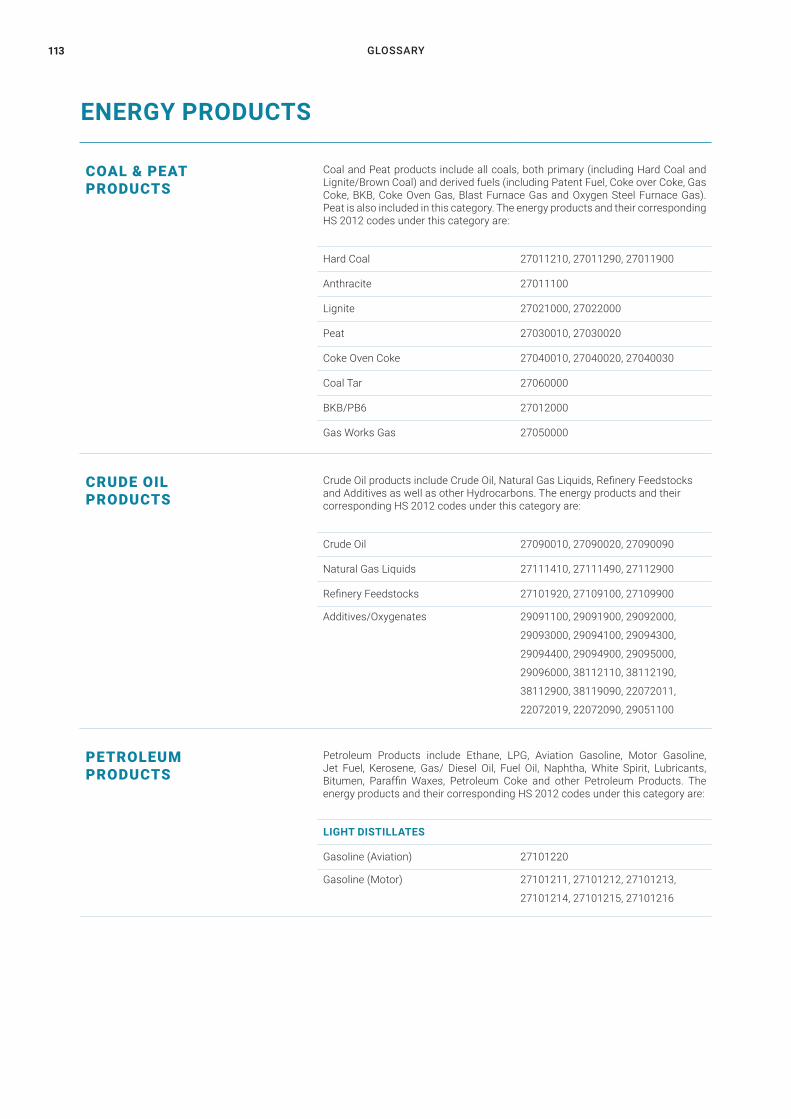
GLOSSARY113
ENERGY PRODUCTS
COAL & PEAT PRODUCTS
Coal and Peat products include all coals, both primary (including Hard Coal and Lignite/Brown Coal) and derived fuels (including Patent Fuel, Coke over Coke, Gas Coke, BKB, Coke Oven Gas, Blast Furnace Gas and Oxygen Steel Furnace Gas). Peat is also included in this category. The energy products and their corresponding HS 2012 codes under this category are:
Hard Coal 27011210, 27011290, 27011900
Anthracite 27011100
Lignite 27021000, 27022000
Peat 27030010, 27030020
Coke Oven Coke 27040010, 27040020, 27040030
Coal Tar 27060000
BKB/PB6 27012000
Gas Works Gas 27050000
CRUDE OILPRODUCTS
Crude Oil products include Crude Oil, Natural Gas Liquids, Refinery Feedstocks and Additives as well as other Hydrocarbons. The energy products and their corresponding HS 2012 codes under this category are:
Crude Oil 27090010, 27090020, 27090090
Natural Gas Liquids 27111410, 27111490, 27112900
Refinery Feedstocks 27101920, 27109100, 27109900
Additives/Oxygenates 29091100, 29091900, 29092000,
29093000, 29094100, 29094300,
29094400, 29094900, 29095000,
29096000, 38112110, 38112190,
38112900, 38119090, 22072011,
22072019, 22072090, 29051100
PETROLEUMPRODUCTS
Petroleum Products include Ethane, LPG, Aviation Gasoline, Motor Gasoline, Jet Fuel, Kerosene, Gas/ Diesel Oil, Fuel Oil, Naphtha, White Spirit, Lubricants, Bitumen, Paraffin Waxes, Petroleum Coke and other Petroleum Products. The energy products and their corresponding HS 2012 codes under this category are:
LIGHT DISTILLATES
Gasoline (Aviation) 27101220
Gasoline (Motor) 27101211, 27101212, 27101213,
27101214, 27101215, 27101216
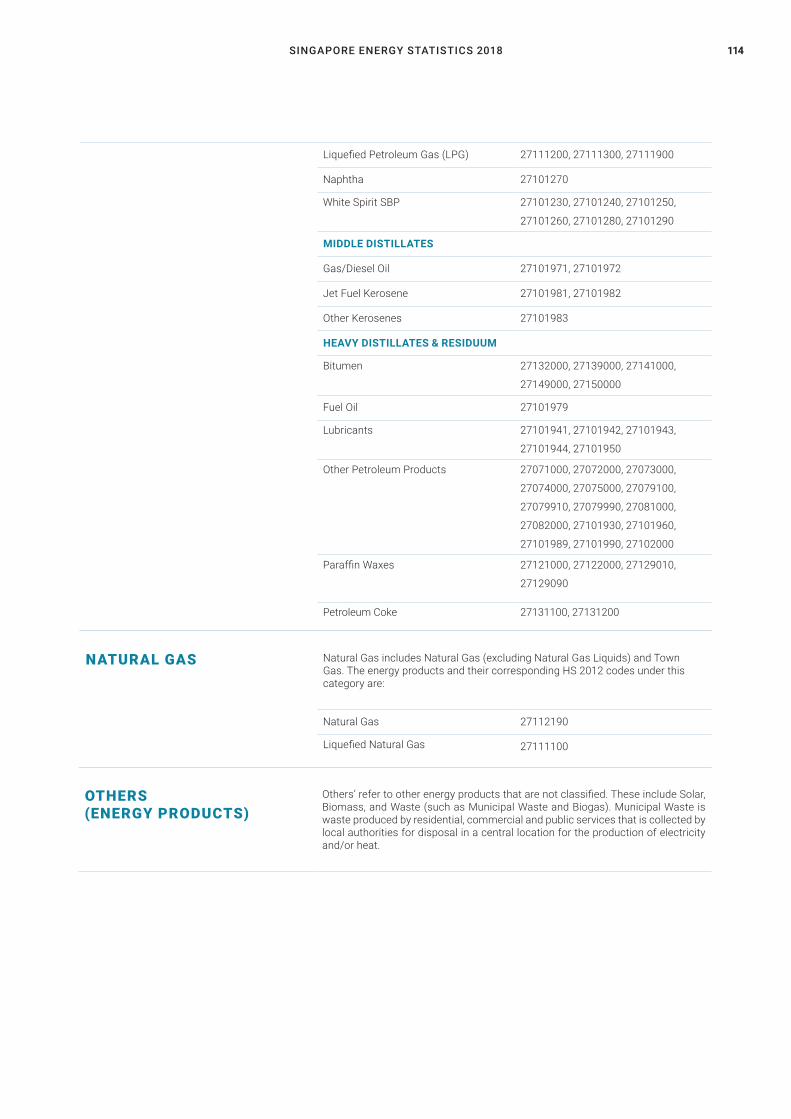
SINGAPORE ENERGY STATISTICS 2018 114
Liquefied Petroleum Gas (LPG) 27111200, 27111300, 27111900
Naphtha 27101270
White Spirit SBP 27101230, 27101240, 27101250,
27101260, 27101280, 27101290
MIDDLE DISTILLATES
Gas/Diesel Oil 27101971, 27101972
Jet Fuel Kerosene 27101981, 27101982
Other Kerosenes 27101983
HEAVY DISTILLATES & RESIDUUM
Bitumen 27132000, 27139000, 27141000,
27149000, 27150000
Fuel Oil 27101979
Lubricants 27101941, 27101942, 27101943,
27101944, 27101950
Other Petroleum Products 27071000, 27072000, 27073000,
27074000, 27075000, 27079100,
27079910, 27079990, 27081000,
27082000, 27101930, 27101960,
27101989, 27101990, 27102000
Paraffin Waxes 27121000, 27122000, 27129010,
27129090
Petroleum Coke 27131100, 27131200
NATURAL GAS Natural Gas includes Natural Gas (excluding Natural Gas Liquids) and Town Gas. The energy products and their corresponding HS 2012 codes under this category are:
Natural Gas 27112190
Liquefied Natural Gas 27111100
OTHERS (ENERGY PRODUCTS)
Others’ refer to other energy products that are not classified. These include Solar, Biomass, and Waste (such as Municipal Waste and Biogas). Municipal Waste is waste produced by residential, commercial and public services that is collected by local authorities for disposal in a central location for the production of electricity and/or heat.
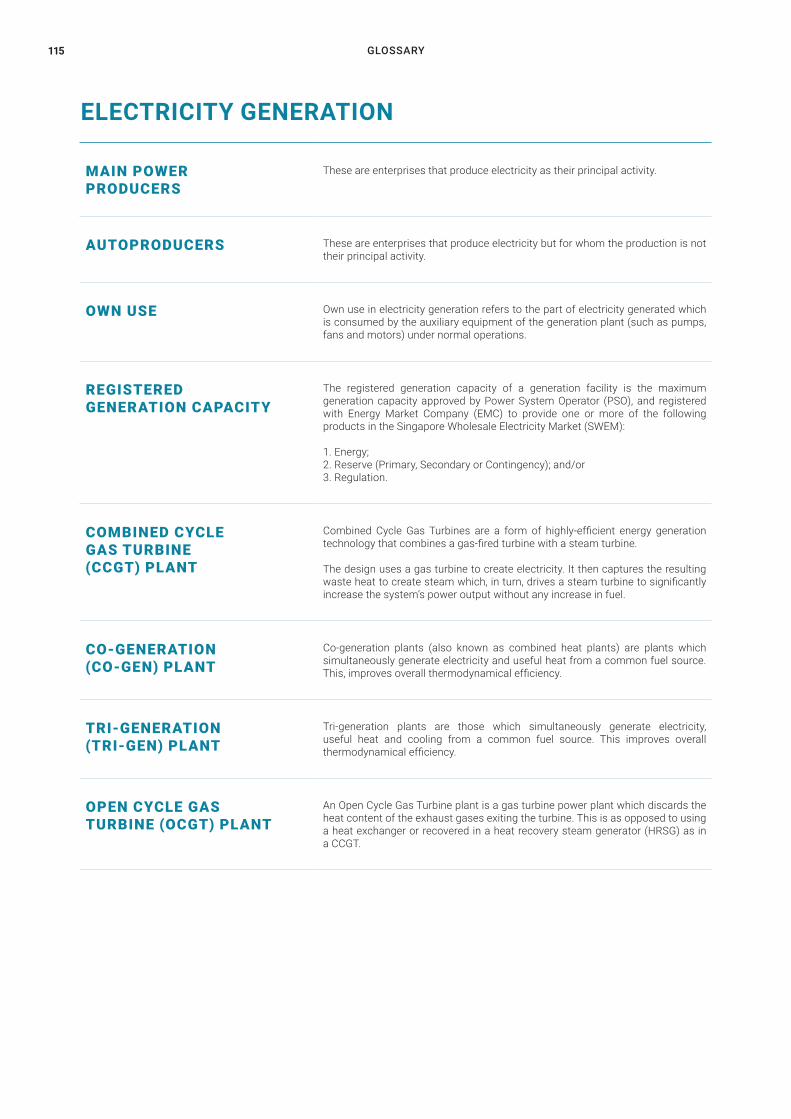
GLOSSARY115
ELECTRICITY GENERATION
MAIN POWER PRODUCERS
These are enterprises that produce electricity as their principal activity.
AUTOPRODUCERS These are enterprises that produce electricity but for whom the production is not their principal activity.
OWN USE Own use in electricity generation refers to the part of electricity generated which is consumed by the auxiliary equipment of the generation plant (such as pumps, fans and motors) under normal operations.
REGISTERED GENERATION CAPACITY
The registered generation capacity of a generation facility is the maximum generation capacity approved by Power System Operator (PSO), and registered with Energy Market Company (EMC) to provide one or more of the following products in the Singapore Wholesale Electricity Market (SWEM):
1. Energy;2. Reserve (Primary, Secondary or Contingency); and/or3. Regulation.
COMBINED CYCLEGAS TURBINE(CCGT) PLANT
Combined Cycle Gas Turbines are a form of highly-efficient energy generation technology that combines a gas-fired turbine with a steam turbine.
The design uses a gas turbine to create electricity. It then captures the resulting waste heat to create steam which, in turn, drives a steam turbine to significantly increase the system’s power output without any increase in fuel.
CO-GENERATION(CO-GEN) PLANT
Co-generation plants (also known as combined heat plants) are plants which simultaneously generate electricity and useful heat from a common fuel source. This, improves overall thermodynamical efficiency.
TRI-GENERATION(TRI-GEN) PLANT
Tri-generation plants are those which simultaneously generate electricity, useful heat and cooling from a common fuel source. This improves overall thermodynamical efficiency.
OPEN CYCLE GASTURBINE (OCGT) PLANT
An Open Cycle Gas Turbine plant is a gas turbine power plant which discards the heat content of the exhaust gases exiting the turbine. This is as opposed to using a heat exchanger or recovered in a heat recovery steam generator (HRSG) as in a CCGT.
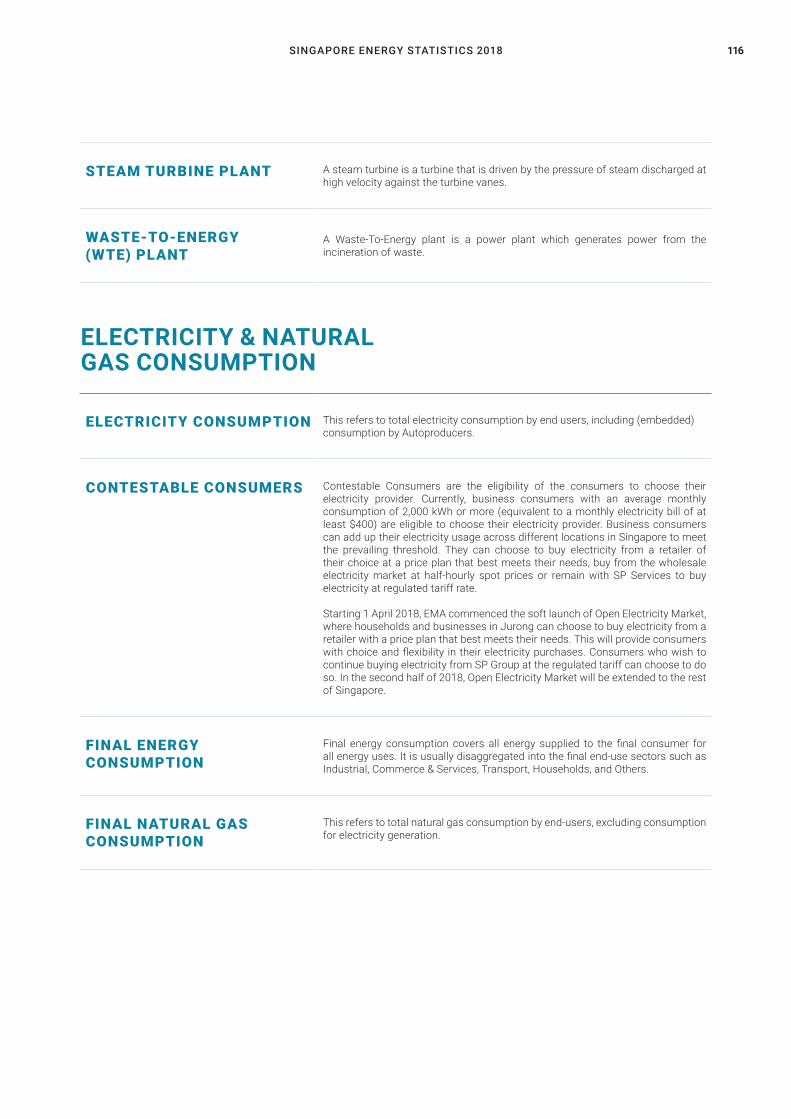
SINGAPORE ENERGY STATISTICS 2018 116
ELECTRICITY & NATURAL GAS CONSUMPTION
ELECTRICITY CONSUMPTION This refers to total electricity consumption by end users, including (embedded) consumption by Autoproducers.
CONTESTABLE CONSUMERS Contestable Consumers are the eligibility of the consumers to choose their electricity provider. Currently, business consumers with an average monthly consumption of 2,000 kWh or more (equivalent to a monthly electricity bill of at least $400) are eligible to choose their electricity provider. Business consumers can add up their electricity usage across different locations in Singapore to meet the prevailing threshold. They can choose to buy electricity from a retailer of their choice at a price plan that best meets their needs, buy from the wholesale electricity market at half-hourly spot prices or remain with SP Services to buy electricity at regulated tariff rate.
Starting 1 April 2018, EMA commenced the soft launch of Open Electricity Market, where households and businesses in Jurong can choose to buy electricity from a retailer with a price plan that best meets their needs. This will provide consumers with choice and flexibility in their electricity purchases. Consumers who wish to continue buying electricity from SP Group at the regulated tariff can choose to do so. In the second half of 2018, Open Electricity Market will be extended to the rest of Singapore.
FINAL ENERGY CONSUMPTION
Final energy consumption covers all energy supplied to the final consumer for all energy uses. It is usually disaggregated into the final end-use sectors such as Industrial, Commerce & Services, Transport, Households, and Others.
FINAL NATURAL GAS CONSUMPTION
This refers to total natural gas consumption by end-users, excluding consumption for electricity generation.
STEAM TURBINE PLANT A steam turbine is a turbine that is driven by the pressure of steam discharged at high velocity against the turbine vanes.
WASTE-TO-ENERGY (WTE) PLANT
A Waste-To-Energy plant is a power plant which generates power from the incineration of waste.
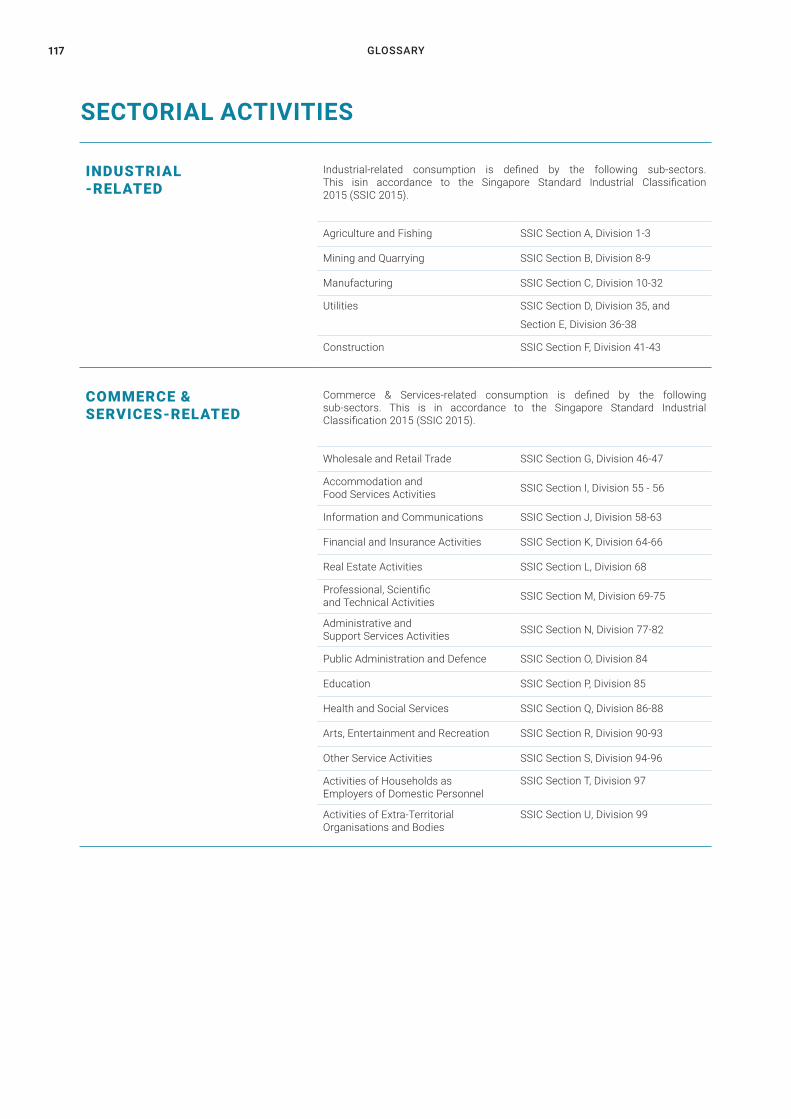
GLOSSARY117
SECTORIAL ACTIVITIES
INDUSTRIAL-RELATED
Industrial-related consumption is defined by the following sub-sectors. This isin accordance to the Singapore Standard Industrial Classification 2015 (SSIC 2015).
Agriculture and Fishing SSIC Section A, Division 1-3
Mining and Quarrying SSIC Section B, Division 8-9
Manufacturing SSIC Section C, Division 10-32
Utilities SSIC Section D, Division 35, and
Section E, Division 36-38
Construction SSIC Section F, Division 41-43
COMMERCE &SERVICES-RELATED
Commerce & Services-related consumption is defined by the following sub-sectors. This is in accordance to the Singapore Standard Industrial Classification 2015 (SSIC 2015).
Wholesale and Retail Trade SSIC Section G, Division 46-47
Accommodation and Food Services Activities SSIC Section I, Division 55 - 56
Information and Communications SSIC Section J, Division 58-63
Financial and Insurance Activities SSIC Section K, Division 64-66
Real Estate Activities SSIC Section L, Division 68
Professional, Scientific and Technical Activities SSIC Section M, Division 69-75
Administrative and Support Services Activities SSIC Section N, Division 77-82
Public Administration and Defence SSIC Section O, Division 84
Education SSIC Section P, Division 85
Health and Social Services SSIC Section Q, Division 86-88
Arts, Entertainment and Recreation SSIC Section R, Division 90-93
Other Service Activities SSIC Section S, Division 94-96
Activities of Households as Employers of Domestic Personnel
SSIC Section T, Division 97
Activities of Extra-Territorial Organisations and Bodies
SSIC Section U, Division 99
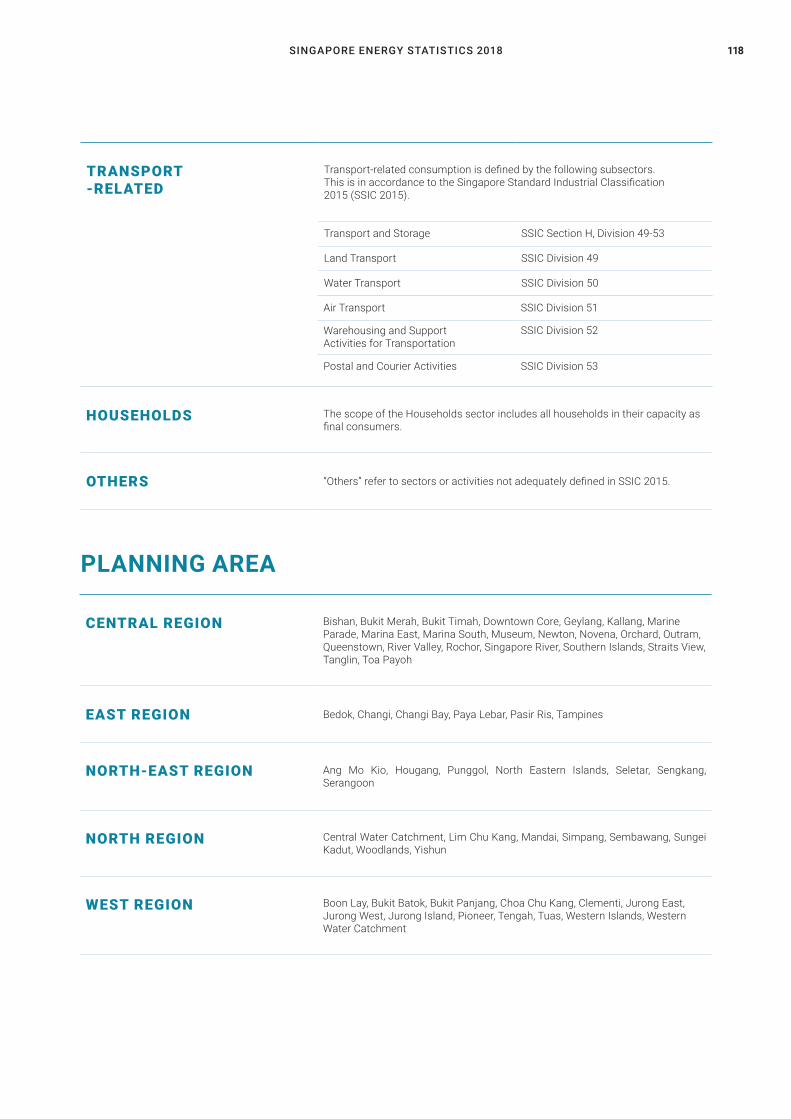
SINGAPORE ENERGY STATISTICS 2018 118
Air Transport SSIC Division 51
Warehousing and Support Activities for Transportation
SSIC Division 52
Postal and Courier Activities SSIC Division 53
TRANSPORT-RELATED
Transport-related consumption is defined by the following subsectors. This is in accordance to the Singapore Standard Industrial Classification 2015 (SSIC 2015).
Transport and Storage SSIC Section H, Division 49-53
Land Transport SSIC Division 49
Water Transport SSIC Division 50
HOUSEHOLDS The scope of the Households sector includes all households in their capacity as final consumers.
OTHERS “Others” refer to sectors or activities not adequately defined in SSIC 2015.
PLANNING AREA
CENTRAL REGION Bishan, Bukit Merah, Bukit Timah, Downtown Core, Geylang, Kallang, Marine Parade, Marina East, Marina South, Museum, Newton, Novena, Orchard, Outram, Queenstown, River Valley, Rochor, Singapore River, Southern Islands, Straits View, Tanglin, Toa Payoh
EAST REGION Bedok, Changi, Changi Bay, Paya Lebar, Pasir Ris, Tampines
NORTH-EAST REGION Ang Mo Kio, Hougang, Punggol, North Eastern Islands, Seletar, Sengkang, Serangoon
NORTH REGION Central Water Catchment, Lim Chu Kang, Mandai, Simpang, Sembawang, Sungei Kadut, Woodlands, Yishun
WEST REGION Boon Lay, Bukit Batok, Bukit Panjang, Choa Chu Kang, Clementi, Jurong East, Jurong West, Jurong Island, Pioneer, Tengah, Tuas, Western Islands, Western Water Catchment
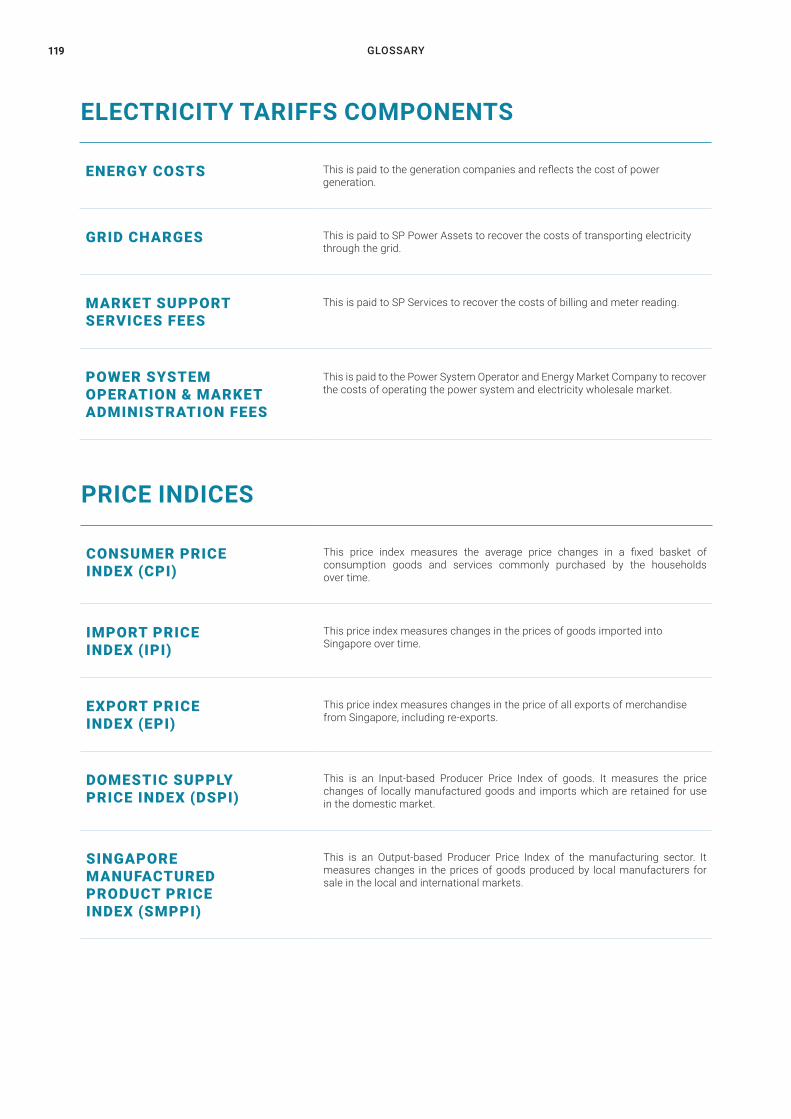
GLOSSARY119
ELECTRICITY TARIFFS COMPONENTS
PRICE INDICES
ENERGY COSTS This is paid to the generation companies and reflects the cost of power generation.
GRID CHARGES This is paid to SP Power Assets to recover the costs of transporting electricity through the grid.
MARKET SUPPORT SERVICES FEES
This is paid to SP Services to recover the costs of billing and meter reading.
POWER SYSTEM OPERATION & MARKET ADMINISTRATION FEES
This is paid to the Power System Operator and Energy Market Company to recover the costs of operating the power system and electricity wholesale market.
CONSUMER PRICE INDEX (CPI)
This price index measures the average price changes in a fixed basket of consumption goods and services commonly purchased by the households over time.
IMPORT PRICE INDEX (IPI)
This price index measures changes in the prices of goods imported into Singapore over time.
EXPORT PRICE INDEX (EPI)
This price index measures changes in the price of all exports of merchandise from Singapore, including re-exports.
DOMESTIC SUPPLY PRICE INDEX (DSPI)
This is an Input-based Producer Price Index of goods. It measures the price changes of locally manufactured goods and imports which are retained for use in the domestic market.
SINGAPORE MANUFACTURED PRODUCT PRICE INDEX (SMPPI)
This is an Output-based Producer Price Index of the manufacturing sector. It measures changes in the prices of goods produced by local manufacturers for sale in the local and international markets.
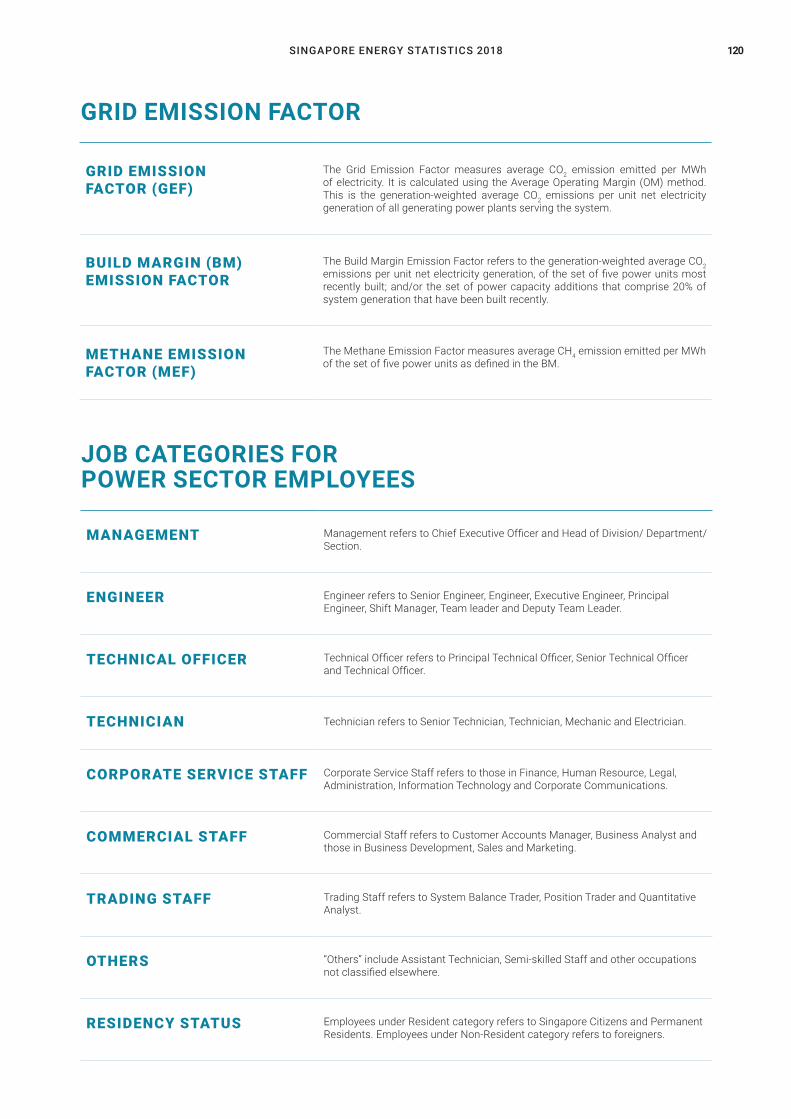
SINGAPORE ENERGY STATISTICS 2018 120
GRID EMISSION FACTOR
JOB CATEGORIES FOR POWER SECTOR EMPLOYEES
GRID EMISSION FACTOR (GEF)
The Grid Emission Factor measures average CO2 emission emitted per MWh of electricity. It is calculated using the Average Operating Margin (OM) method. This is the generation-weighted average CO2 emissions per unit net electricity generation of all generating power plants serving the system.
BUILD MARGIN (BM) EMISSION FACTOR
The Build Margin Emission Factor refers to the generation-weighted average CO2 emissions per unit net electricity generation, of the set of five power units most recently built; and/or the set of power capacity additions that comprise 20% of system generation that have been built recently.
METHANE EMISSION FACTOR (MEF)
The Methane Emission Factor measures average CH4 emission emitted per MWh of the set of five power units as defined in the BM.
MANAGEMENT Management refers to Chief Executive Officer and Head of Division/ Department/ Section.
ENGINEER Engineer refers to Senior Engineer, Engineer, Executive Engineer, Principal Engineer, Shift Manager, Team leader and Deputy Team Leader.
TECHNICAL OFFICER Technical Officer refers to Principal Technical Officer, Senior Technical Officer and Technical Officer.
TECHNICIAN Technician refers to Senior Technician, Technician, Mechanic and Electrician.
CORPORATE SERVICE STAFF Corporate Service Staff refers to those in Finance, Human Resource, Legal, Administration, Information Technology and Corporate Communications.
COMMERCIAL STAFF Commercial Staff refers to Customer Accounts Manager, Business Analyst and those in Business Development, Sales and Marketing.
TRADING STAFF Trading Staff refers to System Balance Trader, Position Trader and Quantitative Analyst.
OTHERS “Others” include Assistant Technician, Semi-skilled Staff and other occupations not classified elsewhere.
RESIDENCY STATUS Employees under Resident category refers to Singapore Citizens and Permanent Residents. Employees under Non-Resident category refers to foreigners.
GLOSSARY121
LICENSED ELECTRICAL, GAS SERVICE AND CABLE DETECTION WORKERS
ELECTRICAL ENGINEER An electrical engineer’s licence entitles the holder to carry out the following elec-trical work:
a. design, install, repair, maintain, operate, inspect, test and take full charge and responsibility for any electrical installation.
b. An electrical engineer’s licence has a range of operation voltage restrictions. They are as follows:-
i. in operation : “up to 1,000 volts”
ii. in operation : “up to 22,000 volts”
iii. in operation : “up to 66,000 volts”
iv. in operation : “up to 230,000 volts”
v. restricted to particular installations
ELECTRICAL TECHNICIAN An electrical technician’s licence entitles the holder to carry out the following elec-trical work:
a. install, repair, maintain, operate, inspect and test an electrical installation where the operating voltage of such an installation does not exceed 1,000 volts and the approved load of such installation does not exceed 500 kVA;
b. design and submit plans and drawings of an electrical installation. The operating voltage of such an installation does not exceed 1,000 volts and the approved load of such installation does not exceed 150 kVA. The limitation of 1,000 volts shall not apply in the case of an Electric Discharge Lighting Circuit; and
c. carry out any work or switching operation as instructed by or under the supervision of an authorised high voltage switching engineer.
SINGAPORE ENERGY STATISTICS 2018 122
ELECTRICIAN An electrician’s licence entitles the holder to carry out the following electrical work:
a. design, install, repair, maintain, operate, inspect and test an electrical/supply installation where the operating voltage of such an installation does not exceed 1,000 volts and the approved load of such installation does not exceed 45 kVA. The limitation of 1,000 volts shall not apply in the case of an Electric Discharge Lighting Circuit;
b. install, repair, maintain and operate, under the supervision of an electrical technician. The operating voltage of the, electrical/supply installation should not exceed 1,000 volts and the approved load of such installation should be more than 45 kVA but does not exceed 500 kVA; and
c. carry out any work as instructed by or under the supervision of an authorised high voltage switching engineer.
GAS SERVICE WORKER A gas service worker licence entitles the holder to carry out the following gas service work where the operating pressure is not more than 30 mbar:
a. to construct, fix, alter, repair and renew gas pipes and fittings;
b. to install, maintain, repair and test gas appliances; and
c. to install or remove gas meters and to turn-on the gas supply on behalf of a gas licensee.
GAS SERVICE WORK (RESTRICTED)
A gas service worker licence (restricted) entitles the holder to carry out the following gas service work where the operating pressure is not more than 30 mbar:
a. to install, maintain, repair and test gas appliances; andb. to install or remove gas meters and to turn-on the gas supply on behalf of a gas licensee.
CABLE DETECTIONWORKERS
A licensed cable detection worker is entitled to perform cable detection work. To minimise damages to electricity cables, it is mandatory to perform cable detection work prior to the commencement of any earthworks.
Cable detection work must be carried out by a licensed cable detection worker. He should inform or advise the earthworks contractor, who engaged him, of the location of the cables detected within the worksite.
OTHER ENERGY-RELATED STATISTICS123

SINGAPORE ENERGY STATISTICS 2018 124

125
SINGAPORE ENERGY STATISTICS 2018 126
Comments on this publication and suggestions for further issues of SES are welcome. Please write to:
E [email protected] +65 6835 8000F +65 6835 8020
RESEARCH & STATISTICS UNITENERGY TECHNOLOGY & DATA DEPARTMENT
ENERGY PLANNING & DEVELOPMENT DIVISIONENERGY MARKET AUTHORITY
991G ALEXANDRA ROAD#01/02-29, SINGAPORE 119975
REPUBLIC OF SINGAPORE

SINGAPORE ENERGY STATISTICS 2018 127
991G ALEXANDRA ROAD #01-29SINGAPORE 119975T +65 6835 8000F +65 6835 8020
www.ema.gov.sgwww.facebook.com/energymarketauthoritywww.twitter.com/ema_sg