€¦ · XLS file · Web view(4) In Jász-Nagykun ... GIS-IP Laboratory, Social Sciences Division,...
676
Gridd These spreadsheets con The va VARIABLE NAME CountryEnglish ISO3 ContinentName Continent CountryCode CountryCodeLong UNRegion ISO2 UNSDCode Resolution PopulationPerUnit ('000) Area LevelUsed Level1Type Level2Type Level3Type Level4Type Level5Type NumUnits RefYearFirst RefYearLast P90E ('000) Cent Columbia 2004. Gridd Columbia For ad
-
Upload
hoangquynh -
Category
Documents
-
view
212 -
download
0
Transcript of €¦ · XLS file · Web view(4) In Jász-Nagykun ... GIS-IP Laboratory, Social Sciences Division,...

Gridded Population of the World (GPW), version 3 betaSummary information
CIESIN, Columbia University, March 2005*Preliminary file-- please check back for updates*
These spreadsheets contain summary information, for countries, continents and the world from GPW v3 beta.The variable (column headings) on the following sheets are defined here.
Recommended citation for use of the GPW database is:
VARIABLE NAMECountryEnglish
ISO3
ContinentName
ContinentCountryCodeCountryCodeLongUNRegion
ISO2
UNSDCode
Resolution
PopulationPerUnit ('000)
Area
LevelUsed
Level1TypeLevel2TypeLevel3TypeLevel4TypeLevel5Type
NumUnits
RefYearFirst
RefYearLast
P90E ('000)
Center for International Earth Science Information Network (CIESIN),Columbia University;and Centro Internacional de Agricultura Tropical (CIAT),
2004. Gridded Population of the World (GPW),Version 3 beta. Palisades, NY: CIESIN,Columbia University. Available at http://beta.sedac.ciesin.columbia.edu/gpw.
For additional information, please send email to: [email protected]

Gridded Population of the World (GPW), version 3 betaSummary information
CIESIN, Columbia University, March 2005*Preliminary file-- please check back for updates*
These spreadsheets contain summary information, for countries, continents and the world from GPW v3 beta.The variable (column headings) on the following sheets are defined here.
Recommended citation for use of the GPW database is:
VARIABLE NAME
Center for International Earth Science Information Network (CIESIN),Columbia University;and Centro Internacional de Agricultura Tropical (CIAT),
2004. Gridded Population of the World (GPW),Version 3 beta. Palisades, NY: CIESIN,Columbia University. Available at http://beta.sedac.ciesin.columbia.edu/gpw.
For additional information, please send email to: [email protected]
P95E ('000)
P00E ('000)
P05E ('000)
P10E ('000)
P15E ('000)
P20E ('000)
UN_P90 ('000)
UN_P95 ('000)
UN_P00 ('000)
UN_P05 ('000)
UN_P10 ('000)
UN_P15 ('000)
UN_P20 ('000)
Diff90
Diff00
Gridded Population of the World (GPW), version 3 betaSummary information
CIESIN, Columbia University, March 2005*Preliminary file-- please check back for updates*
These spreadsheets contain summary information, for countries, continents and the world from GPW v3 beta.The variable (column headings) on the following sheets are defined here.
Recommended citation for use of the GPW database is:
VARIABLE NAME
Center for International Earth Science Information Network (CIESIN),Columbia University;and Centro Internacional de Agricultura Tropical (CIAT),
2004. Gridded Population of the World (GPW),Version 3 beta. Palisades, NY: CIESIN,Columbia University. Available at http://beta.sedac.ciesin.columbia.edu/gpw.
For additional information, please send email to: [email protected]
Source Data: BoundariesSource Data: PopulationEdits and Notes: SpatialEdits and Notes: PopulationNum Settlement Points
Largest PointSmallest PointMean PointUrban Criteria (UN)
Num Urban ExtentsLargest Extent (sq.km)Smallest Extent (sq.km)Mean Extent (sq.km)Sum-All Urban Extents (sq.km)
Largest Extent (pop)Smallest Extent (pop)Mean Extent (pop)Sum-All Urban Extents (pop)
Num UE's from Nighttime Lights
Num UE's from RegressionsNum UE's from DCW Num UE's from other sources
Pct Total Land Area in Urban Extents (sq.km)Pct Total Population in Urban Extents (2000, NSO est.)
Pct Total Population that is urban (2000, UN)
Settlement Point Population SourceSettlement Point Coordinate Source

Gridded Population of the World (GPW), version 3 betaSummary information
CIESIN, Columbia University, March 2005*Preliminary file-- please check back for updates*
These spreadsheets contain summary information, for countries, continents and the world from GPW v3 beta.The variable (column headings) on the following sheets are defined here.
Recommended citation for use of the GPW database is:
DEFINITIONCountry Name in English.
Continent Name in English: continent to which each country belongs (United Nations classification of continents).
United Nations Continent Code: numeric code, unique for each continent.United Nations Country Code: numeric code, unique for each country.United Nations Country Code (long): numeric code, unique for each country.
United Nations Regional Divisions: sets of countries aggregated to form named regions.
International Organization for Standardization, two-letter country code: two-character code unique to each country.
United Nations Statistics Division code: numeric code unique to each country.
Land area in square kilometers from the United Nations Statistics Division.
Name association with level one administrative units: name assigned by the data provider.Name association with level two administrative units: name assigned by the data provider.Name association with level three administrative units: name assigned by the data provider.Name association with level four administrative units: name assigned by the data provider.Name association with level five administrative units: name assigned by the data provider.
Center for International Earth Science Information Network (CIESIN),Columbia University;and Centro Internacional de Agricultura Tropical (CIAT),
2004. Gridded Population of the World (GPW),Version 3 beta. Palisades, NY: CIESIN,Columbia University. Available at http://beta.sedac.ciesin.columbia.edu/gpw.
For additional information, please send email to: [email protected]
International Organization for Standardization, three-letter country code: three character code unique to each country.
Measure of the effective resolution of administrative units in kilometers; calculated as the square root of the land area divided by the number of administrative units.
Average population per administrative unit; 2000 population estimate divided by the number of units. All figures are rounded and expressed per thousand.
Level of administrative united used for GPW gridding; the administrative unit levels are categorized as follows: 0=country, 1=state/province, 2=county (or equivalent), 3= sub-county units (e.g., census units such as tracts or subdivisions), 4=local statistical area, and 5=sub-locations. Note that some data have lower levels available (e.g., India) but they were not always used.
Total number of administrative units at the level used: sum of the unique administrative units (not unique polygons, units may be split across polygons) at the level used for gridding GPW v3.
First year of population figures used to adjust data to 1990 and 1995 estimates. Where only one year of population estimates was obtained, that date is given in RefYearLast and this field is left empty.
Latest year of population figures used to adjust data to 1990 and 1995 estimates. Where only one year of population figures exists, it is referenced here and UN figures were used to adjust the data to 1990 and 1995.
Population estimate for 1990 based on figures produced by national statistical agency (or similar institutions): the sum of administrative unit population estimates for each country, after interpolation or extrapolation to 1990 (if necessary). All figures are rounded and expressed per thousand.

Gridded Population of the World (GPW), version 3 betaSummary information
CIESIN, Columbia University, March 2005*Preliminary file-- please check back for updates*
These spreadsheets contain summary information, for countries, continents and the world from GPW v3 beta.The variable (column headings) on the following sheets are defined here.
Recommended citation for use of the GPW database is:
DEFINITION
Center for International Earth Science Information Network (CIESIN),Columbia University;and Centro Internacional de Agricultura Tropical (CIAT),
2004. Gridded Population of the World (GPW),Version 3 beta. Palisades, NY: CIESIN,Columbia University. Available at http://beta.sedac.ciesin.columbia.edu/gpw.
For additional information, please send email to: [email protected]
Population estimate for 1995 based on figures produced by national statistical agency (or similar institutions): the sum of administrative unit population estimates for each country, after interpolation or extrapolation to 1995 (if necessary). All figures are rounded and expressed per thousand.
Population estimate for 2000 based on figures produced by national statistical agency (or similar institutions): the sum of administrative unit population estimates for each country, after interpolation or extrapolation to 2000 (if necessary). All figures are rounded and expressed per thousand.
Population estimate for 2005 based on figures produced by national statistical agency (or similar institutions): the sum of administrative unit population estimates for each country, after interpolation or extrapolation to 2005 (if necessary). All figures are rounded and expressed per thousand.
Population estimate for 2010 based on figures produced by national statistical agency (or similar institutions): the sum of administrative unit population estimates for each country, after interpolation or extrapolation to 2000 (if necessary). All figures are rounded and expressed per thousand.
Population estimate for 2000 based on figures produced by national statistical agency (or similar institutions): the sum of administrative unit population estimates for each country, after interpolation or extrapolation to 2010 (if necessary). All figures are rounded and expressed per thousand.
Population estimate for 2020 based on figures produced by national statistical agency (or similar institutions): the sum of administrative unit population estimates for each country, after interpolation or extrapolation to 2020 (if necessary). All figures are rounded and expressed per thousand.
United Nations national level population estimate for 1990 in thousands of persons. All figures are rounded and expressed per thousand.
United Nations national level population estimate for 1995 in thousands of persons. All figures are rounded and expressed per thousand.
United Nations national level population estimate for 2000 in thousands of persons. All figures are rounded and expressed per thousand.
United Nations national level population estimate for 2005 in thousands of persons. All figures are rounded and expressed per thousand.
United Nations national level population estimate for 2010 in thousands of persons. All figures are rounded and expressed per thousand.
United Nations national level population estimate for 2015 in thousands of persons. All figures are rounded and expressed per thousand.
United Nations national level population estimate for 2020 in thousands of persons. All figures are rounded and expressed per thousand.
Percent difference between country estimate from source data and the UN estimate for 1990. This percentage is calculated based on the difference between P90E and UN_P90; it was used to adjust the administrative unit population counts from each data provider so that they summed to the same total as the UN estimate for producing the UN adjusted population grids.
Percent difference between country estimate from source data and the UN estimate for 2000. This percentage is calculated based on the difference between P00E and UN_P00; it was used to adjust the administrative unit population counts from each data provider so that they summed to the same total as the UN estimate for producing the UN adjusted population grids.

Gridded Population of the World (GPW), version 3 betaSummary information
CIESIN, Columbia University, March 2005*Preliminary file-- please check back for updates*
These spreadsheets contain summary information, for countries, continents and the world from GPW v3 beta.The variable (column headings) on the following sheets are defined here.
Recommended citation for use of the GPW database is:
DEFINITION
Center for International Earth Science Information Network (CIESIN),Columbia University;and Centro Internacional de Agricultura Tropical (CIAT),
2004. Gridded Population of the World (GPW),Version 3 beta. Palisades, NY: CIESIN,Columbia University. Available at http://beta.sedac.ciesin.columbia.edu/gpw.
For additional information, please send email to: [email protected]
The spatial data provider and listings of other associated reference materials.The population data provider and listings of other associated reference materials.Documention of all edits and changes made to the spatial data.Documention of all edits and changes made to the population data.
The largest settlement point by population.The smallest settlement point by population.The mean settlement point by population.
The definition of urban for a country as given by the United Nation's World Urbanization Prospects, 2001 Revision.
The number of spatial areas that are defined as urban, e.g. 5000+ persons.The size of the largest urban spatial area by sq. km.The size of the smallest urban spatial area by sq. km.
The mean size of the urban spatial areas by sq.km.The sum of all of the urban spatial areas by sq.km.
The largest urban spatial area by populationThe smallest urban spatial areaby populationThe mean size of the urban spatial areas by populationThe sum of the population of all urban spatial areas.
Percetange of a country's total land area that is taken up by urban spatial extents.
Percentage of a country's total population that is in urban spatial extents.
Percentage of a country's total population that is considered urban.
Number of urban extents that came from the Nighttime Lights source data.
Number of urban extents that came from the regressions performed by CIESIN.
Number of urban extents that came from the Digital Chart of the World source data.Number of urban extents that came from the other source data not previously listed.
The settlement point population data provider and listings of other associated reference materials.
The settlement point coordinate data provider and listings of other associated reference materials.
The number of populated places as defined by their latitude and longitude coordinates. This includes cities, towns, villages, and other populated sites.

CountryEnglish Continent UNRegion ISO2 Resolution Area
Angola AGO Africa 1 30 3005 Middle Africa AO 24 264 763 1,251,924 1
Burundi BDI Africa 1 104 10405 Eastern Africa BI 108 15 58 25,227 2 Province
Benin BEN Africa 1 63 6305 Western Africa BJ 204 39 80 115,828 2 Province District
Burkina Faso BFA Africa 1 96 9605 Western Africa BF 854 28 33 275,747 2 Province
ISO3v10
ContinentName
CountryCode
CountryCodeLon
gUNSDCode
PopulationPerUnit
LevelUsed
Level1Type
Level2Type
Level3Type
Provincia
Municipio
Commune
Department

CountryEnglish Continent UNRegion ISO2 Resolution AreaISO3v10
ContinentName
CountryCode
CountryCodeLon
gUNSDCode
PopulationPerUnit
LevelUsed
Level1Type
Level2Type
Level3Type
Botswana BWA Africa 1 74 7405 BW 72 156 69 559,502 2 Region
Central African Republic CAF Africa 1 124 12405 Middle Africa CF 140 111 69 622,868 2
Southern Africa
Census District
Prefecture
Sous-Prefecture

CountryEnglish Continent UNRegion ISO2 Resolution AreaISO3v10
ContinentName
CountryCode
CountryCodeLon
gUNSDCode
PopulationPerUnit
LevelUsed
Level1Type
Level2Type
Level3Type
Ivory Coast CIV Africa 1 169 16905 Western Africa CI 384 42 89 320,329 3 Region Departement
Sous-Prefecture

CountryEnglish Continent UNRegion ISO2 Resolution AreaISO3v10
ContinentName
CountryCode
CountryCodeLon
gUNSDCode
PopulationPerUnit
LevelUsed
Level1Type
Level2Type
Level3Type
Cameroon CMR Africa 1 108 10805 Middle Africa CM 120 97 321 465,765 2 Province Department

CountryEnglish Continent UNRegion ISO2 Resolution AreaISO3v10
ContinentName
CountryCode
CountryCodeLon
gUNSDCode
PopulationPerUnit
LevelUsed
Level1Type
Level2Type
Level3Type
COD Africa 1 926 92605 Middle Africa ZR 180 124 347 2,313,414 3 Region Ville
Congo COG Africa 1 161 16105 Middle Africa CG 178 86 65 343,235 2 Region
Congo, Democratic Republic
Sous-Region
District/Commune
CountryEnglish Continent UNRegion ISO2 Resolution AreaISO3v10
ContinentName
CountryCode
CountryCodeLon
gUNSDCode
PopulationPerUnit
LevelUsed
Level1Type
Level2Type
Level3Type
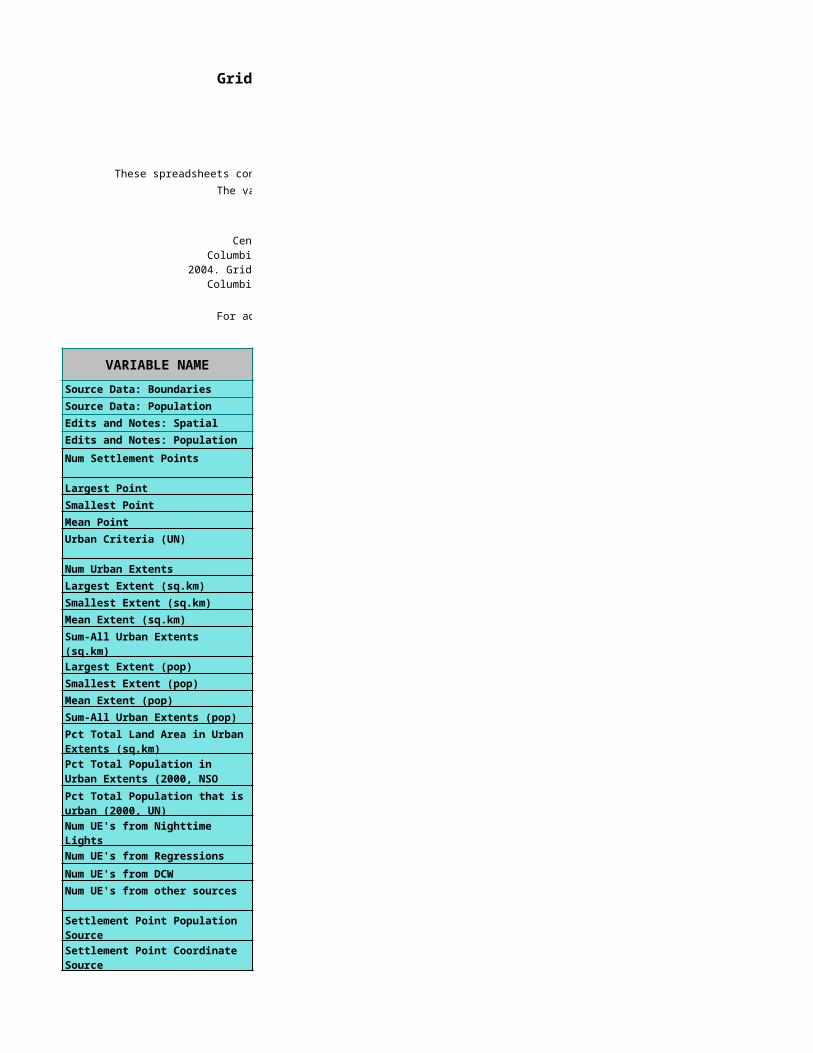
Comoros COM Africa 1 154 15405 Eastern Africa KM 174 23 140 2,046 1 Ile
Cape Verde CPV Africa 1 120 12005 Western Africa CV 132 21 48 4,072 1 Ilha
Djibouti DJI Africa 1 182 18205 Eastern Africa DJ 262 65 120 20,903 1 District

CountryEnglish Continent UNRegion ISO2 Resolution AreaISO3v10
ContinentName
CountryCode
CountryCodeLon
gUNSDCode
PopulationPerUnit
LevelUsed
Level1Type
Level2Type
Level3Type
Algeria DZA Africa 1 20 2005 Northern Africa DZ 12 219 634 2,302,498 1 Wilaya
Egypt EGY Africa 1 192 19205 Northern Africa EG 818 65 278 968,071 2 Governate
Markaz/ Quisms

CountryEnglish Continent UNRegion ISO2 Resolution AreaISO3v10
ContinentName
CountryCode
CountryCodeLon
gUNSDCode
PopulationPerUnit
LevelUsed
Level1Type
Level2Type
Level3Type
Eritrea ERI Africa 1 205 20505 Eastern Africa ER 232 57 96 121,863 2 Region Awraja
Ethiopia ETH Africa 1 208 20805 Eastern Africa ET 231 46 119 1,123,714 3 Region Zone Wereda
Gabon GAB Africa 1 260 26005 Middle Africa GA 266 76 29 265,146 2 Province CantonDepartement

CountryEnglish Continent UNRegion ISO2 Resolution AreaISO3v10
ContinentName
CountryCode
CountryCodeLon
gUNSDCode
PopulationPerUnit
LevelUsed
Level1Type
Level2Type
Level3Type
Ghana GHA Africa 1 278 27805 Western Africa GH 288 46 172 231,730 2 Region District
Guinea GIN Africa 1 304 30405 Western Africa GN 324 86 257 245,860 2 Region Prefecture

CountryEnglish Continent UNRegion ISO2 Resolution AreaISO3v10
ContinentName
CountryCode
CountryCodeLon
gUNSDCode
PopulationPerUnit
LevelUsed
Level1Type
Level2Type
Level3Type
Gambia GMB Africa 1 264 26405 Western Africa GM 270 17 32 10,838 2 Division District
Guinea-Bissau GNB Africa 1 306 30605 Western Africa GW 624 30 33 34,106 2 Regiao Sector
Equatorial Guinea GNQ Africa 1 204 20405 Middle Africa GQ 226 62 65 27,104 2 DistritoProvincia

CountryEnglish Continent UNRegion ISO2 Resolution AreaISO3v10
ContinentName
CountryCode
CountryCodeLon
gUNSDCode
PopulationPerUnit
LevelUsed
Level1Type
Level2Type
Level3Type
Kenya KEN Africa 1 388 38805 Eastern Africa KE 404 9 4 579,617 5 Province District Division
Liberia LBR Africa 1 434 43405 Western Africa LR 430 42 70 96,166 2 DistrictCounty/Territory
CountryEnglish Continent UNRegion ISO2 Resolution AreaISO3v10
ContinentName
CountryCode
CountryCodeLon
gUNSDCode
PopulationPerUnit
LevelUsed
Level1Type
Level2Type
Level3Type
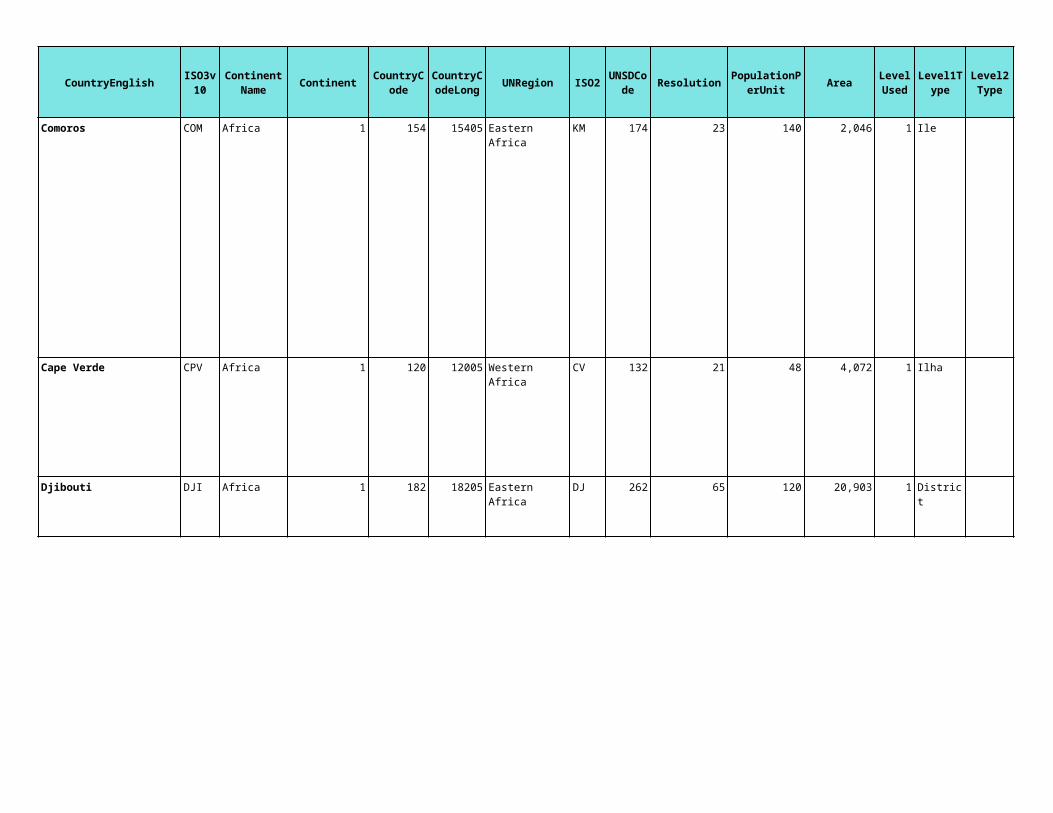
Libyan Arab Jamahiriya LBY Africa 1 438 43805 Northern Africa LY 434 254 223 1,611,363 1
Lesotho LSO Africa 1 424 42405 LS 426 55 196 30,582 1 District
MAR Africa 1 510 51005 Northern Africa MA 504 117 606 669,159 2 Province
Mohafada
Southern Africa
Morocco (includes Western Sahara)
Prefecture

CountryEnglish Continent UNRegion ISO2 Resolution AreaISO3v10
ContinentName
CountryCode
CountryCodeLon
gUNSDCode
PopulationPerUnit
LevelUsed
Level1Type
Level2Type
Level3Type
Madagascar MDG Africa 1 454 45405 Eastern Africa MG 450 22 12 592,965 3
Mali MLI Africa 1 478 47805 Western Africa ML 466 68 39 1,248,137 2 Region Cercle
Province/ Faritany
Prefecture/ Fivondronana
Sous-Prefecture
CountryEnglish Continent UNRegion ISO2 Resolution AreaISO3v10
ContinentName
CountryCode
CountryCodeLon
gUNSDCode
PopulationPerUnit
LevelUsed
Level1Type
Level2Type
Level3Type
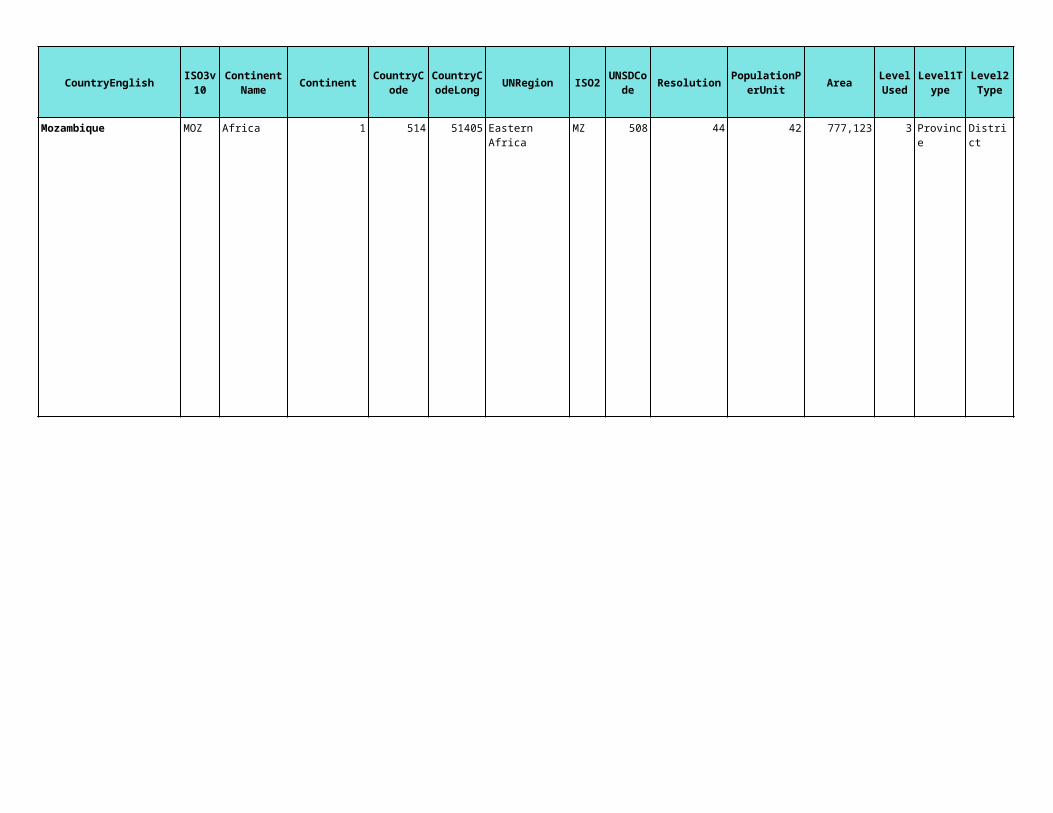
Mozambique MOZ Africa 1 514 51405 Eastern Africa MZ 508 44 42 777,123 3 Province District Posto

CountryEnglish Continent UNRegion ISO2 Resolution AreaISO3v10
ContinentName
CountryCode
CountryCodeLon
gUNSDCode
PopulationPerUnit
LevelUsed
Level1Type
Level2Type
Level3Type
Mauritania MRT Africa 1 488 48805 Western Africa MR 478 140 48 1,036,905 2 Wilaya
Mauritius MUS Africa 1 490 49005 Eastern Africa MU 480 3 6 1,993 3 Island District
Moughataa
Municipal Ward / Village Council Area

CountryEnglish Continent UNRegion ISO2 Resolution AreaISO3v10
ContinentName
CountryCode
CountryCodeLon
gUNSDCode
PopulationPerUnit
LevelUsed
Level1Type
Level2Type
Level3Type
Malawi MWI Africa 1 456 45605 Eastern Africa MW 454 3 1 94,958 3 District
Mayotte MYT Africa 1 19 155 372 0
Namibia NAM Africa 1 520 52005 NA 516 90 18 819,964 2 Region
Traditional Authority, Sub-Chief, Boma, Ward, National Park, Reserve, Other
Enumeration Area
Southern Africa
Constituency
CountryEnglish Continent UNRegion ISO2 Resolution AreaISO3v10
ContinentName
CountryCode
CountryCodeLon
gUNSDCode
PopulationPerUnit
LevelUsed
Level1Type
Level2Type
Level3Type
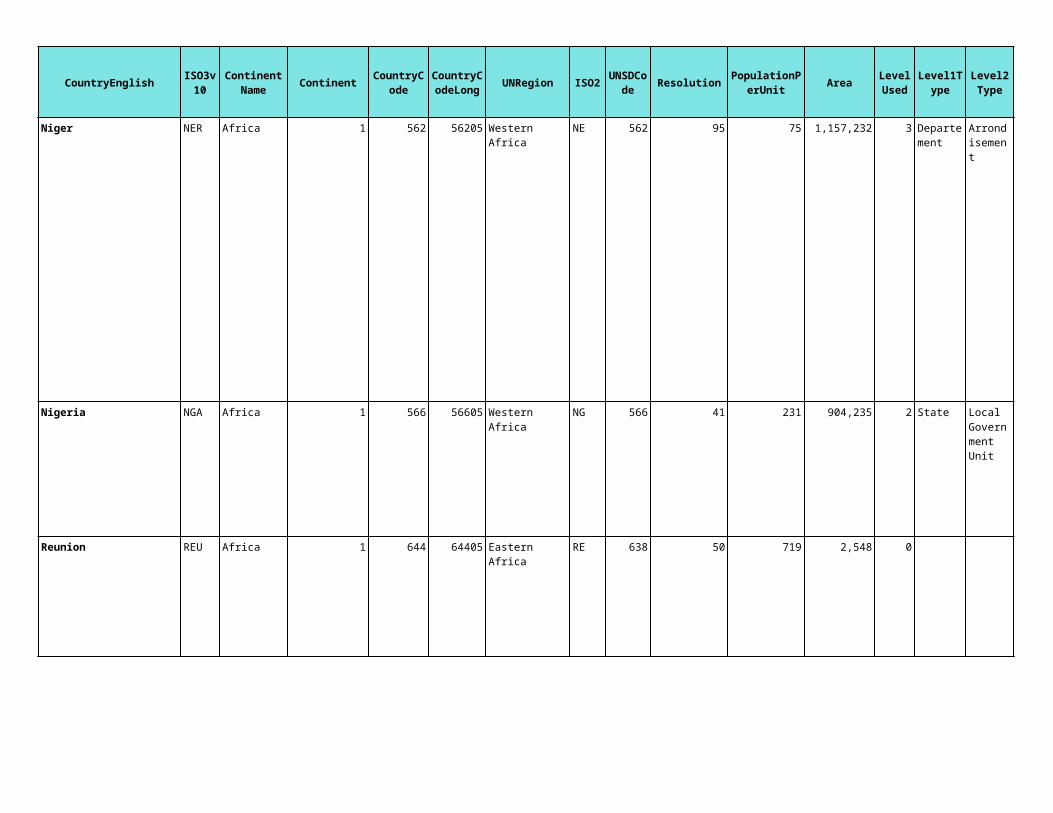
Niger NER Africa 1 562 56205 Western Africa NE 562 95 75 1,157,232 3 Canton
Nigeria NGA Africa 1 566 56605 Western Africa NG 566 41 231 904,235 2 State
Reunion REU Africa 1 644 64405 Eastern Africa RE 638 50 719 2,548 0
Departement
Arrondisement
Local Government Unit

CountryEnglish Continent UNRegion ISO2 Resolution AreaISO3v10
ContinentName
CountryCode
CountryCodeLon
gUNSDCode
PopulationPerUnit
LevelUsed
Level1Type
Level2Type
Level3Type
Rwanda RWA Africa 1 652 65205 Eastern Africa RW 646 13 55 24,349 2
Sudan SDN Africa 1 731 73105 Northern Africa SD 736 171 338 2,492,385 2 State
Prefecture
Commune
Muhafazat

CountryEnglish Continent UNRegion ISO2 Resolution AreaISO3v10
ContinentName
CountryCode
CountryCodeLon
gUNSDCode
PopulationPerUnit
LevelUsed
Level1Type
Level2Type
Level3Type
Senegal SEN Africa 1 676 67605 Western Africa SN 686 46 107 196,151 2 Region
St. Helena SHN Africa 1 657 65705 Western Africa SH 654 11 6 127 0
Sierra Leone SLE Africa 1 688 68805 Western Africa SL 694 22 35 72,616 3 District
Somalia SOM Africa 1 696 69605 Eastern Africa SO 706 93 110 634,315 2 Region District
Commune
Province Chiefdom

CountryEnglish Continent UNRegion ISO2 Resolution AreaISO3v10
ContinentName
CountryCode
CountryCodeLon
gUNSDCode
PopulationPerUnit
LevelUsed
Level1Type
Level2Type
Level3Type
Sao Tome and Principe STP Africa 1 668 66805 Middle Africa ST 678 22 72 1,008 1 Distrito
Swaziland SWZ Africa 1 740 74005 SZ 748 66 228 17,410 1 Region
Seychelles SYC Africa 1 680 68005 Eastern Africa SC 690 10 40 196 1 District
Provincia
Southern Africa

CountryEnglish Continent UNRegion ISO2 Resolution AreaISO3v10
ContinentName
CountryCode
CountryCodeLon
gUNSDCode
PopulationPerUnit
LevelUsed
Level1Type
Level2Type
Level3Type
Chad TCD Africa 1 130 13005 Middle Africa TD 148 298 527 1,243,139 2
Togo TGO Africa 1 764 76405 Western Africa TG 768 52 216 57,277 2 Region
Prefecture
Sous-Prefecture
Prefecture

CountryEnglish Continent UNRegion ISO2 Resolution AreaISO3v10
ContinentName
CountryCode
CountryCodeLon
gUNSDCode
PopulationPerUnit
LevelUsed
Level1Type
Level2Type
Level3Type
Tunisia TUN Africa 1 784 78405 Northern Africa TN 788 80 416 147,882 1
United Rep. of Tanzania TZA Africa 1 855 85505 Eastern Africa TZ 834 99 360 891,021 2 Region District
Gouvernorat
CountryEnglish Continent UNRegion ISO2 Resolution AreaISO3v10
ContinentName
CountryCode
CountryCodeLon
gUNSDCode
PopulationPerUnit
LevelUsed
Level1Type
Level2Type
Level3Type
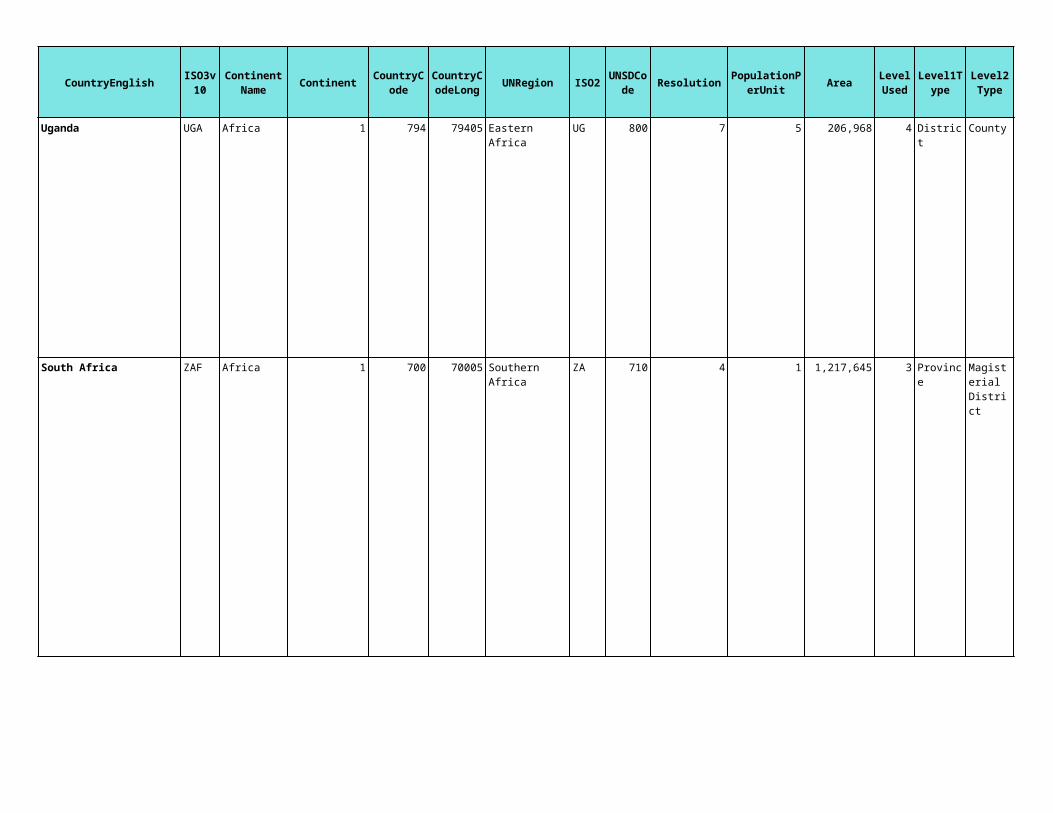
Uganda UGA Africa 1 794 79405 Eastern Africa UG 800 7 5 206,968 4 District County
South Africa ZAF Africa 1 700 70005 ZA 710 4 1 1,217,645 3 Province
Sub-County
Southern Africa
Magisterial District
Enumeration Area

CountryEnglish Continent UNRegion ISO2 Resolution AreaISO3v10
ContinentName
CountryCode
CountryCodeLon
gUNSDCode
PopulationPerUnit
LevelUsed
Level1Type
Level2Type
Level3Type
Zambia ZMB Africa 1 928 92805 Eastern Africa ZM 894 115 167 745,317 2 Province District
Zimbabwe ZWE Africa 1 938 93805 Eastern Africa ZW 716 82 201 389,055 2 Province District
Afghanistan AFG Asia 4 14 1405 AF 4 44 63 634,908 2 Province DistrictSouth-central Asia

CountryEnglish Continent UNRegion ISO2 Resolution AreaISO3v10
ContinentName
CountryCode
CountryCodeLon
gUNSDCode
PopulationPerUnit
LevelUsed
Level1Type
Level2Type
Level3Type
United Arab Emirates ARE Asia 4 830 83005 Western Asia AE 784 97 399 74,777 1 Emirate
Armenia ARM Asia 4 36 3605 Western Asia AM 51 51 293 28,277 1 Marzes Rayon
CountryEnglish Continent UNRegion ISO2 Resolution AreaISO3v10
ContinentName
CountryCode
CountryCodeLon
gUNSDCode
PopulationPerUnit
LevelUsed
Level1Type
Level2Type
Level3Type
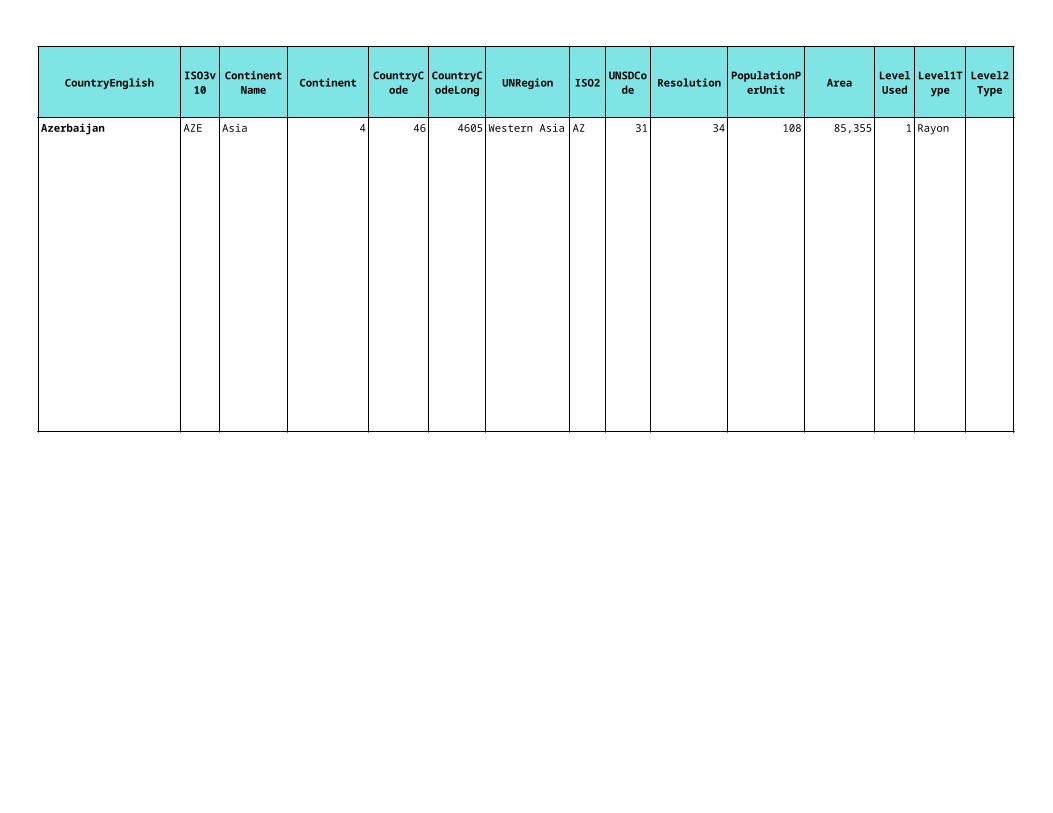
Azerbaijan AZE Asia 4 46 4605 Western Asia AZ 31 34 108 85,355 1 Rayon
CountryEnglish Continent UNRegion ISO2 Resolution AreaISO3v10
ContinentName
CountryCode
CountryCodeLon
gUNSDCode
PopulationPerUnit
LevelUsed
Level1Type
Level2Type
Level3Type
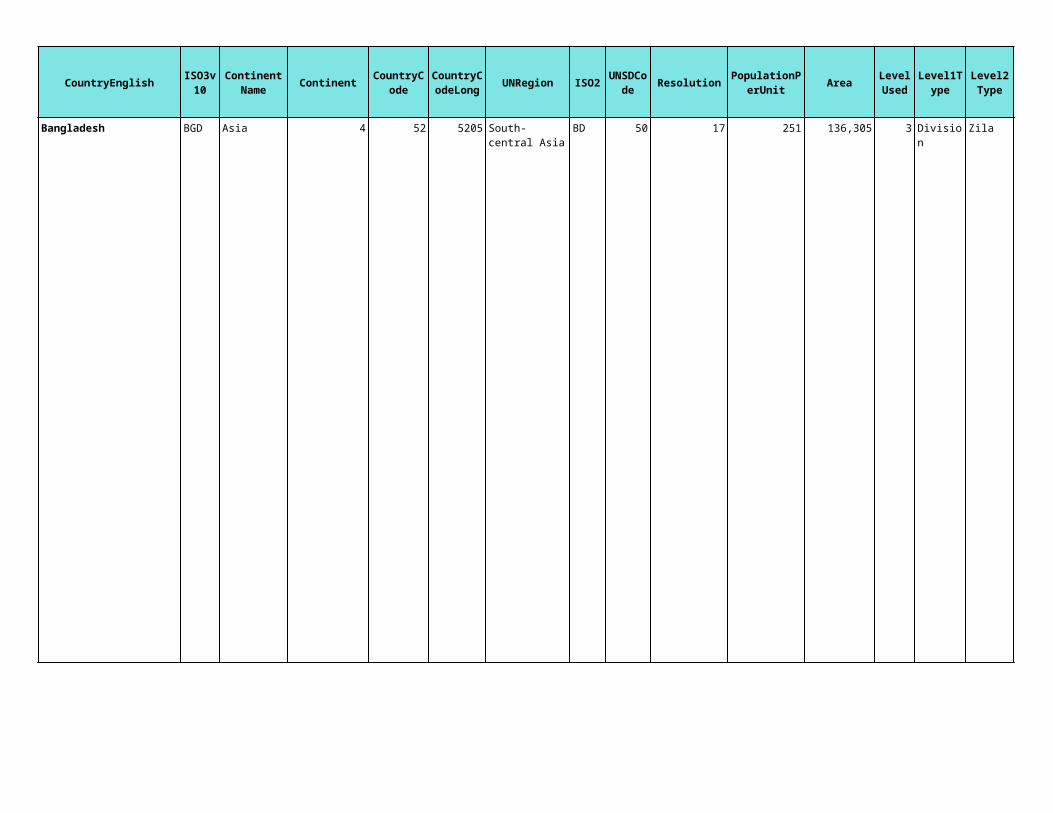
Bangladesh BGD Asia 4 52 5205 BD 50 17 251 136,305 3 Division Zila ThanaSouth-central Asia

CountryEnglish Continent UNRegion ISO2 Resolution AreaISO3v10
ContinentName
CountryCode
CountryCodeLon
gUNSDCode
PopulationPerUnit
LevelUsed
Level1Type
Level2Type
Level3Type
Bahrain BHR Asia 4 50 5005 Western Asia BH 48 8 62 623 1
Brunei Darussalam BRN Asia 4 92 9205 BN 96 38 82 5,901 1 District
Bhutan BTN Asia 4 64 6405 BT 64 45 98 38,040 1 District
Municipality
South-eastern Asia
South-central Asia

CountryEnglish Continent UNRegion ISO2 Resolution AreaISO3v10
ContinentName
CountryCode
CountryCodeLon
gUNSDCode
PopulationPerUnit
LevelUsed
Level1Type
Level2Type
Level3Type
China CHN Asia 4 138 13805 Eastern Asia CN 156 62 518 9,198,103 3 Province CountyPrefecture

CountryEnglish Continent UNRegion ISO2 Resolution AreaISO3v10
ContinentName
CountryCode
CountryCodeLon
gUNSDCode
PopulationPerUnit
LevelUsed
Level1Type
Level2Type
Level3Type
Cyprus CYP Asia 4 174 17405 Western Asia CY 196 5 2 9,273 2 District
Georgia GEO Asia 4 263 26305 Western Asia GE 268 29 59 69,236 2 Oblast
Hong Kong HKG Asia 4 324 32405 Eastern Asia HK 344 8 367 1,054 2 District
Municipality
Rayon/Ad. Gors.
Council District
Consituency Area

CountryEnglish Continent UNRegion ISO2 Resolution AreaISO3v10
ContinentName
CountryCode
CountryCodeLon
gUNSDCode
PopulationPerUnit
LevelUsed
Level1Type
Level2Type
Level3Type
Indonesia IDN Asia 4 344 34405 ID 360 5 3 1,898,776 4 PropinsiSouth-eastern Asia
Kabupaten
Kecamaten

CountryEnglish Continent UNRegion ISO2 Resolution AreaISO3v10
ContinentName
CountryCode
CountryCodeLon
gUNSDCode
PopulationPerUnit
LevelUsed
Level1Type
Level2Type
Level3Type
India IND Asia 4 340 34005 IN 356 25 182 3,209,716 3 State District TehsilSouth-central Asia

CountryEnglish Continent UNRegion ISO2 Resolution AreaISO3v10
ContinentName
CountryCode
CountryCodeLon
gUNSDCode
PopulationPerUnit
LevelUsed
Level1Type
Level2Type
Level3Type
Iran IRN Asia 4 350 35005 IR 364 80 259 1,590,351 2 Ostan
Iraq IRQ Asia 4 354 35405 Western Asia IQ 368 151 1,216 430,575 1
Israel ISR Asia 4 362 36205 Western Asia IL 376 38 411 21,878 2 District
South-central Asia
Shahrestan
Governorates
Subdistrict

CountryEnglish Continent UNRegion ISO2 Resolution AreaISO3v10
ContinentName
CountryCode
CountryCodeLon
gUNSDCode
PopulationPerUnit
LevelUsed
Level1Type
Level2Type
Level3Type
Jordan JOR Asia 4 384 38405 Western Asia JO 400 48 141 88,362 2 DistrictGovernorate

CountryEnglish Continent UNRegion ISO2 Resolution AreaISO3v10
ContinentName
CountryCode
CountryCodeLon
gUNSDCode
PopulationPerUnit
LevelUsed
Level1Type
Level2Type
Level3Type
Japan JPN Asia 4 378 37805 Eastern Asia JP 392 10 38 371,705 2 Prefecture
shi, ku, mati, mura

CountryEnglish Continent UNRegion ISO2 Resolution AreaISO3v10
ContinentName
CountryCode
CountryCodeLon
gUNSDCode
PopulationPerUnit
LevelUsed
Level1Type
Level2Type
Level3Type
Kazakhstan KAZ Asia 4 385 38505 KZ 398 101 62 2,619,352 2 Oblystar RayonSouth-central Asia

CountryEnglish Continent UNRegion ISO2 Resolution AreaISO3v10
ContinentName
CountryCode
CountryCodeLon
gUNSDCode
PopulationPerUnit
LevelUsed
Level1Type
Level2Type
Level3Type
Kyrgyz Republic KGZ Asia 4 400 40005 KG 417 58 89 184,763 2 Oblast Rayon
Cambodia KHM Asia 4 107 10705 KH 116 11 7 179,492 3 Province District
South-central Asia
South-eastern Asia
Commune

CountryEnglish Continent UNRegion ISO2 Resolution AreaISO3v10
ContinentName
CountryCode
CountryCodeLon
gUNSDCode
PopulationPerUnit
LevelUsed
Level1Type
Level2Type
Level3Type
Korea KOR Asia 4 394 39405 Eastern Asia KR 410 21 204 98,977 3 Province District
Kuwait KWT Asia 4 398 39805 Western Asia KW 414 59 445 17,259 1
LAO Asia 4 402 40205 LA 418 42 39 230,230 2 Province District
Lebanon LBN Asia 4 412 41205 Western Asia LB 422 20 128 10,328 2 District
Ward/Township
Governorate
Lao People's Democratic Republic
South-eastern Asia
Governorate

CountryEnglish Continent UNRegion ISO2 Resolution AreaISO3v10
ContinentName
CountryCode
CountryCodeLon
gUNSDCode
PopulationPerUnit
LevelUsed
Level1Type
Level2Type
Level3Type
Sri Lanka LKA Asia 4 729 72905 LK 144 16 75 65,830 3 Province District
Macao MAC Asia 4 450 45005 Eastern Asia MO 446 3 142 19 1
Maldives MDV Asia 4 474 47405 MV 462 3 13 189 1 Atoll
South-central Asia
Peninsula/Island
South-central Asia

CountryEnglish Continent UNRegion ISO2 Resolution AreaISO3v10
ContinentName
CountryCode
CountryCodeLon
gUNSDCode
PopulationPerUnit
LevelUsed
Level1Type
Level2Type
Level3Type
Myanmar MMR Asia 4 516 51605 MM 104 49 165 669,310 2 State Towns
Mongolia MNG Asia 4 506 50605 Eastern Asia MN 496 265 108 1,546,294 1 Aimag
Malaysia MYS Asia 4 458 45805 MY 458 19 24 329,941 3 State Mukim
Nepal NPL Asia 4 526 52605 NP 524 43 302 139,087 3 Zone District
South-eastern Asia
South-eastern Asia
District (jajahan)
South-central Asia
Development Region
CountryEnglish Continent UNRegion ISO2 Resolution AreaISO3v10
ContinentName
CountryCode
CountryCodeLon
gUNSDCode
PopulationPerUnit
LevelUsed
Level1Type
Level2Type
Level3Type
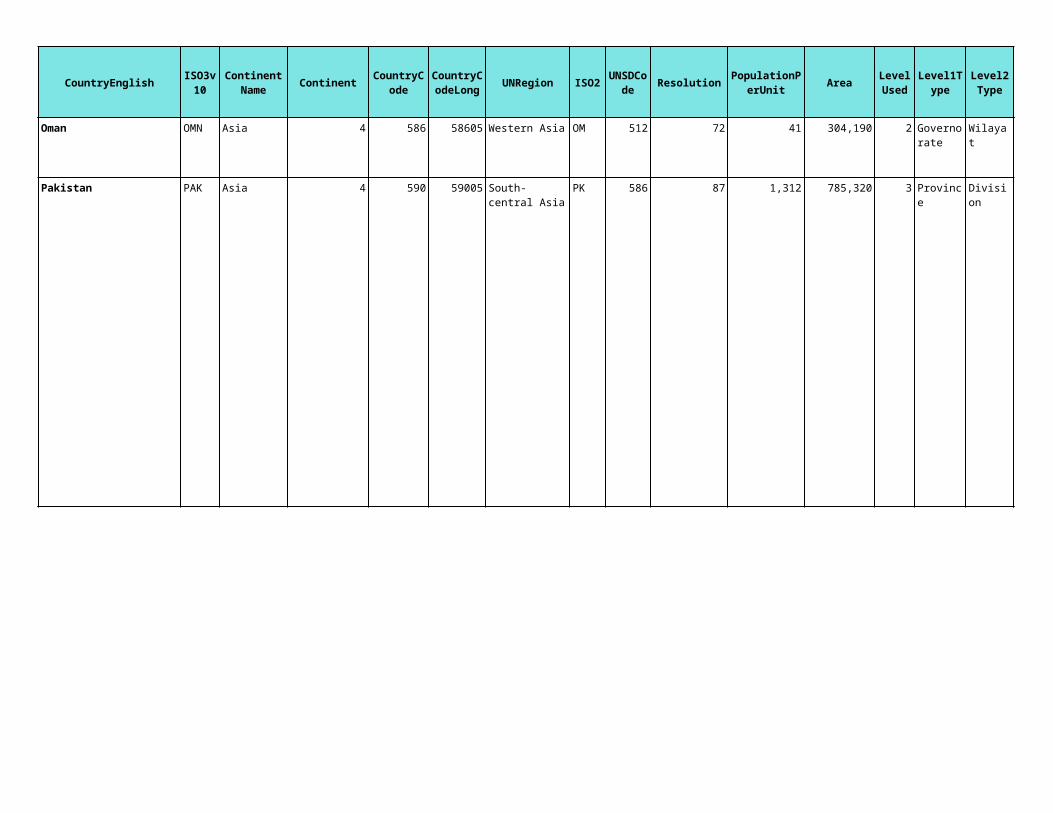
Oman OMN Asia 4 586 58605 Western Asia OM 512 72 41 304,190 2 Wilayat
Pakistan PAK Asia 4 590 59005 PK 586 87 1,312 785,320 3 Province Division District
Governorate
South-central Asia

CountryEnglish Continent UNRegion ISO2 Resolution AreaISO3v10
ContinentName
CountryCode
CountryCodeLon
gUNSDCode
PopulationPerUnit
LevelUsed
Level1Type
Level2Type
Level3Type
Philippines PHL Asia 4 612 61205 PH 608 14 49 295,408 3 RegionSouth-eastern Asia
Province
Municipality
CountryEnglish Continent UNRegion ISO2 Resolution AreaISO3v10
ContinentName
CountryCode
CountryCodeLon
gUNSDCode
PopulationPerUnit
LevelUsed
Level1Type
Level2Type
Level3Type
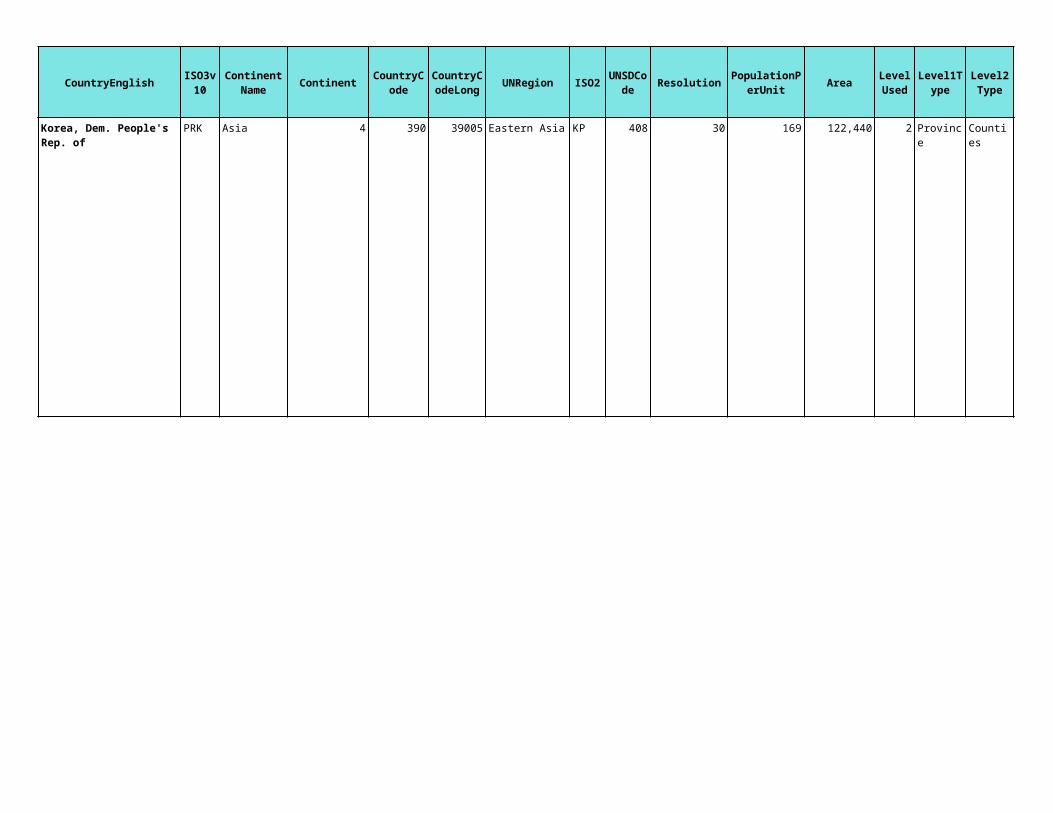
PRK Asia 4 390 39005 Eastern Asia KP 408 30 169 122,440 2 ProvinceKorea, Dem. People's Rep. of
Counties

CountryEnglish Continent UNRegion ISO2 Resolution AreaISO3v10
ContinentName
CountryCode
CountryCodeLon
gUNSDCode
PopulationPerUnit
LevelUsed
Level1Type
Level2Type
Level3Type
PSE Asia 4 19 199 6,006 1 DistrictOccupied Palestinian Territory
CountryEnglish Continent UNRegion ISO2 Resolution AreaISO3v10
ContinentName
CountryCode
CountryCodeLon
gUNSDCode
PopulationPerUnit
LevelUsed
Level1Type
Level2Type
Level3Type
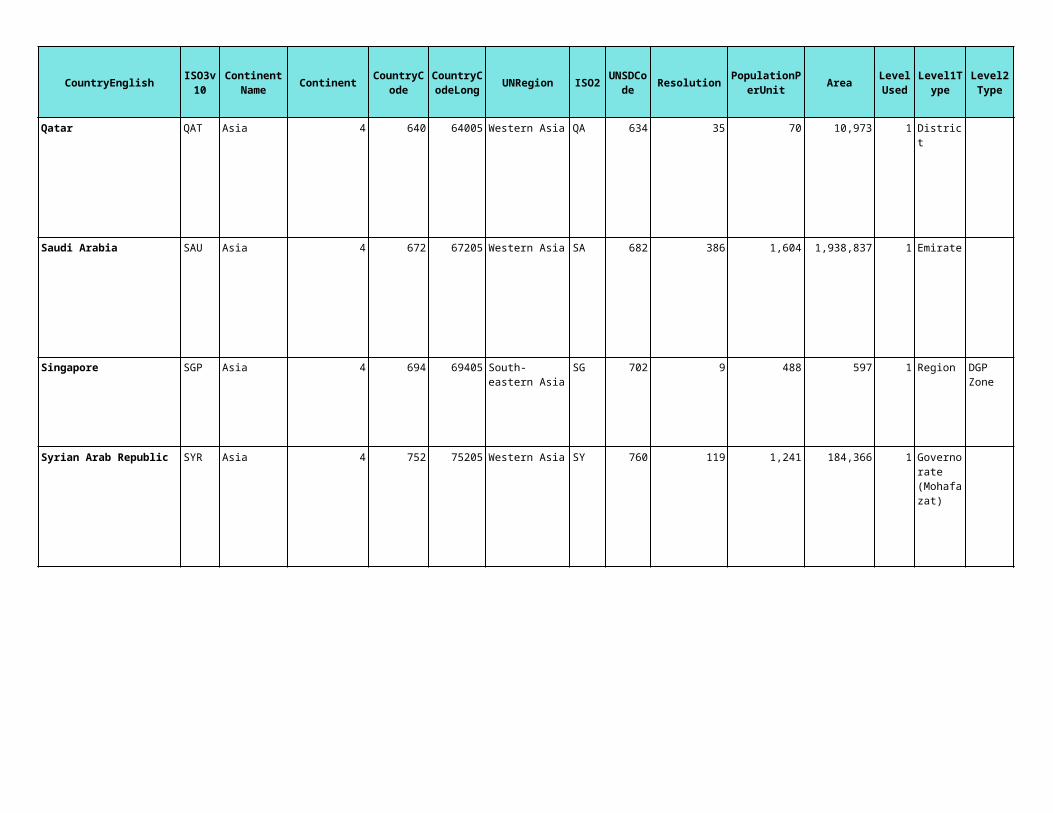
Qatar QAT Asia 4 640 64005 Western Asia QA 634 35 70 10,973 1 District
Saudi Arabia SAU Asia 4 672 67205 Western Asia SA 682 386 1,604 1,938,837 1 Emirate
Singapore SGP Asia 4 694 69405 SG 702 9 488 597 1 Region
Syrian Arab Republic SYR Asia 4 752 75205 Western Asia SY 760 119 1,241 184,366 1
South-eastern Asia
DGP Zone
Subzone
Governorate (Mohafazat)

CountryEnglish Continent UNRegion ISO2 Resolution AreaISO3v10
ContinentName
CountryCode
CountryCodeLon
gUNSDCode
PopulationPerUnit
LevelUsed
Level1Type
Level2Type
Level3Type
Thailand THA Asia 4 760 76005 TH 764 26 77 513,618 2 Province District
Tajikistan TJK Asia 4 756 75605 TJ 762 47 99 130,295 1 Rayon
South-eastern Asia
South-central Asia

CountryEnglish Continent UNRegion ISO2 Resolution AreaISO3v10
ContinentName
CountryCode
CountryCodeLon
gUNSDCode
PopulationPerUnit
LevelUsed
Level1Type
Level2Type
Level3Type
Turkmenistan TKM Asia 4 789 78905 TM 795 98 86 460,254 1 Rayon
East Timor TLS Asia 4 190 19005 TP 626 29 46 14,923 1 Propinsi
Turkey TUR Asia 4 788 78805 Western Asia TR 792 98 848 768,690 1 Province District
South-central Asia
South-eastern Asia

CountryEnglish Continent UNRegion ISO2 Resolution AreaISO3v10
ContinentName
CountryCode
CountryCodeLon
gUNSDCode
PopulationPerUnit
LevelUsed
Level1Type
Level2Type
Level3Type
Taiwan TWN Asia 4 42 1,030 36,223 2 Region County
Uzbekistan UZB Asia 4 873 87305 UZ 860 45 118 412,914 2 Wiloyat RayonSouth-central Asia

CountryEnglish Continent UNRegion ISO2 Resolution AreaISO3v10
ContinentName
CountryCode
CountryCodeLon
gUNSDCode
PopulationPerUnit
LevelUsed
Level1Type
Level2Type
Level3Type
Viet Nam VNM Asia 4 879 87905 VN 704 25 143 328,535 2 Province District
Yemen YEM Asia 4 919 91905 Western Asia YE 887 43 82 415,196 2
South-eastern Asia
Governorate
Muderiah

CountryEnglish Continent UNRegion ISO2 Resolution AreaISO3v10
ContinentName
CountryCode
CountryCodeLon
gUNSDCode
PopulationPerUnit
LevelUsed
Level1Type
Level2Type
Level3Type
Albania ALB Europe 5 18 1805 AL 8 33 119 28,346 1 District
Andorra AND Europe 5 28 2805 AD 20 8 9 464 1 Parish
Austria AUT Europe 5 44 4405 AT 40 29 81 83,145 2 State Lander
Southern Europe
Southern Europe
Western Europe

CountryEnglish Continent UNRegion ISO2 Resolution AreaISO3v10
ContinentName
CountryCode
CountryCodeLon
gUNSDCode
PopulationPerUnit
LevelUsed
Level1Type
Level2Type
Level3Type
Belgium BEL Europe 5 60 6005 BE 56 7 17 30,553 3 Province
Bulgaria BGR Europe 5 94 9405 BG 100 21 30 111,307 2
Bosnia-Herzogovina BIH Europe 5 71 7105 BA 70 131 1,301 51,295 1 District
Belarus BLR Europe 5 58 5805 BY 112 37 66 207,013 2 Oblast Rayon
Western Europe
Arrondisement
Commune
Eastern Europe
District (Oblast)
Municipality
Southern Europe
Eastern Europe

CountryEnglish Continent UNRegion ISO2 Resolution AreaISO3v10
ContinentName
CountryCode
CountryCodeLon
gUNSDCode
PopulationPerUnit
LevelUsed
Level1Type
Level2Type
Level3Type
Switzerland CHE Europe 5 748 74805 CH 756 4 2 38,975 3 Canton District
Czech Republic CZE Europe 5 179 17905 CZ 203 32 134 78,616 1 Okres
Germany DEU Europe 5 265 26505 DE 276 28 184 356,027 2 Länder Kreise
Denmark DNK Europe 5 184 18405 DK 208 12 19 42,484 2 County
Western Europe
Commune
Eastern Europe
Western Europe
Northern Europe
Kommune

CountryEnglish Continent UNRegion ISO2 Resolution AreaISO3v10
ContinentName
CountryCode
CountryCodeLon
gUNSDCode
PopulationPerUnit
LevelUsed
Level1Type
Level2Type
Level3Type
Spain ESP Europe 5 716 71605 ES 724 8 5 505,275 3
Estonia EST Europe 5 207 20705 EE 233 13 5 43,179 2 County
Finland FIN Europe 5 234 23405 FI 246 27 12 317,001 2 Laeaeni Kunta
Southern Europe
Comunidad Autonoma
Provincia
Termino Municipal, Condominio, Ciudad Autonoma
Northern Europe
Municipality
Northern Europe
CountryEnglish Continent UNRegion ISO2 Resolution AreaISO3v10
ContinentName
CountryCode
CountryCodeLon
gUNSDCode
PopulationPerUnit
LevelUsed
Level1Type
Level2Type
Level3Type
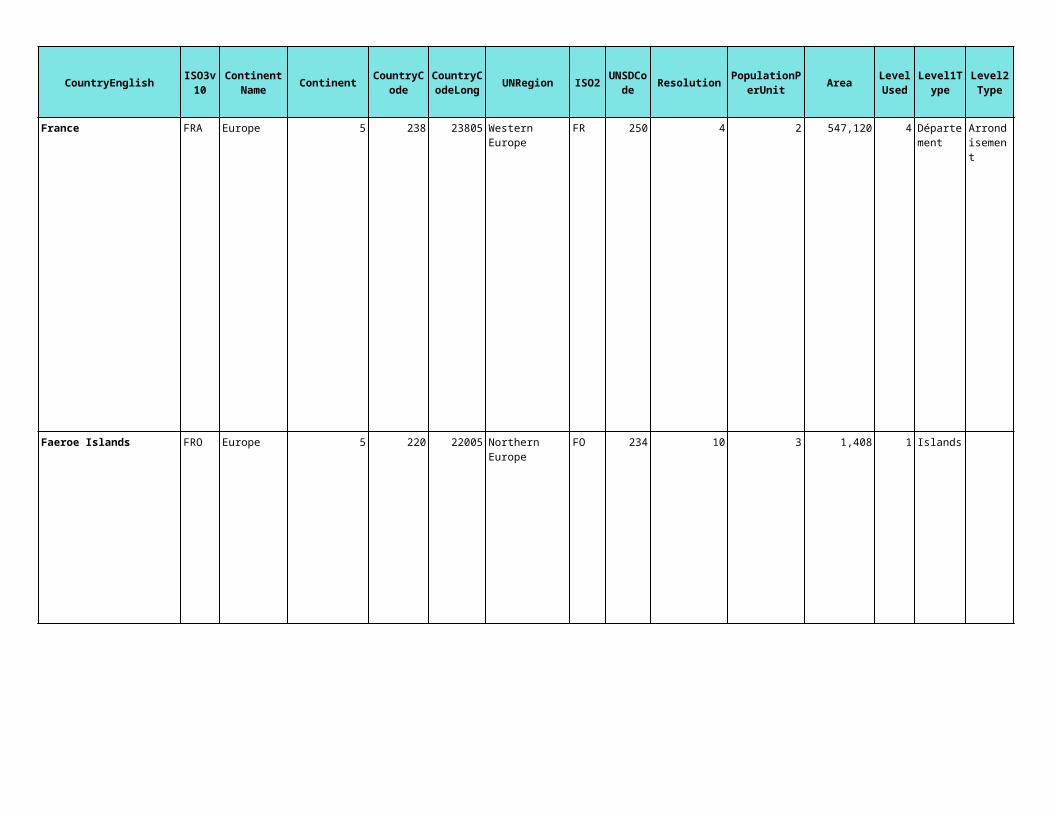
France FRA Europe 5 238 23805 FR 250 4 2 547,120 4
Faeroe Islands FRO Europe 5 220 22005 FO 234 10 3 1,408 1 Islands
Western Europe
Département
Arrondisement
Canton/ville
Northern Europe

CountryEnglish Continent UNRegion ISO2 Resolution AreaISO3v10
ContinentName
CountryCode
CountryCodeLon
gUNSDCode
PopulationPerUnit
LevelUsed
Level1Type
Level2Type
Level3Type
United Kingdom GBR Europe 5 840 84005 GB 826 24 135 247,193 3
Guernsey GGY Europe 5 9 56 85 0 National
Northern Europe

CountryEnglish Continent UNRegion ISO2 Resolution AreaISO3v10
ContinentName
CountryCode
CountryCodeLon
gUNSDCode
PopulationPerUnit
LevelUsed
Level1Type
Level2Type
Level3Type
Gibraltar GIB Europe 5 280 28005 GI 292 2 27 5 0Southern Europe
CountryEnglish Continent UNRegion ISO2 Resolution AreaISO3v10
ContinentName
CountryCode
CountryCodeLon
gUNSDCode
PopulationPerUnit
LevelUsed
Level1Type
Level2Type
Level3Type
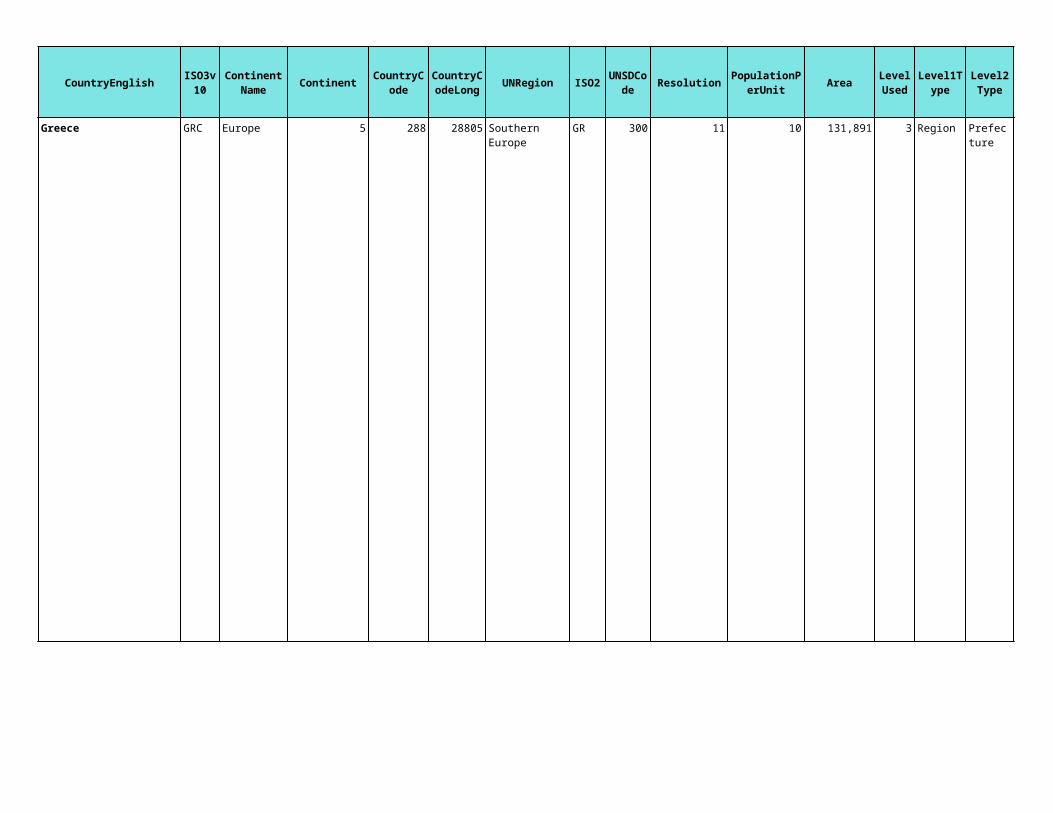
Greece GRC Europe 5 288 28805 GR 300 11 10 131,891 3 RegionSouthern Europe
Prefecture
Municipality/Commune
CountryEnglish Continent UNRegion ISO2 Resolution AreaISO3v10
ContinentName
CountryCode
CountryCodeLon
gUNSDCode
PopulationPerUnit
LevelUsed
Level1Type
Level2Type
Level3Type
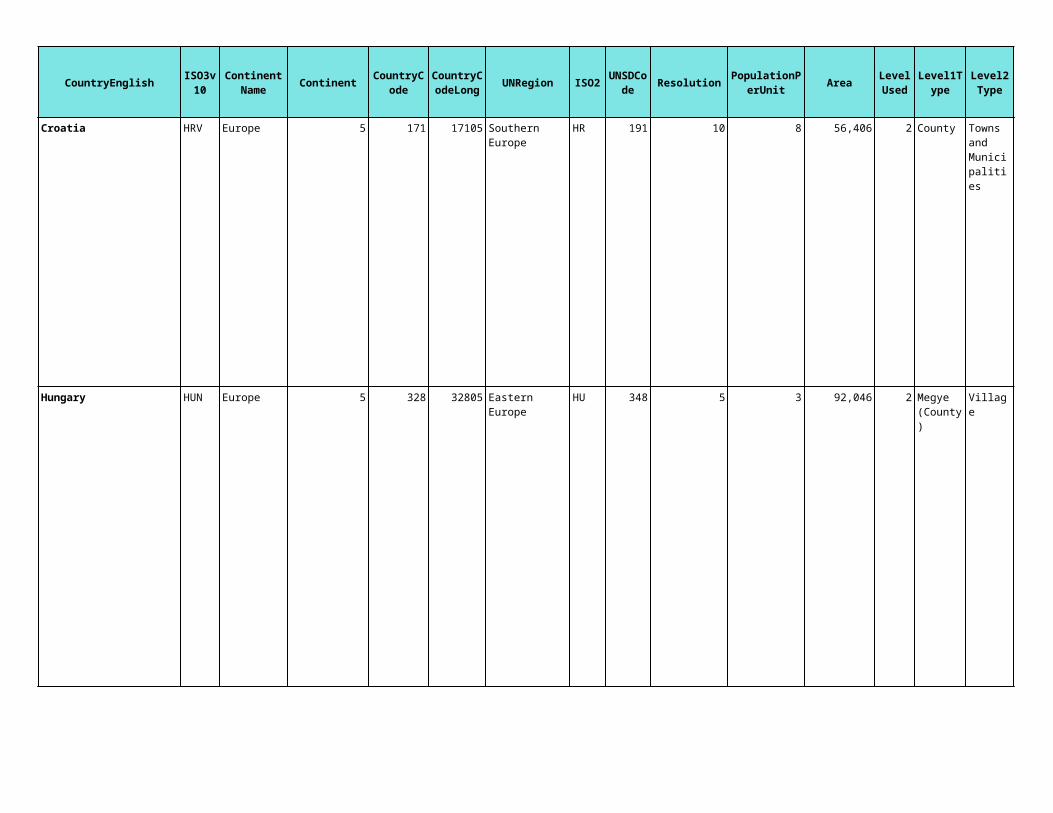
Croatia HRV Europe 5 171 17105 HR 191 10 8 56,406 2 County
Hungary HUN Europe 5 328 32805 HU 348 5 3 92,046 2 Village
Southern Europe
Towns and Municipalities
Eastern Europe
Megye (County)

CountryEnglish Continent UNRegion ISO2 Resolution AreaISO3v10
ContinentName
CountryCode
CountryCodeLon
gUNSDCode
PopulationPerUnit
LevelUsed
Level1Type
Level2Type
Level3Type
Isle of Man IMN Europe 5 5 3 572 1
Iceland ISL Europe 5 332 33205 IS 352 27 2 91,116 2
Italy ITA Europe 5 366 36605 IT 380 6 7 299,287 3 Region
Jersey JEY Europe 5 11 87 119 0
Census District
Town/Village/Parish
Northern Europe
Constituency
Municipality
Southern Europe
Province
Commune

CountryEnglish Continent UNRegion ISO2 Resolution AreaISO3v10
ContinentName
CountryCode
CountryCodeLon
gUNSDCode
PopulationPerUnit
LevelUsed
Level1Type
Level2Type
Level3Type
Liechtenstein LIE Europe 5 442 44205 LI 438 4 3 160 1
Lithuania LTU Europe 5 444 44405 LT 440 36 70 64,995 2 Province District
Luxembourg LUX Europe 5 446 44605 LU 442 5 4 2,587 2 Localite
Western Europe
Municipality
Northern Europe
Western Europe
Commune

CountryEnglish Continent UNRegion ISO2 Resolution AreaISO3v10
ContinentName
CountryCode
CountryCodeLon
gUNSDCode
PopulationPerUnit
LevelUsed
Level1Type
Level2Type
Level3Type
Latvia LVA Europe 5 407 40705 LV 428 10 4 64,196 2 Rajons
Monaco MCO Europe 5 502 50205 MC 492 3 34 10 0
Northern Europe
Rajona piseta
Western Europe

CountryEnglish Continent UNRegion ISO2 Resolution AreaISO3v10
ContinentName
CountryCode
CountryCodeLon
gUNSDCode
PopulationPerUnit
LevelUsed
Level1Type
Level2Type
Level3Type
Republic of Moldova MDA Europe 5 641 64105 MD 498 26 88 34,012 1 Rayon
Macedonia MKD Europe 5 762 76205 MK 807 14 16 24,702 2 Region
Malta MLT Europe 5 479 47905 MT 470 2 6 315 2 District Locality
Eastern Europe
Southern Europe
Municipality
Southern Europe

CountryEnglish Continent UNRegion ISO2 Resolution AreaISO3v10
ContinentName
CountryCode
CountryCodeLon
gUNSDCode
PopulationPerUnit
LevelUsed
Level1Type
Level2Type
Level3Type
Netherlands NLD Europe 5 530 53005 NL 528 9 67 41,364 2 Province
Norway NOR Europe 5 584 58405 NO 578 27 10 318,524 2 Fylke
Western Europe
Municipality
Northern Europe
Kommune
CountryEnglish Continent UNRegion ISO2 Resolution AreaISO3v10
ContinentName
CountryCode
CountryCodeLon
gUNSDCode
PopulationPerUnit
LevelUsed
Level1Type
Level2Type
Level3Type
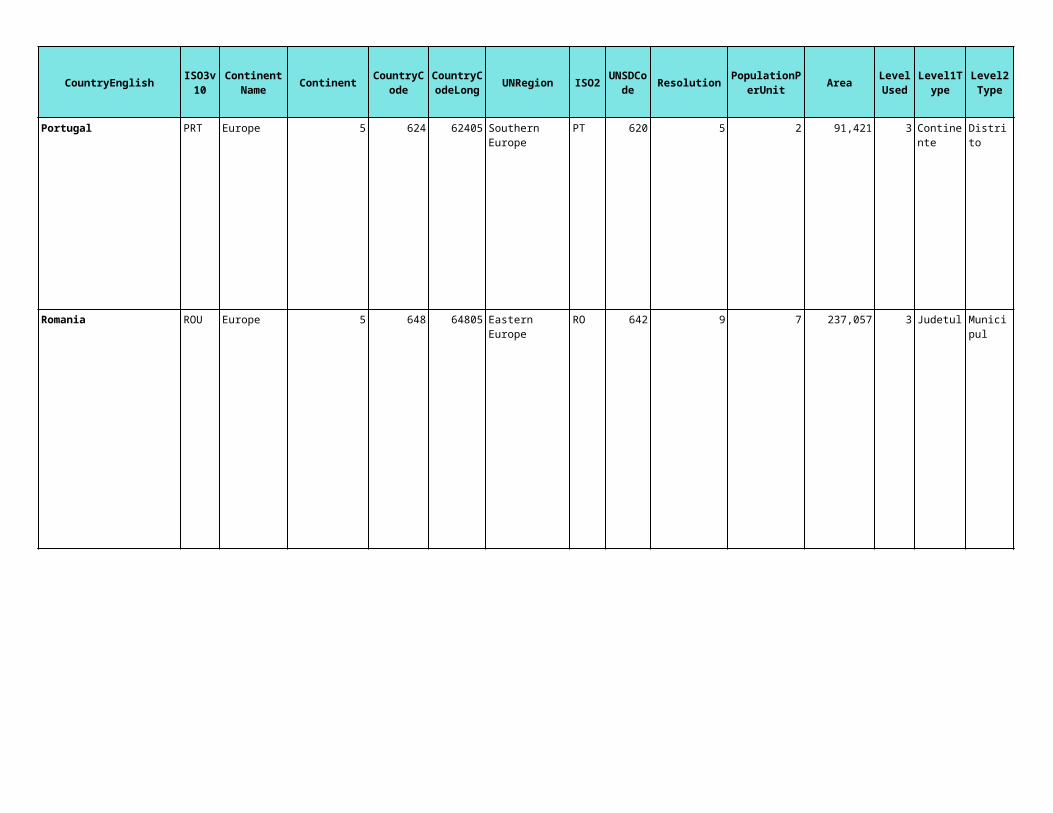
Portugal PRT Europe 5 624 62405 PT 620 5 2 91,421 3 Distrito
Romania ROU Europe 5 648 64805 RO 642 9 7 237,057 3 Judetul
Southern Europe
Continente
Freguesia
Eastern Europe
Municipul
Commune
CountryEnglish Continent UNRegion ISO2 Resolution AreaISO3v10
ContinentName
CountryCode
CountryCodeLon
gUNSDCode
PopulationPerUnit
LevelUsed
Level1Type
Level2Type
Level3Type
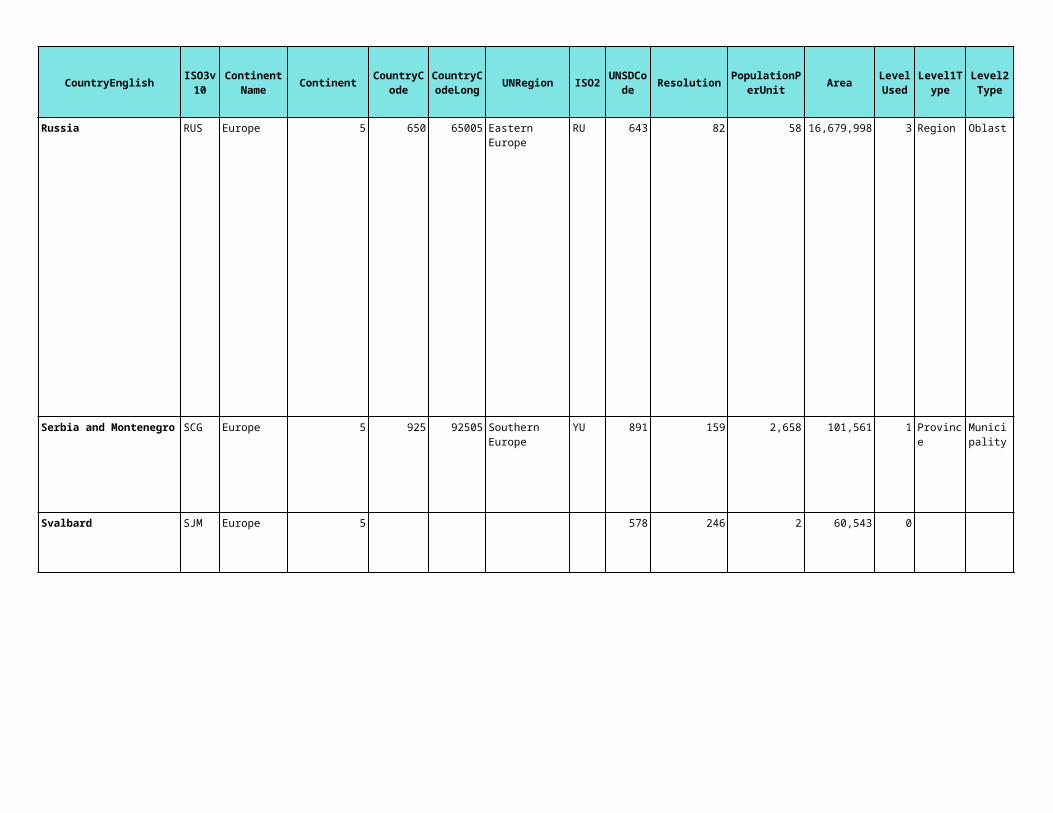
Russia RUS Europe 5 650 65005 RU 643 82 58 16,679,998 3 Region Oblast Raion
Serbia and Montenegro SCG Europe 5 925 92505 YU 891 159 2,658 101,561 1 Province
Svalbard SJM Europe 5 578 246 2 60,543 0
Eastern Europe
Southern Europe
Municipality
Settlement

CountryEnglish Continent UNRegion ISO2 Resolution AreaISO3v10
ContinentName
CountryCode
CountryCodeLon
gUNSDCode
PopulationPerUnit
LevelUsed
Level1Type
Level2Type
Level3Type
San Marino SMR Europe 5 666 66605 SM 674 8 26 62 0
Slovakia SVK Europe 5 693 69305 SK 703 4 2 48,875 3 Kraj Okres ZUJ
Slovenia SVN Europe 5 695 69505 SI 705 2 0 20,224 3 Region
Southern Europe
Eastern Europe
Southern Europe
Municipality
Settlement
CountryEnglish Continent UNRegion ISO2 Resolution AreaISO3v10
ContinentName
CountryCode
CountryCodeLon
gUNSDCode
PopulationPerUnit
LevelUsed
Level1Type
Level2Type
Level3Type
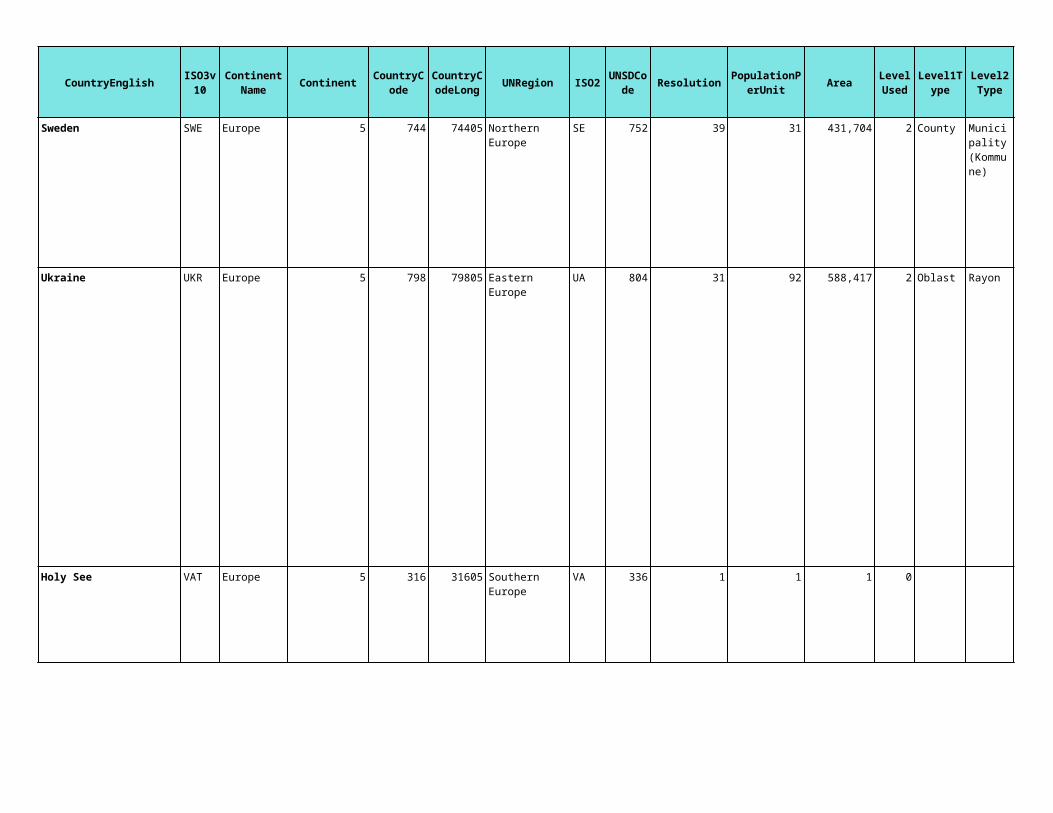
Sweden SWE Europe 5 744 74405 SE 752 39 31 431,704 2 County
Ukraine UKR Europe 5 798 79805 UA 804 31 92 588,417 2 Oblast Rayon
Holy See VAT Europe 5 316 31605 VA 336 1 1 1 0
Northern Europe
Municipality (Kommune)
Eastern Europe
Southern Europe

CountryEnglish Continent UNRegion ISO2 Resolution AreaISO3v10
ContinentName
CountryCode
CountryCodeLon
gUNSDCode
PopulationPerUnit
LevelUsed
Level1Type
Level2Type
Level3Type
Ireland IRL Europe 5 358 35805 IE 372 4 1 69,474 4 Province
Poland POL Europe 5 620 62005 PL 616 11 16 311,195 3 Voivod Poviativ Gmina
Aruba ABW 2 37 3705 Caribbean AW 533 14 101 189 0
Anguilla AIA 2 29 2905 Caribbean AI 660 9 11 83 0
Northern Europe
County/City
Urban/Rural area
Eastern Europe
North America
North America

CountryEnglish Continent UNRegion ISO2 Resolution AreaISO3v10
ContinentName
CountryCode
CountryCodeLon
gUNSDCode
PopulationPerUnit
LevelUsed
Level1Type
Level2Type
Level3Type
Netherland Antilles ANT 2 533 53305 Caribbean AN 530 3 2 818 2 Island
Antigua and Barbuda ATG 2 31 3105 Caribbean AG 28 15 32 444 1 Islands
Bahamas BHS 2 48 4805 Caribbean BS 44 28 18 13,162 1
Belize BLZ 2 61 6105 BZ 84 61 40 22,290 1 District
Bermuda BMU 2 62 6205 BM 60 8 63 63 0
Barbados BRB 2 54 5405 Caribbean BB 52 21 267 441 0
North America
Geozone
North America
North America
Island/ Supervisory District
North America
Central America
North America
Northern America
North America

CountryEnglish Continent UNRegion ISO2 Resolution AreaISO3v10
ContinentName
CountryCode
CountryCodeLon
gUNSDCode
PopulationPerUnit
LevelUsed
Level1Type
Level2Type
Level3Type
Canada CAN 2 116 11605 CA 124 40 5 9,458,886 3 Province
Costa Rica CRI 2 168 16805 CR 188 25 44 51,015 2
North America
Northern America
Census Division
Census Subdivision
North America
Central America
Provincia
Cantones

CountryEnglish Continent UNRegion ISO2 Resolution AreaISO3v10
ContinentName
CountryCode
CountryCodeLon
gUNSDCode
PopulationPerUnit
LevelUsed
Level1Type
Level2Type
Level3Type
Cuba CUB 2 170 17005 Caribbean CU 192 26 66 111,199 2
Cayman Islands CYM 2 122 12205 Caribbean KY 136 10 14 279 1 Islands
DMA 2 185 18505 Caribbean DM 212 9 7 769 1 Parishes
North America
Provincia
Municipio
North America
Commonwealth of Dominica
North America
CountryEnglish Continent UNRegion ISO2 Resolution AreaISO3v10
ContinentName
CountryCode
CountryCodeLon
gUNSDCode
PopulationPerUnit
LevelUsed
Level1Type
Level2Type
Level3Type
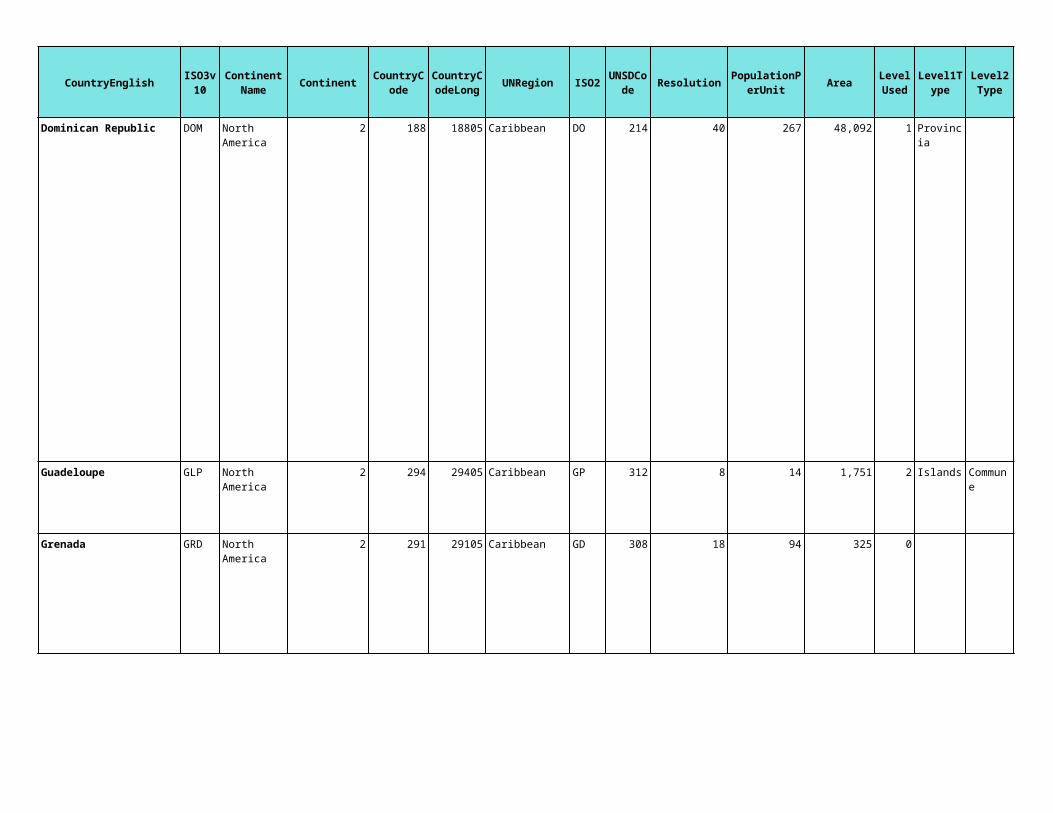
Dominican Republic DOM 2 188 18805 Caribbean DO 214 40 267 48,092 1
Guadeloupe GLP 2 294 29405 Caribbean GP 312 8 14 1,751 2 Islands
Grenada GRD 2 291 29105 Caribbean GD 308 18 94 325 0
North America
Provincia
North America
Commune
North America

CountryEnglish Continent UNRegion ISO2 Resolution AreaISO3v10
ContinentName
CountryCode
CountryCodeLon
gUNSDCode
PopulationPerUnit
LevelUsed
Level1Type
Level2Type
Level3Type
Greenland GRL 2 290 29005 GL 304 149 3 377,972 2 RegionNorth America
Northern America
Town/municipality

CountryEnglish Continent UNRegion ISO2 Resolution AreaISO3v10
ContinentName
CountryCode
CountryCodeLon
gUNSDCode
PopulationPerUnit
LevelUsed
Level1Type
Level2Type
Level3Type
Guatemala GTM 2 300 30005 GT 320 18 31 108,523 2North America
Central America
Departmento
Municipio

CountryEnglish Continent UNRegion ISO2 Resolution AreaISO3v10
ContinentName
CountryCode
CountryCodeLon
gUNSDCode
PopulationPerUnit
LevelUsed
Level1Type
Level2Type
Level3Type
Honduras HND 2 320 32005 HN 340 6 2 112,079 3 Aldea
Haiti HTI 2 312 31205 Caribbean HT 332 52 857 26,876 1
North America
Central America
Departamento
Municipio
North America
Departamento

CountryEnglish Continent UNRegion ISO2 Resolution AreaISO3v10
ContinentName
CountryCode
CountryCodeLon
gUNSDCode
PopulationPerUnit
LevelUsed
Level1Type
Level2Type
Level3Type
Jamaica JAM 2 374 37405 Caribbean JM 388 28 185 11,060 1 Parish
Saint Kitts and Nevis KNA 2 662 66205 Caribbean KN 659 12 19 277 1 Islands
Saint Lucia LCA 2 663 66305 Caribbean LC 662 25 148 620 0
North America
North America
North America

CountryEnglish Continent UNRegion ISO2 Resolution AreaISO3v10
ContinentName
CountryCode
CountryCodeLon
gUNSDCode
PopulationPerUnit
LevelUsed
Level1Type
Level2Type
Level3Type
Mexico MEX 2 496 49605 MX 484 28 40 1,943,018 2 EstadoNorth America
Central America
Municipio

CountryEnglish Continent UNRegion ISO2 Resolution AreaISO3v10
ContinentName
CountryCode
CountryCodeLon
gUNSDCode
PopulationPerUnit
LevelUsed
Level1Type
Level2Type
Level3Type
Montserrat MSR 2 507 50705 Caribbean MS 500 10 4 103 0
Martinique MTQ 2 480 48005 Caribbean MQ 474 34 383 1,146 0
North America
North America
CountryEnglish Continent UNRegion ISO2 Resolution AreaISO3v10
ContinentName
CountryCode
CountryCodeLon
gUNSDCode
PopulationPerUnit
LevelUsed
Level1Type
Level2Type
Level3Type
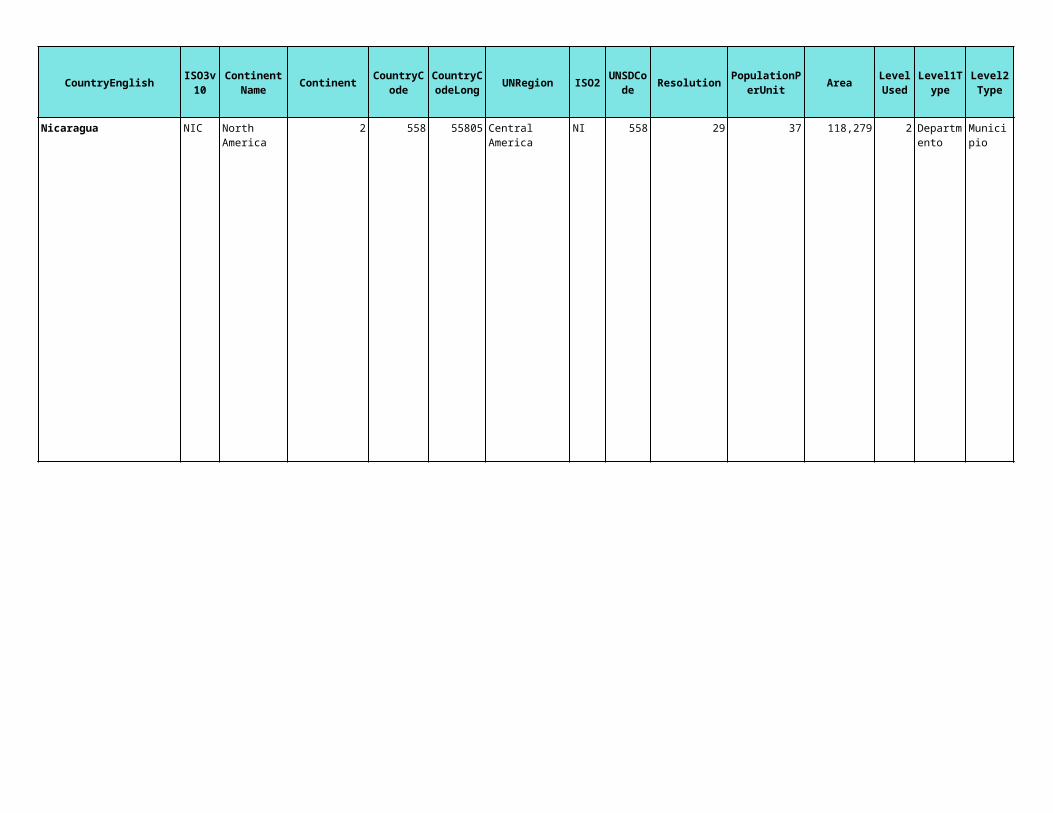
Nicaragua NIC 2 558 55805 NI 558 29 37 118,279 2North America
Central America
Departmento
Municipio

CountryEnglish Continent UNRegion ISO2 Resolution AreaISO3v10
ContinentName
CountryCode
CountryCodeLon
gUNSDCode
PopulationPerUnit
LevelUsed
Level1Type
Level2Type
Level3Type
Panama PAN 2 594 59405 PA 591 33 41 74,515 2
Puerto Rico PRI 2 639 63905 Caribbean PR 630 11 51 8,985 2
El Salvador SLV 2 200 20005 SV 222 9 23 20,279 2
North America
Central America
Provincia
Municipio
North America
North America
Central America
Departmento
Municipio

CountryEnglish Continent UNRegion ISO2 Resolution AreaISO3v10
ContinentName
CountryCode
CountryCodeLon
gUNSDCode
PopulationPerUnit
LevelUsed
Level1Type
Level2Type
Level3Type
St-Pierre and Miquelon SPM 2 664 66405 PM 666 9 2 227 1 Island
TCA 2 791 79105 Caribbean TC 796 23 17 548 0
Trinidad and Tobago TTO 2 774 77405 Caribbean TT 780 13 41 5,202 2 County Ward
United States of America USA 2 860 86005 US 840 12 5 9,210,755 3 State County Tract
North America
Northern America
Turks and Caicos Islands
North America
North America
North America
Northern America

CountryEnglish Continent UNRegion ISO2 Resolution AreaISO3v10
ContinentName
CountryCode
CountryCodeLon
gUNSDCode
PopulationPerUnit
LevelUsed
Level1Type
Level2Type
Level3Type
St. Vincent VCT 2 665 66505 Caribbean VC 670 21 113 453 0
British Virgin Islands VGB 2 88 8805 Caribbean VG 92 6 5 166 1 Islands
VIR 2 864 86405 Caribbean VI 850 3 3 374 2
American Samoa ASM Oceania 6 24 2405 Polynesia AS 16 6 11 198 1 County
North America
North America
United States Virgin Islands
North America
County (Islands)
Census Tracts
Block Groups
District/Island

CountryEnglish Continent UNRegion ISO2 Resolution AreaISO3v10
ContinentName
CountryCode
CountryCodeLon
gUNSDCode
PopulationPerUnit
LevelUsed
Level1Type
Level2Type
Level3Type
Australia AUS Oceania 6 42 4205 AU 36 76 13 7,634,648 4 State
Cook Islands COK Oceania 6 164 16405 Polynesia CK 184 7 1 688 2 Group Island
Fiji FJI Oceania 6 230 23005 Melanesia FJ 242 35 54 18,254 1 Province
Australia and New Zealand
Statistical Divisions
Statistical Subdivisions

CountryEnglish Continent UNRegion ISO2 Resolution AreaISO3v10
ContinentName
CountryCode
CountryCodeLon
gUNSDCode
PopulationPerUnit
LevelUsed
Level1Type
Level2Type
Level3Type
FSM Oceania 6 227 22705 Micronesia FM 583 13 27 675 1 Islands
Guam GUM Oceania 6 298 29805 Micronesia GU 316 2 1 546 3 County Tract
Kiribati KIR Oceania 6 387 38705 Micronesia KI 296 6 3 1,073 2 Island
Marshall Islands MHL Oceania 6 481 48105 Micronesia MH 584 15 51 219 0 Island
MNP Oceania 6 583 58305 Micronesia MP 580 3 1 466 3 County Tract
Federated State of Micronesia
Block Group
Island Group
Island Group
Northern Mariana Islands
Block Group

CountryEnglish Continent UNRegion ISO2 Resolution AreaISO3v10
ContinentName
CountryCode
CountryCodeLon
gUNSDCode
PopulationPerUnit
LevelUsed
Level1Type
Level2Type
Level3Type
New Caledonia NCL Oceania 6 542 54205 Melanesia NC 540 52 31 18,837 2 Province Island
Niue NIU Oceania 6 580 58005 Polynesia NU 570 16 2 267 0
Nauru NRU Oceania 6 522 52205 Micronesia NR 520 4 12 18 0

CountryEnglish Continent UNRegion ISO2 Resolution AreaISO3v10
ContinentName
CountryCode
CountryCodeLon
gUNSDCode
PopulationPerUnit
LevelUsed
Level1Type
Level2Type
Level3Type
New Zealand NZL Oceania 6 554 55405 NZ 554 27 10 265,334 2 Ward
Pitcairn PCN Oceania 6 616 61605 Polynesia PN 612 6 0 41 0
Palau PLW Oceania 6 591 59105 Micronesia PW 585 8 3 463 1 State
Australia and New Zealand
District/ City

CountryEnglish Continent UNRegion ISO2 Resolution AreaISO3v10
ContinentName
CountryCode
CountryCodeLon
gUNSDCode
PopulationPerUnit
LevelUsed
Level1Type
Level2Type
Level3Type
Papua New Guinea PNG Oceania 6 602 60205 Melanesia PG 598 152 241 464,043 1 Province
French Polynesia PYF Oceania 6 244 24405 Polynesia PF 258 10 6 3,745 2
Solomon Islands SLB Oceania 6 702 70205 Melanesia SB 90 54 42 28,707 1 Province
Tonga TON Oceania 6 770 77005 Polynesia TO 776 13 25 664 1
Island Group
Commune
Island Group

CountryEnglish Continent UNRegion ISO2 Resolution AreaISO3v10
ContinentName
CountryCode
CountryCodeLon
gUNSDCode
PopulationPerUnit
LevelUsed
Level1Type
Level2Type
Level3Type
Tuvalu TUV Oceania 6 790 79005 Polynesia TV 798 2 1 32 1 Island
Vanuatu VUT Oceania 6 875 87505 Melanesia VU 548 45 27 12,274 1 Province
Wallis and Futuna WLF Oceania 6 900 90005 Polynesia WF 876 9 7 176 1
Western Samoa WSM Oceania 6 670 67005 Polynesia WS 882 31 58 2,888 2 Region District
Island Group

CountryEnglish Continent UNRegion ISO2 Resolution AreaISO3v10
ContinentName
CountryCode
CountryCodeLon
gUNSDCode
PopulationPerUnit
LevelUsed
Level1Type
Level2Type
Level3Type
Argentina ARG 3 34 3405 South America AR 32 74 72 2,736,391 2South America
Provincia
Departamento

CountryEnglish Continent UNRegion ISO2 Resolution AreaISO3v10
ContinentName
CountryCode
CountryCodeLon
gUNSDCode
PopulationPerUnit
LevelUsed
Level1Type
Level2Type
Level3Type
Bolivia BOL 3 68 6805 South America BO 68 103 78 1,069,350 2
Brazil BRA 3 78 7805 South America BR 76 39 31 8,480,395 2 Estado
South America
Departamento
Provincia
South America
Municipio

CountryEnglish Continent UNRegion ISO2 Resolution AreaISO3v10
ContinentName
CountryCode
CountryCodeLon
gUNSDCode
PopulationPerUnit
LevelUsed
Level1Type
Level2Type
Level3Type
Chile CHL 3 134 13405 South America CL 152 50 50 721,229 3 Region
Colombia COL 3 150 15005 South America CO 170 33 34 1,141,569 2
South America
Provincias
Municipios
South America
Departamento
Municipio

CountryEnglish Continent UNRegion ISO2 Resolution AreaISO3v10
ContinentName
CountryCode
CountryCodeLon
gUNSDCode
PopulationPerUnit
LevelUsed
Level1Type
Level2Type
Level3Type
Ecuador ECU 3 194 19405 South America EC 218 16 12 246,700 3 Canton
Falkland Islands FLK 3 224 22405 South America FK 238 77 1 11,988 1 Islands
French Guiana GUF 3 240 24005 South America GF 254 63 7 83,634 3 Canton
South America
Provincias
Parroquia
South America
South America
Arrodissements
Comuna

CountryEnglish Continent UNRegion ISO2 Resolution AreaISO3v10
ContinentName
CountryCode
CountryCodeLon
gUNSDCode
PopulationPerUnit
LevelUsed
Level1Type
Level2Type
Level3Type
Guyana GUY 3 308 30805 South America GY 328 145 79 211,156 2 Region
Peru PER 3 608 60805 South America PE 604 26 14 1,289,475 3 Distrito
South America
Subregion
South America
Departamento
Provincia
CountryEnglish Continent UNRegion ISO2 Resolution AreaISO3v10
ContinentName
CountryCode
CountryCodeLon
gUNSDCode
PopulationPerUnit
LevelUsed
Level1Type
Level2Type
Level3Type
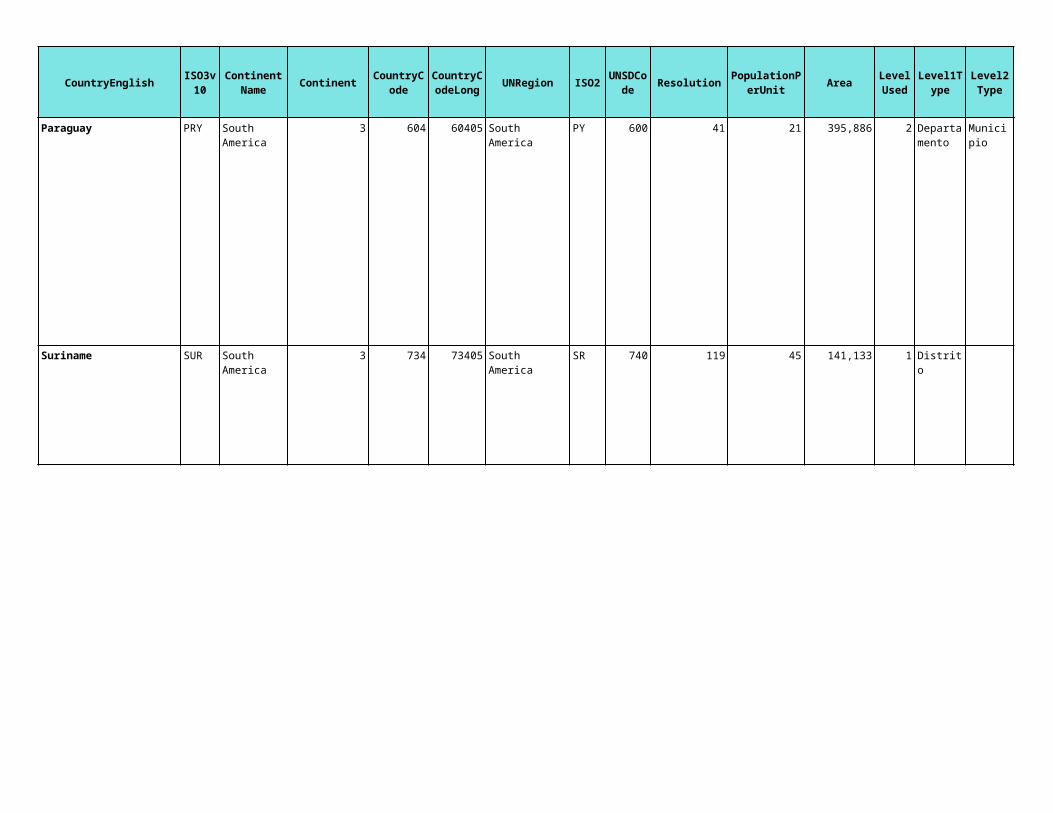
Paraguay PRY 3 604 60405 South America PY 600 41 21 395,886 2
Suriname SUR 3 734 73405 South America SR 740 119 45 141,133 1 Distrito
South America
Departamento
Municipio
South America

CountryEnglish Continent UNRegion ISO2 Resolution AreaISO3v10
ContinentName
CountryCode
CountryCodeLon
gUNSDCode
PopulationPerUnit
LevelUsed
Level1Type
Level2Type
Level3Type
Uruguay URY 3 874 87405 South America UY 858 96 171 173,985 1
Venezuela VEN 3 878 87805 South America VE 862 55 69 911,559 2 Estado
South America
Departamento
South America
Municipio

CountryEnglish
Angola
Burundi
Benin
Burkina Faso
Diff90 Diff00
18 1970 10,002 11,851 13,728 9,570 11,339 13,134 -4.51 -4.52
114 1990 1999 5,356 5,937 6,624 5,636 6,079 6,356 4.96 -4.22
78 1992 4,608 5,437 6,209 4,655 5,492 6,272 1.00 1.00
353 1985 1996 8,654 9,987 11,576 9,008 10,270 11,535 3.94 -0.35
Level4Type
Level5Type
NumUnits
RefYearFirst
RefYearLast
P90E ('000)
P95E ('000)
P00E ('000)
UN_P90 ('000)
UN_P95 ('000)
UN_P00 ('000)

CountryEnglish
Botswana
Central African Republic
Diff90 Diff00Level4Type
Level5Type
NumUnits
RefYearFirst
RefYearLast
P90E ('000)
P95E ('000)
P00E ('000)
UN_P90 ('000)
UN_P95 ('000)
UN_P00 ('000)
23 1991 2001 1,255 1,431 1,591 1,240 1,422 1,541 -1.22 -3.25
51 1988 2,804 3,187 3,540 2,945 3,347 3,717 4.79 4.78
CountryEnglish
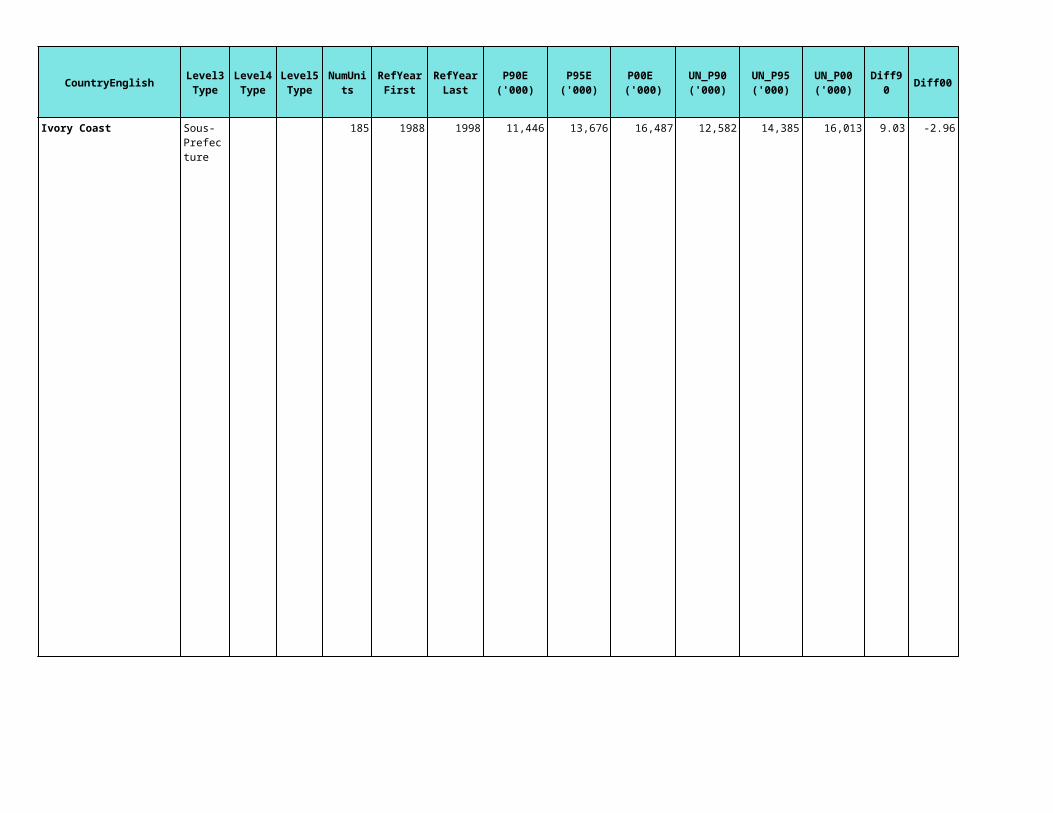
Ivory Coast
Diff90 Diff00Level4Type
Level5Type
NumUnits
RefYearFirst
RefYearLast
P90E ('000)
P95E ('000)
P00E ('000)
UN_P90 ('000)
UN_P95 ('000)
UN_P00 ('000)
185 1988 1998 11,446 13,676 16,487 12,582 14,385 16,013 9.03 -2.96

CountryEnglish
Cameroon
Diff90 Diff00Level4Type
Level5Type
NumUnits
RefYearFirst
RefYearLast
P90E ('000)
P95E ('000)
P00E ('000)
UN_P90 ('000)
UN_P95 ('000)
UN_P00 ('000)
49 1987 11,481 13,394 15,753 11,614 13,273 14,876 1.15 -5.89

CountryEnglish
Congo
Congo, Democratic Republic
Diff90 Diff00Level4Type
Level5Type
NumUnits
RefYearFirst
RefYearLast
P90E ('000)
P95E ('000)
P00E ('000)
UN_P90 ('000)
UN_P95 ('000)
UN_P00 ('000)
150 1970 1984 37,841 45,854 52,108 36,999 44,834 50,948 -2.28 -2.28
46 1984 2,224 2,595 3,009 2,230 2,603 3,018 0.29 0.29

CountryEnglish
Comoros
Cape Verde
Djibouti
Diff90 Diff00Level4Type
Level5Type
NumUnits
RefYearFirst
RefYearLast
P90E ('000)
P95E ('000)
P00E ('000)
UN_P90 ('000)
UN_P95 ('000)
UN_P00 ('000)
4 1991 1996 436 494 560 527 609 706 17.32 20.65
9 1990 2000 324 374 435 341 381 427 4.99 -1.83
5 1979 1998 556 574 598 504 545 632 -10.37 5.41

CountryEnglish
Algeria
Egypt
Diff90 Diff00Level4Type
Level5Type
NumUnits
RefYearFirst
RefYearLast
P90E ('000)
P95E ('000)
P00E ('000)
UN_P90 ('000)
UN_P95 ('000)
UN_P00 ('000)
48 1987 1998 24,470 27,248 30,421 24,855 27,655 30,291 1.55 -0.43
230 1992 1996 53,407 58,392 63,869 56,223 61,991 67,884 5.01 5.91

CountryEnglish
Eritrea
Ethiopia
Gabon
Diff90 Diff00Level4Type
Level5Type
NumUnits
RefYearFirst
RefYearLast
P90E ('000)
P95E ('000)
P00E ('000)
UN_P90 ('000)
UN_P95 ('000)
UN_P00 ('000)
38 1986 3,082 3,167 3,634 3,103 3,189 3,659 0.68 0.69
523 1994 47,102 54,911 62,370 47,509 55,385 62,908 0.86 0.86
46 1990 1993 1,005 1,159 1,322 935 1,078 1,230 -7.50 -7.50

CountryEnglish
Ghana
Guinea
Diff90 Diff00Level4Type
Level5Type
NumUnits
RefYearFirst
RefYearLast
P90E ('000)
P95E ('000)
P00E ('000)
UN_P90 ('000)
UN_P95 ('000)
UN_P00 ('000)
110 1984 2000 14,466 16,525 18,912 15,138 17,297 19,306 4.44 2.04
33 1983 1996 5,270 7,027 8,466 6,139 7,332 8,154 14.16 -3.82

CountryEnglish
Gambia
Guinea-Bissau
Equatorial Guinea
Diff90 Diff00Level4Type
Level5Type
NumUnits
RefYearFirst
RefYearLast
P90E ('000)
P95E ('000)
P00E ('000)
UN_P90 ('000)
UN_P95 ('000)
UN_P00 ('000)
37 1983 1993 925 1,076 1,197 928 1,115 1,303 0.32 8.15
37 1991 966 1,100 1,224 946 1,078 1,199 -2.11 -2.12
7 1983 348 395 452 352 399 457 1.10 1.09

CountryEnglish
Kenya
Liberia
Diff90 Diff00Level4Type
Level5Type
NumUnits
RefYearFirst
RefYearLast
P90E ('000)
P95E ('000)
P00E ('000)
UN_P90 ('000)
UN_P95 ('000)
UN_P00 ('000)
6603 1989 1999 22,138 25,533 29,544 23,574 27,315 30,669 6.09 3.67
54 1983 2,778 2,651 3,775 2,144 2,046 2,913 -29.57 -29.58
Locations
Sub-locations

CountryEnglish
Libyan Arab Jamahiriya
Lesotho
Morocco (includes Western Sahara)
Diff90 Diff00Level4Type
Level5Type
NumUnits
RefYearFirst
RefYearLast
P90E ('000)
P95E ('000)
P00E ('000)
UN_P90 ('000)
UN_P95 ('000)
UN_P00 ('000)
25 1984 4,545 5,013 5,577 4,311 4,755 5,290 -5.43 -5.42
10 1986 1996 1,687 1,814 1,961 1,682 1,869 2,035 -0.27 3.62
49 1982 1990 24,487 27,061 29,712 24,624 27,213 29,878 0.56 0.56

CountryEnglish
Madagascar
Mali
Diff90 Diff00Level4Type
Level5Type
NumUnits
RefYearFirst
RefYearLast
P90E ('000)
P95E ('000)
P00E ('000)
UN_P90 ('000)
UN_P95 ('000)
UN_P00 ('000)
1242 1993 2001 11,052 13,029 15,382 11,956 13,789 15,970 7.56 3.68
272 1987 1998 8,102 9,704 10,732 8,778 9,928 11,351 7.70 5.46

CountryEnglish
Mozambique
Diff90 Diff00Level4Type
Level5Type
NumUnits
RefYearFirst
RefYearLast
P90E ('000)
P95E ('000)
P00E ('000)
UN_P90 ('000)
UN_P95 ('000)
UN_P00 ('000)
402 1991 1997 12,451 14,392 16,743 13,645 16,293 18,292 8.75 8.47

CountryEnglish
Mauritania
Mauritius
Diff90 Diff00Level4Type
Level5Type
NumUnits
RefYearFirst
RefYearLast
P90E ('000)
P95E ('000)
P00E ('000)
UN_P90 ('000)
UN_P95 ('000)
UN_P00 ('000)
53 1988 2000 2,070 2,275 2,548 1,057 1,114 1,161 -95.84 -119.48
186 1990 2000 1,057 1,116 1,179 1,057 1,114 1,161 0.00 -1.54

CountryEnglish
Malawi
Mayotte
Namibia
Diff90 Diff00Level4Type
Level5Type
NumUnits
RefYearFirst
RefYearLast
P90E ('000)
P95E ('000)
P00E ('000)
UN_P90 ('000)
UN_P95 ('000)
UN_P00 ('000)
9218 1987 1998 8,474 9,356 10,338 9,434 10,020 11,308 10.18 8.58
1 1991 1997 89 118 155 90 117 153 0.71 -1.22
102 1991 2001 1,358 1,562 1,797 1,375 1,585 1,757 1.22 -2.27

CountryEnglish
Niger
Nigeria
Reunion
Diff90 Diff00Level4Type
Level5Type
NumUnits
RefYearFirst
RefYearLast
P90E ('000)
P95E ('000)
P00E ('000)
UN_P90 ('000)
UN_P95 ('000)
UN_P00 ('000)
129 1988 2001 7,538 8,491 9,729 7,707 9,109 10,832 2.19 10.18
538 1991 93,195 107,643 124,279 85,953 99,278 113,862 -8.43 -9.15
1 1990 1999 604 659 719 604 664 721 0.00 0.32

CountryEnglish
Rwanda
Sudan
Diff90 Diff00Level4Type
Level5Type
NumUnits
RefYearFirst
RefYearLast
P90E ('000)
P95E ('000)
P00E ('000)
UN_P90 ('000)
UN_P95 ('000)
UN_P00 ('000)
142 1991 6,891 5,071 7,749 6,766 4,979 7,609 -1.84 -1.84
85 1993 24,180 27,233 28,724 24,818 27,952 31,095 2.57 7.63

CountryEnglish
Senegal
St. Helena
Sierra Leone
Somalia
Diff90 Diff00Level4Type
Level5Type
NumUnits
RefYearFirst
RefYearLast
P90E ('000)
P95E ('000)
P00E ('000)
UN_P90 ('000)
UN_P95 ('000)
UN_P00 ('000)
93 1985 7,487 8,762 9,946 7,327 8,298 9,421 -2.18 -5.58
1 1990 1998 6 6 6 6 6 6 3.53 -4.92
147 1985 1999 3,269 3,746 5,086 4,061 4,080 4,405 19.51 -15.47
74 1999 2000 7,869 8,010 8,154 7,163 7,348 8,778 -9.86 7.11

CountryEnglish
Sao Tome and Principe
Swaziland
Seychelles
Diff90 Diff00Level4Type
Level5Type
NumUnits
RefYearFirst
RefYearLast
P90E ('000)
P95E ('000)
P00E ('000)
UN_P90 ('000)
UN_P95 ('000)
UN_P00 ('000)
2 1970 119 131 143 115 126 138 -3.48 -3.65
4 1986 1997 778 842 913 769 835 925 -1.12 1.31
2 1977 70 76 81 70 75 80 0.00 -1.23

CountryEnglish
Chad
Togo
Diff90 Diff00Level4Type
Level5Type
NumUnits
RefYearFirst
RefYearLast
P90E ('000)
P95E ('000)
P00E ('000)
UN_P90 ('000)
UN_P95 ('000)
UN_P00 ('000)
14 1990 5,454 6,302 7,378 5,829 6,735 7,885 6.43 6.42
21 1991 3,454 3,846 4,529 3,453 3,844 4,527 -0.03 -0.04

CountryEnglish
Tunisia
United Rep. of Tanzania
Diff90 Diff00Level4Type
Level5Type
NumUnits
RefYearFirst
RefYearLast
P90E ('000)
P95E ('000)
P00E ('000)
UN_P90 ('000)
UN_P95 ('000)
UN_P00 ('000)
23 1984 2002 7,948 8,887 9,563 8,156 8,943 9,459 2.56 -1.10
90 1988 2002 24,376 28,016 32,437 26,043 30,868 35,119 6.40 7.64

CountryEnglish
Uganda
South Africa
Diff90 Diff00Level4Type
Level5Type
NumUnits
RefYearFirst
RefYearLast
P90E ('000)
P95E ('000)
P00E ('000)
UN_P90 ('000)
UN_P95 ('000)
UN_P00 ('000)
Parish 4122 1980 1991 16,071 18,231 20,738 17,245 20,108 23,300 6.81 10.99
83125 1996 2001 36,530 39,876 43,551 36,376 40,033 43,309 -0.42 -0.56

CountryEnglish
Zambia
Zimbabwe
Afghanistan
Diff90 Diff00Level4Type
Level5Type
NumUnits
RefYearFirst
RefYearLast
P90E ('000)
P95E ('000)
P00E ('000)
UN_P90 ('000)
UN_P95 ('000)
UN_P00 ('000)
56 1990 2000 7,800 8,512 9,337 8,049 9,218 10,421 3.09 10.40
58 1992 2002 10,303 10,931 11,641 10,241 11,475 12,627 -0.61 7.81
329 1998 12,943 18,052 20,600 13,675 19,073 21,765 5.35 5.35

CountryEnglish
United Arab Emirates
Armenia
Diff90 Diff00Level4Type
Level5Type
NumUnits
RefYearFirst
RefYearLast
P90E ('000)
P95E ('000)
P00E ('000)
UN_P90 ('000)
UN_P95 ('000)
UN_P00 ('000)
8 1985 1995 1,822 2,377 3,196 2,014 2,352 2,606 9.53 -22.62
11 1989 2001 3,280 3,246 3,218 3,545 3,760 3,787 7.47 15.02

CountryEnglish
Azerbaijan
Diff90 Diff00Level4Type
Level5Type
NumUnits
RefYearFirst
RefYearLast
P90E ('000)
P95E ('000)
P00E ('000)
UN_P90 ('000)
UN_P95 ('000)
UN_P00 ('000)
74 1990 7,116 7,533 7,974 7,175 7,685 8,041 0.83 0.83

CountryEnglish
Bangladesh
Diff90 Diff00Level4Type
Level5Type
NumUnits
RefYearFirst
RefYearLast
P90E ('000)
P95E ('000)
P00E ('000)
UN_P90 ('000)
UN_P95 ('000)
UN_P00 ('000)
486 1991 2001 104,013 112,476 121,798 110,025 123,612 137,439 5.46 11.38
CountryEnglish
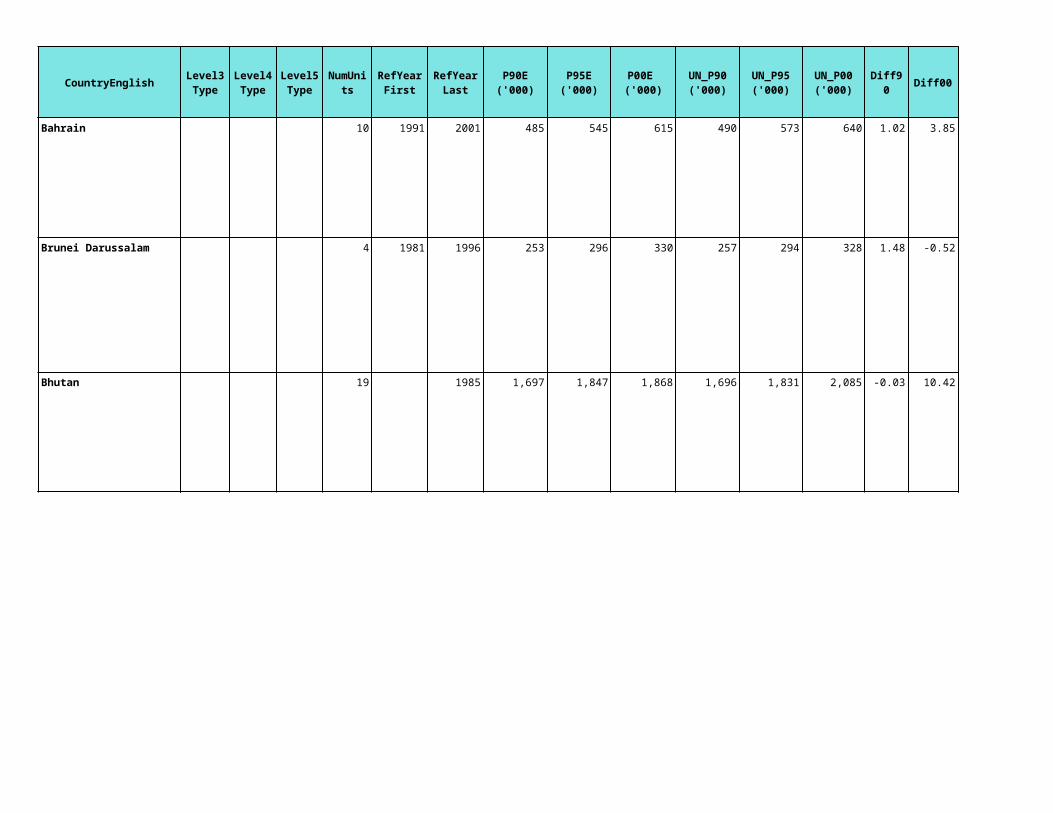
Bahrain
Brunei Darussalam
Bhutan
Diff90 Diff00Level4Type
Level5Type
NumUnits
RefYearFirst
RefYearLast
P90E ('000)
P95E ('000)
P00E ('000)
UN_P90 ('000)
UN_P95 ('000)
UN_P00 ('000)
10 1991 2001 485 545 615 490 573 640 1.02 3.85
4 1981 1996 253 296 330 257 294 328 1.48 -0.52
19 1985 1,697 1,847 1,868 1,696 1,831 2,085 -0.03 10.42

CountryEnglish
China
Diff90 Diff00Level4Type
Level5Type
NumUnits
RefYearFirst
RefYearLast
P90E ('000)
P95E ('000)
P00E ('000)
UN_P90 ('000)
UN_P95 ('000)
UN_P00 ('000)
2390 1990 2000 1,165,506 1,189,878 1,238,736 1,135,506 1,198,683 1,253,494 -2.64 1.18
CountryEnglish
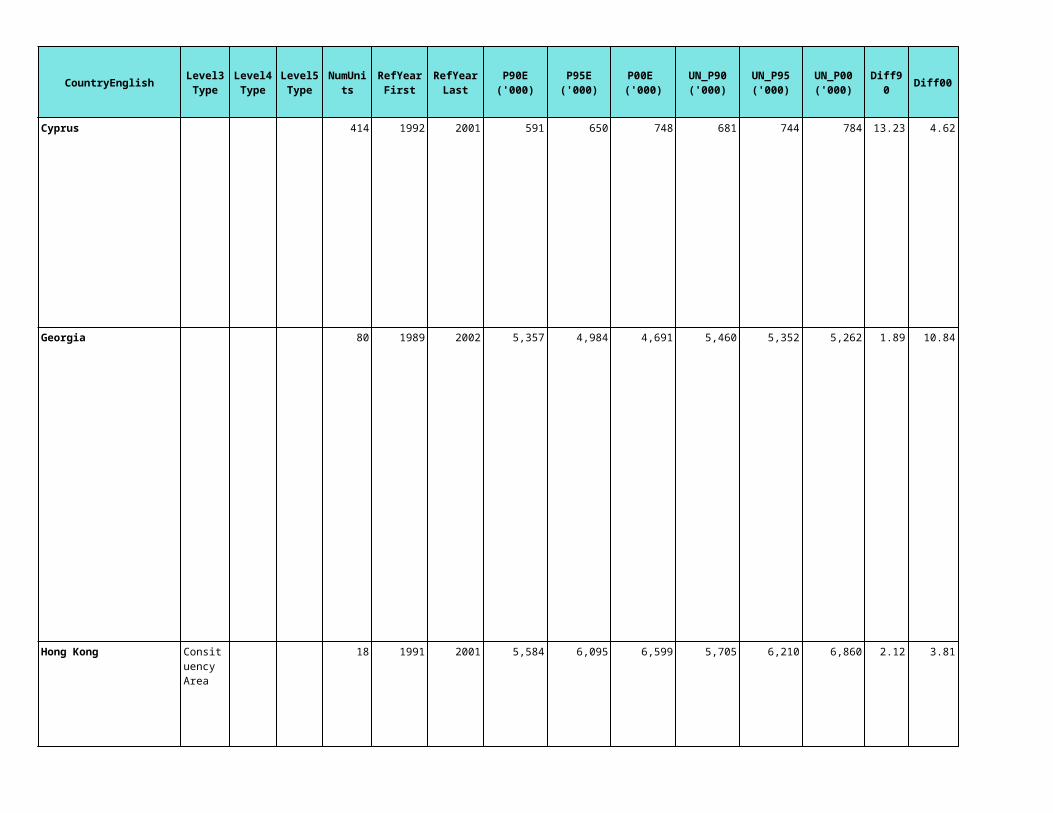
Cyprus
Georgia
Hong Kong
Diff90 Diff00Level4Type
Level5Type
NumUnits
RefYearFirst
RefYearLast
P90E ('000)
P95E ('000)
P00E ('000)
UN_P90 ('000)
UN_P95 ('000)
UN_P00 ('000)
414 1992 2001 591 650 748 681 744 784 13.23 4.62
80 1989 2002 5,357 4,984 4,691 5,460 5,352 5,262 1.89 10.84
18 1991 2001 5,584 6,095 6,599 5,705 6,210 6,860 2.12 3.81

CountryEnglish
Indonesia
Diff90 Diff00Level4Type
Level5Type
NumUnits
RefYearFirst
RefYearLast
P90E ('000)
P95E ('000)
P00E ('000)
UN_P90 ('000)
UN_P95 ('000)
UN_P00 ('000)
Desa 68400 1990 2000 173,432 186,151 200,122 182,474 197,622 212,092 4.96 5.64

CountryEnglish
India
Diff90 Diff00Level4Type
Level5Type
NumUnits
RefYearFirst
RefYearLast
P90E ('000)
P95E ('000)
P00E ('000)
UN_P90 ('000)
UN_P95 ('000)
UN_P00 ('000)
5089 1991 2001 759,963 837,800 924,223 844,886 927,102 1,008,937 10.05 8.40

CountryEnglish
Iran
Iraq
Israel
Diff90 Diff00Level4Type
Level5Type
NumUnits
RefYearFirst
RefYearLast
P90E ('000)
P95E ('000)
P00E ('000)
UN_P90 ('000)
UN_P95 ('000)
UN_P00 ('000)
250 1986 1996 53,246 58,714 64,832 58,435 64,630 70,330 8.88 7.82
19 1977 1985 17,996 20,181 23,098 17,271 20,049 22,946 -4.20 -0.66
15 1990 2001 5,046 5,572 6,171 4,514 5,349 6,040 -11.78 -2.17

CountryEnglish
Jordan
Diff90 Diff00Level4Type
Level5Type
NumUnits
RefYearFirst
RefYearLast
P90E ('000)
P95E ('000)
P00E ('000)
UN_P90 ('000)
UN_P95 ('000)
UN_P00 ('000)
39 1999 2001 4,170 4,796 5,516 3,254 4,249 4,913 -28.15 -12.28

CountryEnglish
Japan
Diff90 Diff00Level4Type
Level5Type
NumUnits
RefYearFirst
RefYearLast
P90E ('000)
P95E ('000)
P00E ('000)
UN_P90 ('000)
UN_P95 ('000)
UN_P00 ('000)
3373 1995 2000 124,430 125,570 126,926 123,537 125,472 127,096 -0.72 0.13
CountryEnglish
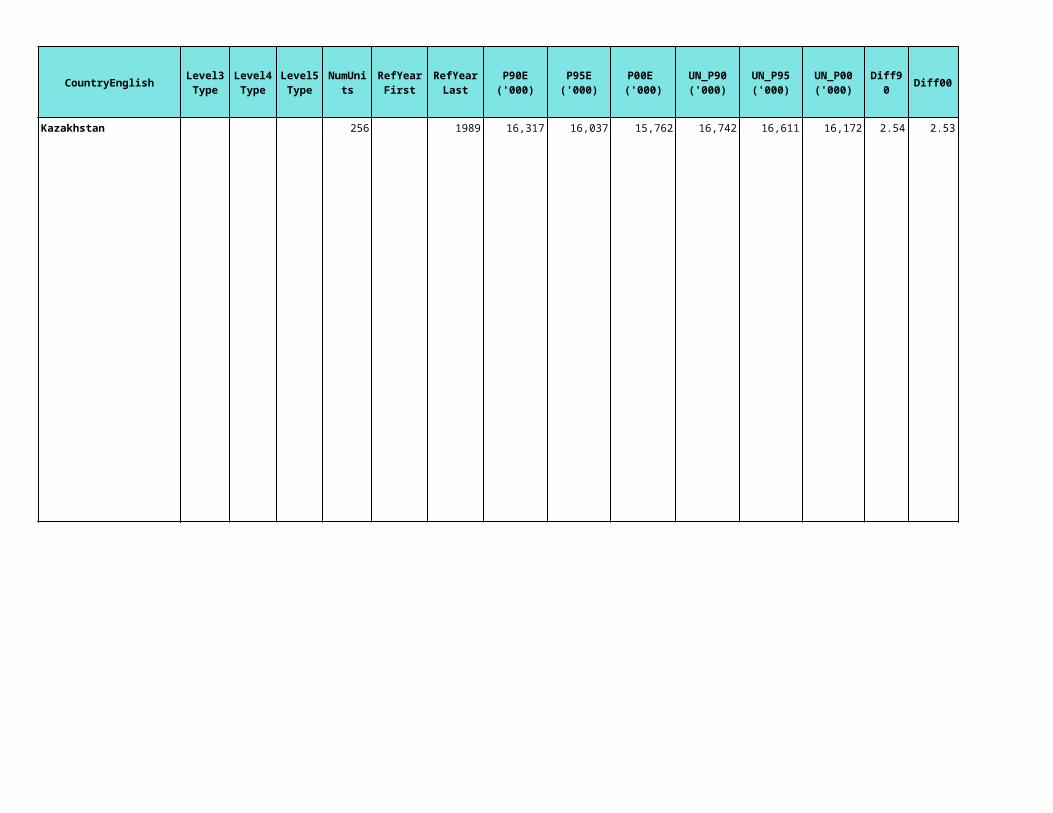
Kazakhstan
Diff90 Diff00Level4Type
Level5Type
NumUnits
RefYearFirst
RefYearLast
P90E ('000)
P95E ('000)
P00E ('000)
UN_P90 ('000)
UN_P95 ('000)
UN_P00 ('000)
256 1989 16,317 16,037 15,762 16,742 16,611 16,172 2.54 2.53

CountryEnglish
Kyrgyz Republic
Cambodia
Diff90 Diff00Level4Type
Level5Type
NumUnits
RefYearFirst
RefYearLast
P90E ('000)
P95E ('000)
P00E ('000)
UN_P90 ('000)
UN_P95 ('000)
UN_P00 ('000)
55 1990 1999 4,288 4,457 4,908 4,395 4,562 4,921 2.43 0.27
Village 1616 1994 1998 8,929 10,324 12,069 9,630 11,393 13,104 7.28 7.89
CountryEnglish
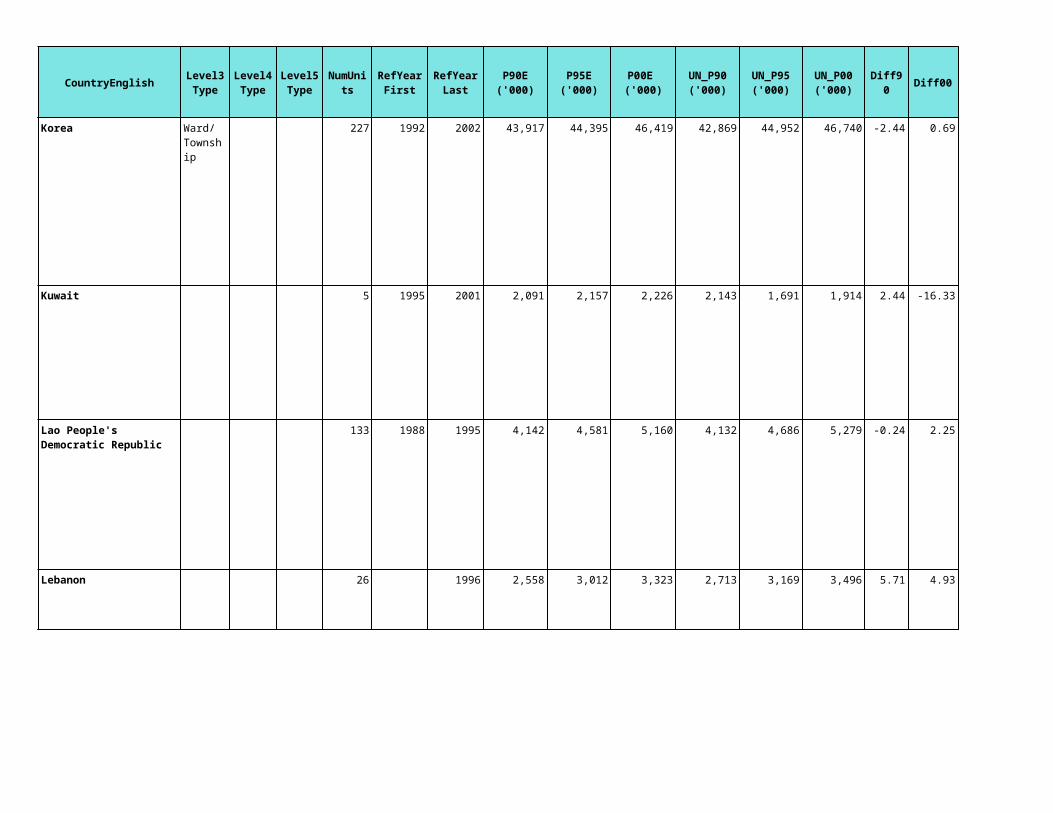
Korea
Kuwait
Lebanon
Lao People's Democratic Republic
Diff90 Diff00Level4Type
Level5Type
NumUnits
RefYearFirst
RefYearLast
P90E ('000)
P95E ('000)
P00E ('000)
UN_P90 ('000)
UN_P95 ('000)
UN_P00 ('000)
227 1992 2002 43,917 44,395 46,419 42,869 44,952 46,740 -2.44 0.69
5 1995 2001 2,091 2,157 2,226 2,143 1,691 1,914 2.44 -16.33
133 1988 1995 4,142 4,581 5,160 4,132 4,686 5,279 -0.24 2.25
26 1996 2,558 3,012 3,323 2,713 3,169 3,496 5.71 4.93

CountryEnglish
Sri Lanka
Macao
Maldives
Diff90 Diff00Level4Type
Level5Type
NumUnits
RefYearFirst
RefYearLast
P90E ('000)
P95E ('000)
P00E ('000)
UN_P90 ('000)
UN_P95 ('000)
UN_P00 ('000)
242 1981 2001 14,424 16,135 18,159 17,022 18,041 18,924 15.27 4.05
3 2001 349 386 427 372 416 444 6.29 3.93
21 1995 2000 227 246 269 216 250 291 -5.04 7.65

CountryEnglish
Myanmar
Mongolia
Malaysia
Nepal
Diff90 Diff00Level4Type
Level5Type
NumUnits
RefYearFirst
RefYearLast
P90E ('000)
P95E ('000)
P00E ('000)
UN_P90 ('000)
UN_P95 ('000)
UN_P00 ('000)
284 1985 1997 38,942 42,770 46,979 40,517 44,352 47,749 3.89 1.61
22 2000 2,002 2,180 2,374 2,216 2,413 2,533 9.66 6.28
920 1991 2000 17,005 19,264 22,071 17,845 20,017 22,218 4.70 0.66
75 1981 2001 18,099 20,209 22,625 18,142 20,439 23,043 0.23 1.81

CountryEnglish
Oman
Pakistan
Diff90 Diff00Level4Type
Level5Type
NumUnits
RefYearFirst
RefYearLast
P90E ('000)
P95E ('000)
P00E ('000)
UN_P90 ('000)
UN_P95 ('000)
UN_P00 ('000)
59 1993 2000 1,873 2,121 2,401 1,785 2,154 2,538 -4.94 5.39
104 1998 106,081 119,448 136,458 109,811 123,648 141,256 3.40 3.40

CountryEnglish
Philippines
Diff90 Diff00Level4Type
Level5Type
NumUnits
RefYearFirst
RefYearLast
P90E ('000)
P95E ('000)
P00E ('000)
UN_P90 ('000)
UN_P95 ('000)
UN_P00 ('000)
1541 1995 2000 61,686 67,997 75,950 61,040 68,341 75,653 -1.06 -0.39

CountryEnglish
Korea, Dem. People's Rep. of
Diff90 Diff00Level4Type
Level5Type
NumUnits
RefYearFirst
RefYearLast
P90E ('000)
P95E ('000)
P00E ('000)
UN_P90 ('000)
UN_P95 ('000)
UN_P00 ('000)
136 1991 2001 20,618 21,775 22,996 19,956 21,373 22,268 -3.32 -3.27

CountryEnglish
Occupied Palestinian Territory
Diff90 Diff00Level4Type
Level5Type
NumUnits
RefYearFirst
RefYearLast
P90E ('000)
P95E ('000)
P00E ('000)
UN_P90 ('000)
UN_P95 ('000)
UN_P00 ('000)
16 1997 2003 2,041 2,547 3,180 2,154 2,635 3,191 5.26 0.34
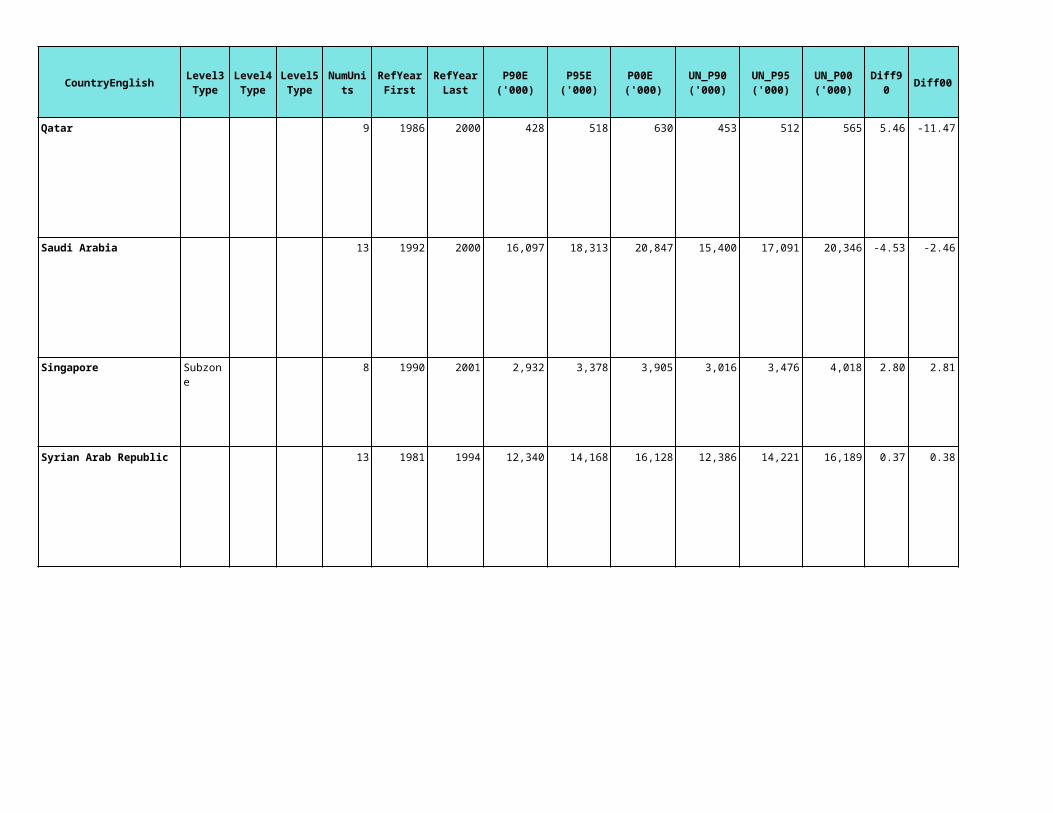
CountryEnglish
Qatar
Saudi Arabia
Singapore
Syrian Arab Republic
Diff90 Diff00Level4Type
Level5Type
NumUnits
RefYearFirst
RefYearLast
P90E ('000)
P95E ('000)
P00E ('000)
UN_P90 ('000)
UN_P95 ('000)
UN_P00 ('000)
9 1986 2000 428 518 630 453 512 565 5.46 -11.47
13 1992 2000 16,097 18,313 20,847 15,400 17,091 20,346 -4.53 -2.46
8 1990 2001 2,932 3,378 3,905 3,016 3,476 4,018 2.80 2.81
13 1981 1994 12,340 14,168 16,128 12,386 14,221 16,189 0.37 0.38

CountryEnglish
Thailand
Tajikistan
Diff90 Diff00Level4Type
Level5Type
NumUnits
RefYearFirst
RefYearLast
P90E ('000)
P95E ('000)
P00E ('000)
UN_P90 ('000)
UN_P95 ('000)
UN_P00 ('000)
789 1990 2000 55,498 57,975 60,896 54,736 58,729 62,806 -1.39 3.04
60 1989 5,192 5,562 5,959 5,303 5,741 6,087 2.09 2.10

CountryEnglish
Turkmenistan
East Timor
Turkey
Diff90 Diff00Level4Type
Level5Type
NumUnits
RefYearFirst
RefYearLast
P90E ('000)
P95E ('000)
P00E ('000)
UN_P90 ('000)
UN_P95 ('000)
UN_P00 ('000)
48 1989 3,196 3,632 4,127 3,668 4,210 4,737 12.87 12.87
18 1990 832 928 829 740 840 737 -12.46 -12.52
80 1990 2000 56,473 61,767 67,804 56,098 61,493 66,668 -0.67 -1.70

CountryEnglish
Taiwan
Uzbekistan
Diff90 Diff00Level4Type
Level5Type
NumUnits
RefYearFirst
RefYearLast
P90E ('000)
P95E ('000)
P00E ('000)
UN_P90 ('000)
UN_P95 ('000)
UN_P00 ('000)
21 1990 2000 19,799 20,666 21,639
208 1989 20,273 22,515 24,586 20,515 22,785 24,881 1.18 1.18
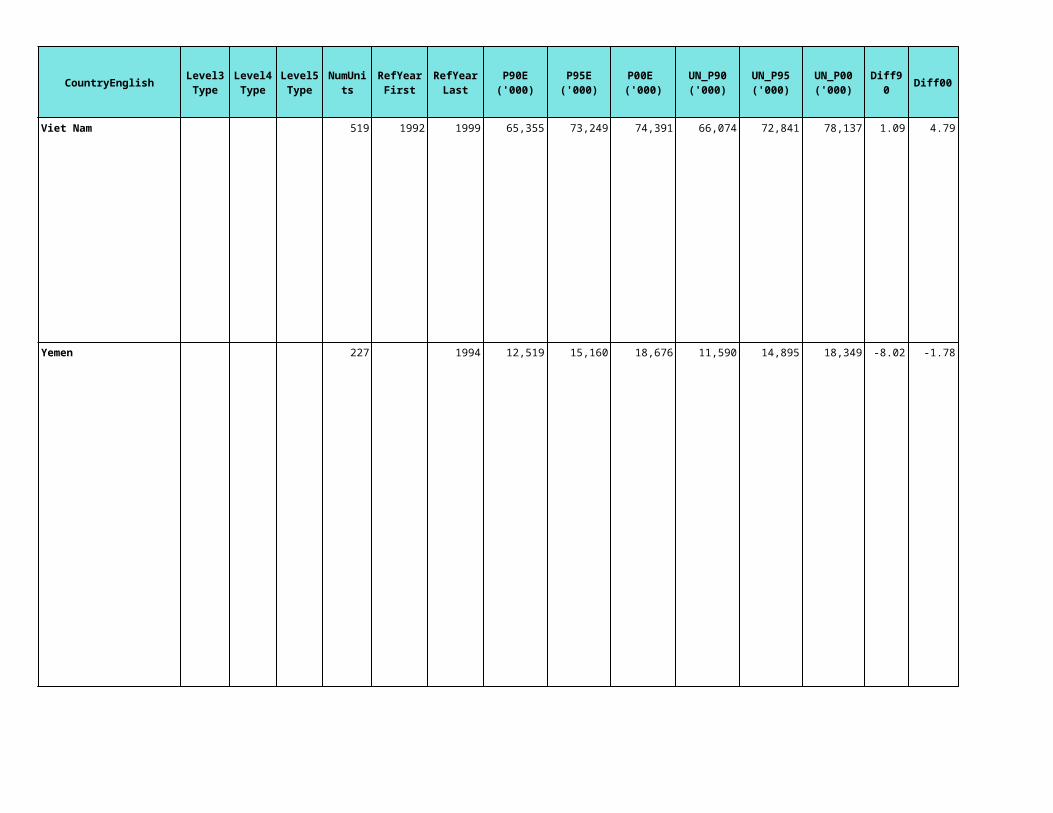
CountryEnglish
Viet Nam
Yemen
Diff90 Diff00Level4Type
Level5Type
NumUnits
RefYearFirst
RefYearLast
P90E ('000)
P95E ('000)
P00E ('000)
UN_P90 ('000)
UN_P95 ('000)
UN_P00 ('000)
519 1992 1999 65,355 73,249 74,391 66,074 72,841 78,137 1.09 4.79
227 1994 12,519 15,160 18,676 11,590 14,895 18,349 -8.02 -1.78

CountryEnglish
Albania
Andorra
Austria
Diff90 Diff00Level4Type
Level5Type
NumUnits
RefYearFirst
RefYearLast
P90E ('000)
P95E ('000)
P00E ('000)
UN_P90 ('000)
UN_P95 ('000)
UN_P00 ('000)
26 1990 2001 3,314 3,144 3,086 3,289 3,185 3,134 -0.76 1.52
7 2000 40 52 66 53 68 86 23.87 23.44
99 1991 2001 7,773 7,888 8,008 7,729 8,047 8,080 -0.58 0.89
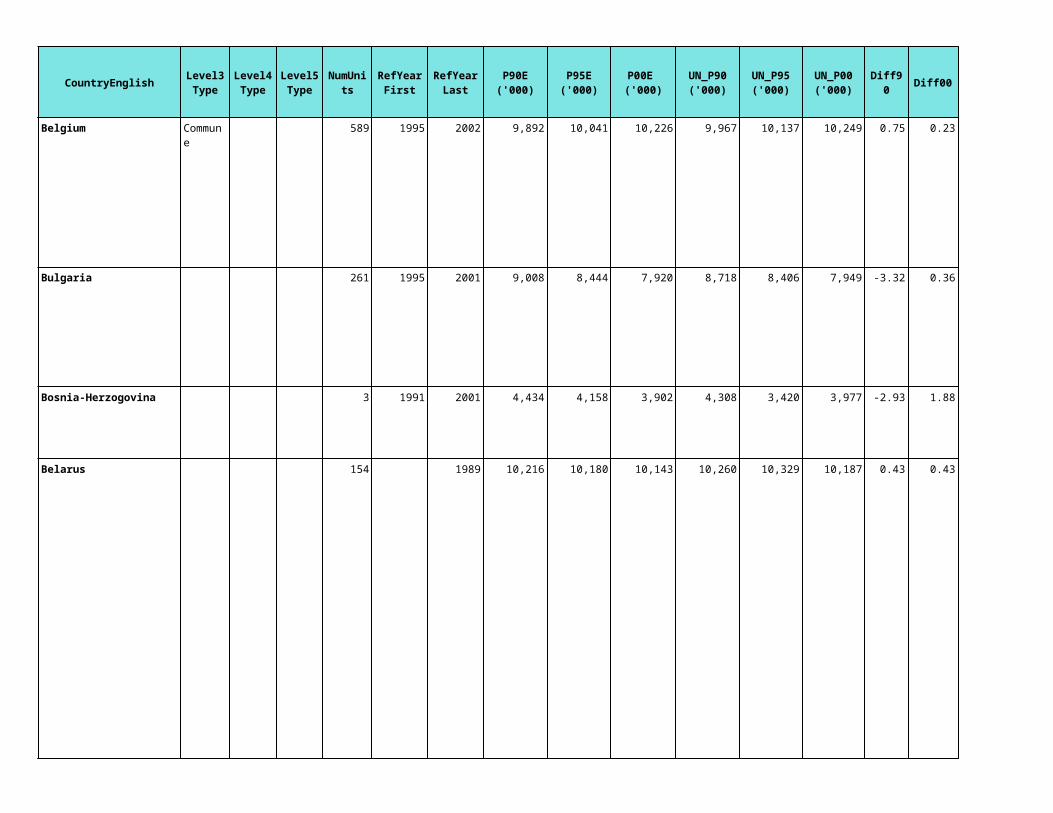
CountryEnglish
Belgium
Bulgaria
Bosnia-Herzogovina
Belarus
Diff90 Diff00Level4Type
Level5Type
NumUnits
RefYearFirst
RefYearLast
P90E ('000)
P95E ('000)
P00E ('000)
UN_P90 ('000)
UN_P95 ('000)
UN_P00 ('000)
589 1995 2002 9,892 10,041 10,226 9,967 10,137 10,249 0.75 0.23
261 1995 2001 9,008 8,444 7,920 8,718 8,406 7,949 -3.32 0.36
3 1991 2001 4,434 4,158 3,902 4,308 3,420 3,977 -2.93 1.88
154 1989 10,216 10,180 10,143 10,260 10,329 10,187 0.43 0.43

CountryEnglish
Switzerland
Czech Republic
Germany
Denmark
Diff90 Diff00Level4Type
Level5Type
NumUnits
RefYearFirst
RefYearLast
P90E ('000)
P95E ('000)
P00E ('000)
UN_P90 ('000)
UN_P95 ('000)
UN_P00 ('000)
2912 1997 2001 7,046 7,050 7,218 6,834 7,118 7,170 -3.10 -0.67
77 1995 2001 10,359 10,327 10,298 10,306 10,331 10,272 -0.51 -0.26
446 1995 2002 81,486 81,769 82,250 79,433 81,661 82,017 -2.58 -0.28
276 1995 2002 5,148 5,238 5,330 5,140 5,228 5,320 -0.15 -0.20

CountryEnglish
Spain
Estonia
Finland
Diff90 Diff00Level4Type
Level5Type
NumUnits
RefYearFirst
RefYearLast
P90E ('000)
P95E ('000)
P00E ('000)
UN_P90 ('000)
UN_P95 ('000)
UN_P00 ('000)
8186 1991 2001 38,674 39,626 40,634 39,303 39,737 39,910 1.60 -1.81
251 1990 2000 1,572 1,468 1,372 1,571 1,484 1,393 -0.04 1.50
448 1993 2000 5,027 5,079 5,188 4,986 5,108 5,172 -0.83 -0.32

CountryEnglish
France
Faeroe Islands
Diff90 Diff00Level4Type
Level5Type
NumUnits
RefYearFirst
RefYearLast
P90E ('000)
P95E ('000)
P00E ('000)
UN_P90 ('000)
UN_P95 ('000)
UN_P00 ('000)
36585 1990 1999 55,694 57,165 58,888 56,735 58,139 59,238 1.84 0.59
15 2001 48 44 47 47 44 46 -1.21 -1.18
Commune

CountryEnglish
United Kingdom
Guernsey
Diff90 Diff00Level4Type
Level5Type
NumUnits
RefYearFirst
RefYearLast
P90E ('000)
P95E ('000)
P00E ('000)
UN_P90 ('000)
UN_P95 ('000)
UN_P00 ('000)
434 1990 2001 57,876 58,488 58,719 57,561 58,606 59,415 -0.55 1.17
1 1991 2001 56 56 56

CountryEnglish
Gibraltar
Diff90 Diff00Level4Type
Level5Type
NumUnits
RefYearFirst
RefYearLast
P90E ('000)
P95E ('000)
P00E ('000)
UN_P90 ('000)
UN_P95 ('000)
UN_P00 ('000)
1 1991 1997 27 27 27 27 27 27 1.40 -1.63

CountryEnglish
Greece
Diff90 Diff00Level4Type
Level5Type
NumUnits
RefYearFirst
RefYearLast
P90E ('000)
P95E ('000)
P00E ('000)
UN_P90 ('000)
UN_P95 ('000)
UN_P00 ('000)
1034 1991 2001 10,067 10,427 10,843 10,160 10,454 10,610 0.91 -2.20

CountryEnglish
Croatia
Hungary
Diff90 Diff00Level4Type
Level5Type
NumUnits
RefYearFirst
RefYearLast
P90E ('000)
P95E ('000)
P00E ('000)
UN_P90 ('000)
UN_P95 ('000)
UN_P00 ('000)
544 2001 4,180 4,243 4,306 4,517 4,634 4,654 7.46 7.47
3158 1990 2002 10,251 10,216 10,186 10,365 10,214 9,968 1.10 -2.19

CountryEnglish
Isle of Man
Iceland
Italy
Jersey
Diff90 Diff00Level4Type
Level5Type
NumUnits
RefYearFirst
RefYearLast
P90E ('000)
P95E ('000)
P00E ('000)
UN_P90 ('000)
UN_P95 ('000)
UN_P00 ('000)
24 1996 2001 67 71 75 67 71 75 0.41 -0.48
123 1998 2000 258 266 283 255 267 279 -1.18 -1.38
8105 1991 2001 56,740 56,769 56,905 56,719 57,301 57,530 -0.04 1.09
1 1991 2001 84 85 87
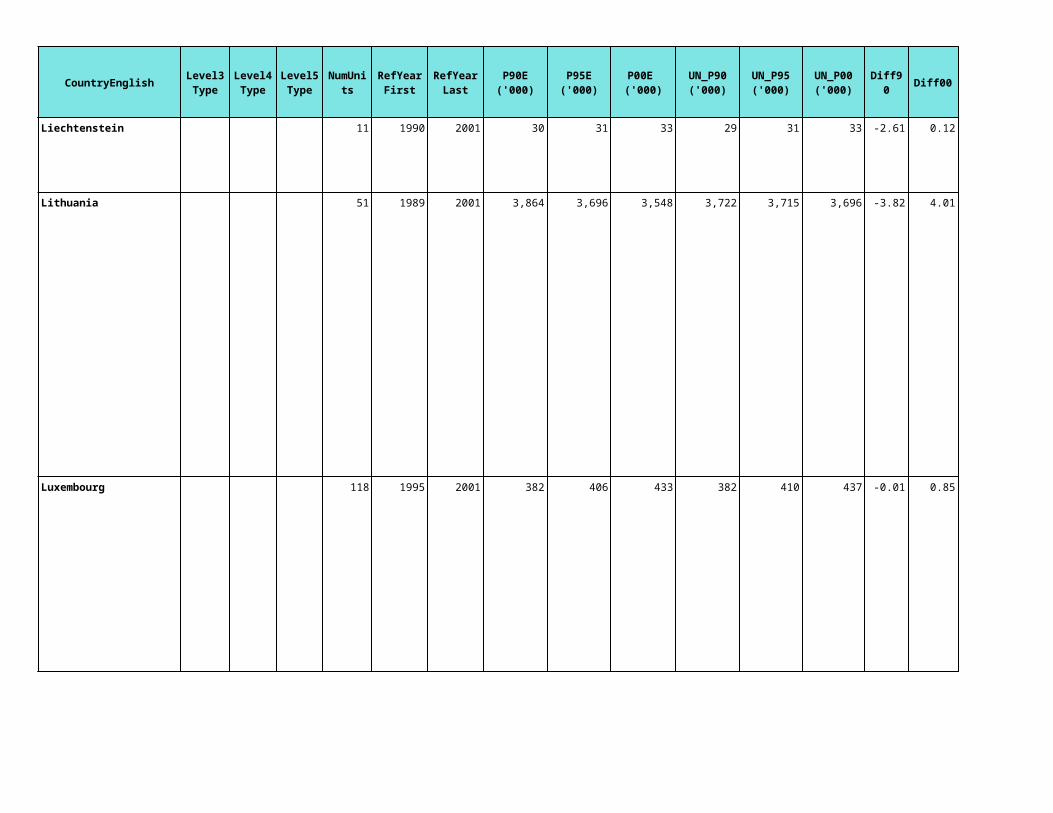
CountryEnglish
Liechtenstein
Lithuania
Luxembourg
Diff90 Diff00Level4Type
Level5Type
NumUnits
RefYearFirst
RefYearLast
P90E ('000)
P95E ('000)
P00E ('000)
UN_P90 ('000)
UN_P95 ('000)
UN_P00 ('000)
11 1990 2001 30 31 33 29 31 33 -2.61 0.12
51 1989 2001 3,864 3,696 3,548 3,722 3,715 3,696 -3.82 4.01
118 1995 2001 382 406 433 382 410 437 -0.01 0.85

CountryEnglish
Latvia
Monaco
Diff90 Diff00Level4Type
Level5Type
NumUnits
RefYearFirst
RefYearLast
P90E ('000)
P95E ('000)
P00E ('000)
UN_P90 ('000)
UN_P95 ('000)
UN_P00 ('000)
585 1990 2000 2,652 2,577 2,381 2,671 2,516 2,421 0.73 1.65
1 1995 30 32 34 30 32 33 -0.99 -2.42

CountryEnglish
Republic of Moldova
Macedonia
Malta
Diff90 Diff00Level4Type
Level5Type
NumUnits
RefYearFirst
RefYearLast
P90E ('000)
P95E ('000)
P00E ('000)
UN_P90 ('000)
UN_P95 ('000)
UN_P00 ('000)
49 1989 1998 4,332 4,313 4,304 4,364 4,339 4,295 0.72 -0.21
123 1994 2002 1,912 1,955 2,002 1,909 1,963 2,034 -0.15 1.56
67 1995 2001 365 378 392 360 378 390 -1.47 -0.46
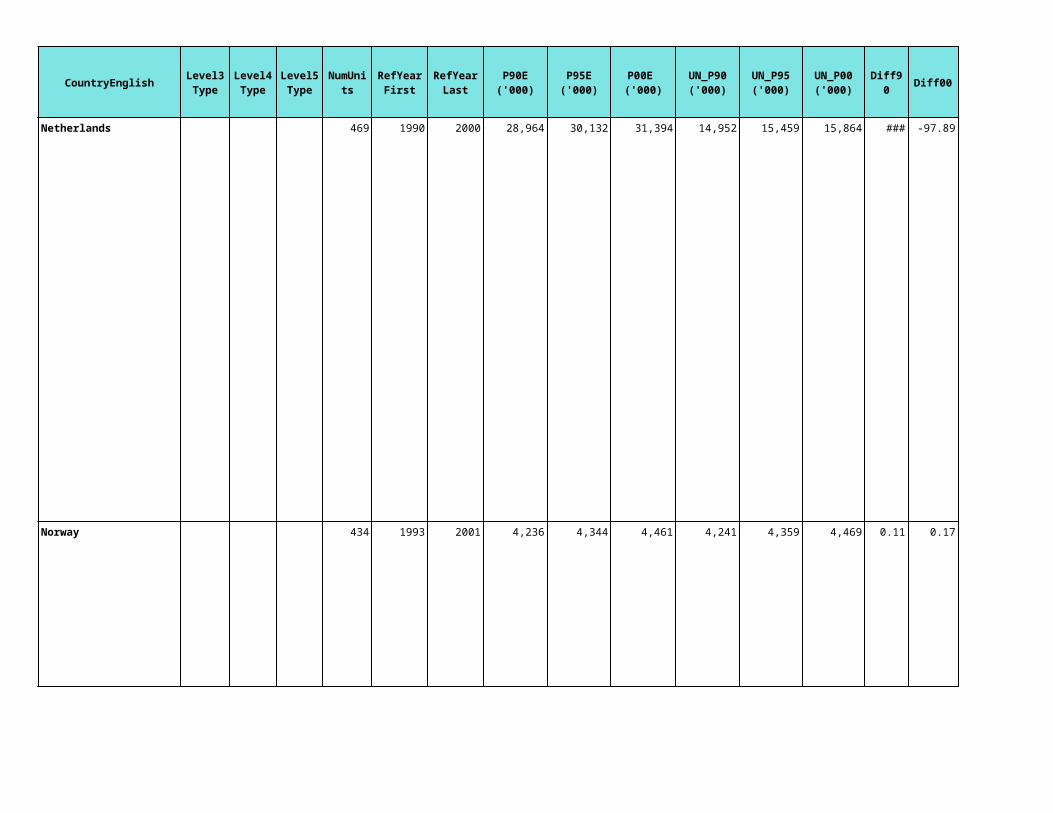
CountryEnglish
Netherlands
Norway
Diff90 Diff00Level4Type
Level5Type
NumUnits
RefYearFirst
RefYearLast
P90E ('000)
P95E ('000)
P00E ('000)
UN_P90 ('000)
UN_P95 ('000)
UN_P00 ('000)
469 1990 2000 28,964 30,132 31,394 14,952 15,459 15,864 -93.72 -97.89
434 1993 2001 4,236 4,344 4,461 4,241 4,359 4,469 0.11 0.17

CountryEnglish
Portugal
Romania
Diff90 Diff00Level4Type
Level5Type
NumUnits
RefYearFirst
RefYearLast
P90E ('000)
P95E ('000)
P00E ('000)
UN_P90 ('000)
UN_P95 ('000)
UN_P00 ('000)
4242 1981 2001 10,382 10,495 10,326 9,899 9,916 10,016 -4.88 -3.09
2935 1992 2002 22,884 22,317 21,768 23,207 22,681 22,438 1.39 2.99

CountryEnglish
Russia
Serbia and Montenegro
Svalbard
Diff90 Diff00Level4Type
Level5Type
NumUnits
RefYearFirst
RefYearLast
P90E ('000)
P95E ('000)
P00E ('000)
UN_P90 ('000)
UN_P95 ('000)
UN_P00 ('000)
2486 1989 148,839 148,058 145,410 148,292 148,141 145,491 -0.37 0.06
4 1988 2001 10,448 10,549 10,633 10,156 10,547 10,552 -2.87 -0.77
1 1990 2003 4 3 2

CountryEnglish
San Marino
Slovakia
Slovenia
Diff90 Diff00Level4Type
Level5Type
NumUnits
RefYearFirst
RefYearLast
P90E ('000)
P95E ('000)
P00E ('000)
UN_P90 ('000)
UN_P95 ('000)
UN_P00 ('000)
1 1990 2003 23 25 26 23 25 27 0.00 3.69
UTJ 2919 1997 2001 4,947 5,115 5,330 5,256 5,364 5,399 5.88 1.28
5989 1995 2002 2,008 1,989 1,971 1,918 1,990 1,988 -4.72 0.87

CountryEnglish
Sweden
Ukraine
Holy See
Diff90 Diff00Level4Type
Level5Type
NumUnits
RefYearFirst
RefYearLast
P90E ('000)
P95E ('000)
P00E ('000)
UN_P90 ('000)
UN_P95 ('000)
UN_P00 ('000)
288 1995 2002 8,804 8,837 8,886 8,559 8,827 8,842 -2.86 -0.50
623 1989 2004 52,225 54,830 57,583 51,891 51,531 49,568 -0.64 -16.17
1 1986 2003 1 1 1 1 1 1 20.20 11.60

CountryEnglish
Ireland
Poland
Aruba
Anguilla
Diff90 Diff00Level4Type
Level5Type
NumUnits
RefYearFirst
RefYearLast
P90E ('000)
P95E ('000)
P00E ('000)
UN_P90 ('000)
UN_P95 ('000)
UN_P00 ('000)
3440 1996 2002 3,427 3,589 3,810 3,515 3,609 3,803 2.49 -0.19
2489 1998 2001 38,845 38,719 38,644 38,111 38,595 38,605 -1.92 -0.10
1 66 84 101 66 84 101 0.09 0.42
1 8 10 11 8 10 11 -5.96 -3.73
Electoral District or Ward

CountryEnglish
Netherland Antilles
Antigua and Barbuda
Bahamas
Belize
Bermuda
Barbados
Diff90 Diff00Level4Type
Level5Type
NumUnits
RefYearFirst
RefYearLast
P90E ('000)
P95E ('000)
P00E ('000)
UN_P90 ('000)
UN_P95 ('000)
UN_P00 ('000)
71 1990 2001 188 190 177 188 205 215 -0.07 17.82
2 63 64 65 63 64 65 0.45 0.23
17 1990 2000 255 280 304 255 283 304 -0.03 0.11
6 1991 2000 185 210 240 186 203 226 0.74 -6.28
1 1990 2000 59 61 63 59 61 63 0.11 0.06
1 1990 2000 257 263 267 257 263 267 -0.07 -0.19

CountryEnglish
Canada
Costa Rica
Diff90 Diff00Level4Type
Level5Type
NumUnits
RefYearFirst
RefYearLast
P90E ('000)
P95E ('000)
P00E ('000)
UN_P90 ('000)
UN_P95 ('000)
UN_P00 ('000)
5984 1991 1996 27,121 28,638 29,771 27,701 29,354 30,757 2.09 3.21
82 1996 2000 3,022 3,307 3,621 3,049 3,554 4,024 0.89 10.02

CountryEnglish
Cuba
Cayman Islands
Commonwealth of Dominica
Diff90 Diff00Level4Type
Level5Type
NumUnits
RefYearFirst
RefYearLast
P90E ('000)
P95E ('000)
P00E ('000)
UN_P90 ('000)
UN_P95 ('000)
UN_P00 ('000)
169 1991 2000 10,863 11,031 11,217 10,629 10,964 11,199 -2.21 -0.16
3 1989 1999 26 33 41 26 32 38 -1.80 -7.23
10 1981 1991 71 70 69 71 71 71 -0.59 2.38

CountryEnglish
Dominican Republic
Guadeloupe
Grenada
Diff90 Diff00Level4Type
Level5Type
NumUnits
RefYearFirst
RefYearLast
P90E ('000)
P95E ('000)
P00E ('000)
UN_P90 ('000)
UN_P95 ('000)
UN_P00 ('000)
30 1993 2002 7,029 7,482 8,002 7,061 7,697 8,373 0.45 4.43
31 1990 1999 387 405 427 391 409 428 1.03 0.17
1 91 92 94 91 92 94 0.29 0.53

CountryEnglish
Greenland
Diff90 Diff00Level4Type
Level5Type
NumUnits
RefYearFirst
RefYearLast
P90E ('000)
P95E ('000)
P00E ('000)
UN_P90 ('000)
UN_P95 ('000)
UN_P00 ('000)
17 1990 2003 55 56 56 56 56 56 0.98 -0.05

CountryEnglish
Guatemala
Diff90 Diff00Level4Type
Level5Type
NumUnits
RefYearFirst
RefYearLast
P90E ('000)
P95E ('000)
P00E ('000)
UN_P90 ('000)
UN_P95 ('000)
UN_P00 ('000)
329 1994 2002 7,451 8,693 10,288 8,749 9,976 11,385 14.84 9.63

CountryEnglish
Honduras
Haiti
Diff90 Diff00Level4Type
Level5Type
NumUnits
RefYearFirst
RefYearLast
P90E ('000)
P95E ('000)
P00E ('000)
UN_P90 ('000)
UN_P95 ('000)
UN_P00 ('000)
Caserio 3695 1988 2001 4,480 5,113 5,907 4,870 5,625 6,417 8.01 7.94
10 1982 1992 6,379 7,389 8,570 6,907 7,522 8,142 7.65 -5.26
Barrio o Colonia
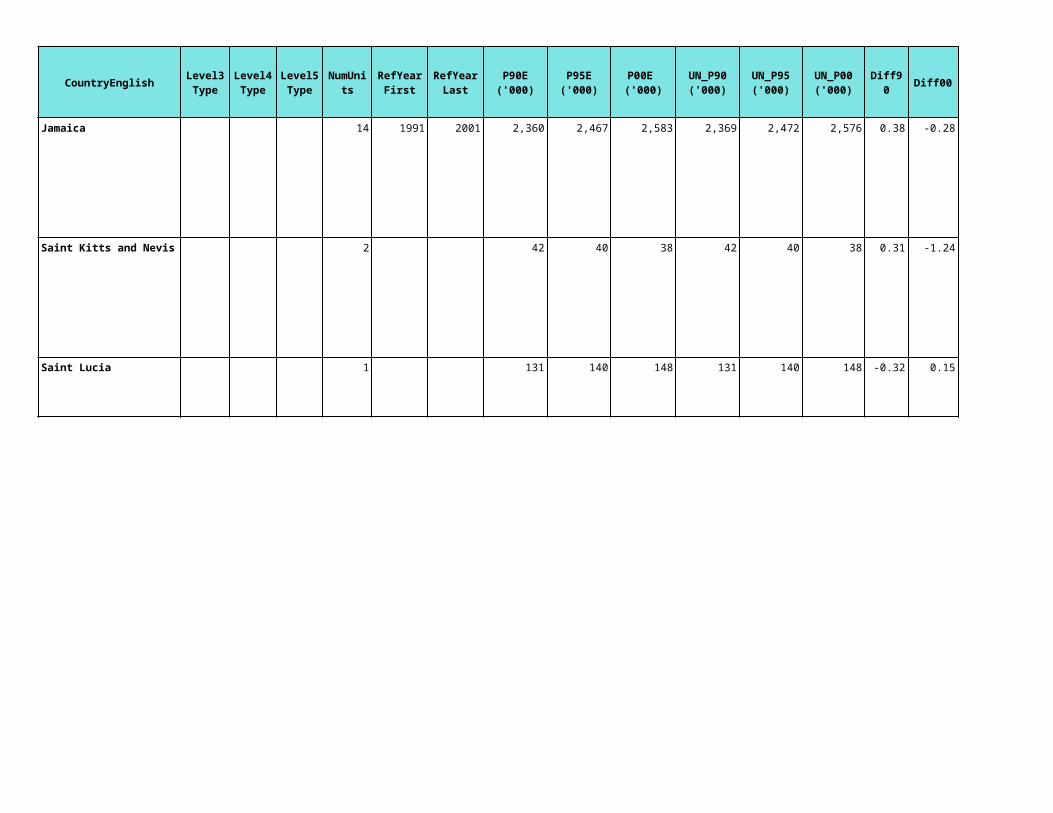
CountryEnglish
Jamaica
Saint Kitts and Nevis
Saint Lucia
Diff90 Diff00Level4Type
Level5Type
NumUnits
RefYearFirst
RefYearLast
P90E ('000)
P95E ('000)
P00E ('000)
UN_P90 ('000)
UN_P95 ('000)
UN_P00 ('000)
14 1991 2001 2,360 2,467 2,583 2,369 2,472 2,576 0.38 -0.28
2 42 40 38 42 40 38 0.31 -1.24
1 131 140 148 131 140 148 -0.32 0.15

CountryEnglish
Mexico
Diff90 Diff00Level4Type
Level5Type
NumUnits
RefYearFirst
RefYearLast
P90E ('000)
P95E ('000)
P00E ('000)
UN_P90 ('000)
UN_P95 ('000)
UN_P00 ('000)
2414 1990 2000 81,217 88,523 97,385 83,223 91,138 98,872 2.41 1.50

CountryEnglish
Montserrat
Martinique
Diff90 Diff00Level4Type
Level5Type
NumUnits
RefYearFirst
RefYearLast
P90E ('000)
P95E ('000)
P00E ('000)
UN_P90 ('000)
UN_P95 ('000)
UN_P00 ('000)
1 11 10 4 11 10 4 2.47 6.28
1 360 372 383 360 372 383 -0.08 -0.10
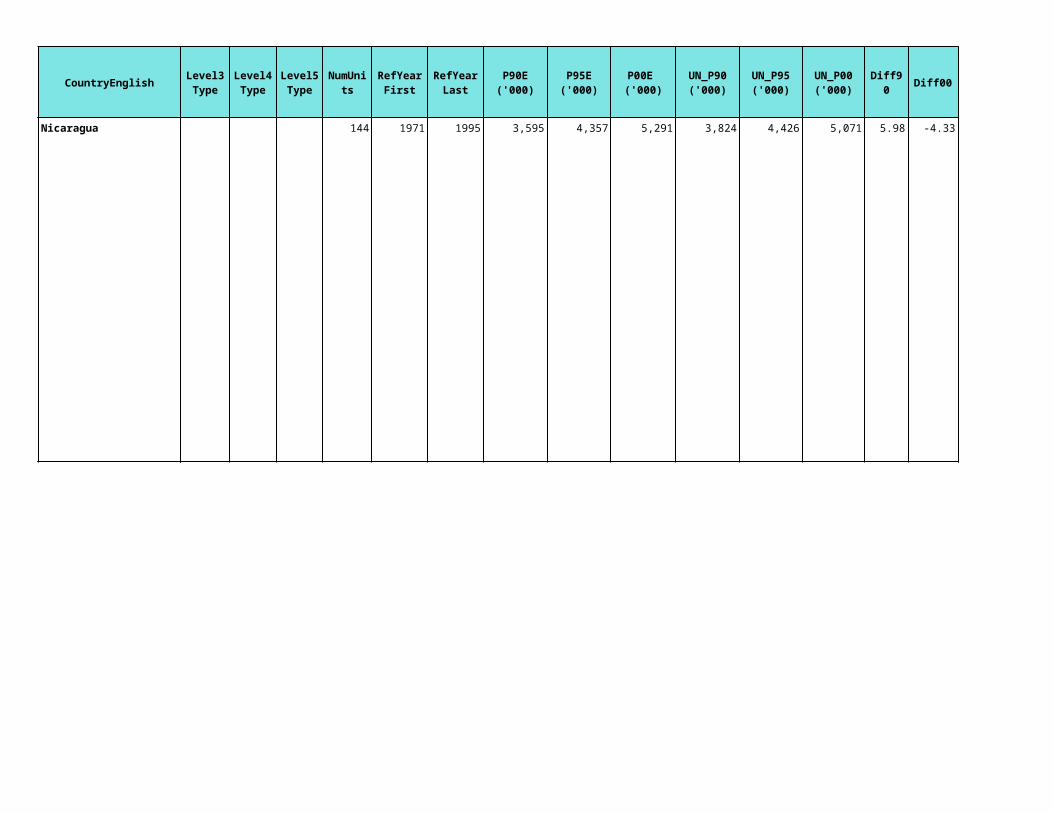
CountryEnglish
Nicaragua
Diff90 Diff00Level4Type
Level5Type
NumUnits
RefYearFirst
RefYearLast
P90E ('000)
P95E ('000)
P00E ('000)
UN_P90 ('000)
UN_P95 ('000)
UN_P00 ('000)
144 1971 1995 3,595 4,357 5,291 3,824 4,426 5,071 5.98 -4.33

CountryEnglish
Panama
Puerto Rico
El Salvador
Diff90 Diff00Level4Type
Level5Type
NumUnits
RefYearFirst
RefYearLast
P90E ('000)
P95E ('000)
P00E ('000)
UN_P90 ('000)
UN_P95 ('000)
UN_P00 ('000)
67 1990 2000 2,255 2,488 2,764 2,398 2,631 2,856 5.98 3.23
78 1990 1997 3,522 3,724 3,974 3,528 3,718 3,915 0.17 -1.51
263 1992 2002 4,940 5,427 5,983 5,112 5,670 6,278 3.36 4.70

CountryEnglish
St-Pierre and Miquelon
Trinidad and Tobago
United States of America
Turks and Caicos Islands
Diff90 Diff00Level4Type
Level5Type
NumUnits
RefYearFirst
RefYearLast
P90E ('000)
P95E ('000)
P00E ('000)
UN_P90 ('000)
UN_P95 ('000)
UN_P00 ('000)
3 1990 1999 6 6 6 6 7 7 -4.62 9.71
1 12 14 17 12 14 17 3.70 1.77
30 1990 2000 1,177 1,200 1,225 1,215 1,262 1,294 3.14 5.33
60904 1990 2000 248,594 262,507 281,322 254,776 268,744 283,230 2.43 0.67Block Group

CountryEnglish
St. Vincent
British Virgin Islands
American Samoa
United States Virgin Islands
Diff90 Diff00Level4Type
Level5Type
NumUnits
RefYearFirst
RefYearLast
P90E ('000)
P95E ('000)
P00E ('000)
UN_P90 ('000)
UN_P95 ('000)
UN_P00 ('000)
1 106 110 113 106 110 113 0.23 -0.25
4 16 19 22 17 20 24 4.09 9.12
Blocks 32 1990 2000 94 101 109 104 114 121 9.97 10.24
5 1990 2000 47 52 57 47 57 68 0.48 15.75

CountryEnglish
Australia
Cook Islands
Fiji
Diff90 Diff00Level4Type
Level5Type
NumUnits
RefYearFirst
RefYearLast
P90E ('000)
P95E ('000)
P00E ('000)
UN_P90 ('000)
UN_P95 ('000)
UN_P00 ('000)
1329 1996 2001 16,643 17,660 17,704 16,888 18,072 19,138 1.45 7.49
15 1991 2001 19 19 18 18 19 20 -2.88 9.08
15 1986 2001 738 769 812 724 768 814 -2.00 0.29
Statistical Local Area (SLA)

CountryEnglish
Guam
Kiribati
Marshall Islands
Federated State of Micronesia
Northern Mariana Islands
Diff90 Diff00Level4Type
Level5Type
NumUnits
RefYearFirst
RefYearLast
P90E ('000)
P95E ('000)
P00E ('000)
UN_P90 ('000)
UN_P95 ('000)
UN_P00 ('000)
4 1994 2000 104 106 107 94 108 123 -11.01 13.00
203 2000 134 144 155 134 145 155 0.30 0.13
28 1990 2000 72 78 84 72 77 83 -0.47 -1.80
1 44 48 51 44 48 51 -0.94 -0.27
Block 72 2000 42 55 69 44 58 73 4.82 5.18

CountryEnglish
New Caledonia
Niue
Nauru
Diff90 Diff00Level4Type
Level5Type
NumUnits
RefYearFirst
RefYearLast
P90E ('000)
P95E ('000)
P00E ('000)
UN_P90 ('000)
UN_P95 ('000)
UN_P00 ('000)
7 1989 1996 168 192 218 171 193 215 1.48 -1.59
1 1991 2001 2 2 2 2 2 2 -14.50 7.15
1 10 11 12 9 11 12 -6.16 4.17
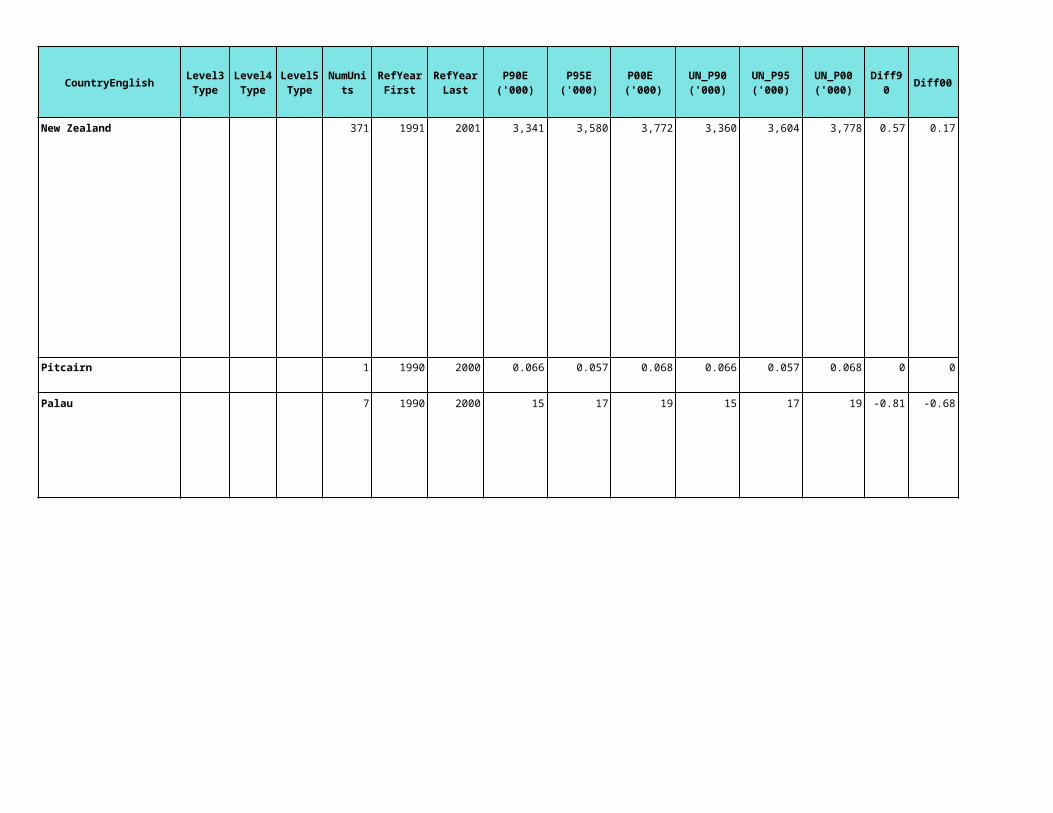
CountryEnglish
New Zealand
Pitcairn
Palau
Diff90 Diff00Level4Type
Level5Type
NumUnits
RefYearFirst
RefYearLast
P90E ('000)
P95E ('000)
P00E ('000)
UN_P90 ('000)
UN_P95 ('000)
UN_P00 ('000)
371 1991 2001 3,341 3,580 3,772 3,360 3,604 3,778 0.57 0.17
1 1990 2000 0.066 0.057 0.068 0.066 0.057 0.068 0 0
7 1990 2000 15 17 19 15 17 19 -0.81 -0.68

CountryEnglish
Papua New Guinea
French Polynesia
Solomon Islands
Tonga
Diff90 Diff00Level4Type
Level5Type
NumUnits
RefYearFirst
RefYearLast
P90E ('000)
P95E ('000)
P00E ('000)
UN_P90 ('000)
UN_P95 ('000)
UN_P00 ('000)
20 1980 1990 3,775 4,304 4,826 3,762 4,279 4,809 -0.35 -0.35
39 1988 2002 196 215 236 195 215 233 -0.43 -1.39
10 1986 1999 318 366 421 319 377 447 0.21 5.88
4 1986 1996 96 97 99 96 97 99 0.28 0.35
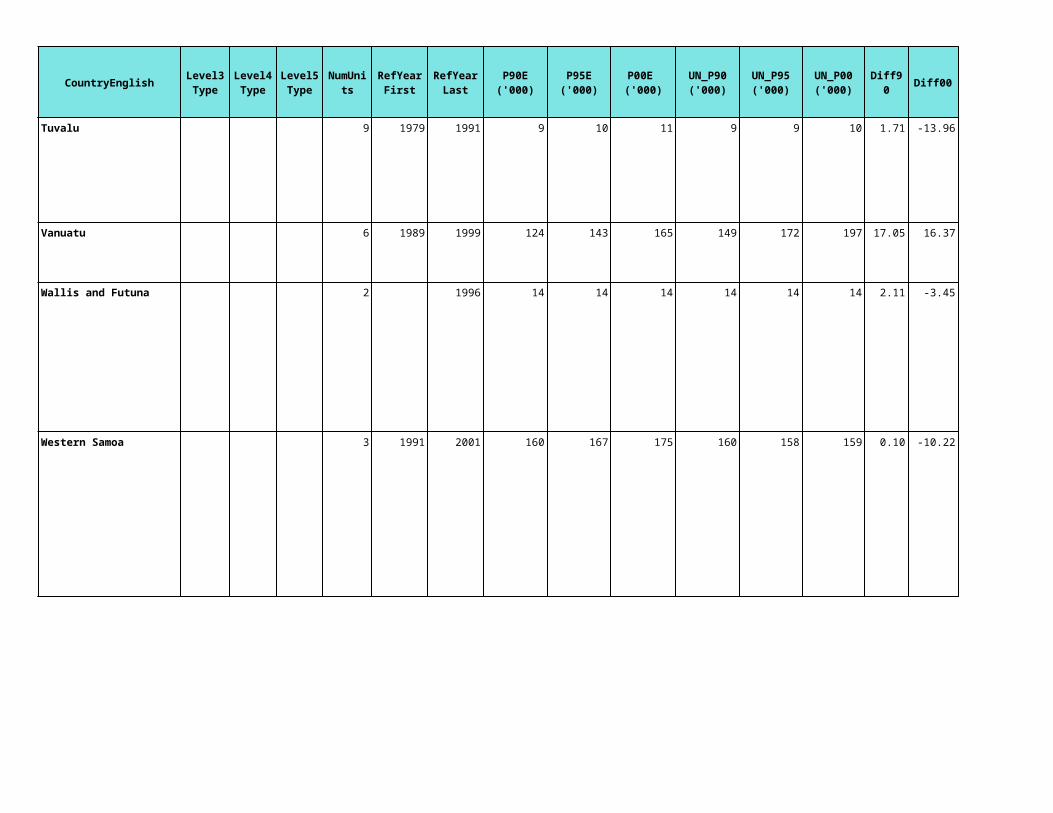
CountryEnglish
Tuvalu
Vanuatu
Wallis and Futuna
Western Samoa
Diff90 Diff00Level4Type
Level5Type
NumUnits
RefYearFirst
RefYearLast
P90E ('000)
P95E ('000)
P00E ('000)
UN_P90 ('000)
UN_P95 ('000)
UN_P00 ('000)
9 1979 1991 9 10 11 9 9 10 1.71 -13.96
6 1989 1999 124 143 165 149 172 197 17.05 16.37
2 1996 14 14 14 14 14 14 2.11 -3.45
3 1991 2001 160 167 175 160 158 159 0.10 -10.22

CountryEnglish
Argentina
Diff90 Diff00Level4Type
Level5Type
NumUnits
RefYearFirst
RefYearLast
P90E ('000)
P95E ('000)
P00E ('000)
UN_P90 ('000)
UN_P95 ('000)
UN_P00 ('000)
499 1991 2001 32,509 34,153 35,993 32,527 34,768 37,032 0.06 2.81

CountryEnglish
Bolivia
Brazil
Diff90 Diff00Level4Type
Level5Type
NumUnits
RefYearFirst
RefYearLast
P90E ('000)
P95E ('000)
P00E ('000)
UN_P90 ('000)
UN_P95 ('000)
UN_P00 ('000)
100 1992 2001 5,993 6,837 7,845 6,573 7,414 8,329 8.82 5.82
5508 1991 2000 144,673 156,165 169,797 147,957 159,481 170,406 2.22 0.36

CountryEnglish
Chile
Colombia
Diff90 Diff00Level4Type
Level5Type
NumUnits
RefYearFirst
RefYearLast
P90E ('000)
P95E ('000)
P00E ('000)
UN_P90 ('000)
UN_P95 ('000)
UN_P00 ('000)
292 1992 2002 13,045 13,831 14,724 13,100 14,210 15,211 0.42 3.20
1069 1985 1993 31,788 34,060 36,533 34,970 38,542 42,105 9.10 13.23

CountryEnglish
Ecuador
Falkland Islands
French Guiana
Diff90 Diff00Level4Type
Level5Type
NumUnits
RefYearFirst
RefYearLast
P90E ('000)
P95E ('000)
P00E ('000)
UN_P90 ('000)
UN_P95 ('000)
UN_P00 ('000)
956 9,409 10,472 11,680 10,264 11,460 12,646 8.33 7.64
2 1990 2001 2 2 2 2 2 2 -6.55 -21.55
21 1990 1999 106 123 143 116 138 165 8.73 13.08

CountryEnglish
Guyana
Peru
Diff90 Diff00Level4Type
Level5Type
NumUnits
RefYearFirst
RefYearLast
P90E ('000)
P95E ('000)
P00E ('000)
UN_P90 ('000)
UN_P95 ('000)
UN_P00 ('000)
10 1991 754 771 788 731 743 761 -3.20 -3.60
1895 1993 2000 19,424 22,348 25,747 21,569 23,532 25,662 9.95 -0.33

CountryEnglish
Paraguay
Suriname
Diff90 Diff00Level4Type
Level5Type
NumUnits
RefYearFirst
RefYearLast
P90E ('000)
P95E ('000)
P00E ('000)
UN_P90 ('000)
UN_P95 ('000)
UN_P00 ('000)
236 1992 2002 3,998 4,413 4,936 4,219 4,828 5,496 5.23 10.18
10 1980 1996 394 418 445 402 409 417 1.97 -6.79
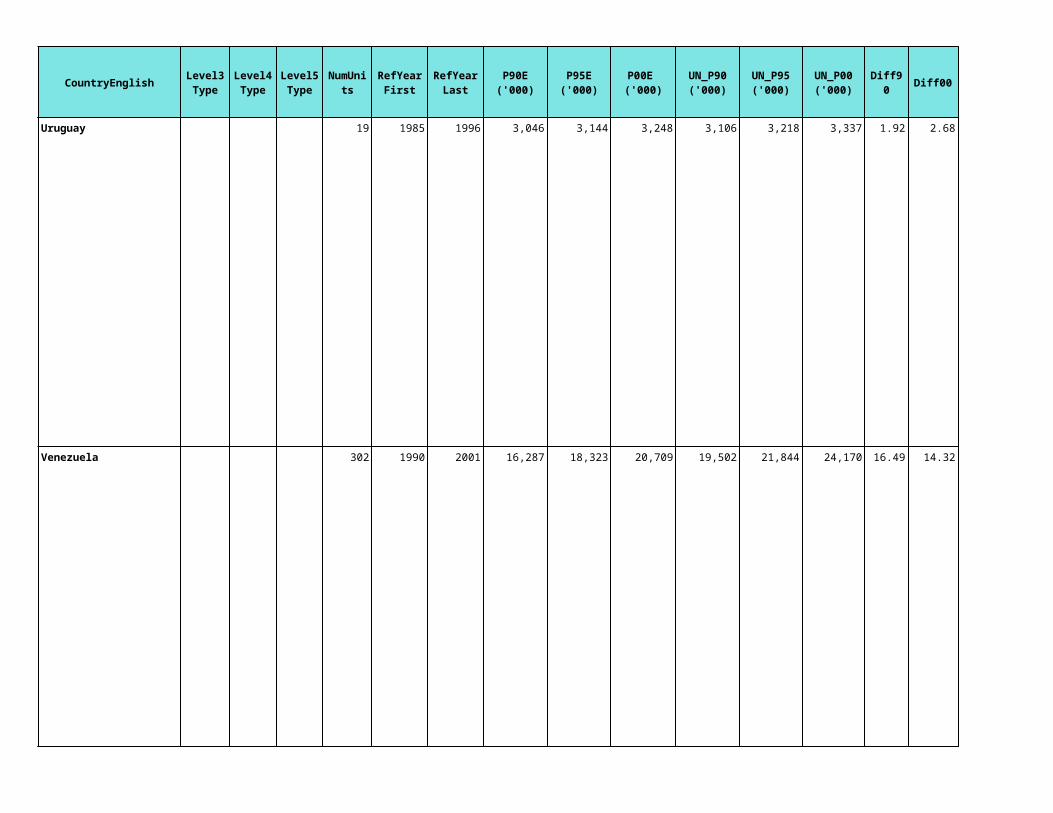
CountryEnglish
Uruguay
Venezuela
Diff90 Diff00Level4Type
Level5Type
NumUnits
RefYearFirst
RefYearLast
P90E ('000)
P95E ('000)
P00E ('000)
UN_P90 ('000)
UN_P95 ('000)
UN_P00 ('000)
19 1985 1996 3,046 3,144 3,248 3,106 3,218 3,337 1.92 2.68
302 1990 2001 16,287 18,323 20,709 19,502 21,844 24,170 16.49 14.32
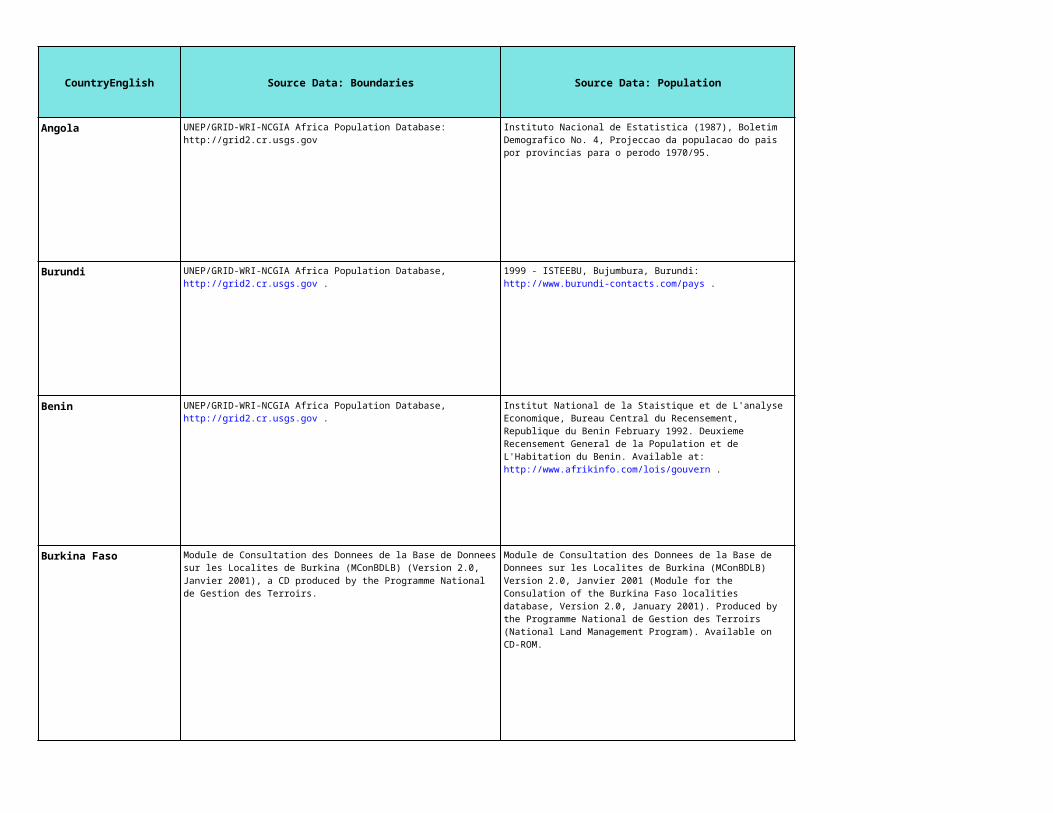
CountryEnglish
Angola
Burundi
Benin
Burkina Faso
Source Data: Boundaries Source Data: Population Edits and Notes: Spatial
UNEP/GRID-WRI-NCGIA Africa Population Database: http://grid2.cr.usgs.gov
Instituto Nacional de Estatistica (1987), Boletim Demografico No. 4, Projeccao da populacao do pais por provincias para o perodo 1970/95.
UNEP/GRID-WRI-NCGIA Africa Population Database, http://grid2.cr.usgs.gov .
1999 - ISTEEBU, Bujumbura, Burundi: http://www.burundi-contacts.com/pays .
UNEP/GRID-WRI-NCGIA Africa Population Database, http://grid2.cr.usgs.gov .
Institut National de la Staistique et de L'analyse Economique, Bureau Central du Recensement, Republique du Benin February 1992. Deuxieme Recensement General de la Population et de L'Habitation du Benin. Available at: http://www.afrikinfo.com/lois/gouvern .
The Athieme District (administrative 2 level , in the Mono Province (administrative 1 level), was split to form Athieme District and Lokossa District. The division was based on a map found at: http://www.uni-hohenheim.de/~atlas308/c_benin/projects/c1_1/html/english/bframe_en_c1_1b.htm . Population was estimated for the two newly created units based on their relative distributions in 1992.
Module de Consultation des Donnees de la Base de Donnees sur les Localites de Burkina (MConBDLB) (Version 2.0, Janvier 2001), a CD produced by the Programme National de Gestion des Terroirs.
Module de Consultation des Donnees de la Base de Donnees sur les Localites de Burkina (MConBDLB) Version 2.0, Janvier 2001 (Module for the Consulation of the Burkina Faso localities database, Version 2.0, January 2001). Produced by the Programme National de Gestion des Terroirs (National Land Management Program). Available on CD-ROM.
The spatial boundaries were aggregated from 353 to 20 units for the calculation of a 1990-1996 population growth rate.

CountryEnglish
Botswana
Central African Republic
Source Data: Boundaries Source Data: Population Edits and Notes: Spatial
1988 census figures, National Statistical Office, digital file.
UNEP/GRID-WRI-NCGIA Africa Population Database, http://grid2.cr.usgs.gov .
Central Statistics Office, Republic of Botswana: 2001 Population and Housing Census, http://www.cso.gov.bw/cso/census_2k.html
Botswana Census of 1991, Digital file obtained through the Software Development Project, UN Statistics Division and Botswana Village Populations 1971, 81 and 91, Digital file obtained through the UNSD POPMAP project (contains district populations).
(1) Tuli district was merged with 3 districts: Palapye, Machaneng, and Bobonong. The population 1990 data for Tuli was split equally 3 ways and added to each district's population 1990 total. P00 data for Tuli region is assumed to be part of those three districts. (2) 2000 data for Kgalagadi South was split and distributed to 2 districts, Tshabong and Gemsbok, in proportion to their population 1990 estimates. 2000 data for Kgalagadi North was assigned to Hukunsti district. (3) The population 2000 figure for South East district was created by adding 2000 data for South East and Lobatse (4) The population 2000 data for Serowe and Palapye districts were created by splitting the 2000 Serowe/Palapye figure and distributing it according to the population 1990 proportions. (5) Ngwaketse South and Ngwaketse Central were merged, and the population 1990 figures for each one (exact same number) were assumed to be a repeat, so only one set of data was assigned to the merged polygon (Ngwaketse South). 2000 data for Southern district was then split in proportion to the population 1990 data, with South and Central assumed to be one data entry, and assigned to Ngwaketse North and South. Then, 2000 data for Ngwaketse West was added to Ngwaketse North. (6) 2000 data for Delta district was added to Ngamiland East district. (7) 2000 data for Francistown and North East was added and assigned to Masungu district. (8) 2000 data for Central Boteti was assigned to Machaneng (9) 2000 data for Orapa was assigned to Lethlakane (10) Kweneng South district was renamed Kweneng West, and the population 2000 total was found by adding Kweneng West and Jwaneng (11) Kweneng North district was renamed Kweneng East. (12) 2000 data for Central Bobonong and Selibe Phikwe was added and assigned to Bobonong district. (13) "Central" was deleted from any related district names (14) 2000 data for Sowa district and CKGR district was not assigned to any districts due to lack of information on location (about 3,500 people).
UNEP/GRID-WRI-NCGIA Africa Population Database, http://grid2.cr.usgs.gov .

CountryEnglish
Ivory Coast
Source Data: Boundaries Source Data: Population Edits and Notes: Spatial
UNEP/GRID-WRI-NCGIA Africa Population Database, http://grid2.cr.usgs.gov .
1998 Population Census: Premiers resultats définitifs du RGPH-98 / Institut national de la statistique. Recensement général de la population et de l'habitat 1998. Abidjan--République de Côte d'Ivoire, Institut National de la Statistique, Bureau Technique du Recensement. The 1990 population figure is based on the OECD/Club du Sahel West Africa Long Term Perspective Study (WALTPS), and was estimated by Benoit Ninnin, based on these sources: Etude d'une Image - Long Terme de l'Afrique; Atlas Jeune Afrique; Republique de la Cote d'Ivoire: Ministere du Plan et de la Comptabilite Nationale: Recensement general de la population et de l'habitat, 1988: a: Resultats provisoires par localite. b: Exploitation et comparaison 1965/1975/1988; Seminaire national de presentation des resultats du RGPH, 1988.
The 1998 census included 8 new department (administative 2 level) units-- all 8 were previously considered sous-prefectures (administrative 3 level). These are: Alepe, Dabou, Jacqueville, Tiebissou, Bocanda, Adiake, Grand-Bassam, and Toulepleu. New spatial data were not available to match these changes therefore the population of these units were redistributed into their respective parent department units (administrative level 2).

CountryEnglish
Cameroon
Source Data: Boundaries Source Data: Population Edits and Notes: Spatial
UNEP/GRID-WRI-NCGIA Africa Population Database, http://grid2.cr.usgs.gov .
The 1990 population figure is based on the OECD/Club du Sahel West Africa Long Term Perspective Study (WALTPS), and was estimated by Benoit Ninnin, based on these sources Republique du Cameroun: Demo 87: 7 millions et demi en 1976, 10 millions et demi en 1987; and Republique du Cameroun: Demo 87: Vol. III, Tome1et Analyse preliminaire: Evaluation des donnees: repartition par sexe et par age de la population.

CountryEnglish
Congo
Congo, Democratic Republic
Source Data: Boundaries Source Data: Population Edits and Notes: Spatial
GIS database produced by the Universitä Louvain, Belgium and obtained from the Department of Geography, University of Maryland.
Republique du Zaire (1984), Combien Sommes- Nous, Resultats Provisoires, Institut National de la Statistique, Kinshasa and Republique du Zaire (undated), Zaire Recensement Scientifique de la Population 1984, Totaux Definitifs, Institut National de la Statistique, Kinshasa [ contains pop figures down to cite/col level ]
UNEP/GRID-WRI-NCGIA Africa Population Database: http://grid2.cr.usgs.gov . Boundaries digitized from 1:1m IGN map.
The population figures for 1990 were based on the OECD/Club du Sahel West Africa Long Term Perspective Study (WALTPS), estimated by Benoit Ninnin from these sources: Republique Populaire du Congo, 1987, Annuaire Statistque, Ministere du Plan, Brazzaville [1974 data]; and Republique Populaire du Congo, 1987, Recensement General de la Population et de l'Habitat de 1984, Vol. 3: Resultats Definitifs, Tome I: Ensemble du Pays, Direction des Statistiques Demographiques et Sociales, Brazzaville.

CountryEnglish
Comoros
Cape Verde
Djibouti
Source Data: Boundaries Source Data: Population Edits and Notes: Spatial
UNEP/GRID-WRI-NCGIA Africa Population Database, http://grid2.cr.usgs.gov .
Comoros 1996 population estimates are from Geohive http://www.geohive.com/ . Geohive cites the original source as: "L'Évaluation de l'éducation pour tous à l'an 2000: Rapport des pays, Forum mondial sur l'éducation, Unesco."
Mayotte is included in Comoros. Mayotte 1997 (rather than 1996) and 1991 census data are also from Geohive. Geohive cites the original source as: Le SPLAF http://splaf.free.fr/976des.html .
UNEP/GRID-WRI-NCGIA Africa Population Database, http://grid2.cr.usgs.gov .
Instituto Nacional de Estatistica, Cabo Verde: Censo 1990 e Censo 2000, Outros Años Perspectivas Demográficas de Cabo Verde Horizonte 2020, http://www.ine.cv/estatisticas_cv_demografia.htm .
UNEP/GRID-WRI-NCGIA Africa Population Database, http://grid2.cr.usgs.gov .
Estimates of 1979 population were found in Republique de Djibouti (1989), Annuaire Statistique de Djibouti, Direction Nationale de la Staistique; and Estimates of 1998 population were from Trésor de la Langue Française au Québec (TLFQ), http://www.tlfq.ulaval.ca/axl/afrique/djibouti.htm .

CountryEnglish
Algeria
Egypt
Source Data: Boundaries Source Data: Population Edits and Notes: Spatial
Boundaries matched to Digital Chart of the World.
UNEP/GRID-WRI-NCGIA Africa Population Database, http://grid2.cr.usgs.gov .
1987 and 1998 Census data from Statistiques Algérie, http://www.ons.dz/ .
Omar Mohamed Hamza (Executive Manager, GIS Program), Cabinet Information and Decision Support Center (IDSC) of the Central Agency for Public Mobilaztion and Statistics (CAMPAS). Additional data support provided by Opinion Research Corporation (ORC) Macro International.
1996 Egyptian Census. Estimates of population in 1990 were based on the 1986 census, digital file, POPMAP application produced by Egyptian Statistical Office in collaboration with the UN Software Development Project (UNSD/DESIPA); Arab Republic of Egypt (1991), Statistical Yearbook of Egypt 1991, Central Agency for Mobilization and Statistics, Cairo; and Arab Republic of Egypt (1993), Statistical Yearbook of Egypt 1993, Central Agency for Mobilization and Statistics, Cairo.

CountryEnglish
Eritrea
Ethiopia
Gabon
Source Data: Boundaries Source Data: Population Edits and Notes: Spatial
GIS coverage produced by USGS/EDC USAID/FEWS and obtained through the International Livestock Research Institute. UNEP/GRID-WRI-NCGIA Africa Population Database: http://grid2.cr.usgs.gov.
Estimates of population in 1990 were based on the Census of Ethiopia 1984, Digital File obtained from EROS Data Center through the Int'l Livestock Research Institute; contains population figures for 3rd level administrative units (2nd level for Eritrea); and Central Statistical Authority (1986), Eritrea Statistical Abstract 1986, Addis Abeba. Contains population by first and second sub-national levels (Region and Awraja) for 1986.
Boundary data were provided by Patrick Gordon, Mine Information Advisor, UNDP Mine Action Advisory Team.
1994 data downloaded from the United Nations Development Programme Emergencies Unit for Ethiopia (UNDP-EUE) databases: http://www.sas.upenn.edu/African_Studies/eue_web/pop_des.htm .
“Komesha Wereda” was manually split from “Asosa Wereda” based on the map from: http://www.telecom.net.et/~undp-eue/reports/Benish96.jpg .
UNEP/GRID-WRI-NCGIA Africa Population Database, http://grid2.cr.usgs.gov .
(1) Republique Gabonaise (1980), Annuaire Statistique du Gabon 1976-80, Direction Generale de la Statistique et des Etudes Economiques, Ministere de la Planification de l'Economie et de l'Amenagement du Territoire, Libreville. (2) Republique Gabonaise (1990), Annuaire Statistique du Gabon 1990, Direction Generale de la Statistique et des Etudes Economiques, Ministere de la Planification de l'Economie et de l'Amenagement du Territoire, Libreville. (3) Republique Gabonaise (1993), Recensement Generale de la Population et de l'Habitat 1993, Resultats Preliminaires, Direction Generale de la Statistique et des Etudes Economiques, Ministere de la Planification de l'Economie et de l'Amenagement du Territoire, Libreville.
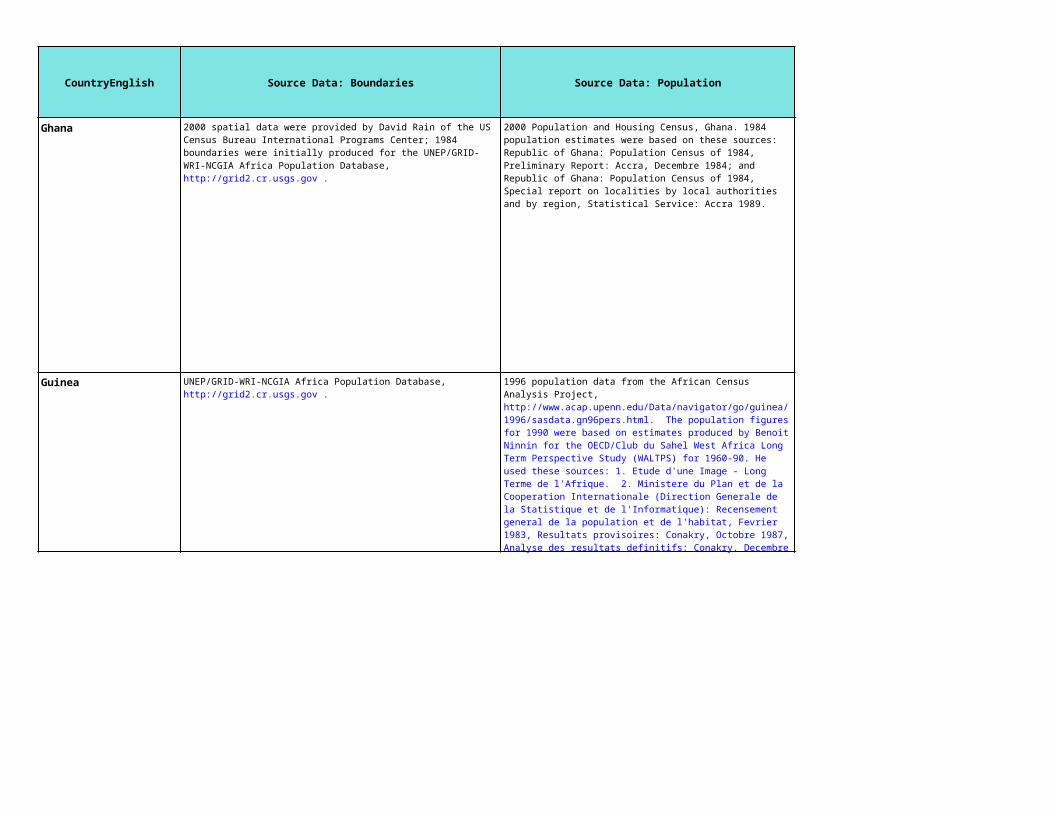
CountryEnglish
Ghana
Guinea
Source Data: Boundaries Source Data: Population Edits and Notes: Spatial
2000 spatial data were provided by David Rain of the US Census Bureau International Programs Center; 1984 boundaries were initially produced for the UNEP/GRID-WRI-NCGIA Africa Population Database, http://grid2.cr.usgs.gov .
2000 Population and Housing Census, Ghana. 1984 population estimates were based on these sources: Republic of Ghana: Population Census of 1984, Preliminary Report: Accra, Decembre 1984; and Republic of Ghana: Population Census of 1984, Special report on localities by local authorities and by region, Statistical Service: Accra 1989.
UNEP/GRID-WRI-NCGIA Africa Population Database, http://grid2.cr.usgs.gov .
1996 population data from the African Census Analysis Project, http://www.acap.upenn.edu/Data/navigator/go/guinea/1996/sasdata.gn96pers.html. The population figures for 1990 were based on estimates produced by Benoit Ninnin for the OECD/Club du Sahel West Africa Long Term Perspective Study (WALTPS) for 1960-90. He used these sources: 1. Etude d'une Image - Long Terme de l'Afrique. 2. Ministere du Plan et de la Cooperation Internationale (Direction Generale de la Statistique et de l'Informatique): Recensement general de la population et de l'habitat, Fevrier 1983, Resultats provisoires: Conakry, Octobre 1987, Analyse des resultats definitifs: Conakry, Decembre 1989. 3. enard J.L.: Projet de developpement urbain de Conakry, Avril 1988
An extra settlement unit in the population data, named Conakry, was combined with the parent unit named Dubreka.
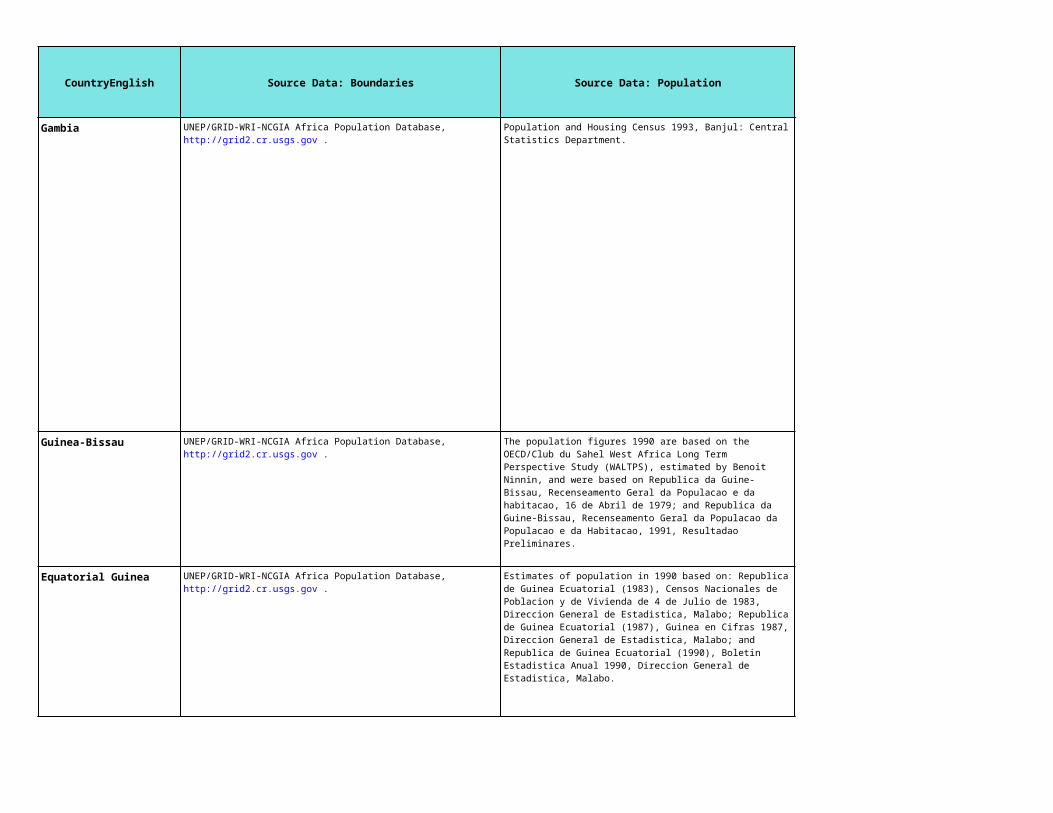
CountryEnglish
Gambia
Guinea-Bissau
Equatorial Guinea
Source Data: Boundaries Source Data: Population Edits and Notes: Spatial
UNEP/GRID-WRI-NCGIA Africa Population Database, http://grid2.cr.usgs.gov .
Population and Housing Census 1993, Banjul: Central Statistics Department.
UNEP/GRID-WRI-NCGIA Africa Population Database, http://grid2.cr.usgs.gov .
The population figures 1990 are based on the OECD/Club du Sahel West Africa Long Term Perspective Study (WALTPS), estimated by Benoit Ninnin, and were based on Republica da Guine-Bissau, Recenseamento Geral da Populacao e da habitacao, 16 de Abril de 1979; and Republica da Guine-Bissau, Recenseamento Geral da Populacao da Populacao e da Habitacao, 1991, Resultadao Preliminares.
UNEP/GRID-WRI-NCGIA Africa Population Database, http://grid2.cr.usgs.gov .
Estimates of population in 1990 based on: Republica de Guinea Ecuatorial (1983), Censos Nacionales de Poblacion y de Vivienda de 4 de Julio de 1983, Direccion General de Estadistica, Malabo; Republica de Guinea Ecuatorial (1987), Guinea en Cifras 1987, Direccion General de Estadistica, Malabo; and Republica de Guinea Ecuatorial (1990), Boletin Estadistica Anual 1990, Direccion General de Estadistica, Malabo.

CountryEnglish
Kenya
Liberia
Source Data: Boundaries Source Data: Population Edits and Notes: Spatial
Kenyan Central Bureau of Statistics (CBS), http://www.cbs.go.ke/ . 1999 Population Census, Kenyan Central Bureau of Statistics (CBS); see http://www.cbs.go.ke/; and Kenya Government (undated), Census of Kenya 1989, Digital File
The Ilemi Triangle belongs to Sudan by treaty but is administered by Kenya. According to a recent paper by Collins http://www.history.ucsb.edu/faculty/Collinsmaterial/books/The%20Ilemi%20Triangle.pdf, SPLM/SPLA, the rebel group that controls Southern Sudan, probably quietly ceded the territory to Kenya.
UNEP/GRID-WRI-NCGIA Africa Population Database: http://grid2.cr.usgs.gov.
The 1990 population figures are based on the OECD/Club du Sahel West Africa Long Term Perspective Study (WALTPS), and were estimated by Benoit Ninnin, using this source: Republic of Liberia: Ministry of Planning and Economic Affairs, 1983, Census of Population and Housing: Summary Population Results: Monrovia 1987.

CountryEnglish
Libyan Arab Jamahiriya
Lesotho
Morocco (includes Western Sahara)
Source Data: Boundaries Source Data: Population Edits and Notes: Spatial
UNEP/GRID-WRI-NCGIA Africa Population Database: http://grid2.cr.usgs.gov.
Estimates of 1990 population were based on 1984-based census results reported in Europa (1992), Africa - South of the Sahara - 1993, 22nd edition, Europa Publications, London, and Government of Libya (1973), Population census preliminary results, Ministry of Planning Census and Statistical Department.
Boundaries were digitized from the CIA map "Libya" dated 5-93. See http://www.lib.utexas.edu/Libs/PCL/Map_collection/africa/Libya.GIF. Projection information was included on the map, but the scale was not. Due to the small cartographic scale of the map, however, the accuracy of the boundaries is very low. This may not matter much in the uninhabited desert areas, but may lead to errors in the urbanized coastal regions - particularly around Tripoli.
These boundaries were initially produced for the UNEP/GRID-WRI-NCGIA Africa Population Database (see the GRID-Sioux Falls Web site at http://grid2.cr.usgs.gov).
Lesotho Census, 1996 data downloaded from www.acap.upenn.edu; and Kingdom of Lesotho (1987), Population census 1986, Preliminary results, Bureau of Statistics, Maseru.
UNEP/GRID-WRI-NCGIA Africa Population Database: http://grid2.cr.usgs.gov.
1990 population estimates are based on census figures and estimates for 1982 to 1990 available from a digital file produced by the National Statistical Office (from the Republique du Maroc, Recensement General de la Population), obtained through the UN Statistics Division's Software Development Project. Censuses were undertaken in 1982 and 1994.

CountryEnglish
Madagascar
Mali
Source Data: Boundaries Source Data: Population Edits and Notes: Spatial
USGS/EDC/USAID/FEWS project
Level 3 administrative boundaries were obtained via a database produced by the National Statistical Office and the Institut National de la Statistique et de la Recherche Economique, Tananarive, in collaboration with the UN Statistics Division's Software Development Project http://www.un.org/Depts/unsd/softproj/index.htm.
RGPH (Recensement Général de la Population et de l'Habitat) 1993, Institut National de la Statistique, Madagascar; 2001 level 2 population estimates were from Institut National de la Statistique at http://www.cite.mg/instat/pdf in the file estim-pop.pdf.
Recensement General de la Population et de L'Habitat (Avril 1998) -- Resultats Definitifs, Tome 4: Repertoire de Village
Spatial boundaries were aggregated to match the population data as follows: (1) Oussoubidiagna and Goundara were aggregated into one unit called Oussoubidiagna (2) the sub-units of Menaka --Tidarmene, Inekar, Anderaboukane, and Menaka-- were aggregated into one unit called Menaka (3) the sub-units of Kidal --Tinkar, Tessalit, Aquel-Hor, Annefis, Essouk, Kidal, Bouressa, Abeilara, Abiyou, Tin-Zaouatene, Tin-Essako, and Tin-Esserine-- were aggregated into one unit called Kidal.

CountryEnglish
Mozambique
Source Data: Boundaries Source Data: Population Edits and Notes: Spatial
International Food Policy Research Institute Instituto Nacional de Estatística Mozambique, Resultados Definitivos do Recenseamento Geral da População e Habitação (1997), http://www.ine.gov.mz/

CountryEnglish
Mauritania
Mauritius
Source Data: Boundaries Source Data: Population Edits and Notes: Spatial
EDC Africa Data Dissemination Service from http://edcw2ks21.cr.usgs.gov/adds/
2000 census data from Ministere des Affaires Econommiques et du Dedeveloppement Office National de la Statistique Bureau Central du Recensement, Resultats Provisoires du Troisieme Recensement General de la Population et de L'Habitat -2000; and 1988 census data from Bureau du recensement: Resultats prioritaires du Recensement de la population et de l'habitat, 1988, Vol. I: Nouakchott 1992.
Spatial data for the administrative unit (Wilaya) of Nouakchott was added via geo-rectification and drawing with shapefile provided by Piet Buys at the World Bank. The units added include the Moughataa: Toujounine, Ksar, Dar Naim, Riadh, El Mina, Sebka, Tevaragh, Zeina, Arafat, and Teyarett.
For the Main Island, The Central Statistics Office, LIC Centre, 1, John Kennedy Street, Port Louis, Mauritius, available from http://ncb.intnet.mu/cso/mifig/popu.htm. For the Island of Rodrigues, Digital Chart of the World (DCW).
Mauritius in Figures 2001, population data 2000, the Central Statistics Office, LIC Centre, 1, John Kennedy Street, Port Louis, Mauritius. http://ncb.intnet.mu/cso/mifig/popu.htm
Spatial and population data for the main Island of Mauritius is for administrative level 3. However, due to lack of spatial data for other islands, the same level of detail could not be employed for the surrounding areas. The Island of Rodrigues, however, was added at administrative level 2. This was done via coastline data (built in to polygons) extracted from the NOAA coastline extractor (http://rimmer.ngdc.noaa.gov/coast/getcoast.html). Arbitrary administrative IDs were assigned (unique per island in the group surrounding Rodrigues) and the population was assigned to the main island only.
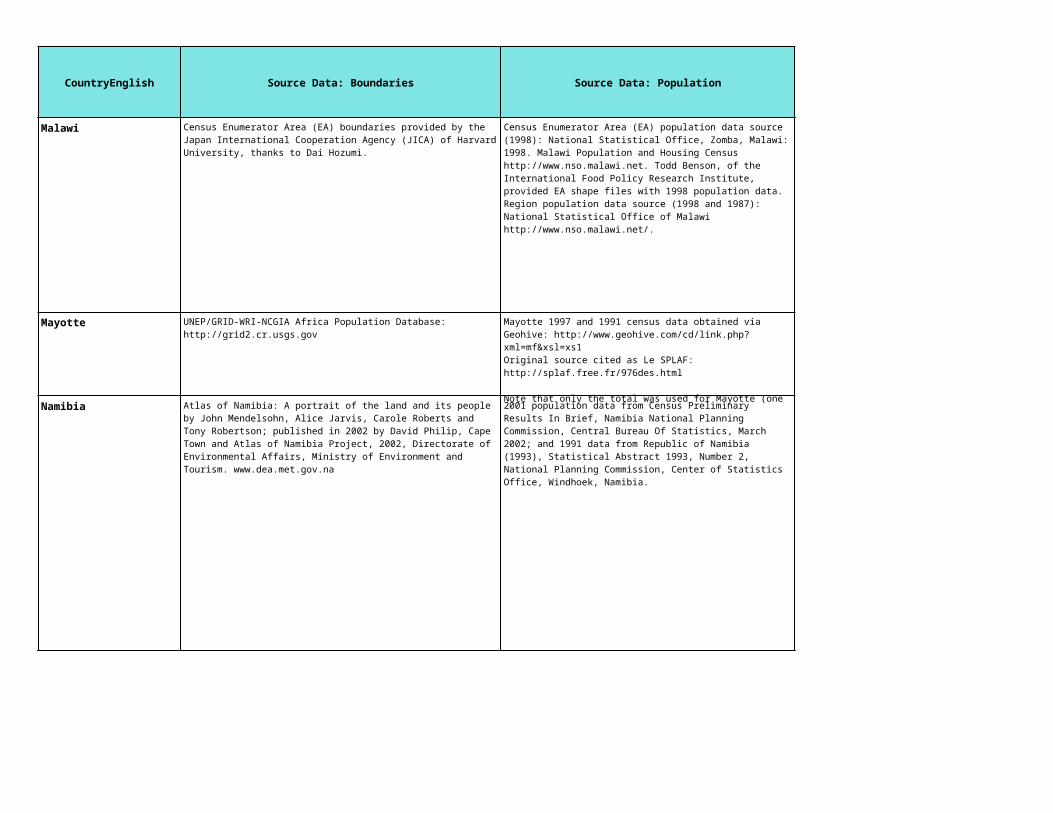
CountryEnglish
Malawi
Mayotte
Namibia
Source Data: Boundaries Source Data: Population Edits and Notes: Spatial
Walvis Bay urban boundary amended as per new spatial data.
Census Enumerator Area (EA) boundaries provided by the Japan International Cooperation Agency (JICA) of Harvard University, thanks to Dai Hozumi.
Census Enumerator Area (EA) population data source (1998): National Statistical Office, Zomba, Malawi: 1998. Malawi Population and Housing Census http://www.nso.malawi.net. Todd Benson, of the International Food Policy Research Institute, provided EA shape files with 1998 population data. Region population data source (1998 and 1987): National Statistical Office of Malawi http://www.nso.malawi.net/.
A polygon was digitized from the eastern shore of Lake Malawi to the northern part of the country in order to avoid loss of islands and prevent the aggregation of population to the lake.
UNEP/GRID-WRI-NCGIA Africa Population Database: http://grid2.cr.usgs.gov
Mayotte 1997 and 1991 census data obtained via Geohive: http://www.geohive.com/cd/link.php?xml=mf&xsl=xs1Original source cited as Le SPLAF: http://splaf.free.fr/976des.html
Note that only the total was used for Mayotte (one island, no subdivisions).
Atlas of Namibia: A portrait of the land and its people by John Mendelsohn, Alice Jarvis, Carole Roberts and Tony Robertson; published in 2002 by David Philip, Cape Town and Atlas of Namibia Project, 2002, Directorate of Environmental Affairs, Ministry of Environment and Tourism. www.dea.met.gov.na
2001 population data from Census Preliminary Results In Brief, Namibia National Planning Commission, Central Bureau Of Statistics, March 2002; and 1991 data from Republic of Namibia (1993), Statistical Abstract 1993, Number 2, National Planning Commission, Center of Statistics Office, Windhoek, Namibia.

CountryEnglish
Niger
Nigeria
Reunion
Source Data: Boundaries Source Data: Population Edits and Notes: Spatial
Digital Chart of the World.
Famine Early Warning Systems Network (FEWS NET) in partnership with the United States Agency for International Development (USAID), 1996. Data retrieved via the Africa Data Dissemination Service (ADDS): http://edcw2ks21.cr.usgs.gov/adds/geolist.php.
2001 Population: Préliminaire du Recensement Général de la Population et de l’Habitat, 2001 - Bureau Central du Resensement, Ministère du Plan Préparer de Stone Environmental, Inc. 20 Avril 2002. Online linkage: https://customer.stone-env.com/niger/Table-canton-sum-rev.pdf
1998 Population: Atlas Préliminaire de la Pauvreté/Vulbérabilte, République du Niger CD. Préparé pour le Gouvernement du Niger, Secrétariat Permanent du DSRP. Stone Environmental Inc.
UNEP/GRID-WRI-NCGIA Africa Population Database: http://grid2.cr.usgs.gov
The population figures for 1991 were based on estimates produced by Benoit Ninnin for the OECD/Club du Sahel West Africa Long Term Perspective Study (WALTPS) for 1960-90. He used these sources for 1990 population estimates: Federal Bureau of Census Nigeria (1991): Census of population, population by sex by state and local government: Lagos, 1992; and Federal Office of Statistics, Lagos (1991):Provisional Population Figures by Local Government Areas.
L'Institut national de la statistique et des études économiques (INSEE): Recensement March 1999 (March 1999 Census) www.recensement.insee.fr for 1990 and 1999 population estimates.

CountryEnglish
Rwanda
Sudan
Source Data: Boundaries Source Data: Population Edits and Notes: Spatial
The boundary data set was produced by the Department of Geography at Michigan State University (Michigan State University (undated), Rwanda District Level Administrative Unit GIS Coverage Department of Geography, East Lansing.) for the UNEP/GRID-WRI-NCGIA Africa Population Database: http://grid2.cr.usgs.gov.
1990 population estimates are based on the 1991 census and earlier census information. Republique Rwandaise (1991), Recensement General de la Population et de l'Habitat Au 15 Aout 1991, Resultats Provisoires, Service National de Recensement, Kigali.
UNEP/GRID-WRI-NCGIA Africa Population Database: http://grid2.cr.usgs.gov
1. Central Bureau of Statistics (1993), Population census of Sudan 1993, Census Office, Khartoum. Incomplete due to partial enumeration in Southern Sudan. Boundaries seemed to have changed somewhat between '83 and '93, but no map was available. 2. Population Studies Center (1983), Population of Sudan and its regions, Project Document 1, 1983 census: Total populations by region, province and district, University of Gezira jointly with Department of Statistics, Census Office. 4. Nelson, H.D. (1982), Sudan - A country study, Area Handbook Series, Federal Research Division of the Library of Congress. 5. Ertur, O.S. and W.J. House (1994), Population and human resources development in the Sudan, Compiled in cooperation with UNFPA and ILO, Iowa State University Press, Ames.
Boundaries changed significantly between the three censuses, so data had to be aggregated or split to match the available boundary data set. The boundaries match the 1983 census although some of the unit names are different in the coverage and the census publications. The Ilemi Triangle , in Kapoeta [admin3 unit] belongs to Sudan by treaty but is administered by Kenya. According to a recent paper by Collins http://www.history.ucsb.edu/faculty/Collinsmaterial/books/The%20Ilemi%20Triangle.pdf), SPLM/SPLA, the rebel group that controls Southern Sudan, probably quietly ceded the territory to Kenya.

CountryEnglish
Senegal
St. Helena
Sierra Leone
Somalia
Source Data: Boundaries Source Data: Population Edits and Notes: Spatial
Landscan, thanks to Jerry Dobson and Ed Bright.
Produced by USGS/EDC USAID/FEWS for the UNEP/GRID-WRI-NCGIA Africa Population Database: http://grid2.cr.usgs.gov
The 1990 population figures are based on the OECD/Club du Sahel West Africa Long Term Perspective Study (WALTPS), and were estimated by Benoit Ninnin, using these sources:
1. Etude d'une Image—Long Terme de l'Afrique. 2. Direction de la Provision et de la Statistique: les principaux resultats provisoires du recensement de la Population et de l'Habitat du Senegal 1985: Dakar, 1989. 3. CERPOD: Migration et urbanisation au Senegal, Ba A. et I. Sarr: Rapport de recherche. 4. Lopez-Escartin N.: Donnees de base sur la population, Senegal: CEPED, No. 7, Paris, Aout 1991. 5. Direction de la provision et de la statistique: Repertoire des villages, dix volumes, Transfert editions.
Saint Helena, The Official Government Web site www.sainthelena.gov.sh
Prepared for the Government of Sierra Leone Ministry of Agriculture, Forestry and Marine Resources, funded by the European Union through the National Authorising Office, by Jane Barry and Robin Schofield. See also: http://www.aidconnections.org/sierraleone/backup/datasets/AFRICA/West%20Africa/Sierra%20Leone/Workspaces/
Prepared for the Government of Sierra Leone Ministry of Agriculture, Forestry and Marine Resources, funded by the European Union through the National Authorising Office, by Jane Barry and Robin Schofield. See also: http://www.aidconnections.org/sierraleone/backup/datasets/AFRICA/West%20Africa/Sierra%20Leone/Workspaces/
UNEP/GRID-WRI-NCGIA Africa Population Database: http://grid2.cr.usgs.gov
World Health Organization population data provided by Charles Rethman Head of the Information Food Security Analysis Unit of Somalia, FSA

CountryEnglish
Sao Tome and Principe
Swaziland
Seychelles
Source Data: Boundaries Source Data: Population Edits and Notes: Spatial
UNEP/GRID-WRI-NCGIA Africa Population Database: http://grid2.cr.usgs.gov
Republica Democratica des Sao Tome e Principe (1978), Censo de 1970, Resultados de 1970
UNEP/GRID-WRI-NCGIA Africa Population Database: http://grid2.cr.usgs.gov
Common Country Assessment: Swaziland 1997, Provisional Results of the 1997 Population and Housing Census http://www.ecs.co.sz/cca/cca_6.htm and Swaziland Government (1986), 1986 Swaziland population census, Vol. 1, Statistical Tables, Central Statistical Office, Mbabane.
UNEP/GRID-WRI-NCGIA Africa Population Database: http://grid2.cr.usgs.gov
1990 population estimate based on 1973 and 1988 United Nations Demographic Yearbooks

CountryEnglish
Chad
Togo
Source Data: Boundaries Source Data: Population Edits and Notes: Spatial
Produce by the USGS/EDC USAID/FEWS for UNEP/GRID-WRI-NCGIA Africa Population Database: http://grid2.cr.usgs.gov. (USGS/EDC USAID/FEWS)
Population estimates are based on the OECD/Club du Sahel West Africa Long Term Perspective Study (WALTPS), by Benoit Ninnin. Data for 1990 are based on Lopez-Escartin N.: Donnees de base sur la population, Tchad: CEPED, No. 5, Paris, Aout 1991.
UNEP/GRID-WRI-NCGIA Africa Population Database: http://grid2.cr.usgs.gov
The population figures for 1990 were based on estimates produced by Benoit Ninnin for the OECD/Club du Sahel West Africa Long Term Perspective Study (WALTPS) for 1960-90. He used these sources for 1990 population estimates: 1. Etude d'une Image - Long Terme de l'Afrique. 2. Lopez-Escartin N.: Donnees de base sur la population, Togo: CEPED, No. 4, Paris, Aout 1991.
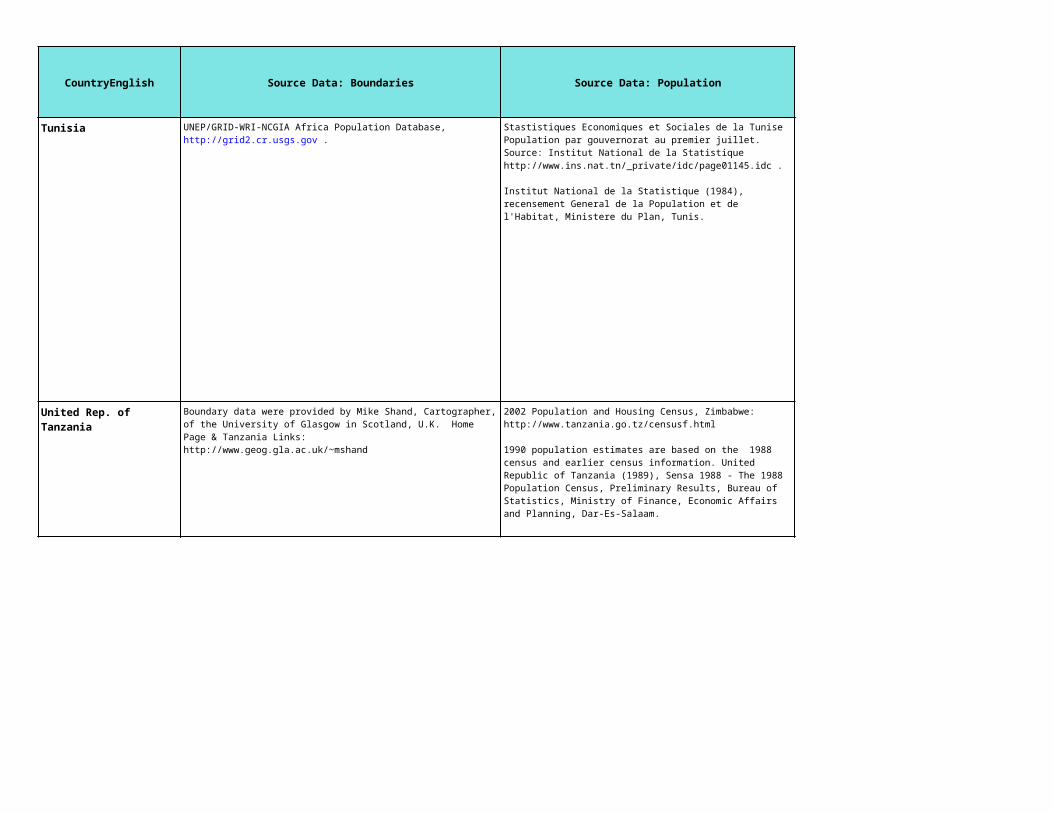
CountryEnglish
Tunisia
United Rep. of Tanzania
Source Data: Boundaries Source Data: Population Edits and Notes: Spatial
UNEP/GRID-WRI-NCGIA Africa Population Database, http://grid2.cr.usgs.gov .
Stastistiques Economiques et Sociales de la Tunise Population par gouvernorat au premier juillet. Source: Institut National de la Statistique http://www.ins.nat.tn/_private/idc/page01145.idc .
Institut National de la Statistique (1984), recensement General de la Population et de l'Habitat, Ministere du Plan, Tunis.
The administrative unit Ariana was split in to 2 units 'Ariana' and 'Manouba' in 2000. As no new spatial data were available, the spatial units and population data were aggregated.
Boundary data were provided by Mike Shand, Cartographer, of the University of Glasgow in Scotland, U.K. Home Page & Tanzania Links: http://www.geog.gla.ac.uk/~mshand
2002 Population and Housing Census, Zimbabwe: http://www.tanzania.go.tz/censusf.html
1990 population estimates are based on the 1988 census and earlier census information. United Republic of Tanzania (1989), Sensa 1988 - The 1988 Population Census, Preliminary Results, Bureau of Statistics, Ministry of Finance, Economic Affairs and Planning, Dar-Es-Salaam.
In the 'Mwanza' region, all level 2 units were dissolved/amalgamated to level 1 because it was not possible to identify how the new units were created in this area.
The most recent boundaries contained 95 units, but six of these were merged into a single unit in order to make the population data for two time periods compatible.

CountryEnglish
Uganda
South Africa
Source Data: Boundaries Source Data: Population Edits and Notes: Spatial
Ministry of Natural Resources - Department of Forestry, Uganda (1999): National Biomass Study.
1. Republic of Uganda (1992), Provisional results of the 1991 Population and Housing Census, Statistics Department, Ministry of Finance and Economic Planning, Entebbe, Uganda 2. Republic of Uganda (1992), The 1991 Population and Housing Census, District Summary Series, Statistics Department, Ministry of Finance and Economic Planning, Entebbe, Uganda 3. Republic of Uganda (1993), The 1991 Population and Housing Census: Preliminary Estimates of Fertility and Mortality, 1993, Statistics Department, Ministry of Finance and Economic Planning, Entebbe, Uganda
Statistics South Africa, Population Census, 1996. ‘Community Profile Databases’ CD
Statistics South Africa, Population Census, 1996. ‘Community Profile Databases’ CD; 2001-MidYear Province Population estimates data is from: http://www.statssa.gov.za/default3.asp
The South African shapefiles contain 83,016 administrative units while the census records population values for 83,126 areas. This translates to 110 missing spatial units, all but one of which was incorporated via correspondence with province-level population values. Coastline was not matched to DCW as data is more detailed than DCW, and there is general agreement with DCW.

CountryEnglish
Zambia
Zimbabwe
Afghanistan
Source Data: Boundaries Source Data: Population Edits and Notes: Spatial
UNEP/GRID-WRI-NCGIA Africa Population Database: http://grid2.cr.usgs.gov
Republic of Zambia, 2000 Census of Population and Housing, Presentation of Selected Indicators, 18 November 2002, Mulungushi International Conference Center - Lusaka
Republic of Zambia, 1990 Census of Population, Housing, and Agriculture, Preliminary Report, Central Statistics Office, Lusaka
UNEP/GRID-WRI-NCGIA Africa Population Database: http://grid2.cr.usgs.gov .
Census 2002, Preliminary Results Summary, Central Statistical Office, Census 1992, Preliminary Report, Central Statistical Office: http://www.zimrelief.info/index.php?sectid=12&articleid=756 .
UNEP/GRID-WRI-NCGIA boundaries are at the district administative level.
Afghanistan Information Management Service, http://www.aims.org.af/ .
UN Afghani Central Statistical Office via the Afghanistan Information Management Service, http://www.aims.org.af/ .

CountryEnglish
United Arab Emirates
Armenia
Source Data: Boundaries Source Data: Population Edits and Notes: Spatial
UNEP/GRID-WRI-NCGIA Asia Population Database: http://grid2.cr.usgs.gov .
United Arab Emirates Census 1985 and 1995: http://www.uae.gov.ae/mop/Census/census.htm .
Australian Centre of the Asian Spatial Information and Analysis Network (ACASIAN), http://www.asian.gu.edu.au/ .
2001 Census marzes (administrative 1 level) were provided by the National Statistical Service of Armenia and downloaded at: http://docs.armstat.am/census/engcontent.php .
1989 rayon (administrative 2 level) population data were obtained via the Australian Centre of the Asian Spatial Information and Analysis Network (ACASIAN), http://www.asian.gu.edu.au/ .
The rayon (administrative 2 level) boundaries were dissolved to the marzes (administrative 1 level) level.

CountryEnglish
Azerbaijan
Source Data: Boundaries Source Data: Population Edits and Notes: Spatial
Australian Centre of the Asian Spatial Information and Analysis Network (ACASIAN), http://www.asian.gu.edu.au/ .
Australian Centre of the Asian Spatial Information and Analysis Network (ACASIAN), http://www.asian.gu.edu.au/ .

CountryEnglish
Bangladesh
Source Data: Boundaries Source Data: Population Edits and Notes: Spatial
UNEP/GRID-WRI-NCGIA Asia Population Database: http://grid2.cr.usgs.gov .
The original database was produced by the National Statistical Office of Bangladesh in collaboration with the UNSD/POPMAP Project.
2001 census, Population Census 2001 Preliminary Report, http://www.bbsgov.org/ .
Bangladesh Central Statistical Office, Census of 1991, digital data obtained from the UNSD/POPMAP Project..
The original data were compiled in POPMAP which at that time did not support true geo-referencing. Source map scale and projection were unknown. The data were first transformed into Transverse Mercator Projection (which resulted in the lowest error among several possible projections evaluated) and then projected into lat/long (ie, geographic) coordinates. Rubbersheeting was then performed on the resulting coverage to improve the match with the country and coastal outline from the Digital Chart of the World (DCW). Thus, the coverage is suitable for regional and continental scale applications as well as for visualization of spatial pattern using census data. It should not be used for high resolution applications at the sub-national level.

CountryEnglish
Bahrain
Brunei Darussalam
Bhutan
Source Data: Boundaries Source Data: Population Edits and Notes: Spatial
ESRI Level 1 and Digital Chart of the World (DCW).
Europa World Yearbook, (administrative 1 level)
State of Bahrain Central Statistics Organization, Basic Results—Population, Housing, Buildings & Establishments Census, 2001 population by region, http://www.bahrain.gov.bh/census/popu_e.html .
State of Bahrain Central Statistics Organization, Bahrain in Figures 1996, Census Population by Region 1991, http://www.bahrain.gov.bh/english/RunIndex.asp?count=21 .
District boundaries were digitized from the CIA map at: http://www.lib.utexas.edu/Libs/PCL/Map_collection/middle_east_and_asia/Brunei.GIF .
1996 district (administrative 1 level) population information from BruNet: http://www.brunet.bn/org/bsmehp/brunei/info/smepopn.htm .
UNEP/GRID-WRI-NCGIA Asia Population Database: http://grid2.cr.usgs.gov .
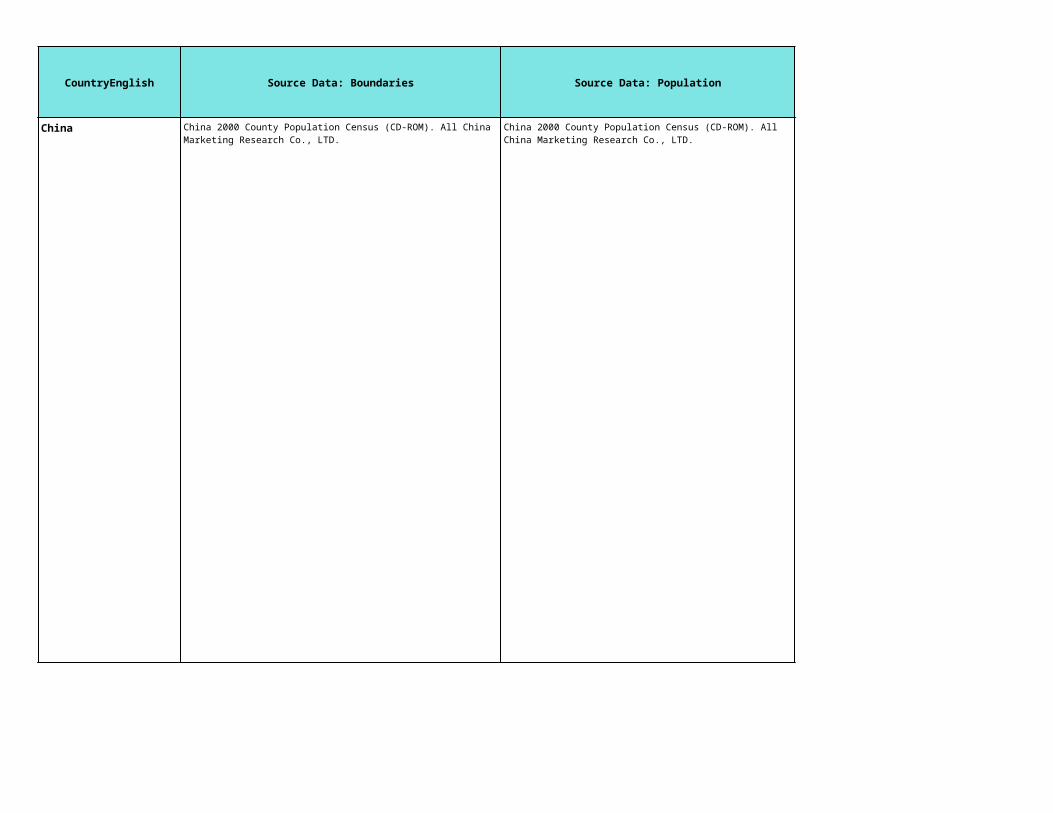
CountryEnglish
China
Source Data: Boundaries Source Data: Population Edits and Notes: Spatial
China 2000 County Population Census (CD-ROM). All China Marketing Research Co., LTD.
China 2000 County Population Census (CD-ROM). All China Marketing Research Co., LTD.
Taiwan was removed from the China shapefile.
1990 and 1995 population estimates were added to GPW3 units from GPW2 as follows: 1) GPW2 polygons projected to match GPW3 coordinate system with slight adjustment in false northing to compensate for misalignment 2) Converted projected GPW2 polygons to centroids 3) Visually-inspected centroids to ensure placement within appropriate GPW3 polygon (verified by comparing to administrative unit names) and moved when necessary 4) Where disaggregation occurred, centroids were copied and pasted to corresponding empty polygons. 5) Performed spatial join in ArcMap to assign GPW2 attributes to the new polygons and assigned the sum of each population attribute if there were multiple centroids within each polygon 6) Inspected data to ensure no data loss 7) Data were converted to lat/long coordinates.

CountryEnglish
Cyprus
Georgia
Hong Kong
Source Data: Boundaries Source Data: Population Edits and Notes: Spatial
Seamless Administrative Boundaries of Europe (SABE) distributed by Eurographics: http://www.eurogeographics.org/eng/03_projects_sabe.asps (SABE 2001 date of release : February 2003).
2001 population census data were provided by the Statistical Service of the Republic of Cyprus and The Press Information Office of Cyprus, http://www.mof.gov.cy/mof/cystat/statistics.nsf/populationcondition_en/ and http://www.pio.gov.cy/dsr/key_figures/population_census/municipality.xls .
Population estimates for the Turkish controlled areas were also provided by the Press Information Office, http://www.pio.gov.cy/dsr/key_figures/population/index.htm .
1992 population data from: Europe World Yearbook, 1992 Census.
Australian Centre of the Asian Spatial Information and Analysis Network (ACASIAN).
General Population Census of Georgia 2002: http://www.statistics.ge/Main/census/INDEX.HTM .
UNEP/GRID-WRI-NCGIA Asia Population Database: http://grid2.cr.usgs.gov and the Electoral Affairs Committee, Survey and Mapping Office, Lands Department
Census and Statistics Department, Hong Kong SAR, People's Republic of China http://www.info.gov.hk/censtatd/eng/hkstat/fas/01c/cd0152001_index.html .
The UNEP/GRID boundaries were updated using a digitized map from the Electoral Affairs Committee, May 1999.

CountryEnglish
Indonesia
Source Data: Boundaries Source Data: Population Edits and Notes: Spatial
2000 boundaries from BPS Statistics Indonesia, Statistical Services, http://www.bps.go.id .
1990 and 2000 Population Censuses, BPS Statistics Indonesia: http://www.bps.go.id/sector/population/table1.shtml for propinsi (administrative 1 level) data. Desa (administrative 4 level) population data for 2000 were purchase from BPS.

CountryEnglish
India
Source Data: Boundaries Source Data: Population Edits and Notes: Spatial
Tahsil Digital Map of India purchased from ML Infomap Private Limited, http://www.mlinfomap.com/.
Original 2001 data source cited as: National Atlas and Thematic Mapping Organization (NATMO) and the Survey of India (SOI), and the Census of India.
Original 1991 data source cited as: National Atlas and Thematic Mapping Organization (NATMO) and the Survey of India (SOI).
1991 and 2001 population data were purchased from ML Infomap Private Limited, http://www.mlinfomap.com/.
Original 2001 data source cited as:Provisional population tables; Census of India 2001-district-wise for each State andRural-Urban Distribution of population.
Original 1991 data source cited as: Census of India, state, district and town level population statistics for 1991 provided by the office of the Registrar General and Census Commissioner, India.

CountryEnglish
Iran
Iraq
Israel
Source Data: Boundaries Source Data: Population Edits and Notes: Spatial
World Data Bank II
World Boundary Databank II and Israel Central Bureau of Statistics.
Spatial data provided by David Rain, US Census Bureau, http://www.census.gov .
Population data provided by David Rain, US Census Bureau, http://www.census.gov .
In 1993, Ardabil ostan (administrative level 1) split from East Azarbaijan. In 1995, Qom ostan split from Tehran. In 1997, Aliabad, Gonbad-e-Kavus, Gorgan, Kordkuy, Minudasht (onbad-e-Kavus), and Torkaman sharestans (administrative level 2), all of which originally belonged to Mazandaran ostan, became a part of Golestan ostan.
Federal Statistical Office of Germany, Laenderbericht: Irak 1988, J.B. Metzler & C.E. Poeschel, Wiesbaden, 1988.
Boundary data source: World Data Bank IICoverage includes Iraq/Saudi Arabia Neutral Zone, with a COUNTRY identifier of 'IY' (as in WBDII), an ADMINID of 999000000, and a population of 0.
2001 Israeli Census: Localities and Population by District, Sub-District, Area, Population Group and Religion (sheet 2.7).
Digitally added administrative level 2 subdistrict boundaries from the Israel Central Bureau of Statistics 2002 map.

CountryEnglish
Jordan
Source Data: Boundaries Source Data: Population Edits and Notes: Spatial
Boundary data were provided by Zeinab Al-Dabbagh, Computer Director, Jordan Department of Statistics.
Population data were provided by Zeinab Al-Dabbagh, Computer Director, Jordan Department of Statistics.

CountryEnglish
Japan
Source Data: Boundaries Source Data: Population Edits and Notes: Spatial
Downloadable boundaries via the Global Map Japan (Provisional Version), http://www.auslig.gov.au/mapping/global_m/specv1_0.htm.
Reference map via the Japan National Tourist Organization, http://www.jnto.go.jp/mapindex/E/mapindex.html.
"Survey of the Land Area for Shi, Ku, Machi, and Mura of Japan, 2000," published by the Geographical Survey Institute, Ministry of Land, Infrastructure and Transport.
Based on the Japan National Tourist Organization digital map at http://www.jnto.go.jp/mapindex/E/mapindex.html, boundaries lines were manually altered in 10 instances to reflect recent unit changes. New boundary lines were added in the following locations: Hokkaidoo prefecture between Kiyotaku and Kitahirosimasi, Hukusima prefecture between Iinomati and Hukusimasi, Tiba prefecture between Wadamati and Kamogawasi, Tiba prefecture between Kuzyuukurimati and Narutoomati, Niigata prefecture between Manomati and Akadomarimura, Toyama prefecture between Funahashimura and Kamiitimati, Yamanasi prefecture between Mitamatyoo and Itikawadzimontyoo, Gifu prefecture between Mitaketyoo and Yaotutyoo, Nagasaki prefecture between Nagayotyoo and inland water, and Kagosima prefecture between Ukenson and Setouchityoo.

CountryEnglish
Kazakhstan
Source Data: Boundaries Source Data: Population Edits and Notes: Spatial
Australian Centre of the Asian Spatial Information and Analysis Network (ACASIAN).
The 1990 is an estimate based on 1989 population from Australian Centre of the Asian Spatial Information and Analysis Network (ACASIAN).

CountryEnglish
Kyrgyz Republic
Cambodia
Source Data: Boundaries Source Data: Population Edits and Notes: Spatial
Australian Centre of the Asian Spatial Information and Analysis Network (ACASIAN).
1999 National Population Census of the Kyrgyz Republic, National Statistical Committee of the Kyrgyz Republic.
The administrative unit of Alaiskii split into the two units of Chon Alai and Alay between 1989 and 1999. In order to create a set of matching boundaries between the two time periods, a boundary line was digitized in Alaiskii and the two units were renamed Chon Alai and Alay.
The administrative units of Kantskii and Issyk-Atinskii merged to form Isyk-Ata between 1989 and 1999. The two were therefore aggregated in the shapefile.
Part of the administrative unit Jumgal (previously called Dzhumgalskii) was split off and added to Jaiyl. In order to reflect this change, a line was digitized into Jumgal using SALB boundaries as a reference.
Cambodia Ministry of Land Management, Urban Planning and Construction, Department of Geography.
1998 Population Census of Cambodia provided by the Cambodia Ministry of Land Management, Urban Planning and Construction; Department of Geography.
Population data for 1994 provided by the Cambodia National Institute of Statistics and have been obtained in digital form from the UNSTAT/POPMAP Project
Boundary changes occured at the district level between 1994 and 1998. The 1998 population data was thus aggregated and/or re-proportioned to match the 1994 boundaries. For a complete description of these changes.
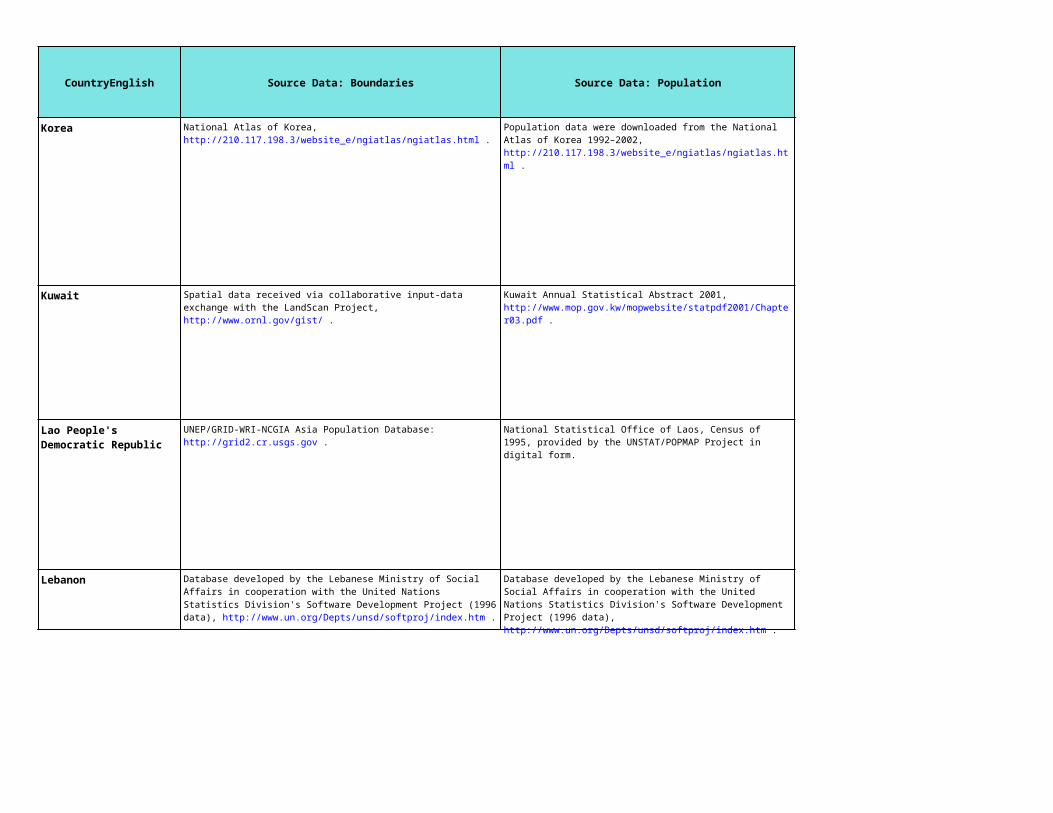
CountryEnglish
Korea
Kuwait
Lebanon
Lao People's Democratic Republic
Source Data: Boundaries Source Data: Population Edits and Notes: Spatial
National Atlas of Korea, http://210.117.198.3/website_e/ngiatlas/ngiatlas.html .
Population data were downloaded from the National Atlas of Korea 1992–2002, http://210.117.198.3/website_e/ngiatlas/ngiatlas.html .
Spatial data received via collaborative input-data exchange with the LandScan Project, http://www.ornl.gov/gist/ .
Kuwait Annual Statistical Abstract 2001, http://www.mop.gov.kw/mopwebsite/statpdf2001/Chapter03.pdf .
According to the 2001 Annual Statistical Abstract, there are now a total of 6 govenorates (administrative level 1) in Kuwait. The newest governorate, Mubarak Al-Kabeer, appears to have been added in 2000 and was split from Hawalli. To create matched boundaries at two time periods, Hawalli and Mubarak Al-Kabeer governorates were aggregated and called Hawalli-incl.MubarakAl-Kabeer.
The governorate called Al Kuwayt in the spatial data is called Capital in the population data.
UNEP/GRID-WRI-NCGIA Asia Population Database: http://grid2.cr.usgs.gov .
National Statistical Office of Laos, Census of 1995, provided by the UNSTAT/POPMAP Project in digital form.
Database developed by the Lebanese Ministry of Social Affairs in cooperation with the United Nations Statistics Division's Software Development Project (1996 data), http://www.un.org/Depts/unsd/softproj/index.htm .
Database developed by the Lebanese Ministry of Social Affairs in cooperation with the United Nations Statistics Division's Software Development Project (1996 data), http://www.un.org/Depts/unsd/softproj/index.htm .

CountryEnglish
Sri Lanka
Macao
Maldives
Source Data: Boundaries Source Data: Population Edits and Notes: Spatial
Digital Chart of the World (DCW).
Boundary data were provided by Hugh Turral at the International Water Management Institute (IWMI, http://www.iwmi.org .
Sri Lanka Census of Population and Housing 2001, http://www.statistics.gov.lk/population/index.htm .
2001 and 1991 population figures were provided by The Statistics and Census Service (DSEC), http://www.dsec.gov.mo/e_index.asp?src=/english/pub/e_cen_pub.html .
Digital Chart of the World (DCW) boundaries were updated using paper maps from the Maldives Ministry of Planning and Development.
Ministry of Planning and Development, Maldives 1995 and 2000 Census Data, http://www.planning.gov.mv/census2k/index_p.htm .

CountryEnglish
Myanmar
Mongolia
Malaysia
Nepal
Source Data: Boundaries Source Data: Population Edits and Notes: Spatial
Boundary data were obtained from Birkbeck College, London and initially prepared for the UNEP/GRID-WRI-NCGIA Asia Population Database: http://grid2.cr.usgs.gov .
Township (administrative 2 level) population data for 1983 population data at township were accessed via: The Socialist Republic of the Union of Burma, 1983 Population Census, Ministry of Home and Religious Affairs, Immigration and Manpower Department, October 1987.
State (administrative 1 level) population data for 1983, 1985 and 1990–1997 were accessed via: the Statistical Yearbook 2000, The Government of the Union of Myanmar, Ministry of National Planning and Economic Development, Central Statistical Organization, Yangoon, Myanmar 2000.
Boundary data was provided by S. Khudulmur, Director of Information and Computer Center, Ministry for Nature and Environment.
2000 Population and Housing Census, Table 5, National Statistics Office of Mongolia, http://nso.mn/census/mainresults/Annx1.pdf .
The country boundary was matched to DCW; the internal boundries are from the data provided by the Ministry for Nature and Environment.
Australian Centre of the Asian Spatial Information and Analysis Network (ACASIAN).
Population and Housing Census of Malaysia 2000, Banci Penduduk Dan Perumaham Malasia 2000 (administrative 2 level), Preliminary County Report, Laporan Kiraan Permulaan.
The new district (administrative level 2) of Bera, in Pahang state (administrative level 1), was formed from parts of Temerloh district. Population totals for Bera and Temerloh districts were combined and assigned to Temorloh district to match the spatial data in GPW2.
The new district of Asajaya was formed from parts of Samarahan and Sadong-Jaya sub-district (in Simunjan district). It was aggregated with Samarahan district to match the spatial data.
The new district of Tongod, in Sabah state, was formed from parts of Kinabatangan district. It was aggregated with Kinabatangan to match the spatial data.
Districts specified as "NA" that are islands belonging to Johor state have been attributed to Pontian district; District specified as "NA" that are islands belonging to Terengganu state have been attributed to Setiu district.
Boundary data provided by Royce Jones, Geographic Decisions International.
Nepal Population Report 2002: Chapter 1, Table 1.7, Distribution and the Growth Rate of Population by Districts, Nepal 1981-2001;The Nepal Ministry of Population and Environment, http://www.mope.gov.np/ .

CountryEnglish
Oman
Pakistan
Source Data: Boundaries Source Data: Population Edits and Notes: Spatial
Pakistan Resources Development Services (Pvt.) Ltd. (PRDS) Pakistan Resources Development Services (Pvt.) Ltd. (PRDS)
Boundaries provided by Dr. William Bajjali, Department of Biology & Earth Sciences, University of Wisconsin at Superior.
Population data were obtained via the Sulatanate of Oman, Ministry of National Economy, Information and Documentation Center: http://www.moneoman.gov.om/stb_web/tables/population/pop_2-2.htm .
Neither the spatial nor the population data contain information for the disputed zones of Jammmu and Kashmir. The Pakistan national boundary was clipped to the spatial extent of the India coverage (placing the disputed territories in the domain of India) because it is the most complete and current data we have.
Two district polygons, lying at the boundary between Jaccobabad and Ghotki districts, lacked any quantitative information. They were therefore merged back into the larger, subsuming polygon district from which they were most likely derived (one each into Jaccobabad and Ghotki).
Islamabad is now listed as its own province, division, and district.

CountryEnglish
Philippines
Source Data: Boundaries Source Data: Population Edits and Notes: Spatial
International Rice Research Institute, GIS-IP Laboratory, Social Sciences Division, MCPO Box 3127 1271, Makati City, Philippines.
2000 population data source: Philippines 2000 Census of Population and Housing, http://www.census.gov.ph/data/sectordata/datapop.html#population .
A handful of island municipalities were not included in the original shapefile. To incorporate them, their polygons were extracted from the World Vector Shoreline coastline extractor, http://rimmer.ngdc.noaa.gov/mgg/coast/getcoast.html .

CountryEnglish
Korea, Dem. People's Rep. of
Source Data: Boundaries Source Data: Population Edits and Notes: Spatial
Province (administrative level 1) boundaries were obtained via UNEP/GRID Tsukuba, Japan, based originally on World Data Bank II. County (administrative level 2) boundaries were obtained via the DPRK Government Data.
2001 census data is from the Democratic People's Republic of Korea (DPRK) Government.
1991 census data from is from the DPRK 1991 Population Census (unpublished, mimeo. data sheet) and Eberstatdt, Nichola and Banister, Judith, The Population of North Korea, Institute of East Asian Studies: Center for Korean Studies, Berkeley, CA, 1992.
Geometrically transformed data in unknown projection to match Digital Chart of the World (DCW) boundaries using 16 control points. The result was an RMS error of 0.035653; the data are not appropriate for detailed or large scale analysis.

CountryEnglish
Occupied Palestinian Territory
Source Data: Boundaries Source Data: Population Edits and Notes: Spatial
Data provided by Bashar Juma'a, Ministry of Planning and International Cooperation, Director of the Special Technical Unit for Negotiations (STU).
1997 and 2000 population data were provided by the Palestinian Central Bureau of Statistics Population, Housing, and Establishment Census.

CountryEnglish
Qatar
Saudi Arabia
Singapore
Syrian Arab Republic
Source Data: Boundaries Source Data: Population Edits and Notes: Spatial
World Data Bank II
Second Administrative Level Boundaries (SALB), United Nations, http://www3.who.int/whosis/gis/salb/salb_home.htm .
1986 population estimates located at: http://www.world-gazetteer.com/fr/fr_qa.htm
2000 population estimate located at: http://www.mindspring.com/~gwil/uqa.html (referenced as provided by Karem Abdalla).
Boundary data were digitized at NCGIA from the 1990 CIA map. This dataset was initially prepared for the UNEP/GRID-CGIAR-NCGIA Asia Population Database, http://www.grid.unep.ch/gridhome.html or http://grid2.cr.usgs.gov .
2000 population data were provided by the Central Department of Statistics, Kingdom of Saudi Arabia. Demographic Survey (1419 A.H./ 2000 A.D)
1992 population data were provided by the Population And Housing Census (1413 A.H./1992 A.D.), http://www.planning.gov.sa/docs/st2e.htm .
Boundaries from the Digital Chart of the World (DCW) were update using a digitized paper map provided by the Singapore Urban Redevelopment Authority.
Singapore Department of Statistics, Census of Population 2000, Statistical Release 4, Geographic Distribution and Travel.
1994 population data are from the United Nation's Economic and Social Commission for Western Asia 2001 volume, "Women and Men in the Syrian Arab Republic- A Statistical Portrait."
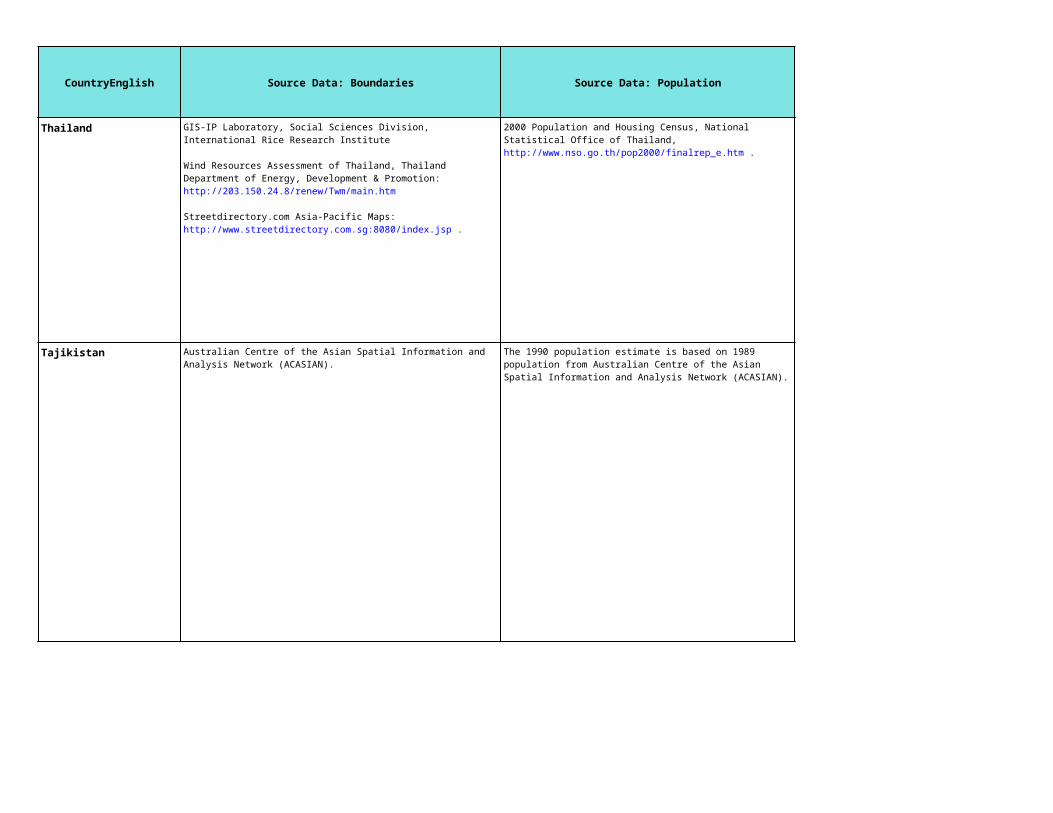
CountryEnglish
Thailand
Tajikistan
Source Data: Boundaries Source Data: Population Edits and Notes: Spatial
GIS-IP Laboratory, Social Sciences Division, International Rice Research Institute
Wind Resources Assessment of Thailand, Thailand Department of Energy, Development & Promotion: http://203.150.24.8/renew/Twm/main.htm
Streetdirectory.com Asia-Pacific Maps: http://www.streetdirectory.com.sg:8080/index.jsp .
2000 Population and Housing Census, National Statistical Office of Thailand, http://www.nso.go.th/pop2000/finalrep_e.htm .
Growth rates were calculated between the years 1990 and 2000, except for some amphoes that had blatantly wrong 1990 pop values. For these special cases, growth rates were calculated between the years 1996-2000
Australian Centre of the Asian Spatial Information and Analysis Network (ACASIAN).
The 1990 population estimate is based on 1989 population from Australian Centre of the Asian Spatial Information and Analysis Network (ACASIAN).

CountryEnglish
Turkmenistan
East Timor
Turkey
Source Data: Boundaries Source Data: Population Edits and Notes: Spatial
National Statistical Office of Indonesia, Census of 1990.
Australian Centre of the Asian Spatial Information and Analysis Network (ACASIAN).
The 1990 population estimate is based on 1989 population from Australian Centre of the Asian Spatial Information and Analysis Network (ACASIAN).
National Statistical Office of Indonesia in collaboration with the UNSTAT/POPMAP Project. BPS Statistics Indonesia, Statistical Services, http://www.bps.go.id .
Spatial data received via collaborative input-data exchange with the LandScan Project, http://www.ornl.gov/gist/ .
2000 population data: Republic of Turkey, State Institute of Statistics (SIS), http://www.die.gov.tr/ENGLISH/index.html .
1990 and 1997 population data: Republic of Turkey, State Planning Organization, http://www.dpt.gov.tr/dptweb/ekutup99/il99/il99.html#nufus .
The boundaries do not include the recently created province (administrative level 1) of Duzce. Duzce was split off from the province of Bolu.

CountryEnglish
Taiwan
Uzbekistan
Source Data: Boundaries Source Data: Population Edits and Notes: Spatial
China 2000 County Population Census (CD-ROM). All China Marketing Research Co., LTD.
2000 Population and Housing Census: Statistical tables (Historical comparison: Taiwan-Fukin area, by city/county) http://www.dgbas.gov.tw/census~n/six/lue5/cen8905e.rtf .
1990 and 1995 population estimates were added to GPW3 units from GPW2 as follows: 1) GPW2 polygons projected to match GPW3 coordinate system with slight adjustment in false northing to compensate for misalignment 2) Converted projected GPW2 polygons to centroids 3) Visually inspected centroids to ensure placement within appropriate GPW3 polygon (verified by comparing to administrative unit names) and moved when necessary 4) Where disaggregation occurred, centroids were copied and pasted to corresponding empty polygons. 5) Performed spatial join in ArcMap to assign GPW2 attributes to the new polygons and assigned the sum of each population attribute if there were multiple centroids within each polygon 6) Inspected data to ensure no data loss 7) Data were converted to lat/long coordinates
Australian Centre of the Asian Spatial Information and Analysis Network (ACASIAN).
The 1990 population estimate is based on 1989 population from Australian Centre of the Asian Spatial Information and Analysis Network (ACASIAN).

CountryEnglish
Viet Nam
Yemen
Source Data: Boundaries Source Data: Population Edits and Notes: Spatial
UNEP/GRID-WRI-NCGIA Asia Population Database: http://grid2.cr.usgs.gov ; The original database was produced by the National Statistical Office of Vietnam in collaboration with the UNSTAT/POPMAP Project
April 1999 Population and Housing Census, General Statistics Office, Central Data Processing Center, Hanoi.
Population estimates for 1992 based on the National Statistical Office of Vietnam, Census of 1989. This data was provided in digital form by the UNSTAT/POPMAP Project.
Database produced by the Yemen National Statistical Office in collaboration with the UN Statistics Division's Software Development Project http://www.un.org/Depts/unsd/softproj/index.htm .
Database produced by the Yemen National Statistical Office in collaboration with the UN Statistics Division's Software Development Project http://www.un.org/Depts/unsd/softproj/index.htm .
The boundaries were rubber-sheeted in the Northwestern part of the country in order to better match the DCW coastlines.
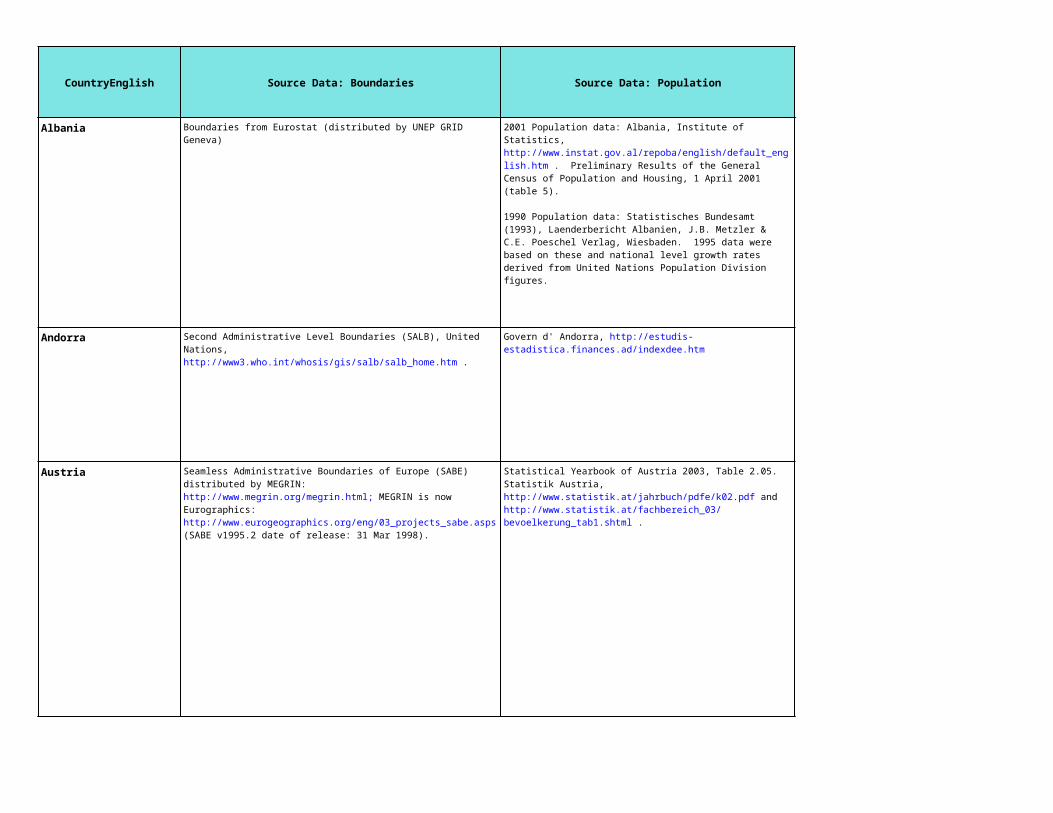
CountryEnglish
Albania
Andorra
Austria
Source Data: Boundaries Source Data: Population Edits and Notes: Spatial
Boundaries from Eurostat (distributed by UNEP GRID Geneva) 2001 Population data: Albania, Institute of Statistics, http://www.instat.gov.al/repoba/english/default_english.htm . Preliminary Results of the General Census of Population and Housing, 1 April 2001 (table 5).
1990 Population data: Statistisches Bundesamt (1993), Laenderbericht Albanien, J.B. Metzler & C.E. Poeschel Verlag, Wiesbaden. 1995 data were based on these and national level growth rates derived from United Nations Population Division figures.
Second Administrative Level Boundaries (SALB), United Nations, http://www3.who.int/whosis/gis/salb/salb_home.htm .
Govern d' Andorra, http://estudis-estadistica.finances.ad/indexdee.htm
Seamless Administrative Boundaries of Europe (SABE) distributed by MEGRIN: http://www.megrin.org/megrin.html; MEGRIN is now Eurographics: http://www.eurogeographics.org/eng/03_projects_sabe.asps (SABE v1995.2 date of release: 31 Mar 1998).
Statistical Yearbook of Austria 2003, Table 2.05. Statistik Austria, http://www.statistik.at/jahrbuch/pdfe/k02.pdf andhttp://www.statistik.at/fachbereich_03/bevoelkerung_tab1.shtml .
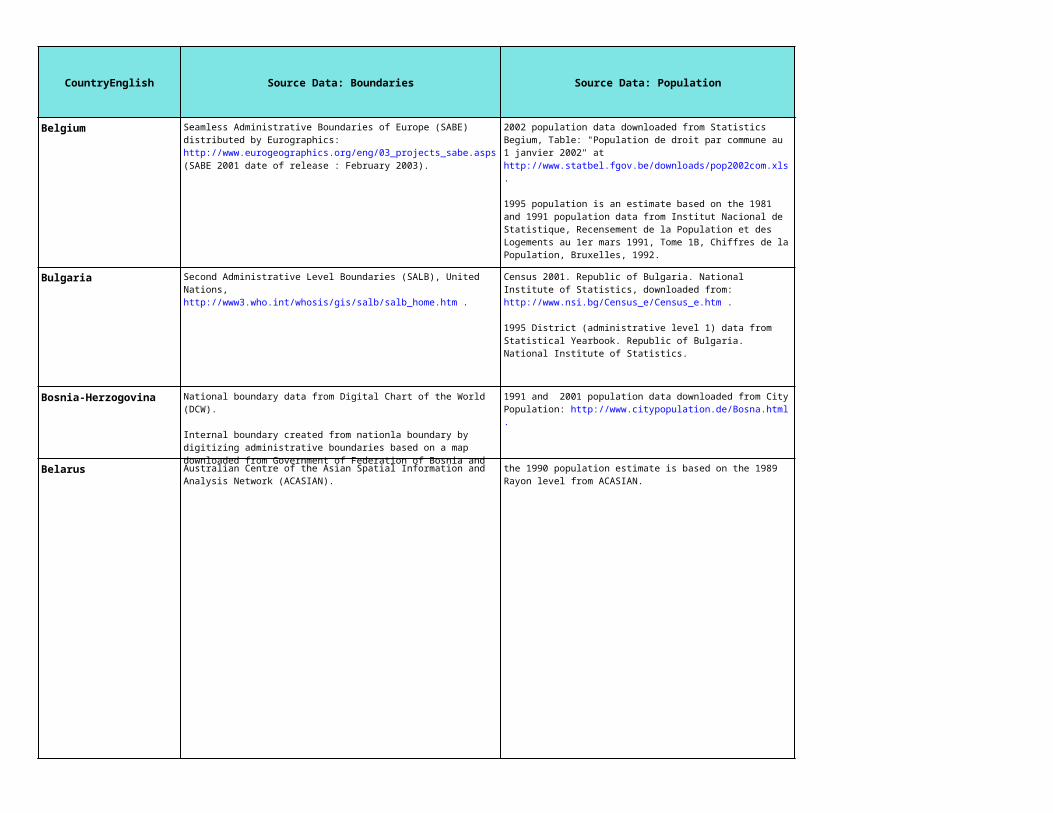
CountryEnglish
Belgium
Bulgaria
Bosnia-Herzogovina
Belarus
Source Data: Boundaries Source Data: Population Edits and Notes: Spatial
Seamless Administrative Boundaries of Europe (SABE) distributed by Eurographics: http://www.eurogeographics.org/eng/03_projects_sabe.asps (SABE 2001 date of release : February 2003).
2002 population data downloaded from Statistics Begium, Table: "Population de droit par commune au 1 janvier 2002" at http://www.statbel.fgov.be/downloads/pop2002com.xls .
1995 population is an estimate based on the 1981 and 1991 population data from Institut Nacional de Statistique, Recensement de la Population et des Logements au 1er mars 1991, Tome 1B, Chiffres de la Population, Bruxelles, 1992.
Second Administrative Level Boundaries (SALB), United Nations, http://www3.who.int/whosis/gis/salb/salb_home.htm .
Census 2001. Republic of Bulgaria. National Institute of Statistics, downloaded from: http://www.nsi.bg/Census_e/Census_e.htm .
1995 District (administrative level 1) data from Statistical Yearbook. Republic of Bulgaria. National Institute of Statistics.
In January 1999, Bulgaria changed its number of districts from 9 to 21 districts. By comparing pre-1999 and post-1999 districts maps, it is assumed that the municiplaity of Topolovgrad (2001 pop of 15179) now in the district of Haskovo was part of the district of Bourgas in 1995.
National boundary data from Digital Chart of the World (DCW).
Internal boundary created from nationla boundary by digitizing administrative boundaries based on a map downloaded from Government of Federation of Bosnia and Herzegovina: http://www.fbihvlada.gov.ba/engleski/ .
1991 and 2001 population data downloaded from City Population: http://www.citypopulation.de/Bosna.html .
Australian Centre of the Asian Spatial Information and Analysis Network (ACASIAN).
the 1990 population estimate is based on the 1989 Rayon level from ACASIAN.

CountryEnglish
Switzerland
Czech Republic
Germany
Denmark
Source Data: Boundaries Source Data: Population Edits and Notes: Spatial
Seamless Administrative Boundaries of Europe (SABE) distributed by Eurographics: http://www.eurogeographics.org/eng/03_projects_sabe.asps (SABE 2001 date of release : February 2003).
Permanent Resident Population 1997 and 2001 from Swiss Federal Statistics Office, www.statistik.admin.ch .
Seamless Administrative Boundaries of Europe (SABE) distributed by Eurographics: http://www.eurogeographics.org/eng/03_projects_sabe.asps (SABE 2001 date of release : February 2003).
1995 and 2001 data from the Czech Statistical Office. 2001 data from Population and Housing Census 2001, downloaded from: http://www.czso.cz/eng/angl.htm.
Boundaries from the Seamless Administrative Boundaries of Europe (SABE) distributed by MEGRIN (now Eurographics [http://www.eurogeographics.org/eng/03_projects_sabe.asps] ) (SABE v1995.2 date of release : 31 Mar 1998)
1995 population from for Kreise from: http://www.brandenburg.de/statreg/daten_02/d02a01.htm.
2002 pop from https://www-genesis.destatis.de/genesis/online/Online ©Statistisches Bundesamt, Wiesbaden, 2004.
Seamless Administrative Boundaries of Europe (SABE) distributed by Eurographics: http://www.eurogeographics.org/eng/03_projects_sabe.asps (SABE 2001 date of release : February 2003).
2002 data from Denmark Statistical Yearbook 2002 (PDF), Table 44. Population in municipalites and counties 2002, downloaded from Denmark Statistics, http://www.dst.dk/HomeUK/Statistics/Publications/Yearbook/2002.aspx?

CountryEnglish
Spain
Estonia
Finland
Source Data: Boundaries Source Data: Population Edits and Notes: Spatial
Boundary data clipped to DCW coastline boundaries.
Seamless Administrative Boundaries of Europe (SABE) distributed by Eurographics: http://www.eurogeographics.org/eng/03_projects_sabe.asps (SABE 2001 date of release : February 2003).
2001 Population: Instituto Nacional de Estadística. Censo de Población 2001, http://www.ine.es/ ; http://www.ine.es/censo2001/cenpob_muni.htm .
1991 Population: data also from the NSO Web site, http://www.ine.es/ .
Seamless Administrative Boundaries of Europe (SABE) distributed by Eurographics: http://www.eurogeographics.org/eng/03_projects_sabe.asps (SABE 2001 date of release : February 2003).
2000 data from the Statistical Office of Estonia, Table: Population by the Place of residence in 2000 and 1989 Population Censuses (by data of 2000 census), http://gatekeeper.stat.ee:8000/px-web.2001/Dialog/varval.asp?ma=PC111&ti=POPULATION+BY+THE+PLACE+OF+RESIDENCE+IN+2000+AND+1989+POPULATION+CENSUSES+%28BY+DATA+OF+2000+CENSUS%29&path=../I_Databas/Population_census/14Place_of_residence_at_the_time_of_the_1989_Population_Census/&lang=1
The 1990 data are official estimates of population from the Statistical Office of Estonia, http://www.stat.ee/
Seamless Administrative Boundaries of Europe (SABE) distributed by Eurographics: http://www.eurogeographics.org/eng/03_projects_sabe.asps (SABE 2001 date of release : February 2003).
2000 Kunta population data provided by:Mr. Juhani Leskinen. Library of Statistics Finland. Email: [email protected] Internet: http://www.stat.fi
1993 Kunta population downloaded from UNEP GEO data portal.
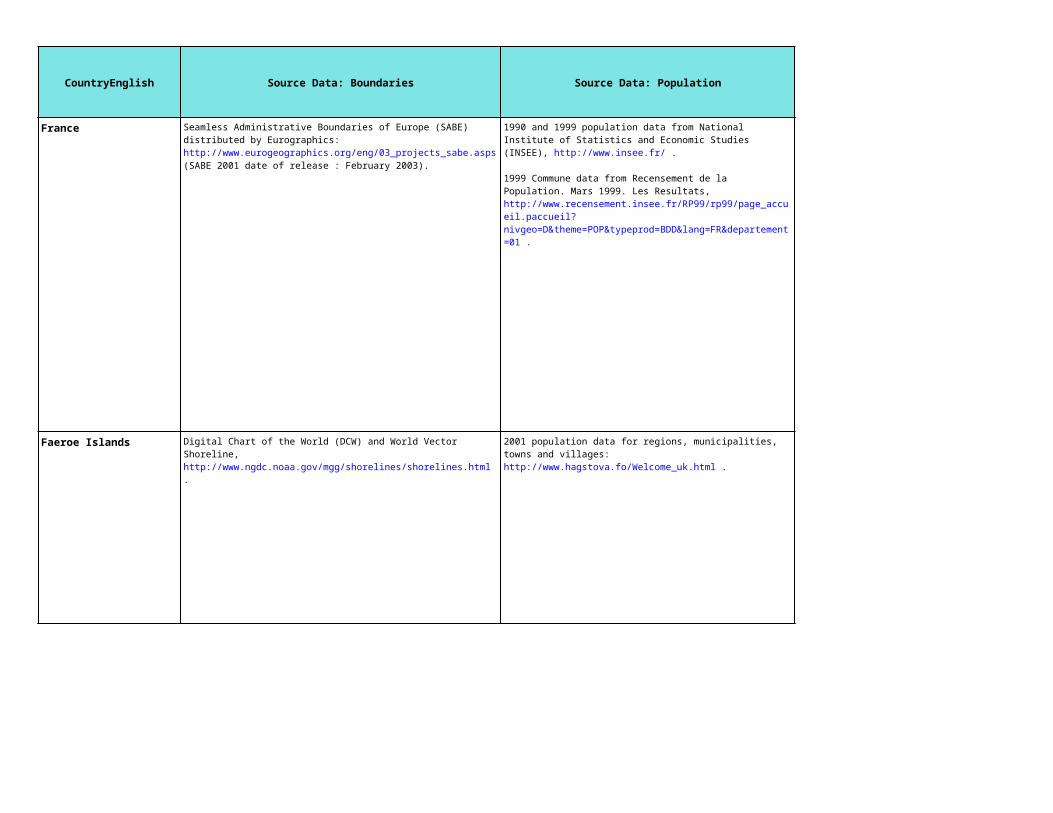
CountryEnglish
France
Faeroe Islands
Source Data: Boundaries Source Data: Population Edits and Notes: Spatial
Seamless Administrative Boundaries of Europe (SABE) distributed by Eurographics: http://www.eurogeographics.org/eng/03_projects_sabe.asps (SABE 2001 date of release : February 2003).
1990 and 1999 population data from National Institute of Statistics and Economic Studies (INSEE), http://www.insee.fr/ .
1999 Commune data from Recensement de la Population. Mars 1999. Les Resultats, http://www.recensement.insee.fr/RP99/rp99/page_accueil.paccueil?nivgeo=D&theme=POP&typeprod=BDD&lang=FR&departement=01 .
Digital Chart of the World (DCW) and World Vector Shoreline, http://www.ngdc.noaa.gov/mgg/shorelines/shorelines.html .
2001 population data for regions, municipalities, towns and villages: http://www.hagstova.fo/Welcome_uk.html .
To assign municipal and regional populations, a hybrid of Region (administrative level 1) and Municipality (administrativelevel 2) internal boundaries were created:
(1) Region STREYMOY ANNARS was combined with region TÓRSHAVNAR ØKIÐ as they are on the same island; (2) Region NORÐARA EYSTUROY and region SYÐRA EYSTUROY were combined as they are on the same island; (3) Viðareiðis in region NORÐOYGGJAR ANNARS was assigned to region KLAKSVÍKARØKIÐ as it is on the same island. (4) Added one island, i.e., the island of Kirkjubøur, from World Vector Shoreline at: http://rimmer.ngdc.noaa.gov/coast/All populations are obtained by generating sums of towns/villages to either muncipalities or islands.

CountryEnglish
United Kingdom
Guernsey
Source Data: Boundaries Source Data: Population Edits and Notes: Spatial
Digital Chart of the World (DCW).
Seamless Administrative Boundaries of Europe (SABE) distributed by MEGRIN: http://www.megrin.org/megrin.html; MEGRIN is now Eurographics: http://www.eurogeographics.org/eng/03_projects_sabe.asps (SABE v1995.2 date of release: 31 Mar 1998).
England and Wales data is from the Office for National Statistics (ONS) in their Census 200 report, http://www.statistics.gov.uk/. Scotland's data is from the Registrar General from Scotland in Scoltand's Census 2001. Northern Ireland's data is from NSO: http://www.nisra.gov.uk/census/Census2001Output/PopulationReport/populationreport1.html .
Population data from the 2001 Guernsey Census report on the census of population and households. States of Guernsey. Advisory and Finance Committee.

CountryEnglish
Gibraltar
Source Data: Boundaries Source Data: Population Edits and Notes: Spatial
Digital Chart of the World (DCW). The 1991 national population from Census of Gibralatar 1991 Report, Government of Gibraltar.
The 1997 national population from Government of Gibraltar Information Services, http://www.gibraltar.gov.gi/index.htm

CountryEnglish
Greece
Source Data: Boundaries Source Data: Population Edits and Notes: Spatial
Seamless Administrative Boundaries of Europe (SABE) distributed by Eurographics: http://www.eurogeographics.org/eng/03_projects_sabe.asps (SABE 2001 date of release : February 2003).
National Statistical Service of Greece, http://www.statistics.gr; 2001 census tables for Eurostat

CountryEnglish
Croatia
Hungary
Source Data: Boundaries Source Data: Population Edits and Notes: Spatial
Seamless Administrative Boundaries of Europe (SABE) distributed by Eurographics: http://www.eurogeographics.org/eng/03_projects_sabe.asps (SABE 2001 date of release : February 2003).
Croation Bureau of Statistics, http://www.dzs.hr/Eng/Census/Popis/E01_01_01/E01_01_01.html
The municipality of Orlic in the County of Sibenik-Knin reported no population data, but existed in shapefile, thus its polygon is merged with Knin, a neighboring unit with which it shared most boundaries. The municipality of Slivno in Dubrovnik-Neretva had a population but no matching polygon in the SABE shapefile, thus, its point coordinates were located then its population added to the municipality in which it falls, i.e., the municipality of Podosoje.
Seamless Administrative Boundaries of Europe (SABE) distributed by Eurographics: http://www.eurogeographics.org/eng/03_projects_sabe.asps (SABE 2001 date of release : February 2003).
1990 population from the Census of 1990, Hungarian Statistical Office, Department of Population Surveys, Budapest.
2002 population from The Detailed Gazetteer of the Republic of Hungary. Hungarian Statistical Office. Downloadale Data of the Settlements of the Republic, http://helynevtar.ksh.hu/download.php3?sid=10643405581416982990&tract=3&c_lang=en

CountryEnglish
Isle of Man
Iceland
Italy
Jersey
Source Data: Boundaries Source Data: Population Edits and Notes: Spatial
Digital Chart of the World (DCW).
National boundary data obtained from VMAP level 0 (Geocommunity CD).
1996 and 2001 data from the Isle of Man Census Report 2001, Volume 2. Economic Affairs Division, Isle of Man Government Treasury.
The Census District boundaries are digitized based on a map from the Isle of Man Census Report 2001, Volume 2. Economic Affairs Division, Isle of Man Government Treasury.
Seamless Administrative Boundaries of Europe (SABE) distributed by Eurographics: http://www.eurogeographics.org/eng/03_projects_sabe.asps (SABE 2001 date of release : February 2003).
Statistics Iceland, http://www.statice.is . (1) The following units in the spatial data did not match census enumeration units: Glæsibæjarhreppur, Öxnadalshreppur, Skriðuhreppur. Lat/long coordinates were located for each place, and populations aggregated to the corresponding administrative unit (all Högábyggð).
(2) Almenningur is public land and has a population of zero. Constituency (administartive level 1) names were not included in data and were not readily available for timely addition to data.
Seamless Administrative Boundaries of Europe (SABE) distributed by Eurographics: http://www.eurogeographics.org/eng/03_projects_sabe.asps (SABE 2001 date of release : February 2003).
14th General Population and Housing Census Legal Population. DaWinci; the Data Warehouse. National Statistical Institute, Italy: http://dawinci.istat.it/pl/ .
Population data from the Report on the 2001 Census Jersey, by the Etat Civil Committee.

CountryEnglish
Liechtenstein
Lithuania
Luxembourg
Source Data: Boundaries Source Data: Population Edits and Notes: Spatial
Seamless Administrative Boundaries of Europe (SABE) distributed by Eurographics: http://www.eurogeographics.org/eng/03_projects_sabe.asps (SABE 2001 date of release : February 2003).
Office of National Economy, Liechtenstein in Figures, http://www.liechtenstein.li/lisite/html/liechtenstein/index.jsp?treeId=ZALFAK_en_EN&topicId=0.3&sync=true .
Seamless Administrative Boundaries of Europe (SABE) distributed by Eurographics: http://www.eurogeographics.org/eng/03_projects_sabe.asps (SABE 2001 date of release : February 2003).
1995 population is an estimate based on the 1999 population from Statistics Lithunia, http://www.std.lt/web/main.php and 1989 population from UNEP/GRID Arendal.
Seamless Administrative Boundaries of Europe (SABE) distributed by Eurographics: http://www.eurogeographics.org/eng/03_projects_sabe.asps (SABE 2001 date of release : February 2003).
Central Service for Statistics and Economic Studies (STATEC), Luxemburg, http://statec.gouvernement.lu/html_fr/RP_2001/rp01_commune_localite.html .

CountryEnglish
Latvia
Monaco
Source Data: Boundaries Source Data: Population Edits and Notes: Spatial
Digital Chart of the World (DCW).
Seamless Administrative Boundaries of Europe (SABE) distributed by Eurographics: http://www.eurogeographics.org/eng/03_projects_sabe.asps (SABE 2001 date of release : February 2003).
Central Statistics Bureau of Latvia, "Results of the 2000 Population and Housing Census in Latvia."
National level pop data from the United Nations World Population Prospects, 1998 Revision, United Nations Population Division, New York.

CountryEnglish
Republic of Moldova
Macedonia
Malta
Source Data: Boundaries Source Data: Population Edits and Notes: Spatial
Australian Centre of the Asian Spatial Information and Analysis Network (ACASIAN).
1989 population from from ACASIAN.
1998 from the UNDP Office in Moldova (Ms. Ludmila Tiganu, [email protected])
Municpal boundary paper map prepared by the State Statistical Office from State Statistical Office, Republic of Macedonia
2002 data from the Census of Population, Households and Dwellings in the Republic of Macedonia, 2002. Final Report. Republic of Macedonia, State Statistical Office.
1994 population from the Census 1994 (according to 1996 administrative boundaries) at http://www.stat.gov.mk/english/index_eng.htm .
Municipal boundary drawn based on map prepared by the Republic of Macedonia State Statistical Office, 2003.
Seamless Administrative Boundaries of Europe (SABE) distributed by Eurographics: http://www.eurogeographics.org/eng/03_projects_sabe.asps (SABE 2001 date of release : February 2003).
1995 data from: http://www.nso.gov.mt/publications/census'95/volume1/chapter5.htm .
2001 data from: Demographic Review, 2001 published by the National Statistics Office, Malta 2002 (PDF-- see Website: http://www.nso.gov.mt)
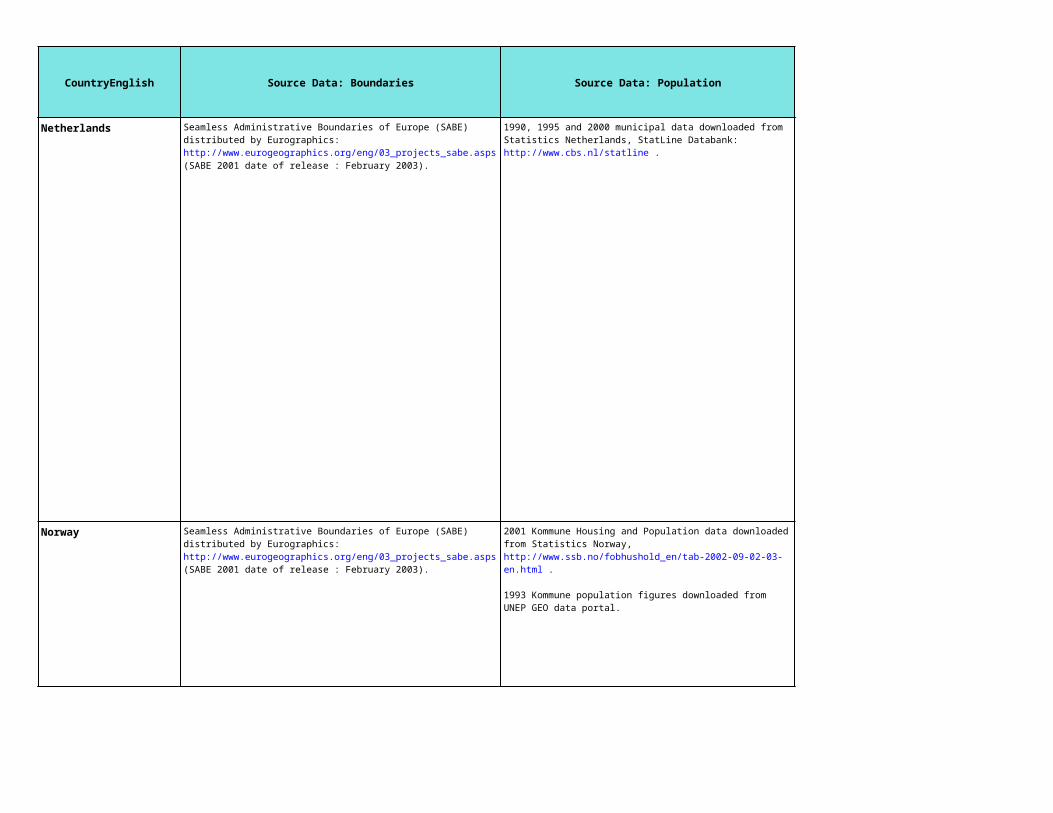
CountryEnglish
Netherlands
Norway
Source Data: Boundaries Source Data: Population Edits and Notes: Spatial
Boundary clipped with DCW to DCW shoreline boundaries.
Seamless Administrative Boundaries of Europe (SABE) distributed by Eurographics: http://www.eurogeographics.org/eng/03_projects_sabe.asps (SABE 2001 date of release : February 2003).
1990, 1995 and 2000 municipal data downloaded from Statistics Netherlands, StatLine Databank: http://www.cbs.nl/statline .
Seamless Administrative Boundaries of Europe (SABE) distributed by Eurographics: http://www.eurogeographics.org/eng/03_projects_sabe.asps (SABE 2001 date of release : February 2003).
2001 Kommune Housing and Population data downloaded from Statistics Norway, http://www.ssb.no/fobhushold_en/tab-2002-09-02-03-en.html .
1993 Kommune population figures downloaded from UNEP GEO data portal.

CountryEnglish
Portugal
Romania
Source Data: Boundaries Source Data: Population Edits and Notes: Spatial
Coastline matched to DCWSeamless Administrative Boundaries of Europe (SABE) distributed by Eurographics: http://www.eurogeographics.org/eng/03_projects_sabe.asps (SABE 2001 date of release : February 2003).
"Censos 2001": Recenseamento da General da População; Instituto Nacional de Estatistica, Portugal.
1981 and 1991 population census figures from the Instituto Nacional de Estatistica, Portugal, http://www.ine.pt/ .
Second Administrative Level Boundaries (SALB), United Nations, http://www3.who.int/whosis/gis/salb/salb_home.htm .
1992 Municipul and 2002 Commune/Municipul population data from Recensamant 2002 (Census 2002), Institutul Nacional de Statistica, Romania: http://www.recensamant.ro/
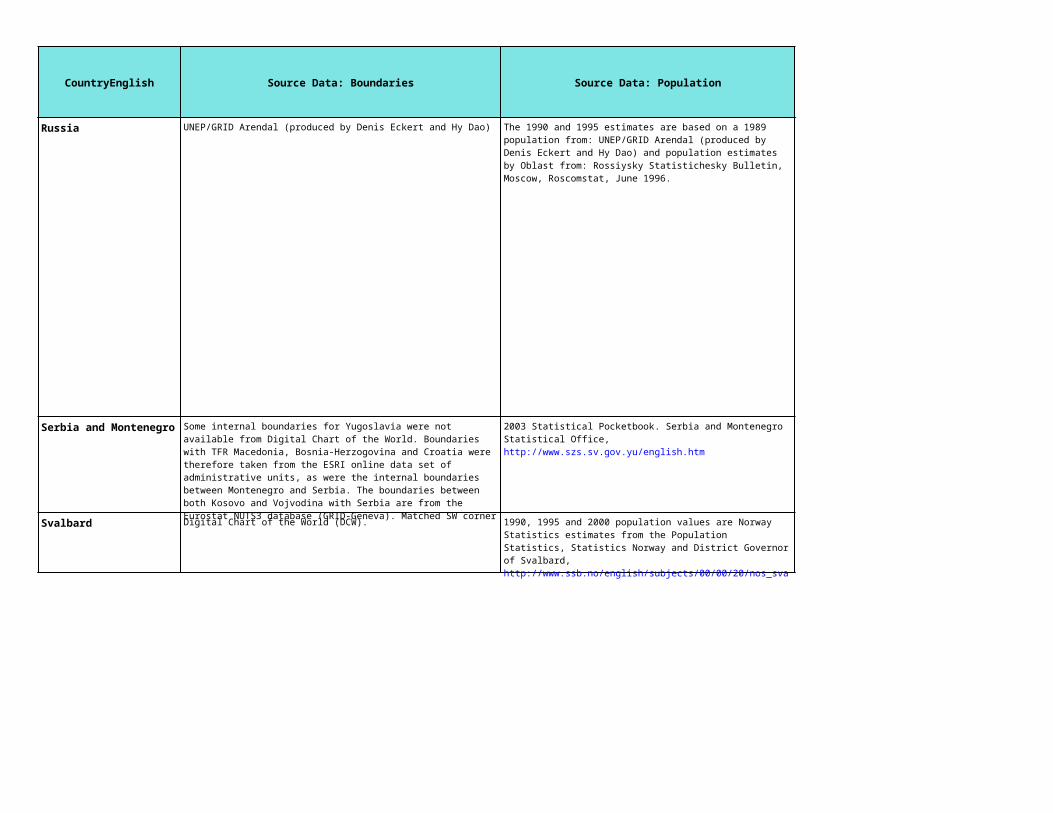
CountryEnglish
Russia
Serbia and Montenegro
Svalbard
Source Data: Boundaries Source Data: Population Edits and Notes: Spatial
UNEP/GRID Arendal (produced by Denis Eckert and Hy Dao)
Digital Chart of the World (DCW).
The 1990 and 1995 estimates are based on a 1989 population from: UNEP/GRID Arendal (produced by Denis Eckert and Hy Dao) and population estimates by Oblast from: Rossiysky Statistichesky Bulletin, Moscow, Roscomstat, June 1996.
Some internal boundaries for Yugoslavia were not available from Digital Chart of the World. Boundaries with TFR Macedonia, Bosnia-Herzogovina and Croatia were therefore taken from the ESRI online data set of administrative units, as were the internal boundaries between Montenegro and Serbia. The boundaries between both Kosovo and Vojvodina with Serbia are from the Eurostat NUTS3 database (GRID-Geneva). Matched SW corner border with TFR Macedonia.
2003 Statistical Pocketbook. Serbia and Montenegro Statistical Office, http://www.szs.sv.gov.yu/english.htm
1990, 1995 and 2000 population values are Norway Statistics estimates from the Population Statistics, Statistics Norway and District Governor of Svalbard, http://www.ssb.no/english/subjects/00/00/20/nos_svalbard_en/nos_d253_en/tab/t-45.html

CountryEnglish
San Marino
Slovakia
Slovenia
Source Data: Boundaries Source Data: Population Edits and Notes: Spatial
The shapefile was taken from the Italy boundary data from Seamless Administrative Boundaries of Europe (SABE) distributed by Eurographics [http://www.eurogeographics.org/eng/03_projects_sabe.asps] (SABE 2001 date of release : February 2003).
The 2000 total population of San Marino is estimated as 26,628 from the Web site: http://www.coe.int/T/E/Social_cohesion/Population/Demographic_Year_Book/2001_Edition/San%20Marino%202001.asp.
The 1995 population estimated is based on the 1991 population from Sistema Statistico Nazionale Istituto Nazionale di Statistico Annuario Statistico Italiano 1995 and 1997 population from Movimento E Calcolo Della Popolazione Residente Secondo Le Risultanze Anagrafiche Anno 1997.
The 1990 population is estimated based on 1989 population from Eurostat and 991 population from Sistema Statistico Nazionale Istituto Nazionale di Statistico Annuario Statistico Italiano 1995.
Seamless Administrative Boundaries of Europe (SABE) distributed by Eurographics: http://www.eurogeographics.org/eng/03_projects_sabe.asps (SABE 2001 date of release : February 2003).
2001 Slovakia Census from Statistickiy Lexicon Obci Sr 2003, Perfekt,a.s., Karpatska 7, 811 05 Bratislava.
Seamless Administrative Boundaries of Europe (SABE) distributed by Eurographics: http://www.eurogeographics.org/eng/03_projects_sabe.asps (SABE 2001 date of release : February 2003).
Census 2002, Statistical Office of the Republic of Slovenia, http://www.stat.si/pxweb/Database/Census2002/Census2002.asp .
The 1995 population was caluclated based on the Population for 1996 and 1997 from: Statistical Office of the Republic of Slovenia - Central Population Register of the Republic of Slovenia, Ministry of the Interior, Office of Immigration and Refugees.

CountryEnglish
Sweden
Ukraine
Holy See
Source Data: Boundaries Source Data: Population Edits and Notes: Spatial
Seamless Administrative Boundaries of Europe (SABE) distributed by Eurographics: http://www.eurogeographics.org/eng/03_projects_sabe.asps (SABE 2001 date of release : February 2003).
Data for 1995 from: Statistik uden Graenser, Nordisk statistik pa cd-rom 1997 (Nordic Statistics on CD-Rom 1997). Published by the Statistics Offices of : Iceland, Danmark, Sweden, Greenland, Faroe, Finland and Norway.
Data for 2002 from Statistics Sweden. url: Source: http://www.scb.se/statistik/be0101/be0101tab3beforandr02eng.aspDownloaded August 2003.
Australian Centre of the Asian Spatial Information and Analysis Network (ACASIAN).
1989 Rayon population from ACASIAN.
2004 Oblast population figures via the State Statistics Office of Ukraine, http://www.ukrstat.gov.ua/ .
The shapefile was taken from the Italy's boundary from Seamless Administrative Boundaries of Europe (SABE) distributed by Eurographics [http://www.eurogeographics.org/eng/03_projects_sabe.asps] (SABE 2001 date of release : February 2003).
The 2003 population estimate is from the CIA World Factbook, http://www.cia.gov/cia/publications/factbook/print/vt.html .
The 1986 pop estimate was from the UN Statistics Division Commo Database, http://unstats.un.org/unsd/cdbdemo/cdb_years_on_top.asp?srID=14720&crID=336&

CountryEnglish
Ireland
Poland
Aruba
Anguilla
Source Data: Boundaries Source Data: Population Edits and Notes: Spatial
Centro Internacional de Agricultural Tropical (CIAT).
Digital Chart of the World (DCW).
Seamless Administrative Boundaries of Europe (SABE) distributed by Eurographics: http://www.eurogeographics.org/eng/03_projects_sabe.asps (SABE 2001 date of release : February 2003).
Census 2002 Preliminary Report, Central Statistics Office, Dublin, Ireland: http://www.cso.ie/census/preliminary.htm .
Seamless Administrative Boundaries of Europe (SABE) distributed by Eurographics: http://www.eurogeographics.org/eng/03_projects_sabe.asps (SABE 2001 date of release : February 2003).
Downloaded from the Regional Data Bank, Polish Official Statistics, http://www.stat.gov.pl/english/index.htm, Population by living location in a gmina (as of 31 XII) --Unit of measure: person.
United Nations. "World Population Prospects: 2000 Revision. Vol 1. Comprehensive Tables," UN: NY 2001. The values given are population estimates.
United Nations. "World Population Prospects: 2000 Revision. Vol 1. Comprehensive Tables," UN: NY 2001. The values given are population estimates.

CountryEnglish
Netherland Antilles
Antigua and Barbuda
Bahamas
Belize
Bermuda
Barbados
Source Data: Boundaries Source Data: Population Edits and Notes: Spatial
Centro Internacional de Agricultural Tropical (CIAT).
Digital Chart of the World (DCW).
Digital Chart of the World (DCW).
Digital Chart of the World (DCW) and World Vector Shoreline, http://www.ngdc.noaa.gov/mgg/shorelines/shorelines.html .
· Population for 1990 through 1999: Source-- Statistical Yearbook Netherlands Antilles 2000, Central Bureau of Statistics, Willemstad, March 2001.
· 2001 population from the The Fourth Population and Housing Census Netherlands Antilles 2001. Central Bureau of Statistics Netherlands Antilles, http://www.central-bureau-of-statistics.an/census.asp .
The Geozone (administrative level 2) boundary for the Island of Curacao was digitized from a paper map from the Central Bureau of Statistics, Netherland Antilles.
United Nations. "World Population Prospects: 2000 Revision. Vol 1. Comprehensive Tables," UN: NY 2001. The values given are population estimates.
The Official Site of the The Commonwealth of the Bahamas. Total Population by Sex and by Island and Number of Households 2000 Census, http://www.bahamas.gov.bs/BahamasWeb/aboutbahamas.nsf/Subjects/General+Statistics .
· Spanish Wells Is and Harbor are merged with Eleutera.· Rum Cay is merged with Long Island.
Mapa de la Regionalización de la República de Guatemala. Ministerio de Agricultura. Escala 1:750000. Copia heliográfica. Prepared by the Centro Internacional de Agricultural Tropical (CIAT).
National Population and Housing Census 2000 and 1991 from the Central Statistical Office, Ministry of Finance.
United Nations. "World Population Prospects: 2000 Revision. Vol 1. Comprehensive Tables," UN: NY 2001. The values given are population estimates.
United Nations. "World Population Prospects: 2000 Revision. Vol 1. Comprehensive Tables," UN: NY 2001. The values given are population estimates.

CountryEnglish
Canada
Costa Rica
Source Data: Boundaries Source Data: Population Edits and Notes: Spatial
Statistics Canada Statistics Canada
Instituto Geográfico Nacional. 1984. Mapa de Provincias y Cantones. Escala 1:1500000 Prepared by the Centro Internacional de Agricultural Tropical (CIAT).
Instituto Nacional de Estadística y Censos, INEC. IX Censo Nacional de Población y Vivivenda del 2000. <http://www.meic.go.cr/>.
The population data used in 1996 were estimations done by INEC, from "VIII Censo Nacional de Población 1984"
The name of the municipio "Leon Cortes Castro" in San Jose Department lacks confirmation

CountryEnglish
Cuba
Cayman Islands
Commonwealth of Dominica
Source Data: Boundaries Source Data: Population Edits and Notes: Spatial
Digital Chart of the World (DCW).
Digital Chart of the World (DCW).
Population for 1991 from Census of Cuba 1991 - digital data from the United Nations Statistics Division's Software Development Project.
Population 2000 from the Anuario Estadistico de Cuba 2000 from the Oficina Nacional de Estadisticas.
Cayman Census, 1989: http://www.columbiagazetteer.org/
Cayman Census, 1999: http://www.caymanislands.ky/tour_guide/population.asp
Commonwealth of Dominica. Demographic Statistics, No.2, 1996. Central Statistical Office, Ministry of Finance. Roseau, Dominica.
Internal boundaries digitized from a map from the Statistical Office included in the report - Commonwealth of Dominica. Demographic Statistics, No.2, 1996. Central Statistical Office, Ministry of Finance. Roseau, Dominica.

CountryEnglish
Dominican Republic
Guadeloupe
Grenada
Source Data: Boundaries Source Data: Population Edits and Notes: Spatial
Digital Chart of the World (DCW).
Mapa de la República Dominicana. Confeccionado por el Instituto Geográfico Universitario. 1985. Escala 1:600000.
2002 population data obtained from the Dominican Republic National Office of Statistics Census 2002, http://www.one.gov.do/datos2002.htm (Oficina Nacional de Estadísticas, VIII Censo Nacional de Población y Vivienda 2002, Resultados Preliminares).
1993 population data from: Censos Nacional de Poblacio y Vivienda 1993, http://www.one.gov.do/datos.htm
National boundaries via Digital Chart of the World (DCW).
Commune boundaries were digitized based on a map downloaded from Petit Atlas de France, La France. Département de la Guadeloupe, http://www.france.diplomatie.fr/france/fr/geo/atlas/atlas23.html .
1999 Commune population data from Recensement (INSEE) 1999, www.insee.fr .
1990 Commune population data from the National Institute of Statistics and Economic Studies (INSEE): http://www.insee.fr/ .
United Nations. "World Population Prospects: 2000 Revision. Vol 1. Comprehensive Tables," UN: NY 2001. The values given are population estimates.

CountryEnglish
Greenland
Source Data: Boundaries Source Data: Population Edits and Notes: Spatial
Statistics GreenlandStatistical Yearbook of Greenland 1997
ESRI level one shapefile from ArcWorld
The 14 largest towns from the Statistical Yearbook were included as polygons in the coverage. These account for about 80% of the population.

CountryEnglish
Guatemala
Source Data: Boundaries Source Data: Population Edits and Notes: Spatial
Mapa de la Regionalización de la República de Guatemala. Ministerio de Agricultura. Escala 1:750000. Copia Heliográfica. Prepared by the Centro Internacional de Agricultural Tropical (CIAT).
1994 population from: Instituto Nacional de Estadística, INE. 1996. República de Guatemala. Características Generales de Población y Habitación. Guatemala. 2002 population from: Republica de Guatemala. Instituto Nacional de Estadistica. Censo Nacionales XI de Poblacion y VI de Habitacion 2002, http://www.censos.gob.gt/
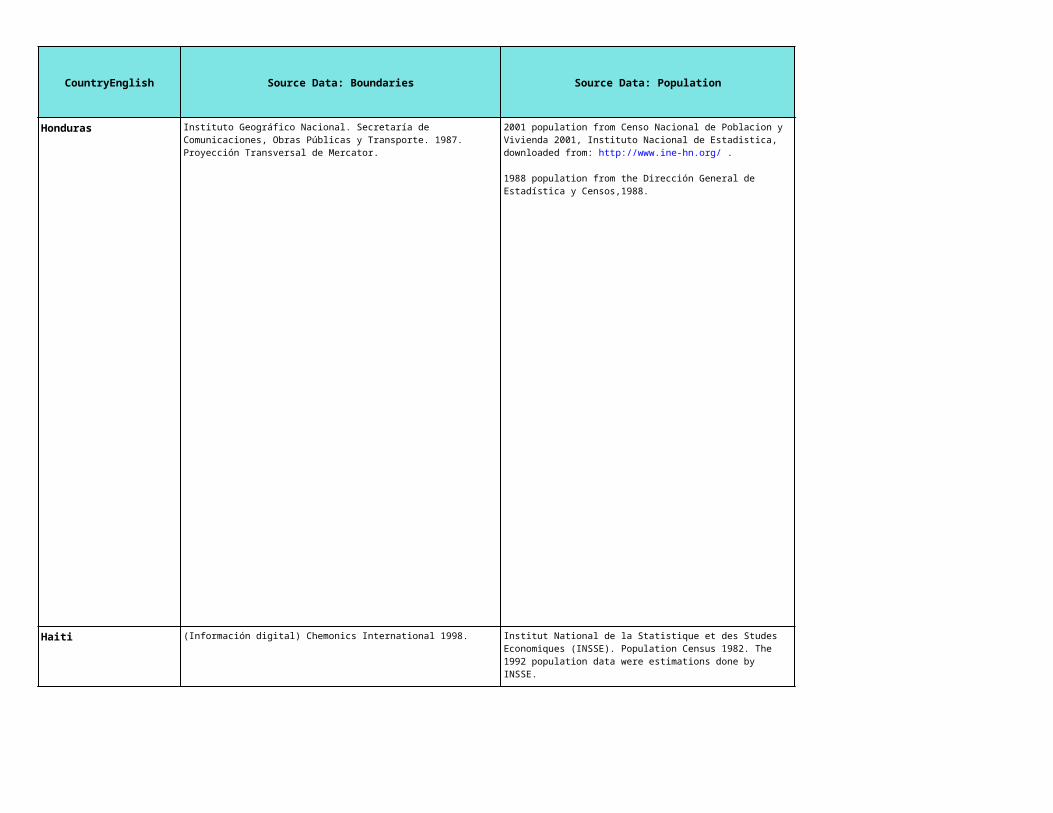
CountryEnglish
Honduras
Haiti
Source Data: Boundaries Source Data: Population Edits and Notes: Spatial
(Información digital) Chemonics International 1998.
Instituto Geográfico Nacional. Secretaría de Comunicaciones, Obras Públicas y Transporte. 1987. Proyección Transversal de Mercator.
2001 population from Censo Nacional de Poblacion y Vivienda 2001, Instituto Nacional de Estadistica, downloaded from: http://www.ine-hn.org/ .
1988 population from the Dirección General de Estadística y Censos,1988.
Levels and Scales:Departamento de Atlántida 1:200000 713 fb /1985Departamento de Choluteca 1:200000 713 fb /1988Departamento de Colon 1:200000 713 fb /1987Departamento de Comayagua 1:200000 713 fb /1987Departamento de Copan 1:200000 713 fb /1986Departamento de Cortes 1:200000 713 fb /1989Departamento de Fco. Morazan 1:200000 713 fb /1989Departamento de Paraíso 1:230000 713 fb /1988Dpto. Gracias a Dios 1:300000 713 fb /1990Dpto. Intibuca 1:150000 713 fb /1986Dpto. Islas de la Bahía 1:200000 713 fb /1986Dpto. La Paz 1:120000 713 fb /1988Dpto. de Lempira 1:200000 713 fb /1988Dpto. Ocotepeque 1:120000 713 fb /1988Dpto. de Olancho 1:350000 713 fb /1988Dpto. Santa Barbara 1:200000 713 fb /1987Dpto. Valle 1:200000 713 fb /1986Dpto. de Yoro 1:230000 713 fb /1987
Institut National de la Statistique et des Studes Economiques (INSSE). Population Census 1982. The 1992 population data were estimations done by INSSE.

CountryEnglish
Jamaica
Saint Kitts and Nevis
Saint Lucia
Source Data: Boundaries Source Data: Population Edits and Notes: Spatial
World Boundary Databank II
Digital Chart of the World (DCW).
Digital Chart of the World (DCW).
Population Census 2001 Jamaica, Volume 1, Country Report and Preliminary Report for 1991's Urban /Rural
United Nations. "World Population Prospects: 2000 Revision. Vol 1. Comprehensive Tables," UN: NY 2001. The values given are population estimates.
"World Population Prospects: 2000 Revision. Vol 1. Comprehensive Tables," UN: NY 2001. The values given are for estimates.

CountryEnglish
Mexico
Source Data: Boundaries Source Data: Population Edits and Notes: Spatial
Mapa Geoestadístico. Secretaría de Programación y Presupuesto (S.P.P.). 1981. Escala 1:1000000 con información del X Censo de Población y Vivienda de 1980. 4 hojas (pages): Norte, Centro, Noroeste y Sudeste. The Oaxaca internal boundaries from CIESIN's Georeferenced Population Datasets of Mexico - GIS Coverage of Mexican Localities, http://sedac.ciesin.columbia.edu/home-page/mexico.html
1990 and 2000 municpio data downloaded from SIMBAD, 28 April 2004; Database: Base de Datos Municipal INEGI from http://www.inegi.gob.mx/inegi/default.asp .
The Estado of Oaxaca was taken from a different source and merged with the rest of the Mexico estados

CountryEnglish
Montserrat
Martinique
Source Data: Boundaries Source Data: Population Edits and Notes: Spatial
Digital Chart of the World (DCW).
Digital Chart of the World (DCW).
United Nations. "World Population Prospects: 2000 Revision. Vol 1. Comprehensive Tables," UN: NY 2001. The values given are population estimates.
United Nations. "World Population Prospects: 2000 Revision. Vol 1. Comprehensive Tables," UN: NY 2001. The values given are population estimates.

CountryEnglish
Nicaragua
Source Data: Boundaries Source Data: Population Edits and Notes: Spatial
Mapa de la División Político Administrativa, 1997. Proyección Transversal de Mercator. Escala: 1:750000.
Instituto Nacional de Estadística y Censos (INEI), 1996. Censos Nacionales 1995, Cifras Oficiales Finales. Managua, Nicaragua.

CountryEnglish
Panama
Puerto Rico
El Salvador
Source Data: Boundaries Source Data: Population Edits and Notes: Spatial
República de Panamá. Mapa Político. Instituto Geográfico Nacional "TOMMY GUARDIA". 1998. Escala: 1:1000000.
2000 Population: Dirección de Estadística y Censos, DEC. X Censo Nacional de Población y VI de Vivienda 2000. http://contraloria.gob.pa/
1990 Population: Direccion de Estadistica y Censo Censos nacionales de Poblacion Y Vivienda 13 Mayo de 1990 Cifras Preliminarios Junio de 1990
US Census Bureau, http://www.census.gov/ US Census Bureau: 1990 Decennial Census and 1997 Population Estimates
Dirección General de Estadística y Censos, Unidad de Cartografía 1987. Mapa de la República de El Salvador, División Político-Administrativa. Copia Heliográfica. Escala 1:200000.
Dirección General de Estadística y Censos. Censos de Población Y Vivienda, 1992 y 2002
The names for departments and municipios should not be considered definitive. Users of this data may want to confirm individual names of the units.
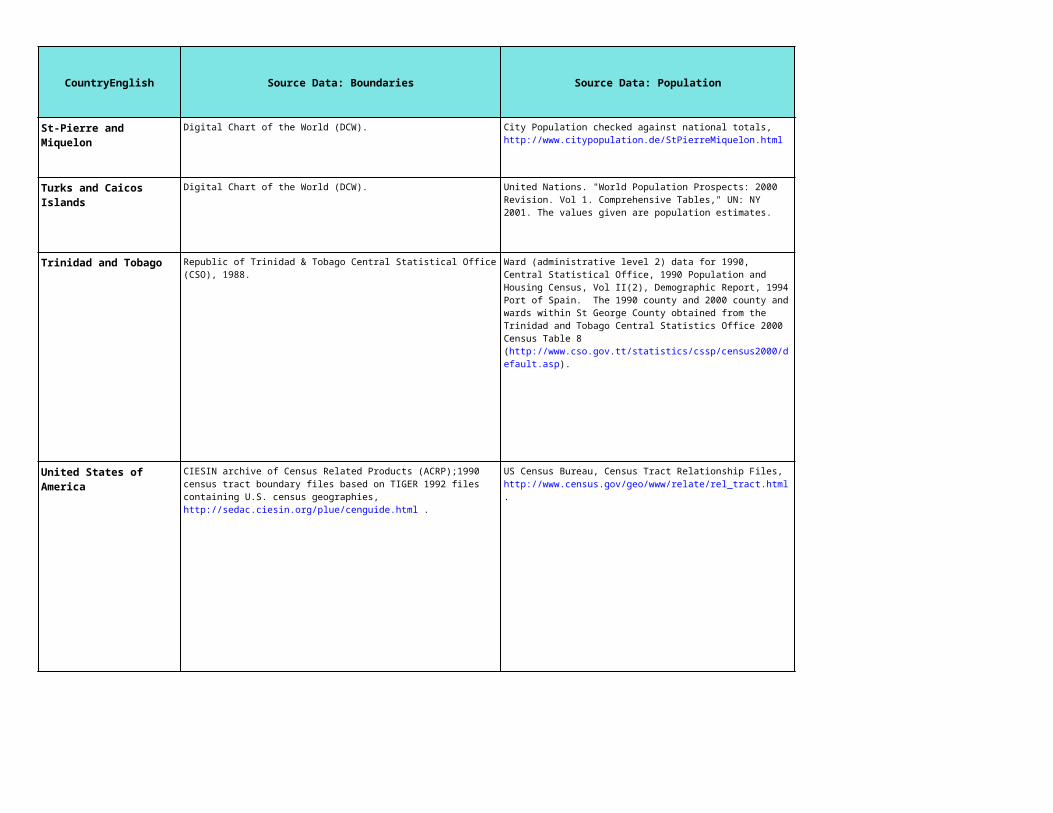
CountryEnglish
St-Pierre and Miquelon
Trinidad and Tobago
United States of America
Turks and Caicos Islands
Source Data: Boundaries Source Data: Population Edits and Notes: Spatial
Digital Chart of the World (DCW).
Digital Chart of the World (DCW).
Republic of Trinidad & Tobago Central Statistical Office (CSO), 1988.
City Population checked against national totals, http://www.citypopulation.de/StPierreMiquelon.html
Added island names from Le recensement de la population à Saint-Pierre-et-Miquelon. AOUT 2000 N° 731 (INSEE PDF)
United Nations. "World Population Prospects: 2000 Revision. Vol 1. Comprehensive Tables," UN: NY 2001. The values given are population estimates.
Ward (administrative level 2) data for 1990, Central Statistical Office, 1990 Population and Housing Census, Vol II(2), Demographic Report, 1994 Port of Spain. The 1990 county and 2000 county and wards within St George County obtained from the Trinidad and Tobago Central Statistics Office 2000 Census Table 8 (http://www.cso.gov.tt/statistics/cssp/census2000/default.asp).
Administrative level 1 data is used for all counties except for St. George County, which is further broken down into 6 towns and suburbs.
CIESIN archive of Census Related Products (ACRP);1990 census tract boundary files based on TIGER 1992 files containing U.S. census geographies, http://sedac.ciesin.org/plue/cenguide.html .
US Census Bureau, Census Tract Relationship Files, http://www.census.gov/geo/www/relate/rel_tract.html .

CountryEnglish
St. Vincent
British Virgin Islands
American Samoa
United States Virgin Islands
Source Data: Boundaries Source Data: Population Edits and Notes: Spatial
Digital Chart of the World (DCW). United Nations. "World Population Prospects: 2000 Revision. Vol 1. Comprehensive Tables," UN: NY 2001. The values given are population estimates.
The British Virgin Islands Welcome On-Line site: http://bviwelcome.com/
US Census Bureau Cartographic Boundary Files, http://www.census.gov/geo/www/cob/ .
US Census Bureau 2000 census data, http://factfinder.census.gov/servlet/DatasetMainPageServlet .
US Census Bureau, http://www.census.gov/geo/www/cob/co2000.html .
American Samoa, Department of Commerce, Statistics Division, http://www.amsamoa.com/statistics.htm .

CountryEnglish
Australia
Cook Islands
Fiji
Source Data: Boundaries Source Data: Population Edits and Notes: Spatial
Digital Chart of the World (DCW).
Fiji Land Processes Department.
ESRI Australia, http://www.esriau.com.au/ . 1996 census data for Statistical Local Area (SLA) population obtained from ESRI Australia, http://www.esriau.com.au/
State Level Population data from the Australian Bureau of Statistics:
* 2001 population from 2001 Census Basic Community Profiles and Snapshots, http://www.abs.gov.au/ausstats/[email protected]/Census_BCP_ASGC_ViewTemplate?ReadForm&Expand=1 * 1996 population from 1996 Census of Population and Housing - Basic Community Profiles, http://www.abs.gov.au/Web sitedbs/d3310108.nsf/f9996d24c8f22d024a256500001c8576/569af0d15c2201964a2565010007a32f!OpenDocument
Cook Islands Statistics Office, http://www.spc.int/prism/country/CK/stats/ .
The Northern Cook Islands were manually digitized based-upon visual inspection and coordinates available at http://kiaorana.com/star/maps.html and the NOAA coastline extractor, World Vector Shoreline, http://rimmer.ngdc.noaa.gov/coast/getcoast.html .
Population data provided by P. Naimila, Fiji Islands Bureau of Statistics, http://www.spc.int/prism/country/fj/stats/
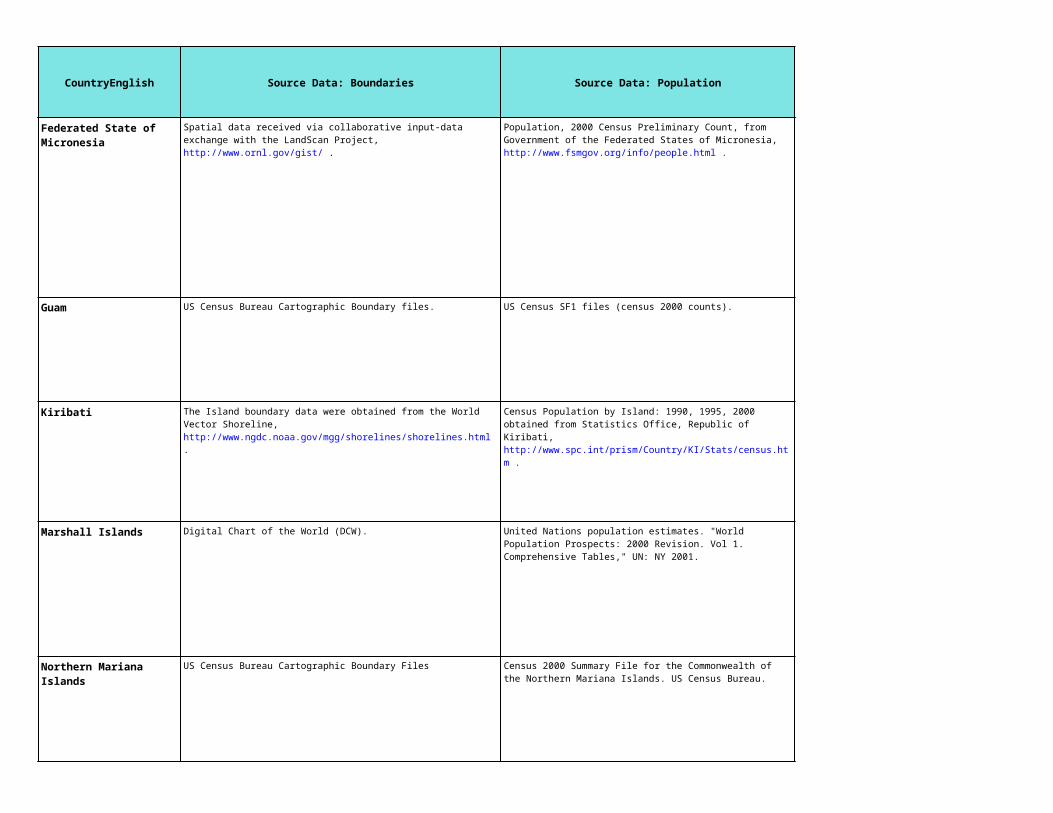
CountryEnglish
Guam
Kiribati
Marshall Islands
Federated State of Micronesia
Northern Mariana Islands
Source Data: Boundaries Source Data: Population Edits and Notes: Spatial
US Census Bureau Cartographic Boundary files. US Census SF1 files (census 2000 counts).
Digital Chart of the World (DCW).
US Census Bureau Cartographic Boundary Files
Spatial data received via collaborative input-data exchange with the LandScan Project, http://www.ornl.gov/gist/ .
Population, 2000 Census Preliminary Count, from Government of the Federated States of Micronesia, http://www.fsmgov.org/info/people.html .
The Island boundary data were obtained from the World Vector Shoreline, http://www.ngdc.noaa.gov/mgg/shorelines/shorelines.html .
Census Population by Island: 1990, 1995, 2000 obtained from Statistics Office, Republic of Kiribati, http://www.spc.int/prism/Country/KI/Stats/census.htm .
Polygons for the small islands of Banaba and Kuria part of the Gilbert Islands were added to the shapefile based on the interactive map as shown on the The Times Atlas of the World, 10th Edition, published by Crown Publishers, NY. Because these islands were rendered in a generalized way, they are not considered to be acurately georeferenced.
United Nations population estimates. "World Population Prospects: 2000 Revision. Vol 1. Comprehensive Tables," UN: NY 2001.
Census 2000 Summary File for the Commonwealth of the Northern Mariana Islands. US Census Bureau.

CountryEnglish
New Caledonia
Niue
Nauru
Source Data: Boundaries Source Data: Population Edits and Notes: Spatial
Digital Chart of the World (DCW).
Digital Chart of the World (DCW).
Digital Chart of the World (DCW).
Roos, William. 1997. Recensement de la Population de la Nouvelle-Calédonie. INSEE Premiere, N° 506 - JANVIER 1997. National Institute of Statistics and Economic Studies (INSEE), France.
The following units were aggregated to the island of Nouvelle Caledonie: Bouloupari, Bourail, Canala, Dumbea, Farino, Hienghene, Houailou, Kaala-Gomen, Kone, Koumac, La Foa, Moindou, Mont Dore, Ouegoa, Paita, Poindimie, Ponerihouen, Pouebo, Pouembout, Poum, Poya, Sarramea, Thio, Touho, Vou, Yate, Kouaoua. A separate polygon for Noumea was created using "split with line" in AV 3.2.
Niue 2001 Census of Population and Housing Report. Statistics Niue, http://www.gov.nu/stats/Census2001/Summary.htm .
The 1990 and 1995 population are from the UN World Population Prospects, 1998 Revision, United Nations Population Division, New York.
Ryan and Stepanoff (2000) project the total population of Nauru to reach 11,500 in 2000. (Ryan, C. and T. Stepanoff. 2000. Selected Pacific Economies: A Statistical Summary. Volume 15. SPC, Noumea.) The reference found via adb.org, publication, "The Contribution of Fisheries to the Economies of Pacific Island Countries"

CountryEnglish
New Zealand
Pitcairn
Palau
Source Data: Boundaries Source Data: Population Edits and Notes: Spatial
Ward level boundary coverage obtained from Statistics New Zealand.
Digital Chart of the World (DCW).
1991, 1996 and 2001 census population data obtained from Statistics New Zealand. Downloaded from http://www.stats.govt.nz/domino/external/pasfull/pasfull.nsf/web/Standard+Tables+2001+Census+of+Population+and+Dwellings%3A+Final+Counts+2001?open
United Nations population estimates: "World Population Prospects: 2000 Revision. Vol 1. Comprehensive Tables," UN: NY 2001.
Digital Chart of the World (DCW) and World Vector Shoreline, http://www.ngdc.noaa.gov/mgg/shorelines/shorelines.html .
Various Census Reports, 2000 Census of Population and Housing, and Office of Planning & Programming/UNDP-PSD Project Office computation, Ministry of Finance, Republic of Palau, http://www.palaugov.net/stats/ .
Via the World Vector Shorelines, http://www.ngdc.noaa.gov/mgg/shorelines/shorelines.html, the following Islands were added: Kayangel, Sonsorol, Peleliu, Angaur, and Merir.

CountryEnglish
Papua New Guinea
French Polynesia
Solomon Islands
Tonga
Source Data: Boundaries Source Data: Population Edits and Notes: Spatial
Digital Chart of the World (DCW).
Digital Chart of the World (DCW).
UN Statistics Division's Software Development Project, http://www.un.org/Depts/unsd/softproj/index.htm .
The PopMap map database included population figures for 1990.
1980 pop figures were available from official census publications 1980 National Population Census.
Final Figures: Provincial Summary National Statistical Office P.O. Wards Strip Port Moresby, Papua New Guinea December 1985
Institut de la Statistique de la Polynesie Francaise, http://www.ispf.pf/(xhaijxjsbngr2b553j3shc45)/index.aspx?choix=stat .
Solomon Islands 1999 Population and Housing Census, Main Results. Report to the Government of the Solomon Islands. Solomon Islands Census Office.
The Digital Chart of the World (DCW), except for the Vava'u and Niuas Island Groups which were taken from the World Vector Shorelines http://www.ngdc.noaa.gov/mgg/shorelines/shorelines.html .
1996 Census results from Tonga, http://www.tongatapu.net.to/tonga/news/facts.htm .
1986 Census from City Population, http://www.citypopulation.de/Tonga.html .

CountryEnglish
Tuvalu
Vanuatu
Wallis and Futuna
Western Samoa
Source Data: Boundaries Source Data: Population Edits and Notes: Spatial
Digital Chart of the World (DCW).
Digital Chart of the World (DCW).
Digital Chart of the World (DCW).
Niulakita located from World Vector Shoreline and merged with Digital Chart of the World (DCW) boundaries.
Government of Tuvalu, 1991 Census, downloaded from http://www.ffa.int/tuvalu.html .
Vanuatu Statistics Office, Facts on Population of Vanuatu, downloaded from http://www.spc.int/stats/vanuatu/About%20VNSO/Data/Social/Population.htm .
Principle results of census 1996. Statistques de Wallis et Futuna, http://www.wallis.co.nc/stats/Recensements/Recensement%201996.htm
The 2001 Population and Housing Census . Government of Samoa website at http://www.govt.ws/gi_listing.cfm

CountryEnglish
Argentina
Source Data: Boundaries Source Data: Population Edits and Notes: Spatial
Atlas de Suelos de la República Argentina. Inta y la Fundación Argentina. Prepared by the Centro Internacional de Agricultural Tropical (CIAT).
Provincia segun departamento. Poblacion censada en 1991 y 2001 y variacion intercensal aboluta y ralativa 1991-2001. Censo Nacional de Poblacion, Hogares y Viviendas del ano 2001. Instituto Nacional de Estadistica Y Censos Argentina. http://www.indec.mecon.ar/webcenso/index.asp

CountryEnglish
Bolivia
Brazil
Source Data: Boundaries Source Data: Population Edits and Notes: Spatial
International Geosphere-Biosphere Programme (IGBP) CD
Instituto Geográfico Militar. Mapa de la República de Bolivia. Escala 1:1500000. Proyección Cónica Comforme de Lambert. Prepared by the Centro Internacional de Agricultural Tropical (CIAT).
Instituto Nacional de estadística, INE. Indicadores Socio-demográficospor Provincias. Censo de 1992. La Paz, Bolivia. 2001 population from Censo de Poblacion y Vivienda, Instituto Nacional de estadística, INE.
Instituto Brasileiro de Geografia y Estatística, IBGE.Censo Demográfico 2000: http://www2.ibge.gov.br/pub/Censos/Censo_Demografico_2000/Dados_do_Universo/Taxa_crescimento_anual_1991_2000/
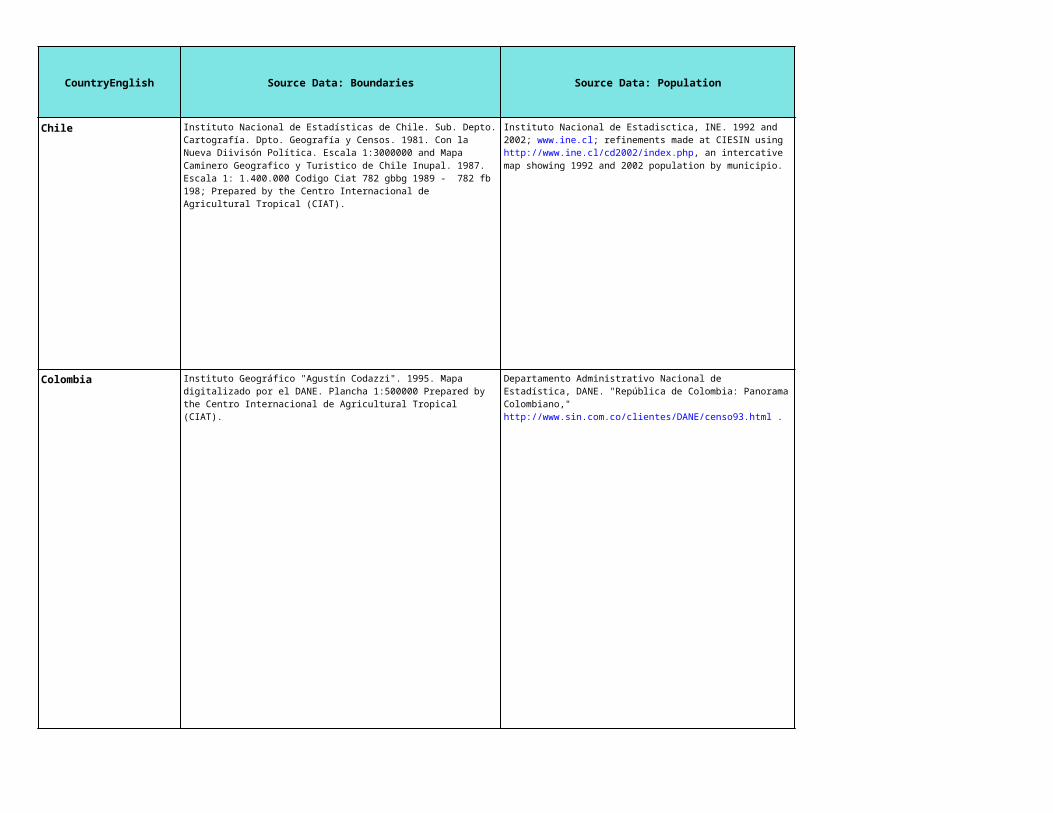
CountryEnglish
Chile
Colombia
Source Data: Boundaries Source Data: Population Edits and Notes: Spatial
Instituto Nacional de Estadísticas de Chile. Sub. Depto. Cartografía. Dpto. Geografía y Censos. 1981. Con la Nueva Diivisón Política. Escala 1:3000000 and Mapa Caminero Geografico y Turistico de Chile Inupal. 1987. Escala 1: 1.400.000 Codigo Ciat 782 gbbg 1989 - 782 fb 198; Prepared by the Centro Internacional de Agricultural Tropical (CIAT).
Instituto Nacional de Estadisctica, INE. 1992 and 2002; www.ine.cl; refinements made at CIESIN using http://www.ine.cl/cd2002/index.php, an intercative map showing 1992 and 2002 population by municipio.
Polygons for the small island municipios of Isla de Pascua and Juan Fernandez located in the Valparaiso region, were added to the original shapefile from Instituto Nacional de Estadísticas based on the interactive map available from the Chile census office, at http://www.ine.cl/cd2002/index.php . Because these islands were rendered in a generalized way, they are not considered to be acurately georeferenced.
Instituto Geográfico "Agustín Codazzi". 1995. Mapa digitalizado por el DANE. Plancha 1:500000 Prepared by the Centro Internacional de Agricultural Tropical (CIAT).
Departamento Administrativo Nacional de Estadística, DANE. "República de Colombia: Panorama Colombiano," http://www.sin.com.co/clientes/DANE/censo93.html .
Municipio names should be treated with caution for specific applications. These lack further confirmation.

CountryEnglish
Ecuador
Falkland Islands
French Guiana
Source Data: Boundaries Source Data: Population Edits and Notes: Spatial
Instituto Nacional de Estadística y Censos (INEC), 1990.
Digital Chart of the World (DCW)
Instituto Nacional de Estadística y Censos. Divisón Político Administrativa de la República del Ecuador. 1993. Planchas y escalas, Provincia de: Sucumbios 1:250000, Napo 1:250000, Pastaza 1:250000, Morona Santiago 1:250000, Zamora Chinchipe 1:250000, Esmeraldas 1:250000, Manabi 1:250000, Los Ríos 1:250000, Guayas 1:250000, Prov. El Oro 1:250000, Galápagos 1:500000, Carchi 1:250000, Imbabura 1:250000, Pichincha 1:250000, Cotopaxi 1:250000, Tungurahua 1:250000, Bolívar 1:250000, Chimborazo 1:250000, Canar 1:250000, Azuay 1:250000, Loja 1:250000. Prepared by the Centro Internacional de Agricultural Tropical (CIAT).
Falkland Islands Government: http://www.falklands.gov.fk/9ca.htm
Institute Geographique National. Carte Touristique Guyane au 1:500000, 1995
Institute National de la Statistique et des Etudes Economiques, INSEE, 1995. Tableux Economiques Régionaux. Guyane, 1995, and 1999 from www.recensement.insee.fr.

CountryEnglish
Guyana
Peru
Source Data: Boundaries Source Data: Population Edits and Notes: Spatial
Bureau of Statistics, 1991.Guyana North-East Sheet compiled in the Cartographic Division. Lands Department, Ministry of Agriculture
Instituto Geográfico Nacional. 1984. Mapa Físico Político del Perú. Proyección Mercator Transversa. Escala: 1:1000000. 4 hojas.
2000 population estimates and 1993 poulation census data provided by the Instituto Nacional de Estadística e Informática, INEI.

CountryEnglish
Paraguay
Suriname
Source Data: Boundaries Source Data: Population Edits and Notes: Spatial
General Bureau of Statistics, 1999
Dirección General de Estadística, Encuesta y Censos. FNUAP-PNUD. 1995. Atlas de Necesidades Básicas Insatisfechas del Paraguay.
Dirección Nacional de Estadística, Encuestas y Censos, DGEEC, 1995. Atlas del Paraguay 1995. Necesidades Básicas Insatisfechas, Asunción, Paraguay. Dirección General de Estadística, Encuestas y Censos, 2002.
Based on maps downloaded from Dirección General de Estadística, Encuestas y Censos, url: http://www.dgeec.gov.py, the following edits are made:
(1) digitized Boqueron from 3 into 6 polys adding Neuland, Menno, and Fernheim. (2) digitized Pres. Hayes from 4 into 7 polygons adding: Neuland, Menno, and Fernheim.

CountryEnglish
Uruguay
Venezuela
Source Data: Boundaries Source Data: Population Edits and Notes: Spatial
Servicio Geográfico Militar. 1992. Mapa de la República Oriental del Uruguay, Carta Geográfica División Política. Escala: 1:500000. Prepared by the Centro Internacional de Agricultural Tropical (CIAT).
Instituto Nacional de Estadística, INE, Censos de Población 1985 y 1996.
Oficina Central de Estadística e Informática Presidencia de la República. Dirección de Geografía y Cartografía. 1993. Mapa de la División Política Territorial de Venezuela. Copia Heliográfica. Prepared by the Centro Internacional de Agricultural Tropical (CIAT).
Instituto Nacional de Estadística, Republica Bolivariana de Venezuela. XIII Censos General de Poblacio y Vivienda, Primeros Resultados, Censo 2001. Downloaded from: http://www.ine.gov.ve/ine/censo/fichascenso/fichacenso.asp
The internal boundary for the provinces of Amazonas and Yaracuy are digitized based on a map from the Census 2001 province reports, donwloaded from: http://www.ine.gov.ve/ine/censo/censo.htm#. For the estado of Dependencia Federelas, the islands of Archipelago de los Roques and Chimanas were extracted from Digital Chart of the World (DCW) and addded to the boundary file.

CountryEnglish
Angola
Burundi
Benin
Burkina Faso
Edits and Notes: Population
8 2,503,503 76,053 539,394.25 6 556
15 397,148 4,887 51,403.07 15 138
38 781,469 1,416 61,633.82 36 195
205 892,916 6,701 21,582.30 93 370
Num Settlement
PointsLargest Point
(pop)Smallest
Point (pop)Mean Point
(pop)Urban
Criteria (UN)
Num Urban Extents
Largest Extent (sq.km)
The last Angolan census was carried out in 1970. All population data published in the Statistical Yearbooks and other publications (e.g., the Economist's Intelligence Unit Report) are estimates that were produced by the National Statistics Institute, in 1987, based on the 1970 data. Due to civil war, considerable displacement of people has taken place since the 1970 census. Thus, population figures should be interpreted with caution. The base year population use here was 1990 projected population from the INE publication in 1987 and were extrapolated to 1995 and 2000 using growth rates derived from United Nations national level estimates and projections.
Localities with a population of 2,000 or more.
9 population units were consolidated to match to the shapefile single unit: Nyabigina (Buj) /Bujumbura. These are: Buyenzi (36,782), Bwiza (35425), Cibitoke (47,061), Kamenge (55,653), Kinama (33,858), Musaga (39,337), Ngagara (19762), Nyakabiga (21,229), and Rohero (29,991).
Commune of Bujumbura.
Population data were extrapolated to target years of 1990, 1995 and 2000 using growth rates derived from United Nations national level estimates and projections.
Localities with 10,000 inhabitants or more.
A population growth rate between 1990 and 1996 was calculated via an aggregation of the spatial and population data to 20 units. This growth rate was applied to the departments (administrative level 2) in order to extrapolate to the target years of 1990, 1995, and 2000.
Fourteen towns.

CountryEnglish
Botswana
Central African Republic
Edits and Notes: PopulationNum
Settlement Points
Largest Point (pop)
Smallest Point (pop)
Mean Point (pop)
Urban Criteria
(UN)Num Urban
ExtentsLargest Extent (sq.km)
67 194,098 1,057 14,505.93 28 392
37 648,782 6,063 38,243.27 31 249
Agglomerations of 5,000 inhabitants or more where 75 per cent of the economic activity is non-agricultural.
Population data were projected to the target years 1990, 1995, and 2000 using growth rates derived from United Nations national level estimates and projections.
Twenty principal centres with a population of over 3,000 each.

CountryEnglish
Ivory Coast
Edits and Notes: PopulationNum
Settlement Points
Largest Point (pop)
Smallest Point (pop)
Mean Point (pop)
Urban Criteria
(UN)Num Urban
ExtentsLargest Extent (sq.km)
76 3,099,196 1,555 89,946.36 67 661The 1998 census data was obtained for administrative level 2. This data is coarser than the 1988 census data which was obtained for administrative level 3. Thus, an administrative level 2 population growth rate was calculated for the period 1990–1998 and applied to the 1990 administrative level 3 units to extrapolate the population of these areas to 1995 and 2000.
Urban agglomerations containing more than 10,000 inhabitants; agglomerations with populations ranging from 4,000 to 10,000 persons with more than 50 per cent of the households en gaged in non-agricultural activities; and the admin istrative centres of Grand Lahoun and Dabakala. Excludes the milieu urbain of Bouna, which has a population of 11,000.

CountryEnglish
Cameroon
Edits and Notes: PopulationNum
Settlement Points
Largest Point (pop)
Smallest Point (pop)
Mean Point (pop)
Urban Criteria
(UN)Num Urban
ExtentsLargest Extent (sq.km)
166 1,512,379 1,038 42,558.47 101 384Population data were extrapolated to the target years of 1990, 1995 and 2000 using growth rates derived from United Nations national level estimates and projections.
Urban centres.

CountryEnglish
Congo
Congo, Democratic Republic
Edits and Notes: PopulationNum
Settlement Points
Largest Point (pop)
Smallest Point (pop)
Mean Point (pop)
Urban Criteria
(UN)Num Urban
ExtentsLargest Extent (sq.km)
182 4,593,037 1,987 85,776.80 148 575
22 1,251,376 10,293 118,479.68 21 329
Population data were extrapolated to the target years of 1990, 1995 and 2000 using growth rates derived from United Nations national level estimates and projections.
Places with 2,000 inhabitants or more where the predominant economic activity is non-agricultural; and places with fewer inhabitants which are considered urban because of their type of economic activity (predominantly non-agricultural).
District level data were available for 1974, but only province level data could be obtained for 1984. Province level growth rates were originally used for interpolation, except for communes (6 major cities) for which data was available for 1974 and 1984, for Brazzaville and Pointe Noire also for 1960 from UNSTAT. These cities were treated explicitly, while the residual population in the corresponding district was interpolated using aggregate province growth rates. These data were used to estimate population in 1990 at the district level. Population data were projected to the years 1995 and 2000 using growth rates derived from United Nations national level estimates and projections.
Communes of Brazzaville and Pointe-Noire.

CountryEnglish
Comoros
Cape Verde
Djibouti
Edits and Notes: PopulationNum
Settlement Points
Largest Point (pop)
Smallest Point (pop)
Mean Point (pop)
Urban Criteria
(UN)Num Urban
ExtentsLargest Extent (sq.km)
93 36,753 1,004 3,569.98 5 70
16 94,757 1,800 14,498.56 8 61
5 407,186 6,183 88,114.40 5 88
A population growth rate was calculated between 1991 and 1996 (1997 for Mayotte) to extrapolate the population data to target years.
Administrative centres of prefec tures and localities with 5,000 inhabitants or more.
A population growth rate was calculated between 1990 and 2000 to extrapolate the population data to target years.
Not available.
The 1998 population estimates were converted from percentages to counts.
Djibouti (capital city).
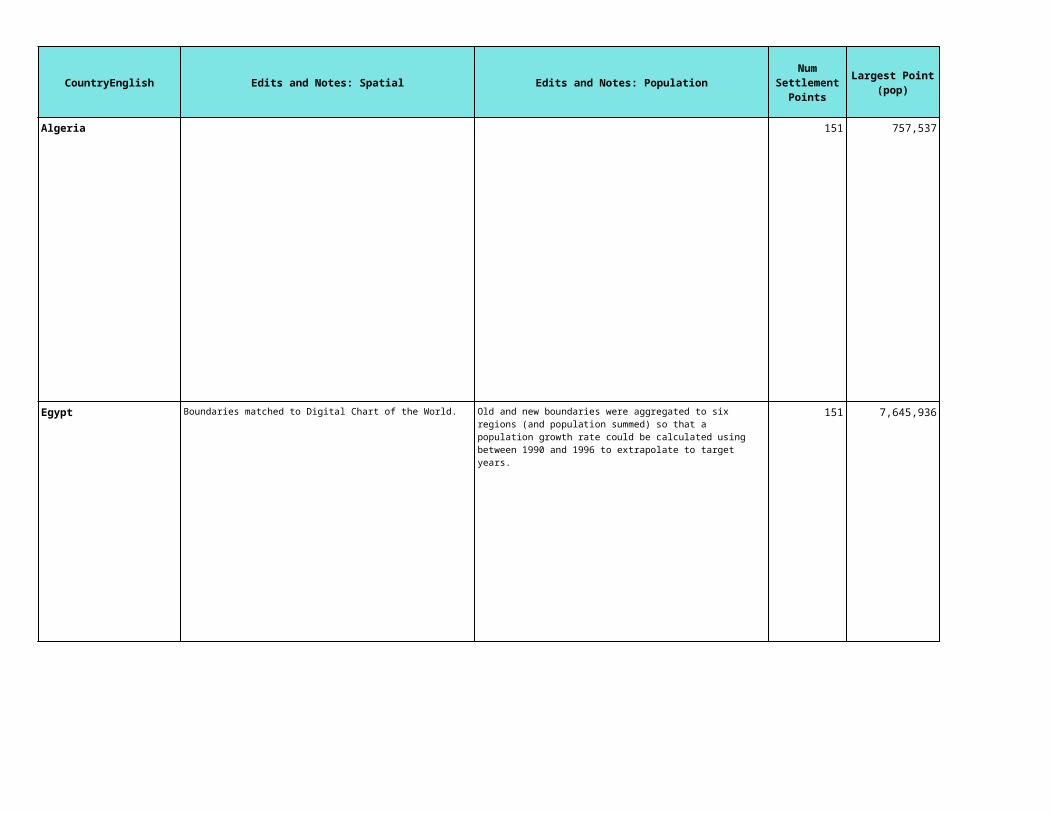
CountryEnglish
Algeria
Egypt
Edits and Notes: PopulationNum
Settlement Points
Largest Point (pop)
Smallest Point (pop)
Mean Point (pop)
Urban Criteria
(UN)Num Urban
ExtentsLargest Extent (sq.km)
151 757,537 4,213 68,918.32 116 2,147
151 7,645,936 13,595 186,218.13 60 10,893
All communes having as chef-lieu either a city, a rural town or an urban agglomeration.
Old and new boundaries were aggregated to six regions (and population summed) so that a population growth rate could be calculated using between 1990 and 1996 to extrapolate to target years.
Governorates of Cairo, Alexandria, Port Said, Ismailia and Suez; frontier governorates; and capitals of other governorates as well as district capitals (markaz).

CountryEnglish
Eritrea
Ethiopia
Gabon
Edits and Notes: PopulationNum
Settlement Points
Largest Point (pop)
Smallest Point (pop)
Mean Point (pop)
Urban Criteria
(UN)Num Urban
ExtentsLargest Extent (sq.km)
9 529,985 13,746 90,781.33 9 131
407 2,890,947 1,036 20,295.80 207 588
35 566,225 1,022 28,133.74 29 281
Population data were projected from 1990 to 1995 and 2000 using growth rates derived from United Nations national level estimates and projections.
Localities with 2,000 inhabitants or more.
Population for “Dire Dawa Town” was added to “Gurgura Wereda” as the town population from the census is within this unit; “Mekele Wereda” was relabeled in the census data from Region 1, Zone 4, Wereda 9 to Region 1, Zone 5, Wereda 1 to match spatial data; For the two regions that had no census data, population for the units was estimated based on input data used in GPW version 2 for the years 1984-86. Several units in these regions did not match spatially.The new and old units were intersected and population was allocated proportionally to the new areas.
1994 population data were projected to the years 1990, 1995 and 2000 using growth rates derived from United Nations national level estimates and projections.
Localities with 2,000 inhabitants or more.
Subnational and national population figures for Gabon are very inconsistent. Instead of using the raw figures, the final estimates are based on the proportion of a sub-units population of the national total. These proportions were then applied to the UN estimates. Population data were projected to the year 2000 using growth rates derived from United Nations national level estimates and projections.
Towns with 2,000 inhabitants or more.

CountryEnglish
Ghana
Guinea
Edits and Notes: PopulationNum
Settlement Points
Largest Point (pop)
Smallest Point (pop)
Mean Point (pop)
Urban Criteria
(UN)Num Urban
ExtentsLargest Extent (sq.km)
175 1,664,978 1,470 39,559.10 113 813
44 1,484,399 3,477 112,227.39 36 222
Data were projected using artificially constructed regions. The data were aggregated to six regions and regional growth rates were subsequently applied to corresponding districts, to generate population estimates of 1990 and 1995 at a spatial resolution consistent with the year 2000 spatial units.
Localities with 5,000 inhabitants or more.
A population growth rate was calculated between 1990 and 1996 to extrapolate to the target years of 1995 and 2000.
Urban centres.

CountryEnglish
Gambia
Guinea-Bissau
Equatorial Guinea
Edits and Notes: PopulationNum
Settlement Points
Largest Point (pop)
Smallest Point (pop)
Mean Point (pop)
Urban Criteria
(UN)Num Urban
ExtentsLargest Extent (sq.km)
96 62,954 1,395 8,051.64 19 158
19 280,913 1,294 24,139.53 11 75
15 85,408 1,393 15,973.67 9 39
A population growth rate was calculated between 1990 and 1993 to extrapolate to the target years of 1995 and 2000.
Local government areas of Banjul and Kanifing.
Population data were projected to 1995 and 2000 using growth rates derived from United Nations national level estimates and projections.
Not available.
Population data were projected to 1995 and 2000 using growth rates derived from United Nations national level estimates and projections.
District centres and localities with 300 dwellings or more or with 1,500 inhabitants or more.

CountryEnglish
Kenya
Liberia
Edits and Notes: PopulationNum
Settlement Points
Largest Point (pop)
Smallest Point (pop)
Mean Point (pop)
Urban Criteria
(UN)Num Urban
ExtentsLargest Extent (sq.km)
77 2,251,564 1,056 63,264.73 72 1,198
27 731,014 1,328 44,847.11 16 74
A district (administrative level 2) growth rate (1989–1999) used to project Sublocation (adminstrative level 5) 1999 population to target years. 1999 districts related to 1989 districts based on data from IPUMS (www.ipums.org).
Towns with 2,000 inhabitants or more.
Population data were projected to 1995 and 2000 using growth rates derived from United Nations national level estimates and projections.
Localities with 2,000 inhabitants or more.
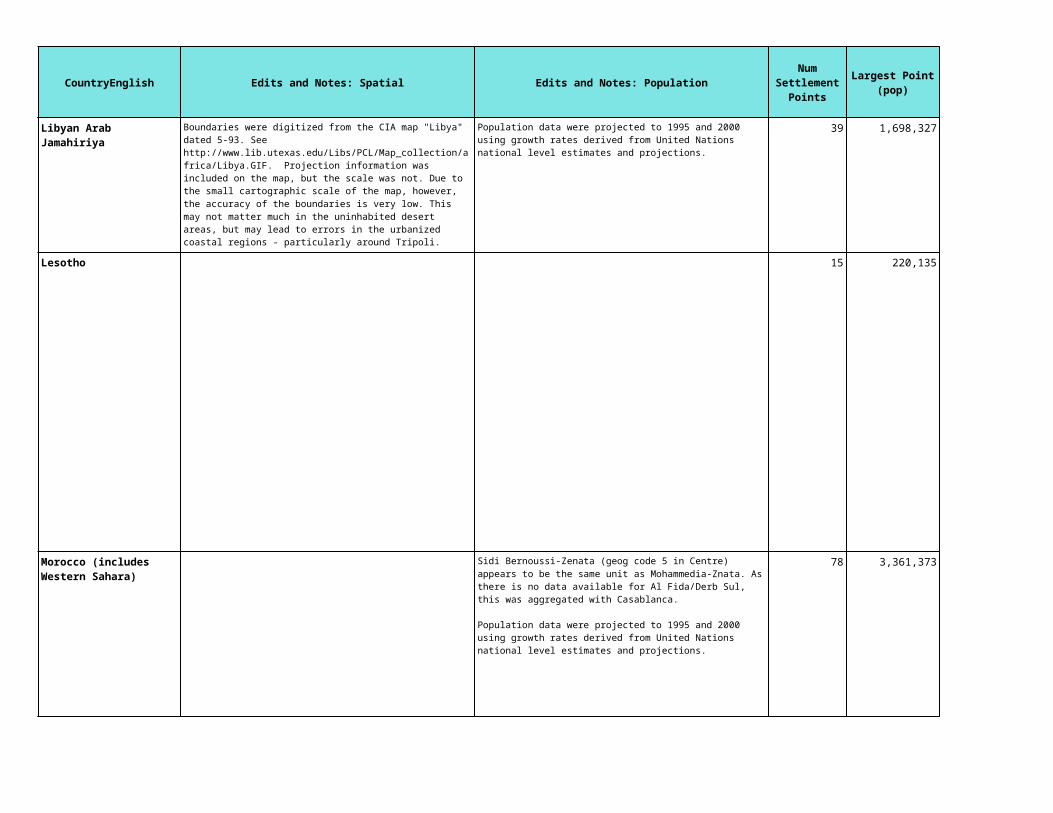
CountryEnglish
Libyan Arab Jamahiriya
Lesotho
Morocco (includes Western Sahara)
Edits and Notes: PopulationNum
Settlement Points
Largest Point (pop)
Smallest Point (pop)
Mean Point (pop)
Urban Criteria
(UN)Num Urban
ExtentsLargest Extent (sq.km)
39 1,698,327 10,190 123,541.67 30 2,418
15 220,135 2,540 31,475.33 13 186
78 3,361,373 20,562 183,845.90 69 1,784
Population data were projected to 1995 and 2000 using growth rates derived from United Nations national level estimates and projections.
Municipalities (baladiyas).
District headquarters and other set tlements with rapid population growth and with fa cilities that tend to encourage people to engage in economic activities that are non-agricultural in na ture.
Sidi Bernoussi-Zenata (geog code 5 in Centre) appears to be the same unit as Mohammedia-Znata. As there is no data available for Al Fida/Derb Sul, this was aggregated with Casablanca.
Population data were projected to 1995 and 2000 using growth rates derived from United Nations national level estimates and projections.
Urban centres.

CountryEnglish
Madagascar
Mali
Edits and Notes: PopulationNum
Settlement Points
Largest Point (pop)
Smallest Point (pop)
Mean Point (pop)
Urban Criteria
(UN)Num Urban
ExtentsLargest Extent (sq.km)
98 1,288,926 5,866 36,697.84 70 416
155 1,116,462 4,125 19,398.04 103 564
Prefecture-level growth rates from 1993-2001 were used to project population to the target years.
Centres with more than 5,000 in habitants.
Due to extensive boundary changes between 1990 and 1998, region (administrative 1 level) population growth rates were calculated between these two years and applied to the 1990 cercle (administrative 2 level) data to extrapolate to our target years of 1995 and 2000.
Localities with 5,000 inhabitants or more and district centres.

CountryEnglish
Mozambique
Edits and Notes: PopulationNum
Settlement Points
Largest Point (pop)
Smallest Point (pop)
Mean Point (pop)
Urban Criteria
(UN)Num Urban
ExtentsLargest Extent (sq.km)
78 1,155,086 1,710 67,762.58 69 324Province level growth rates (administrative level 1) from 1991–1997 were applied to the Posto (administrative level 3) units for projections.
From 1950 to 1970: Conselho of Maputo and Beira; in the 1980 census: 12 cities (nince provincial capitals and the cities of Nacala and Chokwe); in the 1997 census: 23 cities and 68 towns (vilas).

CountryEnglish
Mauritania
Mauritius
Edits and Notes: PopulationNum
Settlement Points
Largest Point (pop)
Smallest Point (pop)
Mean Point (pop)
Urban Criteria
(UN)Num Urban
ExtentsLargest Extent (sq.km)
28 746,466 1,020 50,185.39 13 278
94 127,855 1,043 11,074.09 4 941
Urban centres.
9 units confirmed by national office of statistics as having no population data. There are an additional 8 records relating to small islands with no discernable codes that could nor be formally verified.
National level growth rates from 1990-2000 applied across all the administrative units
Towns with proclaimed legal limits.

CountryEnglish
Malawi
Mayotte
Namibia
Edits and Notes: PopulationNum
Settlement Points
Largest Point (pop)
Smallest Point (pop)
Mean Point (pop)
Urban Criteria
(UN)Num Urban
ExtentsLargest Extent (sq.km)
35 584,020 1,592 53,856.43 31 451
3 38,255 11,932 20,940.33 2 30
34 209,477 2,296 18,645.26 15 408
Data were projected using a artificially constructed regions. Region-level growth rates (1987-98) were applied to the EA units to project population to the target years.
All townships, town planning areas and district centres.
The UN World Population Prospects does not report separate Populations for Mayotte and Comoros, so the UN estimates reported for Mayotte are the UN projection for the Total of the two, multiplied by the ratio of the Mayotte NSO projected population to the Total NSO projected population for the two for the given year.
Data were projected using 3 artificially-constructed 'super regions' by aggregating units so that there was correspondence between the spatial units across time. These rates of growth were then applied to the 2001 population distribution to estimate population in 1990, 1995, and 2000.
The district headquarters and other settlements of rapid population growth with facili ties that tend to encourage people to engage in non agricultural activities.
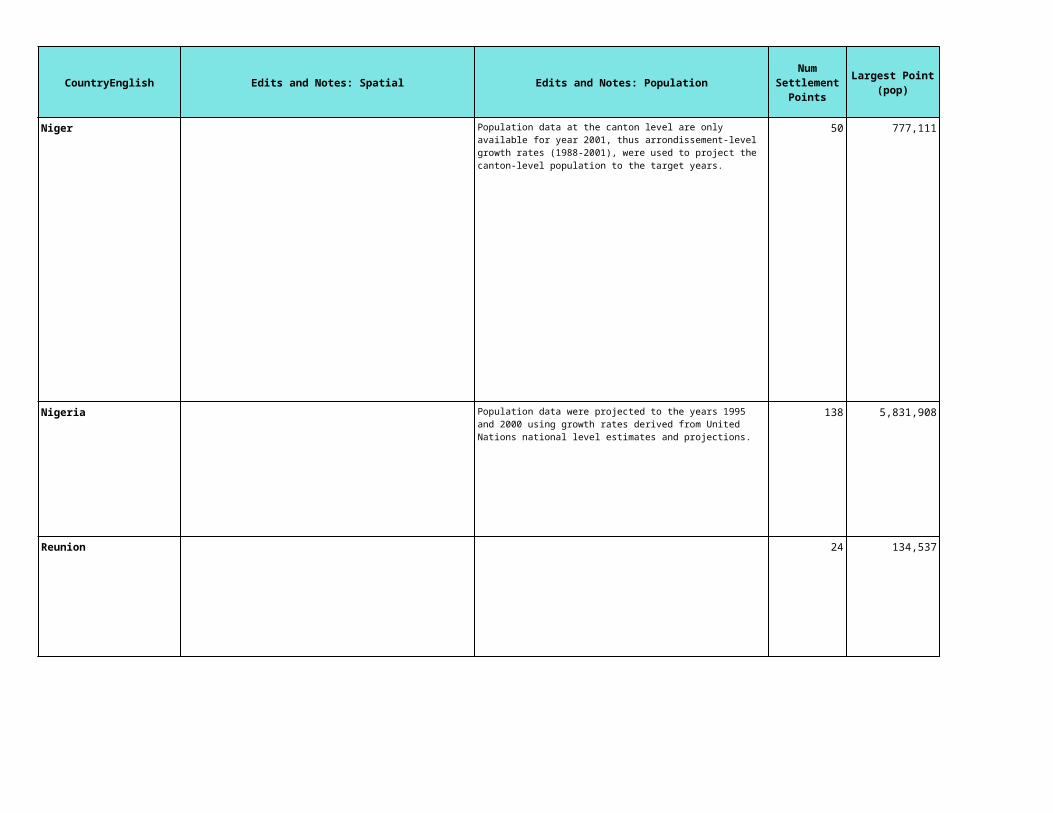
CountryEnglish
Niger
Nigeria
Reunion
Edits and Notes: PopulationNum
Settlement Points
Largest Point (pop)
Smallest Point (pop)
Mean Point (pop)
Urban Criteria
(UN)Num Urban
ExtentsLargest Extent (sq.km)
50 777,111 1,694 49,080.84 42 354
138 5,831,908 44,341 227,424.69 126 1,363
24 134,537 3,434 30,113.13 13 140
Population data at the canton level are only available for year 2001, thus arrondissement-level growth rates (1988-2001), were used to project the canton-level population to the target years.
Urban centres (27 towns).
Population data were projected to the years 1995 and 2000 using growth rates derived from United Nations national level estimates and projections.
Towns with 20,000 inhabitants or more whose occupations are not mainly agrarian.
Not available.

CountryEnglish
Rwanda
Sudan
Edits and Notes: PopulationNum
Settlement Points
Largest Point (pop)
Smallest Point (pop)
Mean Point (pop)
Urban Criteria
(UN)Num Urban
ExtentsLargest Extent (sq.km)
6 313,424 11,100 74,243.00 5 120
72 4,142,527 12,735 186,677.46 60 1,573
Population data were projected to the 1990, 1995 and 2000 using growth rates derived from United Nations national level estimates and projections.
Kigali; administrative centres of prefectures and important agglomerations and their surroundings.
Population figures for Kapoeta were reallocated to the remainder of Kapoeta, without proportional reduction in population, because it was considered unlikely that either Northern or Southern Sudan conducted a census in this region, due to lack of access and presumed cession to Kenya, respectively. P90 is based on the intercensal 83-93 growth rate for the districts (third level units) where available. Else they are based on region level growth rates for the areas not enumerated. For these, only 1993 estimates were available. Population data were projected to the years 1995 and 2000 using growth rates derived from United Nations national level estimates and projections.
Localities of administrative or com mercial importance or with a population of 5,000 inhabitants or more.

CountryEnglish
Senegal
St. Helena
Sierra Leone
Somalia
Edits and Notes: PopulationNum
Settlement Points
Largest Point (pop)
Smallest Point (pop)
Mean Point (pop)
Urban Criteria
(UN)Num Urban
ExtentsLargest Extent (sq.km)
71 2,094,716 1,434 64,236.35 42 297
N/A
77 865,888 1,175 25,399.04 36 91
8 1,118,395 22,496 244,628.75 7 171
Agglomerations of 10,000 inhabi tants or more.
Four units were missing from the boundary data. Their population were reassigned as follows: Dibia to Tinkatupa Maki Saffoko / Port Loko / Northern, Gbense to Kamara / Kono / Eastern , Panga Kim to Panga-Kabonde / Pujehun / Southern, Sowa to Panga-Kabonde / Pujehun / Southern)
Towns with 5,000 inhabitants or more.
Towns with 5,000 inhabitants or more.

CountryEnglish
Sao Tome and Principe
Swaziland
Seychelles
Edits and Notes: PopulationNum
Settlement Points
Largest Point (pop)
Smallest Point (pop)
Mean Point (pop)
Urban Criteria
(UN)Num Urban
ExtentsLargest Extent (sq.km)
11 61,797 2,201 11,206.91 1 47
12 68,607 1,214 13,297.42 6 584
4 36,218 2,315 10,881.00 1 120
Population data were projected to 1990, 1995 and 2000 using growth rates derived from United Nations national level estimates and projections. Population of the two islands estimated by distributing country level totals according to 1970 proportions.
Sao Tome and Pantufo.
Localities proclaimed as urban.
Population data were projected to the years 1995 and 2000 using growth rates derived from United Nations national level estimates and projections. Population of the two islands estimated by distributing country level totals according to 1977 proportions.
Victoria; for 1987 census, Victoria and other towns and townships (including Anse Boileau, Anse Royale, Cascade and Takamaka).

CountryEnglish
Chad
Togo
Edits and Notes: PopulationNum
Settlement Points
Largest Point (pop)
Smallest Point (pop)
Mean Point (pop)
Urban Criteria
(UN)Num Urban
ExtentsLargest Extent (sq.km)
52 647,874 1,020 29,559.50 38 177
45 679,667 1,540 43,633.47 32 271
Population data were projected to the year 2000 using growth rates derived from United Nations national level estimates and projections.
Administrative centres of prefectures, soul prefectures and administrative posts.
Population data were projected to the years 1995 and 2000 using growth rates derived from United Nations national level estimates and projections.
Seven urban communes.

CountryEnglish
Tunisia
United Rep. of Tanzania
Edits and Notes: PopulationNum
Settlement Points
Largest Point (pop)
Smallest Point (pop)
Mean Point (pop)
Urban Criteria
(UN)Num Urban
ExtentsLargest Extent (sq.km)
113 788,980 7,522 45,037.18 58 1,928
56 2,890,159 33,088 164,864.18 55 546
A population growth rate was calculated between 1984 to 1996 and 1996 to 2002 to extrapolate to the target years of 1990 to 2000.
Population living in communes.
The population figures of several administrative units were aggregated in order to match boundaries of the shapefile. (population units: 55 and shapefile units: 25). The maps on the Web site http://www.tanzania.go.tz/census/ were used as a guide for this process.
16 gazetted townships.

CountryEnglish
Uganda
South Africa
Edits and Notes: PopulationNum
Settlement Points
Largest Point (pop)
Smallest Point (pop)
Mean Point (pop)
Urban Criteria
(UN)Num Urban
ExtentsLargest Extent (sq.km)
68 1,235,194 2,195 40,931.25 47 563
310 2,332,338 5,481 96,333.14 199 7,841
Growth Rates from 1980 to 1991 were calculated for 28 artificial regions created from level one units so that population data from two time periods could be matched. The caculated growth rates are applied to 1991 parish population to project to 1990, 1995 and 2000.
Cities, municipalities, towns, town boards and all trading centers with a population over 1,000 persons.
Data were interpolated and extrapolated to 1990, 1995, and 2001 using a province level growth rates (1996-2001) applied to corresponding Enumeration Area sub-units.
All population agglomerations of an urban nature, without regard to local boundaries and status.

CountryEnglish
Zambia
Zimbabwe
Afghanistan
Edits and Notes: PopulationNum
Settlement Points
Largest Point (pop)
Smallest Point (pop)
Mean Point (pop)
Urban Criteria
(UN)Num Urban
ExtentsLargest Extent (sq.km)
44 903,118 1,803 73,443.50 35 935
27 1,609,622 1,302 145,666.04 23 1,412
50 1,982,717 7,912 102,810.56 35 316
Population totals for 2000 were obtained at the province level but for 1990 were available at the district level. Province level growth-rates from 1990-2000 where thus applied to the 1990 district-level data to obtain district-level estimates of population in 1995 and 2000.
Localities of 5,000 inhabitants or more, with a majority of the labour force not in ag ricultural activities.
Chinoye was aggregated with Makonde in the 2002 population data in order to match both our boundaries and 1992 population data (which show them as one unit called Makonde).
A population growth rate was calculated between 1992 and 2002 to extrapolate the population data to target years.
Nineteen main towns.
Population data were extrapolated to target years of 1990, 1995 and 2000 using growth rates derived from United Nations national level estimates and projections.
Sixty-three localities.

CountryEnglish
United Arab Emirates
Armenia
Edits and Notes: PopulationNum
Settlement Points
Largest Point (pop)
Smallest Point (pop)
Mean Point (pop)
Urban Criteria
(UN)Num Urban
ExtentsLargest Extent (sq.km)
9 757,524 25,577 237,309.44 4 6,297
42 1,246,202 1,679 57,384.55 33 594
Not available.
The National Statistics of the Republic of Armenia reported that because the 1989 census took place under difficult conditions, the census data resulted in an undercount. The Rayon population was aggregated to the Marzes level.
Cities and urban-type localities, of ficially designated as such, usually according to the criteria of number of inhabitants and predominance of agricultural or non-agricultural workers and their families.
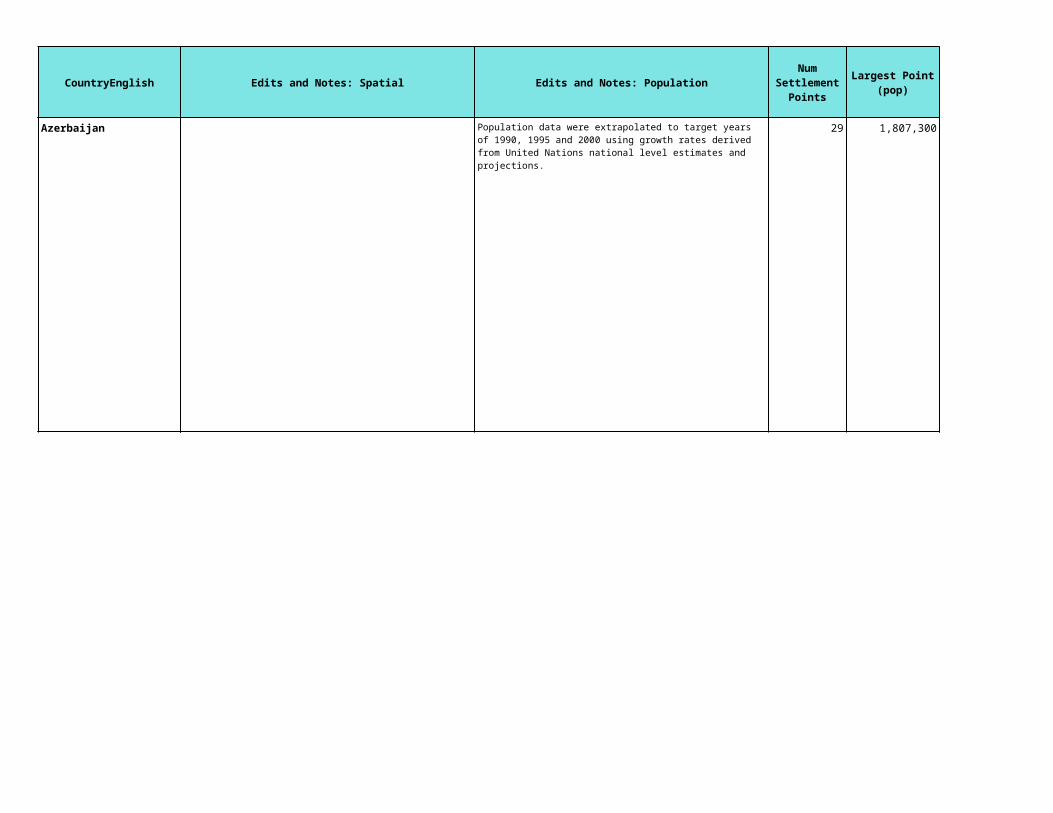
CountryEnglish
Azerbaijan
Edits and Notes: PopulationNum
Settlement Points
Largest Point (pop)
Smallest Point (pop)
Mean Point (pop)
Urban Criteria
(UN)Num Urban
ExtentsLargest Extent (sq.km)
29 1,807,300 21,042 117,426.97 27 1,597Population data were extrapolated to target years of 1990, 1995 and 2000 using growth rates derived from United Nations national level estimates and projections.
Cities and urban-type localities, offi cially designated as such, usually according to the criteria of number of inhabitants and predominance of agricultural or non-agricultural workers and their families.

CountryEnglish
Bangladesh
Edits and Notes: PopulationNum
Settlement Points
Largest Point (pop)
Smallest Point (pop)
Mean Point (pop)
Urban Criteria
(UN)Num Urban
ExtentsLargest Extent (sq.km)
157 5,418,584 9,473 116,302.89 130 1,282The 2001 Census data assigned four Zila units (Hobiganh, Moulavibazar, Sylhet, and Sunamganj) to the new Sylhet Division. These units split from the Chittagong Divison.
Population data were extrapolated to target years of 1990, 1995 and 2000 using Zila (administrative level 2) inter-censal growth rates applied to the 1991 Thana (administrative level 3) population data.
Places having a municipality (Pourashava), a town committee (Shahar commit tee) or a cantonment board. In general, urban areas are a concentration of at least 5,000 persons in con tinuous collection of houses where the community sense is well developed and the community main tains public utilities, such as, roads, street lighting, water supply, sanitary arrangements etc. These places are generally centres of trade and com merce where the labour force is mostly

CountryEnglish
Bahrain
Brunei Darussalam
Bhutan
Edits and Notes: PopulationNum
Settlement Points
Largest Point (pop)
Smallest Point (pop)
Mean Point (pop)
Urban Criteria
(UN)Num Urban
ExtentsLargest Extent (sq.km)
7 131,733 10,734 52,821.86 3 510
5 61,915 2,475 27,796.60 1 1,117
18 53,600 1,100 10,063.94 5 95
Communes or villages with 2,500 inhabitants or more.
Population data were extrapolated to target years of 1990, 1995 and 2000 using growth rates derived from United Nations national level estimates and projections.
Municipalities and areas having ur ban socio-economic characteristics.
Population data were extrapolated to target years of 1990, 1995 and 2000 using growth rates derived from United Nations national level estimates and projections.
Not available.

CountryEnglish
China
Edits and Notes: PopulationNum
Settlement Points
Largest Point (pop)
Smallest Point (pop)
Mean Point (pop)
Urban Criteria
(UN)Num Urban
ExtentsLargest Extent (sq.km)
4,707 14,348,535 1,807 57,969.88 3,803 9,357The 2000 population data was missing for the administrative 3 level unit of Mangyadachaidan. A population growth rate was calculated using 1990 and 1995 Mangyadachaida population estimates. The 1995 data was then projected forward to 2000.
Up to 1982: total population of cities and towns. Cities had to have a population of at least 100,000 or command special administrative, strategic, or economic importance to qualify as cit ies. Towns were either settlements with more than 3,000 inhabitants of whom more than 70 per cent were registered as non-agricultural or settlements with a population ranging from 2,500 to 3,000 of whom more than 85 per cent were registered as non-agricultural. For the 1990 census: (1) all resi dents of urban
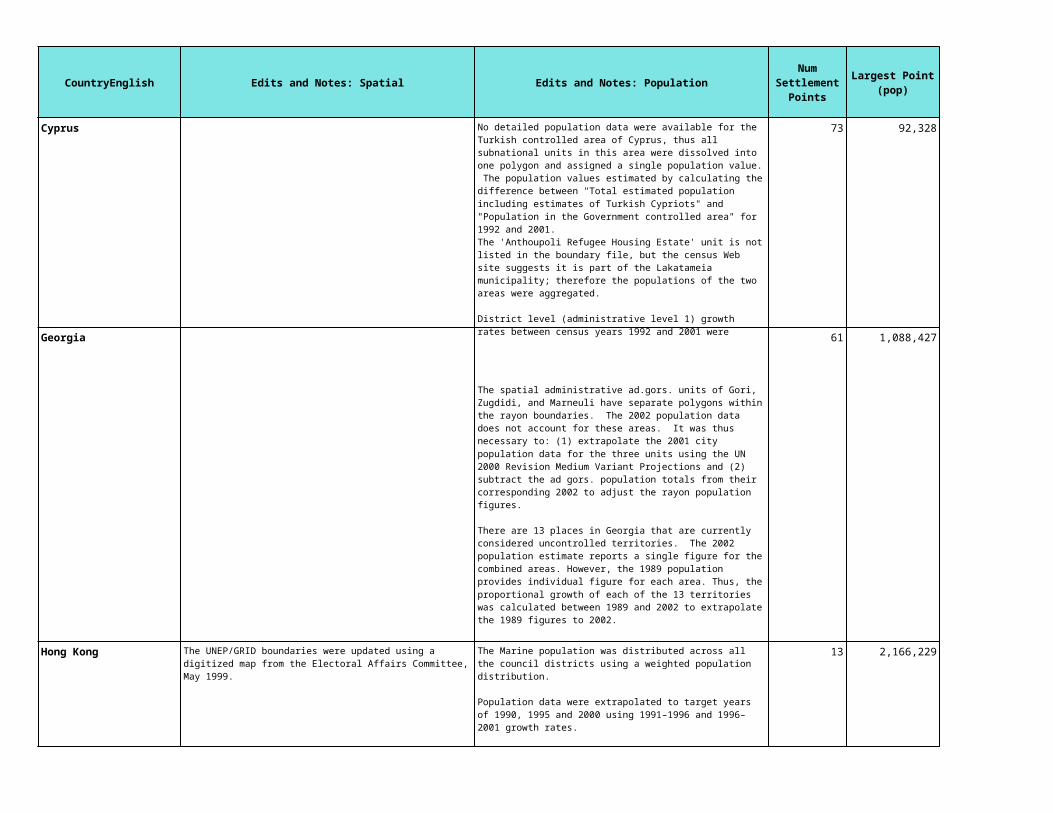
CountryEnglish
Cyprus
Georgia
Hong Kong
Edits and Notes: PopulationNum
Settlement Points
Largest Point (pop)
Smallest Point (pop)
Mean Point (pop)
Urban Criteria
(UN)Num Urban
ExtentsLargest Extent (sq.km)
73 92,328 1,019 7,379.64 4 1,004
61 1,088,427 1,700 43,469.08 48 784
13 2,166,229 104,720 467,663.85 3 692
No detailed population data were available for the Turkish controlled area of Cyprus, thus all subnational units in this area were dissolved into one polygon and assigned a single population value. The population values estimated by calculating the difference between "Total estimated population including estimates of Turkish Cypriots" and "Population in the Government controlled area" for 1992 and 2001.The 'Anthoupoli Refugee Housing Estate' unit is not listed in the boundary file, but the census Web site suggests it is part of the Lakatameia municipality; therefore the populations of the two areas were aggregated.
District level (administrative level 1) growth rates between census years 1992 and 2001 were applied to the 2001 municipality (administrative level 2) population for extrapolation to target years.
Six district towns and Nicosia's suburbs.
The spatial administrative ad.gors. units of Gori, Zugdidi, and Marneuli have separate polygons within the rayon boundaries. The 2002 population data does not account for these areas. It was thus necessary to: (1) extrapolate the 2001 city population data for the three units using the UN 2000 Revision Medium Variant Projections and (2) subtract the ad gors. population totals from their corresponding 2002 to adjust the rayon population figures.
There are 13 places in Georgia that are currently considered uncontrolled territories. The 2002 population estimate reports a single figure for the combined areas. However, the 1989 population provides individual figure for each area. Thus, the proportional growth of each of the 13 territories was calculated between 1989 and 2002 to extrapolate the 1989 figures to 2002.
Cities and urban-type localities, offi cially designated as such, usually according to crite ria regarding the number of inhabitants and the pre dominance of non-agricultural workers and their families.
The Marine population was distributed across all the council districts using a weighted population distribution.
Population data were extrapolated to target years of 1990, 1995 and 2000 using 1991–1996 and 1996–2001 growth rates.
Hong Kong Island, New Kowloon and new towns in New Territories.

CountryEnglish
Indonesia
Edits and Notes: PopulationNum
Settlement Points
Largest Point (pop)
Smallest Point (pop)
Mean Point (pop)
Urban Criteria
(UN)Num Urban
ExtentsLargest Extent (sq.km)
443 12,767,158 1,600 163,784.62 238 4,071Due to significant numbers of boundary changes to the Kabopaten (administrative level 2) units, 1990–2000 Propinsi (administrative level 1) growth rates were calculated for all population projections and applied to the Desa (administrative level 4) population data. Because 2000 census estimates were not produced for the Kabopaten of Pidie, the 2000 Desa-level units were merged up to the Kabupaten level and then 1990 Kabupaten-level populations were extrapolated forward to the target years.
The Province of DAERAH ISTIMEWA ACEH (Prop 11) is a special case, in this province the new Kabopaten ACEH TIMUR (code 180) have a lot of desas without matching polygons. Coincindentally, there are a lot of desa polygons in Kabopaten 170 without a matching population. About a third of the mismatches in this province were sorted out by using the desa name. However, for the remaining desas in both Kabopatens 170 and 180 were sorted out using the following method: Total population for Prop 11 from the population data and the the matched data in the shapefile were calculated and the difference distributed equally to desas without matching population. This assumes that the population of the desas without matching polys have been covered in this method so that their population was
Municipalities (kotamadya), re gency capitals (kabupaten) and other places with urban characteristics.

CountryEnglish
India
Edits and Notes: PopulationNum
Settlement Points
Largest Point (pop)
Smallest Point (pop)
Mean Point (pop)
Urban Criteria
(UN)Num Urban
ExtentsLargest Extent (sq.km)
3,570 16,251,717 1,027 76,820.12 2,736 3,746Towns (places with municipal cor poration, municipal area committee, town commit tee, notified area committee or cantonment board); and all places having 5,000 inhabitants or more, a density of not fewer than 1,000 persons per square mile or 390 per square kilometre, pronounced urban characteristics and at least three fourths of the adult male population employed in pursuits other than agriculture.

CountryEnglish
Iran
Iraq
Israel
Edits and Notes: PopulationNum
Settlement Points
Largest Point (pop)
Smallest Point (pop)
Mean Point (pop)
Urban Criteria
(UN)Num Urban
ExtentsLargest Extent (sq.km)
193 7,475,657 20,852 185,346.62 137 6,405
24 5,956,616 43,512 575,247.29 21 2,016
91 657,500 9,700 55,918.68 6 5,588
The populations of Ardebil ostan (administrative level 1) and East Azerbaijan were aggregated. Also aggregated were the populations of Qom ostan and Tehran. The populations of Aliabad, Gonbad-e-Kavus, Gorgan, Kordkuy, Minudasht (onbad-e-Kavus), and Torkaman sharestans (administrative level 2) were assigned to the ostan Mazandaran (administrative level 1).
1986 population figures were not available at the shahrestan (administrative 2) level. Thus, population data were extrapolated to target years of 1990, 1995 and 2000 using growth rates calculated between 1986 and 1996 at the ostan (administrative 1) level. These rates were applied to the 1996 sharestans.
All shahrestan (county) centres, re gardless of size; and all places having municipal centres.
Population data were extrapolated to target years of 1990, 1995 and 2000 using growth rates derived from United Nations national level estimates and projections.
Area within the boundaries of municipality councils (al majlis al baldei).
All settlements with more than 2,000 inhabitants except those where at least one third of the households participating in the civilian labour force earn their living from agriculture.

CountryEnglish
Jordan
Edits and Notes: PopulationNum
Settlement Points
Largest Point (pop)
Smallest Point (pop)
Mean Point (pop)
Urban Criteria
(UN)Num Urban
ExtentsLargest Extent (sq.km)
26 1,236,180 7,224 119,165.38 12 1,464There are districts (administrative level 2) with population data but no matching polygons. Geographic coordinates were used to locate these districts and the population figures were then added to the districts where coordinates were found.
Governate level growth rates (administrative level 1) from 1999–2001 were applied to the district (administrative level 2) units for extrapolation to the target years of 1990, 1995 and 2000.
Localities with 10,000 inhabitants or more and each subdistrict centre irrespective of population size.

CountryEnglish
Japan
Edits and Notes: PopulationNum
Settlement Points
Largest Point (pop)
Smallest Point (pop)
Mean Point (pop)
Urban Criteria
(UN)Num Urban
ExtentsLargest Extent (sq.km)
995 8,134,688 14,800 109,870.37 143 37,960City (shi) having 50,000 inhabitants or more with 60 per cent or more of the houses lo cated in the main built-up areas and 60 per cent or more of the population (including dependants) engaged in manufacturing, trade or other urban type of business. Alternatively, a shi having urban fa cilities and urban conditions as defined by the prefectural order is considered urban.

CountryEnglish
Kazakhstan
Edits and Notes: PopulationNum
Settlement Points
Largest Point (pop)
Smallest Point (pop)
Mean Point (pop)
Urban Criteria
(UN)Num Urban
ExtentsLargest Extent (sq.km)
34 1,125,579 41,463 181,234.09 31 1,694Population data were extrapolated to target years of 1990, 1995 and 2000 using growth rates derived from United Nations national level estimates and projections.
Cities and urban-type localities, of ficially designated as such, usually according to criteria based on the number of inhabitants and the predominance of non-agricultural workers and their families.
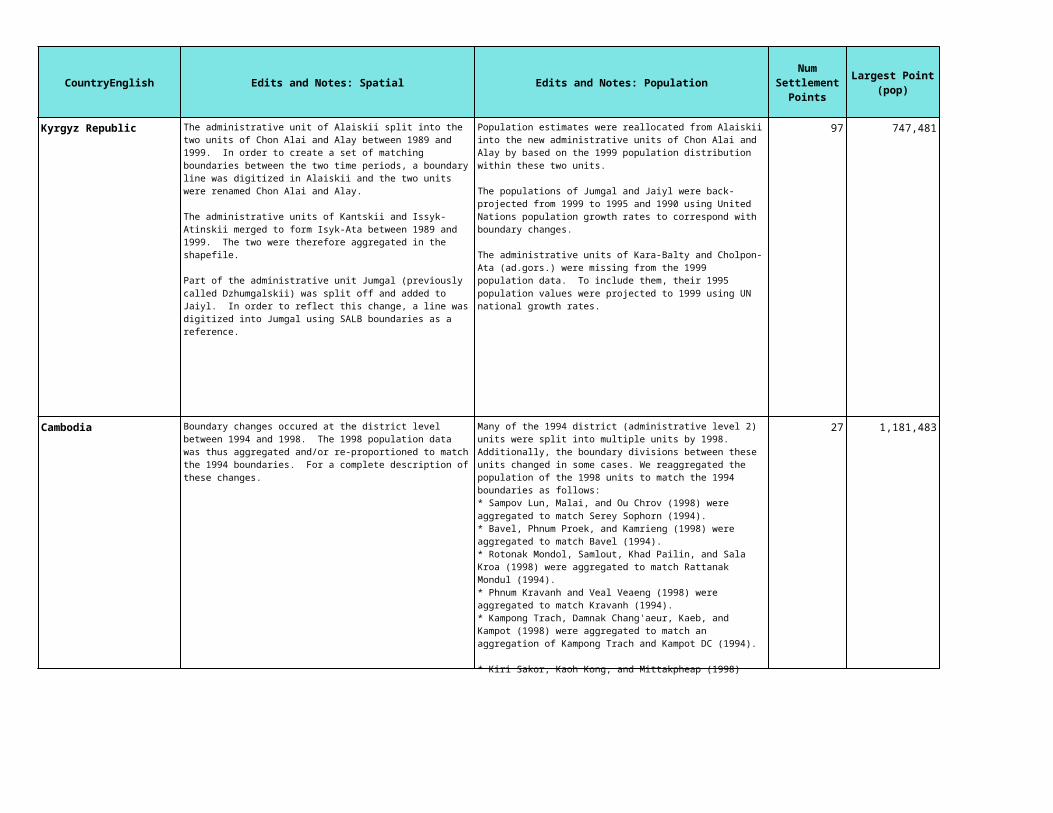
CountryEnglish
Kyrgyz Republic
Cambodia
Edits and Notes: PopulationNum
Settlement Points
Largest Point (pop)
Smallest Point (pop)
Mean Point (pop)
Urban Criteria
(UN)Num Urban
ExtentsLargest Extent (sq.km)
97 747,481 1,641 23,163.55 17 1,475
27 1,181,483 2,831 80,575.85 22 252
Population estimates were reallocated from Alaiskii into the new administrative units of Chon Alai and Alay by based on the 1999 population distribution within these two units.
The populations of Jumgal and Jaiyl were back-projected from 1999 to 1995 and 1990 using United Nations population growth rates to correspond with boundary changes.
The administrative units of Kara-Balty and Cholpon-Ata (ad.gors.) were missing from the 1999 population data. To include them, their 1995 population values were projected to 1999 using UN national growth rates.
Cities and urban-type localities, of ficially designated as such, usually according to criteria based on the number of inhabitants and pre dominance of non-agricultural workers and their families.
Many of the 1994 district (administrative level 2) units were split into multiple units by 1998. Additionally, the boundary divisions between these units changed in some cases. We reaggregated the population of the 1998 units to match the 1994 boundaries as follows:* Sampov Lun, Malai, and Ou Chrov (1998) were aggregated to match Serey Sophorn (1994). * Bavel, Phnum Proek, and Kamrieng (1998) were aggregated to match Bavel (1994). * Rotonak Mondol, Samlout, Khad Pailin, and Sala Kroa (1998) were aggregated to match Rattanak Mondul (1994). * Phnum Kravanh and Veal Veaeng (1998) were aggregated to match Kravanh (1994). * Kampong Trach, Damnak Chang'aeur, Kaeb, and Kampot (1998) were aggregated to match an aggregation of Kampong Trach and Kampot DC (1994). * Kiri Sakor, Kaoh Kong, and Mittakpheap (1998) were aggregated to match an aggregation of Kiri Sakor, Koh Kong DC, and Mittapheap (1994). * Pouk, and Siem Reap (1998) were aggregated to match an aggregation of Pouk and Siem Reap PT (1994).
Population data were extrapolated to target years of 1990, 1995 and 2000 using a district (administrative level 2) population
Municipalities of Phnom Penh, Bokor and Kep and 13 additional urban centres.

CountryEnglish
Korea
Kuwait
Lebanon
Lao People's Democratic Republic
Edits and Notes: PopulationNum
Settlement Points
Largest Point (pop)
Smallest Point (pop)
Mean Point (pop)
Urban Criteria
(UN)Num Urban
ExtentsLargest Extent (sq.km)
129 11,155,621 22,025 310,808.07 55 5,770
27 152,962 11,177 41,236.15 1 3,691
17 219,667 3,024 54,103.18 17 339
17 1,150,401 10,458 121,819.47 11 903
Data are available for most of the South Korea administrative units between 1992–2002. This interval was primarily used to calculate the growth rate and extrapolate to target years using 1995 and 2000 (census years) as base. For the units of Kejang-gun, Sasang-gu, Suyoun-gu,Yonjae-gu, Nam-gu, Chang-won, MasanKyeyang-gu, Pupyong-gu, Yonsu-gu, Kangbuk-gu, Kumchon-gu, and Kwangjin-gu, data is only available between 1995–2002. The growth rate of these units was calculated for the 1995–2002 interval, with 1995 and 2000 as base years. For the units of Chung-gu, Nam-gu, Puk-gu, Tong-gu, and Ulju-gun data is only available between 1997–2002. The growth rate of these units was calculated for the 1997–2002 interval with 2000 as base year.
Cities as administratively defined.
The last census year was 1995. According to the 2001 Annual Statistical Abstract, "for the years 1999–2001 the numbers have been derived by using estimates of different annual growth rates for both natural increase in population and numbers of naturalized citizens during 1995–1998."
The population figures of Hawalli and Mubarak Al-Kabeer governorates were aggregated and called Hawalli-incl.Mubarak Al-Kabeer to match the boundaries.
Agglomerations of 10,000 inhabitants or more.
Population data were extrapolated to target years of 1990, 1995 and 2000 using growth rates derived from United Nations national level estimates and projections.
The five largest towns: Vientiane, Luang Prabang, Savannakhet, Kammouan and Pakse.
Population data were extrapolated to target years of 1990, 1995 and 2000 using growth rates derived from United Nations national level estimates and projections.
Localities with 5,000 inhabitants or more.

CountryEnglish
Sri Lanka
Macao
Maldives
Edits and Notes: PopulationNum
Settlement Points
Largest Point (pop)
Smallest Point (pop)
Mean Point (pop)
Urban Criteria
(UN)Num Urban
ExtentsLargest Extent (sq.km)
55 627,625 9,224 61,819.58 25 1,483
1 440,569 440,569 440,569.00 1 9
58 74,069 1,009 3,263.76 1 2
District (administrative level 2) population data were missing for the following 9 provinces (administrative level 1): Ampara, Batticaloa, Colombo, Jaffna, Kilinochchi, Mannar, Mullaitivu, Trincomalee, Vavuniya. Hybrid administrative level 1 and 2 boundaries were created to account for these areas.
A 1981–1991 province (administrative level 1) population growth rate was used to extrapolate population data to the target years of 1990, 1995, and 2000.
Municipalities, urban councils and towns.
The Maritime Area population was redistributed equally among the other three administrative units (632.66667 people to each unit in 2001; 943.66667people to each unit in 1991). All three have coastal areas.
National level population growth rates (administrative level 0) were applied to the peninsula/island (administrative level 1) units for extrapolation to the target years of 1990, 1995, and 2000.
Macao City, including area maritima. Note: On 30 December 1999, Macao became a Special Administrative Region of China.
The capital city of Male

CountryEnglish
Myanmar
Mongolia
Malaysia
Nepal
Edits and Notes: PopulationNum
Settlement Points
Largest Point (pop)
Smallest Point (pop)
Mean Point (pop)
Urban Criteria
(UN)Num Urban
ExtentsLargest Extent (sq.km)
64 3,993,814 35,878 159,413.20 58 784
24 760,077 8,983 56,717.29 23 451
125 1,297,526 7,845 84,437.98 69 2,326
45 637,802 8,625 60,129.29 37 457
Although the State (administrative 1 level) population data for 1985 and 1990–1997 were based on the 1983 census, the 1983 census was not directly used for computing growth rates. It is believed that artifically high rates are produced when the 1983 census is incorporated into the calculations. This is partially because the state of Kawthulei (Karen) had a population that doubled from 1983 (633,000) to 1985 (1,109,000), but from 1985 the increase in population is gradual. Also, it was reported that there were approximately 1,183,005 persons residing in inaccessible areas during the 1983 census, Kawthulei may have been one of these areas. Thus growth rate at level 1 from 1985 to 1997 were applied to 1983 level 2 population to estimate 1990, 1995 and 2000.
Not available.
Population data were extrapolated to target years of 1990 and 1995 using growth rates derived from United Nations national level estimates and projections.
Capital and district centres.
A district (administrative 2 level) population growth rate was calculated between 1991 and 2000 and applied to all mukim (administrative level 3) units to extrapolate to target years.
Gazetted areas with their adjoining built-up areas and with a combined population of 10,000 persons or more.
Localities with 9,000 inhabitants or more (panchayats).

CountryEnglish
Oman
Pakistan
Edits and Notes: PopulationNum
Settlement Points
Largest Point (pop)
Smallest Point (pop)
Mean Point (pop)
Urban Criteria
(UN)Num Urban
ExtentsLargest Extent (sq.km)
25 236,850 26,741 83,851.28 11 2,794
202 10,103,724 25,673 205,467.50 174 1,777
Not available.
Population data were extrapolated to target years of 1990, 1995 and 2000 using growth rates derived from United Nations national level estimates and projections.
Places with municipal corporation, town committee or cantonment.
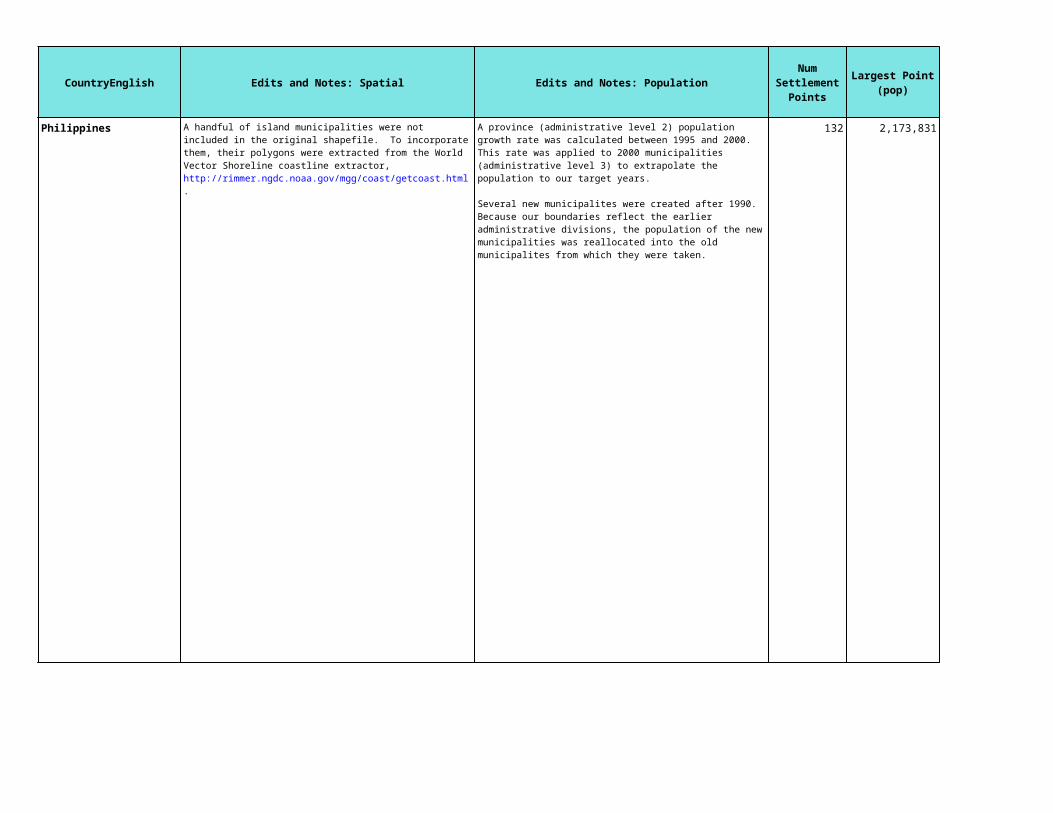
CountryEnglish
Philippines
Edits and Notes: PopulationNum
Settlement Points
Largest Point (pop)
Smallest Point (pop)
Mean Point (pop)
Urban Criteria
(UN)Num Urban
ExtentsLargest Extent (sq.km)
132 2,173,831 31,253 202,461.09 73 2,180A province (administrative level 2) population growth rate was calculated between 1995 and 2000. This rate was applied to 2000 municipalities (administrative level 3) to extrapolate the population to our target years.
Several new municipalites were created after 1990. Because our boundaries reflect the earlier administrative divisions, the population of the new municipalities was reallocated into the old municipalites from which they were taken.
All cities and municipalities with a density of at least 1,000 persons per square kilome tre; administrative centres, barrios of at least 2,000 inhabitants, and those barrios of at least 1,000 in habitants which are contiguous to the administrative centre, in all cities and municipalities with a density of at least 500 persons per square kilometre; and all other administrative centres with at least 2,500 in habitants.
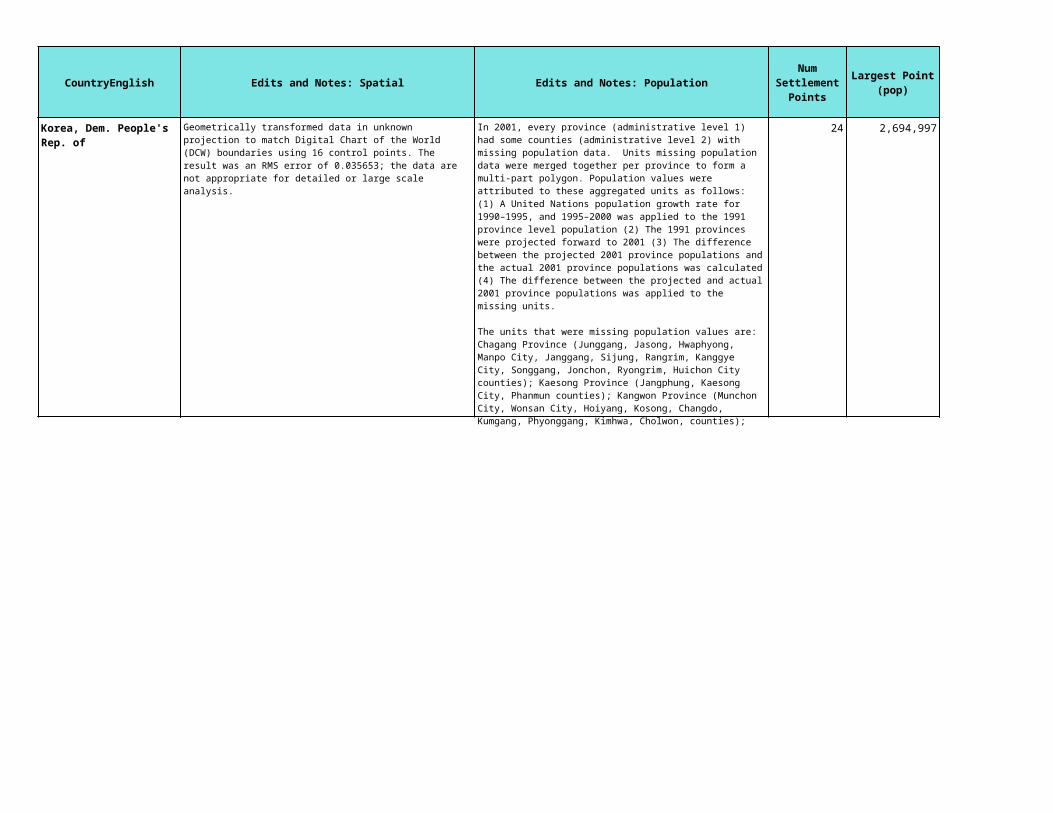
CountryEnglish
Korea, Dem. People's Rep. of
Edits and Notes: PopulationNum
Settlement Points
Largest Point (pop)
Smallest Point (pop)
Mean Point (pop)
Urban Criteria
(UN)Num Urban
ExtentsLargest Extent (sq.km)
24 2,694,997 113,844 362,397.17 21 440In 2001, every province (administrative level 1) had some counties (administrative level 2) with missing population data. Units missing population data were merged together per province to form a multi-part polygon. Population values were attributed to these aggregated units as follows: (1) A United Nations population growth rate for 1990–1995, and 1995–2000 was applied to the 1991 province level population (2) The 1991 provinces were projected forward to 2001 (3) The difference between the projected 2001 province populations and the actual 2001 province populations was calculated (4) The difference between the projected and actual 2001 province populations was applied to the missing units.
The units that were missing population values are: Chagang Province (Junggang, Jasong, Hwaphyong, Manpo City, Janggang, Sijung, Rangrim, Kanggye City, Songgang, Jonchon, Ryongrim, Huichon City counties); Kaesong Province (Jangphung, Kaesong City, Phanmun counties); Kangwon Province (Munchon City, Wonsan City, Hoiyang, Kosong, Changdo, Kumgang, Phyonggang, Kimhwa, Cholwon, counties); North Hamgyong Province (Hoiryong City, Sonbong S. Zone, Rajin S. Zone, Yonsa, Puyun, Myongchon, Hwadae, Kimchaek City, Hwadae counties); North Hwanghae (Songrim City, Yonthan, Sariwon City, Pongsan, Unpha, Phyongsan, Thosan counties); North Phyongan (Changsong, Taegwan, Chonma, Nyongbyon, Sindo counties); Pyongyang (Unjong county); Ryanggang (Paekam, Kimhyongjik, Kimjongsuk counties); South Hamgyong (Pujon, Hochon, Jangjin, Yodok, Sudong counties); South Hwanghae (Jangyon, Ryongyon, Ongjin, Taehung,
Not available.

CountryEnglish
Occupied Palestinian Territory
Edits and Notes: PopulationNum
Settlement Points
Largest Point (pop)
Smallest Point (pop)
Mean Point (pop)
Urban Criteria
(UN)Num Urban
ExtentsLargest Extent (sq.km)
226 402,806 1,010 11,066.72 30 564A population growth rate was calculated between 1997 and 2003 to extrapolate the population data to target years.
Any locality whose population amounts to 10,000 persons or more. This applies to all governorates/districts centers regardless of their size. Besides, it refers to all localities whose popu lations vary from 4,000 to 9,999 persons provided they have, at least, four of the following elements: public electricity network, public water network, post office, health center with a full- time physician and a school offering a general secondary education certificate.

CountryEnglish
Qatar
Saudi Arabia
Singapore
Syrian Arab Republic
Edits and Notes: PopulationNum
Settlement Points
Largest Point (pop)
Smallest Point (pop)
Mean Point (pop)
Urban Criteria
(UN)Num Urban
ExtentsLargest Extent (sq.km)
10 280,502 1,423 51,896.10 2 1,504
47 3,795,991 34,666 323,507.09 28 4,956
1 4,017,733 4,017,733 4,017,733.00 1 543
36 1,941,532 34,069 208,461.47 26 1,578
Not available.
A population growth rate was calculated between 1992 and 2000 to extrapolate the population data to target years.
Cities with 5,000 inhabitants or more.
The non-resident population (1,054,570) was added proportionatly across units. Population data were extrapolated to target years of 1990, 1995 and 2000 using growth rates derived from United Nations national level estimates and projections.
City of Singapore.
Population data were extrapolated to target years of 1990, 1995 and 2000 using growth rates derived from United Nations national level estimates and projections.
Cities, mohafaza centres and man tika centres.

CountryEnglish
Thailand
Tajikistan
Edits and Notes: PopulationNum
Settlement Points
Largest Point (pop)
Smallest Point (pop)
Mean Point (pop)
Urban Criteria
(UN)Num Urban
ExtentsLargest Extent (sq.km)
167 6,320,174 4,796 87,551.82 116 6,028
26 562,000 4,000 51,099.42 12 1,279
In most instances, a population growth rate was calculated between 1990 and 2000 to extrapolate the population data to target years. For several areas, where the 1990 population figures appeared inaccurate, population growth rates were calculated between 1996 and 2000.
Municipalities.
Population data were extrapolated to target years of 1995 and 2000 using growth rates derived from United Nations national level estimates and projections.
Cities and urban-type localities, of ficially designated as such, usually according to criteria based on the number of inhabitants and the predominance of non-agricultural workers and their families.
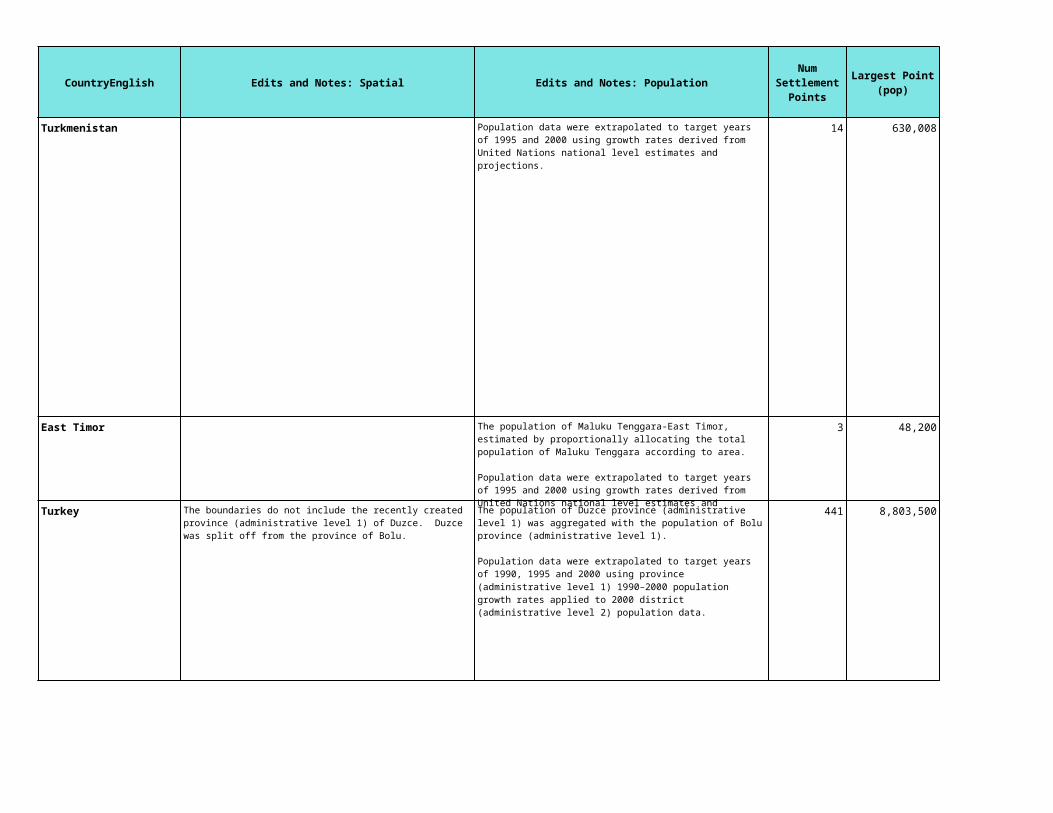
CountryEnglish
Turkmenistan
East Timor
Turkey
Edits and Notes: PopulationNum
Settlement Points
Largest Point (pop)
Smallest Point (pop)
Mean Point (pop)
Urban Criteria
(UN)Num Urban
ExtentsLargest Extent (sq.km)
14 630,008 23,094 117,154.64 12 1,810
3 48,200 12,000 25,766.67 2 127
441 8,803,500 14,616 96,853.04 359 1,975
Population data were extrapolated to target years of 1995 and 2000 using growth rates derived from United Nations national level estimates and projections.
Cities and urban-type localities, of ficially designated as such, usually according to criteria based on the number of inhabitants and the predominance of non-agricultural workers and their families.
The population of Maluku Tenggara-East Timor, estimated by proportionally allocating the total population of Maluku Tenggara according to area.
Population data were extrapolated to target years of 1995 and 2000 using growth rates derived from United Nations national level estimates and projections.
Not available.
The population of Duzce province (administrative level 1) was aggregated with the population of Bolu province (administrative level 1).
Population data were extrapolated to target years of 1990, 1995 and 2000 using province (administrative level 1) 1990–2000 population growth rates applied to 2000 district (administrative level 2) population data.
Population of the localities within the municipal limits of administrative centres of provinces and districts.
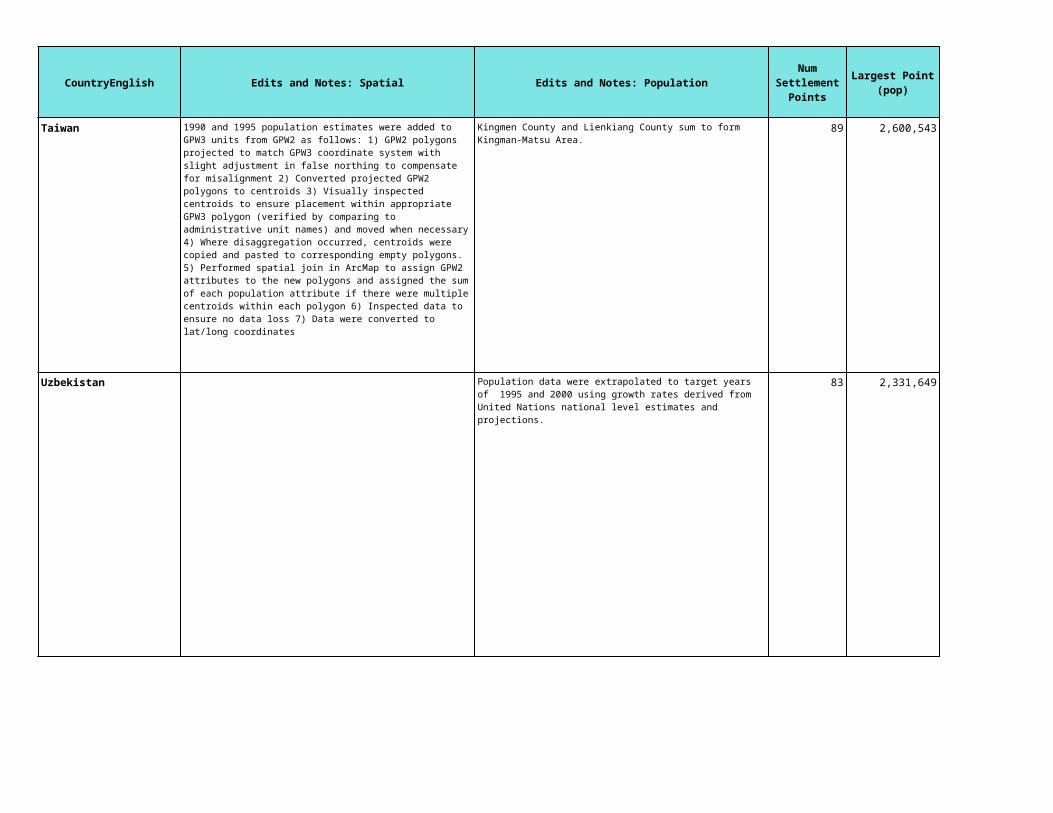
CountryEnglish
Taiwan
Uzbekistan
Edits and Notes: PopulationNum
Settlement Points
Largest Point (pop)
Smallest Point (pop)
Mean Point (pop)
Urban Criteria
(UN)Num Urban
ExtentsLargest Extent (sq.km)
89 2,600,543 31,280 163,761.26 8 11,187
83 2,331,649 17,593 93,342.19 58 2,043
Kingmen County and Lienkiang County sum to form Kingman-Matsu Area.
Not available.
Population data were extrapolated to target years of 1995 and 2000 using growth rates derived from United Nations national level estimates and projections.
Cities and urban-type localities, of ficially designated as such, usually according to criteria based on number of inhabitants and the pre dominance of non-agricultural workers and their families.

CountryEnglish
Viet Nam
Yemen
Edits and Notes: PopulationNum
Settlement Points
Largest Point (pop)
Smallest Point (pop)
Mean Point (pop)
Urban Criteria
(UN)Num Urban
ExtentsLargest Extent (sq.km)
55 3,881,090 27,310 187,603.84 52 1,286
33 1,278,360 8,036 119,282.18 27 680
53 of the 1999 district units could not be matched. Their populations were estimated using UN growth rates.
A population growth rate was calculated between 1992 and 1999 to extrapolate the population data to target years.
Places with 4,000 inhabitants or more.
Population data were extrapolated to target years of 1990, 1995 and 2000 using growth rates derived from United Nations national level estimates and projections.
The urban areas in the Governorates of Aden and Sana'a, meaning, Aden, excluding the oil refinery and villages of Al Burayqah and Bi'r Fuqum (former Democratic Yemen) and six other main towns (former Yemen).

CountryEnglish
Albania
Andorra
Austria
Edits and Notes: PopulationNum
Settlement Points
Largest Point (pop)
Smallest Point (pop)
Mean Point (pop)
Urban Criteria
(UN)Num Urban
ExtentsLargest Extent (sq.km)
47 342,760 3,185 28,850.17 39 283
7 21,370 2,288 9,524.14 1 309
289 1,549,092 0 16,417.83 93 1,582
Since 1991, Albania has disaggregated some of its districts (administrative level 1). Such changes resulted in 36 districts, compared to the previous 26 districts. Recent boundary divisions were accomodated in the following attribution of population: - The population of the new district of Has is absorbed into Kukes; - Kurbin into Lezhe; - Kavaje into Tirana; - Bulqize into Mat; - Peqin into Elbasan; - Mallakaster into Fier; - Kucove into Berat; - Delvine into Sarande; - Korce and Devoll comprise Koritza; - Shkoder and Malsi E Madhe comprise Skutari.
Towns and other industrial centres with more than 400 inhabitants.
Population data were extrapolated to target years of 1990, 1995 and 2000 using growth rates derived from United Nations national level estimates and projections.
Parishes of Andorra la Vella, Escola des-Engordany, Sant Julia, Encamp and La Massa na.
The population of two districts in Burgenland have been assigned as follows: Breitenbrunn has been assigned to Eisenstadt-Umgebung and Oberpullendorf has been assigned to Oberwart
Communes (Gemeinden) with 2,000 inhabitants or more in which less than 15 per cent of the active population is engaged in agricultural or forestry work.

CountryEnglish
Belgium
Bulgaria
Bosnia-Herzogovina
Belarus
Edits and Notes: PopulationNum
Settlement Points
Largest Point (pop)
Smallest Point (pop)
Mean Point (pop)
Urban Criteria
(UN)Num Urban
ExtentsLargest Extent (sq.km)
574 452,301 1,018 17,822.31 74 9,939
41 1,098,433 24,965 101,323.20 36 1,155
22 388,812 6,324 53,252.73 22 153
35 1,688,584 23,276 162,806.37 33 1,265
A population growth rate was calculated between 1995 and 2000 to extrapolate to target years.
Cities, urban agglomerations and urban communes.
The District (administrative level 1) population growth rate between 1995 and 2001 was applied to the 2001 Municipality (administrative level 2) population data.
Towns, that is, localities legally es tablished as urban.
A population growth rate was calculated between 1991 and 2001 to extrapolate to target years.
Not available.
Population data were extrapolated to target years of 1990, 1995 and 2000 using growth rates derived from United Nations national level estimates and projections.
Cities and urban-type localities, of ficially designated as such, usually according to criteria based on the number of inhabitants and predominance of non-agricultural workers and their families.

CountryEnglish
Switzerland
Czech Republic
Germany
Denmark
Edits and Notes: PopulationNum
Settlement Points
Largest Point (pop)
Smallest Point (pop)
Mean Point (pop)
Urban Criteria
(UN)Num Urban
ExtentsLargest Extent (sq.km)
341 363,273 2,300 13,204.01 59 2,030
131 1,181,877 10,038 42,735.79 93 1,273
1,132 3,415,872 6,721 47,598.45 584 5,892
429 1,075,851 1,001 9,381.26 87 1,479
A population growth rate was calculated between 1991 and 2001 to extrapolate to target years. Recent boundary divisions were accomodated and populations from old divisions were systematically attributed to the new divisions. Please contact us for more information at [email protected].
Communes with 10,000 inhabitants or more, including suburbs.
Localities with 5,000 inhabitants or more
(1) In Sachsen, only one of the 5 units that make up Vogtlandkreis in the boundary data has 1995 population. The five units are merged and the the total population of Vogtlandkreis estimated by multiplying the available population five times.
(2) In Niedersachsen, the polygons for Hannover City and the surrounding Hannover Region are merged and population added together.
(3) In Sachsen, polygons for Dresden City and surrounding Dresden Land are merged and population added together. The 2002 population for Dresden in Sachsen is not available, however, 2000 population is provided by the City Administration of Dresden via their website, www.dresden.de.
(4) In Thueringen, the population of Eisenach added to Wartburgkreis.
Communes with 2,000 inhabitants or more.
A population growth rate was calculated between 1995 and 2002. The 1995 population is an estimate based on regional/urban growth rates 1990-1997 from the Denmark Statistics and applied to 1997 data from Statistik uden Graenser, Nordisk statistik pa cd-rom 1997 - Nordic Statistics on DC-Rom 1997 Published by the Statistics Offices of Iceland, Danmark, Sweden, Greenland, Faroe, Finland and Norway.
United Nations population growth rates were applied to the Kommunes Aars and Christians to extrapolate 2002 population to target years.
Population excluding population in rural districts.

CountryEnglish
Spain
Estonia
Finland
Edits and Notes: PopulationNum
Settlement Points
Largest Point (pop)
Smallest Point (pop)
Mean Point (pop)
Urban Criteria
(UN)Num Urban
ExtentsLargest Extent (sq.km)
737 2,945,822 7,970 45,321.01 208 6,814
42 400,378 1,165 21,981.21 21 639
101 1,027,305 9,613 43,336.13 43 2,705
Populations of Municipios without matching polygon on the shapefile are allocated proportionately to the Provincias where they are located. These are: · In Burgos – Valle de Sedano· In Cáceres – Rosalejo· Coruña – Frades· In Cuenca – Palomera, Poyatos and Tragacete· In Guadalajara – Marchamalo· In Jaén - Arroyo del Ojanco · In Navarra – Irurtzun· In Orense – Rubi, Veiga, and Vilamart¡n de Valdeorras· In Valencia - San Antonio de Benagber
Provincia (administrative 2 level) growth rates were calculated between census years 1991 and 2001 and applied to the 2001 municipality (administrative 3 level) population data to extrapolate to target years.
Municipalities (municipios) with 10,000 inhabitants or more.
A county (administrative level 1) population growth rate was calculated between 1990 and 2000 and applied to the muncipality units (administrative level 2) population to extrapolate to target years.
Cities and urban-type localities des ignated as such according to criteria based on the number of inhabitants and the predominance of non-agricultural workers and their families.
A population growth rate was calculated between 1993 and 2000 to extrapolate to target years.
Urban communes.

CountryEnglish
France
Faeroe Islands
Edits and Notes: PopulationNum
Settlement Points
Largest Point (pop)
Smallest Point (pop)
Mean Point (pop)
Urban Criteria
(UN)Num Urban
ExtentsLargest Extent (sq.km)
348 11,245,118 8,148 125,496.49 261 5,741
11 12,208 1,000 2,802.91 Torshavn. 2 141
(1) Canton level (administrative level 1) growth rate between 1990 to 1999 are applied to Commune 1999 population to extrapolate to target years.
(2) The population of the 16 Arrondissements of Marseille in Bouches-du-Rhone are totaled and assigned to the Marseille polygon.
(3) The population of the 9 Arrondissements of Lyon in Rhone are totaled and assigned to the Lyon polygon.
(4) In Orne, the population of Tessé-la-Madeleine added to Bagnoles-de-l'Orne.
(5) In Vendee, the population of Claye (La) added to Bretonnière (La).
(6) In Aube, the populations of Bercenay-le-Hayer and Trancault added to Val-d'Orvin.
Communes with 2,000 inhabitants or more living in houses separated by at most 200 me- tres; or communes in which the majority of the; population is part of a multi-communal agglomeration of this nature.
2001 population data were extrapolated to target years of 1990, 1995 and 2000 using growth rates derived from United Nations national level estimates and projections.

CountryEnglish
United Kingdom
Guernsey
Edits and Notes: PopulationNum
Settlement Points
Largest Point (pop)
Smallest Point (pop)
Mean Point (pop)
Urban Criteria
(UN)Num Urban
ExtentsLargest Extent (sq.km)
447 7,116,814 2,335 78,386.64 107 7,723
5 16,503 2,294 8,512.80 1 62
England and Wales: urban areas formed of continuously built-up urban land, the largest urban areas forming agglomerations in which urban sub-divisions are recognised. Scot land: urban localities, similar in concept to urban areas in England and Wales, except that the urban localities as defined do not extend across local gov ernment district boundaries. Northern Ireland: ur ban area formed of continuously built up land, forming an agglomeration in which urban subdivi sions are recognised.
The "resident population present" numbers used as input population data.

CountryEnglish
Gibraltar
Edits and Notes: PopulationNum
Settlement Points
Largest Point (pop)
Smallest Point (pop)
Mean Point (pop)
Urban Criteria
(UN)Num Urban
ExtentsLargest Extent (sq.km)
1 26,749 26,749 26,749.00 1 4Entire population.

CountryEnglish
Greece
Edits and Notes: PopulationNum
Settlement Points
Largest Point (pop)
Smallest Point (pop)
Mean Point (pop)
Urban Criteria
(UN)Num Urban
ExtentsLargest Extent (sq.km)
1,103 741,187 1,006 7,789.09 113 2,400Regional level population growth rates were calculated between 1991 and 2001 applied to 2001 Commune population. The 2001 Region (administrative level 1) units do not match or nest to 1991 Regional boundaries. Thus the 2001 Commune (administrative level 3) data are aggregated to spatially match 1991 regional boundaries in order to calculate the region growth rates.
Municipalities and communes in which the largest population centre has 10,000 in habitants or more, plus 18 urban agglomerations as defined in the 1991 census: Greater Athens, Thessaloniki, Patra, Iraklion, Volos, Chania, Irannina, Chalkida, Agrino, Kalamata, Katerini, Kerkyra, Salamina, Chios, Egio, Rethymno, Ermoupolis and Sparti.

CountryEnglish
Croatia
Hungary
Edits and Notes: PopulationNum
Settlement Points
Largest Point (pop)
Smallest Point (pop)
Mean Point (pop)
Urban Criteria
(UN)Num Urban
ExtentsLargest Extent (sq.km)
121 693,214 3,029 19,763.33 46 973
1,426 1,763,110 1,009 6,603.60 136 1,777
Population data were extrapolated to target years of 1990, 1995 and 2000 using growth rates derived from United Nations national level estimates and projections.
Not available.
The Megye (administrative level 1) growth rate from 1990 to 2002 was applied to 2002 Village (administrative level 2) population. Because of Megye boundary changes, 2002 population of the villages of Lázi, Bakonypéterd, Sikátor, Románd, Veszprémvarsány, Bakonygyirót, Bakonyszentlászló, Fenyőfő from the Megye Győr-Moson-Sopron are assigned to Vesprem Megye to spatially match 1990 Megye boundaries in order to calculate the Megye growth rate.
Recent Village boundary divisions were accomodated in the following attribution of population:
(1) In Fejér, the population of Daruszentmiklós added to Előszállás. (2) In Győr-Moson-Sopron, the population of Károlyháza added to Kimle. (3) In heves, the population of Szarvaskő added to Eger. (4) In Jász-Nagykun-Szolnok, the population of Tiszaszőlős added to Tiszafüred. (5) In Komárom-Esztergom, the population of Ászár added to Kisbér. (6) In Nógrád, the population of Rákóczibánya added to Bátonyterenye. (7) In Pest, the population of Csörög added to Sződ; and population of Remeteszőlős added to Nagykovácsi. (8) In Somogy, population of Zákányfalu added to Zákány. (9) In Szabolcs-Szatmár-Bereg, the population of Szorgalmatos added to Tiszavasvári.
Budapest and all legally designated towns.

CountryEnglish
Isle of Man
Iceland
Italy
Jersey
Edits and Notes: PopulationNum
Settlement Points
Largest Point (pop)
Smallest Point (pop)
Mean Point (pop)
Urban Criteria
(UN)Num Urban
ExtentsLargest Extent (sq.km)
8 24,963 1,662 6,844.38 1 206
29 110,977 1,041 8,437.52 4 443
1,349 2,568,775 7,985 29,933.14 341 5,969
12 28,150 1,567 7,230.58 1 108
The population data refers to the Isle of Man Resident Population defined as residents present on census night plus residents absent from the Island on census night.
Borough of Douglas, town and vil lage districts. From 1951 to 1976: Towns of Castletown, Douglas Peel and Ramsey.
Localities with 200 inhabitants or more.
Recent boundary divisions were accomodated in the following attribution of population:
(1) In the province of Padova, Carrara San Giorgio and Carrara Santo Stefano are merged and assigned the population of Due Carrare.(2) In Rovigo, Contarina and Donada are merged and assigned the population of Porto Viro. (3) In the province of Biella in Piemonte, the commune Pistolesa's population is not available. (4) In Salerno, the population of Bellizi added to Montercorvino Rovella from which is was created in 1990. (5) In Nuoru, population of Cardedu added to Gairo from which it was created in 1984; and population of Lodine added to Gavoi from which it was created in 1988. (6) In Cagliari, population of Castiadas distributed equally to the comuni of Villaputzu, SanVito and Muravera, from which it was created in 1986; populations of Elmas, Monserrato, and Quartucciu are added to the commune Cagliari from which they were created in 1989, 1991 and 1983 respectively; population of Piscinas added to Giba from which it was created in 1988. (7) In Venezia, the population of Cavallino-Treporti added to Venezia from which it was created in 1999. (8) In Sassari, the population of Erula distributed equally to the
Communes with 10,000 inhabitants or more.
The "resident population present" numbers used as input population data.

CountryEnglish
Liechtenstein
Lithuania
Luxembourg
Edits and Notes: PopulationNum
Settlement Points
Largest Point (pop)
Smallest Point (pop)
Mean Point (pop)
Urban Criteria
(UN)Num Urban
ExtentsLargest Extent (sq.km)
9 5,471 1,184 3,520.44 1 97
98 545,078 1,029 23,827.54 52 670
82 76,602 1,000 3,987.16 3 666
National (administrative level 0) population growth rates, between 1990–1997 and 1997–2001, were applied to the 2001 municipality (administrative level 1) population units to project to target years.
Not available.
1990 population is based on growth rate between 1995–2001. Recent boundary divisions were accomodated in the following attribution of population: (1) In the province (administrative level 1) of Marijampole, the following districts (administrative level 2) are merged and assigned a single total population value - Sakiai, Kalvarijos, Kazlu Ruda, Marijampole, and Vilkaviskis.(2) The population of Pagegiai in province of Taurage added to Silute in province of Klaipeda. (3) In Telsiai, population of Rietavas addded to Plunge. (4) In Utena, the districts of Ignalinos and Visaginas are merged and assigned a single total population value. (5) Trakai in Vilnius and Kaisiadorys in Kaunas are merged and population value assigned is the total of the two merged districts plus population of Elektrenai (in Vilnius).
Cities and urban-type localities, of ficially designated as such, according to criteria based on the number of inhabitants and the pre dominance of non-agricultural workers and their families.
A population growth rate was calculated between 1995 and 2001. The 1995 population is an estimate based on 1991 to 1998 figures provided by the (STATEC).
Communes having more than 2,000 inhabitants in the administrative center.
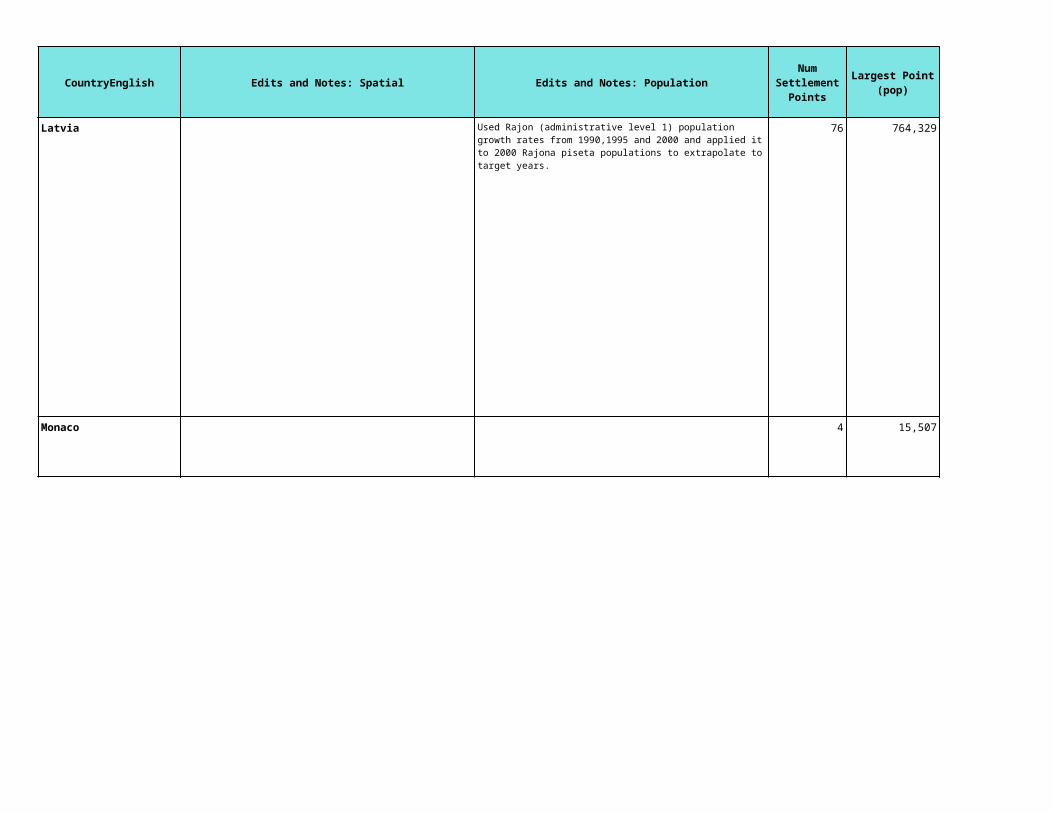
CountryEnglish
Latvia
Monaco
Edits and Notes: PopulationNum
Settlement Points
Largest Point (pop)
Smallest Point (pop)
Mean Point (pop)
Urban Criteria
(UN)Num Urban
ExtentsLargest Extent (sq.km)
76 764,329 1,207 21,661.58 33 1,195
4 15,507 1,034 8,005.00 1 3
Used Rajon (administrative level 1) population growth rates from 1990,1995 and 2000 and applied it to 2000 Rajona piseta populations to extrapolate to target years.
Cities and urban-type localities, of ficially designated as such, usually according to criteria based on the number of inhabitants and pre dominance of non-agricultural workers and their families.
Monaco (capital city).

CountryEnglish
Republic of Moldova
Macedonia
Malta
Edits and Notes: PopulationNum
Settlement Points
Largest Point (pop)
Smallest Point (pop)
Mean Point (pop)
Urban Criteria
(UN)Num Urban
ExtentsLargest Extent (sq.km)
26 662,000 15,200 64,685.27 20 534
30 463,738 13,938 48,513.33 21 487
In the Western District, population of Mtarfa added to Rabat. 60 22,348 1,273 6,528.88 2 225
Cities and urban-type localities, of ficially designated as such, usually according to criteria based on the number of inhabitants and the predominance of non-agricultural workers and their families.
A population growth rate was calculated between 1994 and 2000 to extrapolate to target years.
Not available.
Towns with 1,500 inhabitants or more and district centres.

CountryEnglish
Netherlands
Norway
Edits and Notes: PopulationNum
Settlement Points
Largest Point (pop)
Smallest Point (pop)
Mean Point (pop)
Urban Criteria
(UN)Num Urban
ExtentsLargest Extent (sq.km)
229 731,288 19,230 54,488.61 67 5,055
304 766,517 1,017 10,313.83 56 5,062
Boundary changes from 1990 to 2000 were accomodated in the following attribution of population:
- In Utrecht:* De Bilt and Maartensdijk are merged and assigned a single total population value.* Harmelen and Woerden are merged and assigned a single total population value.* Utrecht and Vleuten_De Meern are merged and assigned a single total population value.
- In North-Holland:* Bergen, Egmond, and Schoorl are merged and assigned a single total population value.* Waterland, Broek in Waterland, Monnickendam, Katwoude, Marken, Ilpendam, Landsmeer, and Purmerend are merged and assigned a single total population value.* In South Holland, Liemeer and Zevenhoven assigned a single total population value.
- In Limburg:* Born, Sittard and Geleen are merged and assigned a single total population value.* Belfeld, Tegelen, Venlo, Broekhuizen, Grubbenvorst, and Horst are merged and assigned a single total population value.* Heythuysen, Baexem, Grathem, Hunsel are merged and assigned a single total population value.
- In Overijssel:* Brederwiede, Zwartsluis, Genemuiden, Hasselt, Ijsselham, Steenwijk, Ijsselmuiden, Kampen, Zwolle, Dalfsen, Nieuwleusen, and Staphorst are merged and assigned a single total population value.* Den Ham and Vriezenveen are merged and assigned a single total population value.* Denekamp, Ootmarsum, Weerselo, Diepenheim, Goor, Markelo, Stad Delden, Holten, Rijssen, Hengelo, Oldenzaal, Ambt Delden, Almelo, and Borne are merged and assigned a single total population value.
Municipalities with 2,000 inhabi tants or more; municipalities with a population of fewer than 2,000 persons but with not more than 20 per cent of their economically active male popula tion engaged in agriculture; and specific residential municipalities of commuters.
Localities with 200 inhabitants or more.

CountryEnglish
Portugal
Romania
Edits and Notes: PopulationNum
Settlement Points
Largest Point (pop)
Smallest Point (pop)
Mean Point (pop)
Urban Criteria
(UN)Num Urban
ExtentsLargest Extent (sq.km)
460 573,830 3,455 14,887.23 83 2,511
865 1,950,063 0 18,163.69 237 775
Recent boundary divisions were accomodated in the following attribution of population: (1) Agualva, Cachem, Mira-Sinta, and S. Marcos merged into Agualva-Cachem; (2) Caxias merged into Paco de Arcos; (3) Aguas Vivas merged into Palacoulo; (4) Santa Cruz/Trindade merged into Outero Seco; (5) Gandaras merged into Lousa; (6) Meia Via merged into Torres Novas (Santiago); (7) Ilhues (Porto Santo) merged into Porto Santo; (8) Porto Martins merged into Cabo de Praia; (9) Longueira/Almograve merged into Odemeira (S. Salvador); (10) Boavista dos Pinheiros merged into Odemeira (S. Maria).
The 1990 and 1995 population estimates are based on 1981 and 1991 population census figures. A population growth rate was calculated between 1990 and 2001 to extrapolate to target years.
Agglomerations of 10,000 inhabi tants or more.
Mismatch problems between the population data and the boundary data led the following Communes (administrative level 3 units) to be dropped from the population data because we have no boundaries nor information about their location: Ciugud (in Alba); Cosesti and Mioveni (in Arges); Buchin (in Caras-Severin); Costinesti and Ghindaresti (in Constanta); Vale Mare (in Covasna); Rovinari (in Gorj); Gen. Berthelot (in Hunedoara); Poienelei Izei (in Maramures); Cornu (in Prahova); Treznea (in Salaj); and Silistea (in Teleorman). The total population of these units are 77, 162, about 0.35% of the total population of Romania in 2002.
There are also Communes were population data is not available, and were therefore assigned a population of zero (0): Sintea Mare (in Arad); Colibasi (in Arges); Sinteu (in Bihor); Sintereag (in Bistrita Nasaud); Cernele (in Dolj); Unirea (in Hunedoara); and Goranu (in Valcea).
The Municipul growth rates between census years 1992 and 2002 applied to 2002 Commune population to project to target years.
Cities, towns and 183 other locali ties having certain urban socio-economic character istics.

CountryEnglish
Russia
Serbia and Montenegro
Svalbard
Edits and Notes: PopulationNum
Settlement Points
Largest Point (pop)
Smallest Point (pop)
Mean Point (pop)
Urban Criteria
(UN)Num Urban
ExtentsLargest Extent (sq.km)
704 9,886,286 9,700 130,978.10 523 4,768
66 1,121,930 9,735 64,156.14 58 1,164
1 1,100 1,100 1,100.00 N/A
The population estimates for the target years were calculated using United Nations population growth rates and 1995 popualtion estimate.
Cities and urban-type localities, of ficially designated as such, usually according to criteria based on the number of inhabitants and the predominance of non-agricultural workers and their families.
A population growth rate was calculated between 1988 and 1998 to estimate 1990 and 1995 population. A population growth rate was calculated between 1998 and 2001 used to estimate populations for 2000.
Not available.
A population growth rate was calculated between 1995 (from Norway Stats) and 2003 (from CIA World Factbook) to extrapolate to target years.

CountryEnglish
San Marino
Slovakia
Slovenia
Edits and Notes: PopulationNum
Settlement Points
Largest Point (pop)
Smallest Point (pop)
Mean Point (pop)
Urban Criteria
(UN)Num Urban
ExtentsLargest Extent (sq.km)
4 4,911 1,089 2,703.75 N/A
137 426,939 1,417 21,941.33 87 432
156 265,615 1,211 11,825.44 38 755
The rate between P03 and P95E was calculated and used for projecting to P00E to P20E.
(1) For the following units, point coordinates were found, and their populations added to the spatial unit in which they fall: · Nový Svet· Malá Mača· Bohunice· Bádice· Dolné Lefantovce· Štitáre· Žitavany
(2) For two other units Hlboké nad Váhom and Potônske Lúky, populations were allocated proportionally among all ZUJ within the appropriate Okres.
(3) The 2001 OkresMunicipality (administrative level 2) data are aggregated to spatially match 1997 Okres boundaries in order to calculate the Okres growth rates. Then Okres growth rate from 1997 to 2001 used to project 2001 UTJ level population to target years.
(4) The 5% rate cap was applied to the following Okres: Levice, Nitra, Bytca, Liptovsky Mikulas, Namestovo, Turcianske Teplice, Zilina, Velky Krtis, Zvolen, and Sabinov.
138 cities with 5,000 inhabitants or more.
The 2002 Municipality (administrative level 2) data are aggregated to spatially match 1995 Municipality boundaries to calculate population growth rates. The municipal growth rates between 1995 and 2002 were computed and applied to Settlements for extrapolation to target years.
Not available.

CountryEnglish
Sweden
Ukraine
Holy See
Edits and Notes: PopulationNum
Settlement Points
Largest Point (pop)
Smallest Point (pop)
Mean Point (pop)
Urban Criteria
(UN)Num Urban
ExtentsLargest Extent (sq.km)
574 1,212,196 1,003 11,327.72 153 2,292
102 2,609,662 50,082 219,775.34 82 1,627
N/A
To accomodate recen boundary divisions, the population of Nykvarn and Soedertaelje are aggregated to form one unit with the name of Soedertaelje.
Built-up areas with at least 200 in habitants and where houses are at most 200 metres from each other.
Oblast growth rate between 1996 and 2004 applied to 1989 Rayon population to extrapolate the population to target years.
Cities and urban-type localities, of ficially designated as such, usually according to criteria based on the number of inhabitants and pre dominance of non-agricultural workers and their families.

CountryEnglish
Ireland
Poland
Aruba
Anguilla
Edits and Notes: PopulationNum
Settlement Points
Largest Point (pop)
Smallest Point (pop)
Mean Point (pop)
Urban Criteria
(UN)Num Urban
ExtentsLargest Extent (sq.km)
189 986,999 1,010 12,110.99 57 1,411
226 1,666,203 19,482 83,410.21 167 2,368
2 25,643 15,597 20,620.00 1 61
3 1,182 1,121 1,152.00 1 70
Cities and towns, including suburbs, with 1,500 inhabitants or more.
A population growth rate was calculated between 1998 and 2001 to extrapolate to target years.
Towns and settlements of an urban type (for example, workers' settlements, fisher men's settlements and health resorts).
continental median
In the absence of more detailed in formation the entire population is considered urban.

CountryEnglish
Netherland Antilles
Antigua and Barbuda
Bahamas
Belize
Bermuda
Barbados
Edits and Notes: PopulationNum
Settlement Points
Largest Point (pop)
Smallest Point (pop)
Mean Point (pop)
Urban Criteria
(UN)Num Urban
ExtentsLargest Extent (sq.km)
1 51,826 51,826 51,826.00 1 358
12 24,380 1,011 3,271.58 1 273
12 210,832 1,178 23,229.33 4 219
9 49,050 4,329 12,726.78 6 127
1 1,752 1,752 1,752.00 2 44
3 97,500 1,047 34,218.00 1 434
Administrative level 1 (Island) data were available from 1990-2001, with the exception of Curacao where administrative level 2 (Geozone) data are available for 2001. The population for all units were projected based on the Island-level growth rates between 1990 and 2001.
Population of the urban agglomera tions of Willemstad, Philipsburg and Kralendjik.
Saint John's (capital city).
Not available.
Not available.
Entire population.
Bridgetown (capital city).

CountryEnglish
Canada
Costa Rica
Edits and Notes: PopulationNum
Settlement Points
Largest Point (pop)
Smallest Point (pop)
Mean Point (pop)
Urban Criteria
(UN)Num Urban
ExtentsLargest Extent (sq.km)
884 4,318,307 1,003 26,695.04 324 5,606
32 309,700 19,200 44,351.97 9 1,979
Subdivision growth rates based on 1991 and 1996 were used to estimate 1990 and 1995 populations.
Used Census division population totals (and boundaries) for 1996 and 2001 to calculate growth rates. These were applied to 1996 to estimate 2000 through 2015.
Areas with at least 1,000 inhabitants and a population density of at least 400 persons per square kilometer at the previous census.
Population was estimated using inter-censal growth rates between the years 1996 and 2000, at Municipio level. For calculations before this period, we used the CEPAL's growth rates at Department level
Administrative centres of cantons, including adjacent areas with clear urban character istics such as streets, urban services and electricity.
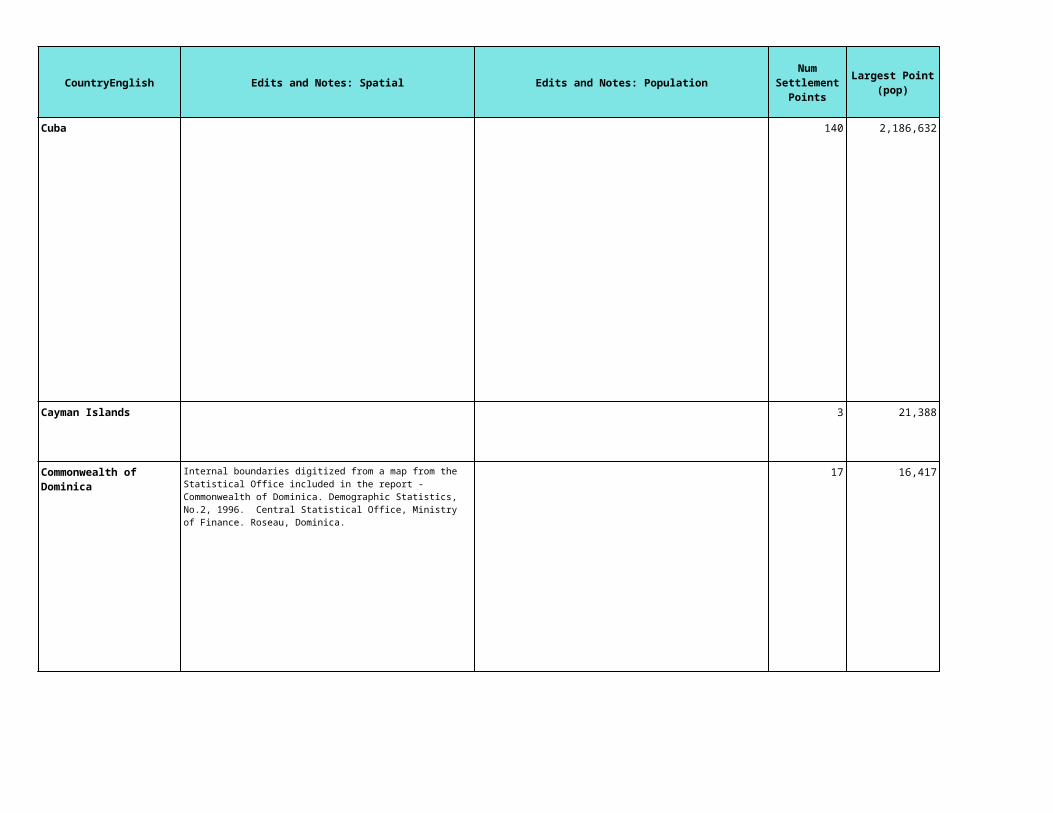
CountryEnglish
Cuba
Cayman Islands
Commonwealth of Dominica
Edits and Notes: PopulationNum
Settlement Points
Largest Point (pop)
Smallest Point (pop)
Mean Point (pop)
Urban Criteria
(UN)Num Urban
ExtentsLargest Extent (sq.km)
140 2,186,632 2,297 59,737.77 114 1,412
3 21,388 5,977 11,970.67 1 188
17 16,417 1,038 2,752.35 3 78
Places with 2,000 inhabitants or more, and places with fewer inhabitants but having paved streets, street lighting, piped water, sewage, a medical centre and educational facilities.
Entire population.
Cities and villages with 500 inhabi tants or more.

CountryEnglish
Dominican Republic
Guadeloupe
Grenada
Edits and Notes: PopulationNum
Settlement Points
Largest Point (pop)
Smallest Point (pop)
Mean Point (pop)
Urban Criteria
(UN)Num Urban
ExtentsLargest Extent (sq.km)
42 1,957,196 4,754 103,317.07 30 1,384
33 63,104 1,244 12,839.85 4 573
6 3,974 1,172 2,465.00 4 90
Census 2002 lists two additional provinces: San Jose de Ocoa and Santo Domingo. · San Jose de Ocoa was formerly part of the province of Peravia, and became its own province in 2001. The 2002 population of San Jose de Ocoa was therefore added to Peravia. · Santo Domingo is a district within the Distrito Nacional. For the purposes of joining data, Santo Domingo's population has been added to that of the entire province.
Administrative centres of Comunas and municipal districts.
Localities with 2,000 inhabitants or more.
Parishes of St. George's Town and St. George.

CountryEnglish
Greenland
Edits and Notes: PopulationNum
Settlement Points
Largest Point (pop)
Smallest Point (pop)
Mean Point (pop)
Urban Criteria
(UN)Num Urban
ExtentsLargest Extent (sq.km)
14 13,513 1,008 3,141.64 2 42The municipality (administrative 2 level) population includes population outside Greenland, termed as “Outside Municipalities." The population "Outside Municipalities" was split between the three regions (East, West, and North) proportionately based on the population in those regions from all other places.
The population of the towns listed below were assigned to the “greenland rest” polygons (i.e., the “outside municipalities”) depending on which region they fell within based on the maps at http://www.world-gazetteer.com/s/p_gl.htm and http://www.statgreen.gl/english/map.html· Illoqqortoormiut – East· Ivittuut – West· Kangaatsiaq - West· Qaanaaq - North
Localities with 200 inhabitants or more.

CountryEnglish
Guatemala
Edits and Notes: PopulationNum
Settlement Points
Largest Point (pop)
Smallest Point (pop)
Mean Point (pop)
Urban Criteria
(UN)Num Urban
ExtentsLargest Extent (sq.km)
46 1,969,598 6,209 94,380.15 26 1,516The municipio of Guatemala De partment and officially recognized centres of other departments and municipalities. The urban popula tion for 1981 is officially adjusted to include the urbanized suburbs bordering the municipio of Gua temala in a way consistent with the previous census.

CountryEnglish
Honduras
Haiti
Edits and Notes: PopulationNum
Settlement Points
Largest Point (pop)
Smallest Point (pop)
Mean Point (pop)
Urban Criteria
(UN)Num Urban
ExtentsLargest Extent (sq.km)
53 732,724 2,251 43,444.47 34 986
15 934,836 7,626 127,327.00 9 328
For the following Aldeas (administrative level 3) without matching polygons, their point coordinates were found and their populations added to the spatial unit in which they fall: o San Antonio de Cañas, in municipio of Comayagua, Departamento Comayagua; o Santa Rosa de Copán in municipio of Santa Rosa de Copán and La Peña in municipio of El Paraíso, departamento of Copan; o Armenta in municipio of San Pedro Sula, departamento Cortes; o El Rebalse, Las Cañas and Las Trojas in municipio of San Antonio de Flores, departamento Choluteca; o El Chilito in municipio Morocelí, departamento El Paraiso; o Las Lajitas and San Ramón in municipio Talgua, departamento Lempira; o El Portillo in municipio of Sinuapa, departamento Ocotepeque; o Río Negro and San Pedro de Pisijire in municipio Dulce Nombre de Culmí, departamento of Olancho; o Buena Vista and Sorca in municipio of Arada, and Venado in municipio of Quimistán, departamento of Santa Barbara.
For Aldeas (administrative level 3) where no point coordinates are found, their population were allocated proportionally among all Aldeas within the appropriate Municipio: o Concepcion del Liston, El Pinal, Vista Hermosa, Col. Brisas del Campo, Rio Chiquito, El Povenir o el Descanso, Union Frontera, and Buena Vista in the municipio of Quimistan, Santa Barbara; o Aldea Nueva in municipio Lempira, Tomala; o Banaka and Guapote Abajo in muncipio Juan Francisco Bulnes, and Nueva Guniea in municipio Villeda Morales, departamento of Gracias A Dios; o El Chaparral o Marilica in muncipio of Pespire, Choluteca; o El Retiro in San Pedro Sula, Cortes; o Nueva Suyapa and La Cumbre de las Flores # 2 o in municipio of Florida, and Nueva Esperanza in municipio of Cabañas, in departamento of Copan; o La Providencia in Las Lajas, Comayagua.
· For Aldeas (administrative level 3) with neither 1988 nor 2001 population, Departmento level growth rates between 1988 and 2001 are calculated and applied to the available year and projected to target years: o In Departamento of Atlantda, Armenia Bonito,Bonitillo,Dantillo,El Bufalo,San Jose de Texiguat, and Satuye; o Tambor Abajo in Choluteca; o In Colon, Campo Bohemio o Alianza,Campo Copete,Campo El Olvido,Campo Guanacaste,Campo Nerones,ChapaguaCol.
Populated centres with 2,000 inhabi tants or more and with the following characteristics: piped water service; communication by land (road or train) or regular air or maritime service; com plete primary school (6 grades); postal service or telegraph; and at least one of the following: electri cal light, sewer system, or a health centre.
Administrative centres of communes.

CountryEnglish
Jamaica
Saint Kitts and Nevis
Saint Lucia
Edits and Notes: PopulationNum
Settlement Points
Largest Point (pop)
Smallest Point (pop)
Mean Point (pop)
Urban Criteria
(UN)Num Urban
ExtentsLargest Extent (sq.km)
18 686,552 4,292 67,578.94 11 1,127
4 13,311 1,033 4,354.50 2 149
9 59,927 1,124 8,959.67 3 220
Kingston metropolitan area and se lected main towns.
Basseterre and Charlestown.
Population data were extrapolated to target years of 1990, 1995 and 2000 using growth rates derived from United Nations national level estimates and projections.
Castries (capital city).

CountryEnglish
Mexico
Edits and Notes: PopulationNum
Settlement Points
Largest Point (pop)
Smallest Point (pop)
Mean Point (pop)
Urban Criteria
(UN)Num Urban
ExtentsLargest Extent (sq.km)
787 18,326,722 3,859 101,779.88 465 4,504Based on the comparisons between the boundary data and INEGI's interactive map (http://galileo.inegi.gob.mx/website/mexico/viewer.htm), recent boundary divisions were accomodated in the following attribution of population:
· In Aguascalientes, the populations of El Llano and San Francisco de los Romo are added to the municipio Aguascalientes. · In Baja California, population of Playas de Rosarito added to Tijuana. · In Baja California Sur, population of Loreto added to Comondu; population of Los Cabos added to La Paz. · In Campeche, population of Calakmul added to Chamopoton; population of Candelaria added to Carmen; Escárcega, Carmen and Chamopoton are merged and assigned a single, total population value. · In Chiapas, population of Aldama added to Chenalho; populations of Benemérito de las Américas and Marqués de Comillas are added to Ocosingo; population of Maravilla Tenejapa added to Las Margaritas; population of Montecristo de Guerrero added to Angel Albino Corzo; population of San Andrés Duraznal added to Simojovel; and population of Santiago el Pinar added to San Adres Larrainzal; population of Unión Juárez added to Cacahoatan; population of San Juan Cancuc added to Sitalla. · In Guerrero, population of Acatepec added to Zapotitlán Tablas. · In Mexico, population of Valle de Chalco Solidaridad added to Ixtapaluca. · In Quintna Roo, population Solidaridad added to Cozumel. · In San Luis Potosí, population of Matlapa added to Tamazunchale; and population of El Naranjo added to Ciudad de Maiz.· In Sonora, populations of San Ignacio Río Muerto and Benito Juárez are added to Huatabampo.· In Tlaxcala: o population of Benito Juarez added to Sanctorum de Lazaro Cardenas;
Localities with 2,500 inhabitants or more.

CountryEnglish
Montserrat
Martinique
Edits and Notes: PopulationNum
Settlement Points
Largest Point (pop)
Smallest Point (pop)
Mean Point (pop)
Urban Criteria
(UN)Num Urban
ExtentsLargest Extent (sq.km)
1 2,000 2,000 2,000.00
32 93,401 1,390 11,949.87 1 980
Plymoth. Due to volcanic activity, the capital Plymouth was abandoned in 1997. The interim government buildings have been built at Brades, in the Carr's Bay/Little Bay vicinity at the northwest end of Montserrat.
Total population of the Commune of Fort-de-France plus the agglomerations of the other communes with 2,000 inhabitants or more.

CountryEnglish
Nicaragua
Edits and Notes: PopulationNum
Settlement Points
Largest Point (pop)
Smallest Point (pop)
Mean Point (pop)
Urban Criteria
(UN)Num Urban
ExtentsLargest Extent (sq.km)
40 954,135 9,384 56,768.75 28 1,221CEPAL's department level growth rate from 1971 to 1995 applied to 1995 population project to target years.The following units are merged and their populations aggregated:· In the Region Autonoma del Atlantico Sur - El Ayote merged with El Rama; El Tortugero merged with La cruz de Rio Grande; Corn Island merged with Laguna de Perlas.· In Departamento de Chontales – San Francisco de Cuapa merged with Juigalpa; El Coral merged with Villa Sandino.· In Departamento de Jinotega – El Cua merged with San Jose de Bocay.· In Departamento de Nueva Segovia – Wiwili de Nueva Segovia merged with Wiwili de Jinotega.· In Departamento de Chinandega – SantoTomas del Norte merged with San Pedro del Norte.· In Departamento de Managua - El Crucero and Ciudad Sandino merged with Managua.
Administrative centres of depart ments and municipios.
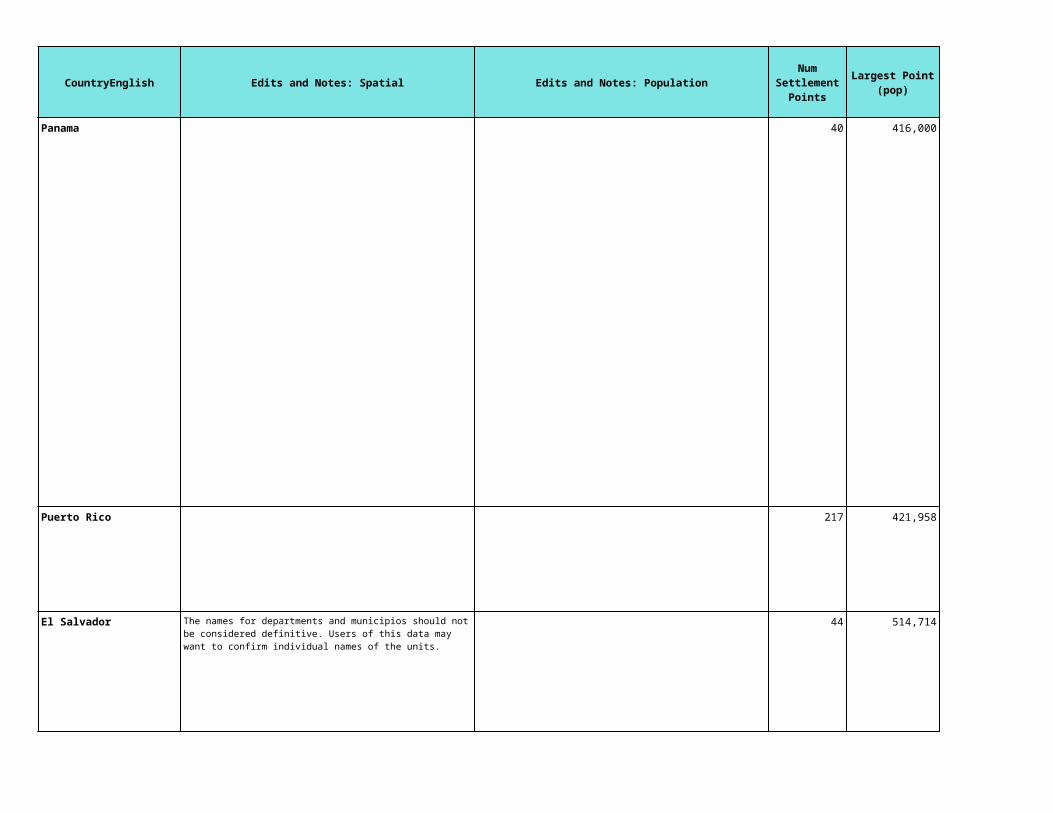
CountryEnglish
Panama
Puerto Rico
El Salvador
Edits and Notes: PopulationNum
Settlement Points
Largest Point (pop)
Smallest Point (pop)
Mean Point (pop)
Urban Criteria
(UN)Num Urban
ExtentsLargest Extent (sq.km)
40 416,000 3,100 34,805.98 18 1,276
217 421,958 1,024 10,443.82 3 6,558
44 514,714 8,956 59,508.45 18 1,494
Localities with 1,500 inhabitants or more having the following urban characteristics: electricity, water-supply and sewerage systems, paved roads and access to commercial establish ments, secondary schools and social and recrea tional centres.
Places with 2,500 inhabitants or more and urbanized areas.
Administrative centres of municipios.

CountryEnglish
St-Pierre and Miquelon
Trinidad and Tobago
United States of America
Turks and Caicos Islands
Edits and Notes: PopulationNum
Settlement Points
Largest Point (pop)
Smallest Point (pop)
Mean Point (pop)
Urban Criteria
(UN)Num Urban
ExtentsLargest Extent (sq.km)
1 5,622 5,622 5,622.00 1 22
2 4,800 1,500 3,150.00
21 203,975 3,000 44,667.62 3 2,021
14,462 8,080,286 1,000 14,342.01 1,634 20,234
A 1990–1999 population growth rate was calculated to extrapolate figures to the target years of 1990, 1995 and 2000.
Saint-Pierre (capital city).
Grand Turk (in 1990, including sur rounding areas).
In 2000, the Port of Spain population was added to the population of Diego Martin and the Borough of Arima pop added to Arima.
Port-of-Spain, Arima borough and San Fernando town.
1995 was interpolated by using growth rates based on 1990 and 2000 population values (census population counts for 1990 and 2000). Where values in 1990 or 2000 were zero, a proxy value of 1 was used to calculate the rates.
2005-2025 were estimated using growth rates based on US Census Bureau state-level population projections. Series 'A' projections were used from: http://www.census.gov/population/projections/state/stpjpop.txt and http://www.census.gov/population/www/projections/stproj.html
Places with 2,500 inhabitants or more and urbanized areas, that is, contiguous built up territory around a larger city.

CountryEnglish
St. Vincent
British Virgin Islands
American Samoa
United States Virgin Islands
Edits and Notes: PopulationNum
Settlement Points
Largest Point (pop)
Smallest Point (pop)
Mean Point (pop)
Urban Criteria
(UN)Num Urban
ExtentsLargest Extent (sq.km)
6 27,483 1,000 5,630.50 2 119
1 9,634 9,634 9,634.00 1 54
8 11,791 2,181 4,800.63 2 211
15 8,615 1,097 3,285.47 1 122
Not available.
Total population for 1990 and 1995 was distributed proportionately to the population figures for the four islands based on the rough figures.
Road Town and East End Long Look.
County level growth rate between 1990 and 2000 used to extrapolate to target years.
Places of 2,500 inhabitants or more and urbanized areas.
A population growth rate was calculated between 1990 and 2000 for extrapolation to target years.
Places with 2,500 inhabitants or more and urbanized areas.

CountryEnglish
Australia
Cook Islands
Fiji
Edits and Notes: PopulationNum
Settlement Points
Largest Point (pop)
Smallest Point (pop)
Mean Point (pop)
Urban Criteria
(UN)Num Urban
ExtentsLargest Extent (sq.km)
224 4,098,478 1,289 80,963.63 148 3,117
1 9,016 9,016 9,016.00 1 56
15 180,019 1,790 26,652.73 7 1,054
1990 and 1995 population values based on SLA figures for 1996 and population for Statistical Subdivisions for 1991 obtained from the Australian Bureau of Statistics, www.abs.gov.au .
The State level growth rate between census years 1996 and 2001 are calculated and applied to 1995 SLA estimated population to extrapolate to target years.
One or more census divisions with urban characteristics and representing a cluster of 1,000 people or more as well as known holiday re sorts of less population if they contain 250 dwell ings or more of which at least 100 were occupied on census night.
Rate between 1991 and 1996 used to estimate 1990 and 1995. Rate between 1996 and 2001 applied to project to additional target years.
Island of Rarotonga.
National growth rates were computed using national population data from Fiji Statistics Agency for the years 1986–1996 and 1996–2001 and applied to 1996 province population to project/backast to 1990–1995, and 2000–2020 respectively.
Places with 1,000 inhabitants or more.

CountryEnglish
Guam
Kiribati
Marshall Islands
Federated State of Micronesia
Northern Mariana Islands
Edits and Notes: PopulationNum
Settlement Points
Largest Point (pop)
Smallest Point (pop)
Mean Point (pop)
Urban Criteria
(UN)Num Urban
ExtentsLargest Extent (sq.km)
17 13,900 1,297 4,474.82
27 12,501 1,122 3,620.67 1 518
17 6,445 1,530 2,833.35 2 2
2 19,633 9,443 14,538.00 1 4
14 8,297 1,785 3,871.21 1 108
Applied the Island growth rates for 1994–2000, as estimated by the Government of the Federated States of Micronesia, to the 2000 Island population.
Localities with 1,000 inhabitants or more.
Population data were extrapolated to target years of 1990 and 1995 using growth rates derived from United Nations national level estimates and projections.
Places with 2,500 inhabitants or more and urbanized areas.
South Tarawa (capital city).
The entire population of Majuro At oll and the town of Ebeye Island on Kwajalein Atoll.
Population data were extrapolated to target years of 1990 and 1995 using growth rates derived from United Nations national level estimates and projections.
Places with 1,000 inhabitants or more.
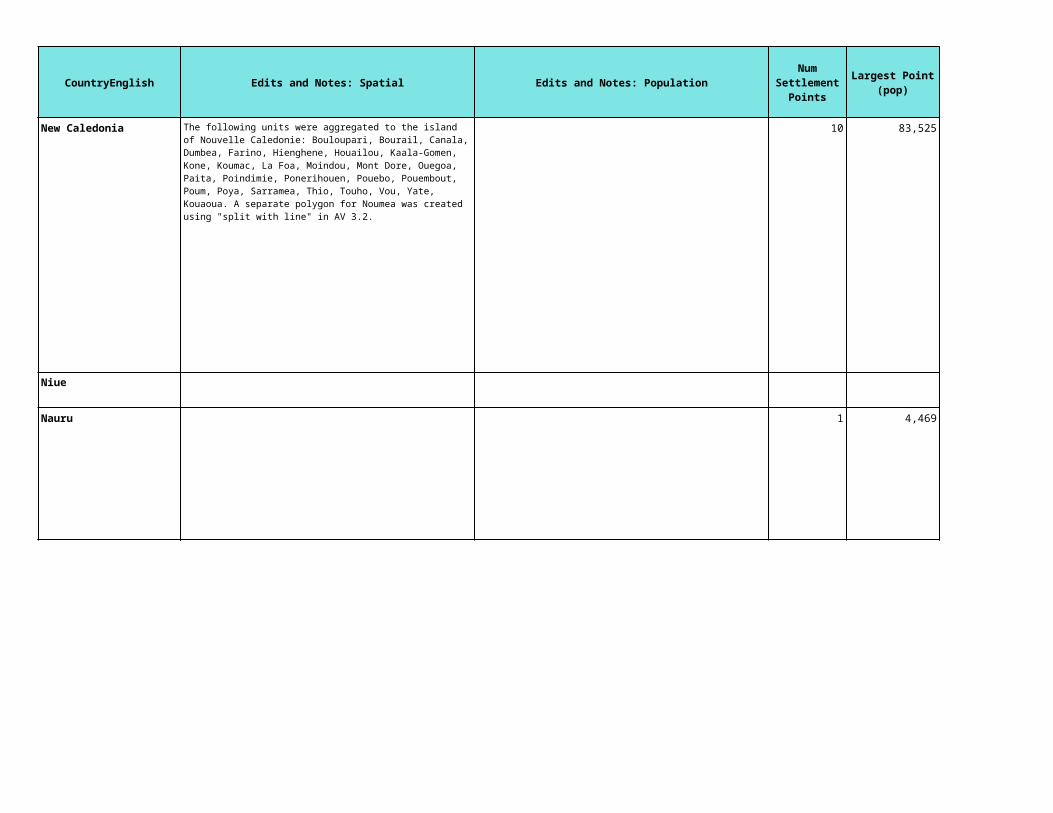
CountryEnglish
New Caledonia
Niue
Nauru
Edits and Notes: PopulationNum
Settlement Points
Largest Point (pop)
Smallest Point (pop)
Mean Point (pop)
Urban Criteria
(UN)Num Urban
ExtentsLargest Extent (sq.km)
10 83,525 2,692 15,587.40 1 209
N/A
1 4,469 4,469 4,469.00 N/A 1 16
Urban agglomeration of Noumea (in cluding Dumbea, Mont-Dore and Paita) and other urban localities (Bourail, Kone, Koumac, La Foa, Poindime and Thio).

CountryEnglish
New Zealand
Pitcairn
Palau
Edits and Notes: PopulationNum
Settlement Points
Largest Point (pop)
Smallest Point (pop)
Mean Point (pop)
Urban Criteria
(UN)Num Urban
ExtentsLargest Extent (sq.km)
113 355,100 1,195 29,205.27 46 944
N/A
2 12,318 1,193 6,755.50 1 12
The Census population values used are based on "Usually resident population." Ward (administrative level 2) population data for 2001 are not available. Thus, a District (administrative level 1) growth rate between 1991 and 2001 was used to extrapolate the Ward (administrative level 2) population to target years.
Twenty-four urban areas plus all boroughs, town districts, townships and country towns with a population of 1,000 or more.
The population growth rate between 1990–2000 was used for extrapolating to target years.
Koror (capital city).

CountryEnglish
Papua New Guinea
French Polynesia
Solomon Islands
Tonga
Edits and Notes: PopulationNum
Settlement Points
Largest Point (pop)
Smallest Point (pop)
Mean Point (pop)
Urban Criteria
(UN)Num Urban
ExtentsLargest Extent (sq.km)
35 254,158 1,037 19,097.17 20 397
35 25,936 1,085 4,854.69 2 211
4 50,950 1,313 14,234.25 1 74
8 23,921 1,161 5,409.38 1 183
1995 calculated using average annual population growth rates between 1980–1990. The United Nations 1990–2000 population growth rate was used for extrapolating to other target years.
Centres with 500 inhabitants or more, excluding separately located schools, hospi tals, missions, plantations, rural settlements and rural villages regardless of population size.
The population growth rates between 1988–1996 was used to estimate the 1990 and 1995 populations. The 1996–2002 rate was used to estimate the 2000–2020 (quinquennialy) populations.
Places with 1,000 inhabitants or, more.
Places with 1,000 inhabitants or more.
Greater Nuku'alofa (including Ko lomotu'a and Kolof'ou districts).

CountryEnglish
Tuvalu
Vanuatu
Wallis and Futuna
Western Samoa
Edits and Notes: PopulationNum
Settlement Points
Largest Point (pop)
Smallest Point (pop)
Mean Point (pop)
Urban Criteria
(UN)Num Urban
ExtentsLargest Extent (sq.km)
2 30,611 11,210 20,910.50 2 61
2 1,102 1,083 1,092.50
20 38,337 1,104 3,649.65 1 82
GPW2 for all islands other than Niulakita. Niulakita located from World Vector Shoreline; island names were identified from http://www.janeresture.com/tuvislands/index.htm
Funafuti (capital city).
Luganville centre and Vila urban.
1996 Island group population data were extrapolated to target years of 1990, 1995 and 2000 using growth rates derived from United Nations national level estimates and projections.
No urban population. Mata-Utu (capital) defined according to administrative boundaries.
National growth rate from 1991 to 2001 applied to 2001 population to project to target years of 1990, 1995 and 2000.
Urban area of Apia, comprising the Faipule districts of Vaimuga West and Foleata East, and other urban areas.

CountryEnglish
Argentina
Edits and Notes: PopulationNum
Settlement Points
Largest Point (pop)
Smallest Point (pop)
Mean Point (pop)
Urban Criteria
(UN)Num Urban
ExtentsLargest Extent (sq.km)
1,091 2,724,824 1,006 28,457.64 465 5,235Based on the jpg Provincial boundary maps downloaded from Resultados Provinciales del Censo 2001 - Información seleccionada (http://www.indec.mecon.ar/webcenso/provincias_2/provincias.asp), the following edits are made:
(1) in Buenos Aires, the populations of Hurlingham, Ituzaingó are added to Morón; Ezeiza added to Esteban Echeverría; population of Presidente Perón added to San Vicente; population of Punta Indio added to Magdalena. (2) In Provincia del Chaco, the polygons for 12 de Octubre and Fray Justo Santa María de Oro are merged and their populations and the populations of 2 de Abril added together. (3) In Provincia de Entre Ríos, the polygons for Colón, Concordia and Villaguay are merged and their populations and San Salvador are added together. (4) In Provincia de Misiones, the population of Capital are added to Apóstoles.
Population centres with 2,000 inhabitants or more.

CountryEnglish
Bolivia
Brazil
Edits and Notes: PopulationNum
Settlement Points
Largest Point (pop)
Smallest Point (pop)
Mean Point (pop)
Urban Criteria
(UN)Num Urban
ExtentsLargest Extent (sq.km)
95 1,077,218 1,277 53,239.57 67 783
4,243 17,075,936 1,001 36,840.29 2,133 6,459
Localities with 2,000 inhabitants or more.
Urban and suburban zones of admin istrative centres of municipios and districts.

CountryEnglish
Chile
Colombia
Edits and Notes: PopulationNum
Settlement Points
Largest Point (pop)
Smallest Point (pop)
Mean Point (pop)
Urban Criteria
(UN)Num Urban
ExtentsLargest Extent (sq.km)
62 4,502,864 19,343 169,906.95 40 2,205
783 6,230,938 1,010 38,178.56 353 2,865
Recent boundary divisions were accomodated in the following attribution of population: - We assign the populations of Aisen and Cisnes municipios to Cisnes, although rendered as two separate polygons in the interactive map, our shapefile indicated only one polygon, Cisnes, which visual approximates the size and shape of these two municipalities combined. - The following muncipios were merged into Chilena Punta Rio Natales: Antartic Chilena, Punta Arenas, Rio Verde (Is), and Natalie (Is) (also called Puerto Natales). They were assigned a single, total population value.- Cabo de Hornos merges the municipalities of Timaukel and Cabo de Hornes. - In Atacama region, the muncipios of Copiapo and Cladera are merged. - In Metropolitana region, in the province of Talagante, the municipio Penaflor and Padre Hurtado are merged. - The following muncipios within Region Metropolitana, Provincia Santiago are treated as Provincia Santiago (I.e., we did not have the boundaries at the municipio-level for this province): Lo Barnechea, Vitacura, Las Condes, La reina, Penalolen, La Florida, Huechuraba, Recoleta, Providencia, Nunoa, Macul, Quilicura, Conchali, Independicia, Renca, Cerro Navia, Quinta Normal, Lo Prado, Estacion central, Santiago, San Joaquin,
Populated centres with definite ur ban characteristics, such as certain public and mu nicipal services.
CEPAL department level growth rate from 1985 to 1993 applied to 1993 muncipio population data.
Population living in a nucleus of 1,500 inhabitants or more.

CountryEnglish
Ecuador
Falkland Islands
French Guiana
Edits and Notes: PopulationNum
Settlement Points
Largest Point (pop)
Smallest Point (pop)
Mean Point (pop)
Urban Criteria
(UN)Num Urban
ExtentsLargest Extent (sq.km)
Department level growth rate between years 55 1,915,560 9,991 118,623.75 40 1,692
1 1,953 1,953 1,953.00
16 53,012 1,060 10,079.38 4 218
Capitals of provinces and cantons.
Stanley (capital city).
Population was estimated using inter-censal growth rates between the years 1990 and 1999, at municipio level.
Not available.

CountryEnglish
Guyana
Peru
Edits and Notes: PopulationNum
Settlement Points
Largest Point (pop)
Smallest Point (pop)
Mean Point (pop)
Urban Criteria
(UN)Num Urban
ExtentsLargest Extent (sq.km)
11 258,363 1,169 34,874.36 6 274
704 7,410,550 1,002 34,249.07 108 2,029
Cities of Georgetown, New Amster dam and Upper Demerara River.
Departamento level growth rate from 1993 to 2000 applied to 2000 distrito population to project to target years.
Populated centres with 100 dwell ings or more grouped contiguously and administra tive centres of districts.

CountryEnglish
Paraguay
Suriname
Edits and Notes: PopulationNum
Settlement Points
Largest Point (pop)
Smallest Point (pop)
Mean Point (pop)
Urban Criteria
(UN)Num Urban
ExtentsLargest Extent (sq.km)
36 474,875 1,670 62,302.92 18 1,661
15 233,417 1,451 20,613.80 2 429
Recent boundary divisions were accomodated in the following attribution of population:
(1) In the departamento of Caagazu, population of Vaqueria added to YHU. (2) In the departamento of Camindeyu, populations of Katuete, La Paloma, and Nueva Esperanza are added to F. Caballero Alvarez. (3) In Guaira, population of Paso Yobai are added to Colonia Independencia; and population of Felix Perez Cardozo added to Yataity. (4) In Itapua, population of Itapua Poti are added to Capitan Mesa. (5) In Pres. Hayes, population of Jose Falcon and Nanawa are added to Villa Hayes. (6) In Concepcion, population of Vallemi added to San Lazaro. (7) In San Pedro, population of Puerto Rosario added to Villa del Rosario.
Administrative centres of the official districts of the Republic.
Greater Paramaribo.

CountryEnglish
Uruguay
Venezuela
Edits and Notes: PopulationNum
Settlement Points
Largest Point (pop)
Smallest Point (pop)
Mean Point (pop)
Urban Criteria
(UN)Num Urban
ExtentsLargest Extent (sq.km)
106 1,655,689 1,011 28,150.29 62 1,471
591 1,793,357 1,157 35,267.48 177 6,241
Cities as officially defined.
(1) Indigenous population not included in the municipio census counts. (2) Estado level growth rates between 1990 and 2001 applied for municipos in Dependencia Federales as 1990 populaiton is not available at this level. (3) A 5% rate cap applied to municipios with rates over 5%. (4) Based on the maps included in the Census 2001 province reports, the following edits are made: a. In the estado of Delta Amacuro, the population of Casacoima are added to Tucupita. b. Anzoategui estado, population of San Juan de Capistrano are added to Fernando de Peñalver; population of Santa Ana and Sir Artur Mc Gregor are added to Aragua. c. In the estado of Aragua, population of Francisco Linares Alcántara are added to Santiago Mariño; population of José Félix Ribas are added to José Rafael Revenga; population of Ocumare de la Costa de Oro are added to Mario Briceño Iragorri. d. In Barinas, the population of Andrés Eloy Blanco are added to Ezequiel Zamora. e. In Bolivar, the population of Padre Pedro Chien are added to Piar. f. In Carabobo, population of Libertador and SanDiego are added to Valencia; population of Naguanagua are added to Montalban. g. In Cojedes, the population of Lima Blanco are added to Cojedes; The population of Rómulo Gallegos are added to San Carlos. h. In Falcon, population of Sucre are added to Bolivar;
Places with 2,500 inhabitants or more.
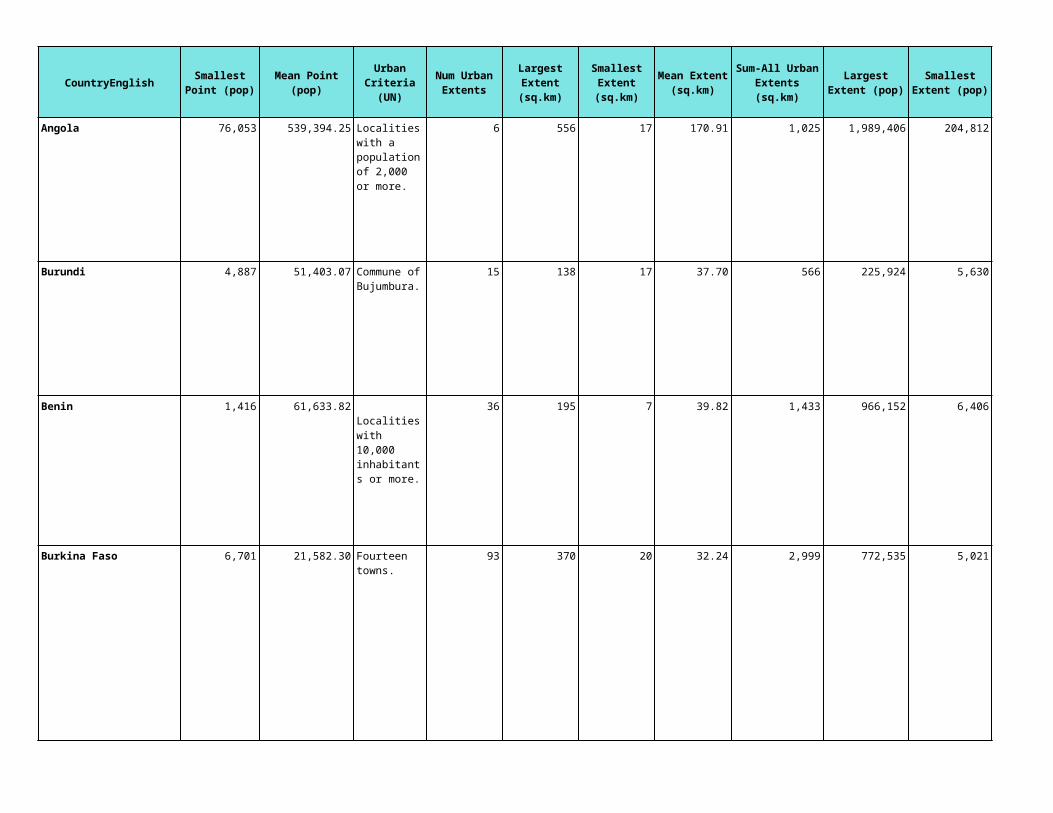
CountryEnglish
Angola
Burundi
Benin
Burkina Faso
17 170.91 1,025 1,989,406 204,812 698,129.67 4,188,778 0.08 30.51 34.90 4
17 37.70 566 225,924 5,630 37,623.73 564,356 2.24 8.52 9.30 1
7 39.82 1,433 966,152 6,406 66,937.86 2,409,763 1.24 38.81 43.00 8
20 32.24 2,999 772,535 5,021 15,628.74 1,453,473 1.09 12.56 16.90 8
Smallest Extent (sq.km)
Mean Extent (sq.km)
Sum-All Urban Extents (sq.km)
Largest Extent (pop)
Smallest Extent (pop)
Mean Extent (pop)
Sum-All Urban Extents (pop)
Pct Total Land Area in
Urban Extents (sq.km)
Pct Total Population
in Urban Extents
(2000,NSO est.)
Pct Total Population
that is urban (2000,UN)
Num UE's from
Nighttime Lights
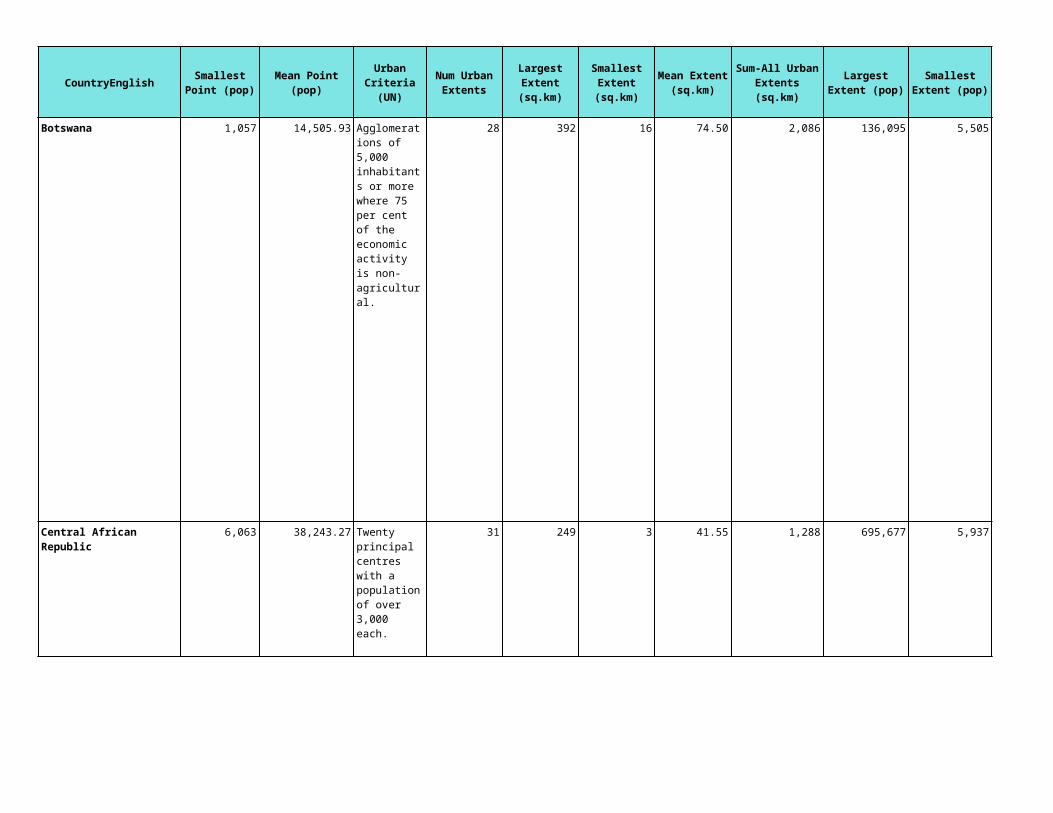
CountryEnglish
Botswana
Central African Republic
Smallest Extent (sq.km)
Mean Extent (sq.km)
Sum-All Urban Extents (sq.km)
Largest Extent (pop)
Smallest Extent (pop)
Mean Extent (pop)
Sum-All Urban Extents (pop)
Pct Total Land Area in
Urban Extents (sq.km)
Pct Total Population
in Urban Extents
(2000,NSO est.)
Pct Total Population
that is urban (2000,UN)
Num UE's from
Nighttime Lights
16 74.50 2,086 136,095 5,505 21,887.39 612,847 0.37 38.52 49.40 14
3 41.55 1,288 695,677 5,937 45,222.84 1,401,908 0.21 39.61 41.70 2
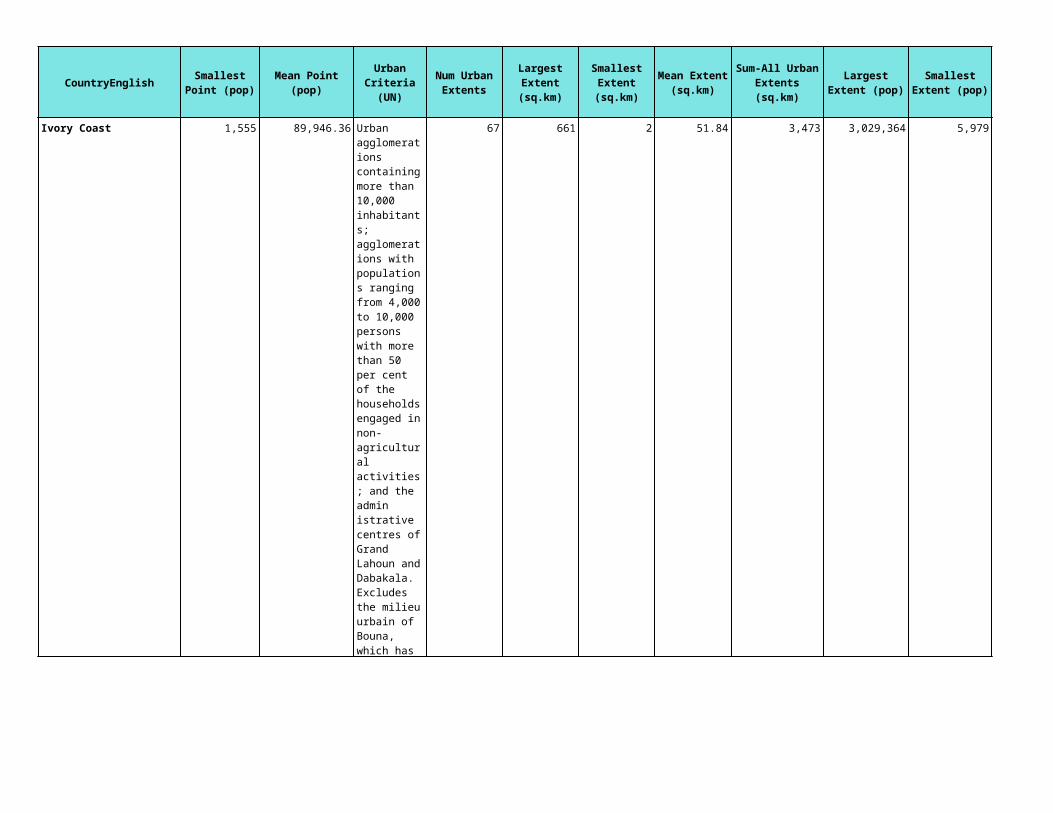
CountryEnglish
Ivory Coast
Smallest Extent (sq.km)
Mean Extent (sq.km)
Sum-All Urban Extents (sq.km)
Largest Extent (pop)
Smallest Extent (pop)
Mean Extent (pop)
Sum-All Urban Extents (pop)
Pct Total Land Area in
Urban Extents (sq.km)
Pct Total Population
in Urban Extents
(2000,NSO est.)
Pct Total Population
that is urban (2000,UN)
Num UE's from
Nighttime Lights
2 51.84 3,473 3,029,364 5,979 99,156.99 6,643,518 1.08 40.30 44.00 46

CountryEnglish
Cameroon
Smallest Extent (sq.km)
Mean Extent (sq.km)
Sum-All Urban Extents (sq.km)
Largest Extent (pop)
Smallest Extent (pop)
Mean Extent (pop)
Sum-All Urban Extents (pop)
Pct Total Land Area in
Urban Extents (sq.km)
Pct Total Population
in Urban Extents
(2000,NSO est.)
Pct Total Population
that is urban (2000,UN)
Num UE's from
Nighttime Lights
3 40.52 4,092 1,753,849 5,048 62,907.20 6,353,627 0.88 40.33 49.70 15
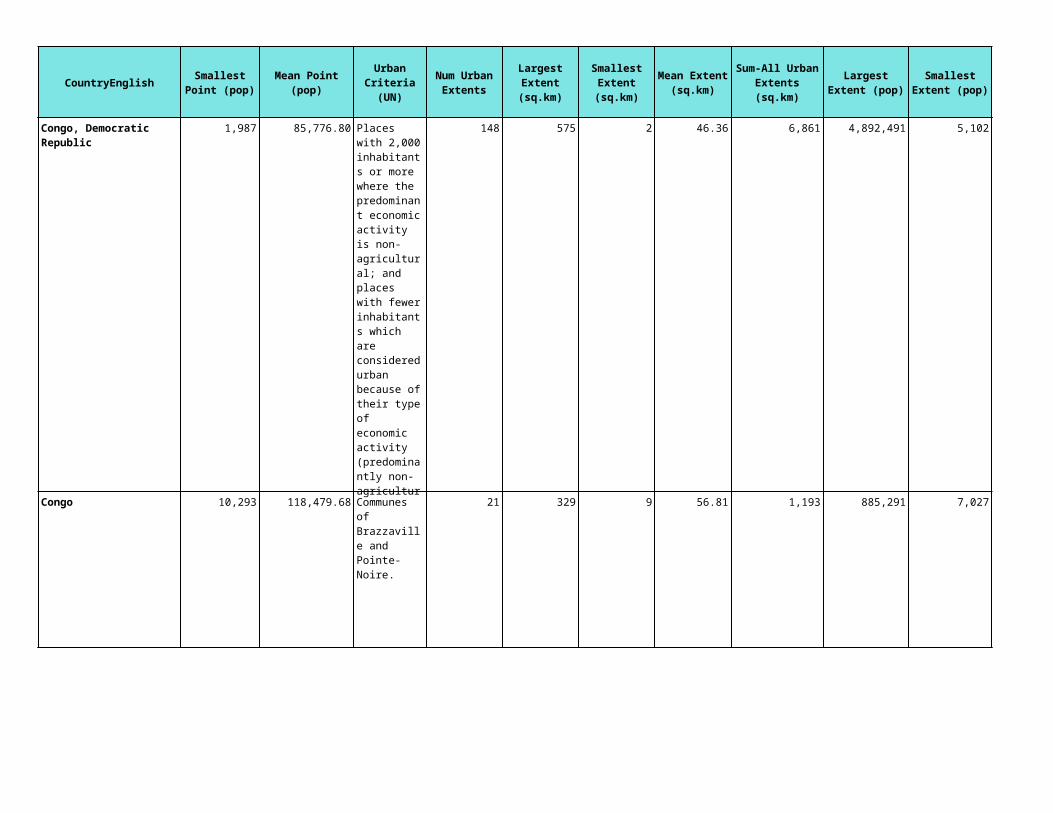
CountryEnglish
Congo
Congo, Democratic Republic
Smallest Extent (sq.km)
Mean Extent (sq.km)
Sum-All Urban Extents (sq.km)
Largest Extent (pop)
Smallest Extent (pop)
Mean Extent (pop)
Sum-All Urban Extents (pop)
Pct Total Land Area in
Urban Extents (sq.km)
Pct Total Population
in Urban Extents
(2000,NSO est.)
Pct Total Population
that is urban (2000,UN)
Num UE's from
Nighttime Lights
2 46.36 6,861 4,892,491 5,102 101,630.02 15,041,243 0.30 28.87 30.70 18
9 56.81 1,193 885,291 7,027 91,958.14 1,931,121 0.35 64.17 66.10 5

CountryEnglish
Comoros
Cape Verde
Djibouti
Smallest Extent (sq.km)
Mean Extent (sq.km)
Sum-All Urban Extents (sq.km)
Largest Extent (pop)
Smallest Extent (pop)
Mean Extent (pop)
Sum-All Urban Extents (pop)
Pct Total Land Area in
Urban Extents (sq.km)
Pct Total Population
in Urban Extents
(2000,NSO est.)
Pct Total Population
that is urban (2000,UN)
Num UE's from
Nighttime Lights
4 20.19 101 83,187 5,674 25,519.20 127,596 4.93 22.78 33.80 2
4 21.60 173 88,624 5,319 25,926.63 207,413 4.24 47.70 63.50 6
7 31.38 157 418,787 6,217 90,651.20 453,256 0.75 75.82 84.20 5

CountryEnglish
Algeria
Egypt
Smallest Extent (sq.km)
Mean Extent (sq.km)
Sum-All Urban Extents (sq.km)
Largest Extent (pop)
Smallest Extent (pop)
Mean Extent (pop)
Sum-All Urban Extents (pop)
Pct Total Land Area in
Urban Extents (sq.km)
Pct Total Population
in Urban Extents
(2000,NSO est.)
Pct Total Population
that is urban (2000,UN)
Num UE's from
Nighttime Lights
16 182.44 21,163 4,142,076 5,443 145,701.81 16,901,410 0.92 55.56 57.70 103
2 398.73 23,924 16,911,000 5,605 987,473.33 59,248,400 2.47 92.76 42.70 57

CountryEnglish
Eritrea
Ethiopia
Gabon
Smallest Extent (sq.km)
Mean Extent (sq.km)
Sum-All Urban Extents (sq.km)
Largest Extent (pop)
Smallest Extent (pop)
Mean Extent (pop)
Sum-All Urban Extents (pop)
Pct Total Land Area in
Urban Extents (sq.km)
Pct Total Population
in Urban Extents
(2000,NSO est.)
Pct Total Population
that is urban (2000,UN)
Num UE's from
Nighttime Lights
9 37.42 337 246,671 7,303 65,572.89 590,156 0.28 16.24 19.10 7
1 21.74 4,500 2,795,904 5,008 35,862.99 7,423,638 0.40 11.90 15.90 31
3 27.73 804 420,458 5,044 30,281.17 878,154 0.30 66.41 82.30 10

CountryEnglish
Ghana
Guinea
Smallest Extent (sq.km)
Mean Extent (sq.km)
Sum-All Urban Extents (sq.km)
Largest Extent (pop)
Smallest Extent (pop)
Mean Extent (pop)
Sum-All Urban Extents (pop)
Pct Total Land Area in
Urban Extents (sq.km)
Pct Total Population
in Urban Extents
(2000,NSO est.)
Pct Total Population
that is urban (2000,UN)
Num UE's from
Nighttime Lights
3 45.54 5,146 2,632,305 5,273 59,836.64 6,761,540 2.22 35.75 36.40 44
8 29.89 1,076 880,874 5,904 70,553.33 2,539,920 0.44 30.00 27.90 9

CountryEnglish
Gambia
Guinea-Bissau
Equatorial Guinea
Smallest Extent (sq.km)
Mean Extent (sq.km)
Sum-All Urban Extents (sq.km)
Largest Extent (pop)
Smallest Extent (pop)
Mean Extent (pop)
Sum-All Urban Extents (pop)
Pct Total Land Area in
Urban Extents (sq.km)
Pct Total Population
in Urban Extents
(2000,NSO est.)
Pct Total Population
that is urban (2000,UN)
Num UE's from
Nighttime Lights
6 27.46 522 442,586 6,065 36,054.74 685,040 4.81 57.24 31.30 3
17 25.20 277 249,439 7,122 31,467.27 346,140 0.81 28.27 32.30 1
4 23.58 212 56,533 7,126 19,380.33 174,423 0.78 38.59 49.30 1
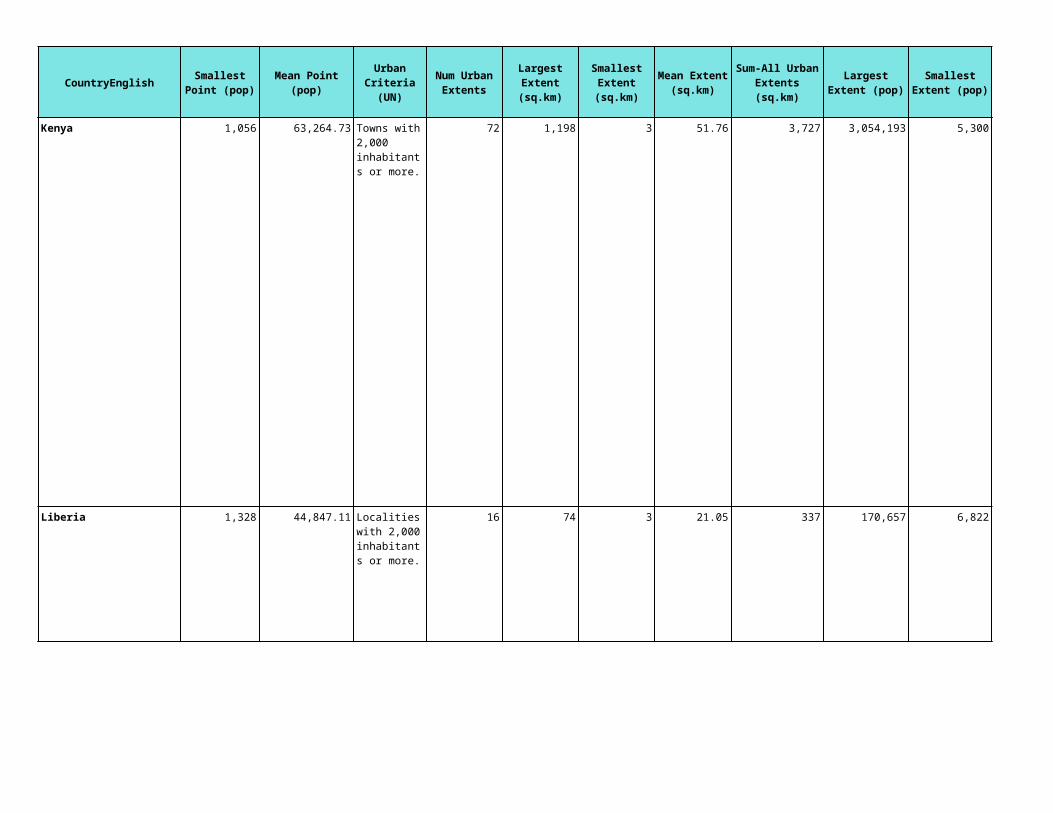
CountryEnglish
Kenya
Liberia
Smallest Extent (sq.km)
Mean Extent (sq.km)
Sum-All Urban Extents (sq.km)
Largest Extent (pop)
Smallest Extent (pop)
Mean Extent (pop)
Sum-All Urban Extents (pop)
Pct Total Land Area in
Urban Extents (sq.km)
Pct Total Population
in Urban Extents
(2000,NSO est.)
Pct Total Population
that is urban (2000,UN)
Num UE's from
Nighttime Lights
3 51.76 3,727 3,054,193 5,300 86,717.97 6,243,694 0.64 21.13 34.40 34
3 21.05 337 170,657 6,822 67,293.50 1,076,696 0.35 28.52 45.50 1

CountryEnglish
Libyan Arab Jamahiriya
Lesotho
Morocco (includes Western Sahara)
Smallest Extent (sq.km)
Mean Extent (sq.km)
Sum-All Urban Extents (sq.km)
Largest Extent (pop)
Smallest Extent (pop)
Mean Extent (pop)
Sum-All Urban Extents (pop)
Pct Total Land Area in
Urban Extents (sq.km)
Pct Total Population
in Urban Extents
(2000,NSO est.)
Pct Total Population
that is urban (2000,UN)
Num UE's from
Nighttime Lights
33 323.85 9,716 2,109,848 10,288 150,152.57 4,504,577 0.60 80.77 88.00 29
21 49.63 645 224,624 5,000 42,878.46 557,420 2.11 28.42 28.80 7
18 163.48 11,280 5,964,130 5,567 239,886.39 16,552,161 1.69 55.71 56.10 68

CountryEnglish
Madagascar
Mali
Smallest Extent (sq.km)
Mean Extent (sq.km)
Sum-All Urban Extents (sq.km)
Largest Extent (pop)
Smallest Extent (pop)
Mean Extent (pop)
Sum-All Urban Extents (pop)
Pct Total Land Area in
Urban Extents (sq.km)
Pct Total Population
in Urban Extents
(2000,NSO est.)
Pct Total Population
that is urban (2000,UN)
Num UE's from
Nighttime Lights
1 25.91 1,814 1,356,019 5,124 43,948.06 3,076,364 0.31 20.00 30.10 11
3 30.75 3,168 1,038,743 5,195 26,426.16 2,721,894 0.25 25.36 30.90 12

CountryEnglish
Mozambique
Smallest Extent (sq.km)
Mean Extent (sq.km)
Sum-All Urban Extents (sq.km)
Largest Extent (pop)
Smallest Extent (pop)
Mean Extent (pop)
Sum-All Urban Extents (pop)
Pct Total Land Area in
Urban Extents (sq.km)
Pct Total Population
in Urban Extents
(2000,NSO est.)
Pct Total Population
that is urban (2000,UN)
Num UE's from
Nighttime Lights
1 39.36 2,716 1,770,351 6,242 77,986.16 5,381,045 0.35 32.14 33.30 22

CountryEnglish
Mauritania
Mauritius
Smallest Extent (sq.km)
Mean Extent (sq.km)
Sum-All Urban Extents (sq.km)
Largest Extent (pop)
Smallest Extent (pop)
Mean Extent (pop)
Sum-All Urban Extents (pop)
Pct Total Land Area in
Urban Extents (sq.km)
Pct Total Population
in Urban Extents
(2000,NSO est.)
Pct Total Population
that is urban (2000,UN)
Num UE's from
Nighttime Lights
13 44.35 577 218,826 6,732 27,947.08 363,312 0.06 14.26 59.10 3
37 302.73 1,211 812,723 13,962 229,659.50 918,638 60.75 77.93 41.60 4
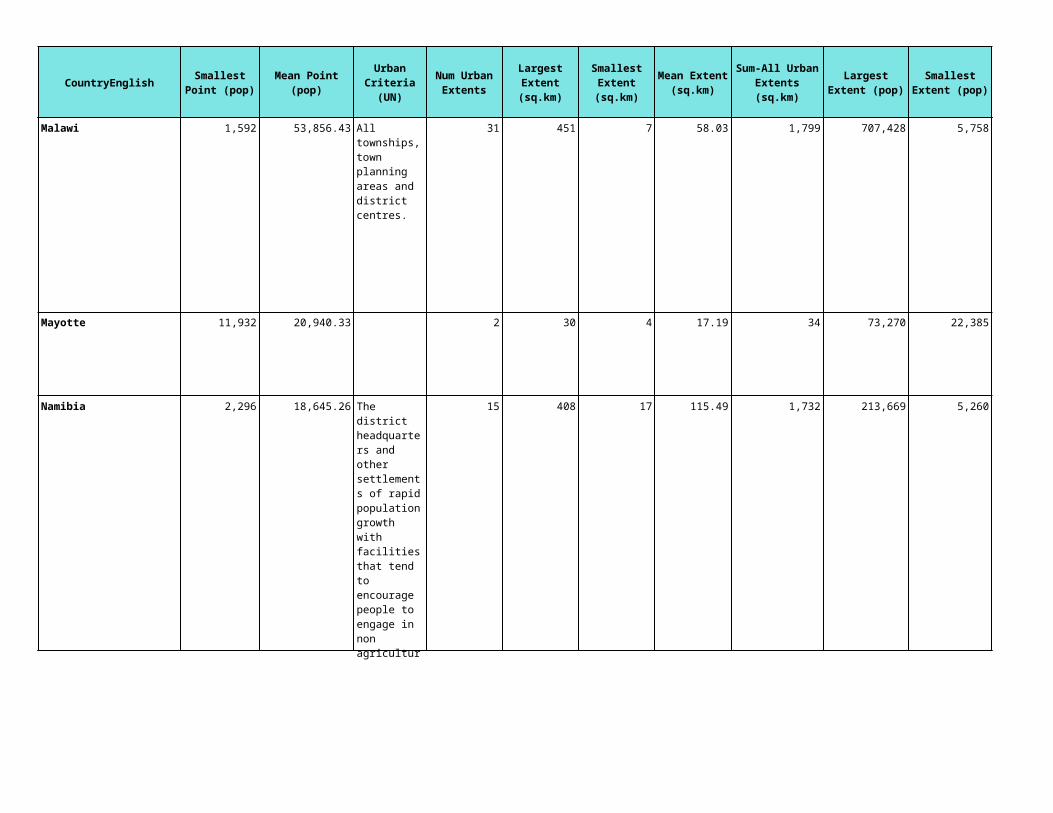
CountryEnglish
Malawi
Mayotte
Namibia
Smallest Extent (sq.km)
Mean Extent (sq.km)
Sum-All Urban Extents (sq.km)
Largest Extent (pop)
Smallest Extent (pop)
Mean Extent (pop)
Sum-All Urban Extents (pop)
Pct Total Land Area in
Urban Extents (sq.km)
Pct Total Population
in Urban Extents
(2000,NSO est.)
Pct Total Population
that is urban (2000,UN)
Num UE's from
Nighttime Lights
7 58.03 1,799 707,428 5,758 61,084.45 1,893,618 1.89 18.32 15.10 13
4 17.19 34 73,270 22,385 47,827.50 95,655 9.23 61.76 2
17 115.49 1,732 213,669 5,260 38,681.40 580,221 0.21 32.29 31.40 14
considered part of
Comoros by UN

CountryEnglish
Niger
Nigeria
Reunion
Smallest Extent (sq.km)
Mean Extent (sq.km)
Sum-All Urban Extents (sq.km)
Largest Extent (pop)
Smallest Extent (pop)
Mean Extent (pop)
Sum-All Urban Extents (pop)
Pct Total Land Area in
Urban Extents (sq.km)
Pct Total Population
in Urban Extents
(2000,NSO est.)
Pct Total Population
that is urban (2000,UN)
Num UE's from
Nighttime Lights
8 38.89 1,633 211,748 8,653 45,712.02 1,919,905 0.14 19.73 21.10 15
2 117.99 14,867 7,455,320 19,005 316,280.12 39,851,295 1.64 32.07 44.90 81
6 31.24 406 161,842 5,611 34,759.38 451,872 15.94 62.87 72.10 0

CountryEnglish
Rwanda
Sudan
Smallest Extent (sq.km)
Mean Extent (sq.km)
Sum-All Urban Extents (sq.km)
Largest Extent (pop)
Smallest Extent (pop)
Mean Extent (pop)
Sum-All Urban Extents (pop)
Pct Total Land Area in
Urban Extents (sq.km)
Pct Total Population
in Urban Extents
(2000,NSO est.)
Pct Total Population
that is urban (2000,UN)
Num UE's from
Nighttime Lights
24 48.54 243 312,533 20,980 99,503.60 497,518 1.00 6.42 6.30 3
2 98.68 5,921 3,700,810 5,530 169,241.97 10,154,518 0.24 35.35 37.10 33

CountryEnglish
Senegal
St. Helena
Sierra Leone
Somalia
Smallest Extent (sq.km)
Mean Extent (sq.km)
Sum-All Urban Extents (sq.km)
Largest Extent (pop)
Smallest Extent (pop)
Mean Extent (pop)
Sum-All Urban Extents (pop)
Pct Total Land Area in
Urban Extents (sq.km)
Pct Total Population
in Urban Extents
(2000,NSO est.)
Pct Total Population
that is urban (2000,UN)
Num UE's from
Nighttime Lights
2 39.35 1,653 2,409,979 9,084 103,554.83 4,349,303 0.84 43.73 48.20 24
71.90
4 23.01 828 802,567 5,213 39,266.31 1,413,587 1.14 27.79 37.30 5
7 40.05 280 1,093,811 33,018 294,713.57 2,062,995 0.04 25.30 27.90 5

CountryEnglish
Sao Tome and Principe
Swaziland
Seychelles
Smallest Extent (sq.km)
Mean Extent (sq.km)
Sum-All Urban Extents (sq.km)
Largest Extent (pop)
Smallest Extent (pop)
Mean Extent (pop)
Sum-All Urban Extents (pop)
Pct Total Land Area in
Urban Extents (sq.km)
Pct Total Population
in Urban Extents
(2000,NSO est.)
Pct Total Population
that is urban (2000,UN)
Num UE's from
Nighttime Lights
47 46.58 47 54,421 54,421 54,421.00 54,421 4.62 38.05 47.70 1
16 144.61 868 148,299 7,767 35,526.50 213,159 4.98 23.35 26.70 6
120 119.81 120 53,719 53,719 53,719.00 53,719 61.25 66.34 64.60 1

CountryEnglish
Chad
Togo
Smallest Extent (sq.km)
Mean Extent (sq.km)
Sum-All Urban Extents (sq.km)
Largest Extent (pop)
Smallest Extent (pop)
Mean Extent (pop)
Sum-All Urban Extents (pop)
Pct Total Land Area in
Urban Extents (sq.km)
Pct Total Population
in Urban Extents
(2000,NSO est.)
Pct Total Population
that is urban (2000,UN)
Num UE's from
Nighttime Lights
6 29.98 1,139 618,053 5,004 44,140.66 1,677,345 0.09 22.73 24.10 3
17 46.67 1,493 893,945 5,818 45,404.41 1,452,941 2.61 32.08 33.90 8

CountryEnglish
Tunisia
United Rep. of Tanzania
Smallest Extent (sq.km)
Mean Extent (sq.km)
Sum-All Urban Extents (sq.km)
Largest Extent (pop)
Smallest Extent (pop)
Mean Extent (pop)
Sum-All Urban Extents (pop)
Pct Total Land Area in
Urban Extents (sq.km)
Pct Total Population
in Urban Extents
(2000,NSO est.)
Pct Total Population
that is urban (2000,UN)
Num UE's from
Nighttime Lights
12 161.64 9,375 2,099,075 13,545 103,105.64 5,980,127 6.34 62.53 66.20 57
3 61.08 3,360 2,419,945 5,622 205,349.16 11,294,204 0.38 34.82 33.30 32

CountryEnglish
Uganda
South Africa
Smallest Extent (sq.km)
Mean Extent (sq.km)
Sum-All Urban Extents (sq.km)
Largest Extent (pop)
Smallest Extent (pop)
Mean Extent (pop)
Sum-All Urban Extents (pop)
Pct Total Land Area in
Urban Extents (sq.km)
Pct Total Population
in Urban Extents
(2000,NSO est.)
Pct Total Population
that is urban (2000,UN)
Num UE's from
Nighttime Lights
1 31.05 1,459 1,613,494 5,627 60,879.55 2,861,339 0.71 13.80 14.50 11
16 223.83 44,542 7,994,775 5,078 128,388.40 25,549,292 3.66 58.67 57.70 191
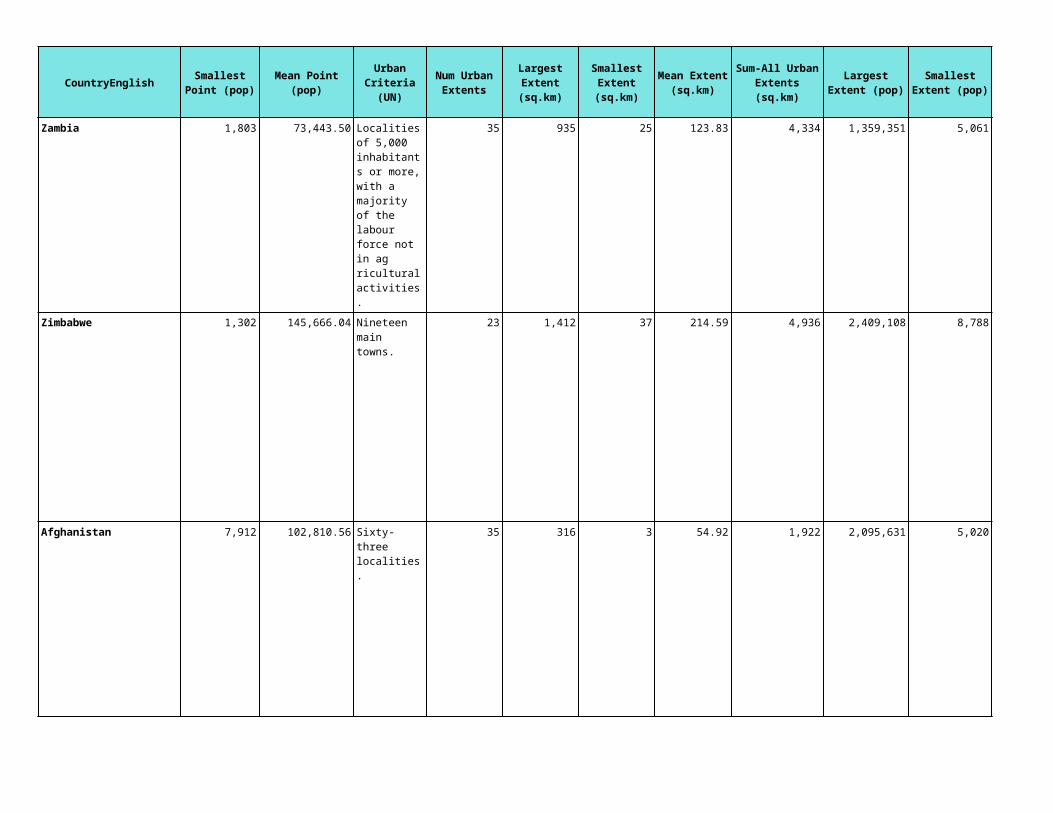
CountryEnglish
Zambia
Zimbabwe
Afghanistan
Smallest Extent (sq.km)
Mean Extent (sq.km)
Sum-All Urban Extents (sq.km)
Largest Extent (pop)
Smallest Extent (pop)
Mean Extent (pop)
Sum-All Urban Extents (pop)
Pct Total Land Area in
Urban Extents (sq.km)
Pct Total Population
in Urban Extents
(2000,NSO est.)
Pct Total Population
that is urban (2000,UN)
Num UE's from
Nighttime Lights
25 123.83 4,334 1,359,351 5,061 105,537.83 3,693,824 0.58 39.56 39.80 21
37 214.59 4,936 2,409,108 8,788 203,022.04 4,669,507 1.27 40.11 36.00 23
3 54.92 1,922 2,095,631 5,020 123,408.71 4,319,305 0.30 20.97 22.30 8

CountryEnglish
United Arab Emirates
Armenia
Smallest Extent (sq.km)
Mean Extent (sq.km)
Sum-All Urban Extents (sq.km)
Largest Extent (pop)
Smallest Extent (pop)
Mean Extent (pop)
Sum-All Urban Extents (pop)
Pct Total Land Area in
Urban Extents (sq.km)
Pct Total Population
in Urban Extents
(2000,NSO est.)
Pct Total Population
that is urban (2000,UN)
Num UE's from
Nighttime Lights
56 1,900.51 7,602 1,969,830 10,252 532,529.75 2,130,119 10.17 66.66 87.20 4
1 48.17 1,590 1,651,491 5,519 81,867.70 2,701,634 5.62 83.95 67.20 16

CountryEnglish
Azerbaijan
Smallest Extent (sq.km)
Mean Extent (sq.km)
Sum-All Urban Extents (sq.km)
Largest Extent (pop)
Smallest Extent (pop)
Mean Extent (pop)
Sum-All Urban Extents (pop)
Pct Total Land Area in
Urban Extents (sq.km)
Pct Total Population
in Urban Extents
(2000,NSO est.)
Pct Total Population
that is urban (2000,UN)
Num UE's from
Nighttime Lights
7 226.79 6,123 2,079,787 12,378 157,210.52 4,244,684 7.17 53.23 51.80 26

CountryEnglish
Bangladesh
Smallest Extent (sq.km)
Mean Extent (sq.km)
Sum-All Urban Extents (sq.km)
Largest Extent (pop)
Smallest Extent (pop)
Mean Extent (pop)
Sum-All Urban Extents (pop)
Pct Total Land Area in
Urban Extents (sq.km)
Pct Total Population
in Urban Extents
(2000,NSO est.)
Pct Total Population
that is urban (2000,UN)
Num UE's from
Nighttime Lights
6 78.35 10,185 9,804,932 8,458 236,064.95 30,688,443 7.47 25.20 25.60 86

CountryEnglish
Bahrain
Brunei Darussalam
Bhutan
Smallest Extent (sq.km)
Mean Extent (sq.km)
Sum-All Urban Extents (sq.km)
Largest Extent (pop)
Smallest Extent (pop)
Mean Extent (pop)
Sum-All Urban Extents (pop)
Pct Total Land Area in
Urban Extents (sq.km)
Pct Total Population
in Urban Extents
(2000,NSO est.)
Pct Total Population
that is urban (2000,UN)
Num UE's from
Nighttime Lights
6 177.53 533 503,343 8,638 199,015.67 597,047 85.46 97.02 92.50 3
1,117 1,116.86 1,117 222,177 222,177 222,177.00 222,177 18.93 67.38 72.80 1
21 41.10 206 59,533 14,674 29,811.00 149,055 0.54 7.98 7.40 2

CountryEnglish
China
Smallest Extent (sq.km)
Mean Extent (sq.km)
Sum-All Urban Extents (sq.km)
Largest Extent (pop)
Smallest Extent (pop)
Mean Extent (pop)
Sum-All Urban Extents (pop)
Pct Total Land Area in
Urban Extents (sq.km)
Pct Total Population
in Urban Extents
(2000,NSO est.)
Pct Total Population
that is urban (2000,UN)
Num UE's from
Nighttime Lights
1 68.69 261,241 31,266,420 5,252 111,417.05 423,719,026 2.84 34.21 36.70 1,021

CountryEnglish
Cyprus
Georgia
Hong Kong
Smallest Extent (sq.km)
Mean Extent (sq.km)
Sum-All Urban Extents (sq.km)
Largest Extent (pop)
Smallest Extent (pop)
Mean Extent (pop)
Sum-All Urban Extents (pop)
Pct Total Land Area in
Urban Extents (sq.km)
Pct Total Population
in Urban Extents
(2000,NSO est.)
Pct Total Population
that is urban (2000,UN)
Num UE's from
Nighttime Lights
246 573.95 2,296 303,939 50,475 167,576.25 670,305 24.76 89.64 70.20 4
2 71.69 3,441 1,421,659 5,329 63,821.77 3,063,445 4.97 65.30 56.50 33
5 256.17 769 4,167,910 344,890 1,928,253.33 5,784,760 72.93 87.66 100.00 3
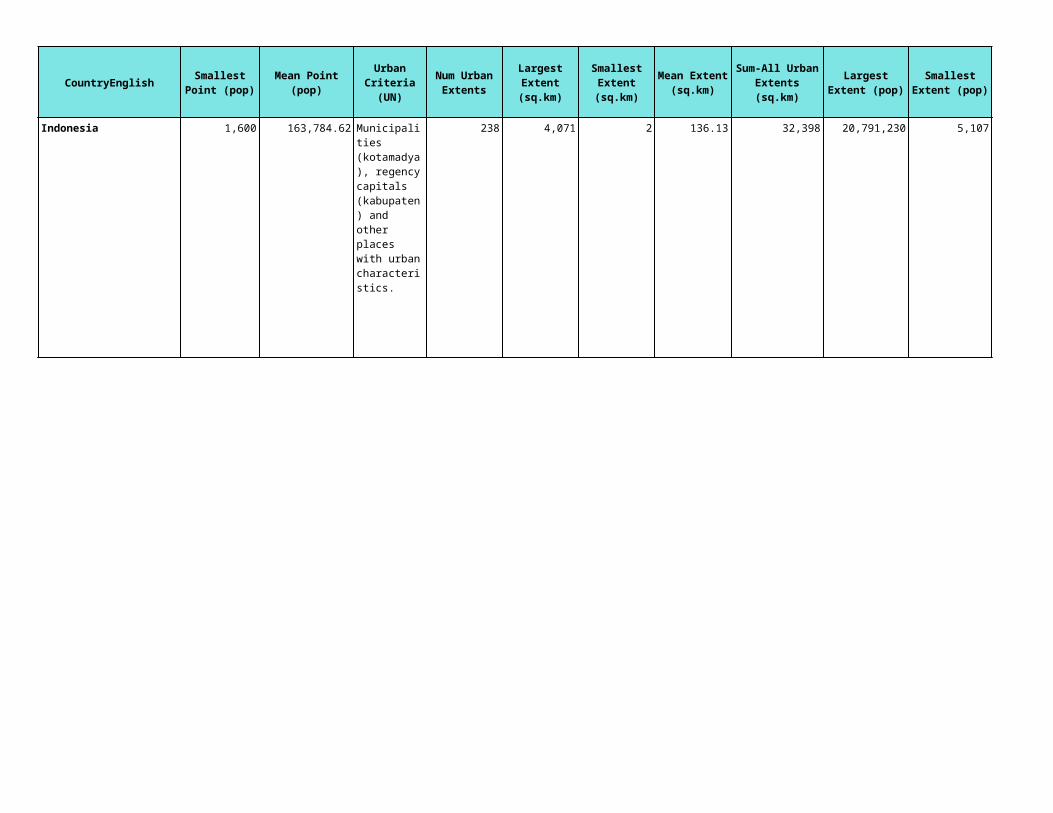
CountryEnglish
Indonesia
Smallest Extent (sq.km)
Mean Extent (sq.km)
Sum-All Urban Extents (sq.km)
Largest Extent (pop)
Smallest Extent (pop)
Mean Extent (pop)
Sum-All Urban Extents (pop)
Pct Total Land Area in
Urban Extents (sq.km)
Pct Total Population
in Urban Extents
(2000,NSO est.)
Pct Total Population
that is urban (2000,UN)
Num UE's from
Nighttime Lights
2 136.13 32,398 20,791,230 5,107 341,876.36 81,366,574 1.71 40.66 42.10 173
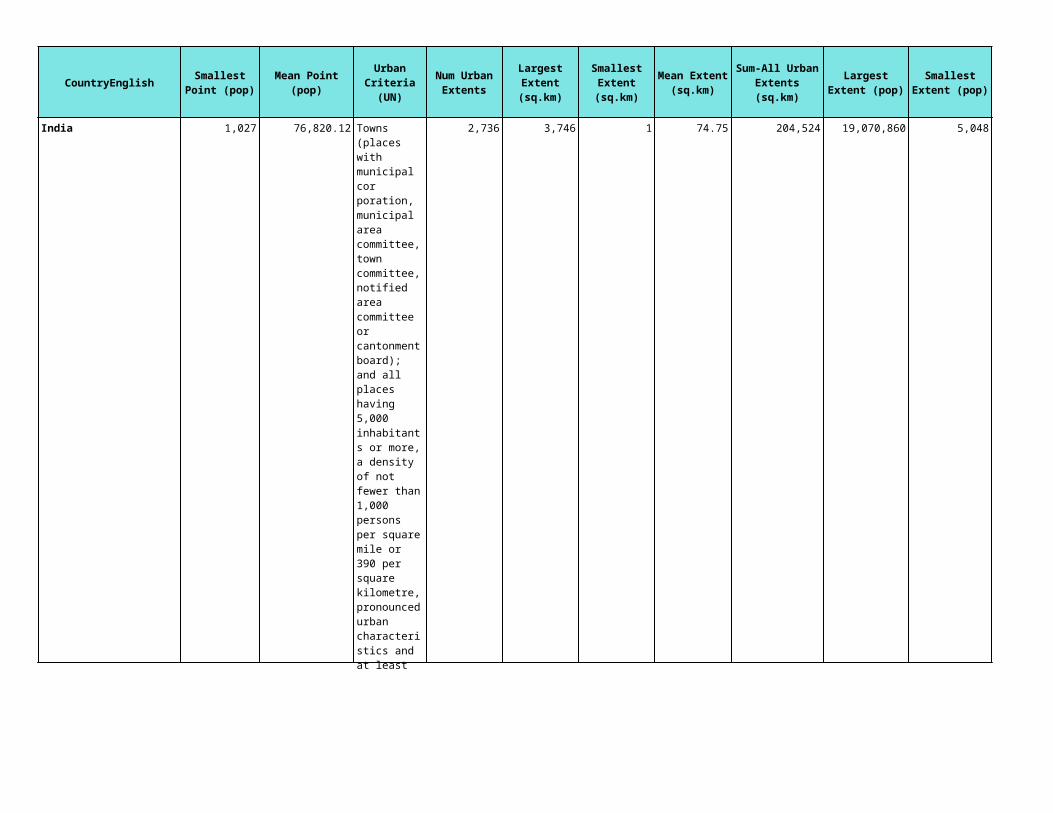
CountryEnglish
India
Smallest Extent (sq.km)
Mean Extent (sq.km)
Sum-All Urban Extents (sq.km)
Largest Extent (pop)
Smallest Extent (pop)
Mean Extent (pop)
Sum-All Urban Extents (pop)
Pct Total Land Area in
Urban Extents (sq.km)
Pct Total Population
in Urban Extents
(2000,NSO est.)
Pct Total Population
that is urban (2000,UN)
Num UE's from
Nighttime Lights
1 74.75 204,524 19,070,860 5,048 110,104.84 301,246,832 6.37 32.59 27.90 1,859

CountryEnglish
Iran
Iraq
Israel
Smallest Extent (sq.km)
Mean Extent (sq.km)
Sum-All Urban Extents (sq.km)
Largest Extent (pop)
Smallest Extent (pop)
Mean Extent (pop)
Sum-All Urban Extents (pop)
Pct Total Land Area in
Urban Extents (sq.km)
Pct Total Population
in Urban Extents
(2000,NSO est.)
Pct Total Population
that is urban (2000,UN)
Num UE's from
Nighttime Lights
6 437.79 59,978 12,449,130 13,483 291,353.74 39,915,463 3.77 61.57 64.70 130
3 469.96 9,869 6,337,758 72,904 743,664.62 15,616,957 2.29 67.61 67.40 19
54 1,026.89 6,161 4,611,058 6,453 836,358.67 5,018,152 28.16 81.32 91.80 6

CountryEnglish
Jordan
Smallest Extent (sq.km)
Mean Extent (sq.km)
Sum-All Urban Extents (sq.km)
Largest Extent (pop)
Smallest Extent (pop)
Mean Extent (pop)
Sum-All Urban Extents (pop)
Pct Total Land Area in
Urban Extents (sq.km)
Pct Total Population
in Urban Extents
(2000,NSO est.)
Pct Total Population
that is urban (2000,UN)
Num UE's from
Nighttime Lights
26 252.35 3,028 2,889,109 6,412 312,818.25 3,753,819 3.43 68.05 78.70 12
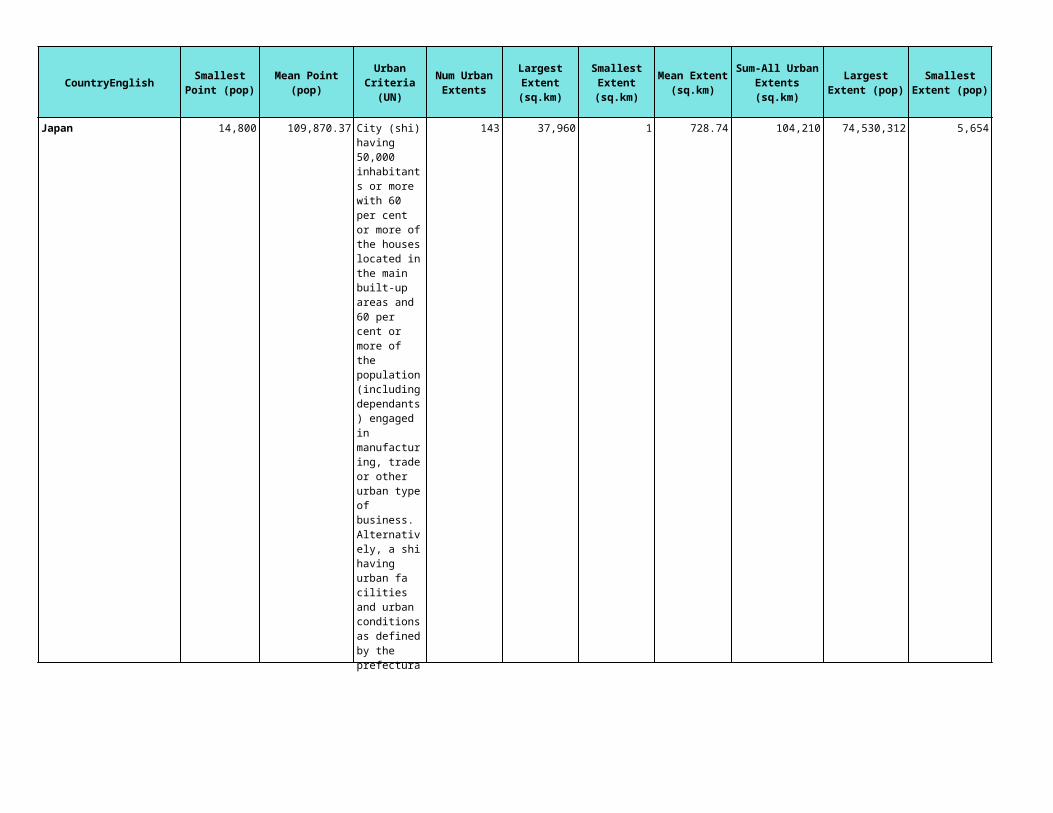
CountryEnglish
Japan
Smallest Extent (sq.km)
Mean Extent (sq.km)
Sum-All Urban Extents (sq.km)
Largest Extent (pop)
Smallest Extent (pop)
Mean Extent (pop)
Sum-All Urban Extents (pop)
Pct Total Land Area in
Urban Extents (sq.km)
Pct Total Population
in Urban Extents
(2000,NSO est.)
Pct Total Population
that is urban (2000,UN)
Num UE's from
Nighttime Lights
1 728.74 104,210 74,530,312 5,654 790,726.37 113,073,871 28.04 89.09 78.90 141

CountryEnglish
Kazakhstan
Smallest Extent (sq.km)
Mean Extent (sq.km)
Sum-All Urban Extents (sq.km)
Largest Extent (pop)
Smallest Extent (pop)
Mean Extent (pop)
Sum-All Urban Extents (pop)
Pct Total Land Area in
Urban Extents (sq.km)
Pct Total Population
in Urban Extents
(2000,NSO est.)
Pct Total Population
that is urban (2000,UN)
Num UE's from
Nighttime Lights
5 386.55 11,983 1,689,938 5,811 283,285.68 8,781,856 0.46 55.71 55.80 24

CountryEnglish
Kyrgyz Republic
Cambodia
Smallest Extent (sq.km)
Mean Extent (sq.km)
Sum-All Urban Extents (sq.km)
Largest Extent (pop)
Smallest Extent (pop)
Mean Extent (pop)
Sum-All Urban Extents (pop)
Pct Total Land Area in
Urban Extents (sq.km)
Pct Total Population
in Urban Extents
(2000,NSO est.)
Pct Total Population
that is urban (2000,UN)
Num UE's from
Nighttime Lights
8 184.36 3,134 892,651 5,382 91,065.12 1,548,107 1.70 31.54 34.30 15
1 30.56 672 1,269,355 5,578 85,708.59 1,885,589 0.37 15.62 17.50 4
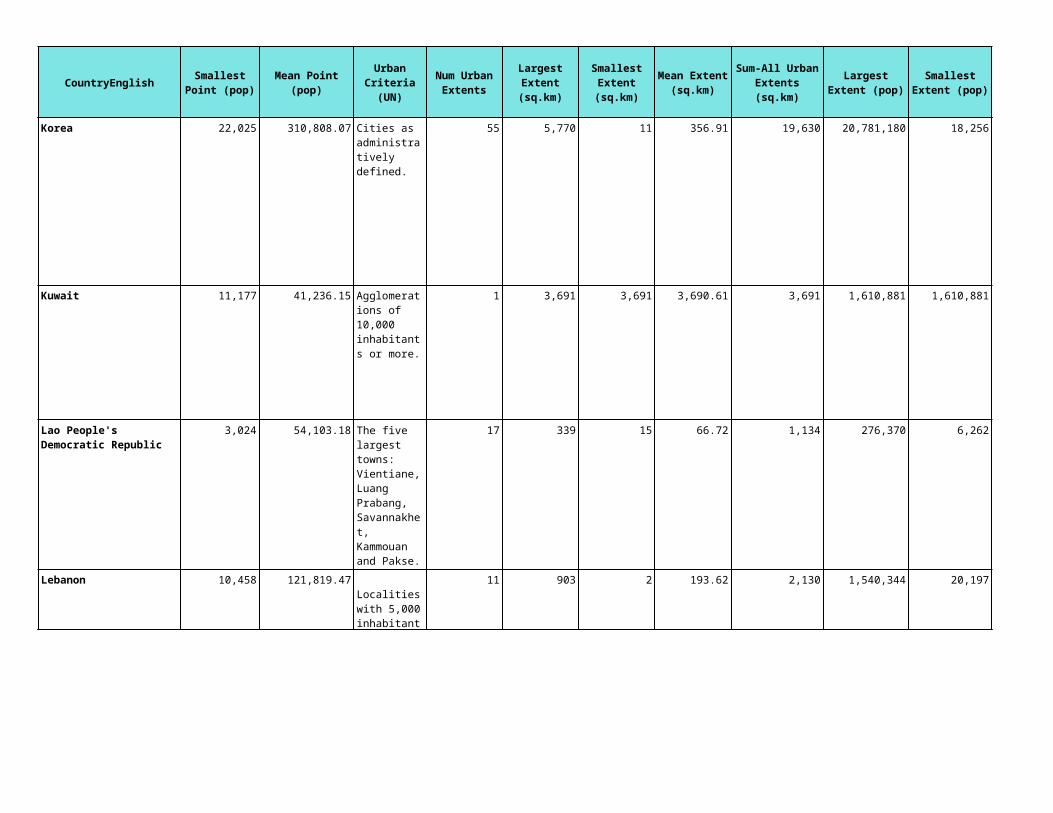
CountryEnglish
Korea
Kuwait
Lebanon
Lao People's Democratic Republic
Smallest Extent (sq.km)
Mean Extent (sq.km)
Sum-All Urban Extents (sq.km)
Largest Extent (pop)
Smallest Extent (pop)
Mean Extent (pop)
Sum-All Urban Extents (pop)
Pct Total Land Area in
Urban Extents (sq.km)
Pct Total Population
in Urban Extents
(2000,NSO est.)
Pct Total Population
that is urban (2000,UN)
Num UE's from
Nighttime Lights
11 356.91 19,630 20,781,180 18,256 697,641.51 38,370,283 19.83 82.66 82.50 53
3,691 3,690.61 3,691 1,610,881 1,610,881 1,610,881.00 1,610,881 21.38 72.35 96.10 1
15 66.72 1,134 276,370 6,262 52,491.35 892,353 0.49 17.29 19.70 6
2 193.62 2,130 1,540,344 20,197 268,886.55 2,957,752 20.62 89.00 90.10 8

CountryEnglish
Sri Lanka
Macao
Maldives
Smallest Extent (sq.km)
Mean Extent (sq.km)
Sum-All Urban Extents (sq.km)
Largest Extent (pop)
Smallest Extent (pop)
Mean Extent (pop)
Sum-All Urban Extents (pop)
Pct Total Land Area in
Urban Extents (sq.km)
Pct Total Population
in Urban Extents
(2000,NSO est.)
Pct Total Population
that is urban (2000,UN)
Num UE's from
Nighttime Lights
6 138.21 3,455 2,631,718 5,552 168,759.52 4,218,988 5.25 23.23 23.10 21
9 8.88 9 336,753 336,753 336,753.00 336,753 46.56 78.95 98.90 1
2 2.21 2 5,372 5,372 5,372.00 5,372 1.17 2.00 28.00 1

CountryEnglish
Myanmar
Mongolia
Malaysia
Nepal
Smallest Extent (sq.km)
Mean Extent (sq.km)
Sum-All Urban Extents (sq.km)
Largest Extent (pop)
Smallest Extent (pop)
Mean Extent (pop)
Sum-All Urban Extents (pop)
Pct Total Land Area in
Urban Extents (sq.km)
Pct Total Population
in Urban Extents
(2000,NSO est.)
Pct Total Population
that is urban (2000,UN)
Num UE's from
Nighttime Lights
1 81.00 4,698 3,901,456 6,425 214,695.71 12,452,351 0.70 26.51 28.10 44
2 53.18 1,223 806,245 6,689 63,133.22 1,452,064 0.08 61.17 56.60 16
2 204.21 14,090 4,748,720 5,697 201,476.96 13,901,910 4.27 62.99 58.10 67
15 72.82 2,694 1,100,187 8,674 73,652.43 2,725,140 1.94 12.04 12.20 22

CountryEnglish
Oman
Pakistan
Smallest Extent (sq.km)
Mean Extent (sq.km)
Sum-All Urban Extents (sq.km)
Largest Extent (pop)
Smallest Extent (pop)
Mean Extent (pop)
Sum-All Urban Extents (pop)
Pct Total Land Area in
Urban Extents (sq.km)
Pct Total Population
in Urban Extents
(2000,NSO est.)
Pct Total Population
that is urban (2000,UN)
Num UE's from
Nighttime Lights
95 485.56 5,341 1,204,148 23,524 172,870.64 1,901,577 1.76 79.19 76.50 11
10 151.37 26,338 10,712,070 31,190 276,497.05 48,110,486 3.35 35.26 33.40 160

CountryEnglish
Philippines
Smallest Extent (sq.km)
Mean Extent (sq.km)
Sum-All Urban Extents (sq.km)
Largest Extent (pop)
Smallest Extent (pop)
Mean Extent (pop)
Sum-All Urban Extents (pop)
Pct Total Land Area in
Urban Extents (sq.km)
Pct Total Population
in Urban Extents
(2000,NSO est.)
Pct Total Population
that is urban (2000,UN)
Num UE's from
Nighttime Lights
2 117.75 8,596 14,555,120 16,043 340,636.08 24,866,434 2.91 32.74 59.40 61

CountryEnglish
Korea, Dem. People's Rep. of
Smallest Extent (sq.km)
Mean Extent (sq.km)
Sum-All Urban Extents (sq.km)
Largest Extent (pop)
Smallest Extent (pop)
Mean Extent (pop)
Sum-All Urban Extents (pop)
Pct Total Land Area in
Urban Extents (sq.km)
Pct Total Population
in Urban Extents
(2000,NSO est.)
Pct Total Population
that is urban (2000,UN)
Num UE's from
Nighttime Lights
2 54.05 1,135 2,445,031 65,822 272,481.71 5,722,116 0.93 24.88 60.50 14

CountryEnglish
Occupied Palestinian Territory
Smallest Extent (sq.km)
Mean Extent (sq.km)
Sum-All Urban Extents (sq.km)
Largest Extent (pop)
Smallest Extent (pop)
Mean Extent (pop)
Sum-All Urban Extents (pop)
Pct Total Land Area in
Urban Extents (sq.km)
Pct Total Population
in Urban Extents
(2000,NSO est.)
Pct Total Population
that is urban (2000,UN)
Num UE's from
Nighttime Lights
4 70.92 2,128 1,112,864 5,422 89,753.97 2,692,619 35.43 84.67 67.10 11

CountryEnglish
Qatar
Saudi Arabia
Singapore
Syrian Arab Republic
Smallest Extent (sq.km)
Mean Extent (sq.km)
Sum-All Urban Extents (sq.km)
Largest Extent (pop)
Smallest Extent (pop)
Mean Extent (pop)
Sum-All Urban Extents (pop)
Pct Total Land Area in
Urban Extents (sq.km)
Pct Total Population
in Urban Extents
(2000,NSO est.)
Pct Total Population
that is urban (2000,UN)
Num UE's from
Nighttime Lights
125 814.64 1,629 506,874 6,910 256,892.00 513,784 14.85 81.58 92.90 2
9 1,132.75 31,717 3,158,196 5,028 579,708.68 16,231,843 1.64 77.86 86.70 26
543 543.04 543 3,926,256 3,926,256 3,926,256.00 3,926,256 91.02 100.54 100.00 1
32 351.65 9,143 1,654,990 20,737 319,374.42 8,303,735 4.96 51.49 51.80 26
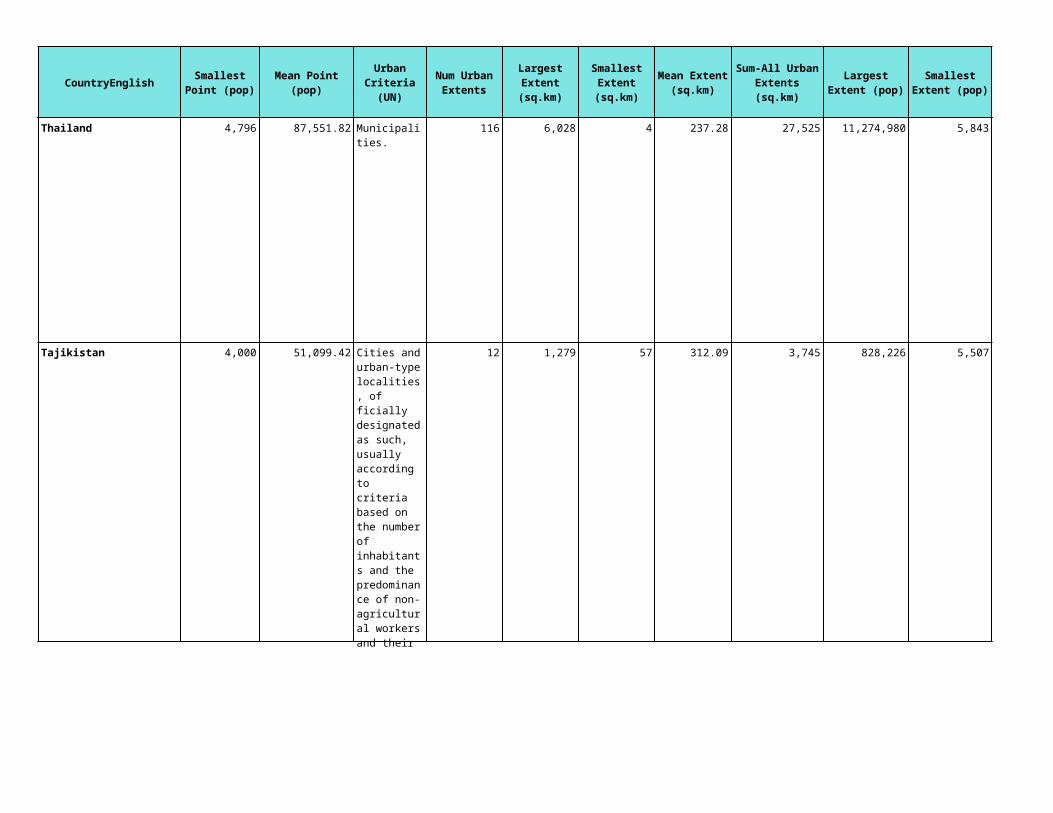
CountryEnglish
Thailand
Tajikistan
Smallest Extent (sq.km)
Mean Extent (sq.km)
Sum-All Urban Extents (sq.km)
Largest Extent (pop)
Smallest Extent (pop)
Mean Extent (pop)
Sum-All Urban Extents (pop)
Pct Total Land Area in
Urban Extents (sq.km)
Pct Total Population
in Urban Extents
(2000,NSO est.)
Pct Total Population
that is urban (2000,UN)
Num UE's from
Nighttime Lights
4 237.28 27,525 11,274,980 5,843 179,199.42 20,787,133 5.36 34.14 20.00 107
57 312.09 3,745 828,226 5,507 146,019.83 1,752,238 2.87 29.40 27.70 11

CountryEnglish
Turkmenistan
East Timor
Turkey
Smallest Extent (sq.km)
Mean Extent (sq.km)
Sum-All Urban Extents (sq.km)
Largest Extent (pop)
Smallest Extent (pop)
Mean Extent (pop)
Sum-All Urban Extents (pop)
Pct Total Land Area in
Urban Extents (sq.km)
Pct Total Population
in Urban Extents
(2000,NSO est.)
Pct Total Population
that is urban (2000,UN)
Num UE's from
Nighttime Lights
7 496.53 5,958 513,543 9,539 167,581.00 2,010,972 1.29 48.72 44.90 10
15 71.39 143 23,098 9,438 16,268.00 32,536 0.96 3.92 7.50 1
6 122.26 43,892 8,299,985 12,867 121,223.32 43,519,172 5.71 64.18 66.20 352

CountryEnglish
Taiwan
Uzbekistan
Smallest Extent (sq.km)
Mean Extent (sq.km)
Sum-All Urban Extents (sq.km)
Largest Extent (pop)
Smallest Extent (pop)
Mean Extent (pop)
Sum-All Urban Extents (pop)
Pct Total Land Area in
Urban Extents (sq.km)
Pct Total Population
in Urban Extents
(2000,NSO est.)
Pct Total Population
that is urban (2000,UN)
Num UE's from
Nighttime Lights
15 1,603.61 12,829 13,864,650 10,069 1,764,107.13 14,112,857 35.42 65.22hina by the UN 7
4 273.57 15,867 3,261,513 5,316 164,306.22 9,529,761 3.84 38.76 36.60 48

CountryEnglish
Viet Nam
Yemen
Smallest Extent (sq.km)
Mean Extent (sq.km)
Sum-All Urban Extents (sq.km)
Largest Extent (pop)
Smallest Extent (pop)
Mean Extent (pop)
Sum-All Urban Extents (pop)
Pct Total Land Area in
Urban Extents (sq.km)
Pct Total Population
in Urban Extents
(2000,NSO est.)
Pct Total Population
that is urban (2000,UN)
Num UE's from
Nighttime Lights
1 114.59 5,959 5,834,918 5,388 334,735.15 17,406,228 1.81 23.40 24.50 51
16 145.67 3,933 1,408,156 5,106 164,510.89 4,441,794 0.95 23.78 25.00 25

CountryEnglish
Albania
Andorra
Austria
Smallest Extent (sq.km)
Mean Extent (sq.km)
Sum-All Urban Extents (sq.km)
Largest Extent (pop)
Smallest Extent (pop)
Mean Extent (pop)
Sum-All Urban Extents (pop)
Pct Total Land Area in
Urban Extents (sq.km)
Pct Total Population
in Urban Extents
(2000,NSO est.)
Pct Total Population
that is urban (2000,UN)
Num UE's from
Nighttime Lights
7 39.08 1,524 322,647 5,170 33,077.77 1,290,033 5.38 41.80 42.90 21
309 309.10 309 85,196 85,196 85,196.00 85,196 66.65 129.39 92.20 1
11 118.69 11,038 2,044,261 5,026 56,565.45 5,260,587 13.28 65.69 67.40 82
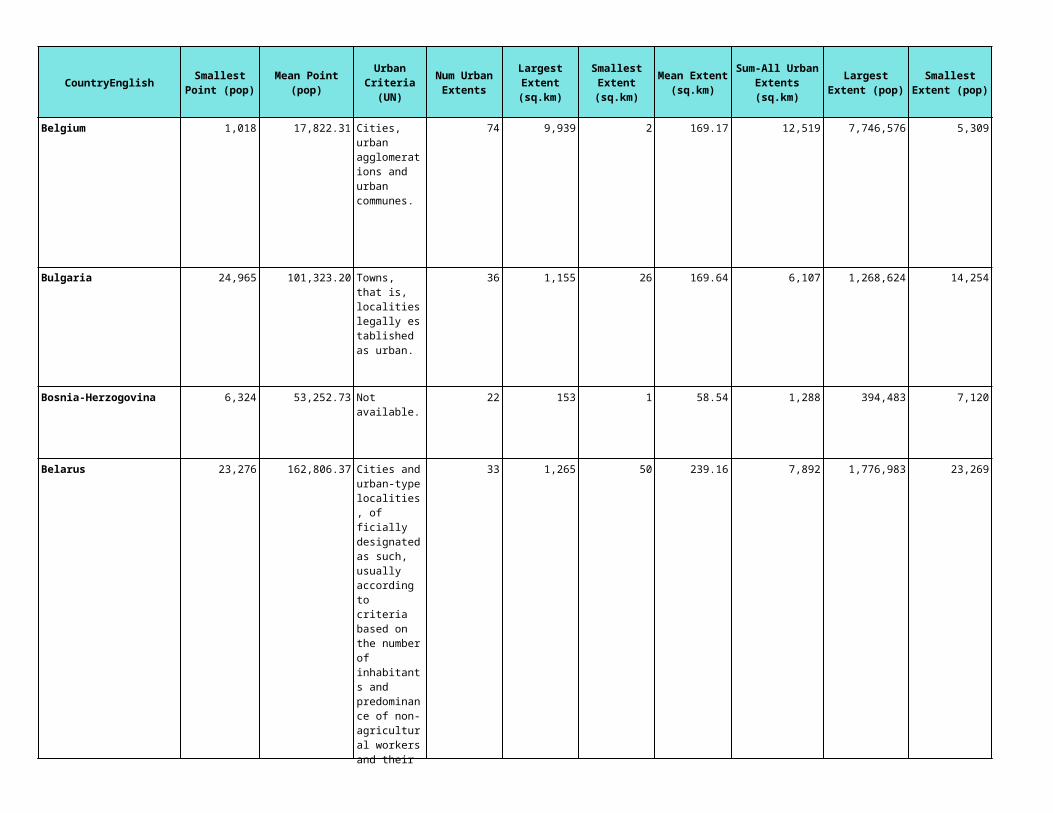
CountryEnglish
Belgium
Bulgaria
Bosnia-Herzogovina
Belarus
Smallest Extent (sq.km)
Mean Extent (sq.km)
Sum-All Urban Extents (sq.km)
Largest Extent (pop)
Smallest Extent (pop)
Mean Extent (pop)
Sum-All Urban Extents (pop)
Pct Total Land Area in
Urban Extents (sq.km)
Pct Total Population
in Urban Extents
(2000,NSO est.)
Pct Total Population
that is urban (2000,UN)
Num UE's from
Nighttime Lights
2 169.17 12,519 7,746,576 5,309 126,579.27 9,366,866 40.97 91.60 97.40 46
26 169.64 6,107 1,268,624 14,254 118,996.00 4,283,856 5.49 54.09 67.40 36
1 58.54 1,288 394,483 7,120 73,198.86 1,610,375 2.51 41.27 43.40 18
50 239.16 7,892 1,776,983 23,269 195,362.00 6,446,946 3.81 63.56 69.60 33

CountryEnglish
Switzerland
Czech Republic
Germany
Denmark
Smallest Extent (sq.km)
Mean Extent (sq.km)
Sum-All Urban Extents (sq.km)
Largest Extent (pop)
Smallest Extent (pop)
Mean Extent (pop)
Sum-All Urban Extents (pop)
Pct Total Land Area in
Urban Extents (sq.km)
Pct Total Population
in Urban Extents
(2000,NSO est.)
Pct Total Population
that is urban (2000,UN)
Num UE's from
Nighttime Lights
11 135.66 8,004 1,727,883 5,006 84,230.80 4,969,617 20.54 68.85 67.30 45
26 122.30 11,374 1,463,049 10,477 79,639.52 7,406,475 14.47 71.92 74.50 91
1 103.22 60,280 10,221,250 5,056 110,142.35 64,323,132 16.93 78.20 87.70 493
7 110.21 9,589 1,424,995 5,023 45,789.54 3,983,690 22.57 74.73 85.10 83

CountryEnglish
Spain
Estonia
Finland
Smallest Extent (sq.km)
Mean Extent (sq.km)
Sum-All Urban Extents (sq.km)
Largest Extent (pop)
Smallest Extent (pop)
Mean Extent (pop)
Sum-All Urban Extents (pop)
Pct Total Land Area in
Urban Extents (sq.km)
Pct Total Population
in Urban Extents
(2000,NSO est.)
Pct Total Population
that is urban (2000,UN)
Num UE's from
Nighttime Lights
6 334.65 69,607 5,394,412 5,501 156,655.41 32,584,325 13.78 80.19 77.80 207
22 125.80 2,642 470,287 5,702 46,610.48 978,820 6.12 71.34 69.40 21
52 449.98 19,349 1,299,138 5,726 81,307.79 3,496,235 6.10 67.39 58.50 42
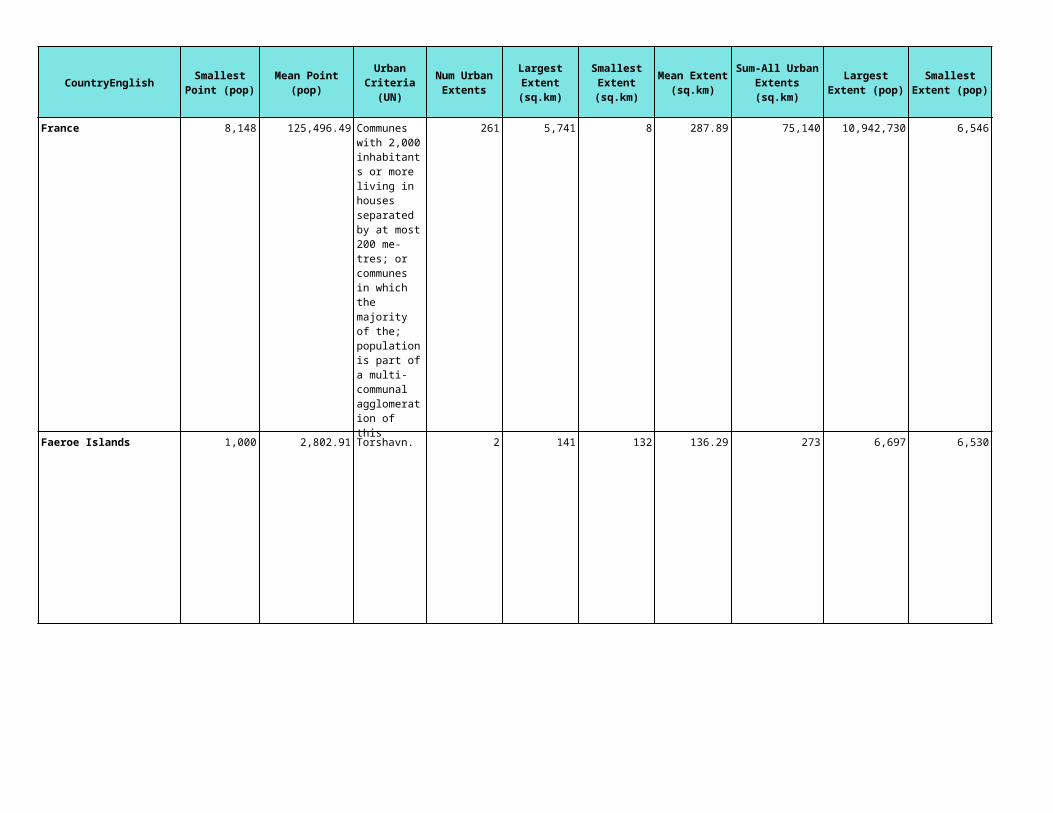
CountryEnglish
France
Faeroe Islands
Smallest Extent (sq.km)
Mean Extent (sq.km)
Sum-All Urban Extents (sq.km)
Largest Extent (pop)
Smallest Extent (pop)
Mean Extent (pop)
Sum-All Urban Extents (pop)
Pct Total Land Area in
Urban Extents (sq.km)
Pct Total Population
in Urban Extents
(2000,NSO est.)
Pct Total Population
that is urban (2000,UN)
Num UE's from
Nighttime Lights
8 287.89 75,140 10,942,730 6,546 160,306.02 41,839,872 13.73 71.05 75.50 261
132 136.29 273 6,697 6,530 6,613.50 13,227 19.36 28.42 38.40 2

CountryEnglish
United Kingdom
Guernsey
Smallest Extent (sq.km)
Mean Extent (sq.km)
Sum-All Urban Extents (sq.km)
Largest Extent (pop)
Smallest Extent (pop)
Mean Extent (pop)
Sum-All Urban Extents (pop)
Pct Total Land Area in
Urban Extents (sq.km)
Pct Total Population
in Urban Extents
(2000,NSO est.)
Pct Total Population
that is urban (2000,UN)
Num UE's from
Nighttime Lights
2 517.59 55,382 12,766,430 5,937 462,174.49 49,452,670 22.40 84.22 89.50 106
62 61.96 62 39,195 39,195 39,195.00 39,195 72.58 69.72 Islands by UN 1

CountryEnglish
Gibraltar
Smallest Extent (sq.km)
Mean Extent (sq.km)
Sum-All Urban Extents (sq.km)
Largest Extent (pop)
Smallest Extent (pop)
Mean Extent (pop)
Sum-All Urban Extents (pop)
Pct Total Land Area in
Urban Extents (sq.km)
Pct Total Population
in Urban Extents
(2000,NSO est.)
Pct Total Population
that is urban (2000,UN)
Num UE's from
Nighttime Lights
4 3.71 4 20,184 20,184 20,184.00 20,184 75.64 73.56 100.00 1

CountryEnglish
Greece
Smallest Extent (sq.km)
Mean Extent (sq.km)
Sum-All Urban Extents (sq.km)
Largest Extent (pop)
Smallest Extent (pop)
Mean Extent (pop)
Sum-All Urban Extents (pop)
Pct Total Land Area in
Urban Extents (sq.km)
Pct Total Population
in Urban Extents
(2000,NSO est.)
Pct Total Population
that is urban (2000,UN)
Num UE's from
Nighttime Lights
11 162.31 18,342 3,640,597 5,003 71,992.02 8,135,098 13.91 75.02 60.30 109

CountryEnglish
Croatia
Hungary
Smallest Extent (sq.km)
Mean Extent (sq.km)
Sum-All Urban Extents (sq.km)
Largest Extent (pop)
Smallest Extent (pop)
Mean Extent (pop)
Sum-All Urban Extents (pop)
Pct Total Land Area in
Urban Extents (sq.km)
Pct Total Population
in Urban Extents
(2000,NSO est.)
Pct Total Population
that is urban (2000,UN)
Num UE's from
Nighttime Lights
8 104.14 4,791 255,147 5,293 30,887.72 1,420,835 8.49 32.99 58.10 40
8 80.65 10,968 2,336,499 5,049 45,166.60 6,142,658 11.92 60.30 64.80 131
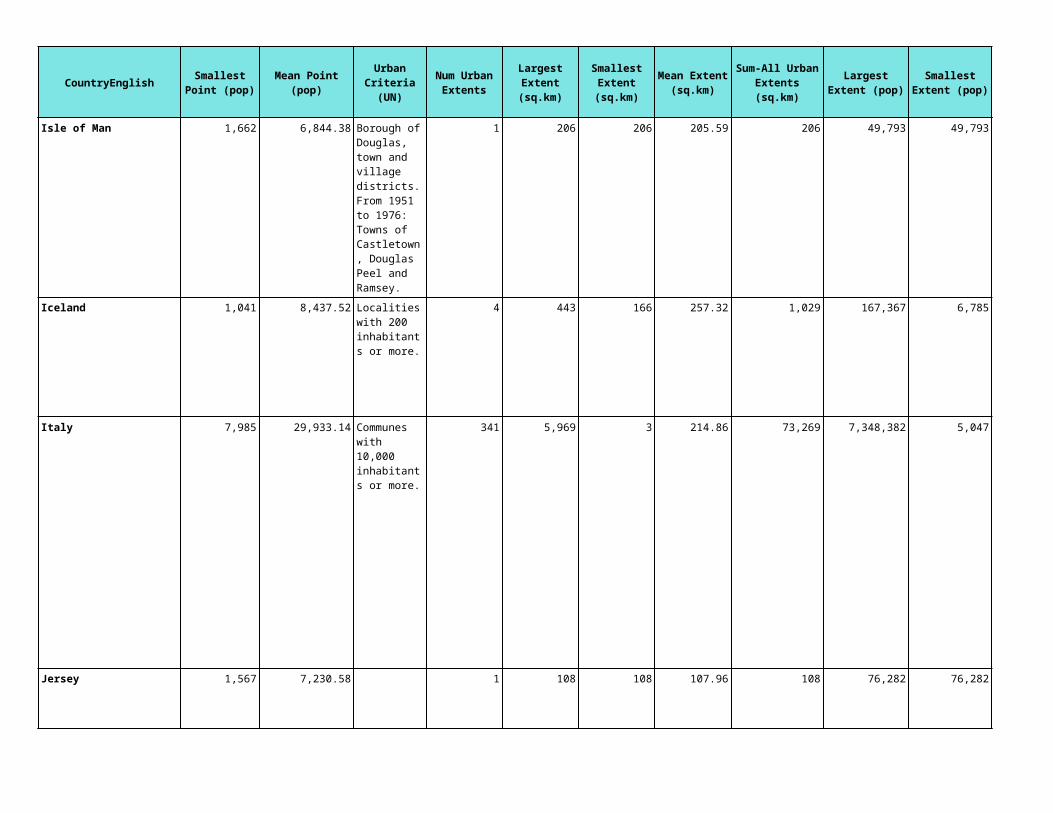
CountryEnglish
Isle of Man
Iceland
Italy
Jersey
Smallest Extent (sq.km)
Mean Extent (sq.km)
Sum-All Urban Extents (sq.km)
Largest Extent (pop)
Smallest Extent (pop)
Mean Extent (pop)
Sum-All Urban Extents (pop)
Pct Total Land Area in
Urban Extents (sq.km)
Pct Total Population
in Urban Extents
(2000,NSO est.)
Pct Total Population
that is urban (2000,UN)
Num UE's from
Nighttime Lights
206 205.59 206 49,793 49,793 49,793.00 49,793 35.97 66.08 76.80 1
166 257.32 1,029 167,367 6,785 51,058.00 204,232 1.13 72.21 92.70 4
3 214.86 73,269 7,348,382 5,047 124,613.95 42,493,357 24.48 74.67 67.10 298
108 107.96 108 76,282 76,282 76,282.00 76,282 90.37 87.81 Islands by UN 1

CountryEnglish
Liechtenstein
Lithuania
Luxembourg
Smallest Extent (sq.km)
Mean Extent (sq.km)
Sum-All Urban Extents (sq.km)
Largest Extent (pop)
Smallest Extent (pop)
Mean Extent (pop)
Sum-All Urban Extents (pop)
Pct Total Land Area in
Urban Extents (sq.km)
Pct Total Population
in Urban Extents
(2000,NSO est.)
Pct Total Population
that is urban (2000,UN)
Num UE's from
Nighttime Lights
97 97.44 97 30,014 30,014 30,014.00 30,014 60.87 91.06 21.50 1
13 95.01 4,941 619,327 5,244 46,739.29 2,430,443 7.60 68.51 68.60 52
25 267.96 804 286,821 7,450 108,522.33 325,567 31.07 75.14 91.90 3

CountryEnglish
Latvia
Monaco
Smallest Extent (sq.km)
Mean Extent (sq.km)
Sum-All Urban Extents (sq.km)
Largest Extent (pop)
Smallest Extent (pop)
Mean Extent (pop)
Sum-All Urban Extents (pop)
Pct Total Land Area in
Urban Extents (sq.km)
Pct Total Population
in Urban Extents
(2000,NSO est.)
Pct Total Population
that is urban (2000,UN)
Num UE's from
Nighttime Lights
24 103.10 3,402 912,508 5,093 47,657.61 1,572,701 5.30 66.05 59.80 33
3 3.45 3 9,166 9,166 9,166.00 9,166 33.45 27.12 100.00 1

CountryEnglish
Republic of Moldova
Macedonia
Malta
Smallest Extent (sq.km)
Mean Extent (sq.km)
Sum-All Urban Extents (sq.km)
Largest Extent (pop)
Smallest Extent (pop)
Mean Extent (pop)
Sum-All Urban Extents (pop)
Pct Total Land Area in
Urban Extents (sq.km)
Pct Total Population
in Urban Extents
(2000,NSO est.)
Pct Total Population
that is urban (2000,UN)
Num UE's from
Nighttime Lights
27 104.65 2,093 829,852 6,312 89,666.50 1,793,330 6.15 41.67 41.40 20
34 127.92 2,686 497,150 9,262 58,970.33 1,238,377 10.87 61.85 59.40 20
61 143.09 286 341,173 29,024 185,098.50 370,197 90.74 94.49 91.20 2
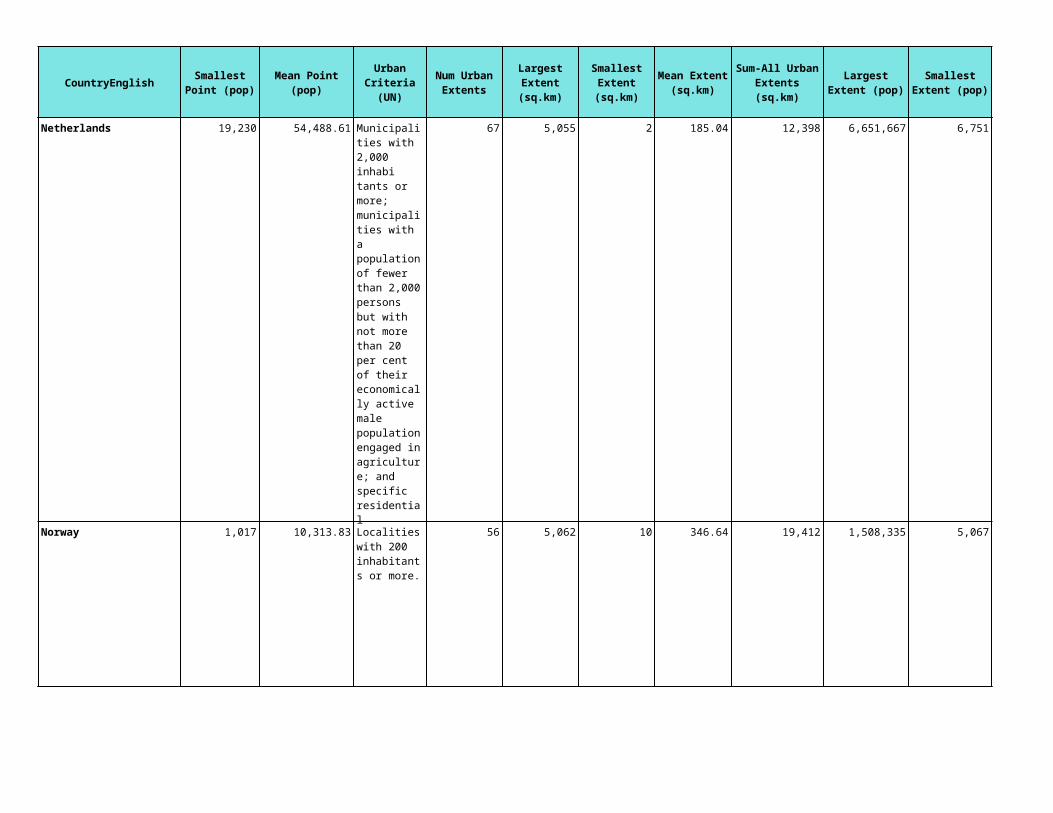
CountryEnglish
Netherlands
Norway
Smallest Extent (sq.km)
Mean Extent (sq.km)
Sum-All Urban Extents (sq.km)
Largest Extent (pop)
Smallest Extent (pop)
Mean Extent (pop)
Sum-All Urban Extents (pop)
Pct Total Land Area in
Urban Extents (sq.km)
Pct Total Population
in Urban Extents
(2000,NSO est.)
Pct Total Population
that is urban (2000,UN)
Num UE's from
Nighttime Lights
2 185.04 12,398 6,651,667 6,751 199,697.09 13,379,705 29.97 42.62 89.60 62
10 346.64 19,412 1,508,335 5,067 55,308.91 3,097,299 6.09 69.43 75.00 56

CountryEnglish
Portugal
Romania
Smallest Extent (sq.km)
Mean Extent (sq.km)
Sum-All Urban Extents (sq.km)
Largest Extent (pop)
Smallest Extent (pop)
Mean Extent (pop)
Sum-All Urban Extents (pop)
Pct Total Land Area in
Urban Extents (sq.km)
Pct Total Population
in Urban Extents
(2000,NSO est.)
Pct Total Population
that is urban (2000,UN)
Num UE's from
Nighttime Lights
7 154.44 12,818 2,379,443 5,100 88,341.27 7,332,325 14.02 71.01 65.80 78
10 60.98 14,452 2,197,247 5,000 45,731.01 10,838,249 6.10 49.79 55.20 149
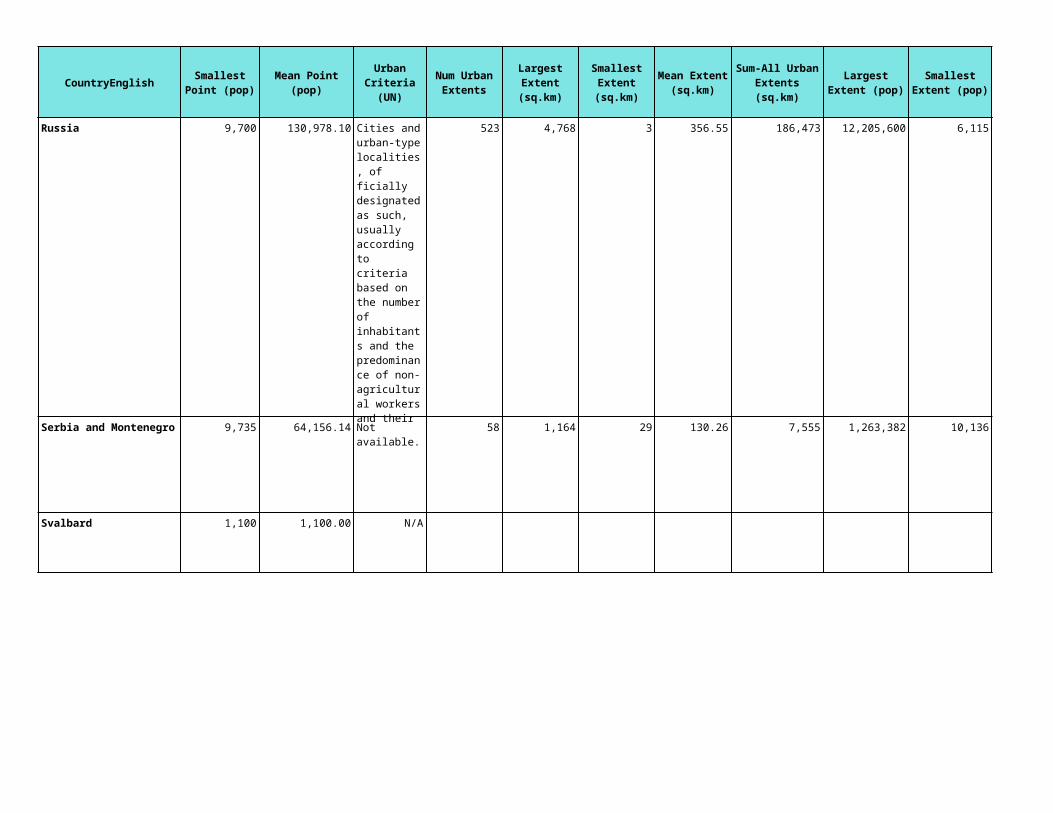
CountryEnglish
Russia
Serbia and Montenegro
Svalbard
Smallest Extent (sq.km)
Mean Extent (sq.km)
Sum-All Urban Extents (sq.km)
Largest Extent (pop)
Smallest Extent (pop)
Mean Extent (pop)
Sum-All Urban Extents (pop)
Pct Total Land Area in
Urban Extents (sq.km)
Pct Total Population
in Urban Extents
(2000,NSO est.)
Pct Total Population
that is urban (2000,UN)
Num UE's from
Nighttime Lights
3 356.55 186,473 12,205,600 6,115 186,857.72 97,726,585 1.12 67.21 72.90 494
29 130.26 7,555 1,263,382 10,136 94,487.36 5,480,267 7.44 51.54 51.70 58
considered part of Norway by UN

CountryEnglish
San Marino
Slovakia
Slovenia
Smallest Extent (sq.km)
Mean Extent (sq.km)
Sum-All Urban Extents (sq.km)
Largest Extent (pop)
Smallest Extent (pop)
Mean Extent (pop)
Sum-All Urban Extents (pop)
Pct Total Land Area in
Urban Extents (sq.km)
Pct Total Population
in Urban Extents
(2000,NSO est.)
Pct Total Population
that is urban (2000,UN)
Num UE's from
Nighttime Lights
90.40
9 78.72 6,849 458,054 5,096 37,705.17 3,280,350 14.01 61.55 57.60 85
8 70.83 2,692 464,033 5,114 32,925.53 1,251,170 13.31 63.49 49.10 36

CountryEnglish
Sweden
Ukraine
Holy See
Smallest Extent (sq.km)
Mean Extent (sq.km)
Sum-All Urban Extents (sq.km)
Largest Extent (pop)
Smallest Extent (pop)
Mean Extent (pop)
Sum-All Urban Extents (pop)
Pct Total Land Area in
Urban Extents (sq.km)
Pct Total Population
in Urban Extents
(2000,NSO est.)
Pct Total Population
that is urban (2000,UN)
Num UE's from
Nighttime Lights
14 234.48 35,875 1,623,541 5,015 42,677.88 6,529,716 8.31 73.48 83.30 150
20 327.27 26,836 2,799,830 54,321 352,446.98 28,900,652 4.56 50.19 68.00 80
100.00
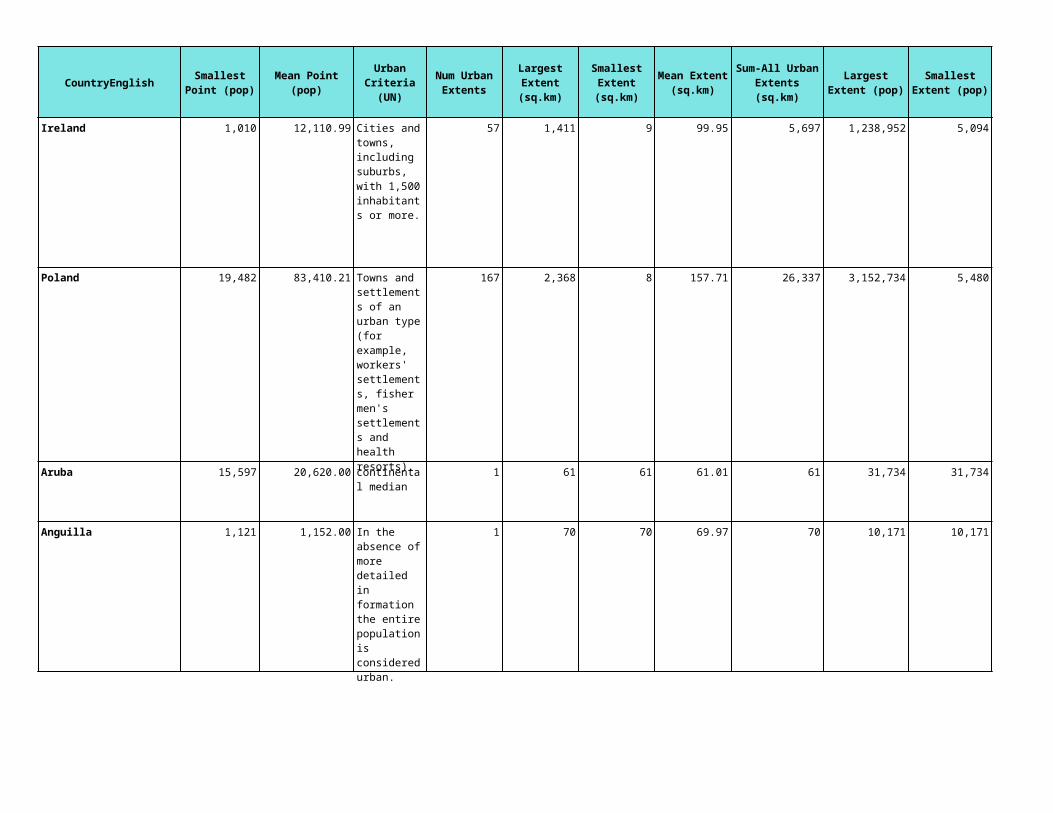
CountryEnglish
Ireland
Poland
Aruba
Anguilla
Smallest Extent (sq.km)
Mean Extent (sq.km)
Sum-All Urban Extents (sq.km)
Largest Extent (pop)
Smallest Extent (pop)
Mean Extent (pop)
Sum-All Urban Extents (pop)
Pct Total Land Area in
Urban Extents (sq.km)
Pct Total Population
in Urban Extents
(2000,NSO est.)
Pct Total Population
that is urban (2000,UN)
Num UE's from
Nighttime Lights
9 99.95 5,697 1,238,952 5,094 41,251.35 2,351,327 8.20 61.71 59.30 57
8 157.71 26,337 3,152,734 5,480 133,168.83 22,239,194 8.46 57.55 62.50 166
61 61.01 61 31,734 31,734 31,734.00 31,734 32.26 31.55 51.00 1
70 69.97 70 10,171 10,171 10,171.00 10,171 84.48 89.14 100.00 1

CountryEnglish
Netherland Antilles
Antigua and Barbuda
Bahamas
Belize
Bermuda
Barbados
Smallest Extent (sq.km)
Mean Extent (sq.km)
Sum-All Urban Extents (sq.km)
Largest Extent (pop)
Smallest Extent (pop)
Mean Extent (pop)
Sum-All Urban Extents (pop)
Pct Total Land Area in
Urban Extents (sq.km)
Pct Total Population
in Urban Extents
(2000,NSO est.)
Pct Total Population
that is urban (2000,UN)
Num UE's from
Nighttime Lights
358 358.25 358 155,353 155,353 155,353.00 155,353 43.79 87.92 69.30 1
273 273.37 273 57,490 57,490 57,490.00 57,490 61.59 88.65 37.10 1
11 125.71 503 201,986 9,388 61,667.25 246,669 3.82 81.23 88.90 4
27 88.64 532 45,030 7,270 15,520.33 93,122 2.39 38.77 48.10 6
6 24.93 50 42,320 5,798 24,059.00 48,118 78.85 76.43 100.00 2
434 434.11 434 262,157 262,157 262,157.00 262,157 98.44 98.00 50.50 1
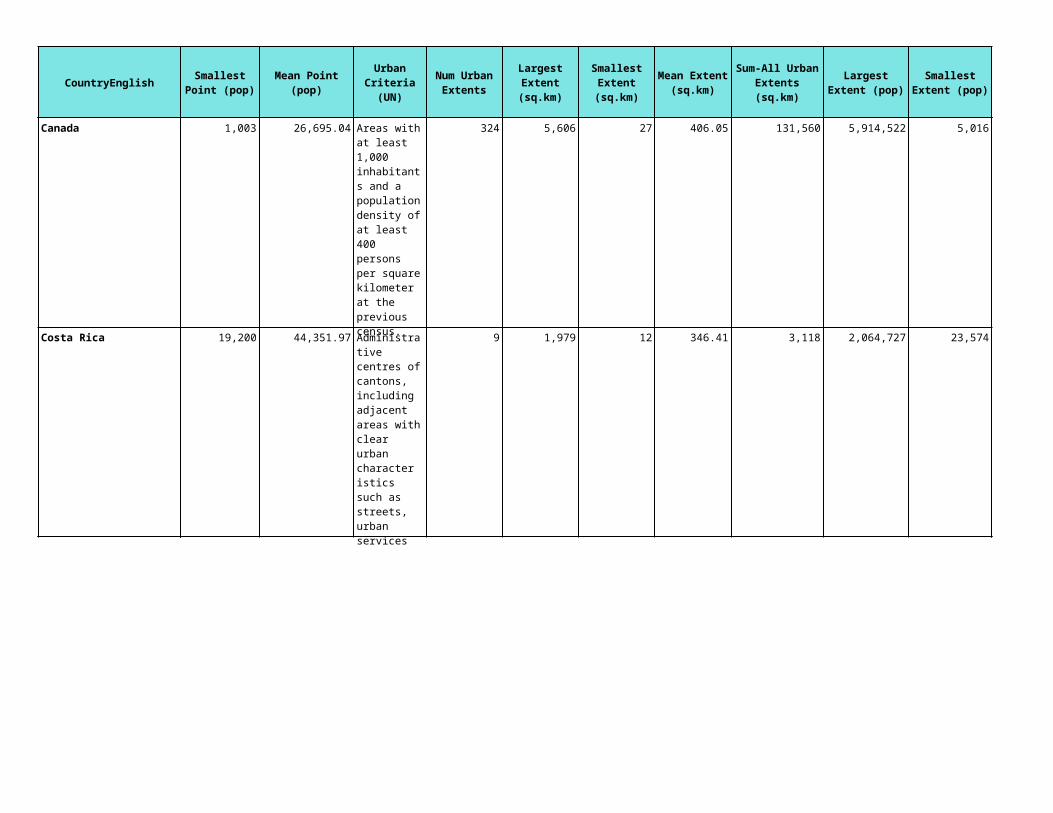
CountryEnglish
Canada
Costa Rica
Smallest Extent (sq.km)
Mean Extent (sq.km)
Sum-All Urban Extents (sq.km)
Largest Extent (pop)
Smallest Extent (pop)
Mean Extent (pop)
Sum-All Urban Extents (pop)
Pct Total Land Area in
Urban Extents (sq.km)
Pct Total Population
in Urban Extents
(2000,NSO est.)
Pct Total Population
that is urban (2000,UN)
Num UE's from
Nighttime Lights
27 406.05 131,560 5,914,522 5,016 81,840.50 26,516,323 1.39 89.07 78.90 321
12 346.41 3,118 2,064,727 23,574 260,310.78 2,342,797 6.11 64.71 59.50 8

CountryEnglish
Cuba
Cayman Islands
Commonwealth of Dominica
Smallest Extent (sq.km)
Mean Extent (sq.km)
Sum-All Urban Extents (sq.km)
Largest Extent (pop)
Smallest Extent (pop)
Mean Extent (pop)
Sum-All Urban Extents (pop)
Pct Total Land Area in
Urban Extents (sq.km)
Pct Total Population
in Urban Extents
(2000,NSO est.)
Pct Total Population
that is urban (2000,UN)
Num UE's from
Nighttime Lights
2 84.08 9,585 2,444,038 5,248 72,560.96 8,271,949 8.62 73.74 75.50 66
188 188.26 188 32,497 32,497 32,497.00 32,497 67.59 79.76 100.00 1
49 63.78 191 22,762 5,368 12,179.67 36,539 24.87 52.72 71.40 1

CountryEnglish
Dominican Republic
Guadeloupe
Grenada
Smallest Extent (sq.km)
Mean Extent (sq.km)
Sum-All Urban Extents (sq.km)
Largest Extent (pop)
Smallest Extent (pop)
Mean Extent (pop)
Sum-All Urban Extents (pop)
Pct Total Land Area in
Urban Extents (sq.km)
Pct Total Population
in Urban Extents
(2000,NSO est.)
Pct Total Population
that is urban (2000,UN)
Num UE's from
Nighttime Lights
9 167.60 5,028 3,150,998 10,428 180,186.40 5,405,592 10.46 67.55 66.00 30
20 290.06 1,160 188,789 5,174 86,864.50 347,458 66.25 81.32 99.60 4
15 40.14 161 31,774 5,152 14,096.75 56,387 49.37 60.31 38.40 2

CountryEnglish
Greenland
Smallest Extent (sq.km)
Mean Extent (sq.km)
Sum-All Urban Extents (sq.km)
Largest Extent (pop)
Smallest Extent (pop)
Mean Extent (pop)
Sum-All Urban Extents (pop)
Pct Total Land Area in
Urban Extents (sq.km)
Pct Total Population
in Urban Extents
(2000,NSO est.)
Pct Total Population
that is urban (2000,UN)
Num UE's from
Nighttime Lights
30 36.21 72 13,036 5,720 9,378.00 18,756 0.02 33.48 82.30 2

CountryEnglish
Guatemala
Smallest Extent (sq.km)
Mean Extent (sq.km)
Sum-All Urban Extents (sq.km)
Largest Extent (pop)
Smallest Extent (pop)
Mean Extent (pop)
Sum-All Urban Extents (pop)
Pct Total Land Area in
Urban Extents (sq.km)
Pct Total Population
in Urban Extents
(2000,NSO est.)
Pct Total Population
that is urban (2000,UN)
Num UE's from
Nighttime Lights
15 145.52 3,784 2,877,668 6,834 166,251.35 4,322,535 3.49 42.01 39.90 26

CountryEnglish
Honduras
Haiti
Smallest Extent (sq.km)
Mean Extent (sq.km)
Sum-All Urban Extents (sq.km)
Largest Extent (pop)
Smallest Extent (pop)
Mean Extent (pop)
Sum-All Urban Extents (pop)
Pct Total Land Area in
Urban Extents (sq.km)
Pct Total Population
in Urban Extents
(2000,NSO est.)
Pct Total Population
that is urban (2000,UN)
Num UE's from
Nighttime Lights
1 91.81 3,121 936,681 6,454 81,875.00 2,783,750 2.78 47.12 53.70 26
1 51.95 468 1,343,417 5,657 306,535.67 2,758,821 1.74 32.19 36.30 6

CountryEnglish
Jamaica
Saint Kitts and Nevis
Saint Lucia
Smallest Extent (sq.km)
Mean Extent (sq.km)
Sum-All Urban Extents (sq.km)
Largest Extent (pop)
Smallest Extent (pop)
Mean Extent (pop)
Sum-All Urban Extents (pop)
Pct Total Land Area in
Urban Extents (sq.km)
Pct Total Population
in Urban Extents
(2000,NSO est.)
Pct Total Population
that is urban (2000,UN)
Num UE's from
Nighttime Lights
7 239.75 2,637 1,054,480 6,232 129,109.45 1,420,204 23.84 54.98 56.60 11
88 118.83 238 27,094 7,238 17,166.00 34,332 85.90 89.24 34.20 2
32 119.65 359 64,788 8,583 33,283.00 99,849 57.92 67.56 38.00 3

CountryEnglish
Mexico
Smallest Extent (sq.km)
Mean Extent (sq.km)
Sum-All Urban Extents (sq.km)
Largest Extent (pop)
Smallest Extent (pop)
Mean Extent (pop)
Sum-All Urban Extents (pop)
Pct Total Land Area in
Urban Extents (sq.km)
Pct Total Population
in Urban Extents
(2000,NSO est.)
Pct Total Population
that is urban (2000,UN)
Num UE's from
Nighttime Lights
7 219.37 102,005 18,210,260 5,051 135,851.78 63,171,077 5.25 64.87 74.60 458
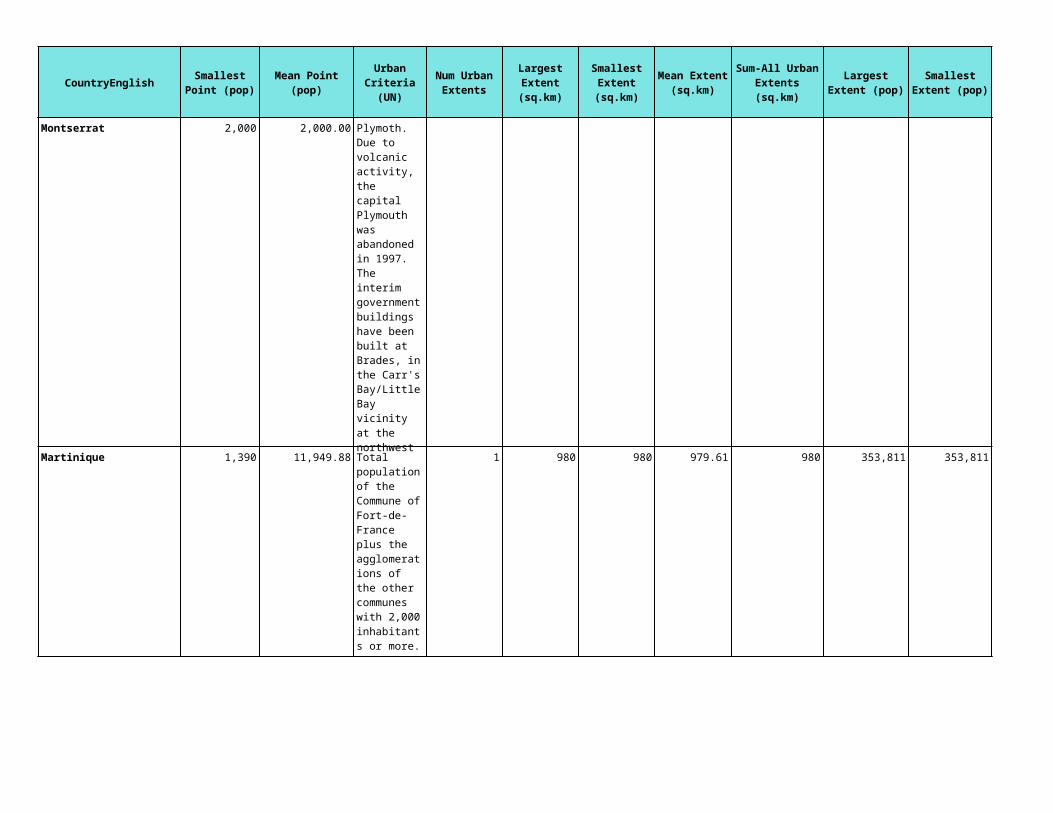
CountryEnglish
Montserrat
Martinique
Smallest Extent (sq.km)
Mean Extent (sq.km)
Sum-All Urban Extents (sq.km)
Largest Extent (pop)
Smallest Extent (pop)
Mean Extent (pop)
Sum-All Urban Extents (pop)
Pct Total Land Area in
Urban Extents (sq.km)
Pct Total Population
in Urban Extents
(2000,NSO est.)
Pct Total Population
that is urban (2000,UN)
Num UE's from
Nighttime Lights
13.10
980 979.61 980 353,811 353,811 353,811.00 353,811 85.45 92.29 95.20 1
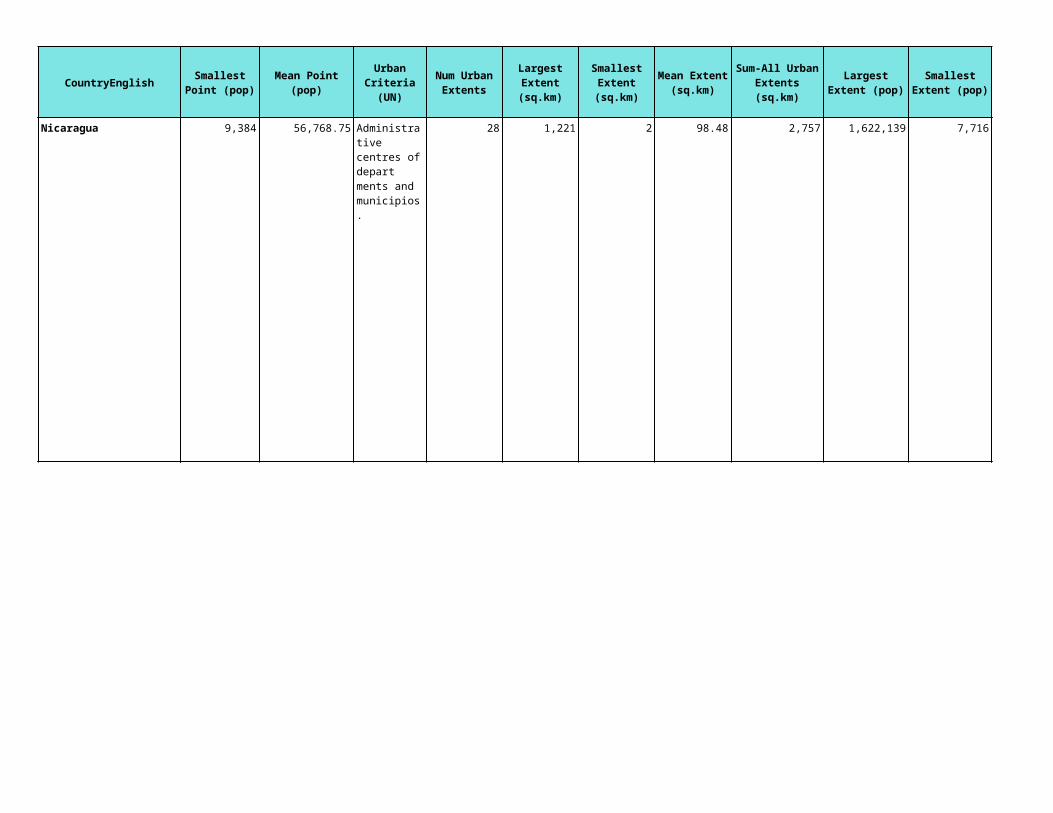
CountryEnglish
Nicaragua
Smallest Extent (sq.km)
Mean Extent (sq.km)
Sum-All Urban Extents (sq.km)
Largest Extent (pop)
Smallest Extent (pop)
Mean Extent (pop)
Sum-All Urban Extents (pop)
Pct Total Land Area in
Urban Extents (sq.km)
Pct Total Population
in Urban Extents
(2000,NSO est.)
Pct Total Population
that is urban (2000,UN)
Num UE's from
Nighttime Lights
2 98.48 2,757 1,622,139 7,716 99,076.43 2,774,140 2.33 52.44 56.50 25
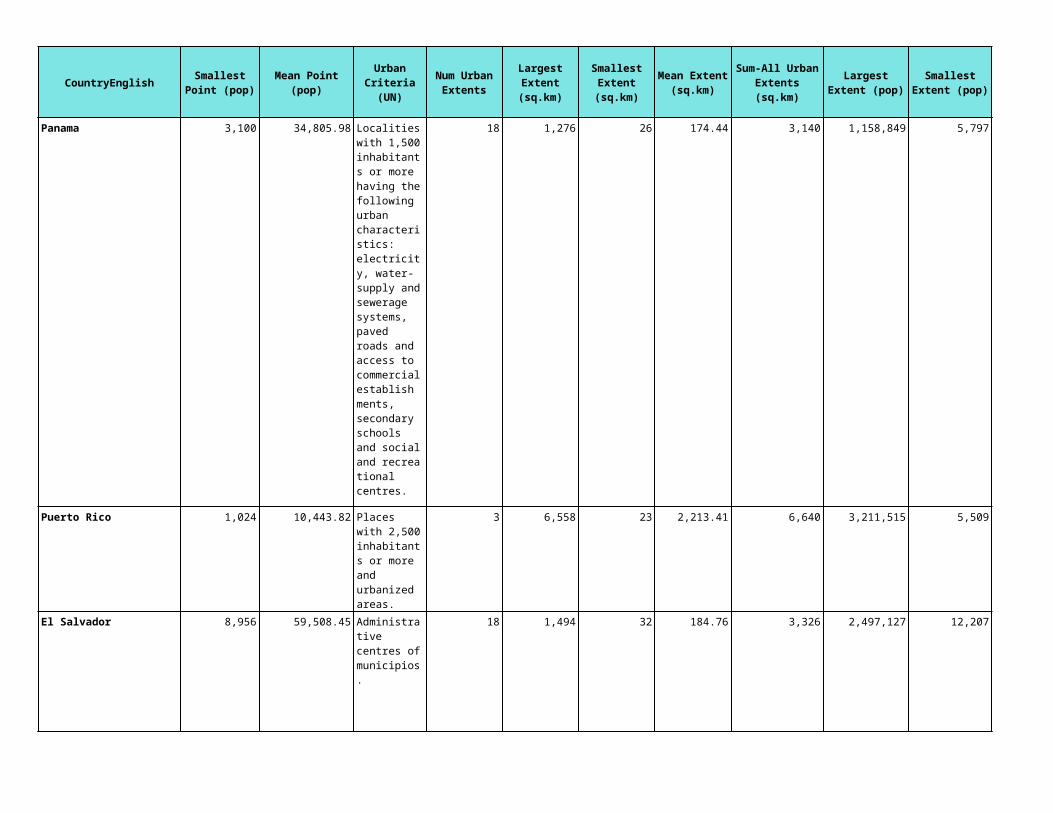
CountryEnglish
Panama
Puerto Rico
El Salvador
Smallest Extent (sq.km)
Mean Extent (sq.km)
Sum-All Urban Extents (sq.km)
Largest Extent (pop)
Smallest Extent (pop)
Mean Extent (pop)
Sum-All Urban Extents (pop)
Pct Total Land Area in
Urban Extents (sq.km)
Pct Total Population
in Urban Extents
(2000,NSO est.)
Pct Total Population
that is urban (2000,UN)
Num UE's from
Nighttime Lights
26 174.44 3,140 1,158,849 5,797 91,998.72 1,655,977 4.21 59.92 56.50 15
23 2,213.41 6,640 3,211,515 5,509 1,075,999.33 3,227,998 73.90 81.22 75.60 3
32 184.76 3,326 2,497,127 12,207 187,163.11 3,368,936 16.40 56.31 61.50 17

CountryEnglish
St-Pierre and Miquelon
Trinidad and Tobago
United States of America
Turks and Caicos Islands
Smallest Extent (sq.km)
Mean Extent (sq.km)
Sum-All Urban Extents (sq.km)
Largest Extent (pop)
Smallest Extent (pop)
Mean Extent (pop)
Sum-All Urban Extents (pop)
Pct Total Land Area in
Urban Extents (sq.km)
Pct Total Population
in Urban Extents
(2000,NSO est.)
Pct Total Population
that is urban (2000,UN)
Num UE's from
Nighttime Lights
22 22.30 22 5,571 5,571 5,571.00 5,571 9.81 88.15 92.20 1
45.60
38 756.97 2,271 1,046,097 19,635 369,538.00 1,108,614 43.65 90.49 74.50 3
6 461.37 753,884 19,015,360 5,004 140,072.58 228,878,602 8.18 81.36 77.40 1,622
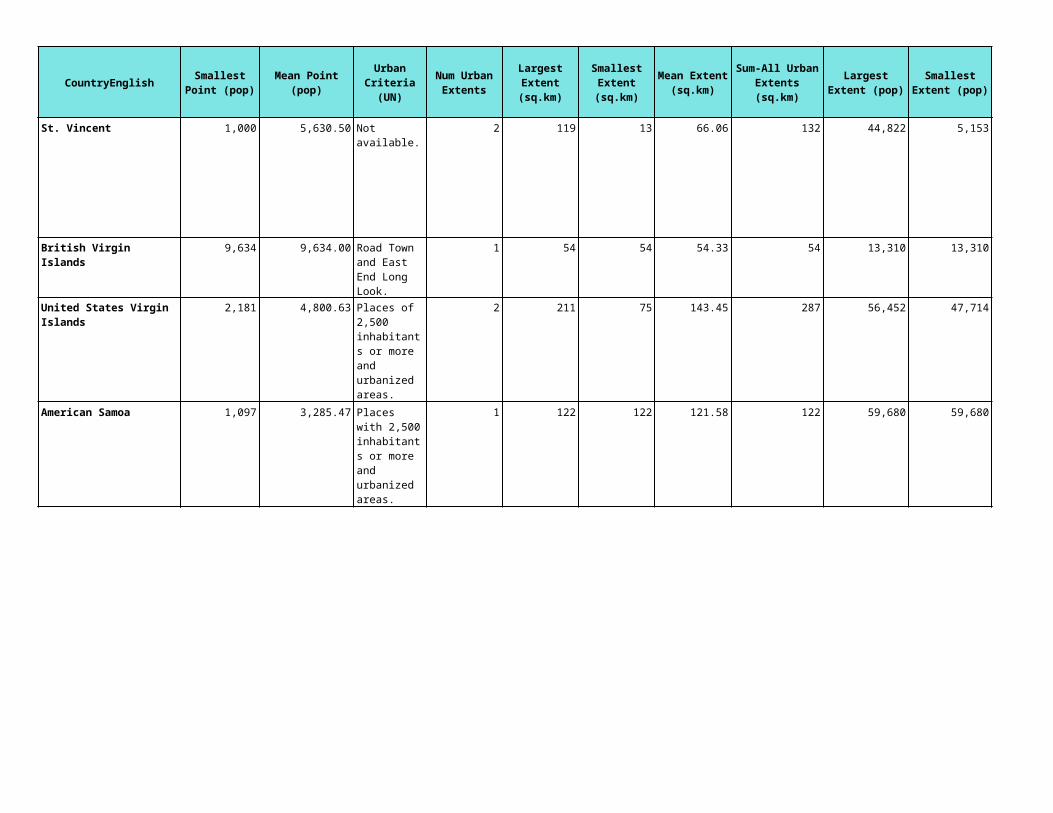
CountryEnglish
St. Vincent
British Virgin Islands
American Samoa
United States Virgin Islands
Smallest Extent (sq.km)
Mean Extent (sq.km)
Sum-All Urban Extents (sq.km)
Largest Extent (pop)
Smallest Extent (pop)
Mean Extent (pop)
Sum-All Urban Extents (pop)
Pct Total Land Area in
Urban Extents (sq.km)
Pct Total Population
in Urban Extents
(2000,NSO est.)
Pct Total Population
that is urban (2000,UN)
Num UE's from
Nighttime Lights
13 66.06 132 44,822 5,153 24,987.50 49,975 29.17 44.12 56.00 1
54 54.33 54 13,310 13,310 13,310.00 13,310 32.68 61.02 62.00 1
75 143.45 287 56,452 47,714 52,083.00 104,166 76.71 95.91 46.70 2
122 121.58 122 59,680 59,680 59,680.00 59,680 61.34 104.17 53.20 1

CountryEnglish
Australia
Cook Islands
Fiji
Smallest Extent (sq.km)
Mean Extent (sq.km)
Sum-All Urban Extents (sq.km)
Largest Extent (pop)
Smallest Extent (pop)
Mean Extent (pop)
Sum-All Urban Extents (pop)
Pct Total Land Area in
Urban Extents (sq.km)
Pct Total Population
in Urban Extents
(2000,NSO est.)
Pct Total Population
that is urban (2000,UN)
Num UE's from
Nighttime Lights
6 246.70 36,512 3,620,772 5,558 112,563.87 16,659,453 0.48 94.10 91.20 147
56 56.46 56 9,697 9,697 9,697.00 9,697 8.21 53.33 59.10 1
12 262.42 1,837 174,442 5,575 54,313.57 380,195 10.06 46.84 50.20 6

CountryEnglish
Guam
Kiribati
Marshall Islands
Federated State of Micronesia
Northern Mariana Islands
Smallest Extent (sq.km)
Mean Extent (sq.km)
Sum-All Urban Extents (sq.km)
Largest Extent (pop)
Smallest Extent (pop)
Mean Extent (pop)
Sum-All Urban Extents (pop)
Pct Total Land Area in
Urban Extents (sq.km)
Pct Total Population
in Urban Extents
(2000,NSO est.)
Pct Total Population
that is urban (2000,UN)
Num UE's from
Nighttime Lights
28.60
518 518.43 518 150,463 150,463 150,463.00 150,463 94.94 97.20 39.50 1
2 2.30 5 5,367 5,344 5,355.50 10,711 0.43 12.68 38.60 0
4 3.80 4 16,264 16,264 16,264.00 16,264 1.74 31.80 66.00 1
108 107.52 108 58,571 58,571 58,571.00 58,571 23.07 84.61 52.80 1

CountryEnglish
New Caledonia
Niue
Nauru
Smallest Extent (sq.km)
Mean Extent (sq.km)
Sum-All Urban Extents (sq.km)
Largest Extent (pop)
Smallest Extent (pop)
Mean Extent (pop)
Sum-All Urban Extents (pop)
Pct Total Land Area in
Urban Extents (sq.km)
Pct Total Population
in Urban Extents
(2000,NSO est.)
Pct Total Population
that is urban (2000,UN)
Num UE's from
Nighttime Lights
209 208.76 209 123,174 123,174 123,174.00 123,174 1.11 56.39 78.10 1
33.10
16 15.65 16 10,411 10,411 10,411.00 10,411 85.32 90.53 100.00 1

CountryEnglish
New Zealand
Pitcairn
Palau
Smallest Extent (sq.km)
Mean Extent (sq.km)
Sum-All Urban Extents (sq.km)
Largest Extent (pop)
Smallest Extent (pop)
Mean Extent (pop)
Sum-All Urban Extents (pop)
Pct Total Land Area in
Urban Extents (sq.km)
Pct Total Population
in Urban Extents
(2000,NSO est.)
Pct Total Population
that is urban (2000,UN)
Num UE's from
Nighttime Lights
39 175.86 8,089 1,028,644 5,129 65,234.96 3,000,808 3.05 79.56 85.90 46
N/A
12 12.17 12 11,111 11,111 11,111.00 11,111 2.63 58.08 69.30 1

CountryEnglish
Papua New Guinea
French Polynesia
Solomon Islands
Tonga
Smallest Extent (sq.km)
Mean Extent (sq.km)
Sum-All Urban Extents (sq.km)
Largest Extent (pop)
Smallest Extent (pop)
Mean Extent (pop)
Sum-All Urban Extents (pop)
Pct Total Land Area in
Urban Extents (sq.km)
Pct Total Population
in Urban Extents
(2000,NSO est.)
Pct Total Population
that is urban (2000,UN)
Num UE's from
Nighttime Lights
8 59.71 1,194 290,743 5,014 36,687.70 733,754 0.26 15.20 17.60 17
23 116.87 234 64,044 6,899 35,471.50 70,943 6.24 30.03 52.60 2
74 74.47 74 74,954 74,954 74,954.00 74,954 0.26 17.82 20.20 1
183 182.92 183 52,269 52,269 52,269.00 52,269 27.53 52.98 33.00 1
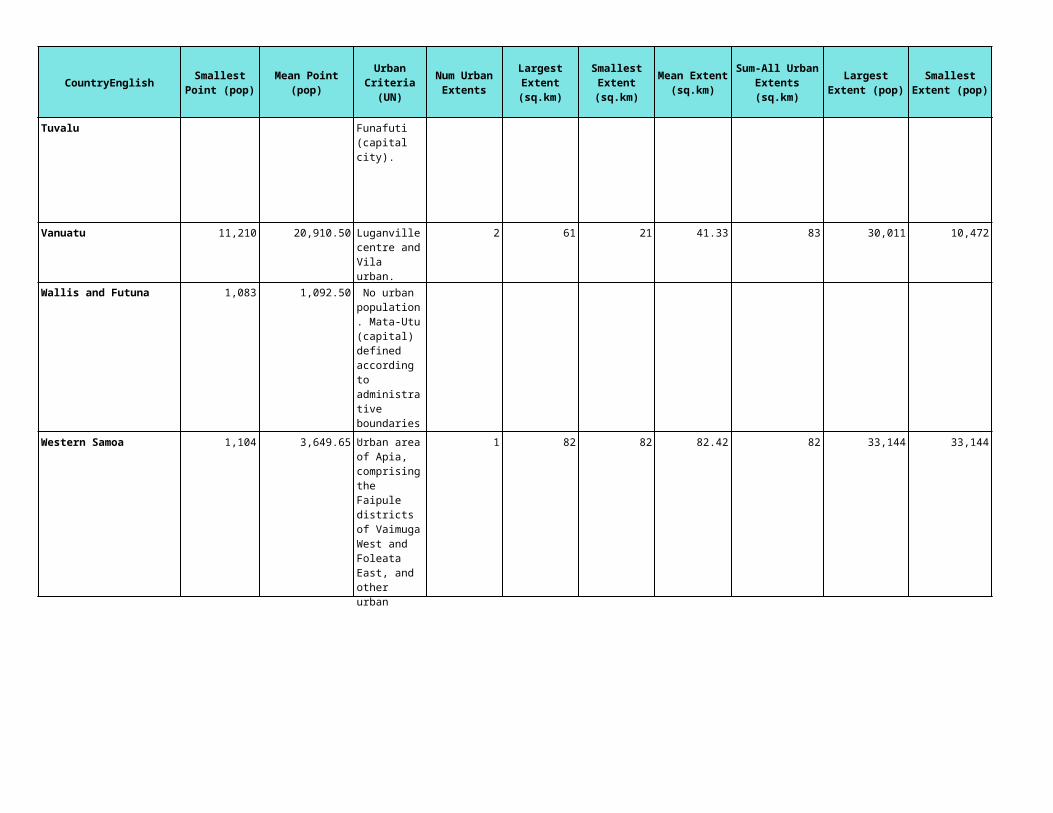
CountryEnglish
Tuvalu
Vanuatu
Wallis and Futuna
Western Samoa
Smallest Extent (sq.km)
Mean Extent (sq.km)
Sum-All Urban Extents (sq.km)
Largest Extent (pop)
Smallest Extent (pop)
Mean Extent (pop)
Sum-All Urban Extents (pop)
Pct Total Land Area in
Urban Extents (sq.km)
Pct Total Population
in Urban Extents
(2000,NSO est.)
Pct Total Population
that is urban (2000,UN)
Num UE's from
Nighttime Lights
53.20
21 41.33 83 30,011 10,472 20,241.50 40,483 0.67 24.57 22.10 2
—
82 82.42 82 33,144 33,144 33,144.00 33,144 2.85 18.91 22.30 1

CountryEnglish
Argentina
Smallest Extent (sq.km)
Mean Extent (sq.km)
Sum-All Urban Extents (sq.km)
Largest Extent (pop)
Smallest Extent (pop)
Mean Extent (pop)
Sum-All Urban Extents (pop)
Pct Total Land Area in
Urban Extents (sq.km)
Pct Total Population
in Urban Extents
(2000,NSO est.)
Pct Total Population
that is urban (2000,UN)
Num UE's from
Nighttime Lights
9 123.97 57,648 13,059,690 5,008 65,965.33 30,673,878 2.11 85.22 88.30 443

CountryEnglish
Bolivia
Brazil
Smallest Extent (sq.km)
Mean Extent (sq.km)
Sum-All Urban Extents (sq.km)
Largest Extent (pop)
Smallest Extent (pop)
Mean Extent (pop)
Sum-All Urban Extents (pop)
Pct Total Land Area in
Urban Extents (sq.km)
Pct Total Population
in Urban Extents
(2000,NSO est.)
Pct Total Population
that is urban (2000,UN)
Num UE's from
Nighttime Lights
3 92.16 6,175 1,263,761 5,101 74,985.49 5,024,028 0.58 64.05 62.90 36
1 88.36 188,477 20,405,800 5,009 58,056.22 123,833,915 2.22 72.93 81.70 1,682
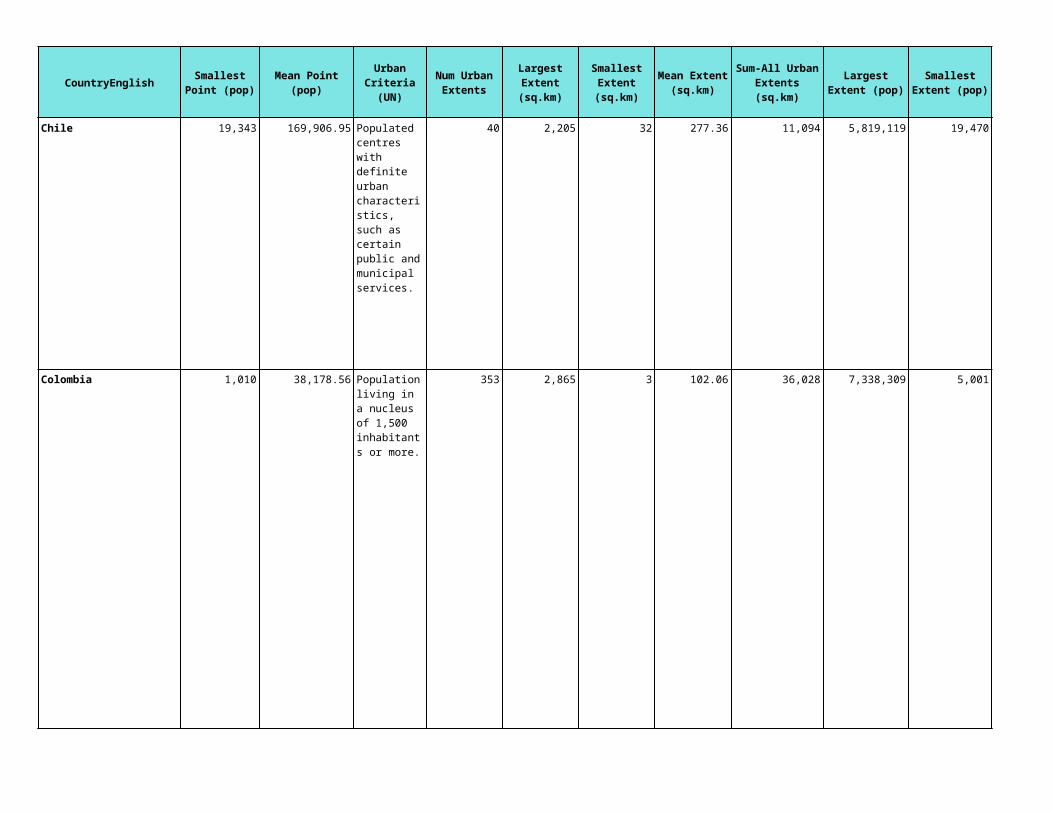
CountryEnglish
Chile
Colombia
Smallest Extent (sq.km)
Mean Extent (sq.km)
Sum-All Urban Extents (sq.km)
Largest Extent (pop)
Smallest Extent (pop)
Mean Extent (pop)
Sum-All Urban Extents (pop)
Pct Total Land Area in
Urban Extents (sq.km)
Pct Total Population
in Urban Extents
(2000,NSO est.)
Pct Total Population
that is urban (2000,UN)
Num UE's from
Nighttime Lights
32 277.36 11,094 5,819,119 19,470 289,130.75 11,565,230 1.54 78.55 86.10 40
3 102.06 36,028 7,338,309 5,001 85,488.72 30,177,517 3.16 82.60 75.50 299

CountryEnglish
Ecuador
Falkland Islands
French Guiana
Smallest Extent (sq.km)
Mean Extent (sq.km)
Sum-All Urban Extents (sq.km)
Largest Extent (pop)
Smallest Extent (pop)
Mean Extent (pop)
Sum-All Urban Extents (pop)
Pct Total Land Area in
Urban Extents (sq.km)
Pct Total Population
in Urban Extents
(2000,NSO est.)
Pct Total Population
that is urban (2000,UN)
Num UE's from
Nighttime Lights
15 249.96 9,998 2,082,085 8,037 191,094.95 7,643,798 4.05 65.44 63.40 40
81.30
27 94.08 376 48,074 6,288 24,838.25 99,353 0.45 69.27 75.20 4
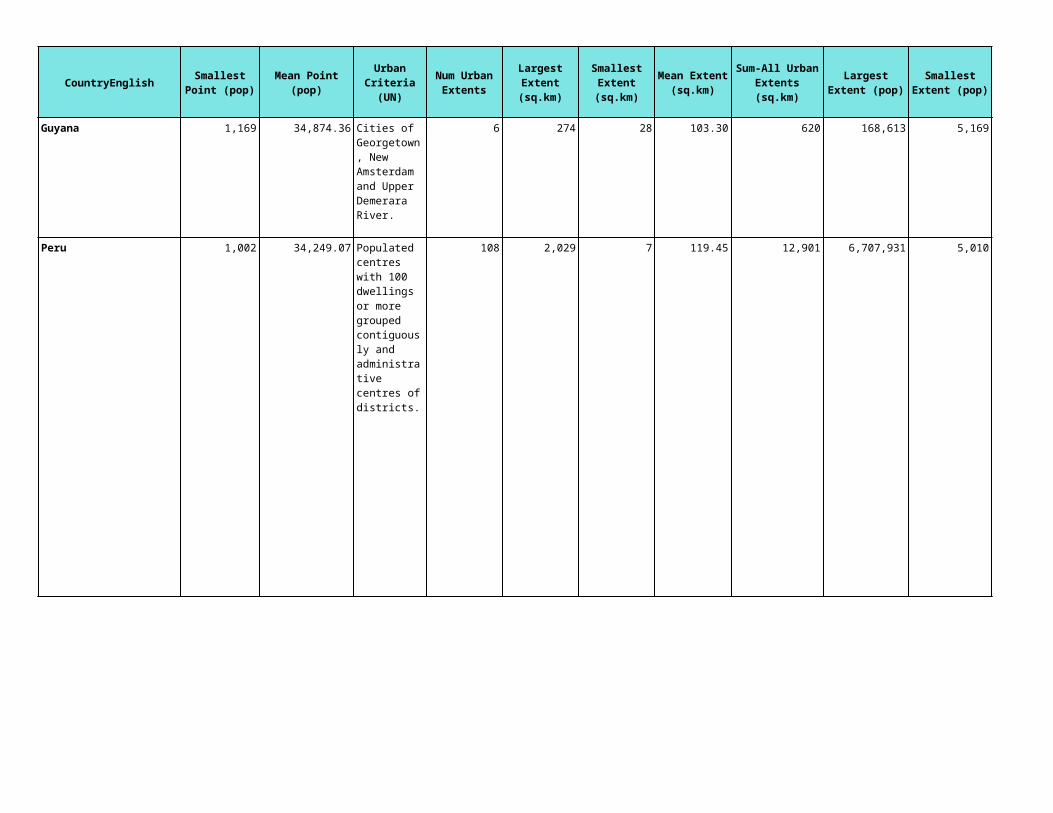
CountryEnglish
Guyana
Peru
Smallest Extent (sq.km)
Mean Extent (sq.km)
Sum-All Urban Extents (sq.km)
Largest Extent (pop)
Smallest Extent (pop)
Mean Extent (pop)
Sum-All Urban Extents (pop)
Pct Total Land Area in
Urban Extents (sq.km)
Pct Total Population
in Urban Extents
(2000,NSO est.)
Pct Total Population
that is urban (2000,UN)
Num UE's from
Nighttime Lights
28 103.30 620 168,613 5,169 44,865.17 269,191 0.29 34.14 36.70 3
7 119.45 12,901 6,707,931 5,010 108,517.92 11,719,935 1.00 45.52 73.10 66

CountryEnglish
Paraguay
Suriname
Smallest Extent (sq.km)
Mean Extent (sq.km)
Sum-All Urban Extents (sq.km)
Largest Extent (pop)
Smallest Extent (pop)
Mean Extent (pop)
Sum-All Urban Extents (pop)
Pct Total Land Area in
Urban Extents (sq.km)
Pct Total Population
in Urban Extents
(2000,NSO est.)
Pct Total Population
that is urban (2000,UN)
Num UE's from
Nighttime Lights
11 199.64 3,594 2,120,722 6,201 166,804.00 3,002,472 0.91 60.82 56.70 17
178 303.66 607 290,919 5,059 147,989.00 295,978 0.43 66.46 74.80 2

CountryEnglish
Uruguay
Venezuela
Smallest Extent (sq.km)
Mean Extent (sq.km)
Sum-All Urban Extents (sq.km)
Largest Extent (pop)
Smallest Extent (pop)
Mean Extent (pop)
Sum-All Urban Extents (pop)
Pct Total Land Area in
Urban Extents (sq.km)
Pct Total Population
in Urban Extents
(2000,NSO est.)
Pct Total Population
that is urban (2000,UN)
Num UE's from
Nighttime Lights
14 90.60 5,617 1,712,684 5,031 44,968.77 2,788,064 3.23 85.85 92.10 49
3 227.58 40,282 6,097,075 5,088 118,115.69 20,906,477 4.42 100.95 87.20 153

CountryEnglish
Angola
Burundi
Benin
Burkina Faso
1 1 0
14 0 0
28 0 0
85 0 0
Num UE's from
RegressionsNum UE's from DCW
Num UE's from other
sources
Settlement Point
Population Source
Settlement Point
Coordinate Source
AFCities (provided by Uwe Deichman, World Bank); World Gazetteer, www.gazetteer.de
AFCities; NIMA
AFCities (provided by Uwe Deichman, World Bank); World Gazetteer, www.gazetteer.de
AFCities; World Gazetteer
AFCities (provided by Uwe Deichman, World Bank); City Population, http://www.citypopulation.de
AFCities; Columbia Gazetteer; NIMA; Times Atlas of the World 1999
BKFPopts (provided by Uwe Deichman, World Bank); City Population, http://www.citypopulation.de; World Gazetteer, www.gazetteer.de
BKPopts (provided by Uwe Deichman; World Bank); NIMA; World Gazetteer
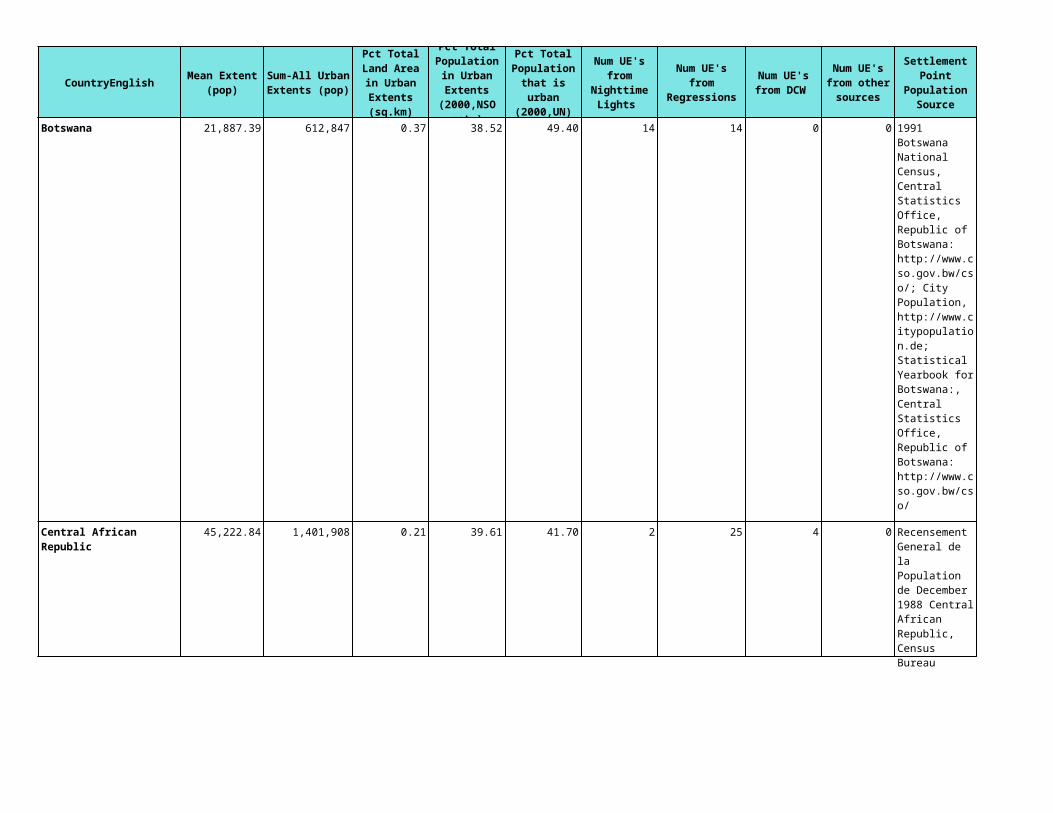
CountryEnglish
Botswana
Central African Republic
Num UE's from
RegressionsNum UE's from DCW
Num UE's from other
sources
Settlement Point
Population Source
Settlement Point
Coordinate Source
14 0 0
25 4 0
1991 Botswana National Census, Central Statistics Office, Republic of Botswana: http://www.cso.gov.bw/cso/; City Population, http://www.citypopulation.de; Statistical Yearbook for Botswana:, Central Statistics Office, Republic of Botswana: http://www.cso.gov.bw/cso/
AFCities; Getty; NIMA; Times Atlas of the World 1999; World Gazetteer
Recensement General de la Population de December 1988 Central African Republic, Census Bureau
AFCities; NIMA; Times Atlas of the World 1999; World Gazetteer

CountryEnglish
Ivory Coast
Num UE's from
RegressionsNum UE's from DCW
Num UE's from other
sources
Settlement Point
Population Source
Settlement Point
Coordinate Source
19 2 0 AFCities (provided by Uwe Deichman, World Bank)
AFCities; NIMA

CountryEnglish
Cameroon
Num UE's from
RegressionsNum UE's from DCW
Num UE's from other
sources
Settlement Point
Population Source
Settlement Point
Coordinate Source
83 3 0 Recensement General de la population et de l'habitat de 1987 de Cameroon: donnees provisiores, Census Bureau, Migration, Urbanization and Development of Cameroon, published by the Institute of the Formation and Research of Demographics by Joseph-Pierre Timnou Tr
Columbia Gazetteer; NIMA; Times Atlas of the World 1999; World Gazetteer

CountryEnglish
Congo
Congo, Democratic Republic
Num UE's from
RegressionsNum UE's from DCW
Num UE's from other
sources
Settlement Point
Population Source
Settlement Point
Coordinate Source
117 13 0
16 0 0
AFCities (provided by Uwe Deichman, World Bank); World Gazetteer, www.gazetteer.de
AFCities; World Gazetteer
AFCities (provided by Uwe Deichman, World Bank)
AFCities; NIMA; World Gazetteer

CountryEnglish
Comoros
Cape Verde
Djibouti
Num UE's from
RegressionsNum UE's from DCW
Num UE's from other
sources
Settlement Point
Population Source
Settlement Point
Coordinate Source
3 0 0
2 0 0
0 0 0 NIMA
AFCities (provided by Uwe Deichman, World Bank); General Census for Comores, September 1980, Census Bureau; World Gazetteer, www.gazetteer.de
AFCities; Columbia Gazetteer; NIMA
City Population, http://www.citypopulation.de; World Gazetteer, www.gazetteer.de
AFCities; Getty; NIMA; World Gazetteer
World Gazetteer, www.gazetteer.de

CountryEnglish
Algeria
Egypt
Num UE's from
RegressionsNum UE's from DCW
Num UE's from other
sources
Settlement Point
Population Source
Settlement Point
Coordinate Source
13 0 0
2 1 0
City Population, http://www.citypopulation.de; Recensement General de la Population de l'Habitat 1998 Armature Urbaine Algeria, Census Bureau; World Gazetteer, www.gazetteer.de
Rand McNally Atlas 1994; Times Atlas of the World 1999; World Gazetteer
City Population, http://www.citypopulation.de; World Gazetteer, www.gazetteer.de
City Population; NIMA; Times Atlas of the World 1999; World Gazetteer

CountryEnglish
Eritrea
Ethiopia
Gabon
Num UE's from
RegressionsNum UE's from DCW
Num UE's from other
sources
Settlement Point
Population Source
Settlement Point
Coordinate Source
2 0 0
170 3 3
18 1 0
AFCities (provided by Uwe Deichman, World Bank); World Gazetteer, www.gazetteer.de
NIMA; World Gazetteer
AFCities (provided by Uwe Deichman, World Bank); City Population, http://www.citypopulation.de; THE 1994 POPULATION AND HOUSING CENSUS OF ETHIOPIA, Census Bureau; World Gazetteer, www.gazetteer.de
AFCities; Columbia Gazetteer; NIMA; Times Atlas of the World 1999; World Gazetteer
Recensement General de la Population et de L'Habitat - Repertoire de Regroupements & Villages 1, UN Statistical Library
AFCities; Columbia Gazetteer; NIMA; World Gazetteer

CountryEnglish
Ghana
Guinea
Num UE's from
RegressionsNum UE's from DCW
Num UE's from other
sources
Settlement Point
Population Source
Settlement Point
Coordinate Source
69 0 0
26 1 0
1984 Population Census of Ghana, Preliminary Report, Census Bureau; AFCities (provided by Uwe Deichman, World Bank); World Gazetteer, www.gazetteer.de
AFCities; Columbia Gazetteer; NIMA; World Gazetteer
AFCities (provided by Uwe Deichman, World Bank); World Gazetteer, www.gazetteer.de
AFCities; NIMA; Times Atlas of the World 1999

CountryEnglish
Gambia
Guinea-Bissau
Equatorial Guinea
Num UE's from
RegressionsNum UE's from DCW
Num UE's from other
sources
Settlement Point
Population Source
Settlement Point
Coordinate Source
16 0 0
10 0 0
7 1 0
AFCities (provided by Uwe Deichman, World Bank); City Population, http://www.citypopulation.de; Population and Housing Census of the Gambia 1993, UN Statistical Library; World Gazetteer, www.gazetteer.de
AFCities; Census; Columbia Gazetteer; NIMA; Times Atlas of the World 1999; World Gazetteer
AFCities (provided by Uwe Deichman, World Bank); World Gazetteer, www.gazetteer.de
AFCities; Columbia Gazetteer; NIMA
AFCities (provided by Uwe Deichman, World Bank); World Gazetteer, www.gazetteer.de
AFCities; NIMA

CountryEnglish
Kenya
Liberia
Num UE's from
RegressionsNum UE's from DCW
Num UE's from other
sources
Settlement Point
Population Source
Settlement Point
Coordinate Source
38 0 0
14 1 0
1989 Kenya Population Census Analytical Report, UN Statistical Library; 1999 Kenya Population and Housing Census - Volume I, Census Bureau; 1999 Kenya Population and Housing Census - Volume I, Hardcopy at CIESIN; AFCities (provided by Uwe Deichman, World Bank)
NIMA; Times Atlas of the World 1999
AFCities (provided by Uwe Deichman, World Bank); World Gazetteer, www.gazetteer.de
AFCities; NIMA

CountryEnglish
Libyan Arab Jamahiriya
Lesotho
Morocco (includes Western Sahara)
Num UE's from
RegressionsNum UE's from DCW
Num UE's from other
sources
Settlement Point
Population Source
Settlement Point
Coordinate Source
1 0 0
6 0 0
1 0 0
AFCities (provided by Uwe Deichman, World Bank); World Gazetteer, www.gazetteer.de
AFCities; NIMA; Times Atlas of the World 1999; World Gazetteer
1986 Lesotho Population Census Analysis Report Volume IV, UN Statistical Library
AFCities; NIMA; World Gazetteer
1982 Census Morocco, UN Statistical Library; City Population, http://www.citypopulation.de; World Gazetteer, www.gazetteer.de
NIMA; Times Atlas of the World 1999; UNSD; World Gazetteer

CountryEnglish
Madagascar
Mali
Num UE's from
RegressionsNum UE's from DCW
Num UE's from other
sources
Settlement Point
Population Source
Settlement Point
Coordinate Source
47 12 0
91 0 0
1993 Recensement General de la Population et de L'Habit Tome VII, Census Bureau; AFCities (provided by Uwe Deichman, World Bank); City Population, http://www.citypopulation.de; World Gazetteer, www.gazetteer.de
AFCities; NIMA; Times Atlas of the World 1999; UNSD; World Gazetteer
1998 Recensement General Mali, Hardcopy at CIESIN; 1998 Recensement General Mali, UN Statistical Library
Carte Mali; Census; NIMA; Times Atlas of the World 1999

CountryEnglish
Mozambique
Num UE's from
RegressionsNum UE's from DCW
Num UE's from other
sources
Settlement Point
Population Source
Settlement Point
Coordinate Source
47 0 0 AFCities (provided by Uwe Deichman, World Bank); Census 1997 Mozambique, Instituto Nacional de Estat¡stica, www.ine.gov.mz/ (and CD from IFPRI)
AFCities; Columbia Gazetteer; NIMA; Times Atlas of the World 1999; World Gazetteer

CountryEnglish
Mauritania
Mauritius
Num UE's from
RegressionsNum UE's from DCW
Num UE's from other
sources
Settlement Point
Population Source
Settlement Point
Coordinate Source
10 0 0
0 0 0
AFCities (provided by Uwe Deichman, World Bank); La Mauritanie en Chiffres, Office National de la Statistique Edition 1997, UN Statistical Library; Resultas Prioritaires du Recensement de la Population et de L'Habitat 1988, UN Statistical Library; World Gazetteer, www.gazetteer.de
AFCities; NIMA; World Gazetteer
2000 Mauritius Housing and Population Census, http://ncb.intnet.mu/cso.htm; Census, http://ncb.intnet.mu/cso.htm
AFCities; World Gazetteer

CountryEnglish
Malawi
Mayotte
Namibia
Num UE's from
RegressionsNum UE's from DCW
Num UE's from other
sources
Settlement Point
Population Source
Settlement Point
Coordinate Source
18 0 0
0 0 0
1 0 0
AFCities (provided by Uwe Deichman, World Bank); City Population, http://www.citypopulation.de; World Gazetteer, www.gazetteer.de
AFCities; NIMA; World Gazetteer
World Gazetteer, www.gazetteer.de
World Gazetteer
1991 Namibia Population and Housing Census, UN Statistical Library; World Gazetteer, www.gazetteer.de
NIMA; World Gazetteer
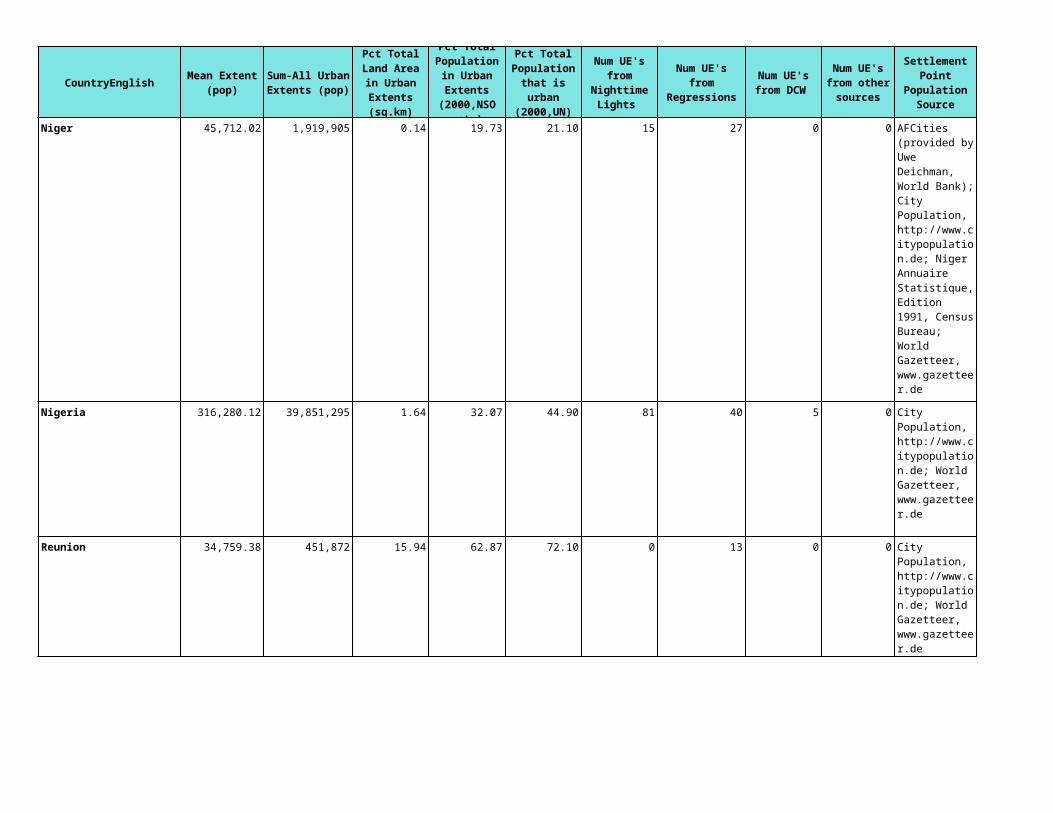
CountryEnglish
Niger
Nigeria
Reunion
Num UE's from
RegressionsNum UE's from DCW
Num UE's from other
sources
Settlement Point
Population Source
Settlement Point
Coordinate Source
27 0 0
40 5 0
13 0 0
AFCities (provided by Uwe Deichman, World Bank); City Population, http://www.citypopulation.de; Niger Annuaire Statistique, Edition 1991, Census Bureau; World Gazetteer, www.gazetteer.de
AFCities; Columbia Gazetteer; NIMA; World Gazetteer
City Population, http://www.citypopulation.de; World Gazetteer, www.gazetteer.de
NIMA; Times Atlas of the World 1999; World Gazetteer
City Population, http://www.citypopulation.de; World Gazetteer, www.gazetteer.de
NIMA; UNSD; World Gazetteer

CountryEnglish
Rwanda
Sudan
Num UE's from
RegressionsNum UE's from DCW
Num UE's from other
sources
Settlement Point
Population Source
Settlement Point
Coordinate Source
2 0 0
21 5 1
AFCities (provided by Uwe Deichman, World Bank); World Gazetteer, www.gazetteer.de
AFCities; NIMA; World Gazetteer
AFCities (provided by Uwe Deichman, World Bank); City Population, http://www.citypopulation.de; Fourth Population Census of Sudan 1993, UN Statistical Library; World Gazetteer, www.gazetteer.de
AFCities; NIMA; UNSD; World Gazetteer

CountryEnglish
Senegal
St. Helena
Sierra Leone
Somalia
Num UE's from
RegressionsNum UE's from DCW
Num UE's from other
sources
Settlement Point
Population Source
Settlement Point
Coordinate Source
18 0 0
31 0 0
2 0 0
AFCities (provided by Uwe Deichman, World Bank); City Population, http://www.citypopulation.de; World Gazetteer, www.gazetteer.de
AFCities; Columbia Gazetteer; NIMA; World Gazetteer
AFCities (provided by Uwe Deichman, World Bank); Handbook of the Population of Sierra Leone, UN Statistical Library
AFCities; Columbia Gazetteer; NIMA; Times Atlas of the World 1999; World Gazetteer
AFCities (provided by Uwe Deichman, World Bank); World Gazetteer, www.gazetteer.de
AFCities; NIMA; World Gazetteer

CountryEnglish
Sao Tome and Principe
Swaziland
Seychelles
Num UE's from
RegressionsNum UE's from DCW
Num UE's from other
sources
Settlement Point
Population Source
Settlement Point
Coordinate Source
0 0 0
0 0 0
0 0 0 NIMA
AFCities (provided by Uwe Deichman, World Bank); Sao Tome and Principe, Recenseamento Geral da Populacao e da Habitatcao, 1981, Census Bureau; World Gazetteer, www.gazetteer.de
NIMA; World Gazetteer
1986 Swaziland Population Census, UN Statistical Library
NIMA; Times Atlas of the World 1999
AFCities (provided by Uwe Deichman, World Bank); World Gazetteer, www.gazetteer.de

CountryEnglish
Chad
Togo
Num UE's from
RegressionsNum UE's from DCW
Num UE's from other
sources
Settlement Point
Population Source
Settlement Point
Coordinate Source
34 1 0
24 0 0
AFCities (provided by Uwe Deichman, World Bank); City Population, http://www.citypopulation.de; Recensement General de la Population et de L'Habit 1995, Census Bureau; World Gazetteer, www.gazetteer.de
NIMA; Times Atlas of the World 1999; World Gazetteer
AFCities (provided by Uwe Deichman, World Bank); Togo Recensement General de la Population et de L'Habitat 1981, University of Texas; World Gazetteer, www.gazetteer.de
AFCities; NIMA; Times Atlas of the World 1999

CountryEnglish
Tunisia
United Rep. of Tanzania
Num UE's from
RegressionsNum UE's from DCW
Num UE's from other
sources
Settlement Point
Population Source
Settlement Point
Coordinate Source
1 0 0
22 1 0
Recensement General de la Population et des Logements, UN Statistical Library; Republique Tunisienne, Ministere Du Plan, Institut National de la Satistique, UN Statistical Library; World Gazetteer, www.gazetteer.de
NIMA; Times Atlas of the World 1999; World Gazetteer
AFCities (provided by Uwe Deichman, World Bank); World Gazetteer, www.gazetteer.de
AFCities; NIMA; Times Atlas of the World 1999; World Gazetteer

CountryEnglish
Uganda
South Africa
Num UE's from
RegressionsNum UE's from DCW
Num UE's from other
sources
Settlement Point
Population Source
Settlement Point
Coordinate Source
27 3 6
8 0 0
1991 Uganda Census, www.ubos.org; AFCities (provided by Uwe Deichman, World Bank); City Population, http://www.citypopulation.de; World Gazetteer, www.gazetteer.de
AFCities; NIMA; Times Atlas of the World 1999; World Gazetteer
1996 South Africa Census, National Statistical Office, South Africa; AFCities (provided by Uwe Deichman, World Bank); City Population, http://www.citypopulation.de; World Gazetteer, www.gazetteer.de
AFCities; City Population; NIMA; UNSD; World Gazetteer

CountryEnglish
Zambia
Zimbabwe
Afghanistan
Num UE's from
RegressionsNum UE's from DCW
Num UE's from other
sources
Settlement Point
Population Source
Settlement Point
Coordinate Source
14 0 0
0 0 0
17 10 0
AFCities (provided by Uwe Deichman, World Bank); Zambia Census of Population, Housing & Argriculture 1990, UN Statistical Library
AFCities; NIMA; UNSD; World Gazetteer
Census 1992: Zimbabwe National Report, Census 1992: Zimbabwe National Report; World Gazetteer, www.gazetteer.de
NIMA; Times Atlas of the World 1999; World Gazetteer
Preliminary Results of the First Afghan Population Census, 1979, UN Statistical Library; World Gazetteer, www.gazetteer.de
NIMA; World Gazetteer

CountryEnglish
United Arab Emirates
Armenia
Num UE's from
RegressionsNum UE's from DCW
Num UE's from other
sources
Settlement Point
Population Source
Settlement Point
Coordinate Source
0 0 0
8 9 0
City Population, www.citypopulation.de
City Population; NIMA
Armenia Census 2001, National Statistical Service of the Republic of Armenia (NSS of RA), UN Statiscal Library; World Gazetteer, www.gazetteer.de
ASCities; Getty; NIMA; World Gazetteer

CountryEnglish
Azerbaijan
Num UE's from
RegressionsNum UE's from DCW
Num UE's from other
sources
Settlement Point
Population Source
Settlement Point
Coordinate Source
0 1 0 ASCities (provided by Uwe Deichman, World Bank); Statistical Yearbook Azerbaijan 2001, Statistical Yearbook Azerbaijan 2001; World Gazetteer, www.gazetteer.de
ASCities; NIMA; World Gazetteer

CountryEnglish
Bangladesh
Num UE's from
RegressionsNum UE's from DCW
Num UE's from other
sources
Settlement Point
Population Source
Settlement Point
Coordinate Source
44 0 0 Bangladesh Population Census 1991, Vol. 3: Urban Area Report, www.bbsgov.org/; Bangladesh Population Census 2001 Preliminary Report, Census Bureau; City Population, www.citypopulation.de; World Gazetteer, www.gazetteer.de
ASCities; Getty; NIMA; Times Atlas of the World 1999; UNSD; World Gazetteer

CountryEnglish
Bahrain
Brunei Darussalam
Bhutan
Num UE's from
RegressionsNum UE's from DCW
Num UE's from other
sources
Settlement Point
Population Source
Settlement Point
Coordinate Source
0 0 0 NIMA
0 0 0
3 0 0 NIMA
City Population, www.citypopulation.de; World Gazetteer, www.gazetteer.de
World Gazetteer, www.gazetteer.de
NIMA; World Gazetteer
City Population, www.citypopulation.de; World Gazetteer, www.gazetteer.de
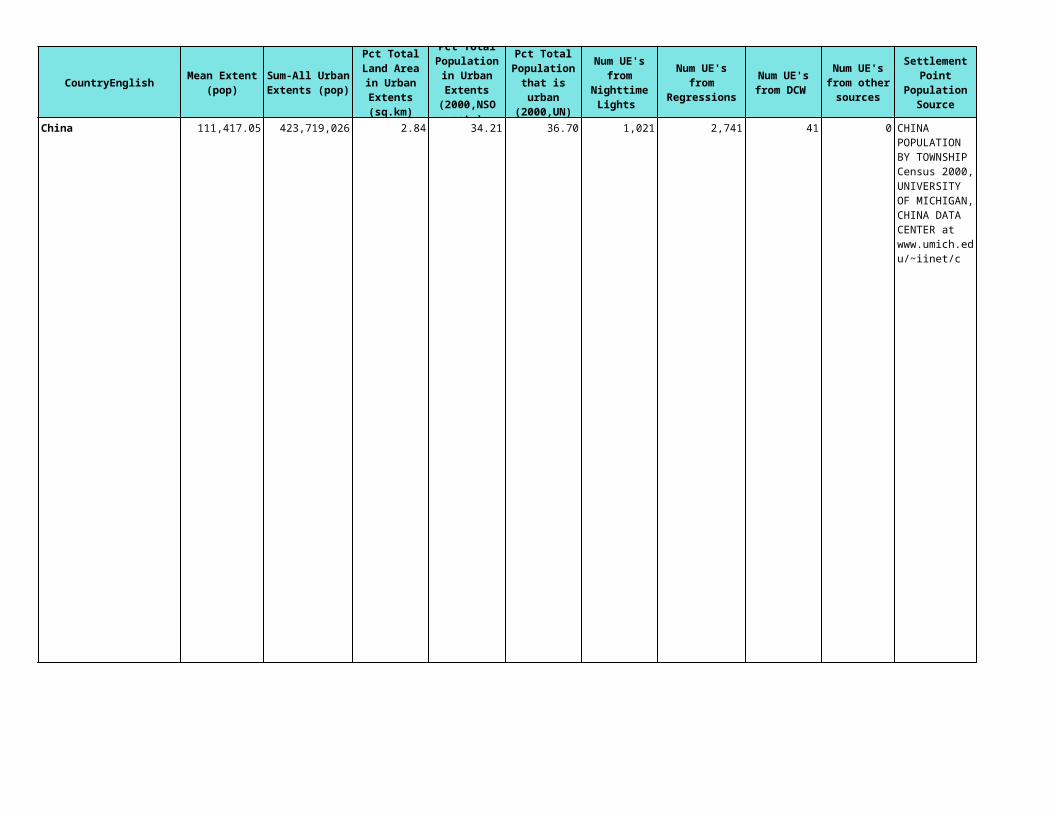
CountryEnglish
China
Num UE's from
RegressionsNum UE's from DCW
Num UE's from other
sources
Settlement Point
Population Source
Settlement Point
Coordinate Source
2,741 41 0 CHINA POPULATION BY TOWNSHIP Census 2000, UNIVERSITY OF MICHIGAN, CHINA DATA CENTER at www.umich.edu/~iinet/c
DCW; Getty; NIMA; World Gazetteer

CountryEnglish
Cyprus
Georgia
Hong Kong
Num UE's from
RegressionsNum UE's from DCW
Num UE's from other
sources
Settlement Point
Population Source
Settlement Point
Coordinate Source
0 0 0
7 8 0
0 0 0 NIMA
Cyprus Population Census, 2001, REPUBLIC OF CYPRUS, STATISTICAL SERVICE; www.pio.gov.cy/dsr/key_figures/population_census/municipality.xls
NIMA; World Gazetteer
ASCities (provided by Uwe Deichman, World Bank); Georgia Census 2002, State Department for Statistics of Georgia, www.statistics.ge/index_Eng.html; State Department for Statistics of Georgia, www.statistics.ge/index_Eng.html
DCW; Getty; NIMA; Times Atlas of the World 1999; World Gazetteer
City Population, www.citypopulation.de

CountryEnglish
Indonesia
Num UE's from
RegressionsNum UE's from DCW
Num UE's from other
sources
Settlement Point
Population Source
Settlement Point
Coordinate Source
53 12 0 City Population, www.citypopulation.de; World Gazetteer, www.gazetteer.de
Getty; Map; NIMA; Times Atlas of the World 1999; UNSD; World Gazetteer

CountryEnglish
India
Num UE's from
RegressionsNum UE's from DCW
Num UE's from other
sources
Settlement Point
Population Source
Settlement Point
Coordinate Source
863 14 0 India Census 1991, www.indiastat.com/default.asp; India Census 2001, Provisional Results, www.censusindia.net/results/town.php?stad=7; World Gazetteer, www.gazetteer.de
ASCities; Census; City Population; DCW; Getty; GIS; Map; NIMA; Times Atlas of the World 1999; UNSD; World Gazetteer
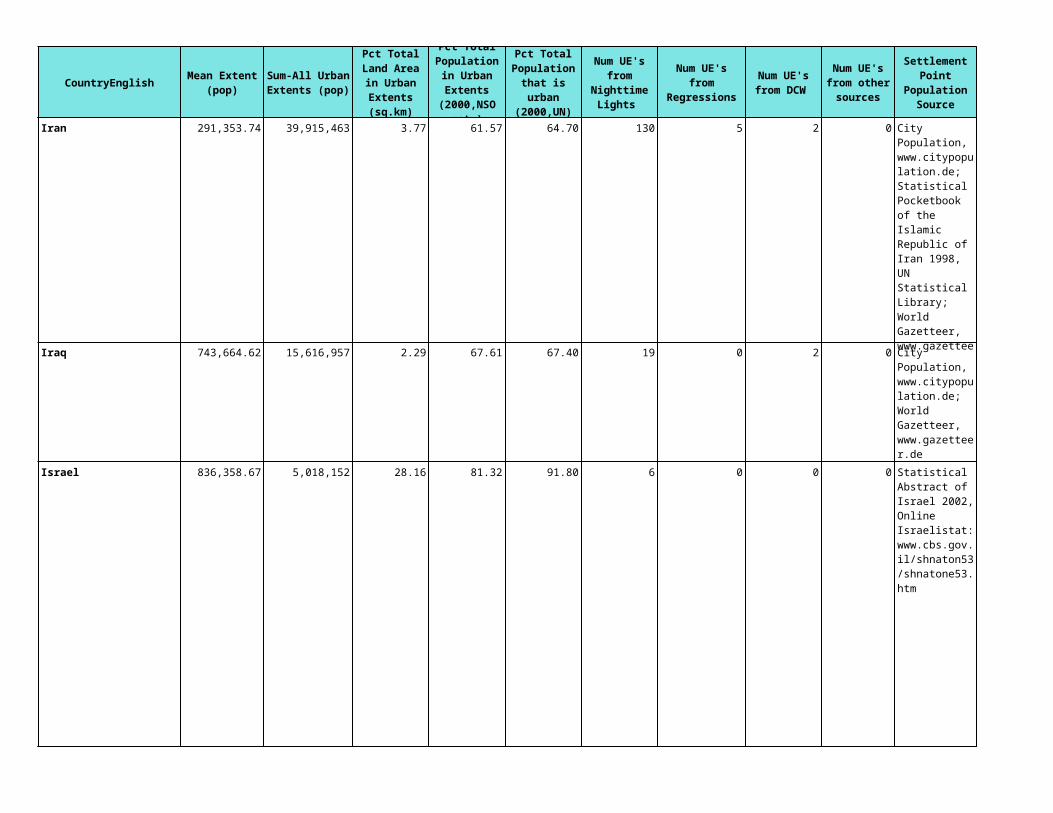
CountryEnglish
Iran
Iraq
Israel
Num UE's from
RegressionsNum UE's from DCW
Num UE's from other
sources
Settlement Point
Population Source
Settlement Point
Coordinate Source
5 2 0
0 2 0
0 0 0
City Population, www.citypopulation.de; Statistical Pocketbook of the Islamic Republic of Iran 1998, UN Statistical Library; World Gazetteer, www.gazetteer.de
ASCities; Getty; Map; NIMA; UNSD; World Gazetteer
City Population, www.citypopulation.de; World Gazetteer, www.gazetteer.de
NIMA; World Gazetteer
Statistical Abstract of Israel 2002, Online Israelistat: www.cbs.gov.il/shnaton53/shnatone53.htm
ASCities; NIMA; UNSD; World Gazetteer

CountryEnglish
Jordan
Num UE's from
RegressionsNum UE's from DCW
Num UE's from other
sources
Settlement Point
Population Source
Settlement Point
Coordinate Source
0 0 0 City Population, www.citypopulation.de; Results of the General Census of Population of Jordan 1994, www.dos.gov.jo/sdb_pop/
DCW; Getty; NIMA; World Gazetteer

CountryEnglish
Japan
Num UE's from
RegressionsNum UE's from DCW
Num UE's from other
sources
Settlement Point
Population Source
Settlement Point
Coordinate Source
0 2 0 City Population, www.citypopulation.de; World Gazetteer, www.gazetteer.de
Getty; Map; NIMA; UNSD; World Gazetteer
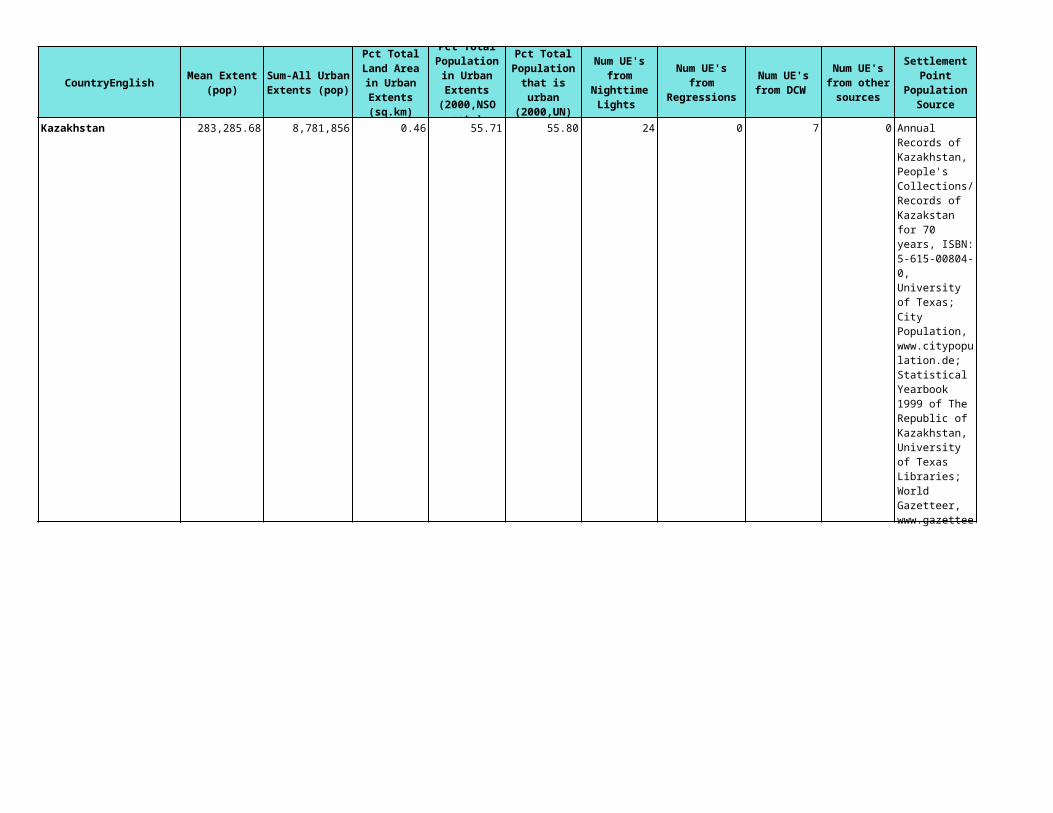
CountryEnglish
Kazakhstan
Num UE's from
RegressionsNum UE's from DCW
Num UE's from other
sources
Settlement Point
Population Source
Settlement Point
Coordinate Source
0 7 0 Annual Records of Kazakhstan, People's Collections/Records of Kazakstan for 70 years, ISBN: 5-615-00804-0, University of Texas; City Population, www.citypopulation.de; Statistical Yearbook 1999 of The Republic of Kazakhstan, University of Texas Libraries; World Gazetteer, www.gazetteer.de
ASCities; City Population; NIMA; World Gazetteer

CountryEnglish
Kyrgyz Republic
Cambodia
Num UE's from
RegressionsNum UE's from DCW
Num UE's from other
sources
Settlement Point
Population Source
Settlement Point
Coordinate Source
2 0 0
8 10 0
Kyrgyz Republic 1st National Census, 1999, National Statistical Committee Of The Kyrgyz Republic, UN Statistical Library
Map; NIMA; World Gazetteer
City Population, www.citypopulation.de
Columbia Gazetteer; Getty; NIMA; World Gazetteer

CountryEnglish
Korea
Kuwait
Lebanon
Lao People's Democratic Republic
Num UE's from
RegressionsNum UE's from DCW
Num UE's from other
sources
Settlement Point
Population Source
Settlement Point
Coordinate Source
2 0 0
0 0 0
11 0 0
2 1 0
City Population, www.citypopulation.de; World Gazetteer, www.gazetteer.de
City Population; NIMA; UNSD; World Gazetteer
Annual Statistical Abstract 1998 Kuwait, UN Statistical Library; City Population, www.citypopulation.de
NIMA; World Gazetteer
City Population, www.citypopulation.de; World Gazetteer, www.gazetteer.de
NIMA; World Gazetteer
World Gazetteer, www.gazetteer.de
NIMA; World Gazetteer
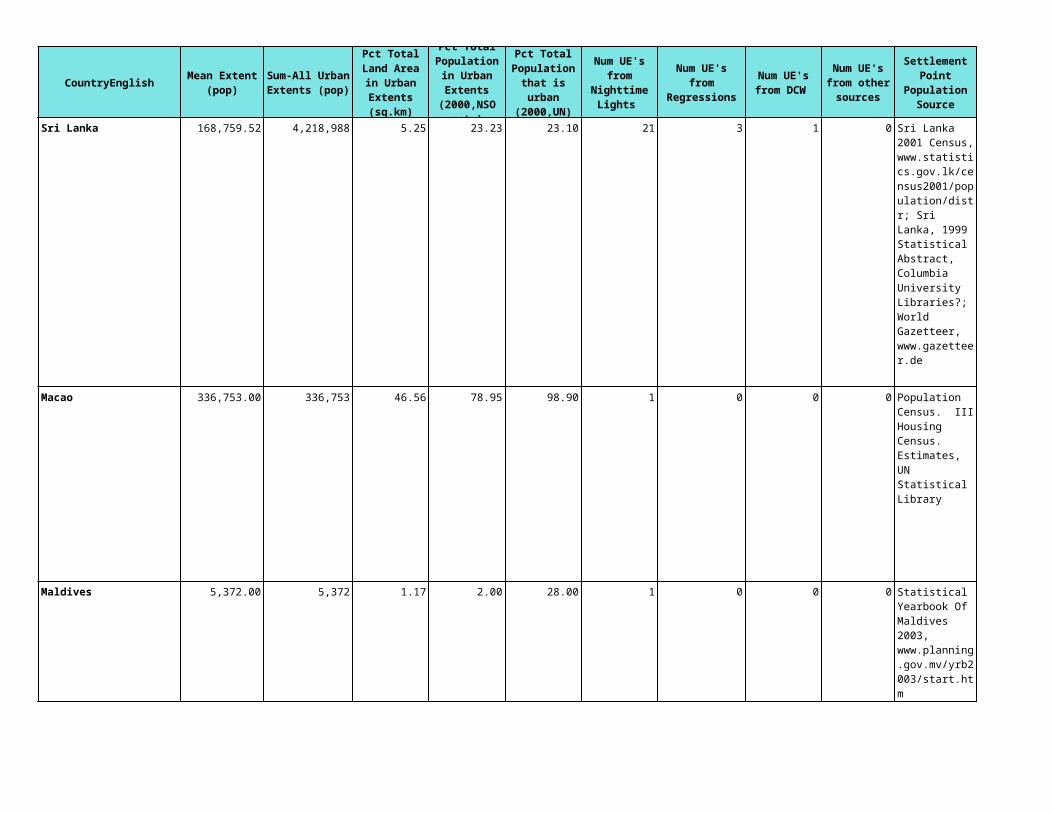
CountryEnglish
Sri Lanka
Macao
Maldives
Num UE's from
RegressionsNum UE's from DCW
Num UE's from other
sources
Settlement Point
Population Source
Settlement Point
Coordinate Source
3 1 0
0 0 0 Getty
0 0 0
Sri Lanka 2001 Census, www.statistics.gov.lk/census2001/population/distr; Sri Lanka, 1999 Statistical Abstract, Columbia University Libraries?; World Gazetteer, www.gazetteer.de
Map; NIMA; World Gazetteer
Population Census. III Housing Census. Estimates, UN Statistical Library
Statistical Yearbook Of Maldives 2003, www.planning.gov.mv/yrb2003/start.htm
World Gazetteer

CountryEnglish
Myanmar
Mongolia
Malaysia
Nepal
Num UE's from
RegressionsNum UE's from DCW
Num UE's from other
sources
Settlement Point
Population Source
Settlement Point
Coordinate Source
8 6 0
4 3 0
2 0 0
15 0 0
World Gazetteer, www.gazetteer.de
NIMA; World Gazetteer
City Population, www.citypopulation.de
NIMA; World Gazetteer
City Population, www.citypopulation.de; Malaysia Yearbook of Statistics2000, University of Texas Libraries; World Gazetteer, www.gazetteer.de
Getty; Map; NIMA; Times Atlas of the World 1999; World Gazetteer
City Population, www.citypopulation.de; The State of Population, Nepal 2000, www.mope.gov.np/frame.php3; World Gazetteer, www.gazetteer.de
ASCities; DCW; NIMA; World Gazetteer

CountryEnglish
Oman
Pakistan
Num UE's from
RegressionsNum UE's from DCW
Num UE's from other
sources
Settlement Point
Population Source
Settlement Point
Coordinate Source
0 0 0
14 0 0
World Gazetteer, www.gazetteer.de
NIMA; World Gazetteer
1998 Population and Housing Census of Pakistan, Provisional Results, UN Statistical Library; ASCities (provided by Uwe Deichman, World Bank); City Population, www.citypopulation.de; World Gazetteer, www.gazetteer.de
NIMA; UNSD; World Gazetteer

CountryEnglish
Philippines
Num UE's from
RegressionsNum UE's from DCW
Num UE's from other
sources
Settlement Point
Population Source
Settlement Point
Coordinate Source
11 1 0 1997 Philippine Statistical Yearbook, Population Census Report 1995, Philippine National Statistics Office,Population Census Report 1995, hard copy; City Population, www.citypopulation.de; Philippine Census 2000, Philippine National Statistics Office, nscb.gov.ph; World Gazetteer, www.gazetteer.de
ASCities; Getty; GIS; NIMA; Times Atlas of the World 1999; UNSD; World Gazetteer

CountryEnglish
Korea, Dem. People's Rep. of
Num UE's from
RegressionsNum UE's from DCW
Num UE's from other
sources
Settlement Point
Population Source
Settlement Point
Coordinate Source
2 5 0 Census 2001, DPRK Government Data; City Population, www.citypopulation.de;Eberstadt, N. and J. Banister. The Population of North Korea., UC Berkeley and Ctr for Korean Studies. Research Monograph, UN Statistical Library
Getty; Map; NIMA

CountryEnglish
Occupied Palestinian Territory
Num UE's from
RegressionsNum UE's from DCW
Num UE's from other
sources
Settlement Point
Population Source
Settlement Point
Coordinate Source
18 1 0 Palestine 1997 Census Data Summary By Localities, www.pcbs.org/inside/f_pophos.htm; World Gazetteer, www.gazetteer.de
NIMA; University of Texas Map Collection

CountryEnglish
Qatar
Saudi Arabia
Singapore
Syrian Arab Republic
Num UE's from
RegressionsNum UE's from DCW
Num UE's from other
sources
Settlement Point
Population Source
Settlement Point
Coordinate Source
0 0 0
0 2 0
0 0 0
0 0 0
City Population, www.citypopulation.de; World Gazetteer, www.gazetteer.de
NIMA; World Gazetteer
City Population, www.citypopulation.de; World Gazetteer, www.gazetteer.de
NIMA; World Gazetteer
Singapore Census of Population 2000, UN Statistical Library
World Gazetteer
City Population, www.citypopulation.de; World Gazetteer, www.gazetteer.de
Getty; NIMA; Times Atlas of the World 1999; World Gazetteer

CountryEnglish
Thailand
Tajikistan
Num UE's from
RegressionsNum UE's from DCW
Num UE's from other
sources
Settlement Point
Population Source
Settlement Point
Coordinate Source
7 2 0
1 0 0
City Population, www.citypopulation.de; Thailand 1991 Statistical Yearbook, Columbia University Libraries?; World Gazetteer, www.gazetteer.de
Getty; Map; NIMA; World Gazetteer
1989 Cities Populations of Rebulic of Tajikistan, UN Statistical Library; Tajikistan Census, 2000, Government Statistical Office under Tajikistan, www.tajikistan.ru/stat.htm; World Gazetteer, www.gazetteer.de
Getty; NIMA; Times Atlas of the World 1999; UNSD; World Gazetteer

CountryEnglish
Turkmenistan
East Timor
Turkey
Num UE's from
RegressionsNum UE's from DCW
Num UE's from other
sources
Settlement Point
Population Source
Settlement Point
Coordinate Source
0 2 0
1 0 0
6 1 0
1998 Statistical Yearbook of Turkmenistan, LehmanLibrary, Columbia University; City Population, www.citypopulation.de; World Gazetteer, www.gazetteer.de
ASCities; NIMA; World Gazetteer
World Gazetteer, www.gazetteer.de
World Gazetteer; NIMA
Turkey 1990 Census of Population, UN Statistical Library; World Gazetteer, www.gazetteer.de
Getty; NIMA; Times Atlas of the World 1999; UNSD; World Gazetteer

CountryEnglish
Taiwan
Uzbekistan
Num UE's from
RegressionsNum UE's from DCW
Num UE's from other
sources
Settlement Point
Population Source
Settlement Point
Coordinate Source
1 0 0
1 9 0
City Population, www.citypopulation.de; Social Indicators The Republic of China 2000, UN and Lehman Library, Columbia University; World Gazetteer, www.gazetteer.de
NIMA; World Gazetteer
City Population, www.citypopulation.de; Uzbekistan 1989 Census, Null; World Gazetteer, www.gazetteer.de
NIMA; World Gazetteer

CountryEnglish
Viet Nam
Yemen
Num UE's from
RegressionsNum UE's from DCW
Num UE's from other
sources
Settlement Point
Population Source
Settlement Point
Coordinate Source
0 1 0
2 0 0
City Population, www.citypopulation.de; Viet Nam Population Census 1989, Columbia University Libraries?; World Gazetteer, www.gazetteer.de
NIMA; World Gazetteer
City Population, www.citypopulation.de; World Gazetteer, www.gazetteer.de
Getty; NIMA; World Gazetteer

CountryEnglish
Albania
Andorra
Austria
Num UE's from
RegressionsNum UE's from DCW
Num UE's from other
sources
Settlement Point
Population Source
Settlement Point
Coordinate Source
18 0 0
0 0 0
11 0 0
2001 Preliminary Albania Population Census, INSTAT, http://pages.albaniaonline.net/repoba/zyra_shtypit/prel_e; World Gazetteer, www.gazetteer.de
NIMA; World Gazetteer
City Population, www.citypopulation.de
World Gazetteer
Austria Census 2001, Statistik Austria, http://wwwold.statistik.gv.at/cgi-bin/db2www/blick; City Population, www.citypopulation.de; World Gazetteer, www.gazetteer.de
Getty; Times Atlas of the World 1999; NIMA; World Gazetteer

CountryEnglish
Belgium
Bulgaria
Bosnia-Herzogovina
Belarus
Num UE's from
RegressionsNum UE's from DCW
Num UE's from other
sources
Settlement Point
Population Source
Settlement Point
Coordinate Source
27 1 0
0 0 0
3 1 0
0 0 0
City Population, www.citypopulation.de; StatsBelgium, statbel.fgov.be; World Gazetteer, www.gazetteer.de
NIMA; World Gazetteer
City Population, www.citypopulation.de; World Gazetteer, www.gazetteer.de
World Gazetteer
City Population, www.citypopulation.de
EUTOWN; NIMA; UNSD; World Gazetteer
City Population, www.citypopulation.de; Statistical Yearbook of Belarus 2000, UN Statistical Library, hard copy
NIMA; World Gazetteer

CountryEnglish
Switzerland
Czech Republic
Germany
Denmark
Num UE's from
RegressionsNum UE's from DCW
Num UE's from other
sources
Settlement Point
Population Source
Settlement Point
Coordinate Source
14 0 0
2 0 0
54 37 0
4 0 0
City Population, www.citypopulation.de; World Gazetteer, www.gazetteer.de
NIMA; World Gazetteer
Czech Republic Population and Housing Census March 2001, http://www.czso.cz/eng/angl.htm
World Gazetteer
City Population, www.citypopulation.de; World Gazetteer, www.gazetteer.de
World Gazetteer
Statistical Yearbook of Denmark 2000, http://www.dst.dk/
NIMA; World Gazetteer
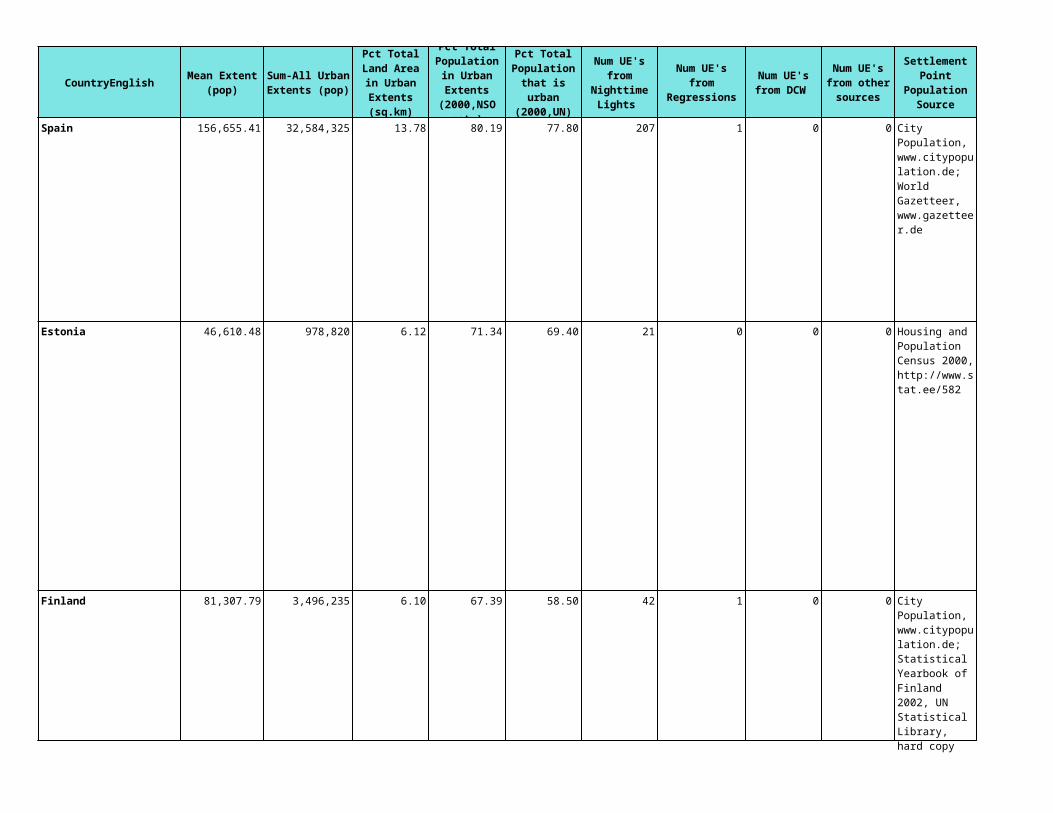
CountryEnglish
Spain
Estonia
Finland
Num UE's from
RegressionsNum UE's from DCW
Num UE's from other
sources
Settlement Point
Population Source
Settlement Point
Coordinate Source
1 0 0
0 0 0
1 0 0
City Population, www.citypopulation.de; World Gazetteer, www.gazetteer.de
NIMA; World Gazetteer
Housing and Population Census 2000, http://www.stat.ee/582
World Gazetteer
City Population, www.citypopulation.de; Statistical Yearbook of Finland 2002, UN Statistical Library, hard copy
NIMA; World Gazetteer

CountryEnglish
France
Faeroe Islands
Num UE's from
RegressionsNum UE's from DCW
Num UE's from other
sources
Settlement Point
Population Source
Settlement Point
Coordinate Source
0 0 0
0 0 0
City Population, www.citypopulation.de; Population Census 1999, Institut National de la Statistique et des ╔tudes ╔conomiques, www.insee.fr
Getty; Times Atlas of the World 1999; NIMA; World Gazetteer
City Population, www.citypopulation.de; World Gazetteer, www.gazetteer.de
NIMA; World Gazetteer

CountryEnglish
United Kingdom
Guernsey
Num UE's from
RegressionsNum UE's from DCW
Num UE's from other
sources
Settlement Point
Population Source
Settlement Point
Coordinate Source
0 1 0
0 0 0 NIMA
City Population, www.citypopulation.de; World Gazetteer, www.citypopulation.de; World Gazetteer, www.gazetteer.de
Getty; Times Atlas of the World 1999; NIMA
City Population, www.citypopulation.de

CountryEnglish
Gibraltar
Num UE's from
RegressionsNum UE's from DCW
Num UE's from other
sources
Settlement Point
Population Source
Settlement Point
Coordinate Source
0 0 0 Gibraltar National Statistical Office, Gibraltar National Statistical Office, www.gibraltar.gov.gi
World Gazetteer

CountryEnglish
Greece
Num UE's from
RegressionsNum UE's from DCW
Num UE's from other
sources
Settlement Point
Population Source
Settlement Point
Coordinate Source
4 0 0 City Population, www.citypopulation.de; World Gazetteer, www.gazetteer.de
World Gazetteer

CountryEnglish
Croatia
Hungary
Num UE's from
RegressionsNum UE's from DCW
Num UE's from other
sources
Settlement Point
Population Source
Settlement Point
Coordinate Source
6 0 0 NIMA
5 0 0
City Population, www.citypopulation.de; STATISTICAL INFORMATION 2003, Republic of Croatia, Central Bureau of Statistics, http://www.dzs.hr/defaulte.htm; World Gazetteer, www.gazetteer.de
2001 Hungary Census, Hungary Central Statistical Office, http://www.ksh.hu/pls/ksh/docs/index_eng.html
Getty; Times Atlas of the World 1999; NIMA; World Gazetteer

CountryEnglish
Isle of Man
Iceland
Italy
Jersey
Num UE's from
RegressionsNum UE's from DCW
Num UE's from other
sources
Settlement Point
Population Source
Settlement Point
Coordinate Source
0 0 0
0 0 0
43 0 0
0 0 0
City Population, www.citypopulation.de
NIMA; World Gazetteer
Statistical Yearbook of Iceland 2002, Statistics Iceland, www.hagstofa.is
NIMA; World Gazetteer
City Population, www.citypopulation.de; World Gazetteer, www.gazetteer.de
Getty; Times Atlas of the World 1999; NIMA; World Gazetteer
City Population, www.citypopulation.de
NIMA; World Gazetteer

CountryEnglish
Liechtenstein
Lithuania
Luxembourg
Num UE's from
RegressionsNum UE's from DCW
Num UE's from other
sources
Settlement Point
Population Source
Settlement Point
Coordinate Source
0 0 0
0 0 0
0 0 0
Statistical Yearbook of Liechtenstein 2003, www.llv.li
Times Atlas of the World 1999; World Gazetteer
Lithuania Population and Housing Census 2001, Statistics Lithuania, http://www.std.lt/web/main.php?parent=755&module=7
NIMA; UNSD; World Gazetteer
Population Census 2001, Le Service central de la statistique et des Θtudes Θconomiques, www.statec.lu/html_fr/RP_2001/resultats.html
World Gazetteer

CountryEnglish
Latvia
Monaco
Num UE's from
RegressionsNum UE's from DCW
Num UE's from other
sources
Settlement Point
Population Source
Settlement Point
Coordinate Source
0 0 0 NIMA
0 0 0
City Population, www.citypopulation.de; Statistical Yearbook of Latvia 2002, UN Statistical Library, hard copy
City Population, www.citypopulation.de
Times Atlas of the World 1999
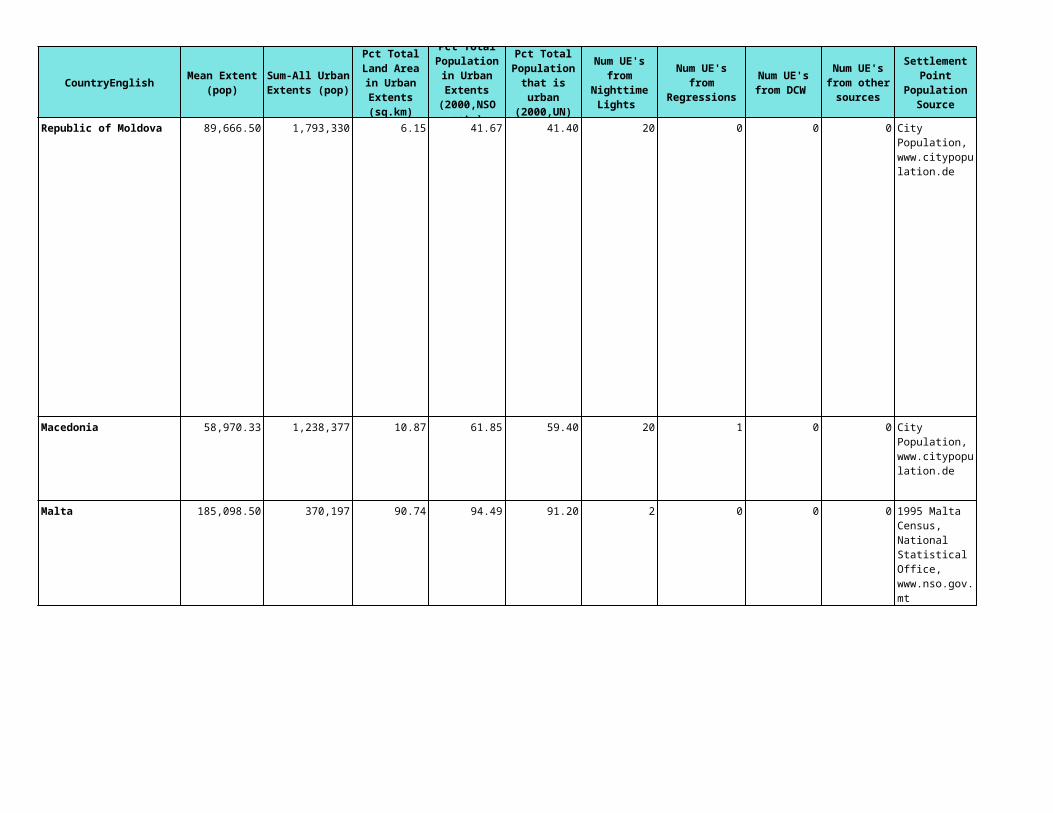
CountryEnglish
Republic of Moldova
Macedonia
Malta
Num UE's from
RegressionsNum UE's from DCW
Num UE's from other
sources
Settlement Point
Population Source
Settlement Point
Coordinate Source
0 0 0
1 0 0
0 0 0
City Population, www.citypopulation.de
NIMA; World Gazetteer
City Population, www.citypopulation.de
NIMA; World Gazetteer
1995 Malta Census, National Statistical Office, www.nso.gov.mt
Times Atlas of the World 1999; NIMA; World Gazetteer

CountryEnglish
Netherlands
Norway
Num UE's from
RegressionsNum UE's from DCW
Num UE's from other
sources
Settlement Point
Population Source
Settlement Point
Coordinate Source
4 1 0
0 0 0
City Population, www.citypopulation.de
NIMA; World Gazetteer
City Population, www.citypopulation.de; StatsNorway, www.ssb.no; World Gazetteer, www.gazetteer.de
Columbia Gazetteer; Getty; Times Atlas of the World 1999; NIMA; Times Atlas of the World 1999; World Gazetteer

CountryEnglish
Portugal
Romania
Num UE's from
RegressionsNum UE's from DCW
Num UE's from other
sources
Settlement Point
Population Source
Settlement Point
Coordinate Source
5 0 0
88 0 0
City Population, www.citypopulation.de; World Gazetteer, www.gazetteer.de
Getty; Times Atlas of the World 1999; NIMA; University of Texas Map Collection; World Gazetteer
Romania 2002 Census, http://www.recensamant.ro/; World Gazetteer, www.gazetteer.de
World Gazetteer
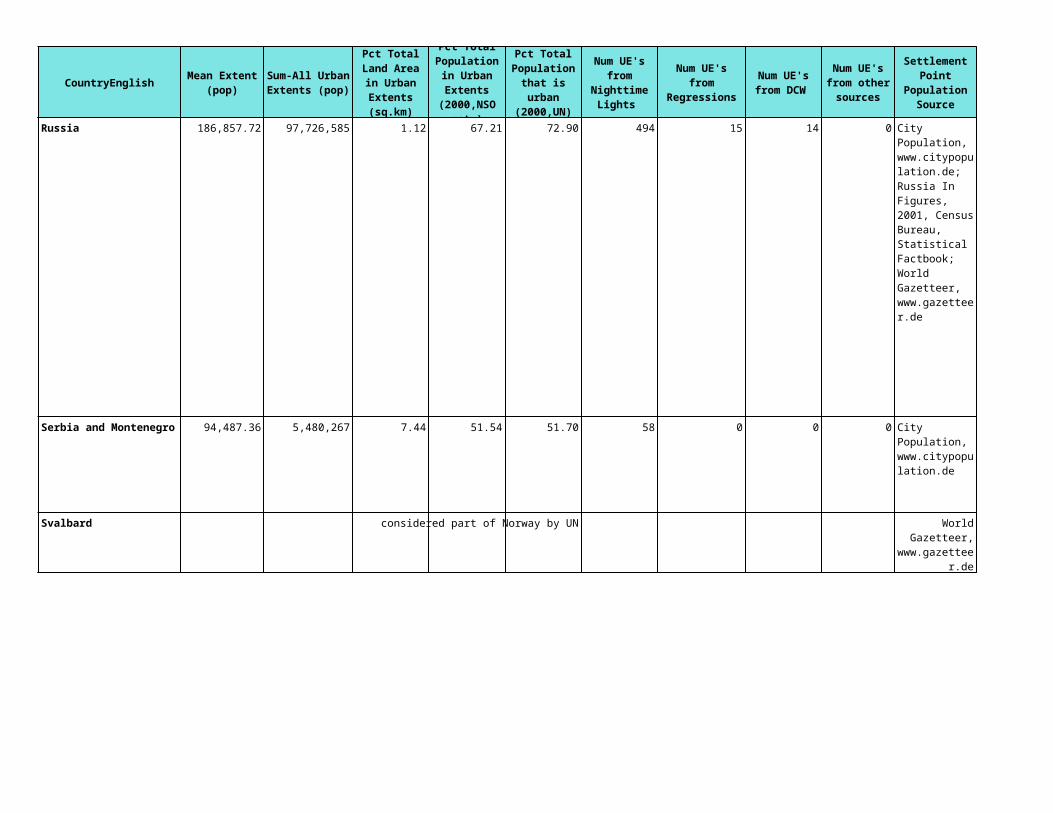
CountryEnglish
Russia
Serbia and Montenegro
Svalbard
Num UE's from
RegressionsNum UE's from DCW
Num UE's from other
sources
Settlement Point
Population Source
Settlement Point
Coordinate Source
15 14 0
0 0 0
City Population, www.citypopulation.de; Russia In Figures, 2001, Census Bureau, Statistical Factbook; World Gazetteer, www.gazetteer.de
Getty; GRID Arendal; Times Atlas of the World 1999; Meteo; NIMA; World Gazetteer
City Population, www.citypopulation.de
NIMA; World Gazetteer
World Gazetteer,
www.gazetteer.de
World Gazetteer
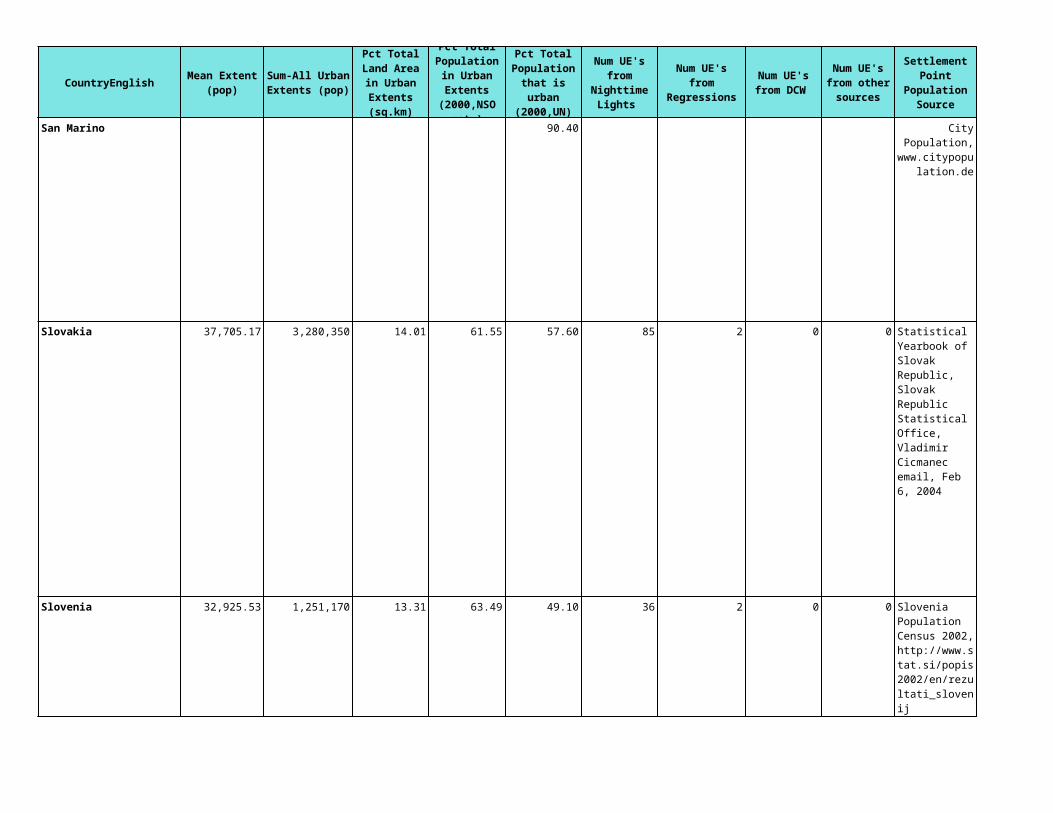
CountryEnglish
San Marino
Slovakia
Slovenia
Num UE's from
RegressionsNum UE's from DCW
Num UE's from other
sources
Settlement Point
Population Source
Settlement Point
Coordinate Source
2 0 0
2 0 0
City Population,
www.citypopulation.de
World Gazetteer
Statistical Yearbook of Slovak Republic, Slovak Republic Statistical Office, Vladimir Cicmanec email, Feb 6, 2004
NIMA; World Gazetteer
Slovenia Population Census 2002, http://www.stat.si/popis2002/en/rezultati_slovenij
NIMA; World Gazetteer

CountryEnglish
Sweden
Ukraine
Holy See
Num UE's from
RegressionsNum UE's from DCW
Num UE's from other
sources
Settlement Point
Population Source
Settlement Point
Coordinate Source
3 0 0
0 2 0
City Population, www.citypopulation.de; StatisticsSweden, www.scb.se
Getty; Times Atlas of the World 1999; NIMA; World Gazetteer
City Population, www.citypopulation.de; World Gazetteer, www.gazetteer.de
EUTOWN; UNSD; World Gazetteer
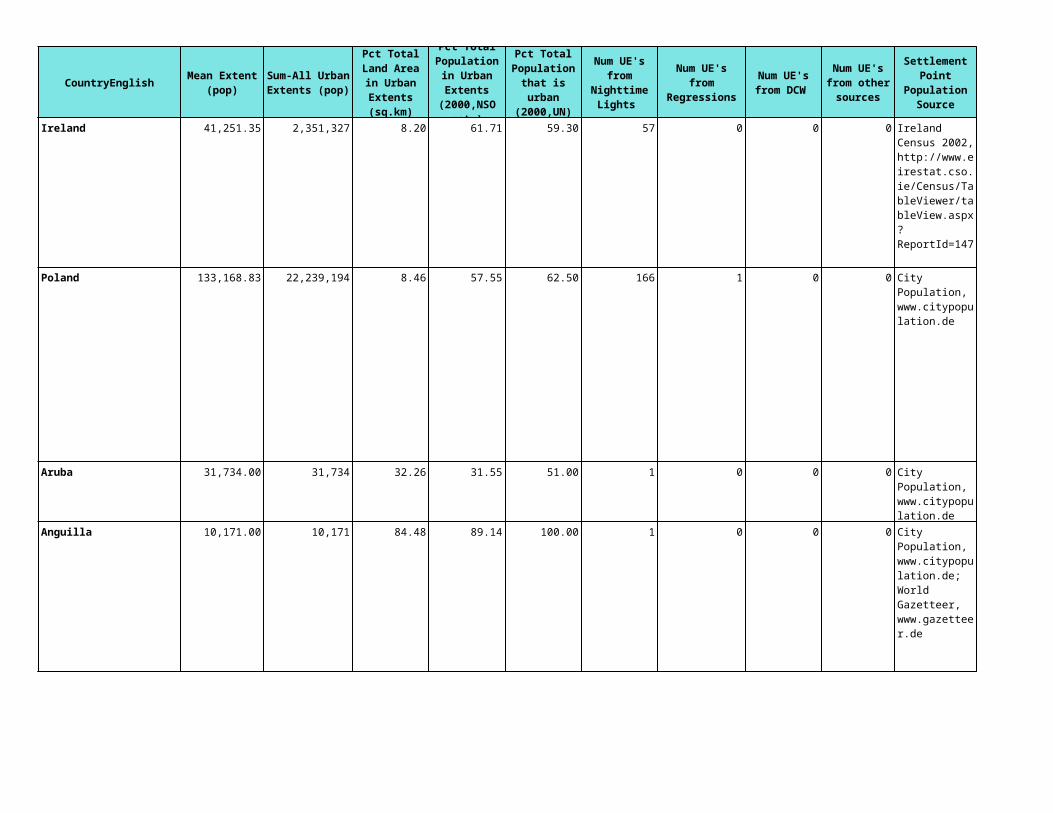
CountryEnglish
Ireland
Poland
Aruba
Anguilla
Num UE's from
RegressionsNum UE's from DCW
Num UE's from other
sources
Settlement Point
Population Source
Settlement Point
Coordinate Source
0 0 0 NIMA
1 0 0
0 0 0
0 0 0
Ireland Census 2002, http://www.eirestat.cso.ie/Census/TableViewer/tableView.aspx?ReportId=147
City Population, www.citypopulation.de
World Gazetteer
City Population, www.citypopulation.de
Map; World Gazetteer
City Population, www.citypopulation.de; World Gazetteer, www.gazetteer.de
Map; NIMA; World Gazetteer
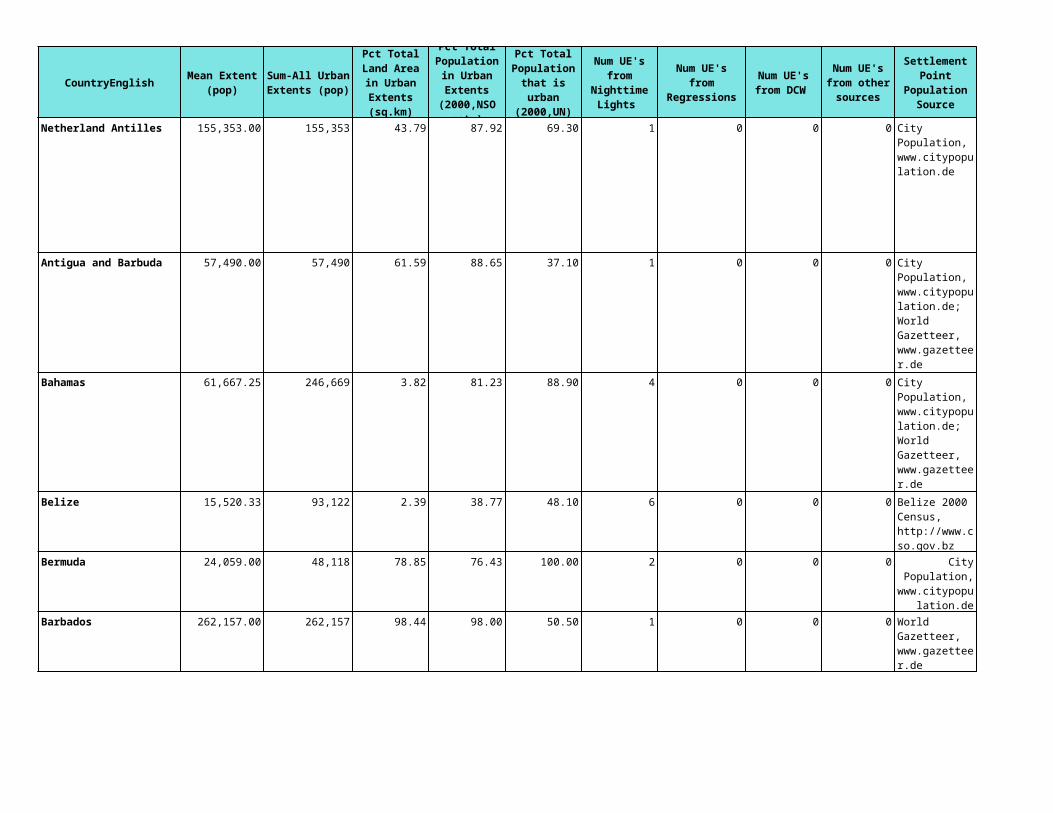
CountryEnglish
Netherland Antilles
Antigua and Barbuda
Bahamas
Belize
Bermuda
Barbados
Num UE's from
RegressionsNum UE's from DCW
Num UE's from other
sources
Settlement Point
Population Source
Settlement Point
Coordinate Source
0 0 0
0 0 0
0 0 0
0 0 0
0 0 0
0 0 0
City Population, www.citypopulation.de
World Gazetteer
City Population, www.citypopulation.de; World Gazetteer, www.gazetteer.de
NIMA; World Gazetteer
City Population, www.citypopulation.de; World Gazetteer, www.gazetteer.de
Map; World Gazetteer
Belize 2000 Census, http://www.cso.gov.bz
NIMA; World Gazetteer
City Population,
www.citypopulation.de
World Gazetteer
World Gazetteer, www.gazetteer.de
Map; World Gazetteer

CountryEnglish
Canada
Costa Rica
Num UE's from
RegressionsNum UE's from DCW
Num UE's from other
sources
Settlement Point
Population Source
Settlement Point
Coordinate Source
3 0 0
1 0 0
2001 Canada Census, Statistics Canada, www12.statcan.ca/english/census01/products/
Canadian Geographical Names; DCW; National Atlas of Canada; NIMA
City Population, www.citypopulation.de; World Gazetteer, www.gazetteer.de
NIMA; World Gazetteer

CountryEnglish
Cuba
Cayman Islands
Commonwealth of Dominica
Num UE's from
RegressionsNum UE's from DCW
Num UE's from other
sources
Settlement Point
Population Source
Settlement Point
Coordinate Source
47 1 0
0 0 0 Map; NIMA
2 0 0
2001 Statistical Annual, Cuba, Officina Nacional de Estadisticas (ONE), UN Statistical Library; World Gazetteer, www.gazetteer.de
Map; NIMA; World Gazetteer
City Population, www.citypopulation.de
Dominica Statistical Digest No. 7 2002, Dominica Central Statistical Office, UN Statistical Library; World Gazetteer, www.gazetteer.de
Map; NIMA; World Gazetteer

CountryEnglish
Dominican Republic
Guadeloupe
Grenada
Num UE's from
RegressionsNum UE's from DCW
Num UE's from other
sources
Settlement Point
Population Source
Settlement Point
Coordinate Source
0 0 0
0 0 0
2 0 0
Celade, Latin American and Caribbean Demographic Centre (CELADE) - Population Division of Economic Commission for Latin America and the Caribbean; City Population, www.citypopulation.de; World Gazetteer, www.gazetteer.de
Celade; NIMA; World Gazetteer
City Population, www.citypopulation.de
Map; NIMA; World Gazetteer
City Population, www.citypopulation.de; World Gazetteer, www.gazetteer.de
World Gazetteer

CountryEnglish
Greenland
Num UE's from
RegressionsNum UE's from DCW
Num UE's from other
sources
Settlement Point
Population Source
Settlement Point
Coordinate Source
0 0 0 City Population, www.citypopulation.de; World Gazetteer, www.gazetteer.de
NIMA; World Gazetteer

CountryEnglish
Guatemala
Num UE's from
RegressionsNum UE's from DCW
Num UE's from other
sources
Settlement Point
Population Source
Settlement Point
Coordinate Source
0 0 0 NIMACelade, Latin American and Caribbean Demographic Centre (CELADE) - Population Division of Economic Commission for Latin America and the Caribbean; City Population, www.citypopulation.de; World Gazetteer, www.gazetteer.de
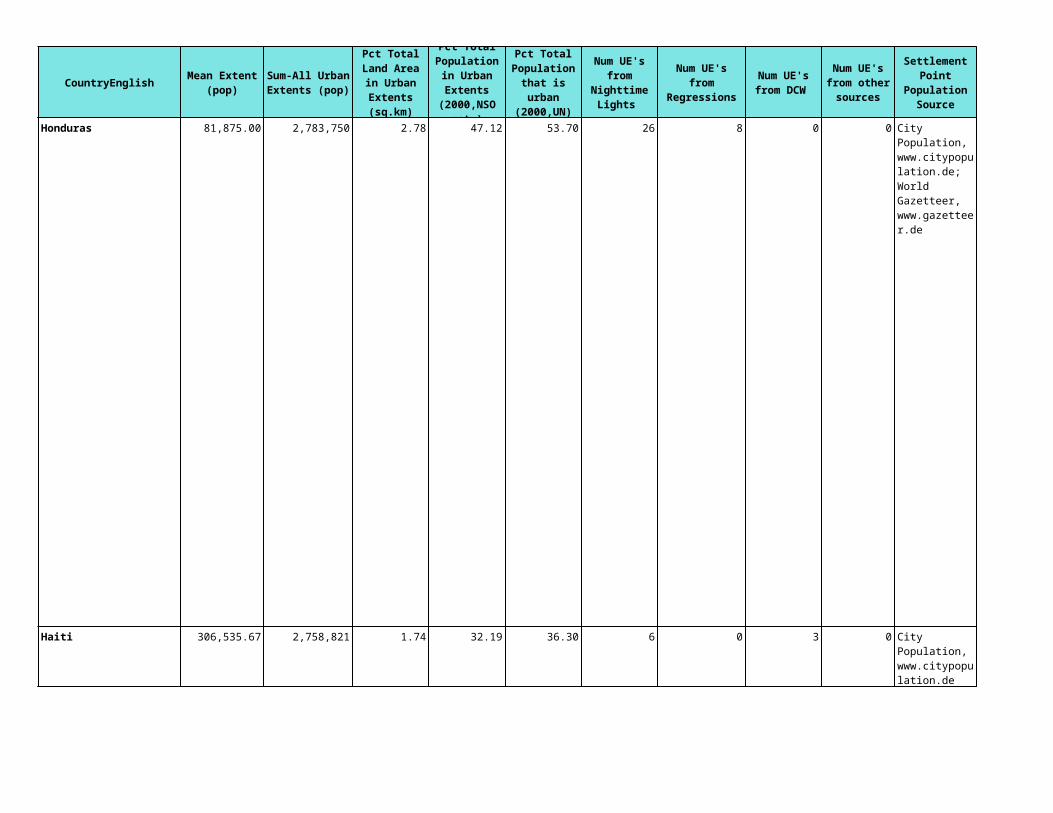
CountryEnglish
Honduras
Haiti
Num UE's from
RegressionsNum UE's from DCW
Num UE's from other
sources
Settlement Point
Population Source
Settlement Point
Coordinate Source
8 0 0
0 3 0 NIMA
City Population, www.citypopulation.de; World Gazetteer, www.gazetteer.de
NIMA; World Gazetteer
City Population, www.citypopulation.de

CountryEnglish
Jamaica
Saint Kitts and Nevis
Saint Lucia
Num UE's from
RegressionsNum UE's from DCW
Num UE's from other
sources
Settlement Point
Population Source
Settlement Point
Coordinate Source
0 0 0
0 0 0
0 0 0
City Population, www.citypopulation.de; World Gazetteer, www.gazetteer.de
NIMA; UNSD; World Gazetteer
City Population, www.citypopulation.de; World Gazetteer, www.gazetteer.de
World Gazetteer
World Gazetteer, www.gazetteer.de
World Gazetteer

CountryEnglish
Mexico
Num UE's from
RegressionsNum UE's from DCW
Num UE's from other
sources
Settlement Point
Population Source
Settlement Point
Coordinate Source
7 0 0 Celade, Latin American and Caribbean Demographic Centre (CELADE) - Population Division of Economic Commission for Latin America and the Caribbean; City Population, www.citypopulation.de; INEGI; INEGI, ftp.ciesin.org/pub/data/Mexico/urb.time.mex; World Gazetteer, www.gazetteer.de
Getty; INEGI; Map; NIMA; World Gazetteer

CountryEnglish
Montserrat
Martinique
Num UE's from
RegressionsNum UE's from DCW
Num UE's from other
sources
Settlement Point
Population Source
Settlement Point
Coordinate Source
GIS
0 0 0
National Statistical
Office, Montserrat,
National Statistical
Office, Montserrat
City Population, www.citypopulation.de
NIMA; World Gazetteer

CountryEnglish
Nicaragua
Num UE's from
RegressionsNum UE's from DCW
Num UE's from other
sources
Settlement Point
Population Source
Settlement Point
Coordinate Source
3 0 0 Celade, Latin American and Caribbean Demographic Centre (CELADE) - Population Division of Economic Commission for Latin America and the Caribbean; City Population, www.citypopulation.de; World Gazetteer, www.gazetteer.de
NIMA; World Gazetteer

CountryEnglish
Panama
Puerto Rico
El Salvador
Num UE's from
RegressionsNum UE's from DCW
Num UE's from other
sources
Settlement Point
Population Source
Settlement Point
Coordinate Source
3 0 0
0 0 0
1 0 0
Celade, Latin American and Caribbean Demographic Centre (CELADE) - Population Division of Economic Commission for Latin America and the Caribbean; World Gazetteer, www.gazetteer.de
Celade; World Gazetteer
2000 US Census, http://www.census.gov/geo/www/gazetteer/gazette.html
2000 US Census
City Population, www.citypopulation.de; World Gazetteer, www.gazetteer.de
Map; NIMA; World Gazetteer

CountryEnglish
St-Pierre and Miquelon
Trinidad and Tobago
United States of America
Turks and Caicos Islands
Num UE's from
RegressionsNum UE's from DCW
Num UE's from other
sources
Settlement Point
Population Source
Settlement Point
Coordinate Source
0 0 0
0 0 0
12 0 0
City Population, www.citypopulation.de
World Gazetteer
World Gazetteer,
www.gazetteer.de
World Gazetteer
2000 Census Trinidad and Tobago, Central Statistical Office, www.cso.gov.tt/statistics/cssp/census2000/; World Gazetteer, www.gazetteer.de
NIMA; World Gazetteer
1990 US Census, http://www.census.gov/geo/www/gazetteer/gazette.html; 2000 US Census, http://www.census.gov/geo/www/gazetteer/gazette.html
1990 US Census; 2000 US Census

CountryEnglish
St. Vincent
British Virgin Islands
American Samoa
United States Virgin Islands
Num UE's from
RegressionsNum UE's from DCW
Num UE's from other
sources
Settlement Point
Population Source
Settlement Point
Coordinate Source
1 0 0
0 0 0
0 0 0
0 0 0
City Population, www.citypopulation.de; World Gazetteer, www.gazetteer.de
World Gazetteer
World Gazetteer, www.gazetteer.de
World Gazetteer
1990 US Census, http://www.census.gov/geo/www/gazetteer/gazette.html
1990 US Census
1990 US Census, http://www.census.gov/geo/www/gazetteer/gazette.ht
1990 US Census; USDI Map
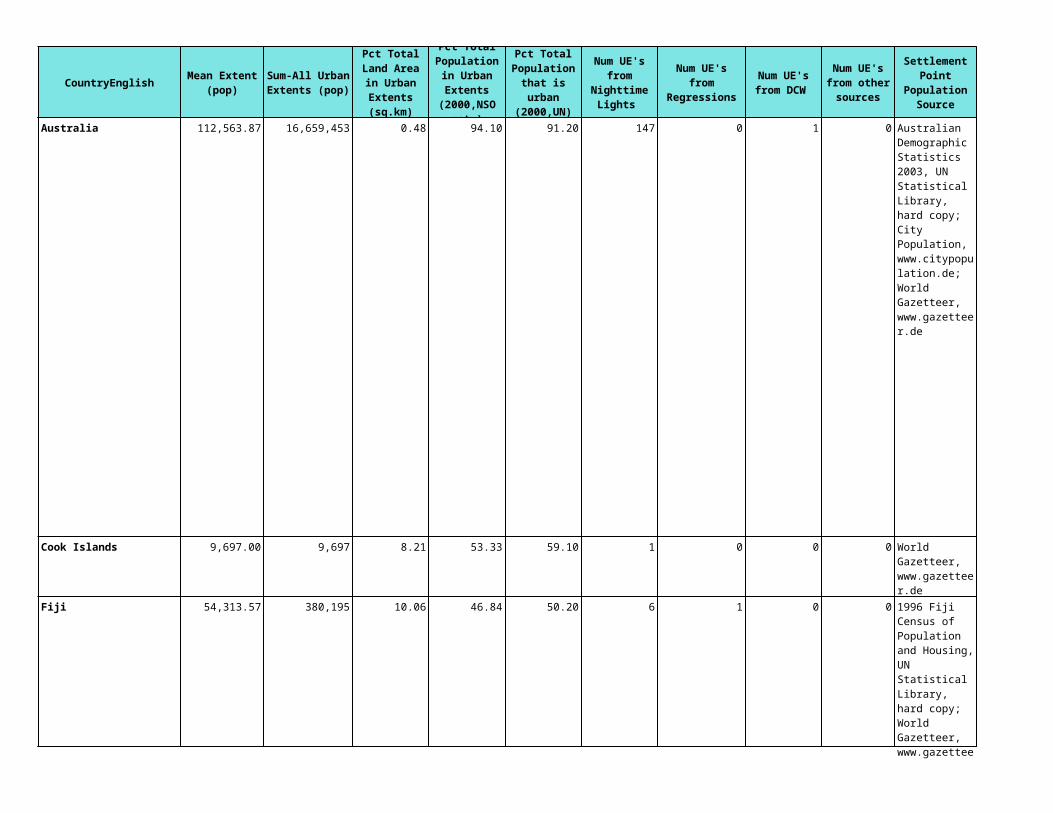
CountryEnglish
Australia
Cook Islands
Fiji
Num UE's from
RegressionsNum UE's from DCW
Num UE's from other
sources
Settlement Point
Population Source
Settlement Point
Coordinate Source
0 1 0
0 0 0
1 0 0
Australian Demographic Statistics 2003, UN Statistical Library, hard copy; City Population, www.citypopulation.de; World Gazetteer, www.gazetteer.de
Map; NIMA; World Gazetteer
World Gazetteer, www.gazetteer.de
Map; World Gazetteer
1996 Fiji Census of Population and Housing, UN Statistical Library, hard copy; World Gazetteer, www.gazetteer.de
World Gazetteer

CountryEnglish
Guam
Kiribati
Marshall Islands
Federated State of Micronesia
Northern Mariana Islands
Num UE's from
RegressionsNum UE's from DCW
Num UE's from other
sources
Settlement Point
Population Source
Settlement Point
Coordinate Source
0 0 0
2 0 0
0 0 0
0 0 0
1994 Federated States of Micronesia Census of Population, UN Statistical Library, hard copy; City Population, www.citypopulation.de
NIMA; World Gazetteer
1990 US Census, http://www.census.gov/geo/www/gazetteer/gazette.ht
1990 US Census
City Population, www.citypopulation.de; World Gazetteer, www.gazetteer.de
Map; World Gazetteer
City Population, www.citypopulation.de; World Gazetteer, www.gazetteer.de
Map; World Gazetteer
1990 US Census, http://www.census.gov/geo/www/gazetteer/gazette.ht
1990 US Census; Map
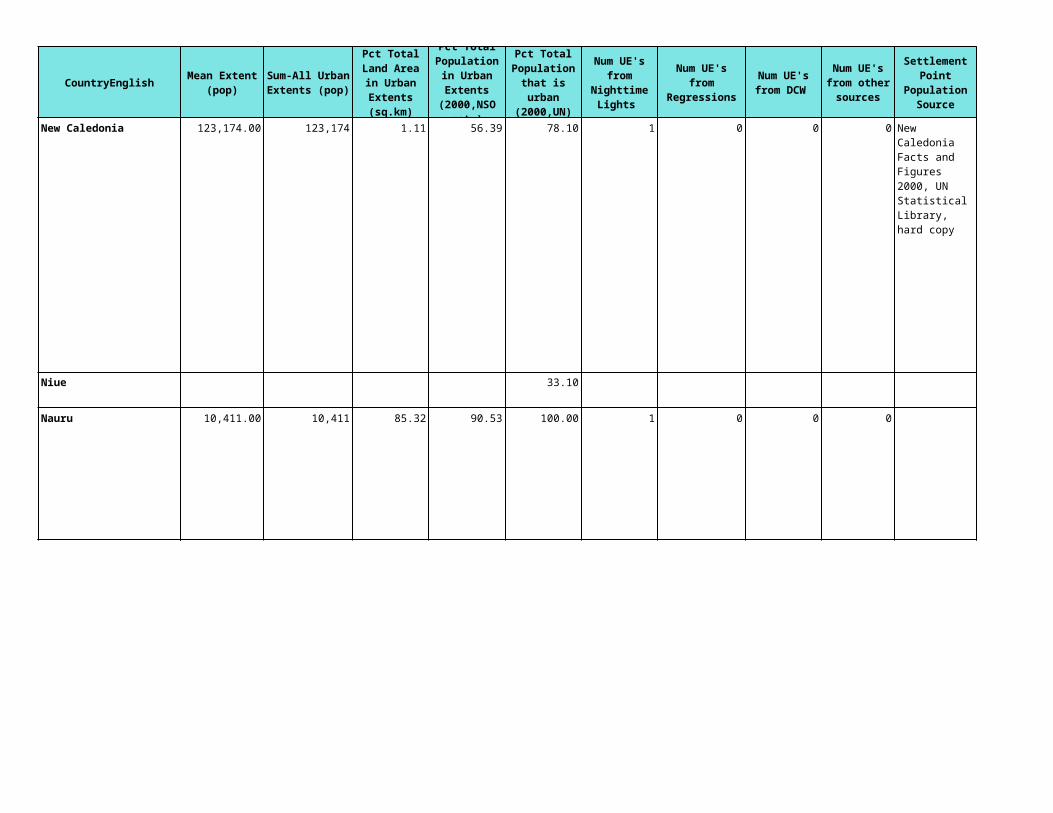
CountryEnglish
New Caledonia
Niue
Nauru
Num UE's from
RegressionsNum UE's from DCW
Num UE's from other
sources
Settlement Point
Population Source
Settlement Point
Coordinate Source
0 0 0
0 0 0
New Caledonia Facts and Figures 2000, UN Statistical Library, hard copy
World Gazetteer

CountryEnglish
New Zealand
Pitcairn
Palau
Num UE's from
RegressionsNum UE's from DCW
Num UE's from other
sources
Settlement Point
Population Source
Settlement Point
Coordinate Source
0 0 0
0 0 0
2001 New Zealand Census of Population and Dwellings, UN Statistical Library, hard copy; City Population, www.citypopulation.de; World Gazetteer, www.gazetteer.de
Getty; Map; NIMA; World Gazetteer
1990 US Census, http://www.census.gov/geo/www/gazetteer/gazette.ht
1990 US Census

CountryEnglish
Papua New Guinea
French Polynesia
Solomon Islands
Tonga
Num UE's from
RegressionsNum UE's from DCW
Num UE's from other
sources
Settlement Point
Population Source
Settlement Point
Coordinate Source
3 0 0
0 0 0
0 0 0
0 0 0
City Population, www.citypopulation.de; World Gazetteer, www.gazetteer.de
Map; NIMA; World Gazetteer
Recensement General de la Population de la Polynesie Francaise 2002, www.ispf.pf
Getty; Map; World Gazetteer
Solomon Islands 1999 Population and Housing Census
World Gazetteer
World Gazetteer, www.gazetteer.de
World Gazetteer
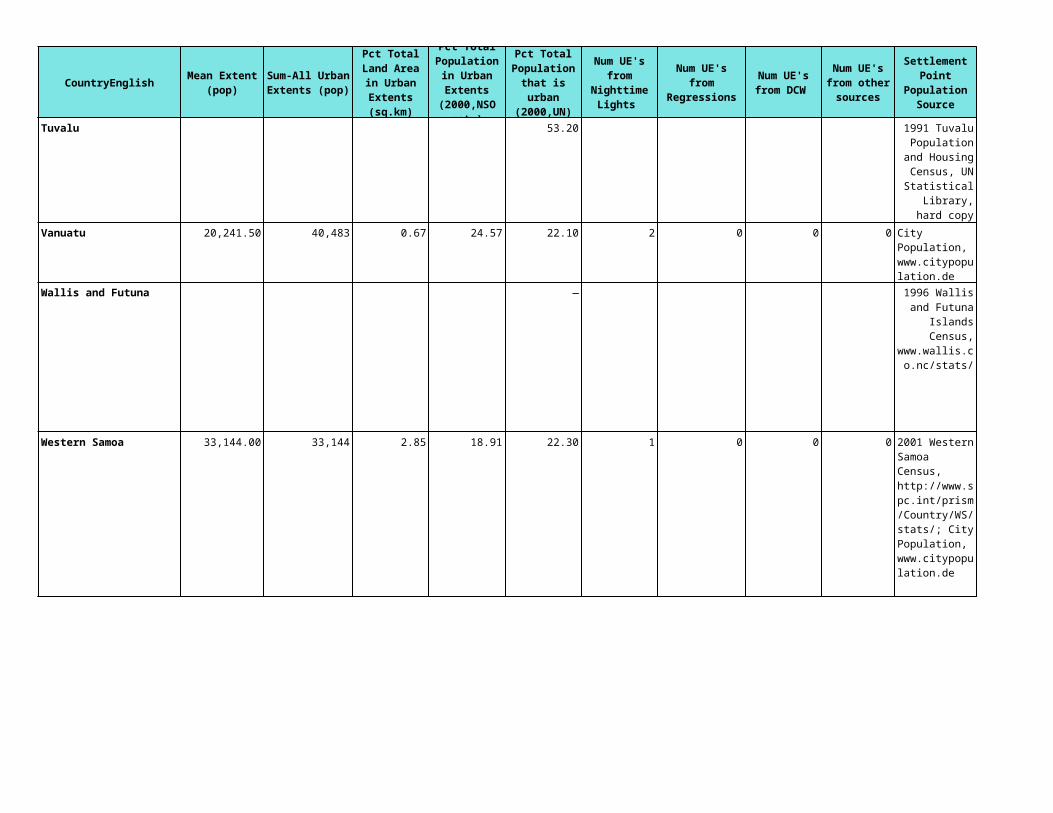
CountryEnglish
Tuvalu
Vanuatu
Wallis and Futuna
Western Samoa
Num UE's from
RegressionsNum UE's from DCW
Num UE's from other
sources
Settlement Point
Population Source
Settlement Point
Coordinate Source
Map, NIMA
0 0 0
Map, NIMA
0 0 0
1991 Tuvalu Population and
Housing Census, UN
Statistical Library, hard
copy
City Population, www.citypopulation.de
World Gazetteer
1996 Wallis and Futuna
Islands Census,
www.wallis.co.nc/stats/
2001 Western Samoa Census, http://www.spc.int/prism/Country/WS/stats/; City Population, www.citypopulation.de
Map; NIMA; Samoa Maps; World Gazetteer

CountryEnglish
Argentina
Num UE's from
RegressionsNum UE's from DCW
Num UE's from other
sources
Settlement Point
Population Source
Settlement Point
Coordinate Source
22 0 0 CELADE, Latin American and Caribbean Demographic Centre (CELADE) - Population Division of Economic Commission for Latin America and the Caribbean; Censo Nacional de Poblaci≤n, Hogares y Viviendas 2001, http://www.indec.mecon.ar/;City Population, www.citypopulation.de
Celade; Map; NIMA

CountryEnglish
Bolivia
Brazil
Num UE's from
RegressionsNum UE's from DCW
Num UE's from other
sources
Settlement Point
Population Source
Settlement Point
Coordinate Source
30 1 0
449 2 0
CELADE, Latin American and Caribbean Demographic Centre (CELADE) - Population Division of Economic Commission for Latin America and the Caribbean
Celade; NIMA; World Gazetteer
CELADE, Latin American and Caribbean Demographic Centre (CELADE) - Population Division of Economic Commission for Latin America and the Caribbean; City Population, www.citypopulation.de;Demographic Census 2000, Brazil; World Gazetteer, www.gazetteer.de
Celade; Getty; Map; NIMA; UNSD; World Gazetteer

CountryEnglish
Chile
Colombia
Num UE's from
RegressionsNum UE's from DCW
Num UE's from other
sources
Settlement Point
Population Source
Settlement Point
Coordinate Source
0 0 0 Map; NIMA
54 0 0
City Population, www.citypopulation.de
CELADE, Latin American and Caribbean Demographic Centre (CELADE) - Population Division of Economic Commission for Latin America and the Caribbean; City Population, www.citypopulation.de; World Gazetteer, www.gazetteer.de
Celade; Columbia Gazetteer; Getty; Map; NIMA; World Gazetteer

CountryEnglish
Ecuador
Falkland Islands
French Guiana
Num UE's from
RegressionsNum UE's from DCW
Num UE's from other
sources
Settlement Point
Population Source
Settlement Point
Coordinate Source
0 0 0 NIMA
0 0 0
CELADE, Latin American and Caribbean Demographic Centre (CELADE) - Population Division of Economic Commission for Latin America and the Caribbean; Censo de Poblacion y de Vivienda 1990 de Ecuador, www.citypopulation.de;City Population, www.citypopulation.de
City Population,
www.citypopulation.de;
World Gazetteer,
www.gazetteer.de
World Gazetteer
City Population, www.citypopulation.de
Map; NIMA; World Gazetteer

CountryEnglish
Guyana
Peru
Num UE's from
RegressionsNum UE's from DCW
Num UE's from other
sources
Settlement Point
Population Source
Settlement Point
Coordinate Source
3 0 0
42 0 0
World Gazetteer, www.gazetteer.de
Map; World Gazetteer
CELADE, Latin American and Caribbean Demographic Centre (CELADE) - Population Division of Economic Commission for Latin America and the Caribbean; City Population, www.citypopulation.de; World Gazetteer, www.gazetteer.de
Celade; Map; NIMA; World Gazetteer

CountryEnglish
Paraguay
Suriname
Num UE's from
RegressionsNum UE's from DCW
Num UE's from other
sources
Settlement Point
Population Source
Settlement Point
Coordinate Source
1 0 0
0 0 0
City Population, www.citypopulation.de
NIMA; World Gazetteer
City Population, www.citypopulation.de; World Gazetteer, www.gazetteer.de
NIMA; World Gazetteer

CountryEnglish
Uruguay
Venezuela
Num UE's from
RegressionsNum UE's from DCW
Num UE's from other
sources
Settlement Point
Population Source
Settlement Point
Coordinate Source
13 0 0 NIMA
22 2 0 Celade; NIMA
1996 Uruguay Census, 1996 Uruguay Census; CELADE, Latin American and Caribbean Demographic Centre (CELADE) - Population Division of Economic Commission for Latin America and the Caribbean
CELADE, Latin American and Caribbean Demographic Centre (CELADE) - Population Division of Economic Commission for Latin America and the Caribbean; City Population, www.citypopulation.de

ISO3 ContinentName Resolution Area NumUnits
Africa 16 7 29,611,975 109,138 North America 17 6 21,731,265 74,421 South America 40 30 17,614,451 10,919 Asia 19 40 30,713,070 88,782 Europe 16 8 22,552,326 91,086 Oceania 63 13 8,454,256 2,153 WORLD 19 16 130,677,343 376,499
CountryEnglish
Continent
CountryCode
CountryCodeLong
UNRegion
ISO2
UNSDCode
PopulationPerUnit ('000)
LevelUsed
Level1Type
Level2Type
Level3Type
Level4Type
Level5Type
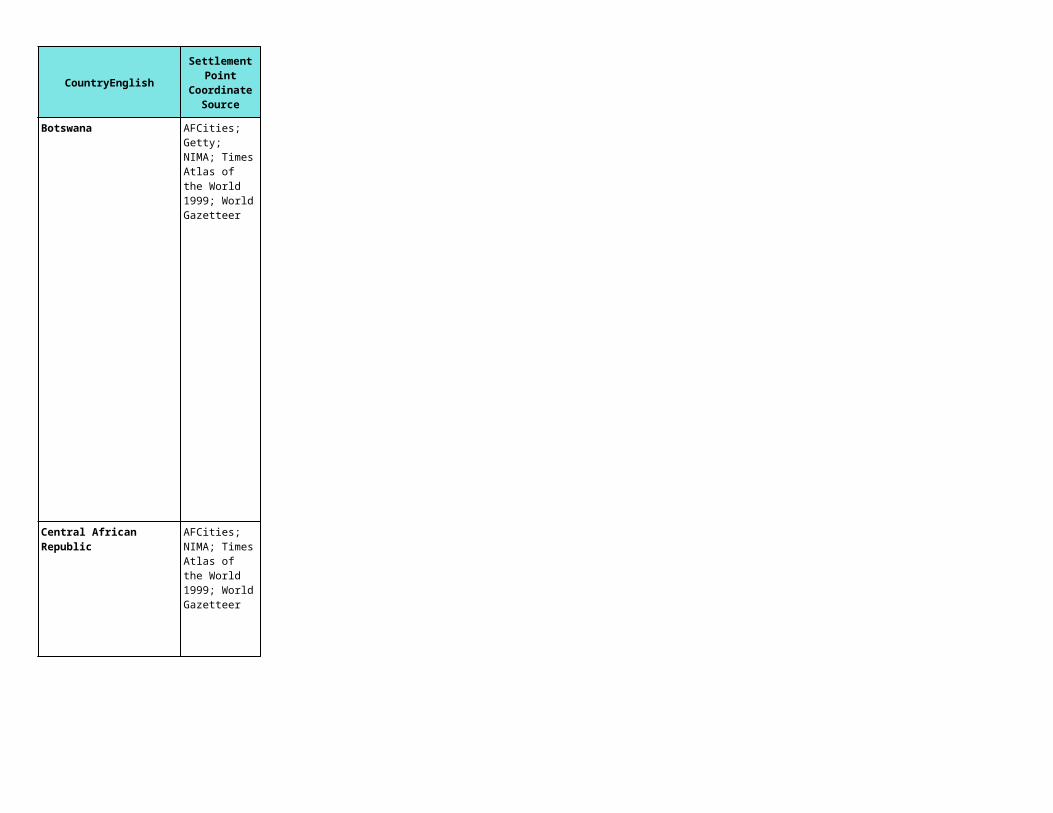
ContinentName
AfricaNorth AmericaSouth AmericaAsiaEuropeOceaniaWORLD
P90E ('000) P95E ('000) Diff90 Diff00
1988 1996 612,257 694,686 788,231 618,457 702,230 792,023 1.00 0.481990 2000 416,494 444,977 480,658 427,917 457,413 487,183 2.67 1.341990 2000 281,429 305,059 332,592 295,038 320,589 345,739 4.61 3.801990 2000 3,083,451 3,284,636 3,525,437 3,144,279 3,402,619 3,650,699 1.93 3.431991 2001 738,940 744,710 749,438 721,838 728,445 727,160 -2.37 -3.061990 2000 26,071 28,048 29,028 26,326 28,500 30,519 0.97 4.891990 2000 5,158,643 5,502,116 5,905,383 5,233,855 5,639,796 6,033,323 1.44 2.12
RefYearFirst
RefYearLast
P00E ('000)
UN_P90 ('000)
UN_P95 ('000)
UN_P00 ('000)
Source Data: Boundaries
Source Data: Population
Edits and Notes: Spatial

ContinentName
AfricaNorth AmericaSouth AmericaAsiaEuropeOceaniaWORLD
Largest Point Mean Point
3,981 7,645,936 1,004 67,016.37 2,506 10,893 1 87.66 219,665 16,911,000 5,00017,021 18,326,722 1,000 20,343.47 2,769 20,234 1 375.39 1,039,450 19,015,360 5,0047,809 17,075,936 1,001 37,188.89 3,475 6,459 1 107.46 373,417 20,405,800 5,001
12,847 16,251,717 1,009 86,979.75 8,769 37,960 1 113.14 992,159 74,530,312 5,02013,190 11,245,118 1,000 35,750.25 4,148 9,939 1 200.77 832,802 12,766,430 5,000
564 4,098,478 1,037 41,540.40 238 3,117 2 207.30 49,337 3,620,772 5,01455,412 18,326,722 0 82,639.05 21,905 37,960 0.54 211.07 3,506,830 74,530,312 5,000
Edits and Notes: Population
Num Settlement
Points
Smallest Point Urban
Criteria (UN)
Num Urban
Extents
Largest Extent (sq.km)
Smallest Extent (sq.km)
Mean Extent (sq.km)
Sum-All Urban
Extents (sq.km)
Largest Extent (pop)
Smallest Extent (pop)

ContinentName
AfricaNorth AmericaSouth AmericaAsiaEuropeOceaniaWORLD
119,355 299,103,886 0.74 38.01 41.23 1,140 1,298 58 10130,034 360,064,780 3.38 75.07 54.47 2,675 90 4 071,367 247,999,836 4.42 74.59 50.79 2,834 636 5 0
154,554 1,355,282,608 4.57 38.49 63.85 4,754 3,862 153 0122,023 506,150,190 4.73 67.68 73.93 3,777 314 57 090,320 21,496,085 0.22 74.13 69.51 231 6 1 0
175,206 2,790,097,385 2.68 47.32 56.80 15,411 6,206 278 10
Mean Extent (pop)
Sum-All Urban Extents (pop)
Pct Total Land Area in Urban
Extents (sq.km)
Pct Total Population in Urban Extents
(2000, NSO est.)
Pct Total Population that is urban (2000,
UN)
Num UE's from
Nighttime Lights
Num UE's from Regressions
Num UE's from DCW
Num UE's from other
sources
Settlement Point
Population Source
Settlement Point
Coordinate Source