chettinadtech.ac.inchettinadtech.ac.in/storage/13-12-20/13-12-20-10-01-50-2436-CCET02… · Web...
64
SURVEYING II (FOR IV – SEMESTER) UNIT - V HYDROGRAPHIC AND ADVANCE SURVEYING PREPARED BY C.LOGANATHAN, M.E., Assistant Professor HOD PRINCIPAL DEPARTMENT OF CIVIL ENGINEERING
Transcript of chettinadtech.ac.inchettinadtech.ac.in/storage/13-12-20/13-12-20-10-01-50-2436-CCET02… · Web...
SURVEYING II
(FOR IV – SEMESTER)
UNIT - V
HYDROGRAPHIC AND ADVANCE SURVEYING
PREPARED BY
C.LOGANATHAN, M.E.,
Assistant Professor
HOD PRINCIPAL
DEPARTMENT OF CIVIL ENGINEERING
CHETTINAD COLLEGE OF ENGINEERING AND TECHNOLOGY

UNIT V
HYDROGRAPHIC AND ADVANCE SURVEYINGPhotogrammetry - Introduction
- Terrestial and aerial Photographs - Stereoscopy - Parallax - Electromagnetic distance measurement - Carrier waves
- Principles - Instruments - Trilateration
Hydrographic Surveying - Tides - MSL - Sounding methods - Location of soundings and methods - Three point problem - Strength of fix - Sextants and station pointer - River surveys - Measurement of current and discharge
Cartography - Cartographic concepts and techniques
- Cadastral surveying - Definition - Uses - Legal values
- Scales and accuracies.

PART – ATWO MARKS QUESTIONS AND ANSWERS
1. What is Photogrammetric surveying?
Photogrammetric surveying or photogrammetry is the science and art of obtaining
accurate measurements by use of photographs, for various purposes such as the construction
of planimetric and topographic maps, classification of soils, interpretation of geology,
acquisition of military intelligence and the preparation of composite pictures of the ground.
The photographs are taken either from the air or from station on the ground. Terrestrial
photogrammetry is that Brach of photogrammetry wherein photographs are taken from a fixed
position on or near the ground. Aerial photogrammetry is that branch of photogrammetry
wherein the photographs are taken by a camera mounted in an aircraft flying over the area.
Mapping from aerial photographs is the best mapping procedures yet developed for large
projects, and are invaluable for military intelligence.
2. What is meant by terrestrial photogrammetry and aerial photogrammetry?
The photographs are taken either from the air or from station on the ground. Terrestrial
photogrammetry is that Brach of photogrammetry wherein photographs are taken from a fixed
position on or near the ground. Aerial photogrammetry is that branch of photogrammetry
wherein the photographs are taken by a camera mounted in an aircraft flying over the area.
Mapping from aerial photographs is the best mapping procedures yet developed for large
projects, and are invaluable for military intelligence. The major users of aerial mapping
methods are the civilian and military mapping agencies of the Government.
3. What is plane table photogrammetry?
The plane table photogrammetry consists essentially in taking a photograph of the area
to be mapped from each of the two or three stations. The photograph perpendiculars may be
oriented at any angle to the base, but usually from an acute angle with the latter. The main
difficulty arises in the identifications of image points in a pair of photographs. In the case of
homogeneous areas of sand or grass, identification becomes impossible. The principles of
stereo photogrammetry, however, produced the remedy.

4. Define terrestrial stereo photogrammetry.
In terrestrial stereo photogrammetry, due to considerable improvement of accuracy
obtained by the stereoscopic measurement of pairs of photographs, the camera base and the
angles of intersection of the datum rays to the points to be measured can be considerably
reduced since the camera axes at the two stations exhibit great similarity to each other. The
image points, which are parallactically displaced relative to each other in the two
photographs, are fused to a single spatial image by the stereoscopic measurement.
5. What is shoreline survey?
The shoreline surveys consist of:
(i) Determination or delineation of shore lines,
(ii) Location of shore details and prominent features to which soundings may be
connected,
(iii) Determination of low and high water lines for average spring tides,
The determination or delineation of shorelines is done by traversing along the shore
and taking offsets to the water edge by tape, or stadia or plane table. If the river is narrow,
both the banks may be located by running a single line of traverse on one bank. For wide
rivers, however, transverse may be run along both the banks. The traverse should be
connected at convenient intervals to check the work
6. What is sounding?
The measurement of depth below the water surface is called sounding. This
corresponds to the ordinary spirit levelling in land surveying where depths are measured
below a horizontal line established by a level. Here, the horizontal line or the datum is the
surface of water, the level of which continuously goes on changing with time. The object of
making soundings is thus to determine the configuration of the sub aqueous source.
7. What are the uses of soundings?
The object of making soundings is thus to determine the configuration of the sub
aqueous source. Soundings are required for:
(i) Making nautical charts for navigation;

(ii) Measurement of areas subject to scour or silting and to ascertain the quantities of
dredged material;
(iii) Making sub-aqueous investigations to secure information needed for the construction, development and improvement of port facilities.
8. What are equipments needed for soundings?
For most of the engineering works, soundings are taken form a small boat. The
equipment needed for soundings are:
(i) Sounding boat
(ii) Sounding rods or poles
(iii) Lead lines
(iv) Sounding machine
(v) Fathometer.
9. What is a Sounding boat?
A row-boat for sounding should be sufficiently roomy and stable. For quiet water, a
flat bottom boat is more suitable, but for rough water round-bottomed boat is more suitable.
For regular soundings, a row-boat may be provided with a well through which sounds are
taken. A sounding platform should be built for use in smaller boat. It should be extended far
enough over the side to prevent the line from striking the boat. If the currents are strong, a
motor or stream launch may be used with advantage.
10. What is a sounding lead?
Sounding lead is a weight (made of lead) attached to the line. The weight is conical in
shape and varies from 4 to 12 kg depending upon the depth of water and the strength of the
current. The weight should be somewhat streamlined and should have an eye at the top for
attaching the cord. It often has cup-shaped cavity at the bottom so that it may be armed with
land or tallow to pick up samples from the bottom. Where the bottom surface is soft, lead-
filled pipe with a board at the top is used with the lead weight. The weight penetrates in the
mud and stops where the board strikes the mud surface.

11. What is a Fathometer?
A Fathometer is used in ocean sounding where the depth of water is too much, and to
make a continuous and accurate record of the depth of water below the boat or ship at which it
is installed. It is an echo-sounding instrument in which water depths are obtained be
determining the time required for the sound waves to travel from a point near the surface of
the water to the bottom and back. It is adjusted to read depth on accordance with the velocity
of sound in the type of water in which it is being used. A Fathometer may indicate the depth
visually or indicate graphically on a roll, which continuously goes on revolving, and provide a
virtual profile of the lake or sea.
12. Explain how soundings can be plotted.
The method of plotting the soundings depends upon the method used for locating the
soundings. If the soundings have been taken along the range lines, the position of shore
signals can be plotted and the sounding located on these in the plan. In the fixes by angular
methods also, the plotting is quite simple, and requires the simple knowledge of geometry.
However, if the sounding has been located by two angles from the boat by observations to
three known points on the shore, the plotting can be done either by the mechanical, graphical
or the analytical solution of the three-point problem.
13. Explain how tides can be predicted.
The two elements required in the prediction of tide at a place are:
(i) Time of occurrence of tide
(ii) Height of tide above datum.
There are two principal methods of tide prediction:
1. Prediction by use of non-harmonic constants.
2. Prediction by use of harmonic constants.

14. What is a map?
When making a map one consideration is to recognize that for areas of any size it is
necessary to decide how to take a three-dimensional surface and flatten it onto a piece of
paper. That is one has to make a projection. In obtaining a map for use in a GIS program it is
important to know what projection was used. If two maps are to be merged they must use the
same projection.
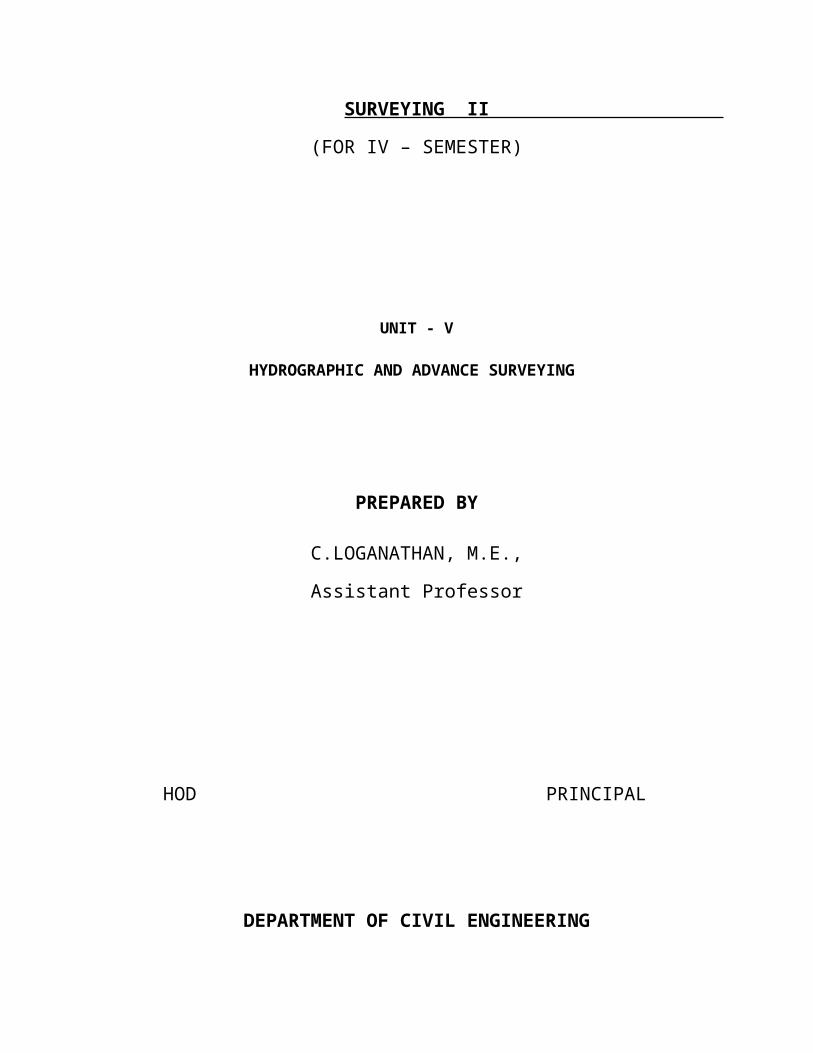
15. Define Cartography.Cartography is about maps. This includes the art, science and technology of map
making, the use of maps as research tools and as sources of information, and the study of
maps as historical documents and works of art. Cartography has always been closely
associated with Geography and Surveying.
Cartographic Communication Process

16. Write about the advantages of Echo sounding.
Echo sounding has the following advantages over the older method of lead line and rod:
1. It is more accurate as a truly vertical sounding is obtained. The speed of the vessel
does deviate it appreciably from the vertical. Under normal water conditions, in ports and
harbors an accuracy of 7.5 cm may be obtained.
2. It can be used when a strong current is running and when the weather is unsuitable
for the soundings to be taken with the lead line.
3. It is more sensitive than the lead line.
4. A record of the depth is plotted immediately and provides a continuous record of the bottom as the vessel moves forward.
5. The speed of sounding and plotting is increased.
6. The error due to estimation of water level in a choppy sea is reduced owing to the
instability of the boat.
7. Rock underlying softer material is recorded and this valuable information is
obtained more cheaply than would be the case where sub-marine borings are taken.
17. What are the methods employed in locating soundings?
The soundings are located with reference to the shore traverse by observations made
(i) entirely from the boat, (ii) entirely from the shore or (iii) from both.
The following are the methods of location
1. By cross rope.
2. By range and time intervals.
3. By range and one angle from the shore.
4. By range and one angle from the boat.
5. By two angles from the shore.
6. By two angles from the boat.
7. By one angle from shore and one from boat.
8. By intersecting ranges.
9. By tacheometry.

18. What is reduction of soundings?
The reduced soundings are the reduced levels of the sub-marine surface in terms of the
adopted datum. When the soundings are taken, the depth of water is measured with reference
to the existing water level at that time. If the gauge readings are also taken at the same time,
the soundings can be reduced to a common unvarying datum. The datum most commonly
adopted is the ‘mean level of low water of spring tides’ and is written either as L.W.O.S.T.
(low water, ordinary spring tides) or M.L.W.S. (mean low water springs).
PART-B
16 MARKS QUESTIONS AND ANSWER
1. Explain photogrametric surveying?
Photogram metric surveying or photogrammetry is the science and art of obtaining
accurate measurements by use of photographs, for various purposes such as the construction
of planimetric and topographic maps, classification of soils, interpretation of geology,
acquisition of military intelligence and the preparation of composite pictures of the ground.
The photographs are taken either from the air or from station on the ground. Terrestrial
photogrammetry is that Brach of photogrammetry wherein photographs are taken from a fixed
position on or near the ground. Aerial photogrammetry is that branch of photogrammetry
wherein the photographs are taken by a camera mounted in an aircraft flying over the area.
Mapping from aerial photographs is the best mapping procedures yet developed for large
projects, and are invaluable for military intelligence. The major users of aerial mapping
methods are the civilian and military mapping agencies of the Government.
The conception of using photographs for purposes of measurement appears to have
originated with the experiments of Aime Laussedat of the Corps of the French Army, who in
1851 produced the first measuring camera. He developed the mathematical analysis of
photographs as perspective projections, thereby increasing their application to topography.
Aerial photography from balloons probably began about 1858. Almost concurrently (1858),
but independently of Laussedat, Meydenbauer in Germany carried out the first experiments in
making critical measurements of architectural details by the intersection method in the basis
of two photographs of the building. The ground photography was perfected in Canada by
Capt. Deville, then Surveyor General of Canada in 1888. In Germany, most of the progress on
the theoretical side was due to Hauck.
In 1901, Pulfrich in Jena introduced the stereoscopic principle of measurement and
designed the stereo comparator. The stereoaitograph was designed (1909) at the Zeiss
workshops in Jena, and this opened a wide field of practical application. Scheimpflug, an
Australian captain, developed the idea of double projector in 1898. He originated the theory
of perspective transformation and incorporated its principles in the photoperspecto graph. He

also gave the idea of radial triangulation. His work paved the way for the development of
aerial surveying and aerial photogrammetry.
In 1875, Oscar Messter built the first aerial camera in Germany and J.W.Bagloy and
A.Brock produced the first aerial cameras in U.S.A. In 1923, Bauersfeld designed the Zeiss
stereoplanigraph. The optical industries of Germany, Switzerland, Italy and France, and later
also those of the U.S.A and U.S.S.R. took up the manufacture and constant further
development of the cameras and plotting instruments. In World War II, both the sides made
extensive use of aerial photographs for their military operations. World War II gave rise to
new developments of aerial photography techniques, such as the application of radio control
to photoflight navigation, the new wide-angle lenses and devices to achieve true vertical
photographs.
2. Explain the principles behind terrestrial photogrammetry.
The principle of terrestrial photogrammetry was improved upon and perfected by
Capt. Deville, then Surveyor General of Canada in 1888. In terrestrial photogrammetry,
photographs are taken with the camera supported on the ground. The photographs are taken
by means of a photo theodolite which is a combination of a camera and a theodolite. Maps are
then compiled from the photographs.
The principle underlying the method of terrestrial photogrammetry is exactly similar
to that of plane table surveying, i.e. if the directions of same objects photographed from two
extremities of measured base are known, their position can be located by the intersection of
two rays to the same object. However, the difference between this and plane tabling is that
more details are at once obtained from the photographs and their subsequent plotting etc. is
done by the office while in plane tabling all the detailing is done in the field itself.

Thus in Fig , A and B are the two stations at the ends of base AB. The arrows indicate
the directions of horizontal pointing (in plan) of the camera. For each pair of pictures taken
from the two ends, the camera axis is kept parallel to each other. From economy and speed
point of view, minimum number of photographs should be used to cover the whole area and to
achieve this, it is essential to select the best positions of the camera stations. A thorough study
of the area should be done from the existing maps, and a ground reconnaissance should be
made. The selection of actual stations depends upon the size and ruggedness of the area to be
surveyed. The camera should be directed downward rather than upward, and the stations
should be at the higher points on the area.
The terrestrial photogrammetry can be divided into two branches:
(i) Plane-table photogrammetry.
(ii) Terrestrial stereo photogrammetry
The plane table photogrammetry consists essentially in taking a photograph of the area
to be mapped from each of the two or three stations. The photograph perpendiculars may be
oriented at any angle to the base, but usually from an acute angle with the latter. The main
difficulty arises in the identifications of image points in a pair of photographs. In the case of
homogeneous areas of sand or grass, identification becomes impossible. The principles of
stereo photogrammetry, however, produced the remedy.
In terrestrial stereo photogrammetry, due to considerable improvement of accuracy
obtained by the stereoscopic measurement of pairs of photographs, the camera base and the
angles of intersection of the datum rays to the points to be measured can be considerably
reduced since the camera axes at the two stations exhibit great similarity to each other. The
image points which are parallactically displaced relative to each other in the two photographs
are fused to a single spatial image by the stereoscopic measurement.

3. What is shore line survey?
The shore line surveys consist of:
(i) Determination or delineation of shore lines,
(ii) Location of shore details and prominent features to which soundings may be
connected,
(iii) Determination of low and high water lines for average spring tides,
The determination or delineation of shore lines is done by traversing along the shore
and taking offsets to the water edge by tape, or stadia or plane table. If the river is narrow,
both the banks may be located by running a single line of traverse on one bank. For wide
rivers, however, transverse may be run along both the banks. The traverse should be
Connected at convenient intervals to check the work. Thus, the Fig. two traverses XY and X
– Y-- along the two opposite shores may be checked by taking observations from A and B to
the points C and D. When the instrument is at B, angles ABC and ABD can be measured.
From the measured length of AB and the four angles, the length CD can be calculated. If this
agrees with the measured length of CD, the work is checked. Sometimes, a triangulation net is

run along a wide river. In sea shore survey, buoys anchored off the shore and light houses are
used as reference points and are located by triangulation.
In the case of tidal water, it is necessary to locate the high and low water lines. The
position of high water line may be determined roughly from shore deposits and marks on
rocks. To determine the high water line accurately, the elevation of mean high water of
ordinary spring tide is determined and the points are located on the shore at that elevation as
in direct method of contouring. The low water line can also be determined similarly.
However, since the limited time is available for the survey of low water line, it is usually
located by interpolation from soundings.
4. What is sounding? Explain the methods employed in sounding.
The measurement of depth below the water surface is called sounding. This
corresponds to the ordinary spirit leveling in land surveying where depths are measured below
a horizontal line established by a level. Here, the horizontal line or the datum is the surface of
water, the level of which continuously goes on changing with time. The object of making
soundings is thus to determine the configuration of the sub aqueous source. As stated earlier,
soundings are required for:
(i) Making nautical charts for navigation;
(ii) Measurement of areas subject to scour or silting and to ascertain the quantities of
dredged material;
(iii) Making sub-aqueous investigations to secure information needed for the
construction, development and improvement of port facilities.
For most of the engineering works, soundings are taken form a small boat. The
equipment needed for soundings are:
(i) Sounding boat (ii) Sounding rods or poles
(iii) Lead lines (iv) Sounding machine
(v) Fathometer.
Sounding boat
A row-boat for sounding should be sufficiently roomy and stable. For quiet water, a
flat bottom boat is more suitable, but for rough water round-bottomed boat is more suitable.
For regular soundings, a row boat may be provided with a well through which sounds are

taken. A sounding platform should be built for use in smaller boat. It should be extended far
enough over the side to prevent the line from striking the boat. If the currents are strong, a
motor or stream launch may be used with advantage.
Sounding rods or poles
A sounding rod is a pole of a sound straight-grained well seasoned tough timber
usually 5 to 8 cm in diameter and 5 to 8 metres long. They are suitable for shallow and quiet
waters. An arrow or lead shoe of sufficient weights fitted at the end. This helps in holding
them upright in water. The lead or weight should be of sufficient area so that it may not sink
in mud or sand. Between soundings it is turned end for end without removing it from the
water. A pole of 6 m can be used to depths unto 4 meters.
Lead lines
A lead line or a sounding line is usually a length of a cord, or tiller rope of Indian
hemp or braided flax or a brass chain with a sounding lead attached to the end. Due to
prolonged use, a line of hemp or cotton is liable to get stretched. To graduate such a line, it is
necessary to stretch it thoroughly when wet before it is graduated. The line should be kept dry
when not in use. It should be soaked in water for about one hour before it is used for taking
soundings. The length of the line should be tested frequently with a tape. For regular
sounding, a chain of brass, steel or iron is preferred. Lead lines are usually used for depths
over about 6 meters.
Sounding lead is a weight (made of lead) attached to the line. The weight is conical in
shape and varies from 4 to 12 kg depending upon the depth of water and the strength of the
current. The weight should be somewhat streamlined and should have an eye at the top for
attaching the cord. It often has cup-shaped cavity at the bottom so that it may be armed with

land or tallow to pick up samples from the bottom. Where the bottom surface is soft, lead-
filled pipe with a board at the top is used with the lead weight. The weight penetrates in the
mud and stops where the board strikes the mud surface.
Suggested system of marking poles and lead lines
The U.S. Coast and Geodetic survey recommends the following system of marking the
poles and the lead lines :
Poles : Make a small permanent notch at each half foot. Paint the entire pole white
and the spaces between the 2- and 3-, the 7- and 8-and the 12- and 13-ft marks black. Point
½’’ red bands at the 5- and 10-ft marks, a ½’’ in black band at each of the other foot marks
and ¼’’ bands at the half foot marks. These bands are black where the pole is white and vice
versa.
Lead Lines : A lead line is marked in feet as follow :
Feet Marks
2, 12, 22 etc Red bunting
4, 14, 24 etc White bunting
6, 16, 26 etc Blue bunting
8, 18, 28 etc Yellow bunting
10, 60, 110 etc One strip of leather
20, 70, 120 etc Two strips of leather
30, 80, 130 etc Leather with two holes
40, 90, 140 etc Leather with one holes
50 Star-shaped leather
100 Star-shaped leather with one hole
The intermediate odd feet (1,3,5,7,9 etc.) are marked by white seizing.
Sounding Machine
Where much of sounding is to done, a sounding machine as very useful. The sounding
machine may either be hand driven or automatic. Fig.4.3. show a typical hand driven
Weddele’s sounding machine.

The lead weight is carried at the end of a flexible wire cord attached to the barrel and
can lowered at any desired rate, the speed of the drum being controlled by means of a break.
The readings are indicated in two dials—the outer dial showing the depth in feet and the inner
showing tenths of a foot. A handle is used to raise the level which can be suspended at any
height by means of a paul and ratchet. The sounding machine is mounted in a sounding boat
and can be used up to a maximum depth of 100 ft.
Fathometer : Echo-sounding
A Fathometer is used in ocean sounding where the depth of water is too much, and to
make a continuous and accurate record of the depth of water below the boat or ship at which it
is installed. It is an echo-sounding instrument in which water depths are obtained be
determining the time required for the sound waves to travel from a point near the surface of
the water to the bottom and back. It is adjusted to read depth on accordance with the velocity
of sound in the type of water in which it is being used. A fathometer may indicate the depth
visually or indicate graphically on a roll which continuously goes on revolving and provide a
virtual profile of the lake or sea.

5. What are the components of echo sounding instrument? Briefly explain the
advantages of echo sounding.
The main parts of an echo-sounding apparatus are:
1. Transmitting and receiving oscillators.
2. Recorder unit.
3. Transmitter / Power unit.
Figure illustrates the principal of echo-sounding. It consists in recording the interval of
time between the emission of a sound impulse direct to the bottom of the sea and the reception
of the wave or echo, reflected from the bottom. If the speed of sound in that water is v and the
time interval between the transmitter and receiver is t, the depth h is given by
h = ½ vt …
Due to the small distance between the receiver and the transmitter, a slight correction
is necessary in shallow waters. The error between the true depth and the recorded depth can
be calculated very easily by simple geometry. If the error is plotted against the recorded
depth, the true depth can be easily known. The recording of the sounding is produced by the
action of a small current passing through chemically impregnated paper from a rotating stylus
to an anode plate. The stylus is fixed at one end of a radial arm which revolves at constant
speed. The stylus makes a record on the paper at the instants when the sound impulse is
transmitted and when the echo returns to the receiver.

Advantage of echo-sounding Echo-sounding has the following advantages over the older method of lead line and
rod: 1. It is more accurate as a truly vertical sounding is obtained. The speed of the vessel
does deviate it appreciably from the vertical. Under normal water conditions, in ports and
harbors an accuracy of 7.5 cm may be obtained.
2. It can be used when a strong current is running and when the weather is unsuitable
for the soundings to be taken with the lead line.
3. It is more sensitive than the lead line.
4. A record of the depth is plotted immediately and provides a continuous record of
the bottom as the vessel moves forward.
5. The speed of sounding and plotting is increased.
6. The error due to estimation of water level in a choppy sea is reduced owing to the
instability of the boat.
7. Rock underlying softer material is recorded and this valuable information is
obtained more cheaply than would be the case where sub-marine borings are taken.
Making the soundings
If the depth is less than 25 m, the soundings can be taken when the boat is in motion.
In the case of soundings with rod the leadsman stands in the bow and plunges the rod at a
forward angle, depending on the speed o the boat, such that the rod is vertical when the boat
reaches the point at which soundings is being recorded. The rod should be read very quickly.
The nature of the bottom should also be recorded at intervals in the note-book.
If the sounding is taken with a lead, the leadsman stands in the bow of the boat and
casts the lead forward at such a distances that the line will become vertical and will reach the
bottom at a point where sounding is required. The lead is withdrawn from the water after the
reading is taken. If the depth is great, the lead is not withdrawn from the water, but is lifted
between the soundings.
The water surface, which is also the reference datum, changes continuously. It is,
therefore, essential to take the readings of the tide gauges at regular interval so that the
soundings can be reduced to a fixed datum. To co-relate each sounding with the gauge
reading, it is essential to record the time at which each sounding is made.

6. What are the methods employed in locating soundings?
The soundings are located with reference to the shore traverse by observations made
(i) entirely from the boat, (ii) entirely from the shore or (iii) from both.
The following are the methods of location
1. By cross rope.
2. By range and time intervals.
3. By range and one angle from the shore.
4. By range and one angle from the boat.
5. By two angles from the shore.
6. By two angles from the boat.
7. By one angle from shore and one from boat.
8. By intersecting ranges.
9. By tacheometry.
Range.
A range or range line is the line on which soundings are taken. They are, in general,
laid perpendicular to the shore line and parallel to each other if the shore is straight or are
arranged radiating from a prominent object when the shore line is very irregular.

Shore signals.
Each range line is marked by means of signals erected at two points on it at a
considerable distance apart. Signals can be constructed in a variety of ways. They should be
readily seen and easily distinguished from each other. The most satisfactory and economic
type of signal is a wooden tripod structure dressed with white and coloured signal of cloth.
The position of the signals should be located very accurately since all the soundings are to be
located with reference to these signals.
Location by Cross-Rope
This is the most accurate method of locating the soundings and may be used for rivers,
narrow lakes and for harbours. It is also used to determine the quantity of materials removed
by dredging the soundings being taken before and after the dredging work is done. A single
wire or rope is stretched across the channel etc. as shown in Fig.4.6 and is marked by metal
tags at appropriate known distance along the wire from a reference point or zero station on
shore. The soundings are then taken by a weighted pole. The position of the pole during a
sounding is given by the graduated rope or line.
In another method, specially used for harbours etc., a reel boat is used to stretch the
rope. The zero end of the rope is attached to a spike or any other attachment on one shore. The

rope is would on a drum on the reel boat. The reel boat is then rowed across the line of
sounding, thus unwinding the rope as it proceeds. When the reel boat reaches the other shore,
its anchor is taken ashore and the rope is wound as tightly as possible. If anchoring is not
possible, the reel is taken ashore and spiked down. Another boat, known as the sounding boat,
then starts from the previous shore and soundings are taken against each tag of the rope. At
the end of the soundings along that line, the reel boat is rowed back along the line thus
winding in the rope. The work thus proceeds.
Location by Range and Time Intervals
In this method, the boat is kept in range with the two signals on the shore and is rowed
along it at constant speed. Soundings are taken at different time intervals. Knowing the
constant speed and the total time elapsed at the instant of sounding, the distance of the total
point can be known along the range. The method is used when the width of channel is small
and when great degree of accuracy is not required. However, the method is used in
conjunction with other methods, in which case the first and the last soundings along a range
are located by angles from the shore and the intermediate soundings are located by
interpolation according to time intervals.
Location by Range and One Angle from the Shore

In this method, the boat is ranged in line with the two shore signals and rowed along
the ranges. The point where sounding is taken is fixed on the range by observation of the
angle from the shore. As the boat proceeds along the shore, other soundings are also fixed by
the observations of angles from the shore. Thus B is the instrument station, A1 A2 is the range
along which the boat is rowed and α1, α2, α3 etc., are the angles measured at B from points 1,
2, 3 etc. The method is very accurate and very convenient for plotting. However, if the angle
at the sounding point (say angle β) is less than 30°, the fix becomes poor. The nearer the
intersection angle (β) is to a right angle, the better. If the angle diminishes to about 30° a new
instrument station must be chosen. The only defect of the method is that the surveyor does not
have an immediate control in all the observation. If all the points are to be fixed by angular
observations from the shore, a note-keeper will also be required along with the instrument
man at shore since the observations and the recordings are to be done rapidly. Generally, the
first and last soundings and every tenth sounding are fixed by angular observations and the
intermediate points are fixed by time intervals. Thus the points with round mark are fixed by
angular observations from the shore and the points with cross marks are fixed by time
intervals. The arrows show the course of the boat, seaward and shoreward on alternate
sections.
To fix a point by observations from the shore, the instrument man at B orients his line
of sight towards a shore signal or any other prominent point (known on the plan) when the
reading is zero. He then directs the telescope towards the leadsman or the bow of the boat, and
is kept continually pointing towards the boat as it moves. The surveyor on the boat holds a
flag for a few seconds and on the fall of the flag, the sounding and the angle are observed
simultaneously.
The angles are generally observed to the nearest 5 minutes. The time at which the flag
falls is also recorded both by the instrument man as well as on the boat. In order to avoid
acute intersections, the lines of soundings are previously drawn on the plan and suitable
instrument stations are selected.
Location by Range and One Angle from the Boat
The method is exactly similar to the previous one except that the angular fix is made
by angular observation from the boat. The boat is kept in range with the two shore signals and

is rowed along it. At the instant the sounding is taken, the angle, subtended at the point
between the range and some prominent point B on the sore is measured with the help of
sextant. The telescope is directed on the range signals, and the side object is brought into
coincidence at the instant the sounding is taken. The accuracy and ease of plotting is the
same as obtained in the previous method. Generally, the first and the last soundings, and some
of the intermediate soundings are located by angular observations and the rest of the
soundings are located by time intervals.
As compared to the previous methods, this method has the following advantages :
1. Since all the observations are taken from the boat, the surveyor has better control
over the operations.
2. The mistakes in booking are reduced since the recorder books the readings directly
as they are measured.
3. On important fixes, check may be obtained by measuring a second angle towards
some other signal on the shore.
4. The obtain good intersections throughout, different shore objects may be used for
reference to measure the angles.
Location by Two Angles from the Shore
In this method, a point is fixed independent of the range by angular observations from
two points on the shore. The method is generally used to locate some isolated points. If this
method is used on an extensive survey, the boat should be run on a series of approximate
ranges. Two instruments and two instrument men are required. The position of instrument is
selected in such a way that a strong fix is obtained. New instrument stations should be chosen
when the intersection angle (θ) falls below 30°. Thus A and B are the two instrument stations.
The distance d between them is very accuarately measured. The instrument stations A and B
are precisely connected to the ground traverse or triangulation, and their positions on plan are
known. With both the plates clamped to zero, the instrument man at A
bisects B ; similarly with both the plates clamped to zero, the instrument man at B bisects A.
Both the instrument men then direct the line of sight of the telescope towards the leadsman
and continuously follow it as the boat moves. The surveyor on the boat holds a flag for a few
seconds, and on the fall of the flag the sounding and the angles are observed simultaneously.
The co-ordinates of the position P of the sounding may be computed from the relations :
The method has got the following advantages:
1. The preliminary work of setting out and erecting range signals is eliminated.
2. It is useful when there are strong currents due to which it is difficult to row the boat
along the range line.
The method is, however, laborious and requires two instruments and two instruments.

Location by Two Angles from the Boat
In this method, the position of the boat can be located by the solution of the three-
point problem by observing the two angles subtended at the boat by three suitable shore
objects of known position. The three-shore points should be well-defined and clearly visible.
Prominent natural objects such as church spire, lighthouse, flagstaff, buoys etc., are selected
for this purpose. If such points are not available, range poles or shore signals may be taken.
Thus A, B and C are the shore objects and P is the position of the boat from which the angles
α and β are measured. Both the angles should be observed simultaneously with the help of
two sextants, at the instant the sounding is taken. If both the angles are observed by surveyor
alone, very little time should be lost in taking the observation. The angles on the circle are
read afterwards. The method is used to take the soundings at isolated points. The surveyor has
better control on the operations since the survey party is concentrated in one boat. If sufficient
number of prominent points are available on the shore, preliminary work o setting out and
erecting range signals is eliminated. The position of the boat is located by the solution of the
three point problem either analytically or graphically.
Location by One Angle from the Shore and the other from the Boat

This method is the combination of methods 5 and 6 described above and is used to
locate the isolated points where soundings are taken. Two points A and B are chosen on the
shore, one of the points (say A) is the instrument station where a theodolite is set up, and the
other (say B) is a shore signal or any other prominent object. At the instant the sounding is
taken at P, the angle α at A is measured with the help of a sextant. Knowing the distance d
between the two points A and B by ground survey, the position of P can be located by
calculating the two co-ordinates x and y.
Location by Intersecting Ranges
This method is used when it is required to determine by periodical sounding at the
same points, the rate at which silting or scouring is taking place. This is very essential on the
harbors and reservoirs. The position of sounding is located by the intersection of two ranges,
thus completely avoiding the angular observations. Suitable signals are erected at the shore.
The boat is rowed along a range perpendicular to the shore and soundings are taken at the
points in which inclined ranges intersect the range, as illustrated in Fig. 4.12. However, in
order to avoid the confusion, a definite system of flagging the range poles is necessary. The
position of the range poles is determined very accurately by ground survey.
\

Location by Tacheometric Observations
The method is very much useful in smooth waters. The position of the boat is located
by tacheometric observations from the shore on a staff kept vertically on the boat. Observing
the staff intercept s at the instant the sounding is taken, the horizontal distance between the
instrument stations and the boat is calculated by
The direction of the boat (P) is established by observing the angle (α) at the instrument
station B with reference to any prominent object A The transit station should be near the
water level so that there will be no need to read vertical angles. The method is unsuitable
when soundings are taken far from shore.
7. Explain reduction of soundings with a example.
The reduced soundings are the reduced levels of the sub-marine surface in
terms of the adopted datum. When the soundings are taken, the depth of water is measured
with reference to the existing water level at that time. If the gauge readings are also taken at
the same time, the soundings can be reduced to a common unvarying datum. The datum most
commonly adopted is the ‘mean level of low water of spring tides’ and is written either as
L.W.O.S.T. (low water, ordinary spring tides) or
M.L.W.S. (mean low water springs). For reducing the soundings, a correction equal to
the difference of level between the actual water level (read by gauges) and the datum is
applied to the observed soundings, as illustrated in the table given below :
Gauge Reading at L.W.O.S.T. = 3.0 m.

Time Gauge
(m)
Distance Soluction
(m)
Correction Reduced
sounding
(m)
Remarks
8.00
A.M.
3.5 10 2.5 -0.5 2.00
20 3.2 2.7
30 3.9 3.4
40 4.6 4.1
8.10
A.M.
3.5 50 5.3 -0.5 4.8
60 5.4 4.9
70 5.1 4.6
80 4.7 4.2
90 3.6 3.1
8.10
A.M.
3.5 100 2.1 -0.5 1.6
8 .What is three point problem ?How it can be solved ?
Given the three shore signals A, B and C, and the angles α and β subtended by AP, BP
and CP at the boat P, it is required to plot the position of P

1. Mechanical Solution
(i) By Tracing Paper
Protract angles α and β between three radiating lines from any point on a piece of
tracing paper. Plot the positions of signals A, B, C on the plan. Applying the tracing paper to
the plan, move it about until all the three rays simultaneously pass through A, B and C. The
apex of the angles is then the position of P which can be pricked through.
(ii) By Station Pointer:
The station pointer is a three-armed protractor and consists of a graduated circle with
fixed arm and two movable arms to the either side of the fixed arm. All the three arms have
beveled or fiducial edges. The fiducial edge of the central fixed arm corresponds to the zero of
the circle. The fiducial edges of the two moving arms can be set to any desired reading and
can be clamped in position. They are also provided with verniers and slow motion screws to
set the angle very precisely. To plot position of P, the movable arms are clamped to read the
angles α and β very precisely. The station pointer is then moved on the plan till the three
fiducial edges simultaneously touch A, B and C. The centre of the pointer then represents the
position of P which can be recorded by a prick mark.

2. Graphical Solutions
(a) First Method:
Let a, b and c be the plotted positions of the shore signals A, B and C respectively and
let α and β be the angles subtended at the boat. The point p of the boat position p can be
obtained as under :
1. Join a and c.
2. At a, draw ad making an angle β with ac. At c, draw cd making an angle α with ca. Let
both these lines meet at d.
3. Draw a circle passing through the points a, d and c.
4. Join d and b, and prolong it to meet the circle at the point p which is the required
position of the boat.
Proof. From the properties of a circle,
apd = acd = α and cpd = cad = β
which is the required condition for the solution.
(b) Second Method:
From a and b, draw lines AO1 and BO1 each making an angle (90° - α) with ab on
the side towards p. Let them intersect at 01.
1. Similarly, from b and c, draw lines ================ each making an angle (90° -
β) with ab on the side towards p. Let them intersect at --.
2. With – as the centre, draw a circle to pass through a and b. Similarly, with – as the
centre draw a circle to pass through b and c. Let both the circles intersect each other at
a point p. p is then the required position of the boat.
Proof. ao1b = 180° - 2 (90° - α) = 2α
apb = ½ ao1b = α
Similarly, bo2c = 180° - 2 (90° - β) = 2β
and bpc = ½ bo2c = β.
The above method is sometimes known as the method of two intersecting circles.
(c) Third Method :
1. Join ab and bc.
2. At a and c, erect perpendiculars ad and ce.
3. At b, draw a line bd subtending angle (90° - α) with ba, to meet the perpendicular
through a in d.
4. Similarly, draw a line be subtending an angle (90° - β) with bc, to meet the
perpendicular through c in e.

5. Join d and e.
6. Drop a perpendicular on de from b. The foot of the perpendicular (i.e. p) is then the
required position of the boat.
9. What are tides? Explain its types and formation.
All celestial bodies exert a gravitational force on each other. These forces of attraction
between earth and other celestial bodies (mainly moon and sun) cause periodical variations in
the level of a water surface, commonly known as tides. There are several theories about the
tides but none adequately explains all the phenomenon of tides. However, the commonly used
theory is after Newton, and is known as the equilibrium theory. According to this theory, a
force of attraction exists between two celestial bodies, acting in the straight line joining the
centre of masses of the two bodies, and the magnitude of this force is proportional to the
product of the masses of the bodies and is inversely proportional to the square of the distance
between them. We shall apply this theory to the tides produced on earth due to the force of
attraction between earth and moon. However, the following assumptions are made in the
equilibrium theory :
1. The earth is covered all round by an ocean of uniform depth.
2. The ocean is capable of assuming instantaneously the equilibrium , required by the tide
producing forces. This is possible if we neglect (i) inertia of water, (ii) viscosity of water,
and (iii) force of attraction between parts of itself.

1. The Lunar Tides
(a) shows the earth and the moon, with their centres of masses O1 and O2 respectively.
Since moon is very near to the earth, it is the major tide producing force. To start with, we
will ignore the daily rotation of the earth on its axis. Both earth and moon attract each other,
and the force of attraction would act along O1O2. Let O be the common centre of gravity of
earth and moon. The earth and moon revolve monthly about O, and due to this revolution
their separate positions are maintained. The distribution of force is not uniform, but it is more
for the points facing the moon and less for remote points. Due to the revolution of earth about
the common centre of gravity O, centrifugal force of uniform intensity is exerted on all the
particles of the earth. The direction of this centrifugal force is parallel to O1O2 and acts
outward. Thus, the total force of attraction due to moon is counter-balanced by the total
centrifugal force, and the earth maintains its position relative to the moon. However, since
the fore of attraction is not uniform, the resultant force will very all along. The resultant
forces are the tide producing forces. Assuming that water has no inertia and viscosity, the
ocean enveloping the earth’s surface will adjust itself to the unbalanced resultant forces,
giving rise to the equilibrium. Thus, there are two lunar tides at A and B, and two low water
positions at C and D. The tide at A is called the superior lunar tide or tide of moon’s upper
transit, While tide at B is called inferior or antilunar tide.
Now let us consider the earth’s rotation on its axis. Assuming the moon to remain
stationary, the major axis of lunar tidal equilibrium figure would maintain a constant position.
Due to rotation of earth about its axis from west to east, once in 24 hours, point A would
occupy successive position C, B and D at intervals of 6 h. Thus, point A would experience
regular variation in the level of water. It will experience high water (tide) at intervals of 12 h
and low water midway between. This interval of 6 h variation is true only if moon is assumed
stationary. However, in a lunation of 29.53 days the moon makes one revolution relative to
sun from the new moon to new moon. This revolution is in the same direction as the diurnal
rotation of earth, and hence there are 29.53 transits of moon across a meridian in 29.53 mean
solar days. This is on the assumption that the moon does this revolution in a plane passing
through the equator. Thus, the interval between successive transits of moon or any meridian
will be 24 h, 50.5 m. Thus, the average interval between successive high waters would be

about 12 h 25 m. The interval of 24 h 50.5 m between two successive transits of moon over a
meridian is called the tidal day.
2. The Solar Tides
The phenomenon of production of tides due to force of attraction between earth and sun is
similar to the lunar tides. Thus, there will be superior solar tide and an inferior or anti-solar
tide. However, sun is at a large distance from the earth and hence the tide producing force due
to sun is much less.
Solar tide = 0.458 Lunar tide.
3. Combined effect : Spring and neap tides
Solar tide = 0.458 Lunar tide.
Above equation shows that the solar tide force is less than half the lunar tide force.
However, their combined effect is important, specially at the new moon when both the sun
and moon have the same celestial longitude, they cross a meridian at the same instant.
Assuming that both the sun and moon lie in the same horizontal plane passing through the
equator, the effects of both the tides are added, giving rise to maximum or spring tide of new
moon. The term ‘spring’ does not refer to the season, but to the springing or waxing of the
moon. After the new moon, the moon falls behind the sun and crosses each meridian 50
minutes later each day. In after 7 ½ days, the difference between longitude of the moon and
that of sun becomes 90°, and the moon is in quadrature . The crest of moon tide coincides
with the trough of the solar tide, giving rise to the neap tide of the first quarter. During the
neap tide, the high water level is below the average while the low water level is above the
average. After about 15 days of the start of lunation, when full moon occurs, the difference
between moon’s longitude and of sun’s longitude is 180°, and the moon is in opposition.
However, the crests of both the tides coincide, giving rise to spring tide of full moon. In about
22 days after the start of lunation, the difference in longitudes of the moon and the sun
becomes 270° and neap tide of third quarter is formed. Finally, when the moon reaches to its
new moon position, after about 29 ½ days of the previous new moon, both of them have the

same celestial longitude and the spring tide of new moon is again formed making the
beginning of another cycle of spring and neap tides.
4. Other Effects
The length of the tidal day, assumed to be 24 hours and 50.5 minutes is not constant
because of (i) varying relative positions of the sun and moon, (ii) relative attraction of the sun
and moon, (iii) ellipticity of the orbit of the moon (assumed circular earlier) and earth, (v)
declination (or deviation from the plane of equator) of the sun and the moon, (v) effects of the
land masses and (vi) deviation of the shape of the earth from the spheroid. Due to these, the
high water at a place may not occur exactly at the moon’s upper or lower transit. The effect of
varying relative positions of the sun and moon gives rise to what are known as priming of tide
and lagging of tide.
At the new moon position, the crest of the composite tide is under the moon and
normal tide is formed. For the positions of the moon between new moon and first quarter, the
high water at any place occurs before the moon’s transit, the interval between successive high
water is less than the average of 12 hours 25 minutes and the tide is said to prime. For
positions of moon between the first quarter and the full moon , the high water at any place
occurs after the moon transits, the interval between successive high water is more than the
average , and tide is said to lag. Similarly, between full moon and 3rd quarter position, the
tide primes while between the 3rd quarter and full moon position, the tide lags. At first
quarter, full moon and third quarter position of moon, normal tide occurs.
Due to the several assumptions made in the equilibrium theory, and due to several
other factors affecting the magnitude and period of tides, close agreement between the results
of the theory, and the actual field observations is not available. Due to obstruction of land
masses, tide may be heaped up at some places. Due to inertia and viscosity of sea water,
equilibrium figure is not achieved instantaneously. Hence prediction of the tides at a place
must be based largely on observations.

10. What is mean sea level? Explain why it is used as datum.
For all important surveys, the datum selected is the mean sea level at a certain place.
The mean sea level may be defined as the mean level of the sea, obtained by taking the mean
of all the height of the tide, as measured at hourly intervals over some stated period covering a
whole number of complete tides, The mean sea level, defined above shows appreciable
variations from day to day, from month to month and from year to year. Hence the period for
which observations should be taken depends upon the purpose for which levels are required.
The daily changes in the level of sea may be more. The monthly changes are more or less
periodic. The mean sea level in particular month may be low while it may be high in some
other moths. Mean sea level may also show appreciable variations in its annual values. Due to
variations in the annual values and due to greater accuracy needed in modern geodetic
levelling, it is essential to base the mean sea level on observations extending over a period of
about 19 years. During this period, the moon’s nodes complete one entire revolution. The
height of mean sea level so determined is referred to the datum of tide gauge at which the
observations are taken. The point or place at which these observations are taken is known as a
tidal station. If the observations are taken on two stations, situated say at a distance of 200 to
500 kms on an open coast, one of the station is called primary tidal station while the other is
called secondary tidal station. Both the stations may then be connected by a line of levels.
11. Explain Cartographic concepts and techniques.
Cartography is about maps. This includes the art, science and technology of map
making, the use of maps as research tools and as sources of information, and the study of
maps as historical documents and works of art.
Definition of Cartography
Cartography has always been closely associated with Geography and Surveying. Its
recognition as a distinct discipline is relatively recent. Scientific journals dealing with
Cartography began to appear in the middle of the twentieth century. Numerous definitions of
Cartography have appeared in the literature. Earlier definitions tend to emphasize map making
while more recent definitions also include map use within the scope of Cartography.

More often than not, the map user is different from the map maker and the map maker rarely
collects the original data. Recognition of this has led to a redefinition of Cartography which is
based in part on work by communications theorists. In this context, Cartography is viewed as
being concerned with a particular form of communications process which relies on graphic
images, i.e. maps, to convey information about data and the spatial relationships between
them, e.g. a geographic environment. The cartographer is the map maker. The map is the
communications medium. The data may be about towns, temperatures, bedrock, people,
crops, water depths, algae growth patterns, the stars, or even about cellular structure, neural
networks, or DNA. The map represents the spatial relationships among the individual pieces
of data. The map user "reads" the map and interprets its information content in the context of
his or her own objectives and knowledge of the environment or spatial pattern which the map
describes.
Scope of Cartography
Cartography is the art, science and technology of map making and map use, and the study of
maps in all its aspects.
Cartographic Communication
Several models of cartographic communication have been proposed. While differing in detail,
the models share a common recognition of the separation between map making and map use
but emphasize the close relationship between these processes by treating them as components
of a communication system. Effective use of maps requires understanding of the nature of
maps and the mapping process while good map design requires understanding of how the
maps will be used. The communications model also serves to emphasize that map use is not
simply the reverse of map making but requires a distinct set of skills.Cartographic
Communication Process

Cartographic communication is a special form of graphic communication which differs from
verbal communication. Verbal communication is sequential. Ideas are presented in a
sequential fashion, allowing the writer or speaker to control the order in which information is
conveyed. The emphasis is on parts linked by logic. In contrast, maps are synoptic, presenting
information in a holistic fashion. The map user receives all of the information at once. Thus
the map maker is unable to control the order in which information is received except by using
map design to emphasize the most important information.
Cartographic Processes
The communications model of Cartography emphasizes that maps are used by a wide range of
users for many different purposes. The role of the cartographer in the communications process
is primarily associated with map making. However, the cartographer must have a good
understanding of the subject matter of the map as well as a good understanding of how the
map is likely to be used in order to design an effective map.

Map Making
While there are many steps involved in the map making process, they can be grouped into
three main stages: data collection, organization, and manipulation; map design and artwork
preparation; and map reproduction.
1) Collection, Organization and Manipulation of Data
Data must be collected from existing maps, aerial photographs or digital imagery, documents,
e.g. legal descriptions of property boundaries, historical documents, etc., field work or
questionnaire surveys. The data must be organized so that we can understand whatever
phenomena are being represented and the data must be manipulated into a form which is
suitable for mapping. This may involve aggregating data to some specified set of spatial units,
calculating percentages, densities or other summary measures from the raw data.
Example. When Champlain crossed the Lake Ontario basin in 1615 he was accompanied by
French Cartographers (people who collected data to make maps - we would now call them
surveyors). They recorded: offshore soundings, the condition of inlets and potential harbours,
rivers and their navigability, and shoreline conditions. Other types of data such as roads or
trails and native settlements were not shown since they wanted to represent Canada as a
pristine environment waiting to be settled.
Data have to be organized and simplified to ensure effective communication. If the map
contains too much detail it will be difficult to read and understand so it is not a good map. But
it must contain enough detail to get the required idea across. What you leave out is often as
important as what you put in.
Example Even using topographic data collected by surveyors, the cartographer still has to
decide which contours will be included on the map. For a map of Denmark or the Netherlands
where most land is below 50m, a contour interval of 5m or perhaps even 1m might be
appropriate whereas in the Himalayas, with elevations of up to 8000m, a much larger contour
interval would be required to produce a legible map.

2) Design and Preparation of Maps, Charts, Plans and Graphs
Many decisions go into the design of an effective map. These include the selection of the
geographic features and thematic attributes to be represented on the map. These choices
depend upon the purpose of the map, the intended audience, and the cartographer's
understanding of the phenomena being represented. For maps of large areas such as
provinces, countries, continents or the world, it is important to choose an appropriate map
projection which minimizes distortion of the geometric properties of the region being mapped.
Determination of the level of detail required, given the purpose of the map, is a critical
decision which is closely related to the choice of map scale. A small scale map can show a
large area but little detail while a large scale map shows a smaller area but with more detail.
Example. Road maps can be produced at a variety of scales. A road map of Ontario might use
a scale of 1: 750,000 and show highways and major regional roads. A road map of Kitchener-
Waterloo might use a scale of 1:25,000 and show all roads as double line rather than single
line features.
Different scales imply different degrees of generalization of the features shown on the map.
For example, if you compare the contour lines on a map at a scale of 1:250,000 with those on
a map of the same area at a scale of 1:50,000, you will find that contours on the two maps are
quite different. The 1:250,000 scale map will use a larger contour interval, have fewer contour
lines, and will simplify the shapes of complex features. Minor features of the landscape may
be omitted altogether. Thus in using maps, it is important to consider what level of detail is
appropriate and therefore what scale of map is needed.
Designing the map also includes consideration of how the information will be symbolized. Do
you show the data in colour or not? Can you afford to reproduce the map in colour? Are the
data qualitative or quantitative? Do the data represent a continuous, stepped or discrete
surface? Will you represent the data using point, line or area symbols? How will you arrange
the map itself as well as items such as title blocks, legends, and scale symbols on the page?
Example . For examples of well designed and well executed maps, see the Historical Atlas of
Canada produced by Matthews who is a cartographer at the University of Toronto. Matthews

is a true creative genius who worked with a group of academics to produce a series of essays
about different periods of Canadian history from 12,000 B.C. to the present in three volumes.
They didn't just write the essays but they mapped all the related data. Very, very hard! Think
about it. You are asked to write an essay on the fur trade, immigration, housing styles, or
French expansion. Then you are asked to produce a map instead of an essay but it must
explain the same thing. The result makes fascinating reading for anyone interested in
Cartography or Canadian history.
3) Map Reproduction
Map reproduction methods act as a constraint on the map design process. How many copies
of the map will be required? This is the major determinant of the reproduction methods used.
Black and white and colour laser printing and Xeroxing technology are cost effective if only a
few copies are required. If large numbers of maps are required then offset printing may be the
only practical alternative. In some instances, distribution of maps in digital format on tape,
disk or CD-ROM is replacing or at least reducing the need for printed maps.
Map Use
Map use is a learned process which requires use of a variety of skills. In order to use maps
effectively, you must understand the rules and conventions governing cartographic
representation of information. Otherwise, it will be difficult to extract meaning from maps.
Cartographic Steps
Step 1Consider what the real world distribution of the
phenomenon might look like
Step 2Determine the purpose of the map and its intended
audience
Step 3 Collect data appropriate for the map's purpose
Step 4 Design and construct the map
Step 5Determine whether users find the map useful and
informative
12. Explain the recent trends in cartography.
Web cartography can be considered a trend in cartography. However there are other
recent trends that affect cartography and the way web cartography is developing. These have
to do with the impact of visualisation and the need for interactivity and dynamics as well as
the widespread use of geographical information systems resulting in many more maps being
produced by many more people. In the context of geospatial data handling, the cartographic
visualisation process is considered to be the translation or conversion of geospatial data from
a database into map-like products. This process is guided by the saying "How do I say what to
whom, and is it effective?"
The above developments have given the word visualisation an enhanced meaning.
According to the dictionary, it means 'make visible' and it can be argued that this has always
been the business of cartographers. However, progress in other disciplines has linked the word
to more specific ways in which modern computer technology can facilitate the process of
'making visible' in real time. This results in visualisation for presentation and exploration.
Presentation fits into the traditional realm of cartography, where the cartographer works on
known geospatial data and creates communicative maps. These maps are often created for
multiple uses. Exploration, however, often involves a discipline expert creating maps while
dealing with unknown data. These maps are generally for a single purpose, expedient in the
expert's attempt to solve a problem. While dealing with the data, the expert should be able to
rely on cartographic expertise, provided by the software or some other means.
In the past cartography played an important role in the exploration of the world. Maps
were used to chart unknown territories. A new phase in mapping the unknown has recently
started. This does not refer to the cartographic or geographic exploration discussed in the
previous paragraph. It deals with the mapping of cyberspace.