environment.gov.au · Web viewDepartment of Sustainability, Environment, Water, Population and...
114
M ARSDEN JACOB ASSO CIATES Final Report 3 September 2012 Literature Review of the Economic Value of Ecosystem Services that Wetlands Provide Final Report prepared for the Department of Sustainability, Environment, Water, Population and Communities
Transcript of environment.gov.au · Web viewDepartment of Sustainability, Environment, Water, Population and...
MARSDEN JACOB ASSOCIATES
Final Report
3 September 2012
Literature Review of the Economic Value of Ecosystem Services that Wetlands Provide
Final Report prepared for the Department of Sustainability, Environment, Water, Population and Communities
MARSDEN JACOB ASSOCIATES
Marsden Jacob AssociatesFinancial & Economic Consultants
ABN 66 663 324 657ACN 072 233 204
Internet: http://www.marsdenjacob.com.auE-mail: [email protected]
Perth office:Level 1, 220 St Georges Terrace, Perth Western Australia, 6000 AUSTRALIATelephone: +61 8 9324 1785Facsimile: +61 8 9322 7936
Melbourne office:Postal address: Level 3, 683 Burke Road, CamberwellVictoria 3124 AUSTRALIATelephone: +61 3 9882 1600Facsimile: +61 3 9882 1300
Brisbane office:Level 14, 127 Creek Street, BrisbaneQueensland, 4000 AUSTRALIATelephone: +61 7 3229 7701Facsimile: +61 7 3229 7944
Sydney office:Rod CarrTelephone: +61 418 765 393
Authors: Kym Whiteoak (MJA)[email protected] Jim Binney (MainStream Eco)[email protected]
This report has been prepared in accordance with the scope of services described in the contract or agreement between Marsden Jacob Associates Pty Ltd ACN 072 233 204 (MJA) and the Client. Any findings, conclusions or recommendations only apply to the aforementioned circumstances and no greater reliance should be assumed or drawn by the Client. Furthermore, the report has been prepared solely for use by the Client and Marsden Jacob Associates accepts no responsibility for its use by other parties.
Copyright © Marsden Jacob Associates Pty Ltd 2012Discussed
DisclaimerThe views and opinions expressed in this publication are those of the authors and do not necessarily reflect those of the Australian Government or the Minister for Sustainability, Environment, Water, Population and Communities.While reasonable efforts have been made to ensure that the contents of this publication are factually correct, the Commonwealth does not accept responsibility for the accuracy or completeness of the contents, and shall not be liable for any loss or damage that may be occasioned directly or indirectly through the use of, or reliance on, the contents of this publication.
MARSDEN JACOB ASSOCIATES
TABLE OF CONTENTSPage
Glossary..............................................................................................i
Executive Summary.............................................................................i
1. Introduction and background.........................................................11.1 Context................................................................................................................11.2 Project purpose and report structure...................................................................2
2. Ecosystem services from wetlands.................................................42.1 Wetland classification and functions...................................................................42.2 Ecosystem services – types and examples..........................................................62.3 Ecosystem services – other issues.......................................................................72.4 Gaps in biophysical information........................................................................12
3. Economic valuation of ecosystem services....................................143.1 Total economic value (TEV)...............................................................................143.2 Valuation methodologies...................................................................................173.3 Case studies......................................................................................................333.4 Gaps in economic valuation...............................................................................41
4. Implications for policy.................................................................454.1 Activity to date..................................................................................................454.2 Use of wetland economic valuation estimates..................................................454.3 A way forward?..................................................................................................46
5. References..................................................................................48
Appendix A: Valuation examples from the international and national literature....................................................................................52
LIST OF TABLES Page
Table 1: Wetland ecosystem services.......................................................................................7Table 2: Ramsar criteria and ecosystem services provision...................................................10Table 3: Methods of Benefit Transfer......................................................................................30Table 4: Strengths and weaknesses of valuation techniques.................................................31Table 5: Attributes used...........................................................................................................34Table 6: Key risk to Moreton Bay – growth in pollution loads..................................................37Table 7: Wetland and waterway ecosystem services – South East Queensland (SEQ)...........39Table 8: Wetland ecosystem services, values and valuation techniques...............................43Table 9: Attributes in choice sets, Choice Modelling (CM) study of habitat values for wetlands, scrublands and grassy woodlands in SA..................................................................................60Table 10: Implicit prices for habitat (per household) per 1000 ha, each year for 5 years.......61Table 11: Average Willingness to Pay (WTP) estimates for non-use values of wetlands.........64Table 12: Contingent Valuation (CV) survey Willingness to Pay (WTP), United Kingdom wetlands..................................................................................................................................67

MARSDEN JACOB ASSOCIATES
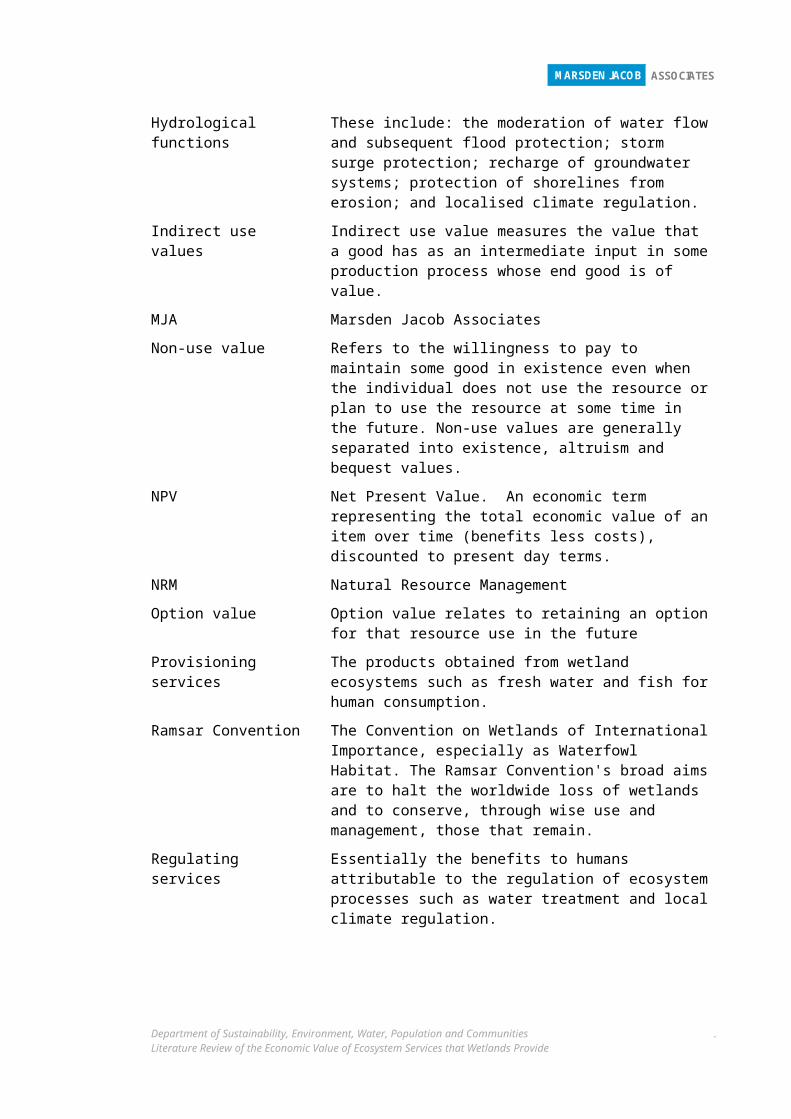
GlossaryAltruism value The preference of the individual for others of the current
generation to enjoy and benefit from a resource, even if the individual professing the value does not use the resource themselves.
Bequest value The preference of the individual for others of future generations to enjoy and benefit from a resource, even if the individual professing the value does not use the resource themselves.
Biogeochemical functions These include: carbon sequestration and storage; water quality treatment; nutrient export and the subsequent impact on aquatic food chains.
Cultural services Typically non-material benefits received by people from direct and indirect interactions with wetlands such as recreation, aesthetic values, spiritual benefits (e.g. Indigenous connections with wetlands) and enhancements in knowledge
Direct use values Direct use values measure the willingness to pay for the good as a final consumption good.
Ecosystem services Ecosystem goods (such as food) and services (such as waste assimilation) that represent the benefits human populations derive, directly or indirectly, from ecosystem functions
EPBC Environment Protection and Biodiversity Conservation Act
Existence value Existence value refers to the willingness to pay to keep a good in existence in the context where the individual expressing the value has no actual or planned use of the resource for herself, or for anyone else.
Habitat functions These include: support for biodiversity (flora and fauna).
Hydrological functions These include: the moderation of water flow and subsequent flood protection; storm surge protection; recharge of groundwater systems; protection of shorelines from erosion; and localised climate regulation.
Indirect use values Indirect use value measures the value that a good has as an intermediate input in some production process whose end good is of value.
MJA Marsden Jacob Associates
Non-use value Refers to the willingness to pay to maintain some good in existence even when the individual does not use the resource or plan to use the resource at some time in the future. Non-use values are generally separated into existence, altruism and bequest values.
Department of Sustainability, Environment, Water, Population and CommunitiesLiterature Review of the Economic Value of Ecosystem Services that Wetlands Provide
.

MARSDEN JACOB ASSOCIATES
NPV Net Present Value. An economic term representing the total economic value of an item over time (benefits less costs), discounted to present day terms.
NRM Natural Resource Management
Option value Option value relates to retaining an option for that resource use in the future
Provisioning services The products obtained from wetland ecosystems such as fresh water and fish for human consumption.
Ramsar Convention The Convention on Wetlands of International Importance, especially as Waterfowl Habitat. The Ramsar Convention's broad aims are to halt the worldwide loss of wetlands and to conserve, through wise use and management, those that remain.
Regulating services Essentially the benefits to humans attributable to the regulation of ecosystem processes such as water treatment and local climate regulation.
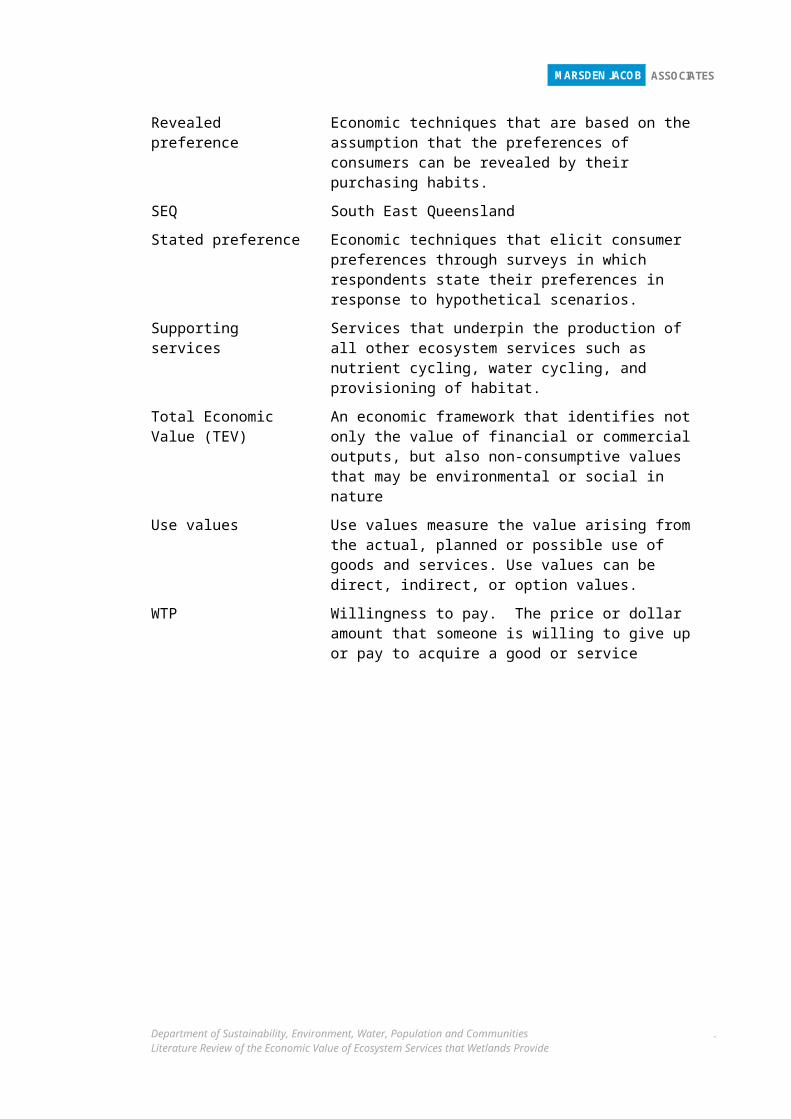
Revealed preference Economic techniques that are based on the assumption that the preferences of consumers can be revealed by their purchasing habits.
SEQ South East Queensland
Stated preference Economic techniques that elicit consumer preferences through surveys in which respondents state their preferences in response to hypothetical scenarios.
Supporting services Services that underpin the production of all other ecosystem services such as nutrient cycling, water cycling, and provisioning of habitat.
Total Economic Value (TEV) An economic framework that identifies not only the value of financial or commercial outputs, but also non-consumptive values that may be environmental or social in nature
Use values Use values measure the value arising from the actual, planned or possible use of goods and services. Use values can be direct, indirect, or option values.
WTP Willingness to pay. The price or dollar amount that someone is willing to give up or pay to acquire a good or service
Department of Sustainability, Environment, Water, Population and CommunitiesLiterature Review of the Economic Value of Ecosystem Services that Wetlands Provide
.
MARSDEN JACOB ASSOCIATES
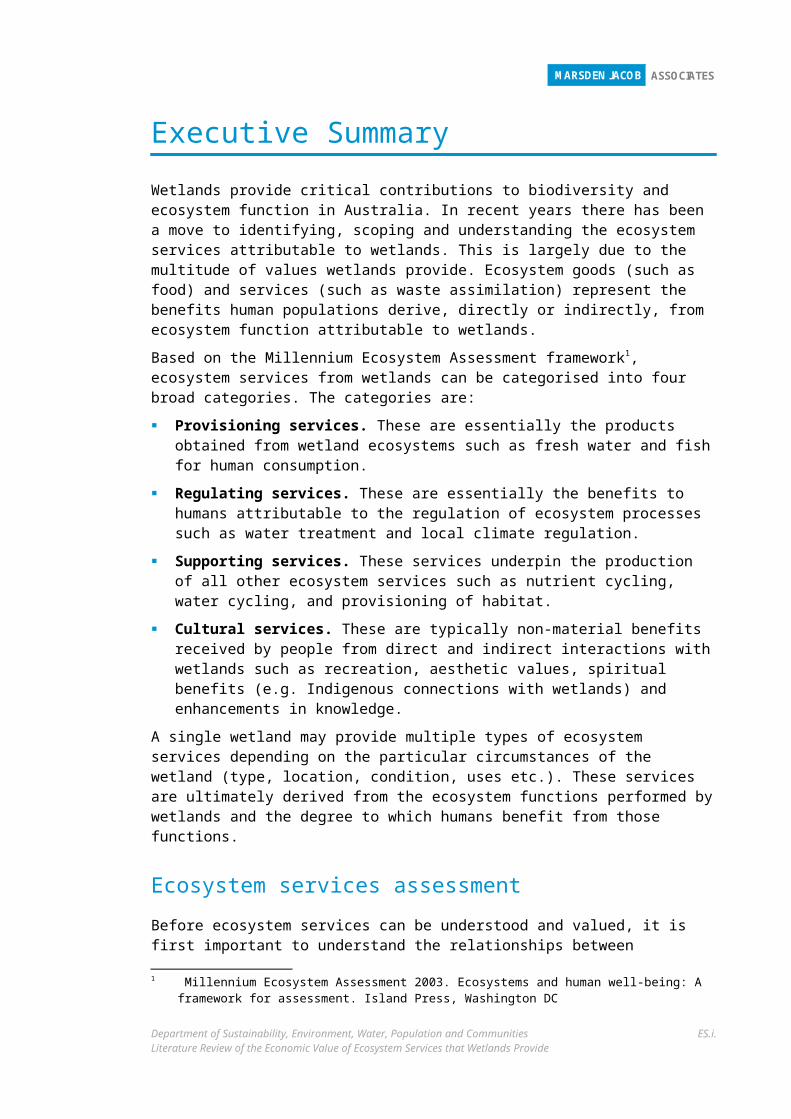
Executive Summary Wetlands provide critical contributions to biodiversity and ecosystem function in Australia. In recent years there has been a move to identifying, scoping and understanding the ecosystem services attributable to wetlands. This is largely due to the multitude of values wetlands provide. Ecosystem goods (such as food) and services (such as waste assimilation) represent the benefits human populations derive, directly or indirectly, from ecosystem function attributable to wetlands.
Based on the Millennium Ecosystem Assessment framework1, ecosystem services from wetlands can be categorised into four broad categories. The categories are:
Provisioning services. These are essentially the products obtained from wetland ecosystems such as fresh water and fish for human consumption.
Regulating services. These are essentially the benefits to humans attributable to the regulation of ecosystem processes such as water treatment and local climate regulation.
Supporting services. These services underpin the production of all other ecosystem services such as nutrient cycling, water cycling, and provisioning of habitat.
Cultural services. These are typically non-material benefits received by people from direct and indirect interactions with wetlands such as recreation, aesthetic values, spiritual benefits (e.g. Indigenous connections with wetlands) and enhancements in knowledge.
A single wetland may provide multiple types of ecosystem services depending on the particular circumstances of the wetland (type, location, condition, uses etc.). These services are ultimately derived from the ecosystem functions performed by wetlands and the degree to which humans benefit from those functions.
Ecosystem services assessmentBefore ecosystem services can be understood and valued, it is first important to understand the relationships between wetlands, their functions, and the services that are provided – in other words, a biophysical understanding of wetlands is a prerequisite to valuing ecosystems services.
Since 2009, 17 updated ecological character descriptions and management plans have been completed for key Australian wetlands and made public on the Department’s website.2 A number of those reports include available information on ecosystem services.3 These updated character descriptions provide information (including some quantitative information) on:
the key site attributes (ecosystem components and processes);
1 Millennium Ecosystem Assessment 2003. Ecosystems and human well-being: A framework for assessment. Island Press, Washington DC
2 For a list of completed assessments and other relevant documents see: http://www.environment.gov.au/water/publications/environmental/wetlands/index.html
3 For example see: Cibilic, A. and White, L., (2011) Ecological Character Description for Little Llangothlin Nature Reserve, a Wetland of International Importance. Report prepared for the Department of Sustainability, Environment, Water, Population and Communities, Canberra, by WetlandCare Australia, Ballina, NSW and DSEWP&C (2012) East Coast Cape Barren Island Lagoons Ramsar Site Ecological Character Description.
Department of Sustainability, Environment, Water, Population and CommunitiesLiterature Review of the Economic Value of Ecosystem Services that Wetlands Provide
ES.i.
MARSDEN JACOB ASSOCIATES
qualitative descriptions of benefits and ecosystem services where known, including high level classification of ecosystem services by type (e.g. provisioning, regulating etc);
an overview of critical wetland components and processes;
limits of acceptable change (indicating potential thresholds before ecosystem services are materially impacted);
risks to wetland condition; and the assessment of trends since designation; and
key knowledge gaps and monitoring needs.
Importantly, these documents provide a valuable starting point for the identification, scoping and ultimately the valuation of ecosystem services. However, it should still be understood that these reports are primarily focussed on biophysical descriptions of processes and values. They are not designed as inputs for economic analysis.
Further work providing sound biophysical, social and economic information on wetlands is required to understand:
the extent and condition of wetlands, which has formed much of the focus of prior research and analysis used for designation purposes;
the drivers of risks and stressors to those wetlands (e.g. competing land use, climate change, over fishing etc.).4 These are generally known, but thresholds will exist that will have a major influence on the economic values of ecosystem services. These issues are covered in some recent ecological character descriptions. However, quantitative enumeration of risks is uncommon;
the types of ecosystem functions derived from those wetlands, their extent and how they relate to the provision of different ecosystem services (sometime qualitatively described in ecological character descriptions); and
key ecological response functions, particularly where the impacts of incremental change are understood. This is rarely known in any quantitative sense.5
Further work would be required to develop biophysical information on ecosystem services of Australian wetlands for use in economic valuation.
An initial focus of further work should be on a more detailed and scientifically rigorous typology of ecosystem functions derived from different wetland categories and the suite of ecosystem services that flow from them. Then the focus should be on the ecological response functions that underpin changes in the level of ecosystem services provided.
This would essentially be an extension of the work already being undertaken for the ecological character descriptions across Australian Ramsar sites. Specifically, this would require a move to a more quantitative enumeration of information, processes, and functions than is currently included in the ecological character descriptions. It would also require a more dedicated process of involving economists and social scientists in the development of ecological character descriptions, incorporating the express purpose of quantification of ecosystem service valuation.
4 Davis, J., & Brock, M. (2008). Detecting unacceptable change in the ecological character of Ramsar wetlands. Ecological Management & Restoration, 9(1), 26-32.
5 MacDonald, D. D. (2010). Valuing biodiversity using habitat types. Australasian Journal Of Environmental Management, 17(4), 235-243.
Department of Sustainability, Environment, Water, Population and CommunitiesLiterature Review of the Economic Value of Ecosystem Services that Wetlands Provide
ES.ii.
MARSDEN JACOB ASSOCIATES
Once this information is available, a robust process of analysis of the ecosystem services derived from wetlands and the respective economic values of wetlands can be established. This system would build on and add value to the existing processes undertaken for the development of ecological character descriptions and management plans.
Economic valuationEconomic valuation of ecosystem services provides an opportunity to drive prioritisation and investment decisions by understanding the relative benefits that alternative investments produce. This requires a rigorous and defensible framework for understanding different values that is compatible with ecosystem services concepts.
The most common framework for understanding the full economic value of environmental resources such as wetlands is the Total Economic Value (TEV) framework. The TEV framework identifies not only the value of financial or commercial outputs, but also non-consumptive values that may be environmental or social in nature (Figure 1).
Figure 1: Total Economic Value framework
Source: MJA analysis based on Freeman, 2003
Based on the review of literature we have identified and reconciled the key types of ecosystem services, the types of values and valuation techniques. The key points to note are:
a single ecosystem service may provide multiple types of economic values;
the economic values could be estimated using numerous techniques, and the choice of technique would be determined by the data availability, resources for the assessment and the likely use of the data (i.e. what sort of purpose); and
there tend to be commonalities of economic values and valuation techniques for specific types of ecosystem functions. For example, many provisioning ecosystem services (such as fish habitat) have been estimated using the avoided cost method while supporting services (such as biodiversity) have been estimated using approaches such as choice modelling.
Department of Sustainability, Environment, Water, Population and CommunitiesLiterature Review of the Economic Value of Ecosystem Services that Wetlands Provide
ES.iii.
Total Economic Value
Use Values Non-use Values
Direct use(fish catch, fuel wood)
Option(genetic material)
For othersExistence values
(protection of endangered species)
Altruism values(healthy
environment)
Bequest values(species protection
for subsequent generations)
Indirect use(water
filtration, flood control)
MARSDEN JACOB ASSOCIATES
MJA reviewed the Australian and international literature on wetland economic valuation, with a prioritisation of work in the Australian context, and found the following:
the majority of economic valuation work undertaken on Australian wetland ecosystem services relates to supporting (biodiversity) values and to a lesser extent cultural values (recreation and aesthetic), primarily using approaches such as choice modelling;
based on the studies reviewed within this project, it would appear that insufficient work has been done to develop a representative and transferable set of ecosystem services values to be used to support a policy agenda;
key gaps in economic valuation exist around provisioning and regulating services, using replacement cost, avoided cost (expected damage function) and production function methods; and
studies that have been undertaken in Australia appear to have focussed on a specific context or question, and may not produce results that are readily transferrable to other contexts.
While several studies have been undertaken to explore non-use values, these are not comprehensive nor guided by a specific research or policy agenda. Importantly, there have been relatively few studies of Australian wetlands undertaken to explore indirect values:
production function (especially for provisioning services);
avoided cost: terrestrial wetlands (flood mitigation, storm surge, purification);
replacement cost; and
contingent behaviour.
Most if not all applicable economic valuation techniques require advanced technical skills to achieve, and non-use valuation methods (especially contingent valuation and choice modelling) require careful preparation and execution to develop robust results. These types of studies tend to dominate the literature, but have proven difficult to incorporate into policy decisions
The existing body of economic research is a useful start, but is insufficient to present a detailed and accurate data set of the economic values of Australian wetland ecosystem services.
It may be that within a guiding Commonwealth framework, a broader strategic set of economic values can be collected over time using defensible techniques, for use in policy formation and investment decisions.
Department of Sustainability, Environment, Water, Population and CommunitiesLiterature Review of the Economic Value of Ecosystem Services that Wetlands Provide
ES.iv.
MARSDEN JACOB ASSOCIATES
1. Introduction and background 1.1 ContextThe Australian Government, through the Department of Sustainability, Environment, Water, Population and Communities (‘the Department’) develops and implements national policy, programs and legislation to protect and conserve Australia's environment and heritage. This scope includes wetlands, with Australia being a signatory to The Convention on Wetlands of International Importance, especially as Waterfowl Habitat.
The Ramsar Convention's broad aims are to halt the worldwide loss of wetlands and to conserve, through wise use and management, those that remain.
The Ramsar Convention provides a broad definition of wetlands as:
“Areas of marsh, fen, peatland or water, whether natural or artificial, permanent or temporary, with water that is static or flowing, fresh, brackish or salt, including areas of marine water the depth of which at low tide does not exceed six metres6.
Wetlands account for a wide variety of habitat types including rivers, shallow coastal waters and coral reefs.
The original emphasis of the Convention was placed upon the conservation and wise use of wetlands primarily as habitat for waterbirds. More recently, however, the Convention has broadened its scope of implementation to cover all aspects of wetland conservation and wise use, recognising wetlands as ecosystems that are extremely important for biodiversity conservation and for the well-being of human communities.
As a Contracting Party to the Convention, Australia is required to promote the conservation of Ramsar wetlands and as far as possible the wise use of all wetlands.
The definition of ‘wise use’ of wetlands was updated in 2005 to ‘the maintenance of their ecological character, achieved through the implementation of ecosystem approaches, within the context of sustainable development’.7
According to the Ramsar Strategic Plan 2009-2015, a key factor that is driving continued change, deterioration and loss of wetlands and their services, is the lack of a good understanding of the economic value of wetlands and their ecosystem services (wetland valuation) to underpin sound decision-making and trade-offs.
Wetlands provide essential ecosystem functions, and deliver important ecosystem services, including biodiversity, as well as providing significant wider benefits to society. In order to ensure the wise use of wetlands, it is important that we know the values, both costs and benefits, of our wetlands resources relating to the services provided.
This study explores the links between wetlands, ecosystem services, economic valuation of these services, and policy settings to appropriately incorporate these values in decision-making.
6 Ramsar Convention 1987, Article 1.1.7 Ramsar Convention 2005, Resolution IX.1 Annex A.
Department of Sustainability, Environment, Water, Population and CommunitiesLiterature Review of the Economic Value of Ecosystem Services that Wetlands Provide
.1.

MARSDEN JACOB ASSOCIATES
1.2 Project purpose and report structureMarsden Jacob Associates (MJA) with MainStream Eco have been commissioned by the Department to undertake a critical literature review of the ecosystem services that wetlands provide, an assessment of the economic values placed on these services, as described in current literature, and a critical review of the assessment of the methods or approaches used to value ecosystem services
In addition to providing a critical review of the literature for both ecosystem service estimation and economic valuation of ecosystem services, this study will provide advice to policy-makers in this area relating to the use of ecosystem services contents and valuation in policy, planning and investment decisions.
The remainder of this report is structured as follows:
Section 2 reviews the literature on ecosystem services, exploring wetland classification and functions, ecosystem service classification and other issues;
Section 3 explores the theory and practice of economic valuation of ecosystem services within the Total Economic Value framework, including use and non-use values, and outlining case studies; and
Section 4 explores implications for policy.
A full list of references is provided in Section 6 followed by an Appendix with detailed examples of ecosystem valuation studies.
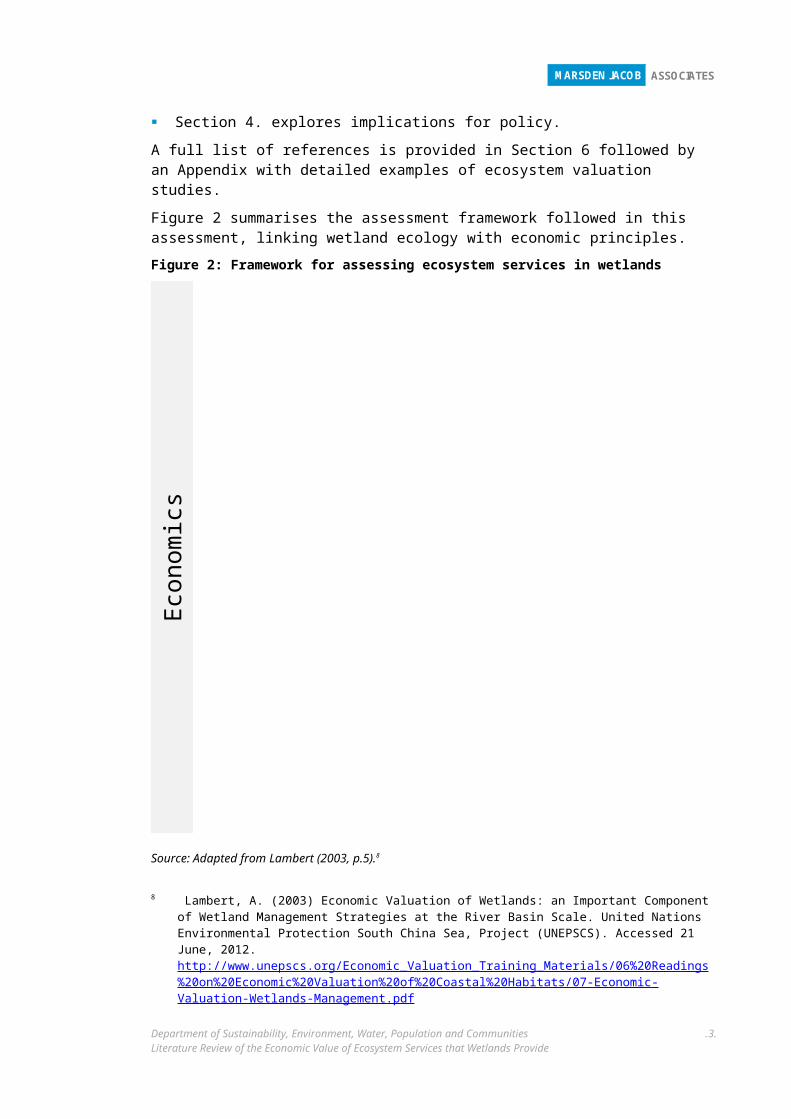
Figure 2 summarises the assessment framework followed in this assessment, linking wetland ecology with economic principles.
Department of Sustainability, Environment, Water, Population and CommunitiesLiterature Review of the Economic Value of Ecosystem Services that Wetlands Provide
.2.

MARSDEN JACOB ASSOCIATES
Figure 2: Framework for assessing ecosystem services in wetlands
Source: Adapted from Lambert (2003, p.5).8
8 Lambert, A. (2003) Economic Valuation of Wetlands: an Important Component of Wetland Management Strategies at the River Basin Scale. United Nations Environmental Protection South China Sea, Project (UNEPSCS). Accessed 21 June, 2012. http://www.unepscs.org/Economic_Valuation_Training_Materials/06%20Readings%20on%20Economic%20Valuation%20of%20Coastal%20Habitats/07-Economic-Valuation-Wetlands-Management.pdf
Department of Sustainability, Environment, Water, Population and CommunitiesLiterature Review of the Economic Value of Ecosystem Services that Wetlands Provide
.3.
Characteristicse.g. size, location, slope ,
substrate, geology, species present, water depth, pH,
dissolved oxygen, precipitation, seasonal variation
StructureBiomass, soils/sediment profile, flora and fauna
communities, etc.
ProcessesPhotosynthesis, transpiration,
biogeochemicals cycling, decomposition,
colonisation, succession, etc.
Goodse.g. agriculture, fisheries,
forestry, non-timber forest products, water
supply, recreation
Servicese.g. flood control,
groundwater, recharge, nutrient removal, toxics retention, biodiversity
maintenance
Direct Use ValuesMarket analysis, productivity loss, hedonic pricing,
travel costs, replacement and restoration costs,
contingent valuation
Indirect Use ValueDamage costs,
production functions, hedonic pricing,
defensive expenditures,
relocation, replacement &
restoration costs, contingent valuation
Non Use ValuesExistence, bequest,
philanthropy
Option Value
Non Use ValueUse Value
TOTAL ECONOMIC VALUE
Wetland Uses
Wetland Values
Wetland Functioning
Ecol
ogy
Ecol
ogy
– Ec
onom
ics
in
terf
ace
Econ
omic
s
MARSDEN JACOB ASSOCIATES
2. Ecosystem services from wetlands“Ecosystem goods (such as food) and services (such as waste assimilation) represent the benefits human populations derive, directly or indirectly, from ecosystem functions.”9
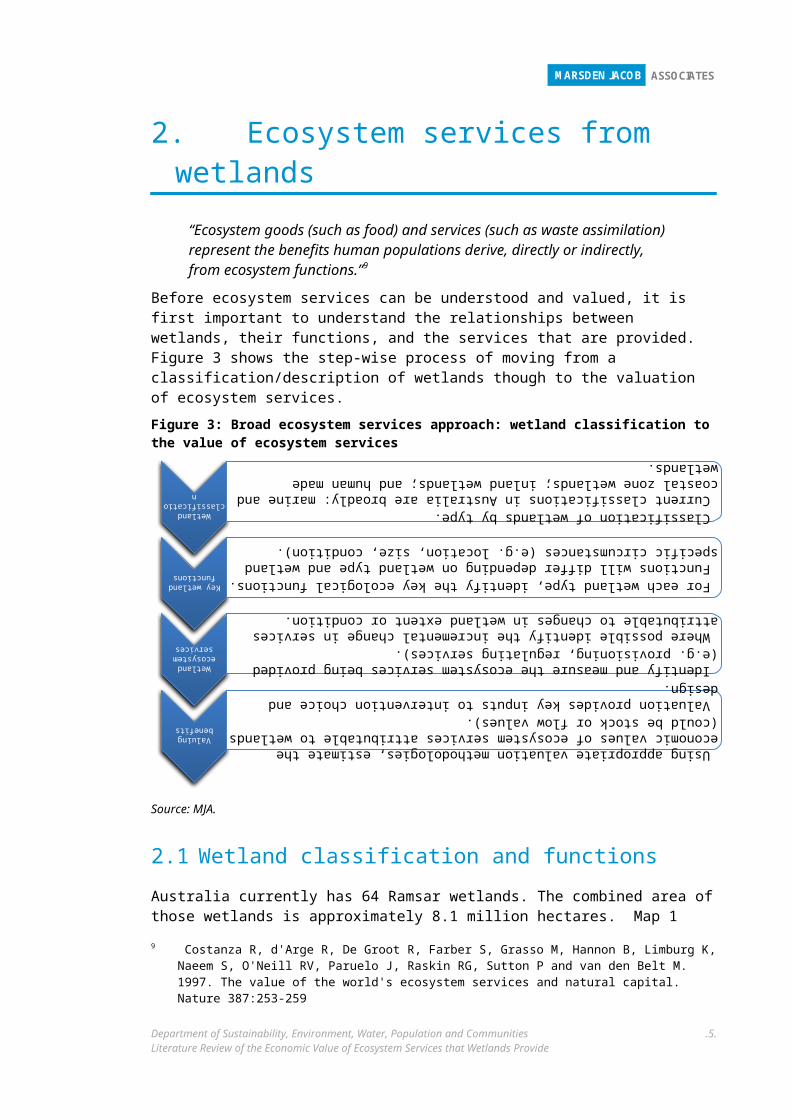
Before ecosystem services can be understood and valued, it is first important to understand the relationships between wetlands, their functions, and the services that are provided. Figure 3 shows the step-wise process of moving from a classification/description of wetlands though to the valuation of ecosystem services.
Figure 3: Broad ecosystem services approach: wetland classification to the value of ecosystem services
Source: MJA.
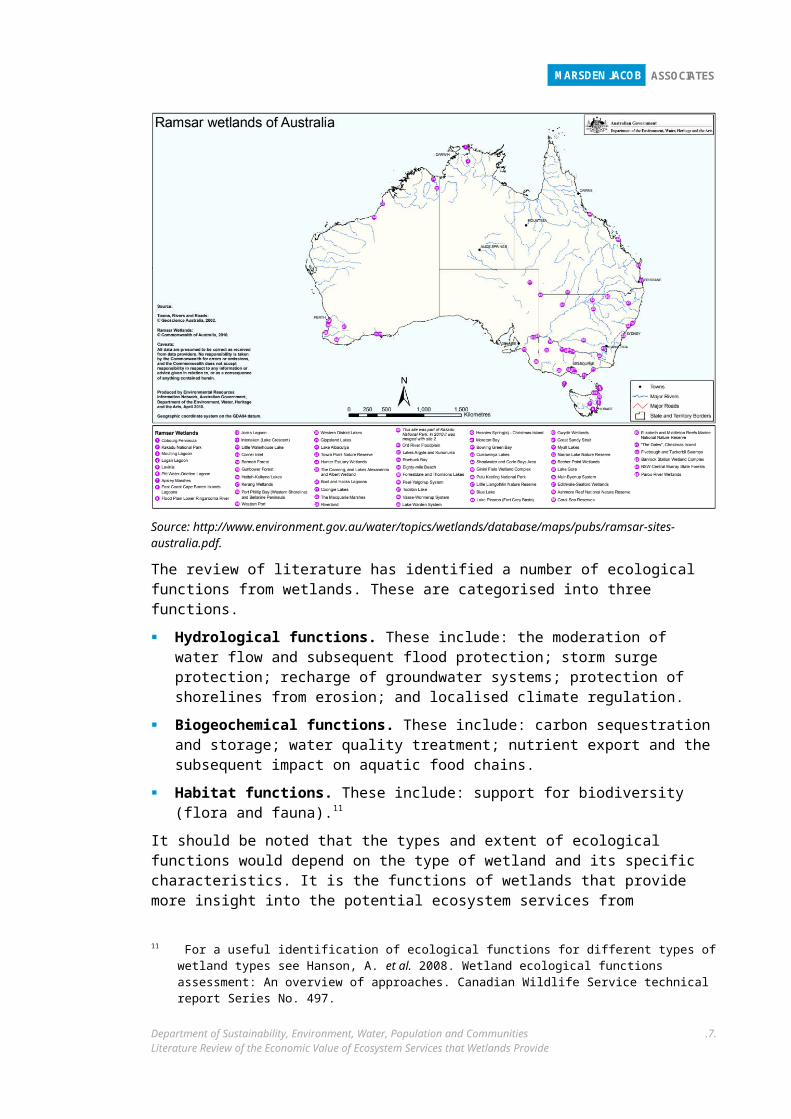
2.1 Wetland classification and functionsAustralia currently has 64 Ramsar wetlands. The combined area of those wetlands is approximately 8.1 million hectares. Map 1 shows the distribution of Ramsar wetlands across Australia. The current classification of wetlands in Australia is broadly:
Marine and coastal zone wetlands (e.g. bays, estuaries, intertidal zones).
Inland wetlands (e.g. floodplans, riparian corridors, fens, lakesides).
Human made wetlands (e.g. canals and drainage channels, stormwater retention basins).10
9 Costanza R, d'Arge R, De Groot R, Farber S, Grasso M, Hannon B, Limburg K, Naeem S, O'Neill RV, Paruelo J, Raskin RG, Sutton P and van den Belt M. 1997. The value of the world's ecosystem services and natural capital. Nature 387:253-259
10 Environment Australia (2001). A Directory of Important Wetlands in Australia, Third Edition. Environment Australia, Canberra. Chapter 2.
Department of Sustainability, Environment, Water, Population and CommunitiesLiterature Review of the Economic Value of Ecosystem Services that Wetlands Provide
.4.
Wetland classification Classification of wetlands by type.
Current classifications in Australia are broadly: marine and coastal zone wetlands; inland wetlands; and human made wetlands.
Key wetland functions For each wetland type, identify the key ecological functions.
Functions will differ depending on wetland type and wetland specific circumstances (e.g. location, size, condition).
Wetland ecosystem services
Identify and measure the ecosystem services being provided (e.g. provisioning, regulating services). Where possible identify the incremental change in services attributable to changes in wetland extent or condition.
Valuing benefits Using appropriate valuation methodologies, estimate the economic values of ecosystem services attributable to wetlands (could be stock or flow values). Valuation provides key inputs to intervention choice and design.
MARSDEN JACOB ASSOCIATES
Interrogation of the Australian wetlands database reveals that some wetlands are classified under multiple categories (e.g. Moreton Bay, South East Queensland). Broadly:
there are 35 natural wetlands that can be categorised as including marine and coastal zone wetlands;
there are 53 natural wetlands that can be categorised as including inland wetlands; and
there are 10 wetland systems that include man-made wetlands.
This classification system is essentially based on location and/or whether a wetland is natural or not. While this classification system provides the basis for cataloguing wetlands, it only provides limited insight to understanding ecosystem services from Ramsar wetlands.
Map 1: Distribution of Ramsar wetlands in Australia
Source: http://www.environment.gov.au/water/topics/wetlands/database/maps/pubs/ramsar-sites-australia.pdf.
The review of literature has identified a number of ecological functions from wetlands. These are categorised into three functions.
Hydrological functions. These include: the moderation of water flow and subsequent flood protection; storm surge protection; recharge of groundwater systems; protection of shorelines from erosion; and localised climate regulation.
Biogeochemical functions. These include: carbon sequestration and storage; water quality treatment; nutrient export and the subsequent impact on aquatic food chains.
Habitat functions. These include: support for biodiversity (flora and fauna).11
11 For a useful identification of ecological functions for different types of wetland types see Hanson, A. et al. 2008. Wetland ecological functions assessment: An overview of approaches. Canadian Wildlife Service technical report Series No. 497.
Department of Sustainability, Environment, Water, Population and CommunitiesLiterature Review of the Economic Value of Ecosystem Services that Wetlands Provide
.5.
MARSDEN JACOB ASSOCIATES
It should be noted that the types and extent of ecological functions would depend on the type of wetland and its specific characteristics. It is the functions of wetlands that provide more insight into the potential ecosystem services from wetlands.12 However, only subsets of these functions translate into ecosystem services as only some of them actually provide direct or indirect benefits to humans.
Clearly there is a disjoint between current wetland classification and the ability to use ecosystem services concepts to manage Australia’s Ramsar wetlands. To incorporate ecosystem services into the management of Ramsar wetlands, an understanding of ecosystem functions is also necessary to underpin the identification, scoping and estimation of the value of ecosystem services.
2.2 Ecosystem services – types and examplesBased on the Millennium Ecosystem Assessment framework13, ecosystem services from wetlands can be categorised into four broad categories. The categories are:
Provisioning services. These are essentially the products obtained from wetland ecosystems such as fresh water and fish for human consumption.
Regulating services. These are essentially the benefits to humans attributable to the regulation of ecosystem processes such as water treatment and local climate regulation.
Supporting services. These services underpin the production of all other ecosystem services such as nutrient cycling, water cycling, and provisioning of habitat.
Cultural services. These are typically non-material benefits received by people from direct and indirect interactions with wetlands such as recreation, aesthetic values, spiritual benefits (e.g. Indigenous connections with wetlands) and enhancements in knowledge.
A single wetland may provide multiple types of ecosystem services depending on the particular circumstances of the wetland (type, location, condition, uses etc.). These services are ultimately derived from the ecosystem functions performed by wetlands and the degree to which humans benefit from those functions.
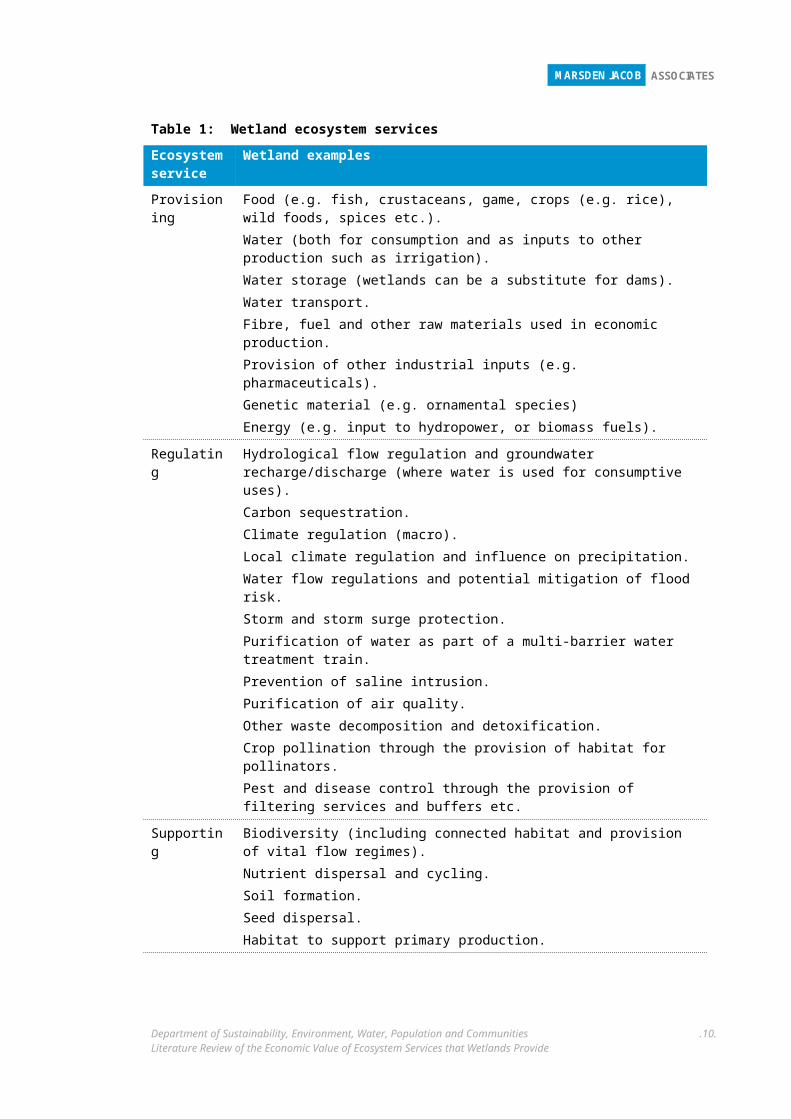
Typical ecosystem services identified through the review of literature are outlined in Table 1
While the examples are extensive, it is unlikely the literature review has captured all possible ecosystem services. It is also important to note that these ecosystem services may be derived in-situ, or at another location.
12 De Groot, R.S., Stuip, M.A.M., Finlayson, C.M. & Davidson, N. 2006. Valuing wet- lands: guidance for valuing the benefits derived from wetland ecosystem services, Ramsar Technical Report No. 3/CBD Technical Series No. 27. Ramsar Convention Secretariat, Gland, Switzerland & Secretariat of the Convention on Biological Diversity, Montreal, Canada.
13 Millennium Ecosystem Assessment 2003. Ecosystems and human well-being: A framework for assessment. Island Press, Washington DC.
Department of Sustainability, Environment, Water, Population and CommunitiesLiterature Review of the Economic Value of Ecosystem Services that Wetlands Provide
.6.
MARSDEN JACOB ASSOCIATES
Table 1: Wetland ecosystem services
Ecosystem service
Wetland examples
Provisioning Food (e.g. fish, crustaceans, game, crops (e.g. rice), wild foods, spices etc.).Water (both for consumption and as inputs to other production such as irrigation).Water storage (wetlands can be a substitute for dams).Water transport.Fibre, fuel and other raw materials used in economic production.Provision of other industrial inputs (e.g. pharmaceuticals).Genetic material (e.g. ornamental species)Energy (e.g. input to hydropower, or biomass fuels).
Regulating Hydrological flow regulation and groundwater recharge/discharge (where water is used for consumptive uses).Carbon sequestration.Climate regulation (macro).Local climate regulation and influence on precipitation.Water flow regulations and potential mitigation of flood risk.Storm and storm surge protection.Purification of water as part of a multi-barrier water treatment train.Prevention of saline intrusion.Purification of air quality.Other waste decomposition and detoxification.Crop pollination through the provision of habitat for pollinators.Pest and disease control through the provision of filtering services and buffers etc.
Supporting Biodiversity (including connected habitat and provision of vital flow regimes). Nutrient dispersal and cycling.Soil formation. Seed dispersal.Habitat to support primary production.
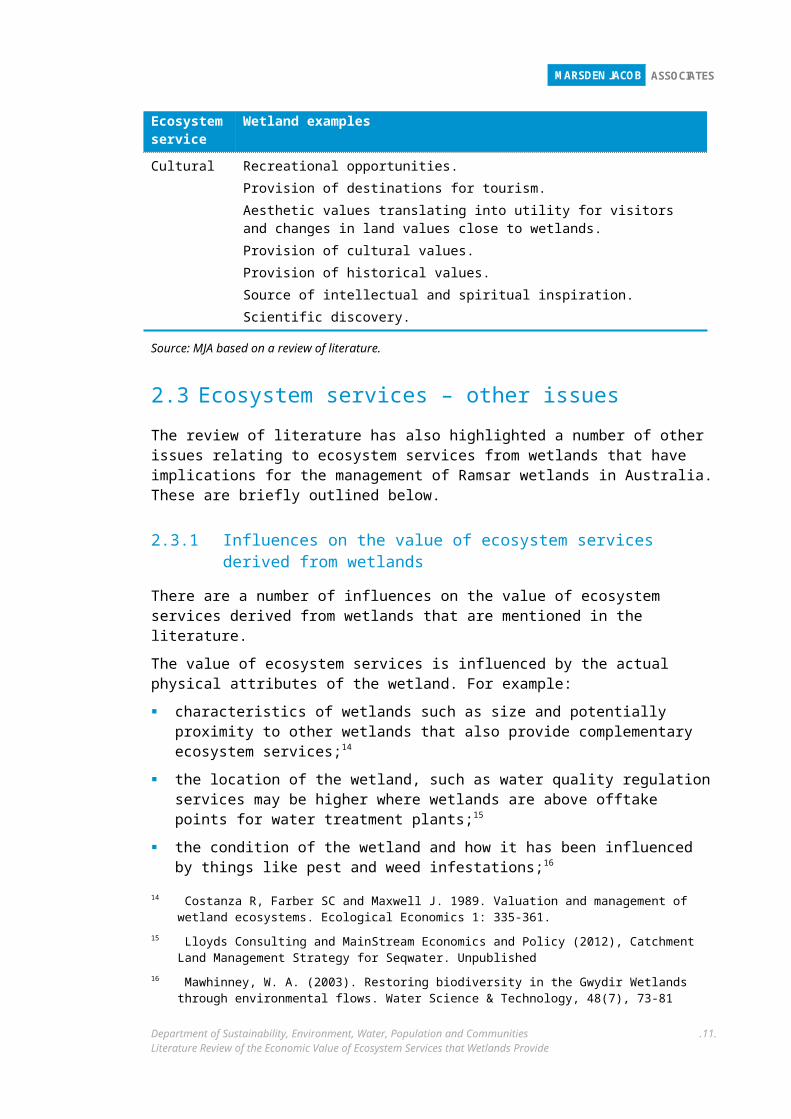
Cultural Recreational opportunities.Provision of destinations for tourism.Aesthetic values translating into utility for visitors and changes in land values close to wetlands.Provision of cultural values.Provision of historical values.Source of intellectual and spiritual inspiration.Scientific discovery.
Source: MJA based on a review of literature.
Department of Sustainability, Environment, Water, Population and CommunitiesLiterature Review of the Economic Value of Ecosystem Services that Wetlands Provide
.7.

MARSDEN JACOB ASSOCIATES
2.3 Ecosystem services – other issuesThe review of literature has also highlighted a number of other issues relating to ecosystem services from wetlands that have implications for the management of Ramsar wetlands in Australia. These are briefly outlined below.
2.3.1 Influences on the value of ecosystem services derived from wetlands
There are a number of influences on the value of ecosystem services derived from wetlands that are mentioned in the literature.
The value of ecosystem services is influenced by the actual physical attributes of the wetland. For example:
characteristics of wetlands such as size and potentially proximity to other wetlands that also provide complementary ecosystem services;14
the location of the wetland, such as water quality regulation services may be higher where wetlands are above offtake points for water treatment plants;15
the condition of the wetland and how it has been influenced by things like pest and weed infestations;16
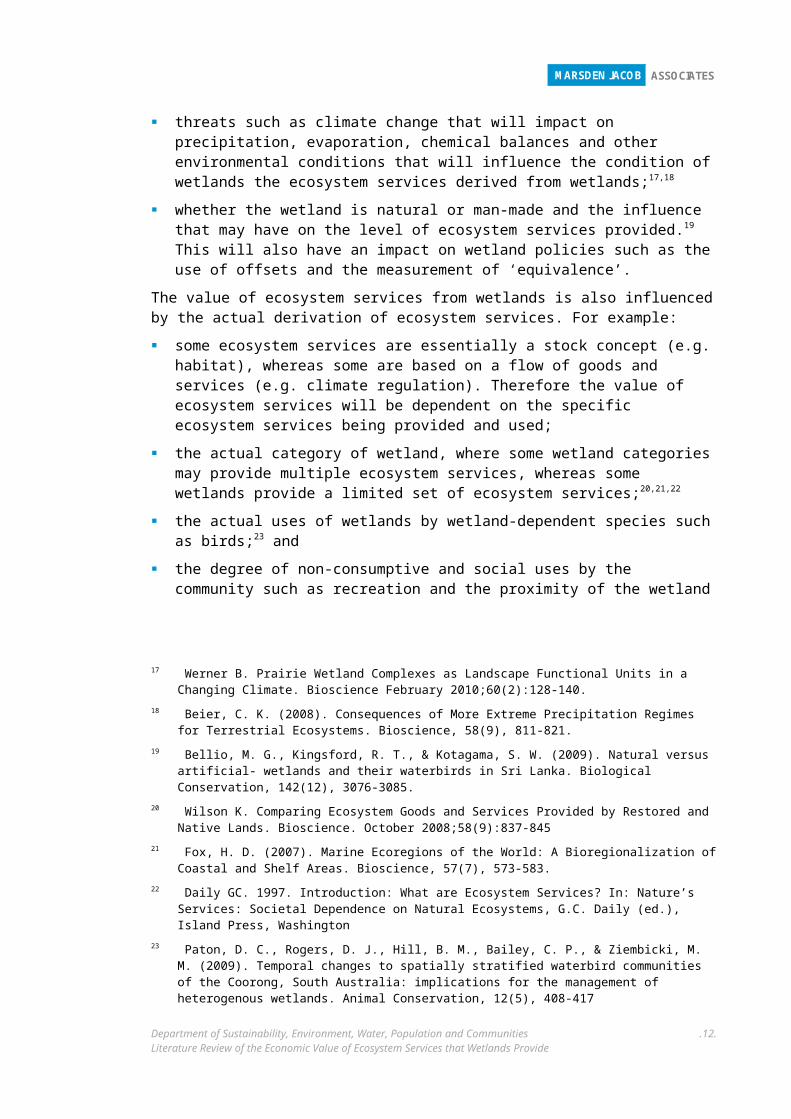
threats such as climate change that will impact on precipitation, evaporation, chemical balances and other environmental conditions that will influence the condition of wetlands the ecosystem services derived from wetlands;17,18
whether the wetland is natural or man-made and the influence that may have on the level of ecosystem services provided.19 This will also have an impact on wetland policies such as the use of offsets and the measurement of ‘equivalence’.
The value of ecosystem services from wetlands is also influenced by the actual derivation of ecosystem services. For example:
some ecosystem services are essentially a stock concept (e.g. habitat), whereas some are based on a flow of goods and services (e.g. climate regulation). Therefore the value of ecosystem services will be dependent on the specific ecosystem services being provided and used;
14 Costanza R, Farber SC and Maxwell J. 1989. Valuation and management of wetland ecosystems. Ecological Economics 1: 335-361.
15 Lloyds Consulting and MainStream Economics and Policy (2012), Catchment Land Management Strategy for Seqwater. Unpublished
16 Mawhinney, W. A. (2003). Restoring biodiversity in the Gwydir Wetlands through environmental flows. Water Science & Technology, 48(7), 73-81
17 Werner B. Prairie Wetland Complexes as Landscape Functional Units in a Changing Climate. Bioscience February 2010;60(2):128-140.
18 Beier, C. K. (2008). Consequences of More Extreme Precipitation Regimes for Terrestrial Ecosystems. Bioscience, 58(9), 811-821.
19 Bellio, M. G., Kingsford, R. T., & Kotagama, S. W. (2009). Natural versus artificial- wetlands and their waterbirds in Sri Lanka. Biological Conservation, 142(12), 3076-3085.
Department of Sustainability, Environment, Water, Population and CommunitiesLiterature Review of the Economic Value of Ecosystem Services that Wetlands Provide
.8.
MARSDEN JACOB ASSOCIATES
the actual category of wetland, where some wetland categories may provide multiple ecosystem services, whereas some wetlands provide a limited set of ecosystem services;20,21,22
the actual uses of wetlands by wetland-dependent species such as birds;23 and
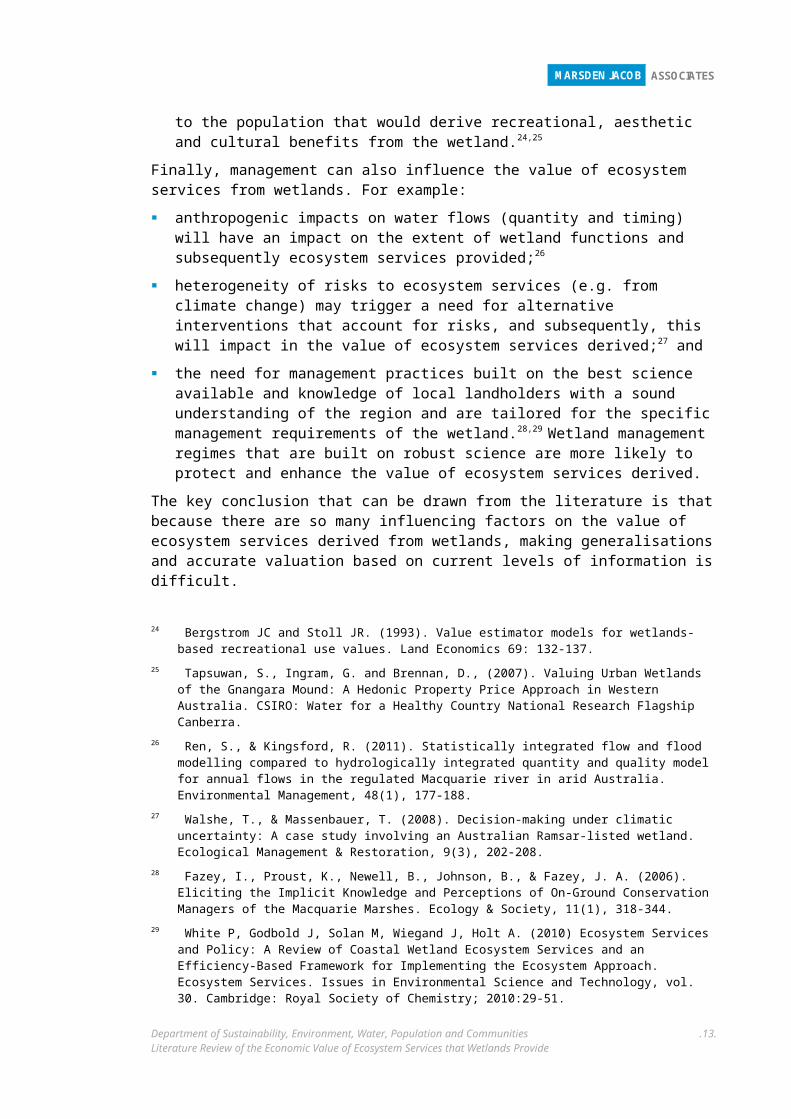
the degree of non-consumptive and social uses by the community such as recreation and the proximity of the wetland to the population that would derive recreational, aesthetic and cultural benefits from the wetland.24,25
Finally, management can also influence the value of ecosystem services from wetlands. For example:
anthropogenic impacts on water flows (quantity and timing) will have an impact on the extent of wetland functions and subsequently ecosystem services provided;26
heterogeneity of risks to ecosystem services (e.g. from climate change) may trigger a need for alternative interventions that account for risks, and subsequently, this will impact in the value of ecosystem services derived;27 and
the need for management practices built on the best science available and knowledge of local landholders with a sound understanding of the region and are tailored for the specific management requirements of the wetland.28,29 Wetland management regimes that are built on robust science are more likely to protect and enhance the value of ecosystem services derived.
The key conclusion that can be drawn from the literature is that because there are so many influencing factors on the value of ecosystem services derived from wetlands, making generalisations and accurate valuation based on current levels of information is difficult. 20 Wilson K. Comparing Ecosystem Goods and Services Provided by Restored and Native Lands. Bioscience.
October 2008;58(9):837-84521 Fox, H. D. (2007). Marine Ecoregions of the World: A Bioregionalization of Coastal and Shelf Areas.
Bioscience, 57(7), 573-583.22 Daily GC. 1997. Introduction: What are Ecosystem Services? In: Nature’s Services: Societal Dependence on
Natural Ecosystems, G.C. Daily (ed.), Island Press, Washington23 Paton, D. C., Rogers, D. J., Hill, B. M., Bailey, C. P., & Ziembicki, M. M. (2009). Temporal changes to
spatially stratified waterbird communities of the Coorong, South Australia: implications for the management of heterogenous wetlands. Animal Conservation, 12(5), 408-417
24 Bergstrom JC and Stoll JR. (1993). Value estimator models for wetlands-based recreational use values. Land Economics 69: 132-137.
25 Tapsuwan, S., Ingram, G. and Brennan, D., (2007). Valuing Urban Wetlands of the Gnangara Mound: A Hedonic Property Price Approach in Western Australia. CSIRO: Water for a Healthy Country National Research Flagship Canberra.
26 Ren, S., & Kingsford, R. (2011). Statistically integrated flow and flood modelling compared to hydrologically integrated quantity and quality model for annual flows in the regulated Macquarie river in arid Australia. Environmental Management, 48(1), 177-188.
27 Walshe, T., & Massenbauer, T. (2008). Decision-making under climatic uncertainty: A case study involving an Australian Ramsar-listed wetland. Ecological Management & Restoration, 9(3), 202-208.
28 Fazey, I., Proust, K., Newell, B., Johnson, B., & Fazey, J. A. (2006). Eliciting the Implicit Knowledge and Perceptions of On-Ground Conservation Managers of the Macquarie Marshes. Ecology & Society, 11(1), 318-344.
29 White P, Godbold J, Solan M, Wiegand J, Holt A. (2010) Ecosystem Services and Policy: A Review of Coastal Wetland Ecosystem Services and an Efficiency-Based Framework for Implementing the Ecosystem Approach. Ecosystem Services. Issues in Environmental Science and Technology, vol. 30. Cambridge: Royal Society of Chemistry; 2010:29-51.
Department of Sustainability, Environment, Water, Population and CommunitiesLiterature Review of the Economic Value of Ecosystem Services that Wetlands Provide
.9.
MARSDEN JACOB ASSOCIATES
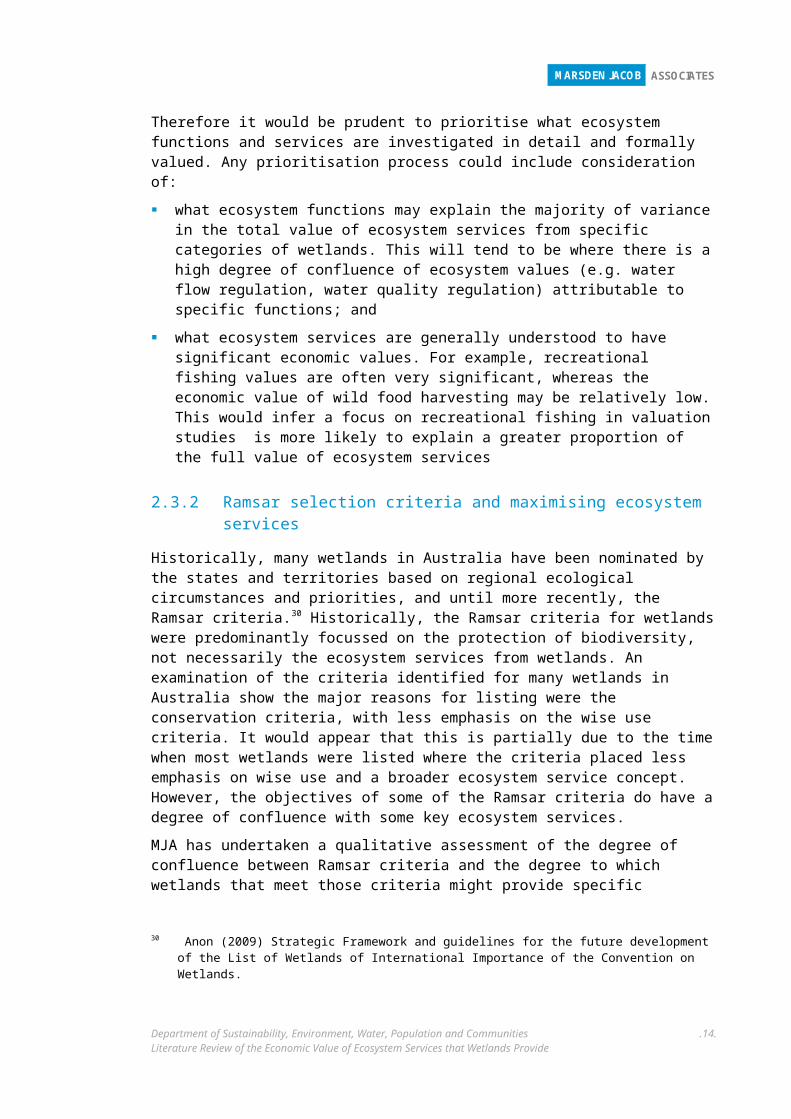
Therefore it would be prudent to prioritise what ecosystem functions and services are investigated in detail and formally valued. Any prioritisation process could include consideration of:
what ecosystem functions may explain the majority of variance in the total value of ecosystem services from specific categories of wetlands. This will tend to be where there is a high degree of confluence of ecosystem values (e.g. water flow regulation, water quality regulation) attributable to specific functions; and
what ecosystem services are generally understood to have significant economic values. For example, recreational fishing values are often very significant, whereas the economic value of wild food harvesting may be relatively low. This would infer a focus on recreational fishing in valuation studies is more likely to explain a greater proportion of the full value of ecosystem services
2.3.2 Ramsar selection criteria and maximising ecosystem servicesHistorically, many wetlands in Australia have been nominated by the states and territories based on regional ecological circumstances and priorities, and until more recently, the Ramsar criteria.30 Historically, the Ramsar criteria for wetlands were predominantly focussed on the protection of biodiversity, not necessarily the ecosystem services from wetlands. An examination of the criteria identified for many wetlands in Australia show the major reasons for listing were the conservation criteria, with less emphasis on the wise use criteria. It would appear that this is partially due to the time when most wetlands were listed where the criteria placed less emphasis on wise use and a broader ecosystem service concept. However, the objectives of some of the Ramsar criteria do have a degree of confluence with some key ecosystem services.
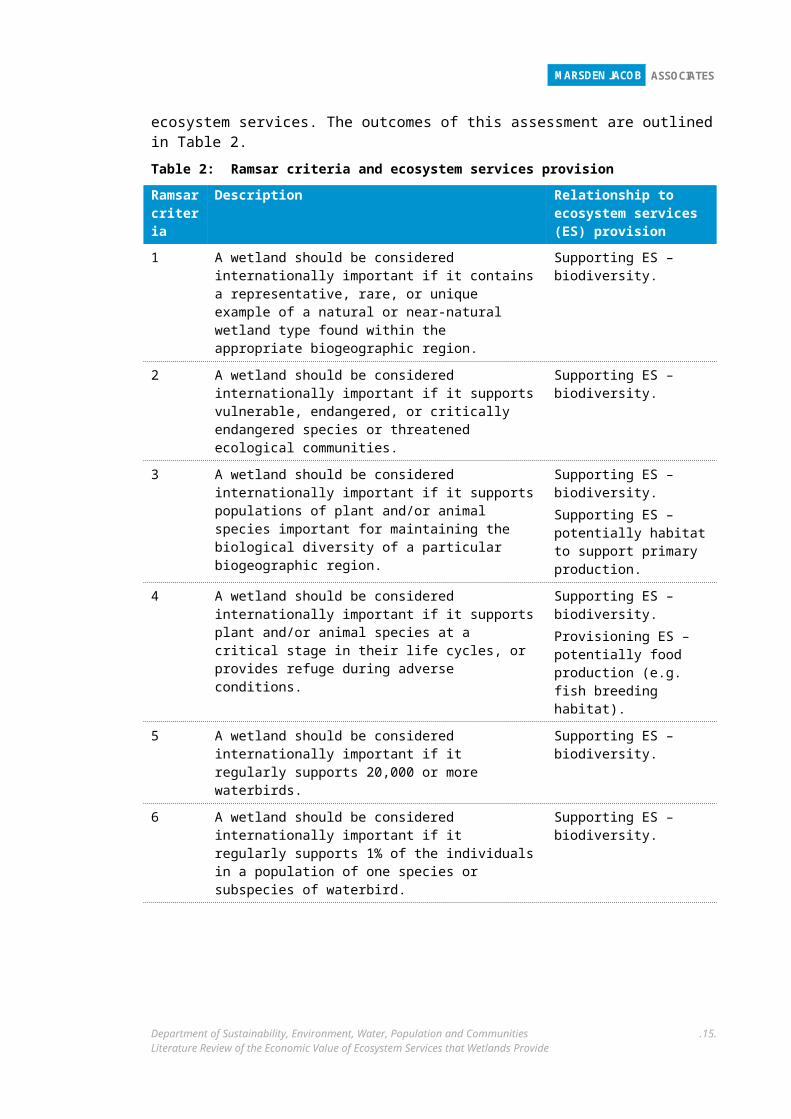
MJA has undertaken a qualitative assessment of the degree of confluence between Ramsar criteria and the degree to which wetlands that meet those criteria might provide specific ecosystem services. The outcomes of this assessment are outlined in Table 2.
Table 2: Ramsar criteria and ecosystem services provision
Ramsar criteria
Description Relationship to ecosystem services (ES) provision
1 A wetland should be considered internationally important if it contains a representative, rare, or unique example of a natural or near-natural wetland type found within the appropriate biogeographic region.
Supporting ES – biodiversity.
2 A wetland should be considered internationally important if it supports vulnerable, endangered, or critically endangered species or threatened ecological communities.
Supporting ES – biodiversity.
3 A wetland should be considered internationally important if it supports populations of plant and/or animal species important for maintaining the biological diversity of a particular biogeographic region.
Supporting ES – biodiversity.Supporting ES – potentially habitat to support primary production.
30 Anon (2009) Strategic Framework and guidelines for the future development of the List of Wetlands of International Importance of the Convention on Wetlands.
Department of Sustainability, Environment, Water, Population and CommunitiesLiterature Review of the Economic Value of Ecosystem Services that Wetlands Provide
.10.
MARSDEN JACOB ASSOCIATES
Ramsar criteria
Description Relationship to ecosystem services (ES) provision
4 A wetland should be considered internationally important if it supports plant and/or animal species at a critical stage in their life cycles, or provides refuge during adverse conditions.
Supporting ES – biodiversity.Provisioning ES – potentially food production (e.g. fish breeding habitat).
5 A wetland should be considered internationally important if it regularly supports 20,000 or more waterbirds.
Supporting ES – biodiversity.
6 A wetland should be considered internationally important if it regularly supports 1% of the individuals in a population of one species or subspecies of waterbird.
Supporting ES – biodiversity.
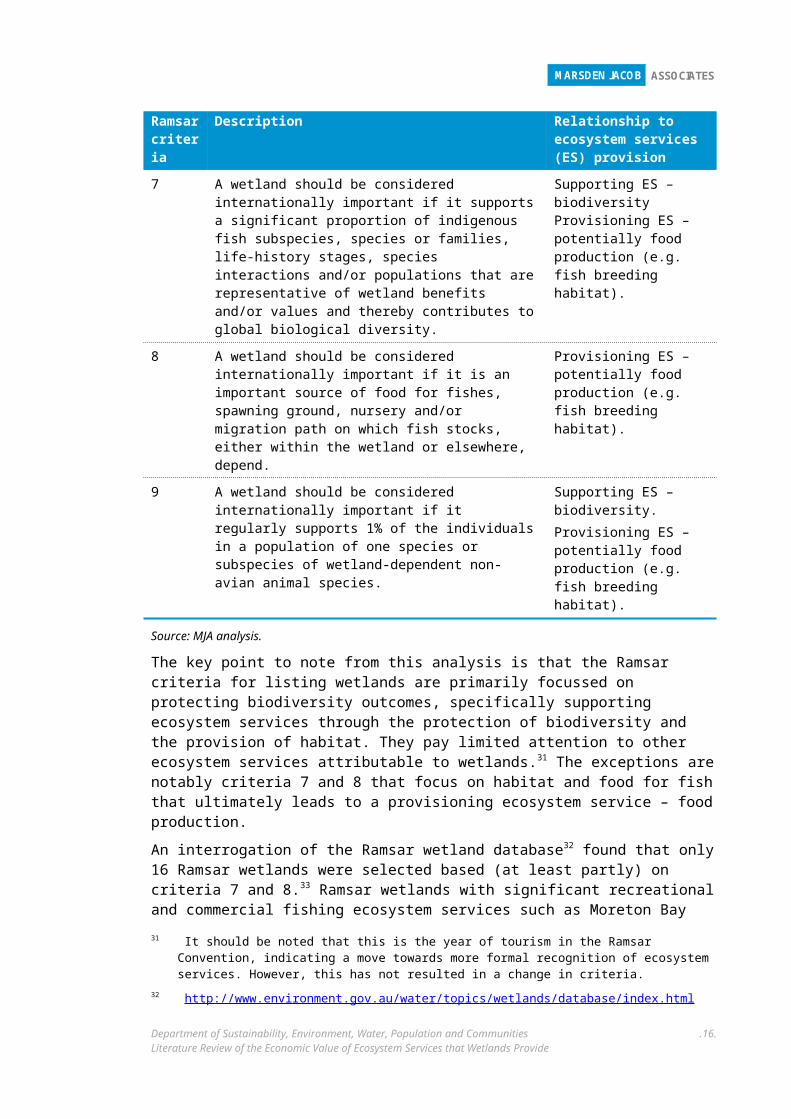
7 A wetland should be considered internationally important if it supports a significant proportion of indigenous fish subspecies, species or families, life-history stages, species interactions and/or populations that are representative of wetland benefits and/or values and thereby contributes to global biological diversity.
Supporting ES – biodiversity Provisioning ES – potentially food production (e.g. fish breeding habitat).
8 A wetland should be considered internationally important if it is an important source of food for fishes, spawning ground, nursery and/or migration path on which fish stocks, either within the wetland or elsewhere, depend.
Provisioning ES – potentially food production (e.g. fish breeding habitat).
9 A wetland should be considered internationally important if it regularly supports 1% of the individuals in a population of one species or subspecies of wetland-dependent non-avian animal species.
Supporting ES – biodiversity.Provisioning ES – potentially food production (e.g. fish breeding habitat).
Source: MJA analysis.
The key point to note from this analysis is that the Ramsar criteria for listing wetlands are primarily focussed on protecting biodiversity outcomes, specifically supporting ecosystem services through the protection of biodiversity and the provision of habitat. They pay limited attention to other ecosystem services attributable to wetlands.31 The exceptions are notably criteria 7 and 8 that focus on habitat and food for fish that ultimately leads to a provisioning ecosystem service – food production.
An interrogation of the Ramsar wetland database32 found that only 16 Ramsar wetlands were selected based (at least partly) on criteria 7 and 8.33 Ramsar wetlands with significant recreational and commercial fishing ecosystem services such as Moreton Bay were not listed based on criteria 7 and 8.34 It is our understanding that this is partly due to the date of listing and
31 It should be noted that this is the year of tourism in the Ramsar Convention, indicating a move towards more formal recognition of ecosystem services. However, this has not resulted in a change in criteria.
32 http://www.environment.gov.au/water/topics/wetlands/database/index.html 33 These were: Riverland (SA), Apsley Marshes (Tas), Ashmore Reef National Nature Reserve (Ext), Coral Sea
Reserves (Coringa-Herald and Lihou Reefs and Cays) (Ext), Elizabeth and Middleton Reefs Marine National Nature Reserve (Ext), Great Sandy Strait (including Great Sandy Strait, Tin Can Bay and Tin Can Inlet). (Qld), Interlaken (Lake Crescent) (Tas), Kakadu National Park (NT), Moulting Lagoon (Tas), NSW Central Murray State Forests (NSW), Paroo River Wetlands (NSW), Pitt Water-Orielton Lagoon (Tas), Roebuck Bay (WA), The Coorong, and Lakes Alexandrina and Albert Wetland (SA), The Dales (Ext), Western Port (Vic).
34 For example, commercial fishing is worth approximately $30 million per annum (gross value of production) and recreation fishing is worth around $190 million (based on expenditure). See: Marsden Jacob Associates (2010), Managing what matters: the cost of environmental decline in SEQ.
Department of Sustainability, Environment, Water, Population and CommunitiesLiterature Review of the Economic Value of Ecosystem Services that Wetlands Provide
.11.

MARSDEN JACOB ASSOCIATES
the fact the criteria have not been formally revisited. However, as Ramsar wetlands are progressively reviewed, the identification of broader ecosystem services values is likely to become more common, and this will be further reflected in future wetland management.
The key point from this analysis is the importance of considering wetland ecosystem attributes beyond the stated values that underpin their listing when considering wetland policy and investment decisions.
2.3.3 Recent advances in wetland assessments and impact on valuing ecosystem services
Since 2009, 17 updated ecological character descriptions and management plans have been completed for key Australian wetlands and made public on the Department’s website.35 A number of those reports include available information on ecosystem services.36 These updated character descriptions provide information (including some quantitative information) on:
the key site attributes (ecosystem components and processes);
qualitative descriptions of benefits and ecosystem services where known, including high level classification of ecosystem services by type (e.g. provisioning, regulating etc);
an overview of critical wetland components and processes;
limits of acceptable change (indicating potential thresholds before ecosystem services are materially impacted;
risks to wetland condition; and the assessment of trends since designation; and
key knowledge gaps and monitoring needs.
Importantly, these documents provide a valuable starting point for the identification, scoping and ultimately the valuation of ecosystem services. However, it should still be understood that these reports are still primarily focussed on biophysical descriptions of processes and values. They are not designed as inputs for economic analysis.
2.4 Gaps in biophysical informationThe issues outlined above indicate that sound biophysical, social and economic information on wetlands is required to understand:
the extent and condition of wetlands, which has formed much of the focus of prior research and analysis used for designation purposes;
the drivers of risks and stressors to those wetlands (e.g. competing land use, climate change, over fishing etc.).37 These are generally known, but thresholds exist that will have a major influence on the economic values of ecosystem services. These issues are covered in some
35 For a list of completed assessments and other relevant documents see: http://www.environment.gov.au/water/publications/environmental/wetlands/index.html
36 For example see: Cibilic, A. and White, L., (2011) Ecological Character Description for Little Llangothlin Nature Reserve, a Wetland of International Importance. Report prepared for the Department of Sustainability, Environment, Water, Population and Communities, Canberra, by WetlandCare Australia, Ballina, NSW and DSEWP&C (2012) East Coast Cape Barren Island Lagoons Ramsar Site Ecological Character Description.
37 Davis, J., & Brock, M. (2008). Detecting unacceptable change in the ecological character of Ramsar wetlands. Ecological Management & Restoration, 9(1), 26-32.
Department of Sustainability, Environment, Water, Population and CommunitiesLiterature Review of the Economic Value of Ecosystem Services that Wetlands Provide
.12.
MARSDEN JACOB ASSOCIATES
recent ecological character descriptions. However, quantitative enumeration of risks is uncommon;
the types of ecosystem functions derived from those wetlands, their extent and how they relate to the provision of different ecosystem services (sometimes qualitatively described in ecological character descriptions); and
key ecological response functions, particularly where the impacts of incremental change are understood. This is rarely known in any quantitative sense.38
An initial focus should be on a more detailed and scientifically rigorous typology of ecosystem functions derived from different wetland categories and the suite of ecosystem services that flow. Then the focus should be on the ecological response functions that underpin changes in the level of ecosystem services provided.
This would essentially be an extension of the work already being undertaken for the ecological character descriptions progressively being undertaken across Australia. Specifically, this would require a move to a more quantitative enumeration of information, processes, and functions than is currently included in the ecological character descriptions. It would also require a more dedicated process of involving economists and social scientists in the development of ecological character descriptions.
Once this information is available, a robust process of analysis of the ecosystem services derived from wetlands and the respective economic values of wetlands can be established. This will provide the basis for a broader and more considered approach to intervention design for wetlands.
38 MacDonald, D. D. (2010). Valuing biodiversity using habitat types. Australasian Journal of Environmental Management, 17(4), 235-243.
Department of Sustainability, Environment, Water, Population and CommunitiesLiterature Review of the Economic Value of Ecosystem Services that Wetlands Provide
.13.
MARSDEN JACOB ASSOCIATES
3. Economic valuation of ecosystem services
Economic valuation of ecosystem services can be described as the process of quantifying in monetary terms the services that environmental resources or systems provide us, with or without the assistance of market prices.39
Valuing ecosystem services requires two specific sources of knowledge:
1. the ecological processes, components and functions that generate useful services; and
2. the way in which these services translate into specific benefits.40
Accurate estimation of ecosystem service values allows the incorporation of otherwise unquantified values into dominant decision-making frameworks such as benefit cost analysis, economic impact assessments and regulatory impact statements, along with more readily quantified financial costs and benefits. This can better inform decision-makers as to the full extent of costs and benefits associated with environmental resources, increasing the efficiency and effectiveness of decisions about their protection or otherwise.
This section explores a relevant economic framework for incorporating economic values for wetland ecosystem services, and explores the range of relevant tools for appropriately quantifying these economic values. Examples are provided for each tool (with several more in Appendix 1). More detailed case studies are then presented.41
3.1 Total economic value (TEV)The economic theory on ecosystem services valuation regards them as assets producing a flow of beneficial goods and services over time, like any other asset. To this extent, they should be valued in a similar manner to other goods – that is, their social value is equal to the discounted net present value (NPV) of the flow of benefits. This value is estimated using a number of techniques (outlined in Section 4.2).
Where environmental assets differ from other assets is that estimating this flow of benefits is often very difficult when compared to approaches to value standard assets. One reason for this is that environmental assets can be described as ‘non-renewable resources with renewable service flows’.42 If the extent and condition of wetlands can be maintained, they provide a non-depleting stream of benefits. However, the asset itself can be depleted through a range of destructive actions such as land conversion and pollution.
39 Adapted from: http://www.unepscs.org/Economic_Valuation_Training_Materials/06%20Readings%20on%20Economic%20Valuation%20of%20Coastal%20Habitats/07-Economic-Valuation-Wetlands-Management.pdf
40 Barbier, E.B. 2007. "Valuing ecosystem services as productive inputs," Economic Policy, CEPR & CES & MSH, vol. 22, pages 177-229, 01.
41 Drafting note: these will be provided in the Final Report.42 Just, R.E., D.L. Hueth and A. Schmitz. (2004). The Welfare Economics of Public Policy: A Practical Approach
to Project and Policy Evaluation. Cheltenham, UK: Edward Elgar.
Department of Sustainability, Environment, Water, Population and CommunitiesLiterature Review of the Economic Value of Ecosystem Services that Wetlands Provide
.14.
MARSDEN JACOB ASSOCIATES
Wetlands also provide services that have ‘public good’ aspects.43 That is, the ecosystem services provided by wetlands are sometimes non-rivalrous (the benefit that one person obtains from wetland habitat protection does not reduce the benefit to others), and non-excludable (someone who is unwilling to pay for that benefit cannot be excluded from obtaining it).
Also, because markets do not exist for many benefits produced by ecosystem services, establishing willingness to pay for them requires the use of specific tools of varying accuracy.44 Further valuation problems arise due to uncertainty about the future value of benefits over time, as wetland assets decline around the world, and the problem of irreversibility of the destruction of wetland assets: once destroyed, a natural wetland cannot necessarily be recreated in the future.
The most common framework for understanding the full economic value of environmental resources such as wetlands is the Total Economic Value (TEV) framework. The TEV framework identifies not only the value of financial or commercial outputs, but also non-consumptive values that may be environmental or social in nature.
The TEV framework considers a larger sphere of impacts than just consumptive use. The TEV framework has been widely adopted by environmental economists over the past three decades, however there is no one standard categorisation nor standard terminology.45
Lancaster’s46 consumer theory argues that a good possesses a bundle of attributes that combine to form the value the consumer places on that good. A TEV framework teases out these different attributes and their values. Value may be placed on a wetland through its use for productive ends (such as providing commercial fishing catch), but also for non-use values such as providing habitat for rare and endangered species, regardless of whether a community member is directly exposed to the flora and fauna retained within it.
The TEV framework is useful for ensuring that all components of value are given recognition in empirical analyses and that “double counting” of values does not occur when multiple valuation methods are employed.47
A diagram showing the components of TEV is shown in Figure 4.
43 De Groot, et al 2006.44 Freeman, A.M. III. (2003). The Measurement of Environmental and Resource Values: Theory and Methods,
2nd ed. Washington DC: Resources for the Future.45 See for example Turner et al 2003, Inter-Departmental Committee on Environmental Economic Valuation
2003, Robinson 2001 and Rolfe 2007.46 Lancaster, K.G. 1966. "A New Approach to Consumer Theory." Journal of Political Economy, 74, 132-157.47 National Research Council of the National Academies, 2005. Valuing Ecosystem Services – Toward Better
Environmental Decision-Making. The National Academies Press.
Department of Sustainability, Environment, Water, Population and CommunitiesLiterature Review of the Economic Value of Ecosystem Services that Wetlands Provide
.15.
MARSDEN JACOB ASSOCIATES
Figure 4: Total Economic Value framework
Source: MJA analysis based on Freeman, 2003.
3.1.1 Use valuesUse values measure the value arising from the actual, planned or possible use of goods and services. Use values can be direct, indirect, or option values.
Direct use values measure the willingness to pay for the good as a final consumption good. For example, wetlands produce values directly related to fish, agriculture, fuel wood, recreation, transport, wildlife harvesting, peat/energy, and other products such as vegetable oils, dyes, and fruits. Direct use is the value typically measured in financial analyses.
Indirect use values measure the value that a good has as an intermediate input in some production process whose end good is of value. For example, wetlands provide nutrient retention and filtration, flood control, storm protection, groundwater recharge, external ecosystem support, micro-climatic stabilisation, and shoreline stabilisation.
Option value relates to retaining an option for that resource use in the future. For example, the species and genetic resources contained in a wetland may provide values in the future that are not evident currently; for example, for responses to human diseases and agricultural pests (in this case, an insurance premium). Option value faces measurement difficulties, requiring knowledge of individuals’ risk preferences.
3.1.2 Non-use valueNon-use value refers to the willingness to pay to maintain some good in existence even when the individual does not use the resource or plan to use the resource at some time in the future. Non-use values are generally separated into existence, altruism and bequest values.
Existence values refers to the WTP to keep a good in existence in the context where the individual expressing the value has no actual or planned use of the resource for herself, or for anyone else. Motivations for having an existence value may include being concerned for the
Department of Sustainability, Environment, Water, Population and CommunitiesLiterature Review of the Economic Value of Ecosystem Services that Wetlands Provide
.16.
Total Economic Value
Use Values Non-use Values
Direct use(fish catch, fuel wood)
Option(genetic material)
For othersExistence values
(protection of endangered species)
Altruism values(healthy
environment)
Bequest values(species protection
for subsequent generations)
Indirect use(water
filtration, flood control)
MARSDEN JACOB ASSOCIATES
good itself in its own right, or a stewardship motivation. In the context of wetlands, this often relates to the protection of rare or endangered species of flora and fauna, provided by wetland as habitat.
Altruism and bequest values stem from the preference of the individual for others to enjoy and benefit from the resource, even if the individual professing the value does not use the resource themselves. In the case of altruism values, the preference is for others in the current generation to enjoy the resource, whereas a bequest value reflects the preference for future generations to be able to enjoy / benefit from the resource.
Non-use values are often measured through hypothetical surveys of people’s stated preferences, the results of which are then extrapolated across entire communities. They can produce very large values, the robustness of which are often questioned. We discuss estimation methods in the next section.
3.1.3 TEV and ecosystem service estimationIn addition, an economic value placed on an asset typically represents the value of all of the attributes of that product. However, because ecosystem services can produce multiple types of values, there is a risk of misstating the economic value of wetlands where multiple estimates of ecosystem service values are simply added up to establish a TEV for a wetland (i.e. is the TEV of a wetland estimated using typical economic approaches more or less than the sum of the value of its parts (based on an ecosystem services framework)).
3.2 Valuation methodologiesThe appropriate tool for quantifying values associated with wetland ecosystem services must be carefully chosen based on the specific context of the ecosystem service to be estimated, the nature of the tools available, and associated issues such as data availability, budget for estimation, use of the results and expertise required for assessment.
The tools described below are well accepted within the conventional economics literature48 and have been applied in practice within Australia and internationally.
Broadly, the valuation tool that is appropriate for any ecosystem service depends upon the type of value to be estimated, split by direct and indirect use values, and non-use values. We define and discuss these tools below.
3.2.1 Direct use valuesThe estimation of use values for wetland ecosystem services retains the advantage of estimating values that are revealed in actual choices made by relevant parties. Rather than developing hypothetical scenarios to explore preferences, use values can be estimated by exploring actual choices made.
48 For more detailed description, see the following:National Research Council of the National Academies, 2005. Valuing Ecosystem Services – Toward Better Environmental Decision-Making. The National Academies Press.Champ, P.A., K.J. Boyle and T. C. Brown (Eds), 2003. A Primer on Nonmarket Valuation. Kluwer Academic Publishers.Freeman, A. M. III. 2003. The Measurement of Environmental and Resource Values, Theory and Methods. Resources for the Future.
Department of Sustainability, Environment, Water, Population and CommunitiesLiterature Review of the Economic Value of Ecosystem Services that Wetlands Provide
.17.
MARSDEN JACOB ASSOCIATES
The appropriate estimation methods are described below.
Travel Cost Method
Market and non-market goods can be complementary: the purchase of market goods and services may be required to access an intangible good or service. The value of the purchase of market goods and services is a reflection of the value placed on the intangible good or service.
In the context of wetland ecosystem services, this method has been used to estimate the recreational value people place on wetland sites.
Visitors from different locations bear different travel costs depending on their proximity to the site. This approach establishes the actual costs borne by different parties from different home locations, usually by surveying visitors to the wetland.
The resulting differences in the rates of visits that they induce provide a basis for estimating a demand curve for the site. The situation is complicated, however, by the fact that travel can have value in its own right, and that the same costs might be incurred to access more than one site.
It is data-intensive and requires advanced technical skills to perform. In addition, travel cost estimates tend to only relate to the site where the survey has been undertaken and transferring those values to other sites can be problematic.
Department of Sustainability, Environment, Water, Population and CommunitiesLiterature Review of the Economic Value of Ecosystem Services that Wetlands Provide
.18.
MARSDEN JACOB ASSOCIATES
Whitten and Bennett (2001)49 - South Australia - value of habitat functions and recreation
Whitten and Bennet used a travel cost survey to determine the benefits generated by duck hunting in the Upper South East of South Australia, as part of a broader study of wetland values in two areas of Australia, which also included a choice modelling analysis of the broader community benefits of wetlands (this is reviewed below).50
People attending a weekend shoot were interviewed to determine the location of their principal place of residence and the extent of their costs incurred in travelling to the duck hunting shoot. Based on the interview information, Whitten and Bennett estimated a relationship between the costs of visiting the site and the number of hunters engaged in the shoot and determined that the benefit enjoyed, on average, by a hunter engaged in the shoot was $51.33 (2000 dollars AUD).
Bennett and Whitten noted that this estimate would understate benefits from the duck hunting in the wetlands, as the benefits generated by duck hunting would also provide incentives for wetland owners to maintain their wetlands as viable habitats for ducks, and thus contribute to the provision of wetland protection values that are enjoyed by the broader community.51 (The choice modelling survey that formed part of this study attempted to value these broader benefits - see below). On the other hand, however, the benefits to hunters may be offset by costs incurred by other parties - e.g. as reflected in anti-hunting pressure from the community that has led to bans in other states.
Averting Behaviour
The averting behaviour method is used to estimate the health values of environmental resources including wetlands, and thus quantify the value of wetland ecosystem services such as pollution control and detoxification.
When the ecosystem function of a wetland is compromised, the health values lost due to the change can be estimated by the cost of substituting to an alternative activity that is experienced by the affected parties. The total cost of averting actions is estimated as the willingness to pay to avoid that reduction in ecosystem service provision.
The data and modelling requirements for this approach can be significant as the ecological response functions are complex and the benefits tend to be indirect.
49 Whitten, S.M. and Bennett, J.W., 2001, A travel cost study of duck hunting in the Upper South East of South Australia, Report no.7: “Private and Social Values of wetlands” project, University of New South Wales, Canberra.
50 The broader “Private and Social Values of wetlands” project was funded by Environment Australia and the Land and Water Resources Research and Development Corporation, as part of the National Wetlands Research and Development Program.
51 There is significant evidence of this in North America where Ducks Unlimited (a non-government organization) that has protected over 5.1 million hectares in the past 75 years where protection is both for conservation and to underpin duck hunting and other outdoor recreation pursuits. See: www.ducks.org
Department of Sustainability, Environment, Water, Population and CommunitiesLiterature Review of the Economic Value of Ecosystem Services that Wetlands Provide
.19.
MARSDEN JACOB ASSOCIATES
Averting behaviour studies
The most common example of averting behaviour expenditures involves determining the cost of purchase of water filters, bottled water, or spending energy (and time) to boil water as a measure of WTP for water quality or water purification services provided by water resources, including wetlands. These expenditures only capture a portion of WTP and they are, therefore, sometimes interpreted as a lower bound on willingness to pay to avoid a particular harm.
Two recent studies by Beaumais et al. (2010)52 and Birol et al (2006)53 review a number of averting behaviour studies, including the following:
Abrahams, Hubbell, and Jordan (2000) estimate the WTP of households in Georgia (US) for water quality from the observation of their use of water filters and purchases of bottled water. The lower bound of the WTP was estimated at USD 47 per person per year.
Abdalla (1994) discussed five studies that have used this method to measure household-level costs associated with groundwater contamination. Annual costs from the household averting expenditure studies reviewed generally ranged from €106.5 to €281.3per household. Annual costs for expenditure on bottled water to address organic contamination alone ranged from €27.3 to €281.3per year.
Um, Kwak and Kim (2002) estimated improved drinking water quality in Pusan, Korea and find that marginal WTP estimation results for a small reduction, 10mgl−1 of suspended solid concentration in tap water from 335mgl-1, range from €0.60–1.50per month per household.
In Canada, Dupont (2005) used the averting expenditure method to study the use of home filtration systems and purchase of bottled water after the contamination of water by bacteria in a small agricultural community in Ontario (seven people were killed after water was contaminated by manure that entered the water system upstream). Monthly amounts spent on bottled water ranged between USD 1 and USD 60 with a mean household amount of about USD 15
Hedonic Pricing (direct and indirect use)
As noted earlier, Lancaster’s consumer theory argues that a good possesses a bundle of attributes that combine to form the value the consumer places on that good. With this in mind, the value of a house can be seen to be the combined value of its features, both tangible and intangible. In addition to the number of bedrooms and bathrooms, property prices are affected by elements connected to ecosystem services. Scenic views, air quality, and protection from storms and flood form part of a property’s value, and are reflected in property prices.
Hedonic pricing method isolates the impact of specific variables on property prices, and can determine the effect of changes to ecosystem services on property prices. This impact on property prices is a reflection of the value of those ecosystem services to property owners.
52 Beaumais, O., Briand, A., Millock, K. and Nauges, C. (2010) What are Households Willing to Pay for Better Tap Water Quality ? A Cross-Country Valuation Study, Documents de Travail du Centre d’Economie de la Sorbonne, 2010.51.
53 Birol, E. Karousakis, K. and Koundouri, P. (2006) Using economic valuation techniques to inform water resources management: A survey and critical appraisal of available techniques and an application. Science of the Total Environment 365: 105–122.
Department of Sustainability, Environment, Water, Population and CommunitiesLiterature Review of the Economic Value of Ecosystem Services that Wetlands Provide
.20.
MARSDEN JACOB ASSOCIATES
Studies have explored use values such as air quality, recreation (proximity to wetlands), as well as indirect use values such as storm and flood protection.
The method is robust but very data intensive (and thus expensive if purchasing property sales data), also requiring advanced technical skills to undertake.
Tapsuwan, Ingram and Brennan (2007)54 - Western Australia - impact on land values
Tapsuwan, Ingram and Brennan (2007) undertook a hedonic pricing study in Western Australia on the value of the urban wetlands of the Gnangara Mound, an extensive groundwater system that supplies 60% of Perth’s potable water. Many of the wetlands on the Mound are groundwater dependent.
Using data on residential property sales prices, along with property and neighbourhood attribute, Tapsuwan et al. found that:
the marginal implicit price of being closer to a wetland by 1 metre, evaluated at the mean sales value, was $829 (AU$2007);
if there is more than one wetland within 1.5 km of a property, the second wetland will increase the property price by $6081 (AU$2007); and
for a 20 ha wetland, the total premium on sales due to wetland proximity for all surrounding residences is estimated to be AU$140 million, based on average property characteristics and median housing densities.
3.2.2 Indirect use valuesIndirect use values can only be measured indirectly, since they are derived from supporting and protecting activities that have directly measurable values.
For example, coastal and estuarine wetlands perform a protective function which prevents or reduces damage from storm and flood events, providing mitigation services. Measuring the value of these services requires understanding of how they support and protect economic activities and human lives in the surrounding areas, such as protecting property and land values, a range of productive activities (farming, fishing), and drinking water supplies.
Similarly, by providing breeding habitat for near-shore fisheries, coastal and estuarine wetlands support and enhance the productivity of these fisheries, producing commercial values.
Ecosystem services producing indirect use values are estimated using a range of tools that explore their impact on related activities. In addition to hedonic pricing (described above for flood and storm protection), indirect use values are estimated using the following tools.
54 Tapsuwan, S., Ingram, G. and Brennan, D., 2007, Valuing Urban Wetlands of the Gnangara Mound: A Hedonic Property Price Approach in Western Australia. CSIRO: Water for a Healthy Country National Research Flagship Canberra.
Department of Sustainability, Environment, Water, Population and CommunitiesLiterature Review of the Economic Value of Ecosystem Services that Wetlands Provide
.21.

MARSDEN JACOB ASSOCIATES
Production Function
The production function approach values ecosystem services as inputs into another production process, and focuses on estimating those ecosystem services arising from the regulatory and habitat functions of ecosystems.
The production can be for a marketed good, such as fish catch, or for a non-marketed service, such as the protection of human property or health, which benefits individuals.
Production function approaches aim to measure these indirect use values through modelling how changes in ecosystem services support or protect economic activities. Because the benefits of these services appear to enhance the productivity of economic activities, or protect them from possible damages, one possible method of measuring the aggregate willingness to pay for such services is to estimate their value as if they were a factor input in these productive activities.55
The basic approach to production function methods is to measure the change in the marketed production activities of an economy caused by the change in regulatory and habitat functions of wetlands. Harm caused by deteriorating wetland condition can negatively affect the marketed economic activities, for example reducing fish catch and increasing prices to consumers. Improving condition can increase the fish catch and reduce prices to consumers. The sum of changes to consumer and producer surpluses is used to measure the marginal willingness to pay for the change.
Barbier notes that the application of the production function approach is limited currently to a handful of ecological services where the key ecological and economic relationships are sufficiently understood, specifically the role of coastal wetlands as a nursery and breeding habitat for near-shore fisheries and in providing storm protection for coastal communities.
55 Barbier, 2007.
Department of Sustainability, Environment, Water, Population and CommunitiesLiterature Review of the Economic Value of Ecosystem Services that Wetlands Provide
.22.
MARSDEN JACOB ASSOCIATES
Morton (1990)56 - Moreton Bay Mangroves - habitat and nursery services (commercial fisheries)
Morton (1990) valued the mangroves of Moreton Bay, SEQ, based on the market value of fish caught. The study estimated the value of mangroves at $8,380 per hectare based on the market value of the fish caught (not taking into account juvenile fish of commercially important species).
Barbier (2007) and (2002) - Thailand - habitat and nursery services (commercial fisheries)
Barbier (2007)57 applies the production function method to value coastal wetlands and, in particular, the role of coastal wetlands as a nursery and breeding habitat for near-shore fisheries.
This study examined mangrove wetlands in Thailand, where mangrove deforestation has been particularly prevalent, to value these ecological services. Between 1961-96, it is estimated that Thailand lost around 56% (2,050 km2) of its mangrove forests, mainly due to shrimp aquaculture, although mangrove losses slowed subsequently, with estimates suggesting mangroves losses of 3.44km2-18km2 during 1996-2004. Mangrove degradation and losses cause a decline in production of fish and shellfish.
Barbier values the habitat service provided by mangroves for fisheries (as spawning grounds and nurseries for fry). The paper develops a new “dynamic” model of the coastal habitat-fishery linkage, linking wetland area with multi-period harvesting of the fishery.
Barbier estimates that the net present value of the welfare loss from reduced mangrove support for fisheries ranges from around US$1.5 to 2.0 million (for the lower deforestation estimate) and around US$0.28 to 0.37 million (for the higher deforestation estimate).
The estimated marginal value of a hectare of mangrove for fish and shellfish production was quite sensitive to assumptions about the elasticity of demand for fisheries output. Barbier noted that when demand is inelastic, decreases in output bring forth a large increase in price and, hence, a high value per hectare for remaining mangroves.
The estimated marginal value of a hectare of mangrove for fish and shellfish production was $135.44 per hectare per year, with highly inelastic demand (demand changed little with changes in price) but only $3.98 per hectare per year when demand is highly responsive (elastic) to price changes (1993 dollars).
Replacement Cost
The replacement cost method of ecosystem service valuation assumes the value of an ecosystem service is equal to the cost of replacing that service (or level of service) should it be lost. While technically, cost is not a reflection of value (because one might value the service much more highly than the cost of replacement), it is sometimes used when willingness to pay is unable to be assessed.
56 Morton, R. M. (1990) Community structure, density and standing crop of fishes in a subtropical Australian mangrove area. Marine Biology, 105, 385‐294.Citedi n Kirkpatrick, 2011.
57 Barbier, E.B. 2007. “Valuing Ecosystem Services as Productive Inputs” Economic Policy 22 (49): 177–229.
Department of Sustainability, Environment, Water, Population and CommunitiesLiterature Review of the Economic Value of Ecosystem Services that Wetlands Provide
.23.

MARSDEN JACOB ASSOCIATES
As with production function, it is used to determine the value of flood and storm mitigation, water purification and habitat provision.
It is assumed that the cost of avoided damage or substitutes match the original benefit. But many external circumstances may change the value of the original expected benefit and the method may therefore lead to under- or overestimates.
Using replacement cost to value the Catskills watersheds (NY)58
Historically, the Catskills watersheds have supplied New York City “freely” with high quality water with little contamination as part of the “natural filtration” process of the rich and diverse ecosystems on the banks of streams, rivers, lakes and reservoirs comprising these watersheds. However, increasing housing developments and pollution from vehicles and agriculture have threatened water quality in the region. By 1996, New York City faced choice: either it could build water filtration systems to clean its water supply or the city could protect the Catskill watersheds to ensure high-quality drinking water. New York chose to protect the Catskills. In retrospect, the decision was an easy one. It was estimated that the total costs of building and operating the filtration system were in the range of $6 billion to $8 billion. In comparison, to protect the water provision service of the Catskills, New York is obligated to spend $250 million during a ten-year period to purchase and set-aside over 140 thousand hectares in the watershed. In addition, a series of land regulations were implemented controlling development and land use in other parts of the watershed. Overall, New York City estimated that it would cost $1 billion to $1.5 billion to protect and restore the natural ecosystem processes in the watershed, thus preserving the clean drinking water service provided by the Catskills.
In the Catskills case, it was not necessary to value all of the services of the watershed ecosystems. It was sufficient simply to demonstrate that protecting and restoring the ecological integrity of the Catskills was less costly than replacing this ecosystem service with a human-constructed water filtration system.
Avoided Cost (Expected Damage Function)
The avoided cost approach to ecosystem service valuation estimates the value of the protective function of a wetland that reduces the probability and severity of economic damage, by the reduction in expected damage achieved by the wetland.
This approach has been used in risk assessment of airline safety performance, road safety and health economics (disease and accident rates), and expected flood damage estimates are undertaken routinely by government agencies and insurance companies. The key step in applying this approach to wetland valuation is estimating how changes in the wetland affect the probability of damage occurring.
As such, this approach can be used to estimate flood damage values and storm damage values, provided the relationship between wetland area and expected incidence of damaging events can be established, as well as that between wetland area and the additional economic damage caused per event.
58 Source: Barbier 2007.
Department of Sustainability, Environment, Water, Population and CommunitiesLiterature Review of the Economic Value of Ecosystem Services that Wetlands Provide
.24.
MARSDEN JACOB ASSOCIATES
Barbier 2007 - Thailand - storm protection services
Barbier provides a case study of mangrove ecosystems in Thailand , and uses the expected damage function to value the storm protection services provided by the mangroves. He notes that changes in wetland area affect the probability and severity of economically damaging storm events in coastal areas, particularly relevant in the light of the 2004 tsunami that affected Thailand and other parts of Asia.
Therefore, the expected damage function can be used to value the benefit provided by the ecosystem service, measured by the reduction in expected damage to economic activities, property and even human lives as a result of the mangrove wetlands. The EDF approach required two steps to estimate the changes in expected storm damages:
an estimate of the influence of wetland are on the expected incidence of economically damaging natural disaster events;
a measure of the expected incidence of economic damage incurred per event.
Barbier used data on past storm events, and changes in wetland area, and estimates of economic damages inflicted by each event to inform the value estimate. The results were as follows:
The marginal effect of a 1km2 loss of mangrove area is an increase in expected storm damages of about US$585,000 (2007 USD);
for the high deforestation estimate, the annual welfare loss in storm protection services amounted to around US$3.4 million, with the NPV loss (over 1996-2004) ranging from US$16.1 to 19.5 million
for the low deforestation estimate, the annual welfare loss in storm protection was estimate at around $US0.65 million, with the NPV loss (over 1996-2004) ranging from around US$3.1 to 3.7 million.
He compared the expected damage function approach with a study involving replacement cost (Sathirathai and Barbier 2001) and noted that the latter tended to produce overestimates of ecosystem services value (which estimated a replacement cost value of storm protection of US $12,263 per ha per year) and considered that the expected damage function may provide more reliable values of the storm protection services of coastal wetlands.
Contingent behaviour
The contingent behavior approach uses a survey that describes a hypothetical change in environmental quality (e.g. change on wetland condition) and asks survey respondents directly for the changes in their behaviour contingent to the quality change. The approach is very useful for exploring the marginal benefits and costs of incremental changes in the quality of wetlands and how that would impact on recreation and tourism activity.
Very few contingent behaviour studies have been undertaken in Australia, except for assessments of relationships between the quality of the GBR (coral and reef fish, condition and diversity) and the propensity of divers and snorkelers to visit (and revisit) the reef.59
59 Kragt, M., Roebeling, P. & Ruijus, A. (2006) Effects of Great Barrier Reef Degradation on Recreational Demand: A Contingent Behaviour Approach. International Association of Agricultural Economists Annual Meeting. Queensland, Australia. Kragt, M., Roebelling, P. & Ruijus, A. (2009) Effects of GBR degradation on recreational reef-trip: a contingent behavior approach. Australian Journal of Agricultural and Resource
Department of Sustainability, Environment, Water, Population and CommunitiesLiterature Review of the Economic Value of Ecosystem Services that Wetlands Provide
.25.
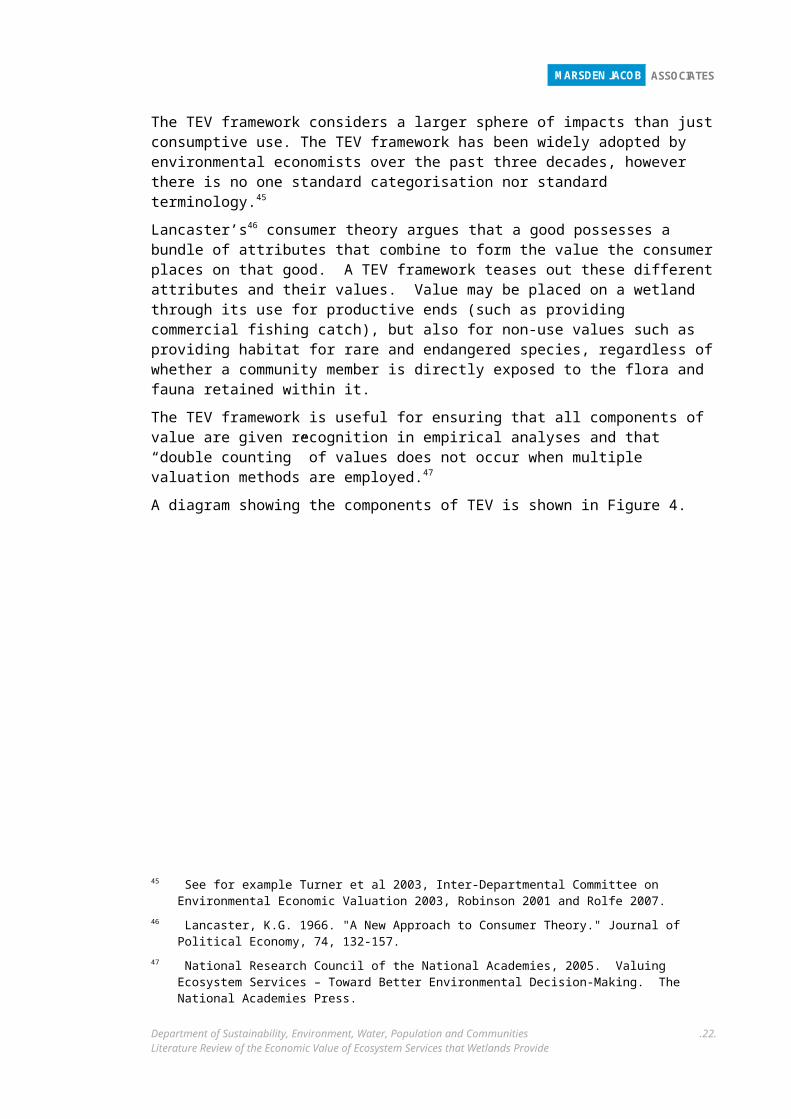
MARSDEN JACOB ASSOCIATES
Kragt et al. (2009)[1][1] - Australia (Great Barrier Reef) – Contingent valuation study - recreational values and tourism
Kragt et al. used a contingent behaviour approach to examine how degradation of coral reefs affects demand for recreation in the Great Barrier Reef, in relation to recreational snorkel and dive trips, and consequently, to determine the effect on the economic sectors that rely on healthy reefs for their income generation. The concern was that increased nutrient and sediment concentrations in river runoff could result in an increase of algal-dominated reef systems, decreased reproductive capacity of coral, and reductions in both coral and fish biodiversity. They noted that an important difference from previous recreation studies was that their study did not model environmental improvements, but the effects of environmental degradation on recreational demand.
The contingent behaviour survey was directed at GBR visitors in Port Douglas, and also included interviews with snorkellers. It elicited information on respondents’ visits to the GBR region, their perception of reef quality, the price paid for the full-day trip to the reef, the number of recreational reef trips made in the past 12 months and the number of reef trips planned for the next five years (at current reef quality). Respondents were then presented with a hypothetical (but scientifically-based) scenario, including photographs, of reef degradation and were asked if they would change their planned number of reef trips in the next five years if the specified reef degradation occurred due to exposure to pollution. The pictures showed a visible decline in coral cover, coral diversity and fish diversity of approximately 80, 30 and 70 per cent, respectively.
Kragt et al. found that:
the consumer surplus reef visitors derived from a diving or snorkelling trip was approximately A$185 per trip;
reef trips by divers and snorkellers could go down by as much as 80 per cent given a hypothetical decrease in coral and fish biodiversity (an average visitor would undertake about 60% less reef trips per year given a combined 80%, 30% and 70% decrease in coral cover, coral diversity and fish diversity, respectively; and
this corresponded to a decrease in tourism expenditure by divers and snorkellers on full-day reef trips in the Cairns management area of the Great Barrier Reef Marine Park of about A$103 million per year.
3.2.3 Non-use valuesValues for ecosystem services may be held by parties not directly using them, or actively benefitting from them. Members of a community may hold a willingness to pay for the existence, bequest and altruism (non-use) values that wetlands provide. They may also support recreational use values that healthy wetlands provide, despite having no intention to ever benefit personally from those values.
Economics, 53, 213-229.[1] [1] Kragt, M., Roebeling, P., and Ruijs, A, (2009), Effects of Great Barrier Reef degradation on recreational
reef-trip demand: a contingent behaviour approach, Australian Journal of Agricultural and Resource Economics 53 (2): 213–229.
Department of Sustainability, Environment, Water, Population and CommunitiesLiterature Review of the Economic Value of Ecosystem Services that Wetlands Provide
.26.
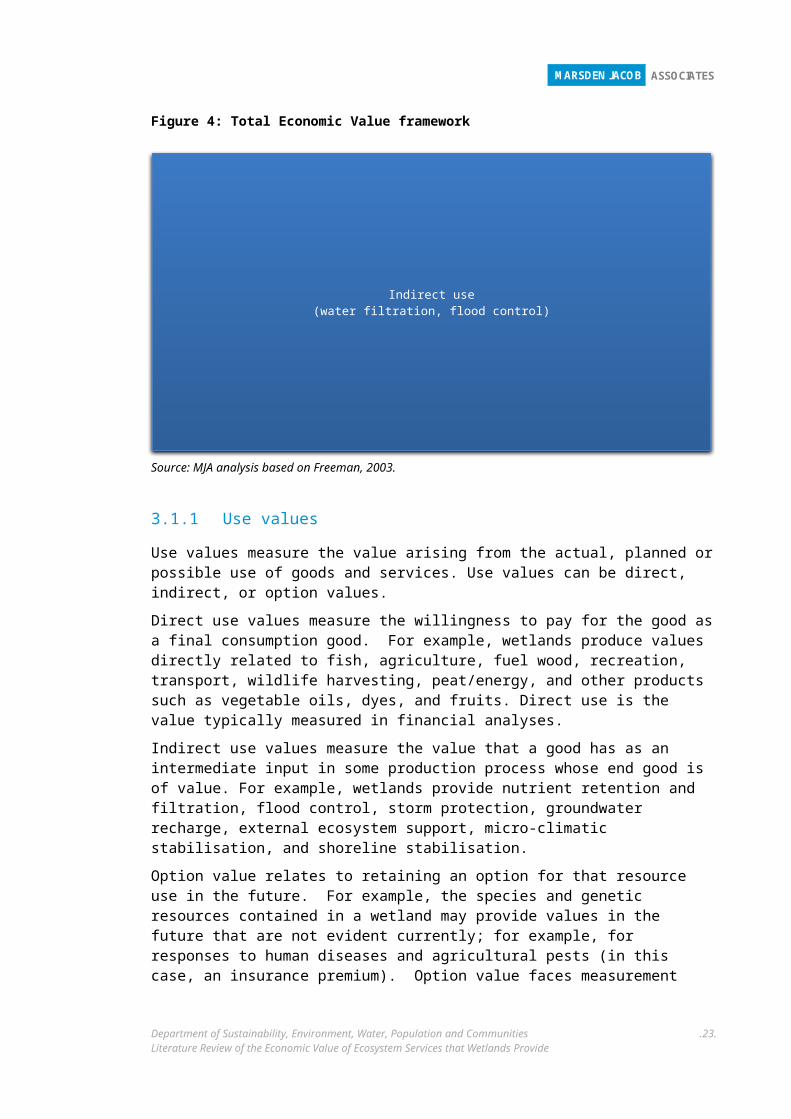
MARSDEN JACOB ASSOCIATES
Determining the nature and extent of non-use values is more difficult and potentially imprecise than the above values, because unlike measurement of use values there is no market data that can be used to assist estimation. Instead, community willingness to pay for these values must be estimated using hypothetical scenarios with different payment options in which survey respondents are asked to state their preferences.
These ‘stated preference’ tools are often considered less defensible than revealed-preference approaches available for use values, and can be subject to a range of biases and errors.
The two primary stated preference tools are choice modelling and contingent valuation.
Choice Modelling
Choice modelling is a survey based valuation method that presents respondents with varying attributes (including attributes for ecosystem services) that are accompanied with different prices. Respondents are asked to choose the option they prefer, which reveals their willingness to pay for varying levels of each attribute. By repeating this process a number of times (each respondent makes numerous choices) and surveying a large number of people, the average community willingness to pay for changes in attributes can be established.
So, for example, the community willingness to pay for increases in the habitat provision function for rare or endangered species can be established. Different marginal changes can also be explored. That is, a willingness to pay for ‘no further decline’ could be significantly different from a doubling of habitat.
As noted, this is a highly technical method that can be expensive, requires high level expertise to implement, and can produce results that are sometimes contested. It can also be subject to a number of biases that often bring results into question. Nevertheless, it can provide useful insights into community values for wetland ecosystem services.
Choice modelling essentially values ‘environmental attributes’ and therefore provides significant opportunities to transfer values from studies of wetland values undertaken in one area to similar types of wetlands elsewhere.
Department of Sustainability, Environment, Water, Population and CommunitiesLiterature Review of the Economic Value of Ecosystem Services that Wetlands Provide
.27.
MARSDEN JACOB ASSOCIATES
Marsden Jacob Associates (2010)60 - Australia (SEQ) - CM survey
MJA undertook a choice modelling survey as part of a study for SEQ Catchments to estimate community values attributable to environmental decline in South East Queensland.
A choice modelling approach was undertaken to elicit the SEQ community’s willingness to pay (WTP) to avoid declines in resource condition and meet NRM targets established in the SEQ NRM Plan. Key results were as follows:
By 2031, the annual costs to each household attributable to a decline in resource condition could be as high as $290. The survey results indicate that SEQ households are willing to pay that amount (about $5.60/week) via higher rates, taxes and costs for goods and services to maintain the current level of social values attributable to the natural environment.
The highest values relate to water quality in creeks and rivers and coastal condition. Survey data reveals that households would be willing to pay approximately $120 per annum to avoid the expected declines in these assets. Values for scenic amenity, maintenance of woody vegetation and inland wetlands were relatively lower.
Enhancing resource condition from current levels also provides significant social benefits to households. For example, by 2031 the value of the enhancements proposed in the Plan could be as high as $100 per annum on average for SEQ households. Of the enhancements proposed, in excess of 50% of the benefits are attributable to enhancing water quality in creeks and rivers.
The values of marginal enhancements are lower than values for marginal declines of the same magnitude (at the current level of resource condition); i.e. households would pay more to avoid further decline in resource condition than they are prepared to pay to enhance resource condition at a later date through rehabilitation.
Contingent valuation
Contingent valuation is a survey approach in which respondents are presented with the status quo and an alternative scenario representing a specific change in ecosystem service provision. Respondents are asked whether they would be willing to pay a sum of money to achieve the outcome, from which community willingness to pay is developed.
Unlike choice modelling, different attributes of ecosystem function are not varied to elicit different willingness to pay levels for different marginal changes. As such, contingent valuation lacks some of the complexity of choice modelling. However, it is recognised that choice modelling places a significant cognitive burden upon respondents by asking them to comprehend and quantify their preferences for various attributes that they would not usually place dollar values upon.61 As such, contingent valuation can offer a more simplistic and realistic choice to respondents.
One established shortcoming of contingent valuation is the potential for respondents to ‘anchor’ preferences on the first value presented to them. Another is the potential for ‘yea-saying’
60 Marsden Jacob Associates (2010), Managing what matters: the cost of environmental decline in SEQ, A report prepared for South East Queensland Catchments.
61 Hanley, N., S. Maurato and R.E. Wright. 2001. “Choice Modelling Approaches: A Superior Alternative for Environmental Valuation?” In Journal of Economic Surveys, Vol 15, No 15.
Department of Sustainability, Environment, Water, Population and CommunitiesLiterature Review of the Economic Value of Ecosystem Services that Wetlands Provide
.28.
MARSDEN JACOB ASSOCIATES
stating a willingness to pay for an outcome for the purposes of the survey that they would not in reality be prepared to pay.
Consideration of these shortcoming can alleviate their impact upon study results, but they are inherent problems to stated preference surveys.
Clouston (2002)62 - SE Queensland - use and non-use functions
Clouston (2002) examined the value of wetlands using a case study of wetlands in Moreton Bay, SE Queensland (which includes mangroves).
The economic values of these wetlands are both direct (fisheries, recreation) and indirect (habitat, storm protection, water quality, waste assimilation) and include non‐use values (cultural, conservation). Moreton Bay supports a wide range of flora and fauna, including turtles and dugongs leading to additional non‐use values associated with conservation.
The study assessed whether the contingent valuation method can be used to determine the ecological value that survey respondents held for the wetlands of Moreton Bay and whether their values can be influenced by how much information they are provided with (e.g. no additional information, ecological information, use value information and non‐use value information (Clouston, 2002).
Respondents were asked their willingness to pay for a hypothetical conservation trust fund to undertake management options to improve the water quality of wetlands. Of those that were willing to pay, respondents that were provided with ‘non‐use’ information were willing to pay $11.41 and those that were provided with ‘use’ information were willing to pay $19.22.
The survey results found that between 39.6% and 51.6% of respondents (depending on the information provided) indicated that they would be unwilling to pay (mostly on the basis of not being able to afford it). Once these ‘protest bids’ were removed, the study found that the remainder of respondents were, on average, willing to make a ‘one off’ payment of $22.74 (Clouston, 2002).
Benefit Transfer
Implementation of the above tools is technically demanding, time consuming and expensive. They are advanced economic tools that require expertise in applied economics. Implementation typically requires the skills of leading academics and/or economic consultants, and it could not reasonably be expected that staff without these skills could implement them. Their use is also predicated upon reasonably detailed biophysical data on wetland function.
Stated preference tools especially require careful preparation and implementation, and produce results that are questioned by some (but are increasingly incorporated into economic regulation).
The benefit transfer method can be used to obtain economic values for goods and services by drawing on available valuation information from studies already completed in another location. For example, values associated with recreational fishing in Western Australia may be estimated
62 Clouston, E. M. (2002) Linking the Ecological and Economic Values of Wetlands: A Case Study of the Wetlands of Moreton Bay. phD Thesis, School of Australian Environmental Studies, Faculty of Environmental Sciences, Griffith University, Brisbane.
Department of Sustainability, Environment, Water, Population and CommunitiesLiterature Review of the Economic Value of Ecosystem Services that Wetlands Provide
.29.
MARSDEN JACOB ASSOCIATES
by applying measures of recreational fishing values from a study conducted in another state of Australia.
Thus, the basic goal of benefit transfer is to estimate benefits for one context by adapting an estimate of benefits from some other context.
However, adapting estimates from one context to another requires technical skills as well as an understanding of the key drivers of values, and how they differ between sites.
Table 3: Methods of Benefit Transfer
Transfer method
Description Example
Single point value transfer
A single value is transferred without adjustment from source study to target site
A premium value for properties with wetland views of $5,000/property is transferred from site A to site B
Marginal point value transfer
A single value that allows for site differences is transferred
A property premium value is transferred and adjusted for property numbers and average property prices
Benefit function transfer
A valuation function is transferred, allowing adjustment for variety of site differences
A valuation function with several attributes is transferred from site A to site B (e.g. property size, distance to wetland)
Meta value analysis
Results of several studies are combined to generate a pooled model
Results from studies X, Y and Z are pooled to estimate a value for Site B
Source: Adapted from Rolfe, John. 2006. “A Simple Guide to Choice Modelling and Benefit Transfer” in Rolfe, J and J. Bennett. 2006. Choice Modelling and the Transfer of Environmental Values. Edward Elgar Publishing
Benefit transfer is most reliable when the original site and the study site are very similar in terms of factors such as quality, location, and population characteristics; when the change in the good or service is very similar; and when the original valuation study was carefully conducted and used sound valuation techniques.
As will be discussed in Section 4, it may be that benefit transfer can be used within a coherent framework to further incorporate economic values of ecosystem services into policy decisions.
Table 4 summarises the key tools, the types of values estimated by them, and the strengths and weaknesses of each.
Department of Sustainability, Environment, Water, Population and CommunitiesLiterature Review of the Economic Value of Ecosystem Services that Wetlands Provide
.30.
MARSDEN JACOB ASSOCIATES
Table 4: Strengths and weaknesses of valuation techniques
Valuation method
Type of values estimated
Advantages Disadvantages
Travel cost Direct use (tourism)
Based on revealed preferences, it reflects actual behaviour.Particularly appropriate for tourism values
Data intensive and technically demandingAppropriate cost attribution of ‘travel cost’ is contentious
Averting behaviour
Direct use (health)
Based on revealed preferences, it reflects actual behaviour.
Data requirements are highMay be few cases in Australia where water supply is compromised by wetland function
Hedonic pricing
Direct and indirect use (active use, aesthetics)
Statistically robustBased on revealed preferencesAppropriate data sets already existRelevant to Australian context where proximity to high value water bodies affects property values
Data sets expensive to purchaseRequires high level technical skills
Production function
Indirect use (commercial and recreational fishing, storm and flood protection)
Provided data exists, results are robust and defensible (based on commercial data)Highly relevant to Australian fisheries
Limited to specific ecosystem services (fish breeding habitat, flood and storm protection)Requires detailed data on relationship between wetland and economic function
Replacement cost
Indirect use (flood and storm mitigation, water purification and habitat provision)
Less technically demanding than other tools
Methodological limitation - assumes cost equals value, but value may be much higher.External factors impact valuation – as such, produces less robust results than other tools
Avoided cost (expected damage function)
Indirect use (flood damage, storm damage)
Technically robust and built upon economic data – produces robust, reliable results
Requires detailed data on relationship between wetland and economic damage due to extreme events.
Contingent behaviour
Indirect use (tourism)
Useful for valuing incremental changes to wetland health (strong link to measure economic implications of management changes)
Technically demandingStated preference tools are considered less reliable than revealed preference tools.
Department of Sustainability, Environment, Water, Population and CommunitiesLiterature Review of the Economic Value of Ecosystem Services that Wetlands Provide
.31.
MARSDEN JACOB ASSOCIATES
Valuation method
Type of values estimated
Advantages Disadvantages
Choice modelling
Non-use values
Sophisticated tool which can reveal values for different aspects of ecosystem services.Considered more robust than other stated preference tools.
Technically demanding and potentially expensive.Requires the development of clear, well understood scenarios to survey respondents.
Contingent valuation
Non-use values
Useful for scenarios in which one clear alternative wetland state exists.
Technically demandingSubject to methodological criticism within the economic field (bias, robustness of results)
Source: MJA analysis.
Department of Sustainability, Environment, Water, Population and CommunitiesLiterature Review of the Economic Value of Ecosystem Services that Wetlands Provide
.32.
MARSDEN JACOB ASSOCIATES
3.3 Case studiesBelow are two case studies that explore different aspects of ecosystem services valuation and its use within policy formation and investment decision-making.
3.3.1 Ecosystem services valuation in the CoorongThe Coorong, Lower Lakes and Murray Mouth region is located at the downstream end of the Murray-Darling River system, and is also known as the “Coorong, and Lakes Alexandrina and Albert (Lower Lakes) Wetland of International Importance” Ramsar site.63
The Coorong is almost 150,000 hectares in size and has a diverse range of freshwater, estuarine and marine habitats. The flora and fauna found in the Coorong are unique internationally. A major site for water bird breeding, many internationally migratory birds can also be found here.
The Coorong is a long, shallow, brackish to hypersaline lagoon more than 100 kilometres in length. It is separated from the Southern Ocean by a narrow sand dune peninsula. Saline waters of the Coorong lagoons and Murray Mouth estuary are prevented from entering the lakes and the Murray River by a series of barrages built in the 1930s.
The region is the only point of entry and exit for fish that move between freshwater and marine habitats.
Study context and policy relevance
As an iconic site of national and international significance, a significant ecosystem service provided by the Coorong is the supportive service of biodiversity protection due to the habitat it provides to unique flora and fauna, especially waterbirds.
Located at the end of the Murray Darling river system, the health of the Coorong is affected by the timing, quality and quantity of fresh water that flows from the Murray River. As such, management decisions made in upstream waterways, not only in South Australia but also in Victoria, New South Wales, the ACT and Queensland, can influence the ecosystem services provided in the Coorong. Conversely, decisions made to increase ecosystem services in the Coorong have implications that extend far upstream.
The recent period of prolonged drought that affected the entire length of the Murray Darling Basin placed the Coorong under environmental stress. This prompted national action to better protect general river health and the health of iconic sites in particular through the Murray Darling Basin Plan.
.
63 http://www.environment.sa.gov.au/Conservation/Rivers_wetlands/Coorong_Lower_Lakes_Murray_Mouth
Department of Sustainability, Environment, Water, Population and CommunitiesLiterature Review of the Economic Value of Ecosystem Services that Wetlands Provide
33.
MARSDEN JACOB ASSOCIATES
Ecosystem valuation study – wetland bird habitat
Hatton MacDonald et al64 undertook a nonmarket valuation study using Choice Modelling to explore the values held by Australians for changes to a range of environmental attributes associated with the Murray River, including waterbird habitat in the Coorong.
As described above, Choice Modelling is a survey tool in which respondents are provided with scenarios describing a current situation, and hypothetical scenarios depicting changes from the current situation, with associated costs . Respondents are asked to choose their preferred scenario. Repeated choices allow a ‘willingness to pay’ for environmental improvement to be derived for each respondent, which can be extrapolated to the broader population for use in decision-making.
Table 5: Attributes used
Attributes Current situation Levels in options B and C
Waterbird breeding along theRiver Murray
Every 10 years 10, 7, 4, 1
Native fish in the River Murray 30% of original population 30%, 40%, 50%, 60%
Healthy vegetation along theRiver Murray
50% of original area 50%, 60%, 70%, 80%
Waterbird habitat in the Coorong Poor quality Good quality
Household cost per year for10 years
$0$20, $50, $75, $100,$125, $150, $200, $250
Source: Hatton MacDonald et al 2011.
The full set of attributes used in the study is outlined in Table 5. The choice of attributes was motivated in part by a desire to compare ecosystem service values in the Lower Murray (Coorong) and upper reaches of the River. Attribute design was also informed by use of focus groups and expert opinions of bio-physical scientists in ecology and hydrology.
The questionnaire was provided to 6,000 households, stratified by geographic areas of Australia. In addition to the series of choice sets, survey respondents were provided with information relating to environmental condition of the Murray River and iconic sites and how they could be improved, as well as agricultural values associated with water use in the Murray Darling Basin.
Respondents were told that improving environmental outcomes would involve payment through taxation and higher food prices, paid over ten years.
Study results
The study found the following key results per household:
Willingness to pay to improve waterbird habitat in the Coorong ranges from $126.63 per year for 10 years in Victoria to $198.15 in the ACT;
64 Hatton MacDonald, D., M. Morrison, J. Rose, Boyle, K. 2011. The Australian Journal of Agricultural and Resource Economics, 55, pp. 374–392.
Department of Sustainability, Environment, Water, Population and CommunitiesLiterature Review of the Economic Value of Ecosystem Services that Wetlands Provide
34.
MARSDEN JACOB ASSOCIATES
WTP to increase the frequency of waterbird breeding along the Murray by 1 year ranges from $12.00 to $18.64 per year for 10 years;
WTP for an increase in frequency from once every 10 years to every year (the maximum improvement possible) is $107.97–$167.80 per year for 10 years;
WTP for a 1 per cent increase in native fish populations in the River Murray ranges from $1.71 to $3.58 per year for 10 years; and
WTP for a one percentage increase in healthy vegetation along the River Murray is from $2.87 to $4.42 per year for 10 years.
As can be seen, improvement in waterbird habitat in the Coorong attracts a significant willingness to pay from respondents, reflecting a strong desire to improve the health of the Coorong from ‘poor quality’ to ‘good quality’.
Once aggregated over the Australian population over ten years, total WTP for improving the Coorong is estimated at $5.8 billion.
Overall, total WTP to increase the frequency of waterbird breeding from every 10 years to every 4 years, to increase native fish populations from 30 to 50 per cent of original levels, to increase the area of healthy native vegetation from 50 to 70 per cent and to improve waterbird habitat quality in the Coorong is equal to A$13 billion using a discount rate of 5 per cent.
Limitations and use of the study
Some limitations of the study were acknowledged by the authors:
the use of qualitative descriptors of ‘good’ and ‘poor’ quality for waterbird habitat in the Coorong allows respondents to interpret these terms according to their own understanding of them, and can combine a range of values for ‘good quality habitat’. This affects the precision of the results;
the study was undertaken at the height of the drought, and the high values may reflect this timing; and
as the study explored iconic and unique assets (the Murray and the Coorong), transferability of findings to smaller wetlands or rivers would not be appropriate;
The non-use values explored in this analysis were not used by the MDBA which opted to focus on use values associated with changes in environmental outcomes.
The transferability of results prior to implementation needs to be explored as part of any workplan for ecosystem services valuation undertaken by the Department.
Other ecosystem services and values
Beyond the existence values explored in the study, there are other ecosystem services provided in the Coorong that may be worthy of exploration and valuation, including those related to:
Provisioning services (fresh water quantity): CIE (2011) found that increasing the health of the Coorong was associated with a present value benefit of $17.8m using the avoided cost method (avoided dredging of the Murray Mouth);
Department of Sustainability, Environment, Water, Population and CommunitiesLiterature Review of the Economic Value of Ecosystem Services that Wetlands Provide
35.
MARSDEN JACOB ASSOCIATES
Provisioning services (fresh water quality): CIE (2011) estimated water quality values for improved environmental health in the Murray (including the Coorong) of $10.3m due to avoided cost of salinity;
Habitat services (nursery): the Coorong is used for professional fishing, benefitting from the fisheries nursery it provides; and
Cultural services (tourism, recreational boating): The Coorong is a destination tourism site that attracts boating enthusiasts and other visitors. These cultural values are dependent upon ecosystem function and can be estimated through travel cost method.
Estimation of the scale of these values may inform the Department of the benefits arising from improved management, and be used to inform decisions on prioritising investments in wetland management.
3.3.2 Case Study – SEQ and Moreton BayMoreton Bay is a Ramsar listed wetland in South East Queensland (SEQ). Moreton Bay was listed in 1993, with an area of approximately 113,000 ha. Moreton Bay has been listed under several Ramsar Criteria (1, 2, 3, 4, 5 and 6), and retains several wetland types ranging from marine aquatic beds to permanent inland rivers and creeks.65
The SEQ coastline supports diverse coastal and marine ecosystems and is the basis for significant community, recreational (including tourism) and commercial activities. Key assets and issues include the extent and condition of seagrass and mangroves, coral, beaches, fish stocks, key species and coastal wetlands, and the extent and frequency of coastal algal blooms.
Study context and policy relevance
State of the Region and the annual Healthy Waterways Report Card evaluations of the condition of Moreton Bay all indicate a declining trend in the condition of Moreton Bay. This has resulted in a number of policy responses such as changes to the Moreton Bay Marine Park, the Healthy Waterways Strategy and other initiatives such as commercial fisheries management to maintain the ecological integrity of Moreton Bay.
The population of SEQ adjacent to Moreton Bay is currently around 3.2 million and is growing at around 1.9% per annum. By 2031, the region’s population could be as high as 5 million people.66 This population growth is triggering significant land use change, industrial development and residential development – all contributing to rapid increases in pollution loads into SEQ waterways and ultimately Moreton Bay. Table 6 shows current and estimated future loads.
65 National wetlands database.66 Office of Economic and Statistical research (2012) Population and housing profile 2012.
Department of Sustainability, Environment, Water, Population and CommunitiesLiterature Review of the Economic Value of Ecosystem Services that Wetlands Provide
36.

MARSDEN JACOB ASSOCIATES
Table 6: Key risk to Moreton Bay – growth in pollution loads
Pollutant and source Current 2031 Growth to 2031
Total Suspended Solids (TSS)
Green space 15,914 15,220 -4%
Rural diffuse 317,862 306,722 -4%
Urban diffuse 132,027 166,539 26%
Point sources 1,388 2,082 50%
Total 467,191 490,563 5%
Total Nitrogen (TN)
Green space 1,140 1,092 -4%
Rural diffuse 2,883 2,791 -3%
Urban diffuse 1,824 2,269 24%
Point sources 1,337 2,006 50%
Total 7,184 8,158 14%
Total Phosphorous (TP)
Green space 54 51 -6%
Rural diffuse 374 361 -3%
Urban diffuse 303 382 26%
Point sources 421 632 50%
Total 1,152 1,426 24%
Source: MainStream (2011) Sharing the Load: a collaborative approach to investing in South East Queensland’s waterways.
Modeling shows that a ‘business as usual’ policy scenario will result in pollution loads into Moreton Bay increasing in the next 20 years – sediment increasing by 5%, nitrogen by 14% and phosphorous by 24%. The major driver of these increases is population growth which results in large increases in urban diffuse loads (due to the intensification of land use) and point sources (attributable to wastewater treatment and industrial emissions).
This is despite the SEQ regional NRM Plan and SEQ Healthy Waterways Strategy both concluding significant reductions of pollution loads are required (to ensure the ecological integrity of Moreton Bay) – with targeted sediment reductions of around 50% from current loads.67,68
The predicted increase in pollutants places significant risks to key ecological values in Moreton Bay such as the presence of seagrass and available food for the iconic dugong..
67 Healthy Waterways Partnership (2007) SEQ Healthy Waterways Strategy 2007-2010.68 Queensland Government (2009) South East Queensland Natural Resource Management Plan 2009-2031.
Department of Sustainability, Environment, Water, Population and CommunitiesLiterature Review of the Economic Value of Ecosystem Services that Wetlands Provide
37.
MARSDEN JACOB ASSOCIATES
Ecosystem services valuation studies in SEQ and Moreton Bay
The concept of ecosystem services has been formally recognised as a potential approach to management in the statutory SEQ Regional Plan under the Sustainable Planning Act69 and significant efforts are underway to identify, scope and map key ecosystem services to underpin resource management in the region.70
As a consequence of this initiative, a number of ecosystems services valuation studies have been undertaken to inform natural resource management and investment decisions. Key ecosystem services, their values and the valuation approaches for those studies are summarised in Table 7.
The key point to note from those studies is that the value of the ecosystem services can be substantial. In addition, the costs of meeting targets can be significantly less than the benefits indicating significant net benefits in enhancing environmental condition. For example, the estimated cost of meeting the targets in the SEQ NRM Plan for creeks and rivers is approximately $280 million in present value terms.71
69 Queensland Government (2009) SEQ Regional Plan 2009-2031.70 Maynard, S, James, D and Davidson, A (2010), The Development of an Ecosystem Services Framework for
South East Queensland Environmental Management: Volume 45, Issue 5, Page 881.71 MainStream Economics and Policy (2011) Sharing the Load: a collaborative approach to investing in South
East Queensland’s waterways.
Department of Sustainability, Environment, Water, Population and CommunitiesLiterature Review of the Economic Value of Ecosystem Services that Wetlands Provide
38.
MARSDEN JACOB ASSOCIATES
Table 7: Wetland and waterway ecosystem services – South East Queensland
Ecosystem services Key findings Valuation approach and comments
Provisioning
Water supply from catchments72
If Seqwater was not able to source water from supply catchments and had to revert to manufactured water supplies, annual costs of meeting SEQ’s potable water supply would increase by $160 million.
Replacement cost based on difference on costs of producing treated water from existing portfolio of dams compared to cost of manufactured water (as the next best alternative).
Commercial fishing Gross value of commercial production is approximately $30 million per annum, and the majority of species are reliant on a good condition estuary system at some point in their lifecycle.73
Gross commercial value of production. Note. This does not directly value the ecosystem service.
Regulating
Water quality from catchments74
A 1% decrease in average in turbidity of raw water supply at off take points would decrease water treatment operating costs by $1 million in present value terms.
Production function modelling based on operating costs of major water treatment plants.
Flood risk mitigation in Brisbane75
Reducing the annual likelihood of a major flood event from once every 50 years to once every 100 years provides a benefit (capitalised value of flood risk avoided) of approximately $16,200 per dwelling.
Avoided cost (expected damage function) based on flood mapping from Brisbane and insurance claims data from the January 2011 flood.
Supporting76
Coastal vegetation and seagrass
The community’s willingness to pay to protect and manage inland wetlands to meet the targets in the SEQ regional NRM Plan is valued at $590 million (present value terms for period up to 2031).
Choice modelling based on community’s willingness to pay to meet targets outlined in the SEQ Regional NRM Plan. Note: sample size = 921 households.
Inland wetlands The community’s willingness to pay to protect and manage inland wetlands to meet the targets in the SEQ regional NRM Plan is valued at $160 million (present value terms for period up to 2031).
Choice modelling based on community’s willingness to pay to meet targets outlined in the SEQ Regional NRM Plan. Note: sample size = 921 households.
72 MainStream Economics and Policy (2012) Economic analysis undertaken to assist with the development of Seqwater’s Catchment Land Management Strategy.
73 Institute for Sustainable Regional Development, 2005, Considering the Economic and Social Impacts of Protecting Environmental Values in Specific Moreton Bay / SEQ, Mary River Basin / Great Sandy Strait Region and Douglas Shire Waters, Report prepared for the Queensland Environmental Protection Agency, March.
74 MainStream Economics and Policy (2012) Economic analysis undertaken to assist with the development of Seqwater’s Catchment Land Management Strategy.
75 MainStream Economics and Policy (2012) Enhancing flood key performance indicators: economic issues.76 MJA (2010) Managing what matters: the cost of environmental decline in SEQ.
Department of Sustainability, Environment, Water, Population and CommunitiesLiterature Review of the Economic Value of Ecosystem Services that Wetlands Provide
39.
MARSDEN JACOB ASSOCIATES
Ecosystem services Key findings Valuation approach and comments
Habitat to support commercial fishing
A 10% decrease in commercial fishing from business as usual due to loss of habitat impacting on catch rates is values at approximately $20 million (present value terms for period up to 2031).
Production function modelling based on industry statistics. Note this estimate is an impact on gross value of production. Note: relationships between change in wetland condition and catch rates not well understood.
Creeks and rivers The community’s willingness to pay to protect and manage creeks and rivers to meet the targets in the SEQ regional NRM Plan is valued at $1.3 billion (present value terms for period up to 2031).
Choice modelling based on community’s willingness to pay to meet targets outlined in the SEQ Regional NRM Plan. Note: sample size = 921 households.
Cultural77
Nature-based tourism
A 10% decrease in nature-based tourism due to loss of habitat impacting on catch rates is valued at approximately $1.8 billion (present value terms for period up to 2031).
Production function modelling based on industry statistics. Note this estimate is an impact on gross value of production. Note: relationships between change in environmental condition and visitation not well understood.
Habitat to support nature based recreation by locals
A 10% decrease in nature-based recreation by locals due to a decline in habitat (extent and condition) is valued at approximately $430 million (present value terms for period up to 2031).
Production function modelling based on industry statistics. Note this estimate is an impact on gross expenditure on recreational activities. Note: relationships between change in wetland condition and recreational fishing activity are not well understood.
Habitat to support recreational fishing
A 10% decrease in recreational fishing expenditure from business as usual due to loss of habitat impacting on catch rates and recreational amenity is valued at approximately $136 million (present value terms for period up to 2031).
Production function modelling based on industry statistics. Note this estimate is an impact on gross expenditure on recreational fishing. Note: relationships between change in wetland condition and recreational fishing activity are not well understood.
Source: MJA based on a review of literature.
Limitations and use of the studies
The enumeration of ecosystem services in SEQ and Moreton Bay is potentially more comprehensive than for any other region in Queensland. The valuations undertaken demonstrate the significant economic values. However, because of the public good nature of the environmental assets that underpin the ecosystem services, establishing policies to ensure
77 MJA (2010) Managing what matters: the cost of environmental decline in SEQ.
Department of Sustainability, Environment, Water, Population and CommunitiesLiterature Review of the Economic Value of Ecosystem Services that Wetlands Provide
40.
MARSDEN JACOB ASSOCIATES
sufficient resources for managing the assets is complex and simply demonstrating that the benefits of intervention exceed the costs is insufficient as a basis for public policy.78
All studies cited above have limitations.
Because of limitations in biophysical science, assumptions have been made about marginal changes in ecosystem services attributable to changes in extent and condition of key natural assets (based on available science). This is particularly the case for supporting and cultural services.
Estimates for fishing, tourism and recreation are effectively measures of changes in gross values of production and gross expenditure, not measures of producer or consumer surplus. Therefore, they cannot be incorporated into formal benefit cost analysis modelling.
Where estimates are in present value terms, an assumption has been made that annual household estimates of marginal changes in natural asset condition and extent from the surveys are maintained over time.
Despite these limitations, the case study does demonstrate the value of understanding and estimating the value of ecosystems services. The studies cited above have already resulted in changes in policy to reduce pollution loads into waterways, investment patterns by water utilities and the prioritisation a greater awareness of the importance of environmental assets in maintaining the objectives of regional planning and development in SEQ.
3.4 Gaps in economic valuation As has been seen in previous sections, there are multiple ecosystem services and approaches to valuing those services. Based on the review of literature we have identified and reconciled the key types of ecosystem services (see Section 3.2), the types of values (Section 4.1) and valuation techniques (Section 4.2). The key points to note are:
a single ecosystem service may provide multiple types of economic values;
the economic values could be valued using numerous techniques, and the choice of technique would be determined by the data availability, resources for the assessment and the likely use of the data (i.e. what sort of purpose); and
there tend to be commonalities of economic values and valuation techniques for specific types of ecosystem functions. For example, many provisioning ecosystem services (such as fish habitat) have been estimated using the avoided cost method while supporting services (such as biodiversity) have been estimated using approaches such as choice modelling.
While several studies have been undertaken to explore non-use values, these are not comprehensive nor guided by a specific research or policy agenda. Importantly, there have been relatively few studies of Australian wetlands undertaken to explore indirect values:
production function (especially for provisioning services);
avoided cost: terrestrial wetlands (flood mitigation, storm surge, purification);
replacement cost; and78 MainStream Economics and Policy (2011) Sharing the Load: a collaborative approach to investing in South
East Queensland’s waterways.
Department of Sustainability, Environment, Water, Population and CommunitiesLiterature Review of the Economic Value of Ecosystem Services that Wetlands Provide
41.
MARSDEN JACOB ASSOCIATES
contingent behaviour.
Given these findings, there may be significant opportunities to better prioritise investments in valuations. Addressing these gaps within a guiding Commonwealth framework is discussed in the next section.
Department of Sustainability, Environment, Water, Population and CommunitiesLiterature Review of the Economic Value of Ecosystem Services that Wetlands Provide
42.
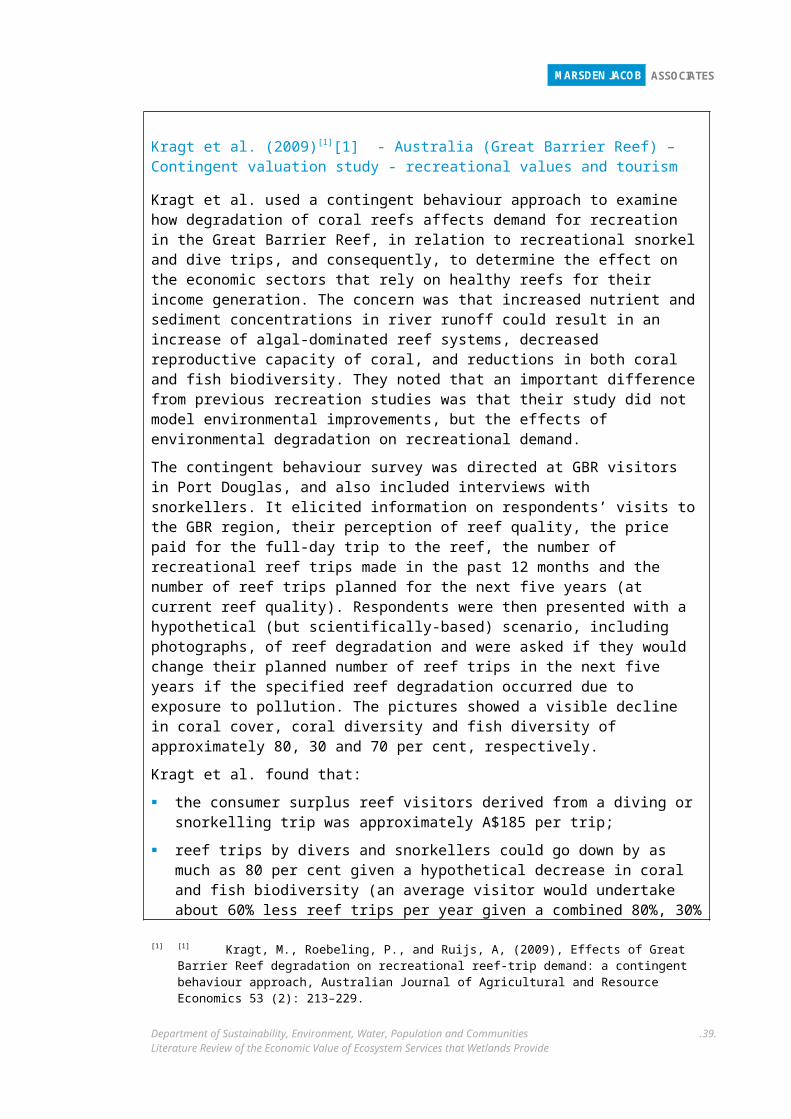
MARSDEN JACOB ASSOCIATES
Table 8: Wetland ecosystem services, values and valuation techniques
Types of values Typical valuation techniquesEcosystem service Direct
UseIndirect
useNon use TC AB AC CB HP PF RC CV CM
Provisioning services
Food (e.g. fish, crustaceans, game, crops (e.g. rice), wild foods, spices etc.).
✓ ✓ ✓ ✓ ✓
Water (both for consumption and as inputs to other production such as irrigation).
✓ ✓ ✓ ✓ ✓
Water storage (wetlands can be a substitute for dams). ✓ ✓ ✓ ✓Water transport. ✓ ✓ ✓ ✓Fibre, fuel and other raw materials used in economic production. ✓ ✓ ✓ ✓ ✓Provision of other industrial inputs (e.g. pharmaceuticals). ✓ ✓ ✓ ✓ ✓ ✓ ✓Genetic material (e.g. ornamental species) ✓ ✓ ✓ ✓ ✓ ✓Energy (e.g. input to hydropower, or biomass fuels) ✓ ✓ ✓ ✓Regulating services
Hydrological flow regulation and groundwater recharge/discharge (where water is used for consumptive uses).
✓ ✓ ✓ ✓ ✓
Carbon sequestration. ✓ ✓ ✓Climate regulation (macro). ✓ ✓ ✓ ✓Local climate regulation and influence on precipitation. ✓ ✓ ✓ ✓ ✓Water flow regulations and potential mitigation of flood risk. ✓ ✓ ✓ ✓ ✓ ✓Storm and storm surge protection. ✓ ✓ ✓ ✓ ✓ ✓Purification of water as part of a multi-barrier water treatment train.
✓ ✓ ✓ ✓ ✓ ✓ ✓ ✓ ✓
Department of Sustainability, Environment, Water, Population and CommunitiesLiterature Review of the Economic Value of Ecosystem Services that Wetlands Provide
43.
MARSDEN JACOB ASSOCIATES
Types of values Typical valuation techniquesEcosystem service Direct
UseIndirect
useNon use TC AB AC CB HP PF RC CV CM
Prevention of saline intrusion. ✓ ✓ ✓ ✓Purification of air quality. ✓ ✓ ✓ ✓ ✓ ✓ ✓Other waste decomposition and detoxification. ✓ ✓ ✓ ✓ ✓ ✓ ✓Crop pollination through the provision of habitat for pollinators. ✓ ✓ ✓ ✓ ✓ ✓ ✓Pest and disease control through the provision of filtering services and buffers etc.
✓ ✓ ✓ ✓ ✓ ✓ ✓
Supporting services
Biodiversity. ✓ ✓ ✓ ✓ ✓ ✓Nutrient dispersal and cycling. ✓ ✓ ✓ ✓ ✓Soil formation. ✓ ✓ ✓ ✓ ✓Seed dispersal. ✓ ✓ ✓ ✓ ✓Habitat to support primary production. ✓ ✓ ✓ ✓ ✓ ✓Cultural services
Recreational opportunities. ✓ ✓ ✓ ✓ ✓ ✓ ✓ ✓ ✓ ✓Provision of destinations for tourism. ✓ ✓ ✓ ✓ ✓ ✓ ✓ ✓ ✓ ✓Aesthetic values translating into utility for visitors and changes in land values close to wetlands.
✓ ✓ ✓ ✓ ✓
Provision of cultural values. ✓ ✓ ✓ ✓Provision of historical values. ✓ ✓ ✓ ✓Source of intellectual and spiritual inspiration. ✓ ✓ ✓Scientific discovery. ✓ ✓ ✓
Department of Sustainability, Environment, Water, Population and CommunitiesLiterature Review of the Economic Value of Ecosystem Services that Wetlands Provide
44.

MARSDEN JACOB ASSOCIATES
Legend: TC = travel cost, AB = averting behaviour, AC = avoided cost, CB = contingent behaviour, HP = hedonic pricing, PF = production function, RC = replacement cost, CV = contingent valuation, CM = choice modelling.
Source: MJA and MainStream analysis based on a review of literature.
Department of Sustainability, Environment, Water, Population and CommunitiesLiterature Review of the Economic Value of Ecosystem Services that Wetlands Provide
45.
MARSDEN JACOB ASSOCIATES
4. Implications for policyThe analysis in Sections 1-3 raises a number of implications for policy. These are briefly outlined below. The sections are designed to provide pragmatic policy advice on actions to build upon the solid base of assessment, policy and investment to manage Australia’s wetlands.
4.1 Activity to dateThe review of literature has revealed that ecosystem services have often not been an explicit rationale for the listing and management of wetlands. This is at least partially explained by the date at which most listing occurred. However, there is a relatively high confluence between historical decision-making and the maintenance of many wetland ecosystems services (particularly supporting services).
Over the past 10 years, there has been a progressive move to better understand wetland use and ecosystem services. While this has not always been the explicit intent, the existing base of information provides a solid base to further enhance biophysical information necessary to move towards the assessment and valuation of ecosystem services.
4.2 Use of wetland economic valuation estimates Based on the literature review undertaken in this study, the following broad conclusions can be reached:
the majority of economic valuation work undertaken on Australian wetland ecosystem services relates to supporting (biodiversity) values and to a lesser extent cultural (recreation and aesthetic) values (primarily using approaches such as choice modelling);
based on the studies reviewed within this project, it would appear that insufficient work has been done to develop a representative and transferable set of ecosystem services values to be used to support a policy agenda;
key gaps in economic valuation exist around provisioning and regulating services, using replacement cost, avoided cost (expected damage function) and production function methods; and
studies that have been undertaken in Australia appear to have focussed on a specific context or question, and may not produce results that are readily transferrable to other contexts.
Section 3.2 outlined the economic valuation methods, noting that most if not all require advanced technical skills to achieve, and that non-use valuation methods (especially contingent valuation and choice modelling) require careful preparation and execution to develop robust results. These types of studies tend to dominate the literature.
Our first case study (Coorong) highlights the difficulty in using these studies in policy decisions, given the above technical challenges. It may be that within a guiding Commonwealth framework, a broader set of economic values can be collected over time using rigorous valuation techniques, for use in policy formation and investment decisions.
Department of Sustainability, Environment, Water, Population and CommunitiesLiterature Review of the Economic Value of Ecosystem Services that Wetlands Provide
46.

MARSDEN JACOB ASSOCIATES
4.3 A way forward?This literature review has found that a consistent framework exists for understanding ecosystem services relating to wetlands, which has begun to be incorporated into current thinking in Commonwealth and State jurisdictions.79
Further, a baseline understanding of the extent and condition of Ramsar wetlands can be built upon, as well as the main drivers of risk to their extent and condition – and subsequently the ecosystems services that flow from wetlands.
However, a more detailed and rigorous typology of ecosystem functions derived from different wetland categories and a suite of ecosystem services that flow from them would be a useful additional step to the development of economic value estimation of ecosystem services, and their use in policy formation and investment guidance.
A more comprehensive and quantitative understanding of the economic value arising from ecosystem services would provide the Commonwealth with a strong and defensible rationale for decision-making on investments in wetland management.
Below, we demonstrate potential steps to realise this outcome over time.
4.3.1 Development of a Commonwealth frameworkAs noted, this report highlights that Ramsar listing in Australia appears to be guided by biodiversity values and their protection and it would be useful to progressively revisit the existing portfolio of wetlands under management with a view to identifying and scoping a more broad appreciation of the ecosystem services each wetland provides. As management plans and ecological character assessments are revised, this should be achieved.
Although a National framework and guidance for describing the ecological character of Australian Ramsar wetlands exists, and a number of Ramsar Ecological character descriptions and management plans have been recently developed (17 have been published online80), the framework appears largely descriptive, and is not explicitly linked to quantitative enumeration of extent, condition, ecosystem function, and ecosystem services. This constrains the ability to value the ecosystems services.
While not the intent of these documents, an opportunity exists to develop a Commonwealth framework that builds upon the robust ecological information in the ecological character descriptions with a view to identifying, scoping and wherever possible, enumerating some of the more significant ecosystem services. Specifically, this would require a move to a more quantitative enumeration of information, processes, and functions than is currently included in the ecological character descriptions. It would also require a more dedicated process of involving economists and social scientists in the development of ecological character descriptions.
4.3.2 Undertake biophysical assessments of wetlands Following the development of the Commonwealth framework, physical assessments of wetlands of interest (Ramsar and other sites) might then be undertaken, building upon existing 79 http://www.environment.gov.au/water/publications/environmental/wetlands/module-2-framework.html 80 http://www.environment.gov.au/water/publications/environmental/wetlands/index.html
Department of Sustainability, Environment, Water, Population and CommunitiesLiterature Review of the Economic Value of Ecosystem Services that Wetlands Provide
47.
MARSDEN JACOB ASSOCIATES
information. A number of assessments could be undertaken to develop an understanding of ecosystem service scale and scope, and establish whether any patterns are revealed, such as:
the same types of ecosystem services tend to feature most prominently in each assessment; and/or
a small number of large value ecosystem services dominate assessments.
These insights can inform the types of economic valuation tools that might be employed, and a strategy for implementing them to generate maximum value (through benefit transfer).
Physical assessments could build upon the 17 Ramsar ecological character descriptions and management plans already published.
4.3.3 Identify and implement appropriate valuation approaches This report has outlined the key ecosystem services, and the main valuation methods used to estimate economic values for them. Once a number of physical assessments of wetlands have been undertaken, this can be used to inform a structured program of economic valuation exercises that can be used to develop a transferrable range of values for ecosystem services. This would be prioritised based on ecosystem services that are common to many wetlands (e.g. recreational opportunities and destinations for visitors), and ecosystem services that are clearly significant on a national or regional scale (e.g. nationally important bird breeding habitat for endangered or vulnerable species). This should ensure the maximum portfolios of ecosystem services are included in valuation studies given the budget available.
The valuation exercises can be specifically designed to produce outputs than can be transferred to other wetland contexts.
Once the usable set of ecosystem service valuations has been developed, outputs can be transferred to different wetlands and used to inform decision-making on investments in those wetlands and others. While this would require care in the interpretation of benefit transfer exercises and the use of sensitivity analysis in economic analysis, it would be a significant step forward in the understanding and incorporation of ecosystem services in policy-making and investment in the management of Australia’s wetlands.
Department of Sustainability, Environment, Water, Population and CommunitiesLiterature Review of the Economic Value of Ecosystem Services that Wetlands Provide
48.

MARSDEN JACOB ASSOCIATES
5. ReferencesAnon. 2009. Strategic Framework and guidelines for the future development of the List of Wetlands of International Importance of the Convention on Wetlands.
Barbier E, Acreman MC and Knowler D. 1997. Economic Valuation of Wetlands: A Guide for Policy Makers and Planners. Ramsar Convention Bureau, Switzerland.
Beaumais, O., Briand, A., Millock, K. and Nauges, C. (2010) What are Households Willing to Pay for Better Tap Water Quality? A Cross-Country Valuation Study, Documents de Travail du Centre d’Economie de la Sorbonne, 2010.51
Bellio, M. G., Kingsford, R. T., & Kotagama, S. W. (2009). Natural versus artificial- wetlands and their waterbirds in Sri Lanka. Biological Conservation, 142(12), 3076-3085
Beier, C. K. 2008. Consequences of More Extreme Precipitation Regimes for Terrestrial Ecosystems. Bioscience, 58(9), 811-821.
Bergstrom JC and Stoll JR. 1993. Value estimator models for wetlands-based recreational use values. Land Economics 69: 132-137.
Bergstrom JC, Stoll JR, Titre JP and Wright VL. 1990. Economic value of wetlands-based recreation. Ecological Economics 2: 129-147.
Birol, E. Karousakis, K. and Koundouri, P. 2006 Using economic valuation techniques to inform water resources management: A survey and critical appraisal of available techniques and an application. Science of the Total Environment 365: 105–122
Brander., L et al 2006. The empirics of wetland valuation: a comprehensive summary and a meta-analysis of the literature. Environmental & resource Economics 33: 223-250
Brower., R 2009. Multi-attribute choice modelling of Australia’s rivers and wetlands: a meta-analysis of ten years of research. CSIRO. Canberra.
CIE (2011) Economic benefits and costs of the proposed Basin Plan: discussion and issues. Prepared for the Murray–Darling Basin Authority. Centre for International Economics, Canberra and Sydney, 166 pp.
Champ, P.A., K.J. Boyle and T. C. Brown (Eds), 2003. A Primer on Nonmarket Valuation. Kluwer Academic Publishers.
Cork S, Stoneham G and Lowe K. 2007. ‘Ecosystem services and Australian natural resource management (NRM) futures’. Paper to the Natural Resource Policies and Programs Committee (NRPPC) and the Natural Resource Management Standing Committee (NRMSC).
Costanza R, d'Arge R, De Groot R, Farber S, Grasso M, Hannon B, Limburg K, Naeem S, O'Neill RV, Paruelo J, Raskin RG, Sutton P and van den Belt M. 1997. The value of the world's ecosystem services and natural capital. Nature 387:253-259
Costanza R, Farber SC and Maxwell J. 1989. Valuation and management of wetland ecosystems. Ecological Economics 1: 335-361.
Daily, G.C. 1997. Introduction: What are Ecosystem Services? In: Nature’s Services: Societal Dependence on Natural Ecosystems, G.C. Daily (ed.), Island Press, Washington
Davis, J., & Brock, M. 2008. Detecting unacceptable change in the ecological character of Ramsar wetlands. Ecological Management & Restoration, 9(1), 26-32
Department of Sustainability, Environment, Water, Population and CommunitiesLiterature Review of the Economic Value of Ecosystem Services that Wetlands Provide
49.
MARSDEN JACOB ASSOCIATES
De Groot, R.S., Stuip, M.A.M., Finlayson, C.M. & Davidson, N. 2006. Valuing wet- lands: guidance for valuing the benefits derived from wetland ecosystem services, Ramsar Technical Report No. 3/CBD Technical Series No. 27. Ramsar Convention Secretariat, Gland, Switzerland & Secretariat of the Convention on Biological Diversity, Montreal, Canada.
Department of the Environment, Water, Heritage and the Arts (2009). Ecosystem Services: Key Concepts and Applications, Occasional Paper No 1, Department of the Environment, Water, Heritage and the Arts, Canberra.
Dodds., W et al (2008) Comparing Ecosystem Goods and Services Provided by Restored and Native Lands. Bioscience. October 2008 I Vol 58 No. 9
Environment Australia. 2001. A Directory of Important Wetlands in Australia, Third Edition. Environment Australia, Canberra.
Fazey, I., Proust, K., Newell, B., Johnson, B., & Fazey, J. A. (2006). Eliciting the Implicit Knowledge and Perceptions of On-Ground Conservation Managers of the Macquarie Marshes. Ecology & Society, 11(1), 318-344.
Fox, H. D. (2007). Marine Ecoregions of the World: A Bioregionalization of Coastal and Shelf Areas. Bioscience, 57(7), 573-583.
Freeman, A. M. III. 2003. The Measurement of Environmental and Resource Values, Theory and Methods. Resources for the Future.
Hanley, N., S. Maurato and R.E. Wright. 2001. “Choice Modelling Approaches: A Superior Alternative for Environmental Valuation?” In Journal of Economic Surveys, Vol 15, No 15.
Hanson, Allan. et al. 2008. Wetland ecological functions assessment: An overview of approaches. Canadian Wildlife Service technical report Series No. 497.
Inter-Departmental Committee on Environmental Economic Valuation. 2003. Environmental Economic Valuation - An introductory guide for policy-makers and practitioners prepared for the Queensland Government
Jenkins W, Murray B, Kramer R, Faulkner S. Valuing Ecosystem Services from Wetlands Restoration in the Mississippi Alluvial Valley. Ecological Economics. March 2010;69(5):1051-1061.
Just, R.E., D.L. Hueth and A. Schmitz. 2004. The Welfare Economics of Public Policy: A Practical Approach to Project and Policy Evaluation. Cheltenham, UK: Edward Elgar.
Keddy P. Wet and Wonderful: The World's Largest Wetlands Are Conservation Priorities. Bioscience. January 2009;59(1):39-51
Knapp., A et al (2008). Consequences of more extreme precipitation regimes for terrestrial ecosystems. Bioscience. October 2008 I Vol 58 No. 9
Kragt, M., Roebeling, P. & Ruijus, A. (2006) Effects of Great Barrier Reef Degradation on Recreational Demand: A Contingent Behaviour Approach. International Association of Agricultural Economists Annual Meeting. Queensland, Australia.
Kragt, M., Roebelling, P. & Ruijus, A. (2009) Effects of GBR degradation on recreational reef-trip: a contingent behavior approach. Australian Journal of Agricultural and Resource Economics, 53, 213-229.
Lancaster, K.G. 1966. "A New Approach to Consumer Theory." Journal of Political Economy, 74, 132-157.
Department of Sustainability, Environment, Water, Population and CommunitiesLiterature Review of the Economic Value of Ecosystem Services that Wetlands Provide
50.
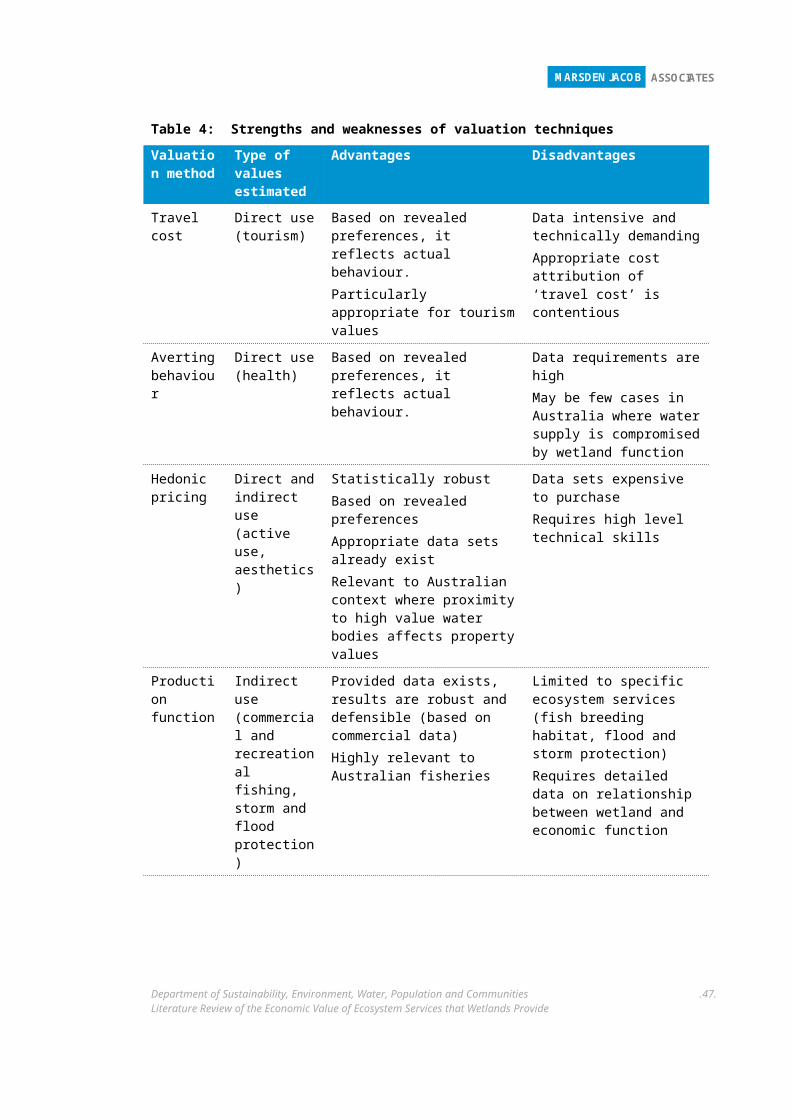
MARSDEN JACOB ASSOCIATES
Liu., S and Stern., D (2008) A meta-analysis of contingent valuation studies in coastal and near-shore marine ecosystems. CSIRO. Canberra.
Lloyds Consulting and MainStream Economics and Policy (2012), Catchment Land Management Strategy for Seqwater. Unpublished.
MacDonald, D. D. (2010). Valuing biodiversity using habitat types. Australasian Journal Of Environmental Management, 17(4), 235-243.
Mawhinney, W. A. (2003). ‘Restoring biodiversity in the Gwydir Wetlands through environmental flows’. Water Science & Technology, 48(7), 73-81
Marsden Jacob Associates (2009). Integrated Water Management Framework: Rationale, Context, Framework and Case Study Reframing. Unpublished, for Brisbane City Council, Brisbane.
Marsden Jacob Associates. 2010. Managing what matters: the cost of environmental decline in SEQ.
Maynard S., James D., Davidson A. 2010. “The development of an ecosystem services framework for South East Queensland.” Environmental Management. 45(5): 881-895.
MacDonald, D. D. 2010. Valuing biodiversity using habitat types. Australasian Journal Of Environmental Management, 17(4), 235-243.
Mawhinney, W. A. (2003). Restoring biodiversity in the Gwydir Wetlands through environmental flows. Water Science & Technology, 48(7), 73-81
MDE (2010) Maryland’s Phase I Watershed Implementation Plan for the Chesapeake Bay Total Maximum Daily Load, Maryland Department of Environment.
Millennium Ecosystem Assessment. 2005. Ecosystems and Human Well-Being: Our Human Planet: Summary for Decision Makers. The Millennium Ecosystem Assessment Series, Volume 5, Island Press, Washington DC.
Millennium Ecosystem Assessment 2003. Ecosystems and human well-being: A framework for assessment. Island Press, Washington DC
Morton, R. M. (1990) Community structure, density and standing crop of fishes in a subtropical Australian mangrove area. Marine Biology, 105, 385‐294.Citedi n Kirkpatrick, 2011,
National Research Council of the National Academies, 2005. Valuing Ecosystem Services – Toward Better Environmental Decision-Making. The National Academies Press.
Pagiola, S. (2006a) Payments for Environmental Services: An Introduction, Environment Department, World Bank, Washington D.C.
Pagiola, S. (2006b) Payments for Environmental Services: Combining Science and Economics for Sustainable Conservation, Environment Department, World Bank, Washington D.C.
Paton, D. C., Rogers, D. J., Hill, B. M., Bailey, C. P., & Ziembicki, M. M. (2009). Temporal changes to spatially stratified waterbird communities of the Coorong, South Australia: implications for the management of heterogeneous wetlands. Animal Conservation, 12(5), 408-417
Pearce DW and Turner RK. (1990). Economics of Natural Resources and the Environment. Harvester Wheatsheaf, Hertfordshire
Pearce, F. (2010). Price tags for planet Earth. New Scientist, 208(2782), 01.
Department of Sustainability, Environment, Water, Population and CommunitiesLiterature Review of the Economic Value of Ecosystem Services that Wetlands Provide
51.
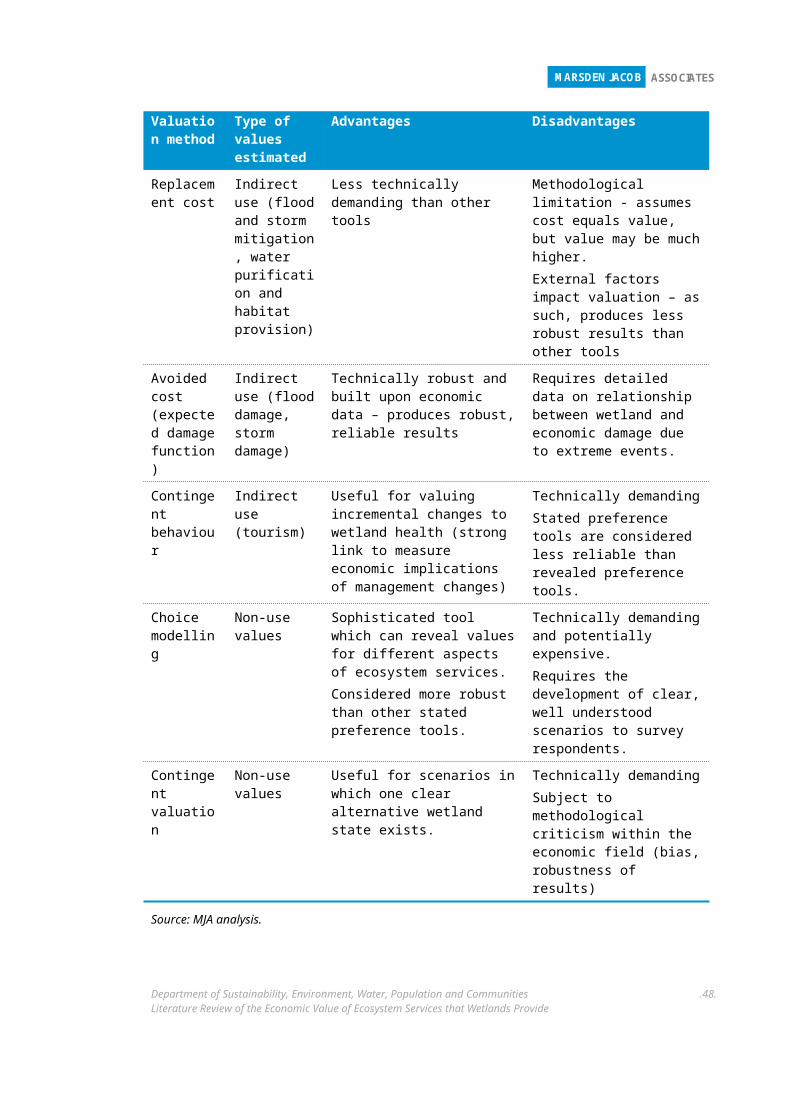
MARSDEN JACOB ASSOCIATES
Plant et al 2012 Recognising the broader benefits of aquatic systems in water planning: an ecosystem services approach, Waterlines report, National Water Commission, Canberra
Ren, S., & Kingsford, R. (2011). Statistically integrated flow and flood modelling compared to hydrologically integrated quantity and quality model for annual flows in the regulated Macquarie river in arid Australia. Environmental Management, 48(1), 177-188.
Robinson, Jackie. 2001. A Review Of Techniques To Value Environmental Resources In Coastal Zones, CRC for Coastal Zone Estuary and Waterway Management, University of Queensland
Rolfe John. 2007. Evaluating the management of invasive species: A role for non-market valuation and benefit transfer AARES Workshop
Rolfe, J and J. Bennett. 2006. Choice Modelling and the Transfer of Environmental Values. Edward Elgar Publishing
Tapsuwan, S., Ingram, G. and Brennan, D., (2007). Valuing Urban Wetlands of the Gnangara Mound: A Hedonic Property Price Approach in Western Australia. CSIRO: Water for a Healthy Country National Research Flagship Canberra.
Turner R. K, Paavola J, Cooper P, Farber S, Jessamy V, Georgiou S, (2003) ‘Valuing nature: lessons learned and future research directions’ Ecological Economics 46 pp 493-510
Walshe, T., & Massenbauer, T. (2008). Decision-making under climatic uncertainty: A case study involving an Australian Ramsar-listed wetland. Ecological Management & Restoration, 9(3), 202-208.
Werner B. 2010. Prairie Wetland Complexes as Landscape Functional Units in a Changing Climate. Bioscience. February 2010; 60(2):128-140
White P, Godbold J, Solan M, Wiegand J, Holt A. (2010) Ecosystem Services and Policy: A Review of Coastal Wetland Ecosystem Services and an Efficiency-Based Framework for Implementing the Ecosystem Approach. Ecosystem Services. Issues in Environmental Science and Technology, vol. 30. Cambridge: Royal Society of Chemistry; 2010:29-51.
Whitten, S.M. and Bennett, J.W., 2001, A travel cost study of duck hunting in the Upper South East of South Australia, Report no.7: “Private and Social Values of wetlands” project, University of New South Wales, Canberra.
Wilson K. Comparing Ecosystem Goods and Services Provided by Restored and Native Lands. Bioscience. October 2008;58(9):837-845.
Department of Sustainability, Environment, Water, Population and CommunitiesLiterature Review of the Economic Value of Ecosystem Services that Wetlands Provide
52.

MARSDEN JACOB ASSOCIATES
Appendix A: Valuation examples from the international and national literature Wetlands are highly productive ecosystems, providing a number of goods and services that are of value to people. The open-access nature and the public-good characteristics of wetlands often result in these regions being undervalued in decisions relating to their use and conservation.
There is a substantial literature on wetland valuation, particularly internationally, with a smaller (although growing) number of studies in the Australian context. The literature covers a wide range of geographical areas, ecosystem services and valuation methodologies. The literature is extremely diverse in terms of values estimated, wetland types considered, variety of ecosystem services considered, and valuation methods used. The wide range of values estimated is partly a product of differences in what is valued (e.g. tropical vs temperate wetlands, urban vs rural, small vs large wetlands, etc) and partly due to methodological differences between the studies.
In this section, we review the literature on ecosystem services provided by wetlands, grouping them by valuation techniques utilised.
While marginal (rather than average or total) values are most useful to the decision-maker in determining whether to spend additional dollars on wetlands, many of the studies focus on average or total values, which are less suitable for benefit transfer.
5.1.1 Travel costTravel cost studies are applied primarily to studies of the value of recreation, in which people travel to particular sites to hunt, fish, hike, or watch wildlife. The travel cost method uses the relationship that exists between people’s purchases of marketed goods and services in connection with their journeys to a recreational site to infer a value for the site itself. Travel cost studies only evaluate part of the total value of wetlands - they do not encompass the public goods aspects of wetlands that are unrelated to recreation, such as, e.g., flood control or ground-water recharge.
Whitten and Bennett (2001)81 - South Australia - value of habitat functions and recreation
Whitten and Bennet used a travel cost survey to determine the benefits generated by duck hunting in the Upper South East of South Australia, as part of a broader study of wetland values in two areas of Australia, which also included a choice modelling analysis of the broader community benefits of wetlands (this is reviewed below).82
People attending a weekend shoot were interviewed to determine the location of their principal place of residence and the extent of their costs incurred in travelling to the duck hunting shoot.
81 Whitten, S.M. and Bennett, J.W., 2001, A travel cost study of duck hunting in the Upper South East of South Australia, Report no.7: “Private and Social Values of wetlands” project, University of New South Wales, Canberra.
82 The broader “Private and Social Values of wetlands” project was funded by Environment Australia and the Land and Water Resources Research and Development Corporation, as part of the National Wetlands Research and Development Program.
Department of Sustainability, Environment, Water, Population and CommunitiesLiterature Review of the Economic Value of Ecosystem Services that Wetlands Provide
53.
MARSDEN JACOB ASSOCIATES
Based on the interview information, Whitten and Bennet estimated a relationship between the costs of visiting the site and the number of hunters engaged in the shoot and determined that the benefit enjoyed, on average, by a hunter engaged in the shoot was $51.33 (2000 dollars).
Bennett and Whitten noted that this estimate would understate benefits from the duck hunting in the wetlands, as the benefits generated by duck hunting would also provide incentives for wetland owners to maintain their wetlands as viable habitats for ducks, and thus contribute to the provision of wetland protection values that are enjoyed by the broader community. (The choice modelling survey that formed part of this study attempted to value these broader benefits - see below). On the other hand, however, the benefits to hunters may be offset by costs incurred by other parties - e.g. as reflected in anti-hunting pressure from the community that has led to bans in other states.
Boyer and Polasky (2004)83 - United States - value of recreation / hunting and fishing
Boyer and Polasky (2004) reviewed two number of studies conducted in the US involving the travel cost method:
Van Vuuren and Roy (1993) used travel costs of individuals to estimate the benefits of hunting and fishing in the Lake St. Clair wetlands in Ontario. They estimated a net present value of $271 per hectare for un-diked wetlands and $1,715 to $2,952 per hectare for diked wetlands (1985 Canadian $, over 50 years, and assuming a four percent discount rate).
Cooper and Loomis (1991) estimated the value of seven wildlife reserves in the San Joaquin Valley in California at $55.41 per waterfowl hunter per season using data on the 1987 and 1988 seasons. The total consumer surplus from hunting in the seven refuges was estimated to be over $3 million annually (1989 dollars).
5.1.2 Hedonic pricing studiesUsing the hedonic approach measures the value of wetlands as perceived by nearby property owners. Other wetland ecosystem services that provide benefits to individuals far away (e.g. such as flood control, water quality improvement, habitat provision for species, groundwater recharge and discharge) are not captured by this method.
Hedonic pricing studies have been undertaken in Australia (Tapsuwan et al.) and internationally, including Japan, the US and Thailand.
Tapsuwan, Ingram and Brennan (2007)84 - Western Australia - impact on land values
Tapsuwan, Ingram and Brennan (2007) undertook a hedonic pricing study in Western Australia on the value of the urban wetlands of the Gnangara Mound, an extensive groundwater system that supplies 60% of Perth’s potable water. Many of the wetlands on the Mound are groundwater dependent.
83 Tracy Boyer and Stephen Polasky, 2004, Valuing urban wetlands: a review of non-market valuation studies.84 Tapsuwan, S., Ingram, G. and Brennan, D., 2007, Valuing Urban Wetlands of the Gnangara Mound: A
Hedonic Property Price Approach in Western Australia. CSIRO: Water for a Healthy Country National Research Flagship Canberra.
Department of Sustainability, Environment, Water, Population and CommunitiesLiterature Review of the Economic Value of Ecosystem Services that Wetlands Provide
54.

MARSDEN JACOB ASSOCIATES
Using data on residential property sales prices, along with property and neighbourhood attribute, Tapsuwan et al. found that:
the marginal implicit price of being closer to a wetland by 1 metre, evaluated at the mean sales value, was $829 (AU$2007);
if there is more than one wetland within 1.5 km of a property, the second wetland will increase the property price by $6081 (AU$2007); and
for a 20 ha wetland, the total premium on sales due to wetland proximity for all surrounding residences is estimated to be AU$140 million, based on average property characteristics and median housing densities.
Daniels (2011) - Australia and Japan - hedonic pricing studies
Daniels noted two hedonic pricing studies relevant to wetland valuations, conducted in Melbourne, Australia and Japan:
Lloyd (2001) - Australia: Lloyd found that properties with frontage onto a constructed wetland in Melbourne attracted a higher price than the average block; and
Asano (2001) - Japan. Asano found that a decrease in the distance to the nearest wetland increases property values by $58,240. The value of being 1000 feet closer to a wetland after the initial mile from a wetland is $304.80.
Boyer and Polasky 2004 - US - value of environmental impacts on residential property
Boyer and Polasky (2004) reviewed three hedonic pricing studies conducted in the US to estimate the value of wetlands to nearby property owners in urban areas. All three studies found a positive impact from wetlands on property values. Wetlands may positively affect property values through the provision of ecosystem services such as storm protection, flood mitigation, and maintenance of air quality.
Mahan et al. (2000) used data on over 14,000 home sales in the Portland, Oregon metropolitan area, along with detailed information about housing characteristics, and GIS information on location of wetlands, lakes, rivers, streams, and other environmental amenities. They found that closer proximity to a wetland increased property value. Specifically:
decreasing the distance to the nearest wetland by 300 meters from an initial distance of 1.6 kilometres resulted in an estimated increase in property value of $436 (1994 dollars); and
a $24 increase in house value with an increase in the size of the nearest wetland by one hectare.
Lupi et al. (1991) used data from Ramsey County, Minnesota, and estimated that an increase in wetlands acreage increased housing value by $19 per hectare of increased wetlands (1989 dollars). The increase in value for wetland area tended to be greater in areas where there were few nearby wetlands.
Doss and Taff (1996) also found a positive value from nearby wetlands using data from Ramsey County, Minnesota. They found a preference for open-water wetlands and scrub-shrub wetland types over emergent-vegetation and forested wetlands.
Department of Sustainability, Environment, Water, Population and CommunitiesLiterature Review of the Economic Value of Ecosystem Services that Wetlands Provide
55.
MARSDEN JACOB ASSOCIATES
Hedonic studies of the value of wetlands in rural areas show a more mixed response, with some studies (e.g. Reynolds and Regalado 2002) finding that wetlands could negatively affected land values, depending on the type of wetland.85 However, using hedonic studies in rural areas can be problematic because there are often few land sales in a geographic region.
5.1.3 Production functionProduction methods can be used to estimate the value of increased economic productivity attributable to wetlands. The majority of applications of the production approach to wetlands have estimated the value of coastal wetlands for increased fishery productivity. Coastal wetlands are recognized as being important nurseries for commercially harvested fish species. Other values that have been estimated using the production approach include the value of hydrological services provided by wetlands.
Morton (1990)86 - Moreton Bay Mangroves - habitat and nursery services (commercial fisheries)
Morton (1990) valued the mangroves of Moreton Bay, SEQ, based on the market value of fish caught. The study estimated the value of mangroves at $8,380 per hectare based on the market value of the fish caught (not taking into account juvenile fish of commercially important species).
Barbier (2007) and (2002) - Thailand - habitat and nursery services (commercial fisheries)
Barbier (2007)87 applies the production function method to value coastal wetlands and, in particular, the role of coastal wetlands as a nursery and breeding habitat for near-shore fisheries.
He focuses on case study of mangrove wetlands in Thailand, where mangrove deforestation has been particularly prevalent to value these ecological services. Between 1961-96, it is estimated that Thailand lost around 56% (2,050 km2) of its mangrove forests, mainly due to shrimp aquaculture, although mangrove losses slowed subsequently, with estimates suggesting mangroves losses of 3.44km2-18km2 during 1996-2004. Mangrove degradation and losses cause a decline in production of fish and shellfish.
Barbier values the habitat service provided by mangroves for fisheries (as spawning grounds and nurseries for fry). The paper develops a new “dynamic” model of the coastal habitat-fishery linkage, linking wetland area with multi-period harvesting of the fishery.
Barbier estimates that the net present value of the welfare loss from reduced mangrove support for fisheries ranges from around US$1.5 to 2.0 million (for the lower deforestation estimate) and around US$0.28 to 0.37 million (for the higher deforestation estimate).
The estimated marginal value of a hectare of mangrove for fish and shellfish production was quite sensitive to assumptions about the elasticity of demand for fisheries output. Barbier noted that when demand is inelastic, decreases in output bring forth a large increase in price and, hence, a high value per hectare for remaining mangroves.
85 See Boyer and Polasky, p.748 for more details.86 Morton, R. M. (1990) Community structure, density and standing crop of fishes in a subtropical Australian
mangrove area. Marine Biology, 105, 385‐294.Citedi n Kirkpatrick, 2011. 87 Barbier, E.B. 2007. “Valuing Ecosystem Services as Productive Inputs” Economic Policy 22 (49): 177–229.
Department of Sustainability, Environment, Water, Population and CommunitiesLiterature Review of the Economic Value of Ecosystem Services that Wetlands Provide
56.
MARSDEN JACOB ASSOCIATES
The estimated marginal value of a hectare of mangrove for fish and shellfish production was $135.44 per hectare per year, with highly inelastic demand (demand changed little with changes in price) but only $3.98 per hectare per year when demand is highly responsive (elastic) to price changes (1993 dollars).
Acharya and Barbier (2002) and Acharya (2000) - Nigeria - hydrological services / groundwater recharge
Acharya and Barbier (2000, 2002) and Acharya (2000) used production methods to estimate the value of the hydrologic services (ground water recharge) of the Hadejia-Nguru wetlands in northern Nigeria.
Acharya and Barbier (2002) estimated the loss in productive capacity with a reduction in ground water available for dry season agriculture and domestic use as a result of reduced recharge to the aquifer from wetlands. The loss of ground water affected welfare through decreased production, increased marginal cost of pumping, and increased costs of water provision for the household. The value of the recharge function for wetlands was estimated to be $20,468.93 (AUD 2010) while the average welfare change for a 1-m change in water levels was: $1.84 (AUD 2010). 88
The value of recharge by wetlands in agriculture was estimated to be $40.50 per hectare (1996 dollars) per season, or 6 percent of yearly income per farmer (Acharya 2000).
5.1.4 Replacement costAnother way to value a service provided by a wetland is to estimate the replacement cost of providing that service should the wetland no longer function properly or no longer exist. As with the production approach, replacement cost typically focuses on one service provided by a wetland (e.g., wastewater treatment) rather than the complete range of values.
A number of studies emphasise that replacement cost is a valid measure of ecosystem services values only when certain conditions are met (e.g., Barbier 2007, Boyer and Polasky, 2004):
the same service (i.e., equivalent quality and magnitude) must be supplied by wetlands and another alternative; and
the service must be of greater value than the replacement cost, or individuals would not be willing to incur the cost. If replacement of lost wetland services would not be chosen should the wetland be destroyed, then replacement cost will exceed the value of the service and using replacement cost will overestimate value of that service.
Barbier (2007) - US - water quality services
One of the best known examples of valuing ecosystem services involves pricing the cost of replacing the water filtration services provided by undeveloped watersheds (including wetlands) with a drinking water filtration plant. The replacement cost approach was used to make a policy decision regarding whether to protect the watersheds in the Catskills as a cheaper means of providing clean drinking water for New York City, rather than building water filtration systems (see Barbier 2007). The high replacement cost ($6–8 billion in 1996) led public officials to protect the watersheds in the Catskills as a cheaper means of providing clean drinking water for New York City. (Box 1 provides more detail).
88 Cited in Daniels, 2011.
Department of Sustainability, Environment, Water, Population and CommunitiesLiterature Review of the Economic Value of Ecosystem Services that Wetlands Provide
57.
MARSDEN JACOB ASSOCIATES
Box 1: Using replacement cost to value the Catskills watersheds (NY)
Historically, the Catskills watersheds have supplied New York City “freely” with high quality water with little contamination as part of the “natural filtration” process of the rich and diverse ecosystems on the banks of streams, rivers, lakes and reservoirs comprising these watersheds. However, increasing housing developments and pollution from vehicles and agriculture have threatened water quality in the region. By 1996, New York City faced choice: either it could build water filtration systems to clean its water supply or the city could protect the Catskill watersheds to ensure high-quality drinking water. New York chose to protect the Catskills. In retrospect, the decision was an easy one. It was estimated that the total costs of building and operating the filtration system were in the range of $6 billion to $8 billion. In comparison, to protect the water provision service of the Catskills, New York is obligated to spend $250 million during a ten-year period to purchase and set-aside over 140 thousand hectares in the watershed. In addition, a series of land regulations were implemented controlling development and land use in other parts of the watershed. Overall, New York City estimated that it would cost $1 billion to $1.5 billion to protect and restore the natural ecosystem processes in the watershed, thus preserving the clean drinking water service provided by the Catskills.
In the Catskills case, it was not necessary to value all of part of the services of the watershed ecosystems. It was sufficient simply to demonstrate that protecting and restoring the ecological integrity of the Catskills was less costly than replacing this ecosystem service with a human-constructed water filtration system.
Source: Barbier 2007
Other studies - US - water quality
Wetlands are also effective at treatment of sewage. Kazmierczak (2001) provides a summary of several studies using cost savings for tertiary municipal wastewater treatment in the US (Louisiana and Florida). The replacement cost estimates for wetland values ranged from $1.15 to $1,087.67 per hectare in 2000 dollars (Kazmierczak 2001). Breaux et al. (1995) estimated cost savings for wastewater treatment by wetlands at fifteen Louisiana seafood processing plants of $2,522 to $3,899 per year per hectare in 1992 dollars.
Various values have been determined for flood control services provided by wetlands, including Mud Lake, Minnesota-South Dakota (US): Roberts and Leich 1997 found the avoided costs due to natural flood control for Mud Lake wetlands is $440 per acre per year ($2.2 million per year).89
5.1.5 Expected damage function approachThe expected damage cost avoided method uses either the value of property protected, or the cost of actions taken to avoid damages, as a measure of the benefits provided by an ecosystem. For example, if a wetland protects adjacent property from flooding, the flood protection benefits 89 Roberts, L.A. & Leitch, J.A. 1997. ‘Economic valuation of some wetland outputs of Mud Lake’. Department of
Agricultural Economics, North Dakota Agricultural Experiment Station, North Dakota State University, Fargo ND.
Department of Sustainability, Environment, Water, Population and CommunitiesLiterature Review of the Economic Value of Ecosystem Services that Wetlands Provide
58.
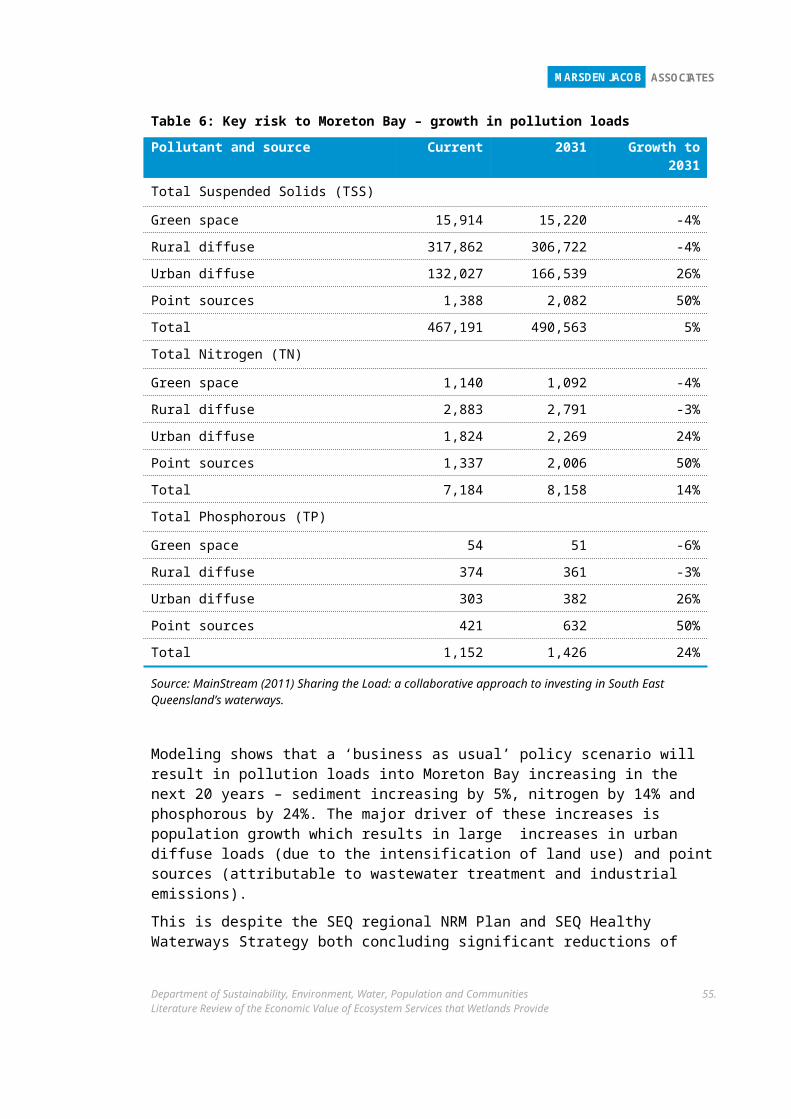
MARSDEN JACOB ASSOCIATES
may be estimated by the damages avoided if the flooding does not occur or by the expenditures property owners make to protect their property from flooding.
The expected damage approach requires (1) assessment of the environmental services provided; (2) estimation of the potential physical damage to property; (3) calculation of the dollar value of potential property damage, or the amount that people spend to avoid such damage.
Barbier 2007 - Thailand - storm protection services
Barbier provides a case study of mangrove ecosystems in Thailand, and uses the expected damage function to value the storm protection services provided by the mangroves. He notes that changes in wetland area affect the probability and severity of economically damaging storm events in coastal areas, particularly relevant in the light of the 2004 tsunami that affected Thailand and other parts of Asia.
Therefore, the expected damage function can be used to value the benefit provided by the ecosystem service, measured by the reduction in expected damage to economic activities, property and even human lives as a result of the mangrove wetlands. The EDF approach required two steps to estimate the changes in expected storm damages:
an estimate of the influence of wetlands are on the expected incidence of economically damaging natural disaster events;
a measure of the expected incidence of economic damage incurred per event.
Barbier used data on past storm events, and changes in wetland area, and estimates of economic damages inflicted by each event to inform the value estimate. The results were as follows:
the marginal effect of a 1km2 loss of mangrove area is an increase in expected storm damages of about US$585,000 (2007 USD);
for the high deforestation estimate, the annual welfare loss in storm protection services amounted to around US$3.4 million, with the NPV loss (over 1996-2004) ranging from US$16.1 to 19.5 million; and
for the low deforestation estimate, the annual welfare loss in storm protection was estimate at around $US0.65 million, with the NPV loss (over 1996-2004) ranging from around US$3.1 to 3.7 million.
He compared the expected damage function approach with a study involving replacement cost (Sathirathai and Barbier 2001) and noted that the latter tended to produce overestimates of ecosystem services value (which estimated a replacement cost value of storm protection of US $12,263 per ha per year) and considered that the expected damage function may provide more reliable values of the storm protection services of coastal wetlands.
Gerrad (2010) for TEEB90 - Laos - flood protection services
The value of conserving wetlands for flood protection in the city of Vientiane (Lao PDR) has been estimated at just under US$ 5 million, based on the value of flood damages avoided (TEEBcase: Wetlands reduce damages to infrastructure, LAO PDR).
90 Gerrad, P. (2010) Wetlands reduce damages to infrastructure, Lao PDR, available at: TEEBweb.org.TEEB (The Economics of Ecosystems and Biodiversity).
Department of Sustainability, Environment, Water, Population and CommunitiesLiterature Review of the Economic Value of Ecosystem Services that Wetlands Provide
59.
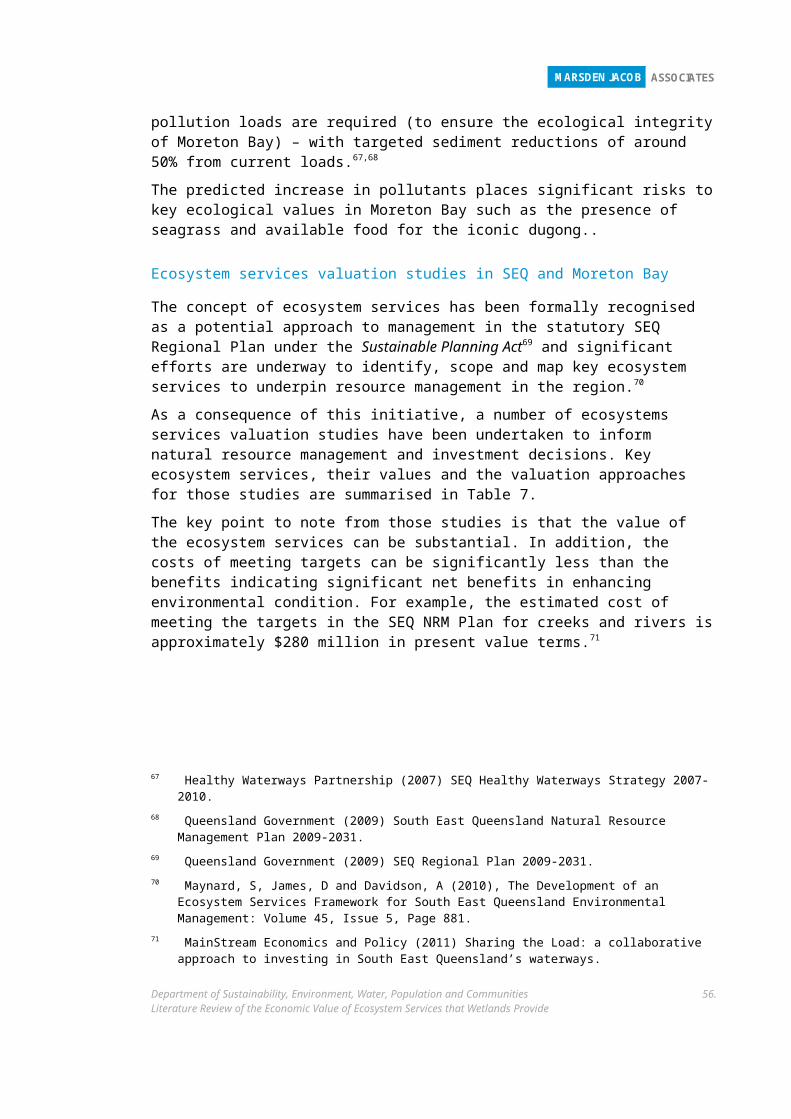
MARSDEN JACOB ASSOCIATES
5.1.6 Non-market valuations: contingent valuation and choice modelling
The contingent valuation (CV) method is a simulated market approach and is undertaken in the absence of market data. The concept is to undertake a survey and ask respondents to state their preferences, i.e. their willingness to pay or willingness to accept compensation for an environmental good or service. This method can estimate non‐use values such as option, existence and bequest values and the valuation is based on the respondent’s opinion (King and Mazzotta, 2000). The technique can be limited by questions being misinterpreted or taken into a context that causes the individual to change their answer. Additionally, a further limitation is bias in responses and responses that are dishonest or align with a strategy or agenda of the individual (Kirkpatrick, 2011).
Choice modelling (CM) asks respondents to make tradeoffs among sets of environmental characteristics, without directly asking them to state their values in monetary terms. The respondent states their preference between one set of environmental characteristics at a given price/cost and another set at a different price (King and Mazzotta, 2000). Limitations within this technique are similar to those described above for the contingent valuation technique.
Daniels et al. (2011)91 - international - various ecosystem services
Daniels et al. reviewed a wide range of Australian and international literature on ‘externality effects’ (i.e. public values, or “effects that are not taken into account directly in market-place transactions”) in the context of valuing water services in South East Queensland. Studies relevant to wetland valuations (that have not reviewed in more detail elsewhere in this document), included the following (all values in $AUD 2010):
Nijkamp, Vingidni and Nunes (2008): based on a meta-analysis of global literature, predominantly CV survey data, Nijkamp et al. found that the mean WTP for wetlands was $45.56;
Nunes and van den Bergh (2001): WTP for the conservation of waterfowl in wetlands based on a CV study was $80.55-$96.66;
Whitten and Bennett (2001) - a CV study in Australia found that WTP for a 1% increase in native wetland and woodland birds was $0.70 ;
Bennet and Morrison (2001): a choice modelling study found that WTP for an additional endangered species to be preserved in wetlands in NSW was $5.70-$5.87;
Costanza et al (1997): valued ecosystems services for wetlands in Canada at $24,056.35. He found that the global value of wetlands was $7.53 trillion. He valued the function of wetlands in Canada in water purification and as pollution sinks at $31,129.04, while their value in regulating peak floods was $84,650.32.
Hoehn and Loomis (1993): using a CV survey, Hoen and Loomis found that WTP to support a single program aimed at enhancing wetlands and habitat in California was $144.67-$277.27.
91 Daniels, P., Porter, M., Bodsworth, P. and Coleman, S. 2011, Externality Effects and their Monetary Values for Water Servicing Options: A Study based on the South East Queensland Context. Urban Water Security Research Alliance Technical Report No. 42.
Department of Sustainability, Environment, Water, Population and CommunitiesLiterature Review of the Economic Value of Ecosystem Services that Wetlands Provide
60.
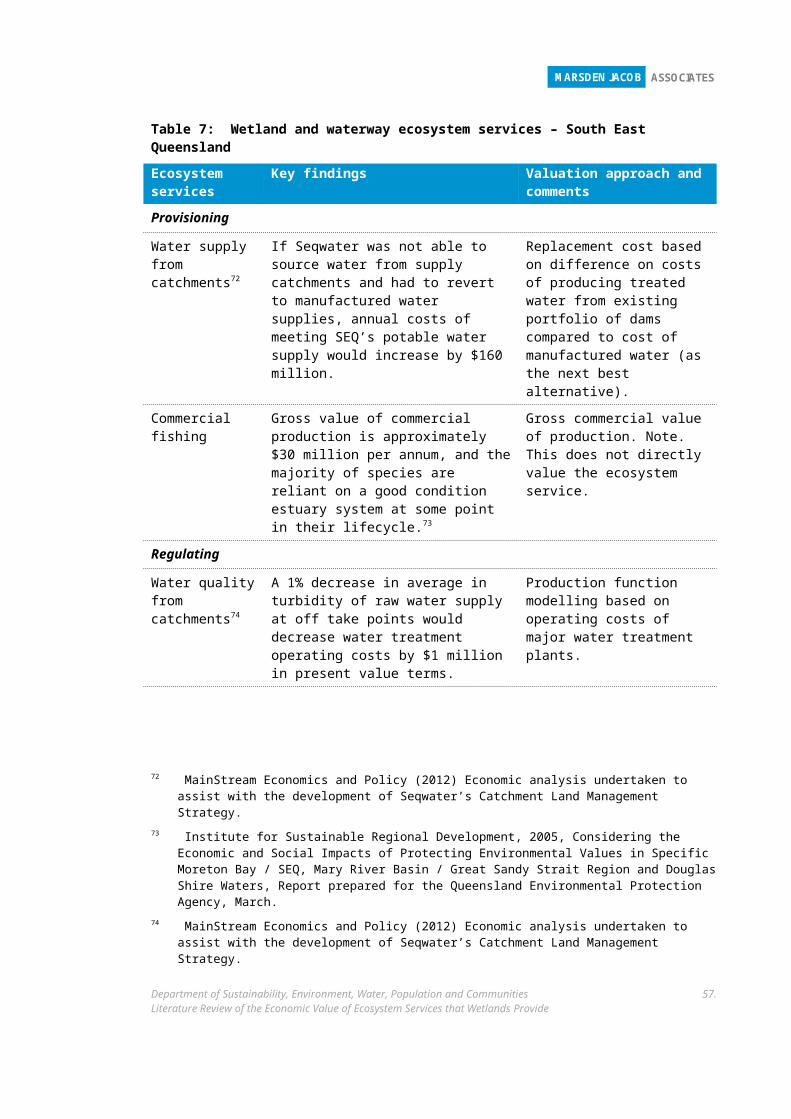
MARSDEN JACOB ASSOCIATES
Hatton MacDonald and Morrison (2010)92 - South Australia - value of biodiversity / habitat maintenance
In this study, choice experiments were used to elicit monetary values for three types of remnant vegetation: wetlands, scrublands and grassy woodlands, in relation to valuing biodiversity maintenance by these habitat areas. The study focuses on a region in South Australia known as the Upper South East, where there are significant areas of habitat currently under threat of degradation and land clearance.
The study aims to place a value on biodiversity, with estimates that can be used in CBA, to allow governments and others to balance the financial benefits from the construction of infrastructure, land clearing or agriculture against the benefits associated with the existence of diverse flora and fauna. The study focused on habitat over biodiversity because qualitative testing prior to the choice modelling confirmed that ‘biodiversity’ was a difficult concept to understand whereas ‘habitat’ conveyed important information to potential survey respondents.
The research showed that people around the Coorong, in the capital Adelaide and elsewhere in South Australia were willing to pay much more money to protect the wetlands than scrublands or grassy woodlands in the same region.
The study design involved a questionnaire to elicit values from three groups of South Australians regarding the importance of, and their WTP for good quality habitat.
Respondents were informed that new NRM projects would increase the size and improve the quality of scrublands, grassy woodlands and wetlands in the Upper SE; however, to undertake new projects would cost money, requiring collection of a levy from all households in South Australia.
Subsequent to this information, respondents were asked to trade-off scrublands, grassy woodlands and wetlands against changes in the levy.
The experimental design for this study had a total of 54 choice sets. The choice sets were organised in nine blocks with six choice sets in each questionnaire version. In the questionnaire, a respondent was asked to choose one bundle of habitat areas and a cost.
The attributes and levels used in the choice sets are presented in Table 1. The levels of the habitat variables were chosen so that they spanned the maximum range possible, but represented ecologically possible outcomes, derived in consultation with ecologists.
Table 9: Attributes in choice sets, CM study of habitat values for wetlands, scrublands and grassy woodlands in SA
LevyStatus quo$0
Attribute levels in other alternatives$10, $20, $40, $60, $80 and $100
Habitat areas:
Scrublands 66,000 73,000, 80,000 and 90,000 ha
Grassy woodlands 46,000 51,000, 56,000 and 63,000 ha
Wetlands 73,000 81,000, 88,000 and 99,000 ha
Source: Hatton McDonald and Morrison 2010.
From the choice data, econometric models of individual choice were estimated, to derive implicit prices that represent the amount that respondents, on average, were willing to pay (in 92 Hatton MacDonald, D. and Morrison, M.D. (2010), Valuing Biodiversity Using Habitat Types, Australasian
Journal of Environmental Management, Volume 17 Issue 4 (Dec 2010).
Department of Sustainability, Environment, Water, Population and CommunitiesLiterature Review of the Economic Value of Ecosystem Services that Wetlands Provide
61.
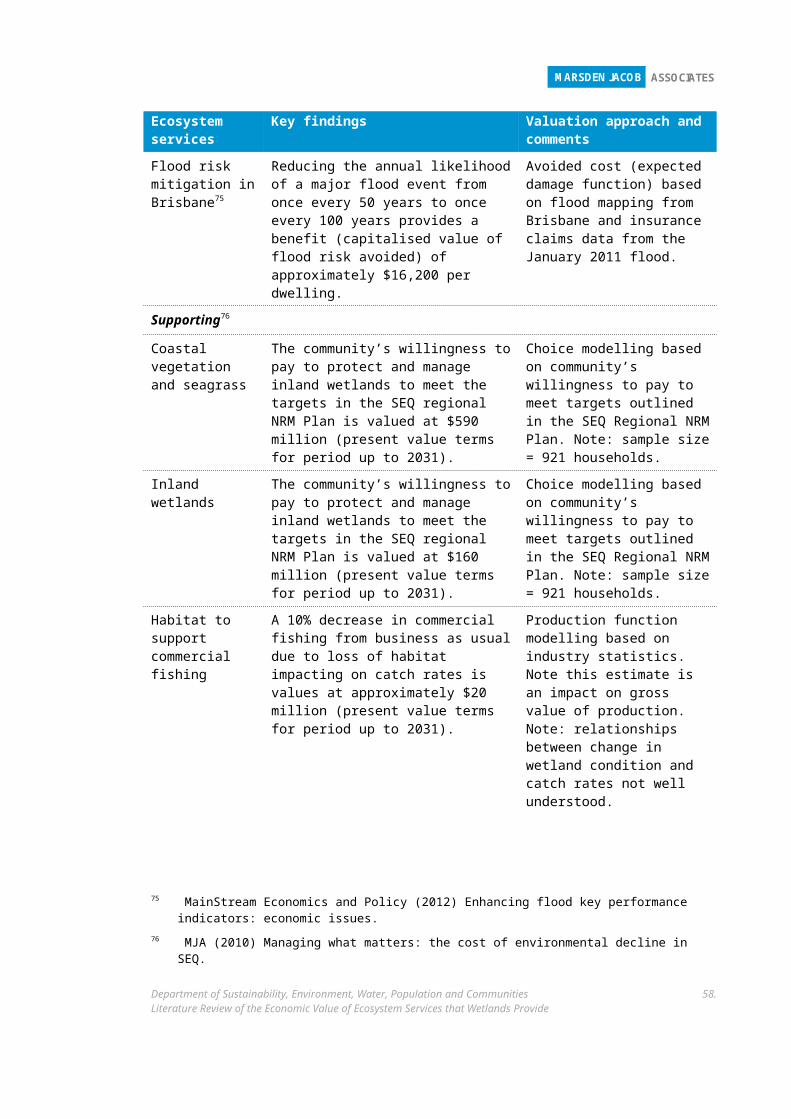
MARSDEN JACOB ASSOCIATES
the form of a levy) for a unit change in a particular attribute (a hectare of good quality scrubland, grassy woodland or wetland habitat area being added to the stock of the Upper SE over ten years). The implicit prices calculated are shown in Table 7.
Table 10: Implicit prices for habitat (per household) per 1000 ha, each year for 5 years
Scrublands Grassy woodlands Wetlands
Whole state $0.72 $1.06 $1.36
Adelaide $0.73 $1.04 $1.41
Upper SE $0.97 $0.06* $0.45
Rest of the state $0.70 $1.17 $1.22
Source: Hatton McDonald and Morrison 2010. Notes: * statistically insignificant from zero.
WTP for wetlands varied from $0.45 (for Upper SE respondents) up to $1.41 (for respondents from Adelaide). Wetlands values were generally higher than values associated with other habitat areas (with the exception of the Upper SE respondents, who valued scrublands more highly than wetlands).
Hatton MacDonald and Morrison noted that wetlands in Whitten and Bennett (2006) were found to be statistically insignificant from zero, and argued that this suggests that preferences for wetlands may have strengthened over time.
Hatton MacDonald and Morrison extrapolated these values to the general population of South Australia, assuming that 58 per cent of households in South Australia had the same preferences as the sample in this study. This resulted in an aggregative implicit price for wetlands (per hectare) of $1,529 (higher than the WTP for scrublands - $810 - or grass woodlands - $1,192).
Application of values - the REFLOWS wetland rehabilitation project
The values derived by Hatton MacDonald and Morrison were used in a CBA of a REFLOWS wetland rehabilitation project in the Upper South East region of South Australia.93 When market values only were included in the analysis, the costs of rehabilitating the wetlands and loss of on-farm production (estimate at $18 million) exceeded the benefits to agriculture from drainage and less flooding. However, when the WTP values for increased biodiversity were taken into account, the benefit cost ratio was 2.2, providing an economic justification for the project to go ahead.
McCartney et al. (2010)94 - choice modelling - WA - value of biodiversity and habitat preservation
McCartney et al. used choice modelling to investigate how information and understanding influences the preferences for conserving the natural environment. Respondents were asked to make conservation choices about the tropical waterways and wetlands of the Kimberley region in Western Australia.
Analysis of public low and high information samples found that:
93 Bright and Tengrove (2007).94 McCartney, A., Cleland, J. and Burton, M. (2010) The value of tropical waterways and wetlands: does an
increase in knowledge change community preferences? Environmental Economics Research Hub, ANU, Research Report 60, May 2010.
Department of Sustainability, Environment, Water, Population and CommunitiesLiterature Review of the Economic Value of Ecosystem Services that Wetlands Provide
62.
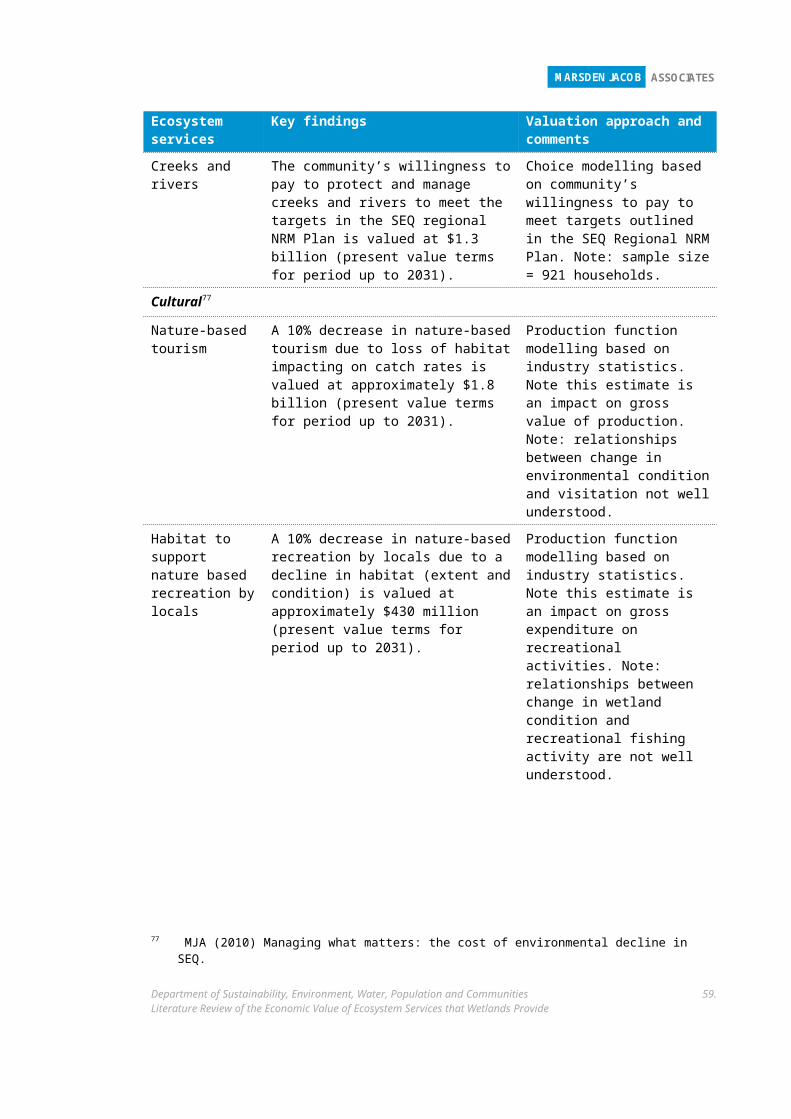
MARSDEN JACOB ASSOCIATES
when bird and plant species are the focus of tropical waterway conservation, increased information does not significantly impact preferences;
when fish species conservation is considered, however, significant differences were found, involving higher values for the high information sample; and
respondents generally preferred high levels of conservation improvements rather than lower incremental improvements.
Brouwer 200995 - Australia - Choice Modelling Meta Analysis
Brouwer undertook a meta-analysis based on empirical findings from choice experiment studies of water and wetland management issues in Australia undertaken in the 10 years preceding his study. The meta-analysis included three studies of wetlands, two of which have already been reviewed separately in this paper (Whitten and Bennett 2005 and MacDonald and Morrison 2005). Mean WTP estimates from the third wetland study by Morrison et al. (2002): found a high annual value of $31/household for each extra year that water birds breed in the Macquarie marshes (Sydney). Overall, the meta-analysis found that mean WTP for healthy wetlands was an annual payment of $1.30 (AUD 2006) or $3.40 as a once-off payment.
Brouwer noted that:
marginal values are generally higher for rivers than for wetlands; and
the benefits associated with current and possible future use of water resources are valued significantly higher than the non-use benefits.
He considered that WTP values are ‘more or less’ transferable across catchments.
Marsden Jacob Associates (2010)96 - Australia (SEQ) - CM survey
MJA undertook a choice modelling survey as part of a study for SEQ Catchments to estimate community values attributable to environmental decline in South East Queensland.
A choice modelling approach was undertaken to elicit the SEQ community’s willingness to pay (WTP) to avoid declines in resource condition and meet NRM targets established in the SEQ NRM Plan. Key results were as follows:
by 2031, the annual costs to each household attributable to a decline in resource condition could be as high as $290. The survey results indicate that SEQ households are willing to pay that amount (about $5.60/week) via higher rates, taxes and costs for goods and services to maintain the current level of social values attributable to the natural environment;
the highest values relate to water quality in creeks and rivers and coastal condition. Survey data reveals that households would be willing to pay approximately $120 per annum to avoid the expected declines in these assets. Values for scenic amenity, maintenance of woody vegetation and inland wetlands were relatively lower.
enhancing resource condition from current levels also provides significant social benefits to households. For example, by 2031 the value of the enhancements proposed in the Plan could be as high as $100 per annum on average for SEQ households. Of the enhancements
95 Brouwer (2009), Multi-attribute Choice Modelling of Australia’s Rivers and Wetlands: A Meta-Analysis of Ten Years of Research, CSIRO Working Paper - Choice Modelling Meta Analysis
96 Marsden Jacob Associates (2010), Managing what matters: the cost of environmental decline in SEQ, A report prepared for South East Queensland Catchments
Department of Sustainability, Environment, Water, Population and CommunitiesLiterature Review of the Economic Value of Ecosystem Services that Wetlands Provide
63.
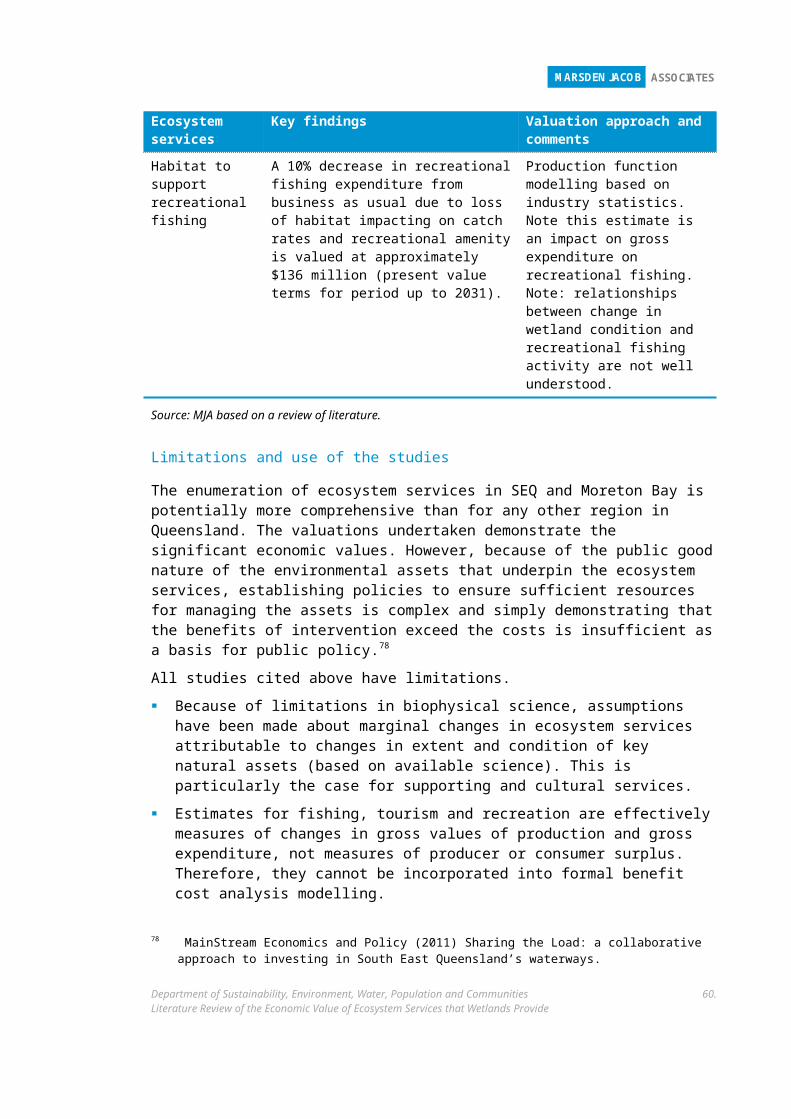
MARSDEN JACOB ASSOCIATES
proposed, in excess of 50% of the benefits are attributable to enhancing water quality in creeks and rivers; and
the values of marginal enhancements are lower than values for marginal declines of the same magnitude (at the current level of resource condition); i.e. households would pay more to avoid further decline in resource condition than they are prepared to pay to enhance resource condition at a later date through rehabilitation.
Clouston (2002)97 - SE Qld - use and non-use functions
Clouston (2002) examined the value of wetlands using a case study of wetlands in Moreton Bay, SE Queensland (which includes mangroves).
The economic values of these wetlands are both direct (fisheries, recreation) and indirect (habitat, storm protection, water quality, waste assimilation) and include non‐use values (cultural, conservation). Moreton Bay supports a wide range of flora and fauna, including turtles and dugongs leading to additional non‐use values associated with conservation.
The study assessed whether the contingent valuation method can be used to determine the ecological value that survey respondents held for the wetlands of Moreton Bay and whether their values can be influenced by how much information they are provided with (e.g. no additional information, ecological information, use value information and non‐use value information (Clouston, 2002).
Respondents were asked their willingness to pay for a hypothetical conservation trust fund to undertake management options to improve the water quality of wetlands. Of those that were willing to pay, respondents that were provide with ‘non‐use’ information were willing to pay $11.41 and those that were provided with ‘use’ information were willing to pay $19.22. (i.e., ‘Willingness to pay’ (per household per year) was $11.41 for non-use values and $19.22 for use values).
The survey results found that between 39.6% and 51.6% of respondents (depending on the information provided) indicated that they would be unwilling to pay (mostly on the basis of not being able to afford it). Once these ‘protest bids’ were removed, the study found that the remainder of respondents were, on average, willing to make a ‘one off’ payment of $22.74 (Clouston, 2002).
Whitten and Bennett (2001) 98- Australia - wetland biodiversity values
Bennett and Whitten used a choice modelling approach to estimate the wetland protection values enjoyed by members of the wider community. Wetlands in two regions were the subject of the study - the Upper South East (USE) region of South Australia and the Murrumbidgee River Floodplain (MRF) in NSW. To determine the broader community values, residents of Naracoorte, Adelaide and Canberra were questioned in relation to the USE wetlands, and residents of Griffith, Wagga Wagga, Canberra and Adelaide were questioned for the MRF wetlands.
97 Clouston, E. M. (2002) Linking the Ecological and Economic Values of Wetlands: A Case Study of the Wetlands of Moreton Bay. phD Thesis, School of Australian Environmental Studies, Faculty of Environmental Sciences, Griffith University, Brisbane.
98 Whitten, S.M., and J.W. Bennett, 2001, Non-market values of wetlands: A choice modelling study of wetlands in the Upper South East of South Australia and the Murrumbidgee River floodplain in New South Wales. Report 8 private and social values of wetlands research report no. 8, University of New South Wales, Canberra.
Department of Sustainability, Environment, Water, Population and CommunitiesLiterature Review of the Economic Value of Ecosystem Services that Wetlands Provide
64.
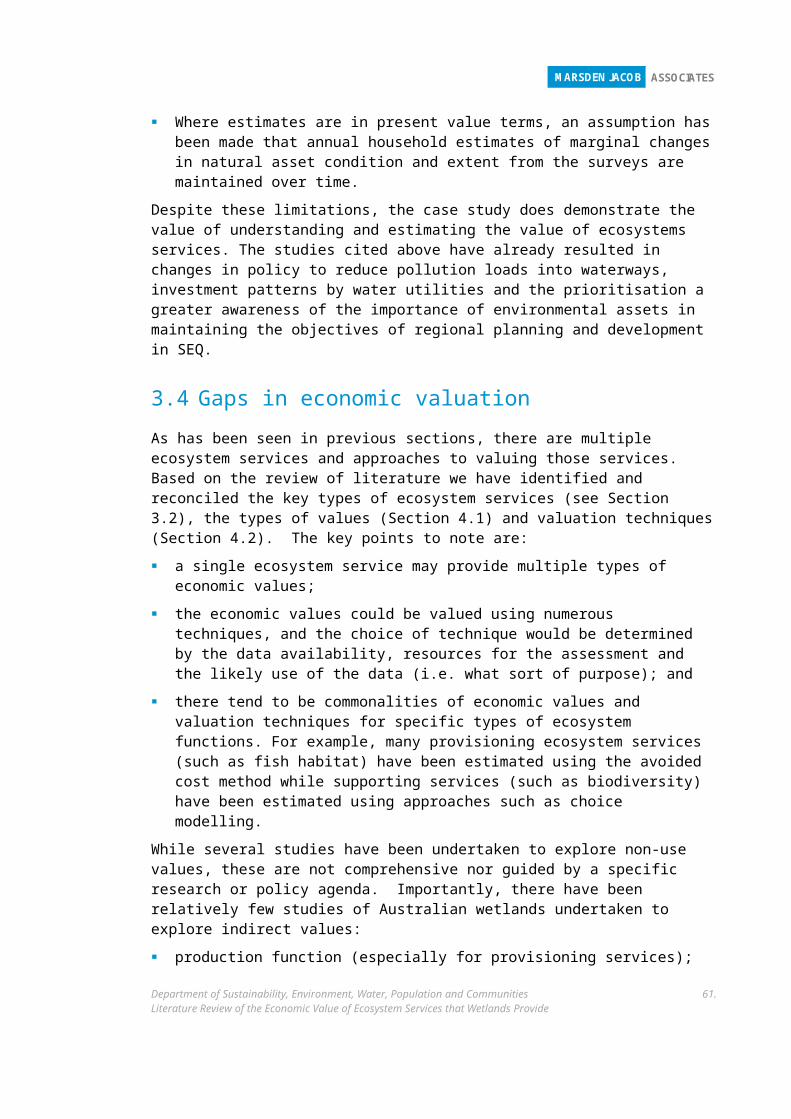
MARSDEN JACOB ASSOCIATES
In the questionnaire, respondents were asked to make a sequence of choices between alternative “futures” for the wetlands under consideration. The alternatives between which respondents were asked to choose were described in terms of a number of wetland “attributes” (see Table 8); for both case study areas, a fifth attribute – the cost of implementing the alternative management regime as a one-off levy on the respondent’s income tax – was also included. In every choice made by the respondents, the current management regime was available as an option that would involve no income tax levy.
The study resulted in the following average WTP estimates (see Table 8). For example, respondents were willing, on average, to pay $4.81 to increase by one the number of threatened species protected through wetland management.
Table 11: Average WTP estimates for non-use values of wetlands
Case study region Attribute Value estimate ($ per unit)
Upper South East of South Australia
Area of healthy wetlands (1000 ha) Not significant
Area of healthy remnant vegetation (1000 ha) 1.51
Number of threatened species that benefit 4.81
Number of ducks hunted Not significant
Murrumbidgee Riverfloodplain
Area of healthy wetland (1000 ha) 11.39
Number of native birds (% of 1800 population) 0.55
Number of native fish (% of 1880 population) 0.34
Number of farmers leaving -5.73
Source: Bennett and Whitten 2001.
Morrison, Bennet & Blamey (1999)99 - Australia (NSW) - WTP for endangered species present in a wetland
Morrison et al. (1999) used stated choice conjoint analysis to study tradeoffs between agricultural employment and the presence of wetlands and endangered species for the Macquarie Marshes, a large wetland in New South Wales, Australia. They found higher willingness to pay for an additional endangered species present in a wetland, roughly $4, than for an irrigation-related job, for which willingness to pay was about $0.13 (1997 Australian dollars). Although the willingness to pay for improving quality to protect endangered species was greater than existence values for rural employment, the inclusion of employment in the choice models lowered the overall willingness to pay for environmental improvements (e.g., increased bird breeding frequency, wetland area, and species presence) by 20–30 percent in the scenarios used.
99 Morrison, M., J. Bennett, and R. Blamey. 1999. Valuing improved wetland quality using choice modelling. Water Resources Research 35:2805–2815.
Department of Sustainability, Environment, Water, Population and CommunitiesLiterature Review of the Economic Value of Ecosystem Services that Wetlands Provide
65.
MARSDEN JACOB ASSOCIATES
Costanza (1997) and Blackwell (2007)100 - ‘worldwide’ and Australia - total value of wetlands
Costanza et al. (1997) placed a value for ecological services of US$9,990 per hectare per year on wetlands – specifically tidal salt marshes and mangroves and an annual global value of US$1,648 billion. Costanza et al. (1997) placed a value on 17 ecosystems worldwide using published data (via the benefit transfer method) and further calculations. The assessment concluded that ecosystem services are an important component of human well‐being, although the study is somewhat controversial.
Using Costanzia et al. (1997), Blackwell (2007a) calculated a value for Australia’s tidal wetlands based on these figures of $1,796,364 (2005 $) per square kilometre (tidal salt marshes and mangroves) with a total annual value of $39.1 billion (2005 $). As the study relied heavily on estimates of ecosystem areas from previous studies and monetary figures by Costanza et al. (1997), Blackwell acknowledged that his estimates had some limitations and should be regarded as a starting point for future investigations (Blackwell, 2005).
Thang Nam Do and Bennett (2007)101 - Vietnam - wetland biodiversity values
This study uses choice modelling to estimate biodiversity protection values of Tram Chim National Park, a typical wetland ecosystem in the Mekong River Delta.
For the proposed wetland management plan, the overall WTP differs across respondent locations. On average, respondents in Cao Lanh and Ho Chi Minh City are not willing to pay for the proposed change plan (because the marginal benefits for wetland attributes are not large enough to compensate for the marginal costs caused because local farmers are negatively affected by dyke management) while respondents in Ha Noi are willing on average to pay 2.5 USD per household.
The estimated values for wetland conservation initiatives, therefore, depend not only on wetland biodiversity improvement but also on the number of farmer households affected. Do and Bennett noted that this is consistent with the findings of Whitten and Bennett (2005) and van Bueren and Bennett (2004) in the Australian context. Other factors influencing WTP include age, income, education, knowledge about Tram Chim and distance to the wetland. WTP increases when these factors increase.
The aggregated values for a wetland conservation program were found to be about USD 3.9 million, justifying its implementation, given that the cost of the proposed management plan was about USD 3.4 million (Tram Chim National Park Management Board, 2005).
Brouwer et al. (1999) - US - meta analysis of CV studies
Brouwer et al. undertook a quantitative meta-analysis of evaluations derived from a large number (30) of contingent valuation (CV) studies of wetlands. Most of the studies were conducted between 1985 and the 1990s. These studies provided over 100 value estimates which the meta-analysis related to the previously defined function variables and various CV design parameters.
100 Cited in Kirkpatrick, 2011. The Economic Value of Natural and Built Coastal Assets. Accarnsi Discussion Paper – Node 1 Coastal Settlements.
101 Estimating Wetland Biodiversity Values: A choice modelling application in Vietnam's Mekong River Delta.
Department of Sustainability, Environment, Water, Population and CommunitiesLiterature Review of the Economic Value of Ecosystem Services that Wetlands Provide
66.
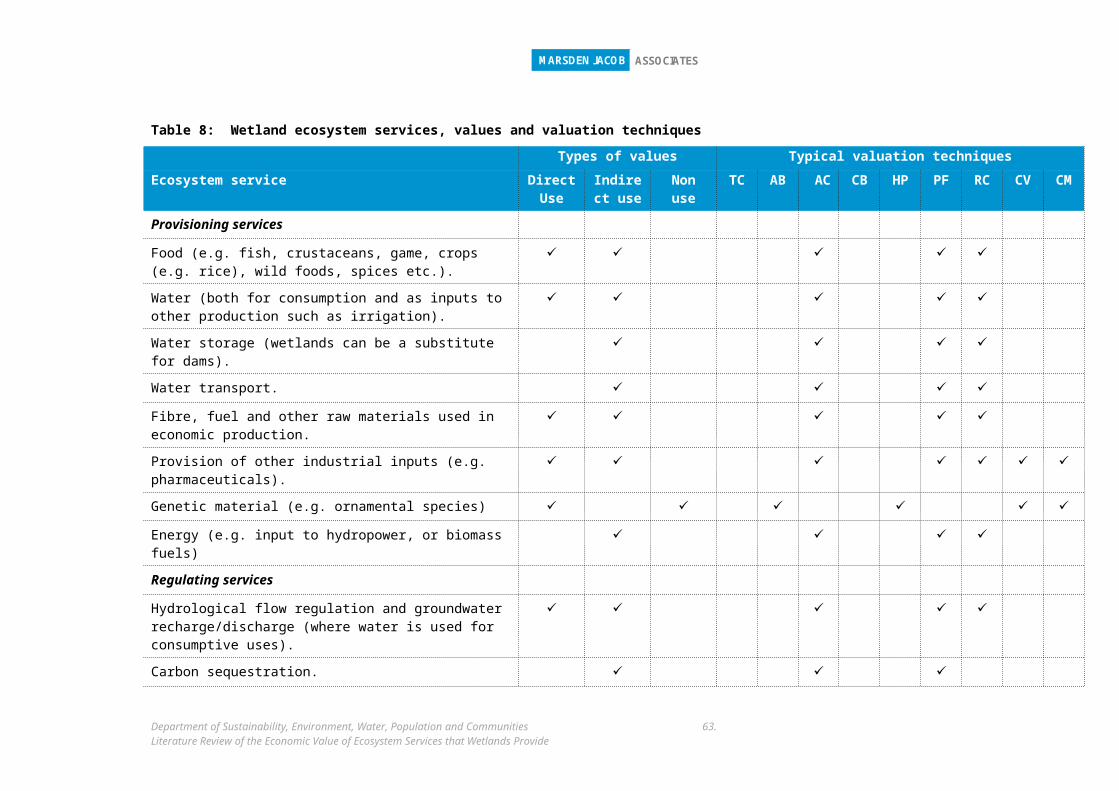
MARSDEN JACOB ASSOCIATES
Around 1/3 of the studies in the meta-analysis cover water resources in general (rather than wetlands in particular) but were kept in the study because they referred to hydrological wetland functions).
The study focuses on wetlands in temperate climate zones, noting that only very few tropical wetland valuation studies existed.
Converted all studies to average WTP per household per year for the preservation of specific wetland aspects:
The study identified a number of distinct values for wetland functions, including:
average WTP for wetland preservation across all studies is 62 SDRs (where 1 SDR 1.5 US$ at the end of 1995); the median WTP was 34 SDRS;
flood control generates the highest mean WTP (92.6 SDRs);
the regression analysis showed that wildlife habitat provision and biodiversity were valued the lowest of the four values investigated; and
use values are almost twice as high as non-use values;
Brouwer noted that a number of standard CV design effects were also shown to have a significant impact upon WTP including the choice of payment vehicle and elicitation method.
Johnston et al (2002) - US -
Johnston et al. (2002)102 examined the value of salt marshes to residents of Rhode Island. Survey respondents placed greatest value on mosquito control and protection of shellfish habitat, followed by protection of fish and bird habitat.
Hoehn et al (2002) - US -
Hoehn et al. (2002) analysed how Michigan residents would trade off characteristics of a restored wetland, including type of wetland, the quality of habitat for categories of species, and their likelihood of seeing an animal while visiting, versus draining an existing wetland. Hoehn et al. (2002) found that in terms of area, 1.64 hectares of restored wetlands were needed to compensate for the destruction of an equivalent hectare of original wetland, showing that people place an intrinsically higher value on in-situ wetlands regardless of quality. Higher mitigation ratios were required when the quality of the restored wetland characteristics was not as high. A mitigation ratio of 2.14 to 1 was required when the restored wetland was of ‘good’ rather than ‘excellent’’ quality.103
Bateman (1995) - UK - CV study - recreational and non-use values
The UK is characterised by several extensive wetland areas; one of the most important is the Norfolk Broads in East Anglia. Bateman et al. undertook an economic valuation study to assess the merits of retaining the wetland area versus permitting them to be converted to alternative uses or simply to degrade from lack of investment in management and control works (Bateman et al., 1993; Bateman et al., 1995).
102 Cited in Boyer and Polask (2004).103 Cited in Boyer and Polask (2004).
Department of Sustainability, Environment, Water, Population and CommunitiesLiterature Review of the Economic Value of Ecosystem Services that Wetlands Provide
67.
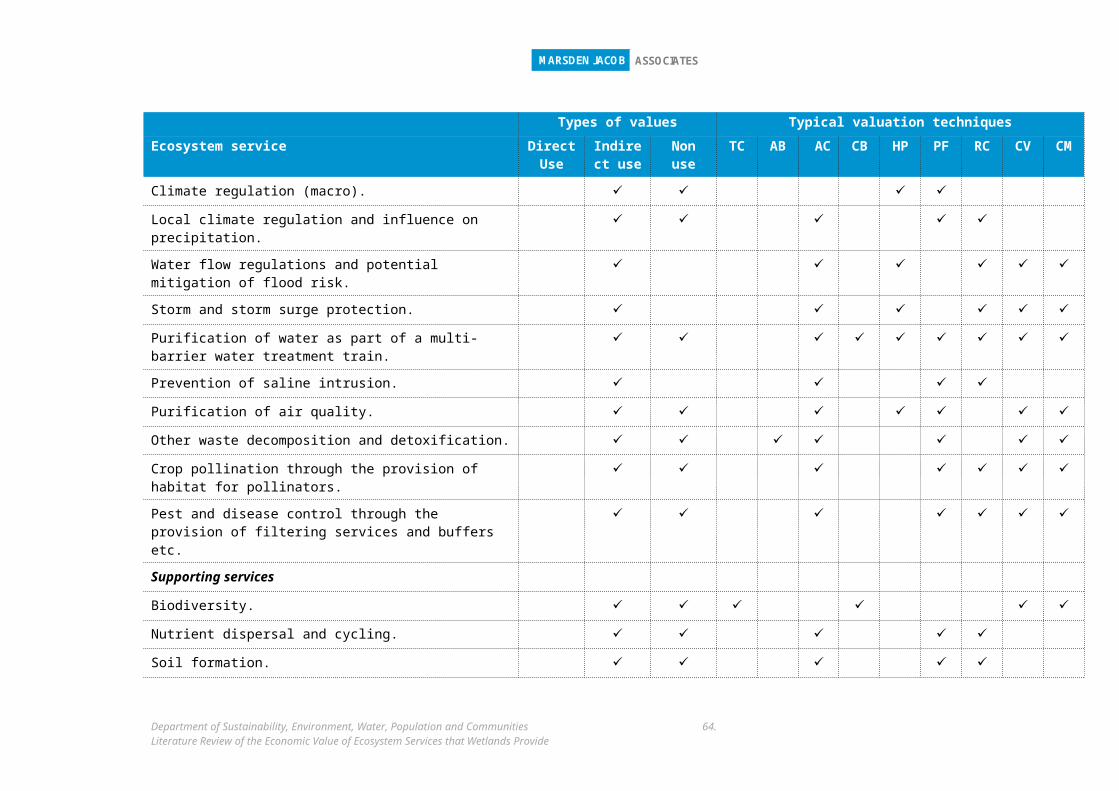
MARSDEN JACOB ASSOCIATES
The Norfolk Broads constitute a sizeable wetland complex and offers recreational or amenity opportunities considered to be of national significance; since the wetlands are of national interest, they were also expected to generate significant non-use values. A contingent valuation study was undertaken to determine the willingness-to-pay to conserve the recreational use benefits and to value the non-use values. The results are shown in Table 9.
Table 12: CV survey WTP, UK wetlands
Question format of CV survey Respondents (no.) Mean WTP (GBP 1991)
Open-ended question 846 67
Iterative bidding question 2051 75
Dichotomous choice question 2070 140
Source: Barbier 1997.
Surveying was performed on-site and involved a large sample size (about 3000). Considerable care was also taken to ensure that a constant flow of information was provided, in order to avoid bias associated with the level of knowledge of each respondent. As a result, the Broads study represents a good example of the application of direct survey or valuation techniques to a wetlands problem. Three different question formats were used to elicit WTP for maintaining the wetland area in its present condition; all used an increase in taxes as the ‘vehicle’ for collection of the hypothetical payments
5.1.7 Meta-analyses (reviewing multiple methods)Meta-analysis involves the quantitative analysis of statistical summary indicators reported in a series of similar empirical studies. Two meta analyses reviewing choice modelling surveys were noted above (Brouwer 2009 and Brouwer 1999). There are a number of other meta analyses surveying studies involving multiple valuation methodologies (market and non-market valuations). These are noted briefly below.
Woodward and Wui (2001)
A meta-analysis covering 39 valuation studies by Woodward and Wui (2001) found that the mean value per hectare per service of a wetland varied from $1.21 per hectare for amenity value to as high as $490 per hectare for bird watching (1990 dollars). Woodward and Wui focused on temperate wetlands, and considered a limited number of ecosystem services.
A number of contingent valuation studies have asked respondents the value they place on various services from wetlands (Woodward and Wui 2001 contains references to a number of such studies).
Brander et al (2006) - international - meta analysis of wetland studies
Brander et al. (2006) builds on the meta analysis in Brouwer (1999), reviewed above, but expands the analysis to include tropical wetlands (e.g. mangroves) as well as temperate wetlands, a broader range of wetland services, including biodiversity value, and estimates from a broader range of countries. Unlike Brouwer, Brander et al. includes market and non-market valuation methodologies in the meta-analysis.
Department of Sustainability, Environment, Water, Population and CommunitiesLiterature Review of the Economic Value of Ecosystem Services that Wetlands Provide
68.
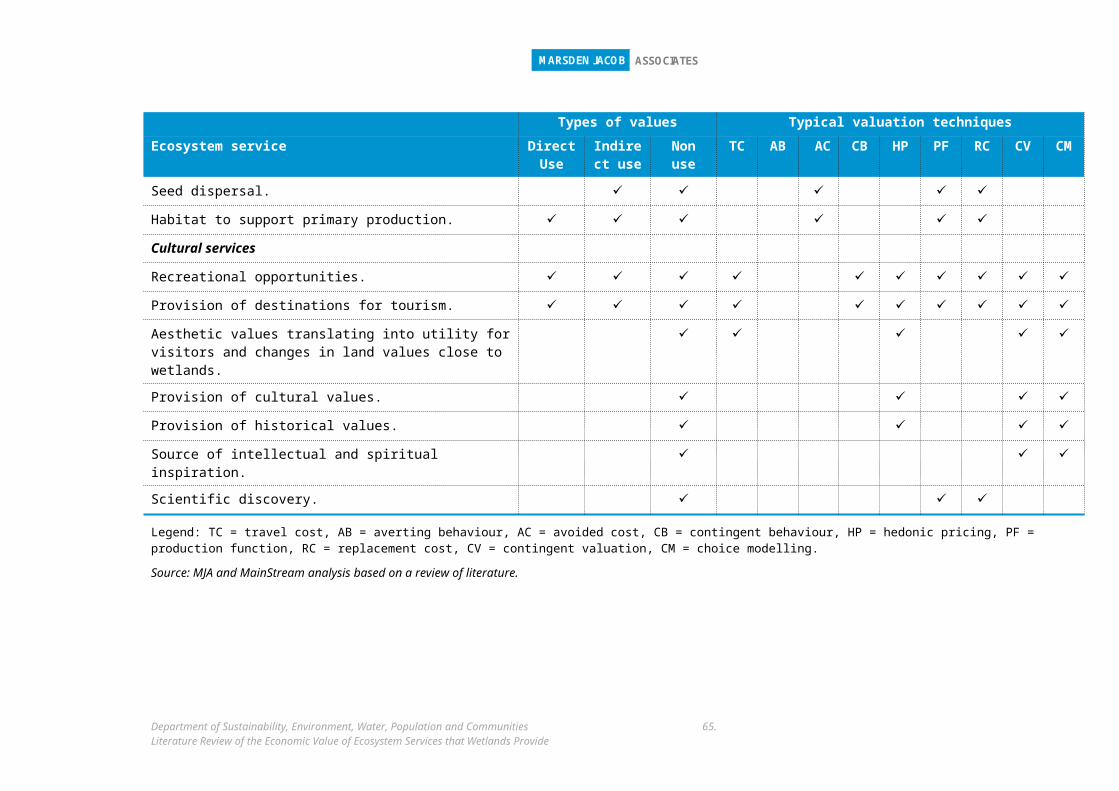
MARSDEN JACOB ASSOCIATES
Brander et al. provide a useful summary of the development of the wetland valuation literature, noting there were a small number of studies in the 1970s and 1980s, and rapid expansion in the number of studies from the 1990s.
Brander et al. collected 191 wetland valuation studies, providing 215 value observations; 80 of the studies contained sufficient information to be included in the meta-analysis. The studies covered 25 countries, including 3 studies in Australia (providing 7 observations from 5 different wetlands); the majority of studies (more than half) came from the US and Canada.
They noted that the valuation literature has tended to focus on:
freshwater wetlands;
habitat and nursery ecosystem services, followed by amenity;
valuation methodologies using market prices; and
total or average wetland values rather than marginal values.
To compare values across studies, Brander et al. first standardised values to $ / ha / year (US$1995). He found that:
the average annual wetland value is $2800 / ha /yr; and
the median value is $150 ha / yr.
Further, mean and median values vary considerably by continent, wetland service and valuation method used. Wetland values were highest in Europe, followed by N. America, Australasia, Africa, Asia, and then South America. In terms of ecosystem functions/services, biodiversity had the highest average value. Wetlands have a higher value in areas with a higher population density as most wetland services are related to direct or indirect human use.
Department of Sustainability, Environment, Water, Population and CommunitiesLiterature Review of the Economic Value of Ecosystem Services that Wetlands Provide
69.
MARSDEN JACOB ASSOCIATES
Figure 5: Mean and median wetland values for each wetland service and valuation method from Brander et al. (2006)
Source: Brander et al. 2006. Notes: The number of observations for each category is in parentheses. The bars represent the means, the error bars represent the standard error of the mean, and the black dots represent the medians.
Lui and Stern (2008)104 - CV study - Coastal and near-shore marine ecosystems
Lui and Stern examined ecosystem services provided by coastal and near-shore marine systems. They found that they contributed significantly to human welfare. They collected 29 CV papers with 120 observations to conduct their meta-analysis. Their results showed that over 3/4 of WTP variations between studies could be explained by variables in commodity, methodology and study quality. In terms of values for ecosystem services of wetlands, they found a mean WTP estimate of $152 for near-shore freshwater wetlands (6 studies on which were included in the meta analysis), vs. $2,189 for saltwater wetlands.
Ghermandi et al. (2010) - international - meta analysis of natural and constructed wetland values
Ghermandi et al. (2010) conduct a meta-analysis of the values of natural and constructed wetlands, based on a range of market and non-market techniques. The meta analysis is based on 170 valuation studies (yielding 418 observations), and 186 wetland sites. The majority of wetlands studies are from North America (132), but also Asia (106), Europe (93) and Africa
104 Lui, S. and Stern, D. (2008), A Meta-Analysis of Contingent Valuation Studies in Coastal and Near-Shore Marine Ecosystems, CSIRO Working Paper Series 2008-15.
Department of Sustainability, Environment, Water, Population and CommunitiesLiterature Review of the Economic Value of Ecosystem Services that Wetlands Provide
70.
MARSDEN JACOB ASSOCIATES
(53) are represented, with smaller numbers of studies from South America (22) and Australasia (16).
Key results from the studies surveyed were as follows:
water quality improvement, water supply, and flood protection are the most highly valued services of constructed wetlands;
non-consumptive recreational activities and the provision of natural habitat and biodiversity are also highly valued;
values increased with anthropogenic pressure; and
constructed wetlands are valued for both flood control and natural habitat and biodiversity services; Ghermandi et al. suggest that this indicates potential for the provision of substantial welfare benefits from the construction of wetlands in urbanized areas that have limited access to natural ecosystems.
Department of Sustainability, Environment, Water, Population and CommunitiesLiterature Review of the Economic Value of Ecosystem Services that Wetlands Provide
71.