
· the RPP program design addresses product-specific market barriers other than initial ... PLC...
68
Transcript of · the RPP program design addresses product-specific market barriers other than initial ... PLC...


Erik Jacobson Director Regulatory Relations
Pacific Gas and Electric Company 77 Beale St. P.O. Box 770000 San Francisco, CA 94177 Fax: 415-973-7226 February 10, 2016 Advice 3668-G-A/4765-E-A (Pacific Gas and Electric Company ID U 39 M) Public Utilities Commission of the State of California Subject: Supplemental: Request For Authority for Retail Products Platform
(RPP) Pilot within PG&E's Residential Energy Efficiency Plug-Load and Appliances Sub-Program
Purpose PG&E Advice Letter 3668-G/4765-E, dated December 24, 2015, requests authority to launch the Retail Products Platform (RPP) Pilot under the Plug Load and Appliances Sub-program, including six measures identified in the RPP Workpaper. PG&E submits this partial supplement to outline additional research that will address the requirements identified in the December 15, 2015 RPP Workpaper Disposition (PGECOAPP128 Revision 0 Retail Products Platform, hereinafter referred to as the Disposition). PG&E requests authority to launch the RPP Pilot by March 1, including the six measures identified in the RPP Workpaper, while conducting the additional research described below. PG&E will continue to work with Commission staff throughout 2016 to clarify these research needs and plans to provide the research described below on the following schedule, but no later than January 1, 2017.
1. Product-Specific Market Barrier Research (All 6 Product Categories)
Project scoping(submitted on basecamp)
February 29, 2016
Preliminary results shared with ED
October 1, 2016
Final research completed December 30, 2016 2. ENERGY STAR Qualified vs. ENERGY STAR Non-Qualified Energy
Consumption Research (Soundbars, Room Air Cleaners and Freezers)
Submit review of existing research for CPUC Review
April 1, 2016
Submit primary research plan May 27, 2016

Advice 3668-G-A/4765-E-A - 2 - February 10, 2016
for CPUC review Preliminary results shared with ED
October 1, 2016
Final research completed December 30, 2016 3. Clothes Dryer Research
Submit primary research plan for CPUC Review
April 1, 2016
Preliminary results shared with ED
October 1, 2016
Final research completed December 30, 2016 4. Room Air Cleaner Unit Energy Savings Estimates
Submit review of existing research for CPUC Review
April 1, 2016
Submit primary research plan for CPUC review
May 27, 2016
Preliminary results shared with ED
October 1, 2016
Final research completed December 30, 2016 Additional Research on Product-Specific Market Barriers. The Disposition states that the freezer and soundbar measures are not approved because each has an incremental measure cost of $0. PG&E has conducted initial research to confirm that the RPP program design addresses product-specific market barriers other than initial retail cost.1 PG&E proposes to conduct additional product-specific market barrier research to substantiate that other product-specific market barriers, besides initial cost, exist and that these additional barriers are meaningful to energy use, and are best-addressed by providing midstream incentives to retailers. PG&E acknowledges that absent this additional information, RPP support for measures with zero incremental costs will be reconsidered and will be discontinued in future program years. As required by the Disposition, the market specific barrier research (Appendix 2) will be completed by January 1, 2017. Research on Energy Consumption of ENERGY STAR-Qualified vs. non-ENERGY STAR-Qualified Products. PG&E also proposes to gather additional data and conduct research and analysis to demonstrate that ENERGY STAR certified products proposed for inclusion in RPP are more efficient than non-certified products. The RPP program design and work paper analysis assumes that ENERGY STAR certified products consume less energy on an annual basis than any products not ENERGY STAR certified. As part of its work in 2016, PG&E will provide detailed energy consumption
1 See Appendix 1, Discussion of Market Barriers: Review of Current Research, where market barriers including performance uncertainties (lack of energy savings information, lack of personal experience, product unavailability, few energy-efficient models available, low market share, and information or search costs, availability of product information and costs of acquiring information are discussed.

Advice 3668-G-A/4765-E-A - 3 - February 10, 2016
information for soundbars, air cleaners and freezers that will include a direct comparison of the energy use metrics for certified and non-certified products. For soundbars and air cleaners, energy consumption information includes but is not limited to on-mode, stand-by and idle mode power, of ENERGY STAR-certified and non-certified products. If these data are not available, PG&E will conduct original research to collect the data and perform the analysis. If this research reveals that there is no difference in energy consumption between ENERGYSTAR-qualified and non-qualified products, RPP support for these products will be discontinued. Clothes Dryers Research. The Disposition requires more research on baseline conditions to augment and support the standard practice baseline for both electric and gas clothes dryers. In response to Energy Division direction on the RPP work paper, PG&E will provide additional information on actual dryer installations to reliably establish typical clothes washer characteristics where RPP qualifying dryers are installed. This research will:
• Determine what fraction of dryers are installed in locations where venting is not possible;
• Describe typical characteristics of the washer used where the qualifying dryer is to be installed; and
• In instances when a dryer is purchased along with a washer for vented installations, describe characteristics of the typical washer purchased with the qualifying dryer.
Freezer Research. PG&E will conduct two research efforts related to its freezer measure:
• As detailed above, PG&E will provide additional research for freezers, which have estimated $0 incremental costs, regarding non-cost market barriers and demonstrate that these barriers can be effectively addressed via mid-stream incentives.
• As described above, PG&E will provide research to substantiate that ENERGY STAR-certified freezers consume less energy than non-certified freezers with similar features.
Room Air Cleaner Research. The Disposition requests more research and additional documentation and calculations supporting the re-estimation of Unit Energy Savings (UES) and, using the measure-level approach, focus more resources on identifying credible secondary data sources for typical baseline modal power draw, typical modal operating hours, and typical usage profile (for determining demand impacts) assumptions. Soundbar Research. PG&E will provide additional research for soundbars, which have a $0 incremental measure cost, to demonstrate that non-cost market barriers exist and can be effectively and best-addressed through a mid-stream incentive. In addition to the market barrier research, additional research on the energy use of ENERGY STAR-qualified vs. non-qualified soundbars will be conducted as described in the table above.

Advice 3668-G-A/4765-E-A - 4 - February 10, 2016
Protests PG&E asks that the Commission, pursuant to GO 96-B, General Rule 7.5.1, maintain the original protest and comment period designated in Advice 3668-G/4765-E and not reopen the protest period as the information in this advice letter reflects the direction of Energy Division. Effective Date PG&E requests approval of this Tier 2 by March 1, 2016. Notice In accordance with General Order 96-B, Section IV, a copy of this advice letter is being sent electronically and via U.S. mail to parties shown on the attached list and the parties on the service list for R.13-11-005. Address changes to the General Order 96-B service list should be directed to PG&E at email address [email protected]. For changes to any other service list, please contact the Commission’s Process Office at (415) 703-2021 or at [email protected]. Send all electronic approvals to [email protected]. Advice letter filings can also be accessed electronically at: http://www.pge.com/tariffs/. /S/ Erik Jacobson Director, Regulatory Relations Attachments cc: Service List R.13-11-005

CALIFORNIA PUBLIC UTILITIES COMMISSION ADVICE LETTER FILING SUMMARY
ENERGY UTILITY
MUST BE COMPLETED BY UTILITY (Attach additional pages as needed)
Company name/CPUC Utility No. Pacific Gas and Electric Company (ID U39 M)
Utility type: Contact Person: Kingsley Cheng
ELC GAS Phone #: (415) 973-5265
PLC HEAT WATER E-mail: [email protected] and [email protected]
EXPLANATION OF UTILITY TYPE
ELC = Electric GAS = Gas PLC = Pipeline HEAT = Heat WATER = Water
(Date Filed/ Received Stamp by CPUC)
Advice Letter (AL) #: 3668-G-A/4765-E-A Tier: 2 Subject of AL: Supplemental: Request For Authority for Retail Products Platform (RPP) Pilot within PG&E's
Residential Energy Efficiency Plug-Load and Appliances Sub-Program
Keywords (choose from CPUC listing): Energy Efficiency AL filing type: Monthly Quarterly Annual One-Time Other _____________________________
If AL filed in compliance with a Commission order, indicate relevant Decision/Resolution #: N/A Does AL replace a withdrawn or rejected AL? If so, identify the prior AL: No Summarize differences between the AL and the prior withdrawn or rejected AL: ____________________
Is AL requesting confidential treatment? If so, what information is the utility seeking confidential treatment for: No
Confidential information will be made available to those who have executed a nondisclosure agreement: N/A Name(s) and contact information of the person(s) who will provide the nondisclosure agreement and access to the confidential information: __________________________________________________________________________________________________ Resolution Required? Yes No Requested effective date: March 1, 2016 No. of tariff sheets: N/A Estimated system annual revenue effect (%): N/A Estimated system average rate effect (%): N/A When rates are affected by AL, include attachment in AL showing average rate effects on customer classes (residential, small commercial, large C/I, agricultural, lighting). Tariff schedules affected: N/A Service affected and changes proposed: N/A Pending advice letters that revise the same tariff sheets: N/A
PG&E asks that the Commission, pursuant to GO 96-B, General Rule 7.5.1, maintain the original protest and comment period designated in Advice 3668-G/4765-E and not reopen the protest period as the information in this advice letter reflects the direction of Energy Division. California Public Utilities Commission Pacific Gas and Electric Company
Energy Division EDTariffUnit 505 Van Ness Ave., 4th Flr. San Francisco, CA 94102 E-mail: [email protected]
Attn: Erik Jacobson Director, Regulatory Relations c/o Megan Lawson 77 Beale Street, Mail Code B10C P.O. Box 770000 San Francisco, CA 94177 E-mail: [email protected]

February 10, 2016
Appendix 1
Discussion of Market Barriers: Review of Current Research

pg. 1
Discussion of Market Barriers:Review of current research
Jane Peters, Alexandra Dunn, Paul Schwarz, and Joe Van Clock
pg. 2
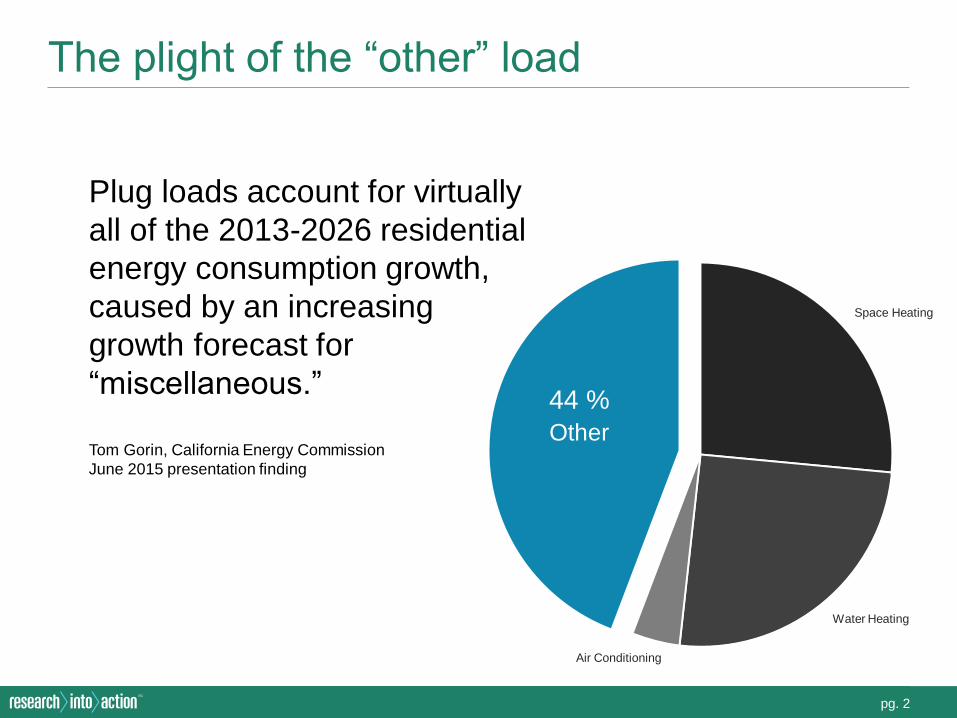
The plight of the “other” load
Space Heating
Water Heating
Air Conditioning
Other44 %
Plug loads account for virtually all of the 2013-2026 residential energy consumption growth, caused by an increasing growth forecast for “miscellaneous.”
Tom Gorin, California Energy CommissionJune 2015 presentation finding
pg. 3
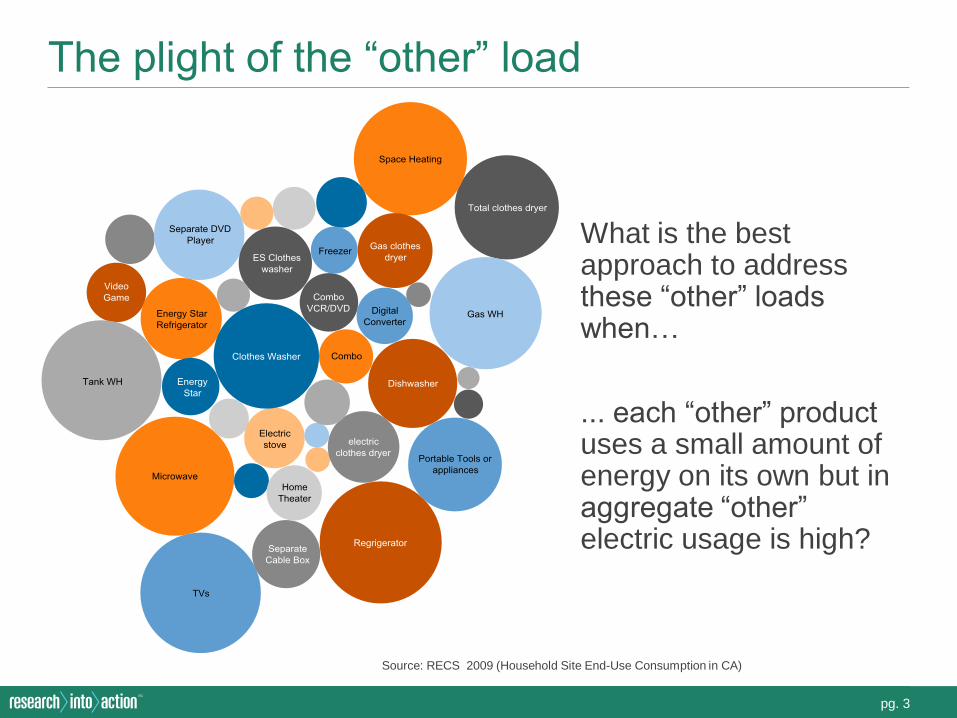
The plight of the “other” load
What is the best approach to address these “other” loadswhen…
... each “other” product uses a small amount of energy on its own but in aggregate “other” electric usage is high?
Source: RECS 2009 (Household Site End-Use Consumption in CA)

pg. 4
Answering your questions
Is the RPP design a “one size fits all” approach?
Why are retailers the key point of intervention in the PLA supply chain?
What role do the retailer marketing plans play in RPP?
What are the product category-specific market barriers that need to be addressed?
• Which market barriers is RPP designed to address? How?• How will RPP increase consumer awareness of and demand for EE products?
What current market characterization data are available for the RPP product categories?
What additional research could support RPP?

pg. 5
Answering your questions
Is the RPP design a “one size fits all” approach?
Why are retailers the key point of intervention in the PLA supply chain?
What role do the retailer marketing plans play in RPP?
What are the product category-specific market barriers that need to be addressed?
• Which market barriers is RPP designed to address? How?• How will RPP increase consumer awareness of and demand for EE products?
What current market characterization data are available for the RPP product categories?
What additional research could support RPP?
Research
Design
Barriers
pg. 6
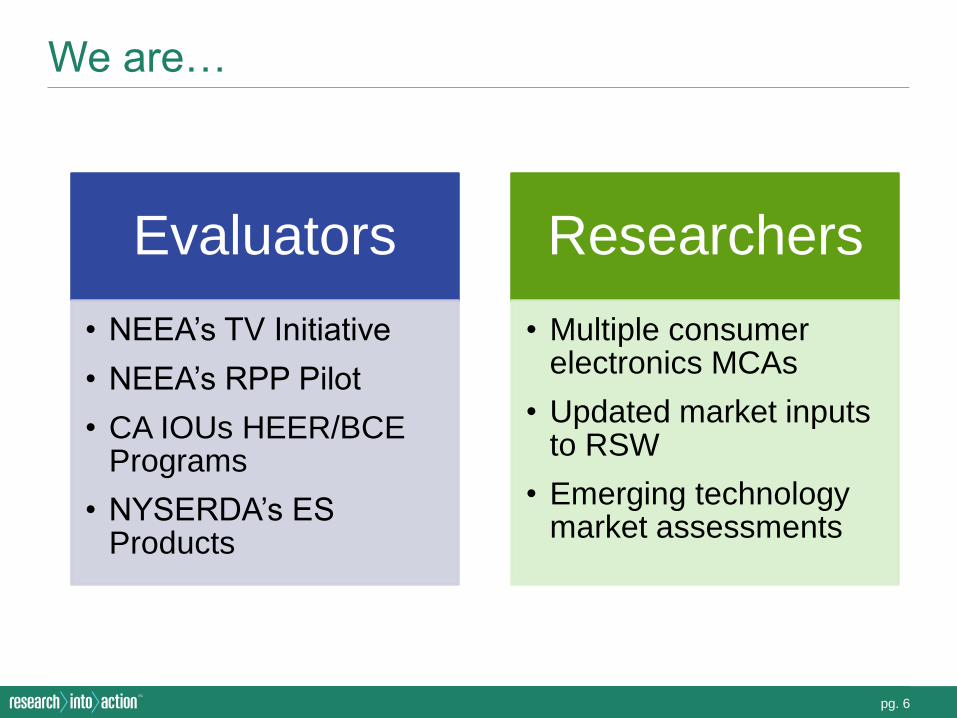
We are…
Evaluators
• NEEA’s TV Initiative
• NEEA’s RPP Pilot
• CA IOUs HEER/BCE Programs
• NYSERDA’s ES Products
Researchers
• Multiple consumer electronics MCAs
• Updated market inputs to RSW
• Emerging technology market assessments

pg. 7
Our perspective
PG&E's RPP Trial
20162015
NEEA's TV Initiative
BCE Initiative
2014201320122011201020092008
NEEA's TV InitiativeMPER #1
NEEA's TV InitiativeMPER #2
NEEA's RPP
HEER/BCE Evaluation
BCE MCA Report
PG&E's RPP
NEEA's RPP Pilot Evaluation
RPP Workpaper
Estimating UEC Paper
RPP Product Transition Paper
NEEA's TV Initiative MPER
#4
Strategic Options for EE Electronics CE Findings
Memos
BCE Baseline Report
CA BCE Impact Report
CE Energy Savings Opportunities Report
CEE CE Program Guide
RPP Parameter
Paper
NEEA's TV Initiative MPER
#3
New YorkProducts Program
Report
RSW Phase IReport
RSW Phase IIReport

pg. 8
The sources we used

pg. 9
Design

pg. 10
Program designsUpstream Midstream DownstreamManufacturer Retailer End-User
Goals• ↑ manufacture of EE models
• ↓ burden on retailers
• Δ designs
• Δ retailer assortment selection behavior
• Δ manufacturer designs
• Motivate promotion
• ↑ sales of incented models
Product Pricing
• Incentive → lower price
• Customer unaware of “true
cost”
• Price may not change
• Incentive too small to effect customer purchase decisions
• Incentive → lower price
• Customer aware of “true cost”
• Incentive IDs EE options
Target Product Categories
• Low saturation of EE models• Many models
• Model selection is complex
• Few models available
• Models at many price points
Measuring Effects
• Qualitative results short-term
• Use manufacturer shipment data to quantify LT
• Qualitative results short-term
• Use market sales data to quantify LT
• Observe results quickly
• Track incented sales
Determining Attribution
• Multiple methods needed to triangulate attribution
• Multiple methods needed to triangulate attribution
• Estimated from self reports & other methods(e.g., regression analysis)

pg. 11
Retailers
Manufacturers
Supply Side
Demand Side
Assort more EE models
Fewer non-efficient choices
Request EE specifications
Design EE models by request
Design EE models standard procedure
Implement choice architecture
Regular contact with EE products
EE products more visible
Increased awareness of EE
Consumers
RPP
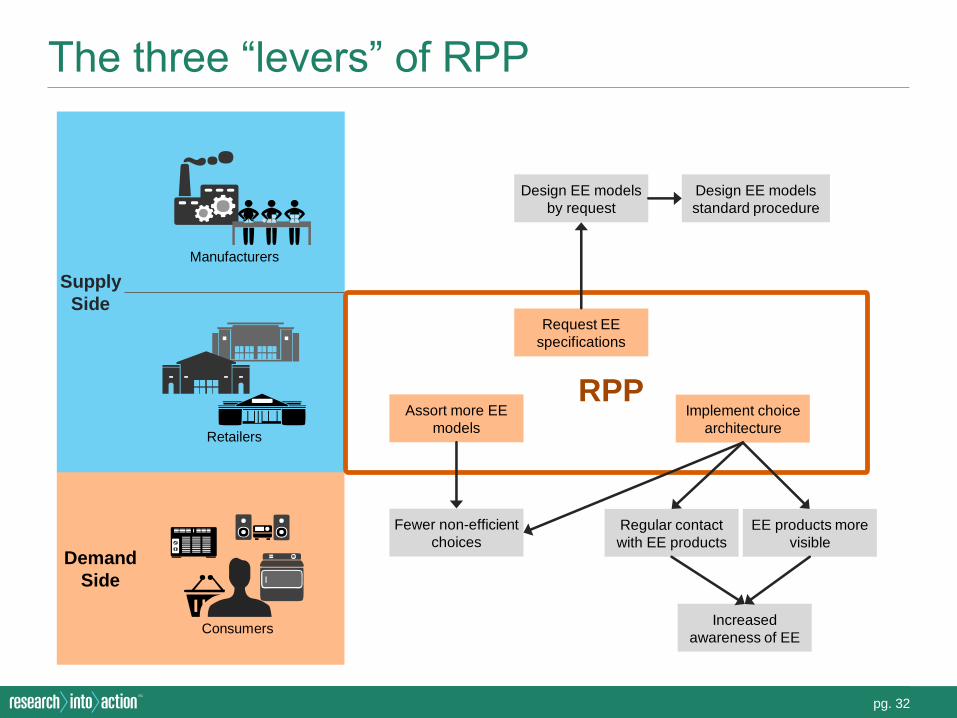
The three “levers” of RPP

pg. 12
Retailer implementation choices
Assortment
Choice Architecture
Pricing
Retailer merchant behavior change
Nudges
Price signals

pg. 13
Are barriers minimized midstream?
Upstream Midstream Downstream
Reasoning
• Retailers are the conduit connecting multiple manufacturers, brands and products with various types of consumers.
• They are the ideal entry point to increase access to efficient goods.

pg. 14
Barriers

pg. 15
Barriers from RPP PTLM
Supply-Side Market BarriersS1. Manufacturers may be uncertain about the response of customers to new products or retailers might be reluctant to promote products for which their performance is uncertain…
S2. Products and services may be unavailable because [of] difficulty accurately predicting customer demand …
S3. Lack of information and awareness among upstream market actors regarding the benefits of energy efficient equipment.
Market-Infrastructure Barriers
M1. Low levels of awareness and knowledge regarding product specifications or differentiation regarding efficiency levels among retail merchandizers.
M2. Limited experience with energy efficient equipment.
M3. Perception of risk with stocking or installing efficient appliances when customer demand or product quality has yet to be proven …
M4. Undervaluing energy efficiency and sustainability and their impact on economic development, denial of climate change, and low sense of urgency …
M5. Information or search costs. Specifically, the lack of expertise among equipment sales staff due to the lack of energy efficiency training opportunities.
M6. Institutional policies and practices might prevent some retailers from shifting their assortment to the more energy efficient products …
M7. Lack of differentiated product marketing by retailers to motivate customers to make more efficient purchasing choices.
M8. Market lacks experience in determining the best way to create a profitable long-term business model
Demand-Side Market Barriers
D1. Customers often unaware and lack knowledge and understanding of energy-efficient products and services
D2. Information costs associated with understanding the energy related features and associated benefits of energy-efficient technologies and services.
D3. Because energy efficiency is rarely valued by the customer more than the requested functionality, efficient models do not always receive consumer attention.
D4. Sometimes the energy-efficiency attributes of a product or service may not be packaged with other features customers desire…
D5. Many customers and some businesses in the distribution chain are uncertain about the performance of energy-efficient products and services ... Many customers also have difficulty assessing the value of energy efficiency …
D6. Incremental costs may be higher for the more efficient models.
D7. Resistance to new or innovative technologies

pg. 16
Eto, Prahl, & Schlegel’s 14 Barriers
Eto, et al List of Market Barriers Key Words/ Notes
Information search costs Availability of information, Costs of acquiring information
Performance uncertainties ROI, lack of energy savings information, personal experience, lack of trust
Asymmetric information Consumers lack detailed information - retailers may mislead
Access to financing Loans, financing for energy efficiency, value of EE not being factored in
Split incentives Renters, equipment that consumers rent
Bounded rationality Habit, net present value, newness of the product, unfamiliarity
Organizational practices Norms, policies, organizational habits
Inability to separate product features Coupling high end features with EE – few EE versions at lower prices
Irreversibility Will efficiency matter in the long run
Hassle or transaction costs Indirect costs (i.e., time) associated with EE products
Hidden costs Installation costs, maintenance
Externalities not visible Full costs not being accounted for
Mispricing due to regulation Costs not reflective of actual price of fuel
Product availability Few EE models available, low market share

pg. 17
Eto, Prahl, & Schlegel’s 14 Barriers
Eto, et al List of Market Barriers Key Words/ Notes
Information search costs Availability of information, Costs of acquiring information
Performance uncertainties ROI, lack of energy savings information, personal experience, lack of trust
Asymmetric information Consumers lack detailed information - retailers may mislead
Access to financing Loans, financing for energy efficiency, value of EE not being factored in
Split incentives Renters, equipment that consumers rent
Bounded rationality Habit, net present value, newness of the product, unfamiliarity
Organizational practices Norms, policies, organizational habits
Inability to separate product features Coupling high end features with EE – few EE versions at lower prices
Irreversibility Will efficiency matter in the long run
Hassle or transaction costs Indirect costs (i.e., time) associated with EE products
Hidden costs Installation costs, maintenance
Externalities not visible Full costs not being accounted for
Mispricing due to regulation Costs not reflective of actual price of fuel
Product availability Few EE models available, low market share

pg. 18
Barriers affecting product suppliers
Supply-Side Market Barriers
S1. Manufacturers may be uncertain about the response of customers to new products or retailers might be reluctant to promote products for which their performance is uncertain…
S2. Products and services may be unavailable because [of] difficulty accurately predicting customer demand …
S3. Lack of information and awareness among upstream market actors regarding the benefits of energy efficient equipment.
Performance uncertainties
Product unavailability
Information or search costs
Barriers from LM Barriers from Eto et al.

pg. 19
Barriers affecting product distribution
Market-Infrastructure BarriersM1. Low levels of awareness and knowledge regarding product specifications or differentiation regarding efficiency levels among retail merchandizers.
M2. Limited experience with energy efficient equipment.
M3. Perception of risk with stocking or installing efficient appliances when customer demand or product quality has yet to be proven …
M4. Undervaluing energy efficiency and sustainability and their impact on economic development, denial of climate change, and low sense of urgency …
M5. Information or search costs. Specifically, the lack of expertise among equipment sales staff due to the lack of energy efficiency training opportunities.
M6. Institutional policies and practices might prevent some retailers from shifting their assortment to the more energy efficient products …
M7. Lack of differentiated product marketing by retailers to motivate customers to make more efficient purchasing choices.
M8. Market lacks experience in determining the best way to create a profitable long-term business model
Information or search costs
Organizational practices
Product unavailability
Inseparability of product features
Bounded rationality
Barriers from LM Barriers from Eto et al.

pg. 20
Barriers affecting end-use customers
Demand-Side Market BarriersD1. Customers often unaware and lack knowledge and understanding of energy-efficient products and services
D2. Information costs associated with understanding the energy related features and associated benefits of energy-efficient technologies and services.
D3. Because energy efficiency is rarely valued by the customer more than the requested functionality, efficient models do not always receive consumer attention.
D4. Sometimes the energy-efficiency attributes of a product or service may not be packaged with other features customers desire…
D5. Many customers and some businesses in the distribution chain are uncertain about the performance of energy-efficient products and services ... Many customers also have difficulty assessing the value of energy efficiency …
D6. Incremental costs may be higher for the more efficient models.
D7. Resistance to new or innovative technologies
Information or search costs
Bounded rationality
Performance uncertainties
Inseparability of product features
Irreversibility
Product unavailability
Barriers from LM Barriers from Eto et al.

pg. 21
Some barriers operate at multiple levels
Barrier Supply-side Market Demand-side
Performance uncertainties
Product unavailability
Information or search costs
Organizational practices
Inseparability of features
Bounded rationality
Irreversibility

pg. 22
Primary barriers to address with RPP
Barrier Supply-side Market Demand-side
Performance uncertainties
Product unavailability 🎯 🎯 🎯
Information or search costs 🎯 🎯 🎯
Organizational practices 🎯 🎯
Inseparability of features
Bounded rationality 🎯 🎯
Irreversibility

pg. 23
Research questions
What are the barriers for each product?
Are there patterns in barriers by product type (consumer
electronics vs. white good)?
Can RPP address the key barriers for each product?

pg. 24
Initial products in and out of RPP
Dishwasher
Game Consoles
Laptops
HTIB
TVs
STBs
Dryers
Soundbars
Air Purifiers
Room ACs
Freezers
In product mix Other

pg. 25
Barrier Supply-side Market Demand-side
Performance uncertainties
Product unavailability
Information or search costs
Organizational practices
Inseparabilityof features
Boundedrationality
Irreversibility
Barriers for products included in product mix

pg. 26
Barrier Supply-side Market Demand-side
Performance uncertainties
Product unavailability
Information or search costs
Organizational practices
Inseparabilityof features
Boundedrationality
Irreversibility
Barriers for reviewed and excluded products

pg. 27
Product Barrier/Explanation Next Step
HTIBs: High information search costs – hard to differentiate audio product categories – soundbars have larger market share
TVs: They’re efficient!
STBs: Product availability – choice made by pay TV provider
Upstream
Monitor 4K
Midstream
Game Consoles: Performance uncertainties crucial, limited availability of models
UpstreamBounty
Dishwashers: High saturation of EE modelsIncrease stringency of standards
Laptops: High saturation of EE modelsFocus on battery chargers
Reasons for exclusion

pg. 28
Similarities we see across PLA categories
• Availability - variety of models with varying features
• Information search costs –awareness of need for EE low across market actors
• Information search costs – EE is a very low priority for consumers
• Performance uncertainty – keeps retailers and manufacturers from promoting EE
• Inseparability of features – EE is often bundled in with premium features, fewer EE models at lower price points
Consumer Electronics White Goods

pg. 29
There will always be barriers…
Typically the desired end state will not be a market that is free of all market barriers
Some market barriers cannot be permanently overcome
Markets are in a continuous state of evolution … so even as current market barriers are eliminated new ones may be developing.Prahl and Keating, 2014

pg. 30
RPP selection story
Product Selected
Mix of appliances
and CE
Product has some market
share
Ability for product to
stay in mix for several years
Work with retailers
Findings from trial
Potential to increase EE but stable product
pg. 31
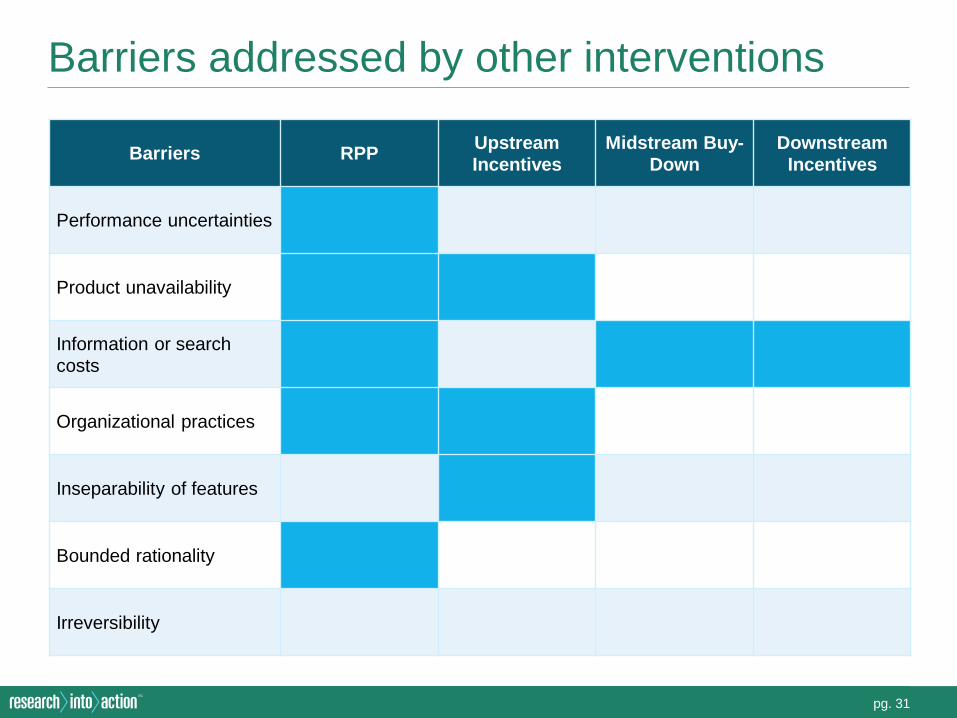
Barriers addressed by other interventions
Barriers RPPUpstream Incentives
Midstream Buy-Down
Downstream Incentives
Performance uncertainties
Product unavailability
Information or search costs
Organizational practices
Inseparability of features
Bounded rationality
Irreversibility
pg. 32
Retailers
Manufacturers
Supply Side
Demand Side
Assort more EE models
Fewer non-efficient choices
Request EE specifications
Design EE models by request
Design EE models standard procedure
Implement choice architecture
Regular contact with EE products
EE products more visible
Increased awareness of EE
Consumers
RPP
The three “levers” of RPP

pg. 33
Retailers want to differentiate themselves
• “The NEEA message wasn’t focused on driving sales. It was focused on landing a
message about energy efficiency. It would have been difficult to create specific sales
metrics around that message.” [Explaining why they would have preferred a message
designed to drive sales:] “We’re publicly traded. We sell things.”
• “[Retailer] is a publically-traded company, therefore Wall Street and shareholders will
judge us based on two key criteria: one is the top-line revenue and the other is the
bottom-line profitability of the business. ENERGY STAR helps drive top-line revenue
[because efficient products are typically more expensive]. And, of course, mid-stream
programs…help drive bottom-line profitability. Together, ENERGY STAR and the mid-
stream programs make a perfect influencer on the business, both from top-line
[revenue] and bottom-line profitability.”
• “At the very least, there would be some indication [in marketing that a product meets
ENERGY STAR]. As things get more standard, you don’t call out that this
[dishwasher] has a bar handle, [energy efficiency is] becoming a standard.”

pg. 34
RPP has the potential to…
• Essentially a retailer behavior change program
• Long-term change in decision making around energy-using products
Change retailer’s organizational practices
• Assortment is national
• Small changes in assortment can lead to large energy savings
Influence assortment
• Retailers often reluctant to agree to prescriptive approaches
• Know what makes a product sell
• Can use different levers for different categories
Offer greater autonomy to retailers

pg. 35
Attacking plug loads from the middle
Plug load is a growing problem
RPP provides a possible approach
Early and regular monitoring should confirm RPP is suitable
Track and learn from what retailers will do

pg. 36
Research = Search + Re-search

pg. 37
Sources
BC Hydro. 2009. Feasibility Assessment of Canadian ENERGY STAR Set-top Box Promotion Program – Final Report.
CEC. 2005. Market Failures, Consumer Preferences, and Transaction Costs in Energy Efficiency Purchase Decisions.
NEEA. 2012-2015. Consumer Electronics Television Initiative Market Progress Evaluation Report #1 to 4. NEEA. Forthcoming. RPP Pilot Evaluation.
ODC. 2010. Draft Business to Business (B2B) and Business to Consumer (B2C) Notebook Computer Findings Memorandum.
ODC. 2011. California Statewide Business and Consumer Electronics Program New Products Baseline.
ODC. 2010. Final Game Consoles Findings Memorandum.
ODC. 2010. Final Set-top Box Findings Memorandum.
PG&E. 2008. Strategic Options for Energy-Efficient Electronics in Pacific Gas and Electric Service Territory: Marketing Delivery Systems for Electronics Measures.
PG&E. 2015. Air Cleaner Residential Solutions Excel Workbook (RSW).
PG&E. 2015. Clothes Dryer Residential Solutions Excel Workbook (RSW).
PG&E. 2015. Pacific Gas and Electric Company Retail Plug-Load Portfolio (RPP) Trial: Evaluation Report.
PG&E. 2015. Work Paper PGECOAPP128 Retail Plug Load Portfolio Revision # 1.
PG&E. 2015. Retail Products Platform (RPP) Product Introduction and Transition Guidance – Draft Report.
PG&E. 2015. Program Theory and Logic Model for the PG&E 2016 Retail Product Platform (RPP) Program.
Research Into Action. 2010. Electronics and Energy Efficiency: A Plug Load Characterization Study SCE0294.
Research Into Action. 2012. Program & Technology Review of Two Residential Product Programs: Home Energy Efficiency Rebate (HEER) / Business & Consumer Electronics (BCE)
Reviewed – not directly cited
California Technical Forum. 2015. Workpaper PGECOAPP128 Retail Plug Load Portfolio PowerPoint Presentation.
EMI. 2014. Calculation Methodology for Unit Energy Consumption (UEC) and Unit Energy Savings (UES) for the Retail Plug-Load Portfolio (RPP) Program
Energy Solutions. 2014. Calculation Methodology for Sales-Weighted Unit Energy Consumption Estimates in the Retail Plug-Load Portfolio (RPP) Program.
PG&E. 2014. General Approaches for Estimating Key Parameters for the Retail Plug-Load Portfolio Program.
PG&E. 2014. Retail Plug-Load Portfolio (RPP) Trial Phase One (2013-14) Preliminary Results Phase Two (2015) Design Discussion National RPP Development with EPA Presentation.
PG&E. 2015. Phase I Retail Plug-Load Portfolio (RPP) Trial Evaluation Results Presentation.
PG&E. 2015. Retail Plug-Load Portfolio (RPP): Options for NTGR Approval Presentation.

February 10, 2016
Appendix 2

Proposal | Page 1
Memorandum
To: Brian Smith, PG&E
From: Alexandra Dunn, Paul Schwarz, and Joe Van Clock, Research Into Action
Date: January 4, 2016
Re: Proposal for Market Characterization Research
In response to a request by Pacific Gas and Electric (PG&E), Research Into Action has prepared
a proposal to conduct research to support the Retail Product Platform (RPP) program. The
purpose of the research is to update and extend the market characterization research completed
by Research Into Action and others to better understand the supply chain issues and market
barriers affecting the product categories selected for the 2016 RPP. The requirement to conduct
new primary research as described in this document to identify and understand in greater detail
the product-specific market barriers to the adoption of energy efficient models of products
targeted by RPP has been communicated by the Office of Ratepayer Advocates in its comments
to the Draft RPP EMV Plan dated November 9, 2015 and by the CPUC’s Ex Ante Review Team
in its disposition to the RPP workpaper dated December 15, 2015. The outcome of this research
will allow PG&E to fine-tune RPP’s program design, assess market change over time using these
results as a baseline snapshot, and inform possible product selection.
In our discussions with PG&E, four primary research objectives emerged for this research
project:
1. Identify barriers to adoption of energy efficient (EE) products selected for the portfolio,
2. Assess whether barriers can be categorized by product category,
3. Provide baseline snapshots by product category concurrent to the rollout of RPP,
4. Identify any current and potential EE technical breakthroughs for products in the
portfolio that may signal shifts that should be contemplated to the products comprising
the portfolio.
To address these objectives we propose conducting a comprehensive market characterization for
all six products selected for 2016 RPP and up to two products currently under consideration for
inclusion in the future (e.g. ultra-HD televisions). Typically, market characterizations use
primary and secondary data to define current and emerging market conditions across numerous
dimensions, including: market segments, technology areas, geographies, market actor groups,
and market behavior and decision-making. Market characterization results can be used for a
variety of purposes, such as: developing a better understanding of market operation; identifying
relevant supply and value chains, and potential leveraging opportunities; estimating program
penetration rates; and establishing baseline measurements to be used to track market progress
over time.
Through our experience with RPP, both PG&E’s pilot and through our recent evaluation of the
Northwest Energy Efficiency Alliance’s (NEEA’s) RPP, and the Statewide Residential Solutions

Workbook (RSW), and workpaper updates, we operationalized PG&E’s four research objectives
into fourteen (14) research questions (shown in Table 1 below). To address these research
questions, we propose conducting three research activities:
1. A literature review including published energy studies, PG&E’s RPP planning
documents, documentation of energy-related meetings, articles, press releases, research
reports, and published data.
2. In-depth interviews with market actors, including RPP staff at PG&E and EPA,
manufacturers, retailers, and trade associations, and
3. A general population survey of consumers.
Table 1: Research Questions by Data Collection Activity
Research Questions
Product Review &
Secondary Research
In-Depth Interviews Consumer
Survey Program Staff
Manufac-turers Retailers
Trade Assoc.
What are the market barriers for adoption of EE models for each product?
X X X X
X
Are barriers generalizable to a general class of product?
X
X X X
What barriers do supply-side market actors identify for adoption of EE models?
X X X
Do barriers identified by RPP staff overlap with barriers identified by the supply-side?
X X X X X
What is magnitude of the challenge posed by each barrier identified for each product?
X X X X
What are the sales trends by product? X
X X X X
What is the current market share of EE models for each product and what is the growth trajectory for EE by product category?
X
X X
Who are the key market actors in the supply chain by product?
X X X X X X
What is the manufacturing development timeline for each product?
X
X
What are the key characteristics for each product?
X
How is category energy use likely to change, and what is likely to drive that change?
X
X X X
Among manufacturers, what is the relative importance of EE for each product?
X X X
Among consumers, what is the relative importance of EE for each product?
X
X
X
Is EE bundled with premium features? X
X
In conducting this research, we will leverage previous research conducted by Research Into
Action and others. For example, we recently conducted a limited literature review focused on
identifying barriers to market adoption for current RPP products, and we will build upon this
recent work when conducting the market characterization we describe below. Additionally, in a

separate research project conducted for the Statewide IOUs, Research Into Action gathered and
compiled energy and market data for a variety plug load and appliance (PLA) product
categories—both at the device level and the measure level—that overlap with the product
categories selected for inclusion in the RPP. This research is presented in the recently updated
the Residential Solutions Workbooks (RSW). Research Into Action also recently completed
additional research for PG&E and Statewide product teams to support updates to PLA Work
Papers. This research entailed reviews of secondary sources to identify key data points, insights,
and perspectives needed to update a Work Paper as well as interviews with appliance
manufacturer representatives to assess current market conditions and future product and market
trends.
Proposed Tasks
Below we describe six research tasks to address PG&E’s four research objectives and inform
RPP planning, design, and baseline calculation. The six tasks together will characterize the
market for each product PG&E currently included in the 2016 RPP platform, and up to two
products PG&E is reviewing for future inclusion in the platform, for example ultra-HD
televisions. As documented in the RPP program theory and logic model (PTLM)1 document, the
six products incented in the 2016 portfolio are:
1. Freezers
2. Air purifiers/cleaners
3. Room air conditioners
4. Sound bars
5. Electric dryers
6. Gas dryers
A full market characterization for these six products (with the possibility of two more products
under consideration for future program years), as proposed here, will also provide PG&E with
market baseline snapshots to track program progress over time.
Task 1: Develop Work Plan and Manage Project
Kick-off Meeting
Dr. Paul Schwarz, principal-in-charge, and Dr. Alexandra Dunn, project manager, of Research
Into Action will participate in a web-based project initiation meeting with the pilot team to:
Review and comment on this proposal
Learn more about RPP
Discuss steps needed to prepare a research plan and begin the research
1 PG&E staff provided Research Into Action with the PTLM document on in December 2015.

We will prepare an agenda for the meeting and provide it to the PG&E project manager at least
three days prior to the meeting.
On-going Project Management
Drs. Schwarz and Dunn will be actively involved in the project from its inception. Dr. Schwarz
will be available to the project team on an as-needed basis, and will be involved directly in the
review of in-depth and survey instruments and the development of conclusions and
recommendations.
Dr. Dunn will work with project team members to ensure that they understand the project and are
able to deliver the project in a timely and effective manner. Dr. Dunn will design and oversee the
research; schedule milestone calls to discuss the project; hold regular internal meetings
addressing the activities underway; and prepare monthly reports, to be delivered by the 10th day
of each month, documenting project activities and any questions that need attention.
Deliverables:
Kick-off meeting agenda
Kick-off meeting
Meeting results memo
Weekly or bi-weekly status calls with PG&E project manager
Monthly progress reports by the 10th of the month
Draft and final work plan
Task 2: Review Products and Conduct Secondary Research
For up to eight products (the six selected for RPP’s 2016 portfolio, plus two additional products)
we will conduct an in-depth literature review to identify market trends, market barriers, key
players, the product market’s attitude towards energy efficiency and a preliminary assessment of
barriers and opportunities. We will also use the literature review to expand our current list of
interview contacts for Task 4.
The following are examples of documents we will review for each product.
Published energy use studies
Documentation from energy-related meetings (for example, ENERGY STAR
specification development meetings), including PowerPoint presentations and meeting
notes
Articles, press releases, research reports and published data from print and online-only
sources including popular publications, industry-specific publications/organizations,
manufacturer websites, and market research firms. These may include:
Business data source: Hoovers.com

Industry-specific publications/organizations: Electronics Weekly, eWeek, National
Cable and Telecommunications Association (NCTA), TWICE
Market research firms: ABI Research, Dell’Oro Group, Gartner, IDC, iSupply,
NPD Group, VDC Research Group
Popular media: Business Week, The New York Times, The Wall Street Journal
The literature review will build on research already conducted by Research Into Action and other
energy efficiency organizations actively engaged in researching the energy used by, or
developing energy efficiency standards for, consumer electronics and white goods products.
The research conducted in this task will inform product-level characterizations in the final report.
These characterizations will each include topics such as:
Key market characteristics
Product types
Top manufacturers
Energy efficiency
Resources
Supply chain
Barriers and opportunities
Task 3: Interview RPP Designers and Program Staff and Translate Barriers
The RPP PTLM discusses the market barriers the program faces and the strategic interventions
intended to address them. The discussion of these barriers largely reflect the perspectives of
program designers and administrators, which in turn must be reconciled with perceptions
regarding the key market barriers as seen by market actors such as retailers and manufacturers.
We will use the results of interviews in Task 3 to develop a better understanding of the market
barriers and the supply chain issues facing each of the relevant RPP product categories. Then, we
will use this improved understanding to prepare and conduct interviews with various market
actors in Task 4.
Interview RPP Design and Program Staff
We will conduct interviews with up to six (6) individuals working directly with RPP program
design. These individuals may include program managers at EPA, the CA IOUs, NEEA, and
program designers from evaluation consultancies at EMI, and Cadmus, and we will endeavor to
interview at least one representative from each organization. We will seek to get a broad cross
section of perspectives represented by these organizations, and when appropriate we will
interview several individuals as a group, which will enable individual interviewees to build off
the responses of others and allow us to get a fuller organizational perspective.

We will conduct the interviews as free flowing, open-ended interviews, lasting approximately
45-60 minutes each. We plan to cover the following topics:
Cataloging Market Barriers:
What market barriers bar end-use customers from adopting EE models of white good
and consumer electronic products?
What market barriers does RPP address?
What technologies your staff expect to see in the next five years?
Identification of Supply Chain Intervention Points
What is the best method to influence integration of EE into the selected products?
What interventions are currently implemented across the supply chain? What are the
weaknesses and strengths of these current interventions?
What are the incentives for distributors and retailers for moving efficient products?
How much does consumer demand drive EE improvements?
Identification of Key Players in Supply Chain
What are the key manufacturers for each product?
Are there organizations that influence these markets?
Who are the key players driving EE for each product?
Prior to conducting the interviews, we will prepare an interview guide and send it to PG&E for
review and comment.
Translate EE-Program-Facing Barriers to Supply-Side-Facing Barriers
As noted above, we will use the results of our interviews with program staff prior to inform our
interview guides for market actors (discussed below). In particular, we believe it is important to
compare the market barriers identified by program staff with the market barriers identified by the
various market actors. For example, the RPP PTLM documents barriers that may limit the
success of the program, whereas retailers and manufacturers, for example, will likely emphasize
potential barriers that may limit their ability to sell products. Moreover, program staff and
various market actors may view the same barrier with different levels of significance. We will
use our experience interviewing retailers as well as our knowledge of RPP to map the market
barriers identified in the PTLM and discussed by program staff to the barriers identified by the
market actors.
Deliverables:
Draft and final interview guides
Memo documenting barrier mapping
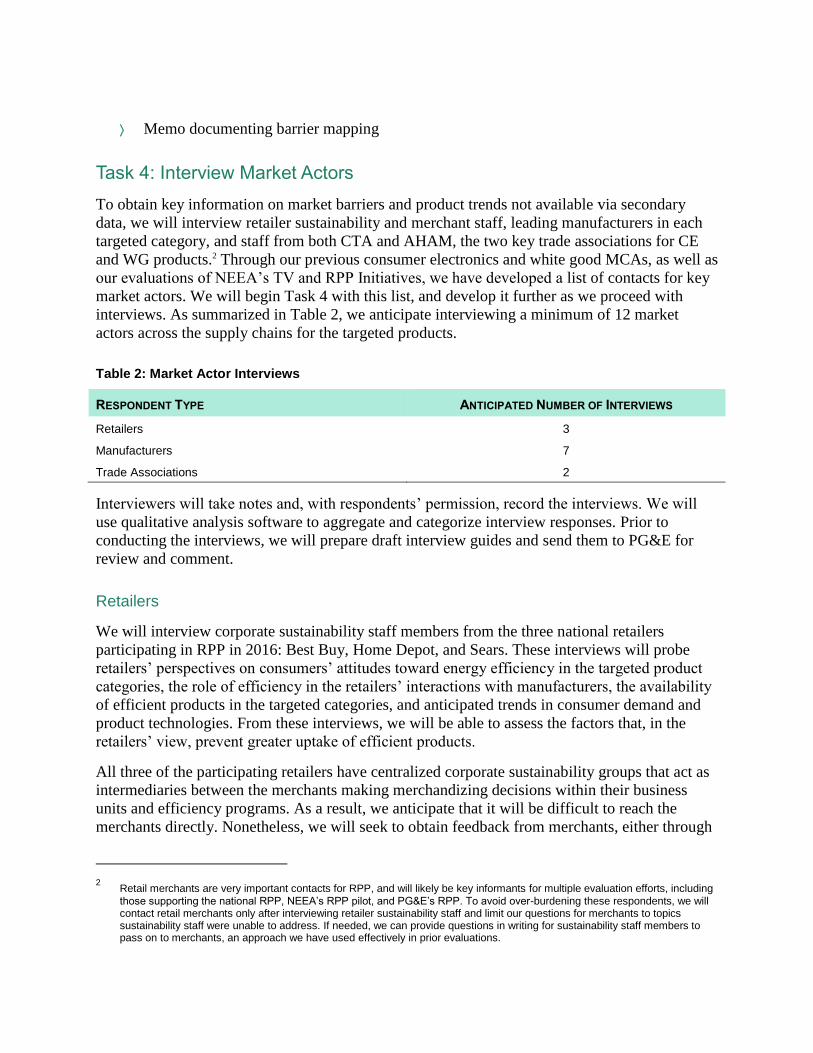
Task 4: Interview Market Actors
To obtain key information on market barriers and product trends not available via secondary
data, we will interview retailer sustainability and merchant staff, leading manufacturers in each
targeted category, and staff from both CTA and AHAM, the two key trade associations for CE
and WG products.2 Through our previous consumer electronics and white good MCAs, as well as
our evaluations of NEEA’s TV and RPP Initiatives, we have developed a list of contacts for key
market actors. We will begin Task 4 with this list, and develop it further as we proceed with
interviews. As summarized in Table 2, we anticipate interviewing a minimum of 12 market
actors across the supply chains for the targeted products.
Table 2: Market Actor Interviews
RESPONDENT TYPE ANTICIPATED NUMBER OF INTERVIEWS
Retailers 3
Manufacturers 7
Trade Associations 2
Interviewers will take notes and, with respondents’ permission, record the interviews. We will
use qualitative analysis software to aggregate and categorize interview responses. Prior to
conducting the interviews, we will prepare draft interview guides and send them to PG&E for
review and comment.
Retailers
We will interview corporate sustainability staff members from the three national retailers
participating in RPP in 2016: Best Buy, Home Depot, and Sears. These interviews will probe
retailers’ perspectives on consumers’ attitudes toward energy efficiency in the targeted product
categories, the role of efficiency in the retailers’ interactions with manufacturers, the availability
of efficient products in the targeted categories, and anticipated trends in consumer demand and
product technologies. From these interviews, we will be able to assess the factors that, in the
retailers’ view, prevent greater uptake of efficient products.
All three of the participating retailers have centralized corporate sustainability groups that act as
intermediaries between the merchants making merchandizing decisions within their business
units and efficiency programs. As a result, we anticipate that it will be difficult to reach the
merchants directly. Nonetheless, we will seek to obtain feedback from merchants, either through
2 Retail merchants are very important contacts for RPP, and will likely be key informants for multiple evaluation efforts, including
those supporting the national RPP, NEEA’s RPP pilot, and PG&E’s RPP. To avoid over-burdening these respondents, we will contact retail merchants only after interviewing retailer sustainability staff and limit our questions for merchants to topics sustainability staff were unable to address. If needed, we can provide questions in writing for sustainability staff members to pass on to merchants, an approach we have used effectively in prior evaluations.

direct interviews or by asking sustainability staff members to pass on written questions, to
address any issues that interviews with sustainability staff do not adequately resolve.
Manufacturers
We will seek to interview staff members of leading manufacturers in each product category. We
anticipate that some manufacturers will be leaders in multiple categories. For these
manufacturers, we will seek to obtain data about all of the relevant categories. This may involve
identifying multiple contacts within the manufacturer organization or adapting the interview
guide to address multiple categories with a single, knowledgeable respondent. Manufacturer
interviews will focus on technology trends, manufacturers’ perspectives on consumer
preferences related to energy efficiency, and manufacturers’ perceptions of retailers’ views on
efficiency. Through these interviews, we will seek to assess the primary barriers preventing
manufacturers from increasing the efficiency of their product designs.
In Appendix A we provide a list of manufacturers for each product included in RPP’s 2016
portfolio. We will attempt to interview manufacturers with the largest market share across RPP’s
three participating retailers (Sears Holdings, The Home Depot, and Best Buy), as well as
manufacturers who manufacture multiple products incented through RPP. Since these
manufacturers will have the largest touch with RPP through retailers and multiple products, these
manufacturers are the most likely to eventually be influenced by RPP.
Key Trade Associations (CTA, AHAM)
In order to gain a broader perspective on the supply chains for the targeted products than
individual retailers and manufacturers can provide, we will interview staff members at key
industry organizations. The Consumer Technology Association (CTA) represents consumer
electronics manufacturers and retailers and the Association of Home Appliance Manufacturers
(AHAM) represents appliance manufacturers. Interviews with these associations will address
trends in technologies and consumer preferences with implications for energy use, as well as the
most important factors preventing greater uptake of efficient products in the targeted categories.
Deliverables:
Draft interview guides for each group of market actors
Final interview guides for each group of market actors
Task 5: Survey Consumers
We will conduct a consumer web survey to identify end-user barriers and characterize the
general awareness, knowledge, and attitudes toward various energy efficiency behaviors for
consumers in PG&E territory. The survey will reflect the CA general population based on the

2010 census and will use established survey batteries for Awareness, Knowledge, Attitudes and
Behaviors (akAB)3, and Statewide Marketing and Outreach Program’s (SWM&O) segments4.
We propose surveying 1,000 consumers to allow for statistically relevant analysis of behavior
subgroups, such as consumers who report purchasing EE products.
Sampling. To control costs and ensure we accurately reflect California’s diverse general
population, we will use an online web panel from SSI. SSI, is well positioned to successfully
field online studies for diverse populations. If necessary, SSI will enhance sample
representativeness through its proprietary method. This approach recruits online survey
respondents from a panel list of diverse respondents. SSI enhances sample representativeness by
drawing from a broad range of online sources and then controlling for variations in respondent
characteristics that are associated with those sources. SSI has invested significantly in
developing its sample blending approach and has been using it successfully for several years. See
Appendix B for example CA census proportions we can match using SSI panel.
Survey Guide Development. Results from this survey may serve as a baseline attitudinal
measurement to help quantify RPP’s consumer-level market effects in future program
implementation years. To serve as a consumer baseline, the survey questions will:
Identify barriers to purchasing EE versions of target products,
Identify products consumers have recently purchased and products consumers plan to
purchase in the next two years,
Characterize consumer purchasing behavior, e.g. whether consumers select products
online but purchase in the store, or whether behaviors differ by product or product
category,
Update the consumer plug-load saturation profiles, and
Characterize current attitudes using the akAB battery.
We will submit the draft survey for review and comment by the project managers; we will
address comments and provide a final draft survey prior to implementation. The instrument will
include the key questions to produce the SWM&O segments and the akAB battery. In order to
maintain high completion rates, we will restrict the survey length to 12 minutes in length.
Analysis. The data analysis for the surveys will rely on analysis of frequencies for the specific
questions asked as well as statistical comparisons using t-test and regression techniques. A key
finding in the 2011-2012 general population survey analysis was the importance of comparison
between different sub-populations. In addition to the linguistic and income groups we are setting
quotas for, other sub-populations may be especially important to identify and assess. Sub-
populations of specific interest in this analysis may be those who have previously participated in
3 http://www.calmac.org/publications/GPS_Report_08302012_FINAL.pdf
4 http://cpuc.ca.gov/NR/rdonlyres/9A3B6444-96AD-4A6D-A392-7588761C3A9D/0/OpinionDynamicsFinalSegmentationReport.pdf

a downstream PG&E program, or regularly purchase EE versions of products. We will look for
this type of disaggregation into sub-groups for this analysis, and plan on conducting regression
analyses to identify key predictors of high akAB and intention to purchase EE versions of
products.
We will prepare a draft analysis plan memo and provide that to the PG&E project manager prior
to beginning the analysis.
Deliverables:
Draft and final survey questionnaire
Analysis plan memo
Task 6: Document and Present Findings
We will combine the results of these activities into a final report to document the project and
provide a single reference resource. In addition, we will document our methodologies and
include copies of all interview guides and survey questionnaires as appendices. We will submit a
draft for review and comment and then finalize the report within two weeks after receiving
comments.
In addition, we will prepare a PowerPoint presentation summarizing our key findings and
conduct two webinars—an internal presentation with PG&E staff, and a separate presentation
with CPUC Energy Division staff.
Deliverables:
Draft and final report
Draft and final PowerPoint slide deck
Two webinars, one for PG&E staff and one for Energy Division
Timeline
The following table outlines the key milestones and deliverables for this project. We include a
general timeline in days relative to the notice to proceed (NTP) as well as a hypothetical timeline
if the project started on February 1, 2016. Task 2 activities do not include a deliverable but will
be conducted prior to and concurrent with primary data collection activities (Tasks 3-5).
Although we believe these completion dates are realistic, we note from our experience that
conducting interviews with market actors, such as retailers and manufacturers, is difficult, and as
such these completion dates are subject to change. We will, of course, keep PG&E apprised
regarding any necessary changes to the project timeline.
Table 3: Key milestones and deliverables
Task Activity Anticipated Calendar Days

Completion Date Relative to NTP
0 Notice to Proceed (NTP) 1-Feb-16 0
1 Kick-off Meeting Agenda 8-Feb-16 7
1 Kick-off Meeting 11-Feb-16 10
1 Kick-off Meeting Memo 15-Feb-16 14
1 Draft Work Plan 11-Feb-16 10
1 Comments on Draft Work Plan 15-Feb-16 14
1 Final Work Plan 25-Feb-16 24
3 Draft Interview Guides for RPP Designers and Program Staff 10-Mar-16 38
3 Final Interview Guides for RPP Designers and Program Staff 17-Mar-16 45
3 Interviews with RPP Designers and Program Staff 7-Apr-16 66
3 Memo Documenting Barrier Mapping 21-Apr-16 80
4 Draft Interview Guides for Market Actors 28-Apr-16 87
4 Final Interview Guide for Market Actors 5-May-16 94
4 Interviews with Market Actors 12-May-16 101
5 Draft Consumer Survey 22-Apr-16 81
5 Final Consumer Survey 6-May-16 95
5 Analysis Plan Memo for Surveys 6-May-16 95
6 Draft Report 24-Jun-16 144
6 Final Report 18-Jul-16 168
6 Final Data to PG&E 25-Jul-16 175
1 Weekly Updates and Monthly Reports Weekly/Monthly NA
1 Regulatory Support Unknown NA

Research Into Action, Inc. PO Box 12312 Portland, OR 97212
www.researchintoaction.com
503 287 9136 (main) 503 281 7375 (fax) 888 492 9100 (toll free)
| Page 12
Staffing
Dr. Paul Schwarz, a Managing Director of Research Into Action, will have overall responsibility
as the principal-in-charge for this project and will ensure that the research objectives are met and
the key questions of the project are addressed. Dr. Alexandra Dunn, Senior Consultant II, will be
the project manager. Dr. Dunn will work closely with Mr. Joe Van Clock, the qualitative task
lead (Tasks 2-4), to develop the market characterization for the each product, to design interview
guides, and conduct in-depth interview guides. Dr. Dunn will work with Mr. Jordan Forks, our
quantitative lead (Task 5), to develop the consumer survey guide, and execute and analyze the
survey. Mr. Zac Hathaway, and Dore Mangan, will work with Dr. Dunn to develop data
collection instruments, conduct interviews, and provide additional analytical support for the
team.

Research Into Action, Inc. PO Box 12312 Portland, OR 97212
www.researchintoaction.com
503 287 9136 (main) 503 281 7375 (fax) 888 492 9100 (toll free)
| Page 13
Budget
Table 3 shows our proposed budget for the research described in this proposal.
Table 3: Proposed Budget
Category Rate Task 1 Task 2 Task 3 Task 4 Task 5 Task 6 Total Hours
Total Amount
Research Into Action Hours
Managing Director $159 8 8 6 8 12 28 70 $11,130
Director $138 32 24 24 32 32 44 188 $25,944
Sr. Consultant 1 $122 40 32 48 86 12 56 274 $33,428
Consultant 2 $111
60 24 100 120 60 364 $40,404
Consultant 1 $101
100
32
132 $13,332
Support/Technical Editor $58
40 40 $2,320
Hours per Task
80 224 102 226 306 288 1226
Labor cost per Task
$10,568 $25,248 $12,786 $27,280 $24,340 $26,336
$126,558
Other Direct Costs (ODC)
Market Research Firm
$19,800
$19,800
G&A on Subs @ 5%
$0 $0 $0 $0 $990 $0
$990
Total Cost by Task $10,568 $25,248 $12,786 $27,280 $45,130 $26,336
Project Total $147,348

Research Into Action, Inc. PO Box 12312 Portland, OR 97212
www.researchintoaction.com
503 287 9136 (main) 503 281 7375 (fax) 888 492 9100 (toll free)
| Page 14
Appendix A –Manufacturers by Product
This appendix provides tables of manufacturers by product across the three participating
retailers. Bolded entries are manufacturers who currently provide at least one ENERGY STAR
qualified model. When conducting this preliminary research, we found there were many
manufacturers for room air conditioners, air purifiers/cleaners, and soundbars. For these
products, we restrict the manufacturers to those who A) manufacture an ENERGY STAR version
of the product, or B) are sold by more than one participating retailer.
Gas Dryers
Manufacturer
Retailer
Best Buy Sears Home Depot
Amana X
X
Electrolux X
Frigidaire X
X
GE X
X
LG X
X
Samsung X
X
Whirlpool X
X
Kenmore (elite)
X
Maytag
X X
Hotpoint
X X
Electric Dryers
Manufacturer Retailer
Best Buy Sears Home Depot
Amana X
X Avanti X
Bosch X X
Electrolux X X X Equator X
Frigidaire X X X GE X X X Haier X
X
LG X X X Magic Chef X
X
Samsung X X X Whirlpool X X X Maytag
X X
Hotpoint
X X

To: Brian Smith, PG&E
Re: Proposal for Market Characterization Research
| Page 15
Deco
X Ariston
X
Kenmore (elite)
X
Room Air Conditioners
Manufacturer Type Retailer
Best Buy Sears Home Depot
Arctic King Window X
Avallon Portable X
X
Comfort-Aire Window X
DeLonghi Portable X
X
Frigidaire Both X X X
Haier Both X X X
Heat Controller Window X
Honeywell Portable X
X
Impecca Both X
X
Keystone Both X X X
LG Both X X X
Luma Comfort Portable X
X
NewAir Portable X
X
RCA Both X
X
Royal Sovereign Portable X
X
Senville Window X
SoleusAir Window X
X
SPT Both X X X
Whirlpool Portable X
X
Whytner Portable X
X
Kenmore (elite) Both
X X
Air Cleaners/Purifiers
Manufacturer Retailer
Best Buy Sears Home Depot
3M X
Airfree X
X
Alen X
X
Black and Decker X
Blueair X X X
Coway X

To: Brian Smith, PG&E
Re: Proposal for Market Characterization Research
| Page 16
Crane X X X
DeLonghi X X
Envion X
Febreze X
X
Fellowes X
GermGuardian X X
Holmes X
Honeywell X X X
Hoover X
Lasko X
X
Rowenta X
Sharp X
X
SPT X X X
Vornado X
X
Whynter X
X
Winix X X X
Kenmore
X
Brondell
X X
Whirlpool
X
Rabbit Air
X
AmairCare
X
Electrolux
X
GE
X
Freezers
Manufacturer Type Retailer
Best Buy Sears Home Depot
Amana Both X
X
Avanti Chest X
Danby Both X
X
EdgeStar Upright X
Electrolux Upright X X X
Equator Both X X
Equator-Midea Upright X
X
Frigidaire Both X X X
GE Both X
X
Haier Chest X
Hisense Chest X
X
Igloo Both X X X
Insignia Both X
Kenmore Both
X X

To: Brian Smith, PG&E
Re: Proposal for Market Characterization Research
| Page 17
SPT Upright X X X
Summit Chest X
X
Whirlpool Both X X X
Whynter Both X X X
Magic Chef
X
Maytag
X
White-Westinghouse
X
Sound Bars
Manufacturer Retailer
Best Buy Sears Home Depot
Bose X X
iLive X X
LG X X
Libratone X
Magnavox X
X
Naxa X X
Panasonic X
X
Polk Audio X
X
Pyle X
X
Samsung X X X
Sharp X X
Sony X X
Vizio X X X
Yamaha X
ZVOX X
Ultra-HD Televisions
Manufacturer Retailer
Best Buy Sears Home Depot
LG X X
Samsung X X
Sharp X X
Sony X X
VIZIO X
X
Westinghouse X
Hisense
X
Upstar
X
JVC (Amptran Video Corp) X
Proscan
X

To: Brian Smith, PG&E
Re: Proposal for Market Characterization Research
| Page 18
Appendix B – CA 2010 Census Requirements for Sampling
We will establish quotas to ensure representation in the following areas.
Language
English 82%
Spanish 13%
Other 5%
HH Income
Less than $50k 42%
$50k - $100k 29%
$100k or more 29%
Geography
Urban 94%
Rural 6%
Race
White 62%
Asian 13%
Other 24%

PG&E Gas and Electric Advice Filing List General Order 96-B, Section IV
AT&T Division of Ratepayer Advocates OnGrid Solar Albion Power Company Don Pickett & Associates, Inc. Pacific Gas and Electric Company Alcantar & Kahl LLP Douglass & Liddell Praxair Anderson & Poole Downey & Brand Regulatory & Cogeneration Service, Inc. Atlas ReFuel Ellison Schneider & Harris LLP SCD Energy Solutions BART G. A. Krause & Assoc. SCE Barkovich & Yap, Inc. GenOn Energy Inc. SDG&E and SoCalGas Bartle Wells Associates GenOn Energy, Inc. SPURR Braun Blaising McLaughlin & Smith, P.C. Goodin, MacBride, Squeri, Schlotz &
Ritchie San Francisco Water Power and Sewer
Braun Blaising McLaughlin, P.C. Green Power Institute Seattle City Light CPUC Hanna & Morton Sempra Energy (Socal Gas) California Cotton Ginners & Growers Assn International Power Technology Sempra Utilities California Energy Commission Intestate Gas Services, Inc. SoCalGas California Public Utilities Commission Kelly Group Southern California Edison Company California State Association of Counties Ken Bohn Consulting Spark Energy Calpine Leviton Manufacturing Co., Inc. Sun Light & Power Casner, Steve Linde Sunshine Design Cenergy Power Los Angeles County Integrated Waste
Management Task Force Tecogen, Inc.
Center for Biological Diversity Los Angeles Dept of Water & Power Tiger Natural Gas, Inc. City of Palo Alto MRW & Associates TransCanada City of San Jose Manatt Phelps Phillips Troutman Sanders LLP Clean Power Marin Energy Authority Utility Cost Management Coast Economic Consulting McKenna Long & Aldridge LLP Utility Power Solutions Commercial Energy McKenzie & Associates Utility Specialists Cool Earth Solar, Inc. Modesto Irrigation District Verizon County of Tehama - Department of Public Works
Morgan Stanley Water and Energy Consulting
Crossborder Energy NLine Energy, Inc. Wellhead Electric Company Davis Wright Tremaine LLP NRG Solar Western Manufactured Housing
Communities Association (WMA) Day Carter Murphy Nexant, Inc. YEP Energy Defense Energy Support Center ORA Dept of General Services Office of Ratepayer Advocates