© Services Transformation & Innovation Group, LLC All rights reserved. 1 “The Service Economy”...
24
© Services Transformation & Innovation Group, LLC All rights reserved. 1 “The Service Economy” ISSIP Service Economics an you measure the new services economy the same old way? Doug Morse 2015 1
-
Upload
drusilla-caldwell -
Category
Documents
-
view
215 -
download
2
Transcript of © Services Transformation & Innovation Group, LLC All rights reserved. 1 “The Service Economy”...
© Services Transformation & Innovation Group, LLC All rights reserved.
1
“The Service Economy”
ISSIP Service Economics
Can you measure the new services economy the same old way?
1
Doug Morse 2015
© Services Transformation & Innovation Group, LLC All rights reserved.
1
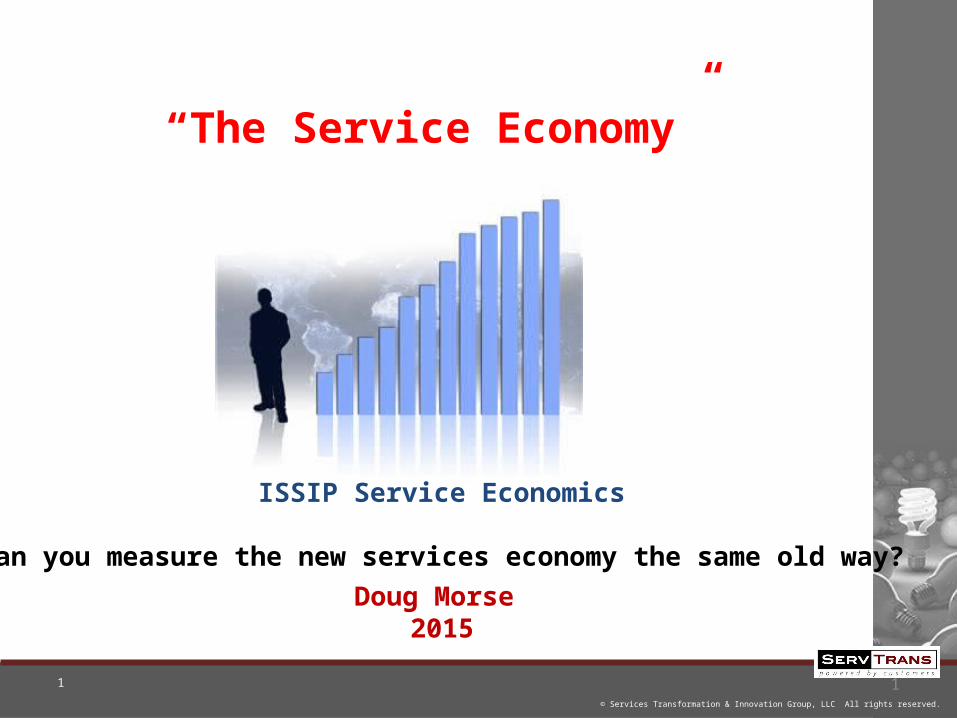
Service Economics Group Charter / Mission
The key purpose Service Economics Group is to bring together a diverse team of individuals and organizations to help define and better understand current and desired future state economic tools, models, processes and technologies that would reduce inhibitors to current service innovation and to drive change that accelerate service innovation in the future. Ultimately the group would become an instigator / influencer of change to economic policies, economic and business metrics and accounting rules in support of the services economy.
This may include but is not limited to the following: Create a center of knowledge and expertise around service economics Use the COE ( Center of Expertise ) to drive change that promotes service innovation, new education
models, public policy and economic models. Understand new forms of value creation
o Customer Equity – Customers as an asset – beyond ‘goodwill’o Value of Data (big data, sensor data et al.)o Touchpoint value ( Twitter, Facebook, other social media that collects visits and views )
Research and education of both micro and macro-economic models of service(s) Definition and valuations of non-tangible economic transactions Create and disseminate intellectual property (papers, books, presentations etc.) that create a better
understanding of services related economics

© Services Transformation & Innovation Group, LLC All rights reserved.
1
Country Name 2008 2009 2010 2011 2012 2013
United Kingdom 77.2 78.5 78.7 78.4 78.9 79.2
France 77.6 78.5 78.6 78.3 78.2 78.5
North America 76.5 78.3 77.9 77.8 77.7
United States 77.2 78.8 78.4 77.8 77.7
Italy 71.8 73.8 73.7 73.7 74.2 74.4
OECD members 73.0 74.7 74.1 74.0 74.2
European Union 72.4 74.1 73.7 73.6 73.9 74.1
Euro area 72.1 73.8 73.4 73.3 73.5 73.7
Singapore 72.6 72.1 72.3 73.6 73.3 74.9
Japan 71.3 72.8 71.3 72.7 73.2
Europe & Central Asia (all income levels) 71.0 72.8 72.3 72.0 72.4 72.7
World 68.9 70.6 70.0 69.7 70.1Australia 69.7 68.6 70.6 69.1 69.3 70.7
Germany 69.2 71.6 69.3 68.7 68.4 68.4
Latin America & Caribbean (developing only) 61.0 63.1 62.0 62.8 63.3 64.2
Central Europe and the Baltics 62.7 63.7 63.3 61.9 62.4 62.4
Latin America & Caribbean (all income levels) 59.7 61.6 60.4 61.1 61.7 62.5
Korea, Rep. 61.2 60.7 59.3 59.1 59.5 59.1
Sub-Saharan Africa (all income levels) 50.0 52.2 55.8 55.4 55.9 57.3
China 41.8 43.4 43.2 43.4 44.6 46.1
Middle East & North Africa (all income levels) 45.2 41.6 42.3 42.9
% GDP from Service
Source World Bank : http://data.worldbank.org/indicator/NV.SRV.TETC.ZS/countries
© Services Transformation & Innovation Group, LLC All rights reserved.
1
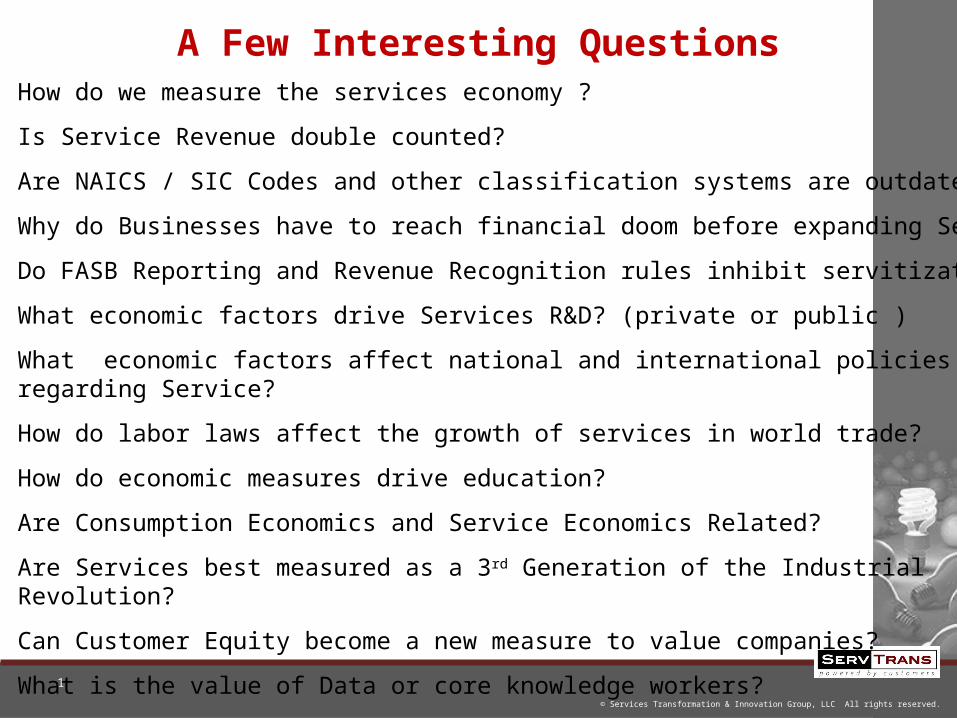
How do we measure the services economy ?
Is Service Revenue double counted?
Are NAICS / SIC Codes and other classification systems are outdated?
Why do Businesses have to reach financial doom before expanding Services?
Do FASB Reporting and Revenue Recognition rules inhibit servitization?
What economic factors drive Services R&D? (private or public )
What economic factors affect national and international policies regarding Service?
How do labor laws affect the growth of services in world trade?
How do economic measures drive education?
Are Consumption Economics and Service Economics Related?
Are Services best measured as a 3rd Generation of the Industrial Revolution?
Can Customer Equity become a new measure to value companies?
What is the value of Data or core knowledge workers?
A Few Interesting Questions
© Services Transformation & Innovation Group, LLC All rights reserved.
1
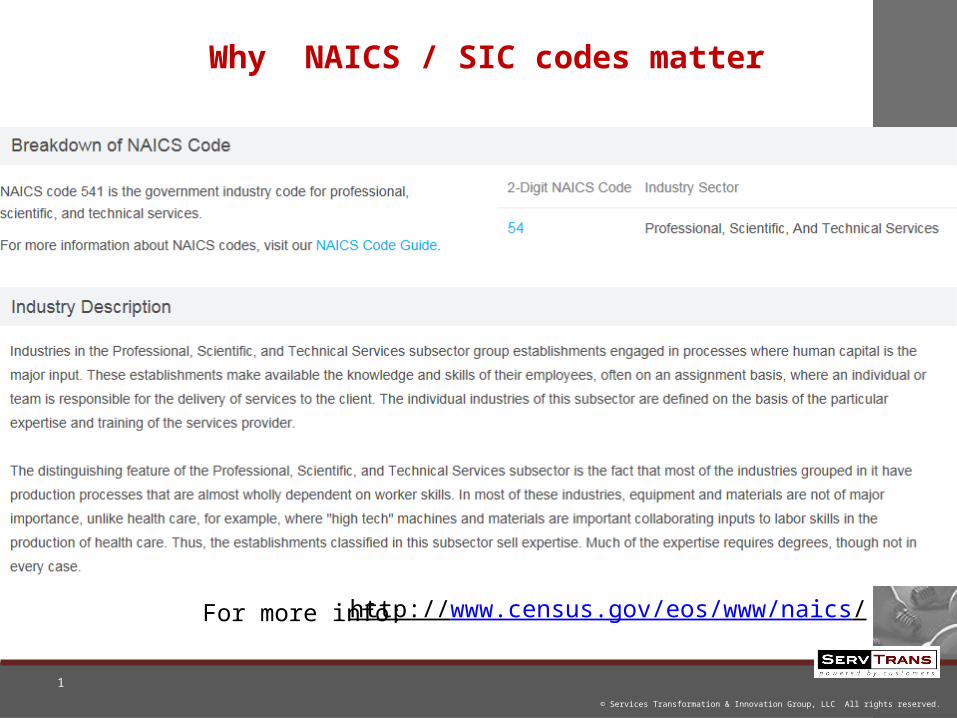
Why NAICS / SIC codes matter
http://www.census.gov/eos/www/naics/For more info:
© Services Transformation & Innovation Group, LLC All rights reserved.
1
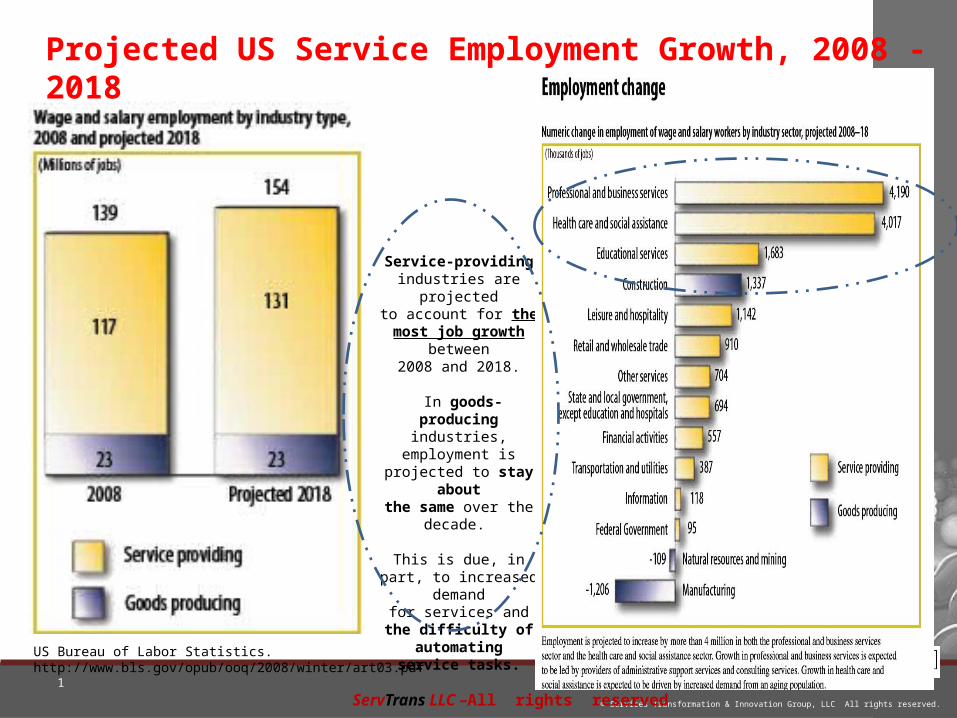
Service-providing industries are projectedto account for the most
job growth between2008 and 2018.
In goods-producing industries,
employment is projected to stay about
the same over the decade.
This is due, inpart, to increased
demandfor services andthe difficulty of
automatingservice tasks.
US Bureau of Labor Statistics. http://www.bls.gov/opub/ooq/2008/winter/art03.pdf
Projected US Service Employment Growth, 2008 - 2018
ServTrans LLC –All rights reserved
© Services Transformation & Innovation Group, LLC All rights reserved.
1
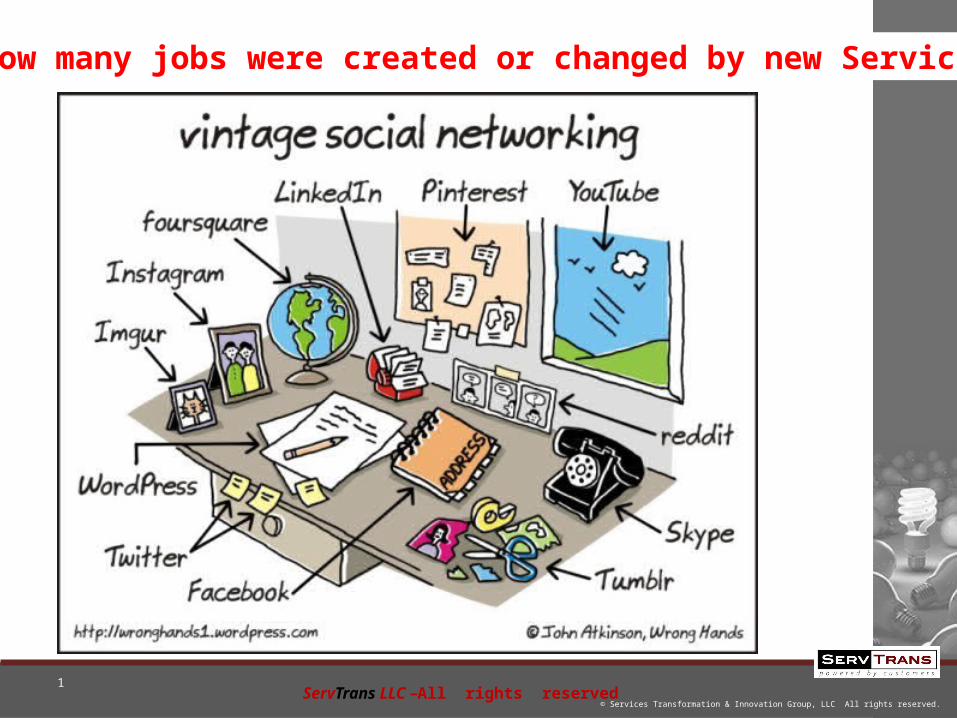
How many jobs were created or changed by new Services?
ServTrans LLC –All rights reserved

© Services Transformation & Innovation Group, LLC All rights reserved.
1
Manual labor to cognitive thinking

© Services Transformation & Innovation Group, LLC All rights reserved.
1
Ag Economy Industrial Economy Service Economy
Global Economic Shifts
ServTrans LLC –All rights reserved

© Services Transformation & Innovation Group, LLC All rights reserved.
1
Agricultural sectorAgriculture (a term which encompasses farming) is the process of producing food, feed, fiber and other goods by the systematic raising of plants and animals. Agricultural output is a component of the GDP of a nation.
Industrial sectorIndustry is the segment of economy concerned with production of goods (including fuels and fertilizers). Industrial output is a component of the GDP of a nation. It includes mining and extraction sectors.
Service sectorA service is the non-material equivalent of a good. Service provision is defined as an economic activity that does not result in ownership, and this is what differentiates it from providing physical goods. It is claimed to be a process that creates benefits by facilitating either a change in customers, a change in their physical possessions, or a change in their intangible assets. Service output is a component of the GDP of a nation. The service sector includes farm and factory related activities
ServTrans LLC –All rights reserved
© Services Transformation & Innovation Group, LLC All rights reserved.
1
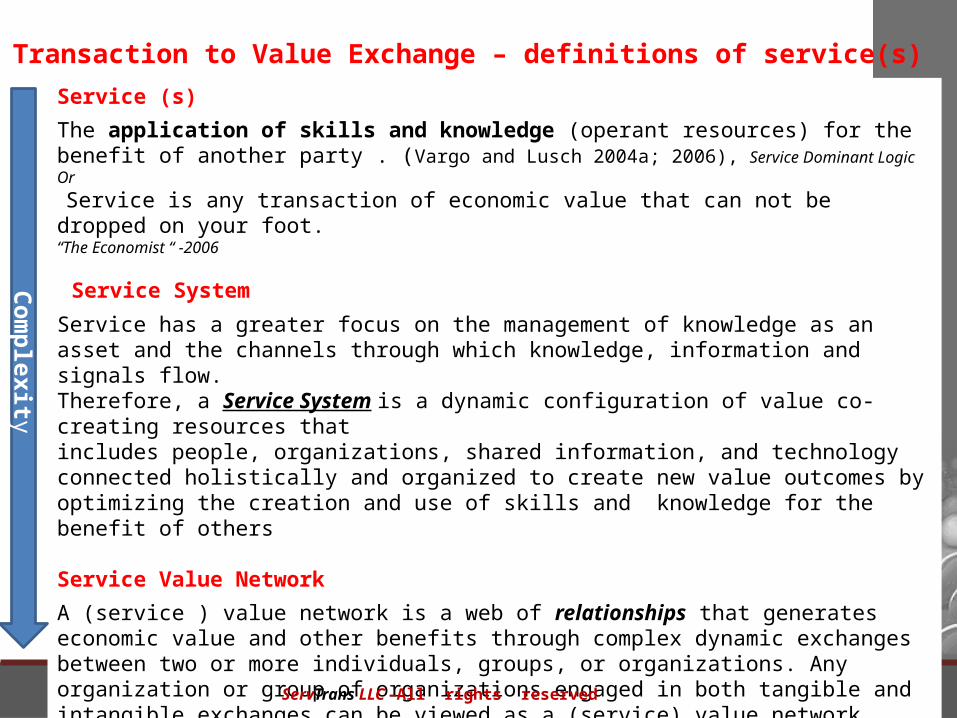
Service (s)
The application of skills and knowledge (operant resources) for the benefit of another party . (Vargo and Lusch 2004a; 2006), Service Dominant LogicOr
Service is any transaction of economic value that can not be dropped on your foot. “The Economist “ -2006
Service System
Service has a greater focus on the management of knowledge as an asset and the channels through which knowledge, information and signals flow. Therefore, a Service System is a dynamic configuration of value co-creating resources that includes people, organizations, shared information, and technology connected holistically and organized to create new value outcomes by optimizing the creation and use of skills and knowledge for the benefit of others
Service Value Network
A (service ) value network is a web of relationships that generates economic value and other benefits through complex dynamic exchanges between two or more individuals, groups, or organizations. Any organization or group of organizations engaged in both tangible and intangible exchanges can be viewed as a (service) value network, whether private industry, government, or public sector.Interpreted from: Verna Allee from ValueNetworks.com™
Co
mp
lexity
From Transaction to Value Exchange – definitions of service(s)
ServTrans LLC –All rights reserved
© Services Transformation & Innovation Group, LLC All rights reserved.
1
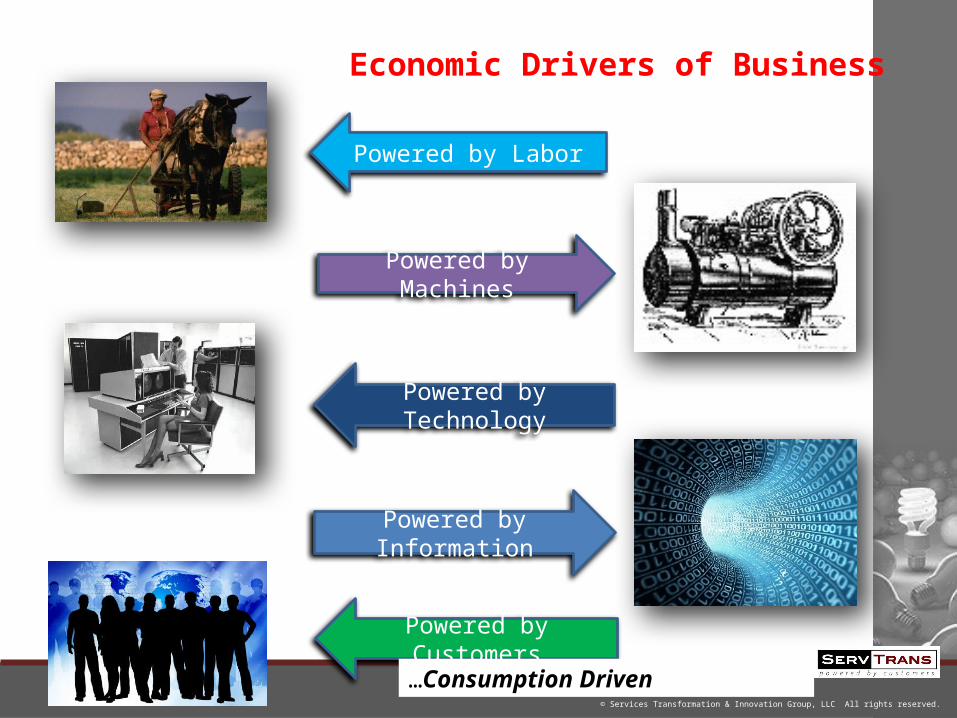
Powered by Labor
Powered by Customers
Powered by Technology
Powered by Machines
Powered by Information
Economic Drivers of Business
…Consumption Driven
© Services Transformation & Innovation Group, LLC All rights reserved.
1
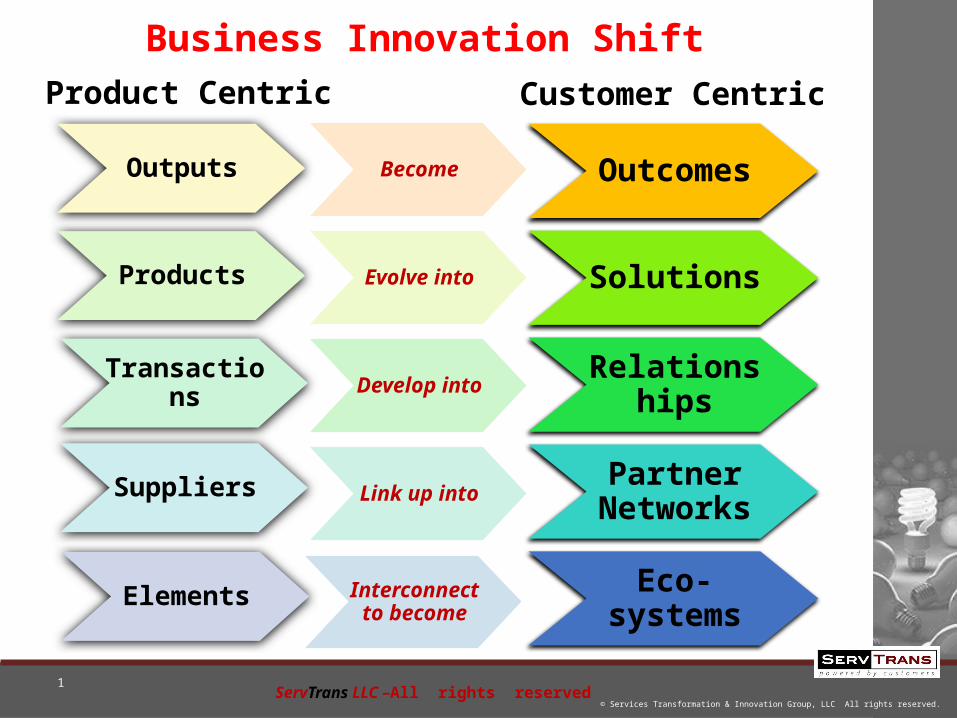
OutcomesBecomeOutputs
SolutionsEvolve intoProducts
RelationshipsDevelop intoTransactions
Partner NetworksLink up intoSuppliers
Eco-systemsInterconnect to become
Elements
Product Centric Customer Centric
Business Innovation Shift
ServTrans LLC –All rights reserved

© Services Transformation & Innovation Group, LLC All rights reserved.
1
Transaction Interaction Experience
Search ServeBrowse Relationship
$$$ $$$$$$
Commodity Packaged Service Experience
Source: BusinessWeek 2005
Relationship Creates Value
ServTrans LLC –All rights reserved
© Services Transformation & Innovation Group, LLC All rights reserved.
1
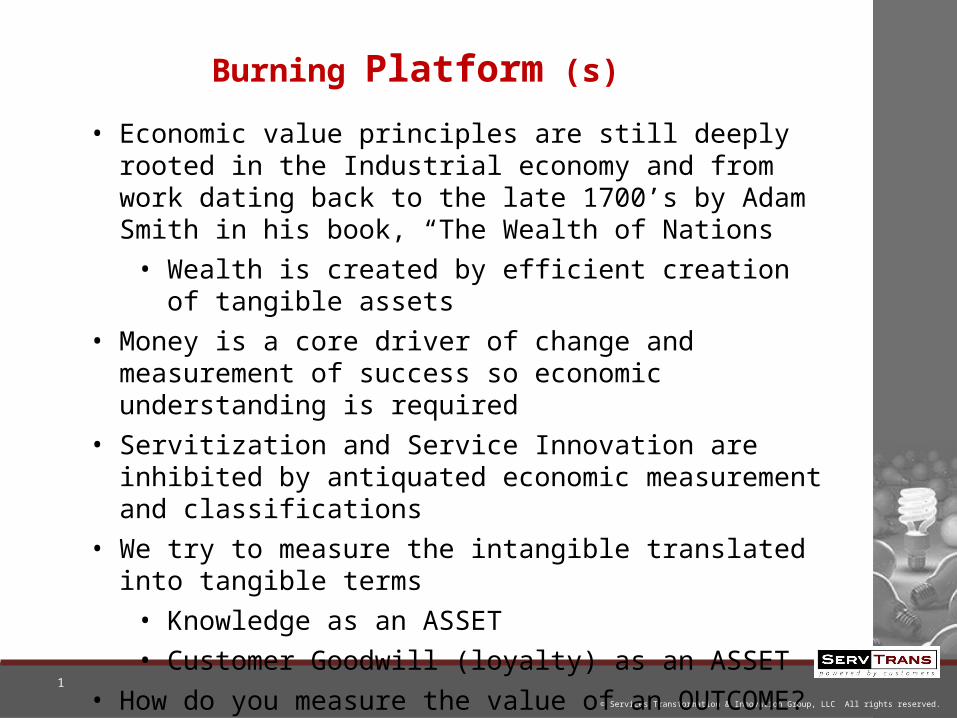
• Economic value principles are still deeply rooted in the Industrial economy and from work dating back to the late 1700’s by Adam Smith in his book, “The Wealth of Nations
• Wealth is created by efficient creation of tangible assets
• Money is a core driver of change and measurement of success so economic understanding is required
• Servitization and Service Innovation are inhibited by antiquated economic measurement and classifications
• We try to measure the intangible translated into tangible terms
• Knowledge as an ASSET
• Customer Goodwill (loyalty) as an ASSET
• How do you measure the value of an OUTCOME?
Burning Platform (s)

© Services Transformation & Innovation Group, LLC All rights reserved.
1
Business Success and Valuations
• Servitization – move from goods to services
• Consumption economics is different than production economics
• Revenue Recognition
• Income to expense ratios reverse in consumption models - models become back loaded
• Business Valuations
• Value of customers
• Value of “eye balls” ( target marketing )
• Value of data ownership
• Changes in Brand Value
• Value Chain (Networks) vs. Supply Chain
• Who is the customer?
Wh
y Ch
ang
e ?
© Services Transformation & Innovation Group, LLC All rights reserved.
1
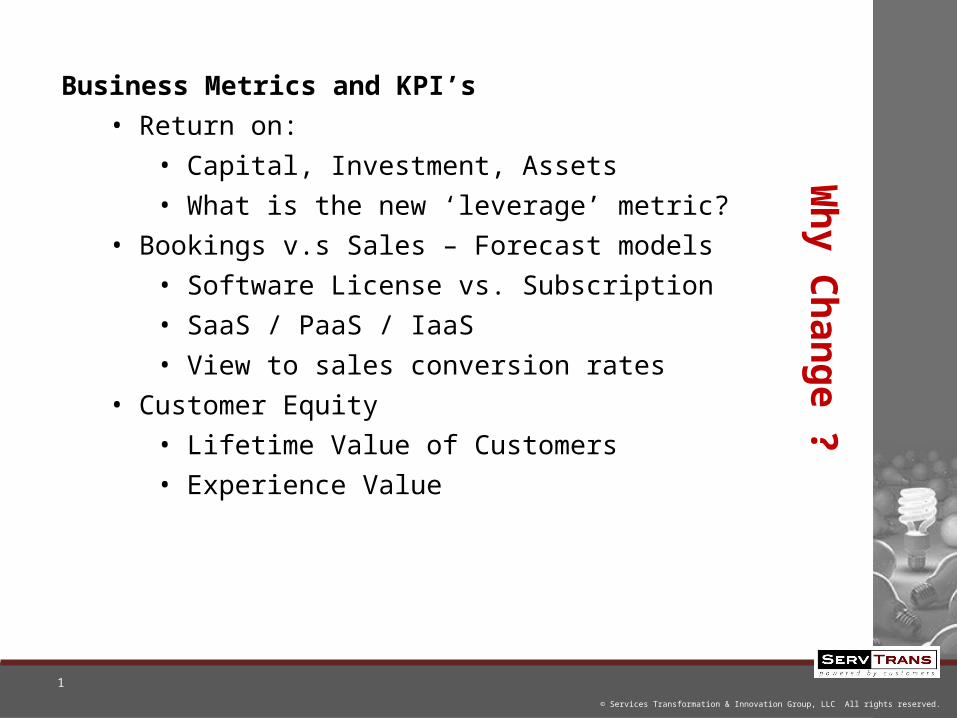
Business Metrics and KPI’s
• Return on:
• Capital, Investment, Assets
• What is the new ‘leverage’ metric?
• Bookings v.s Sales – Forecast models
• Software License vs. Subscription
• SaaS / PaaS / IaaS
• View to sales conversion rates
• Customer Equity
• Lifetime Value of Customers
• Experience Value
Wh
y Ch
ang
e ?
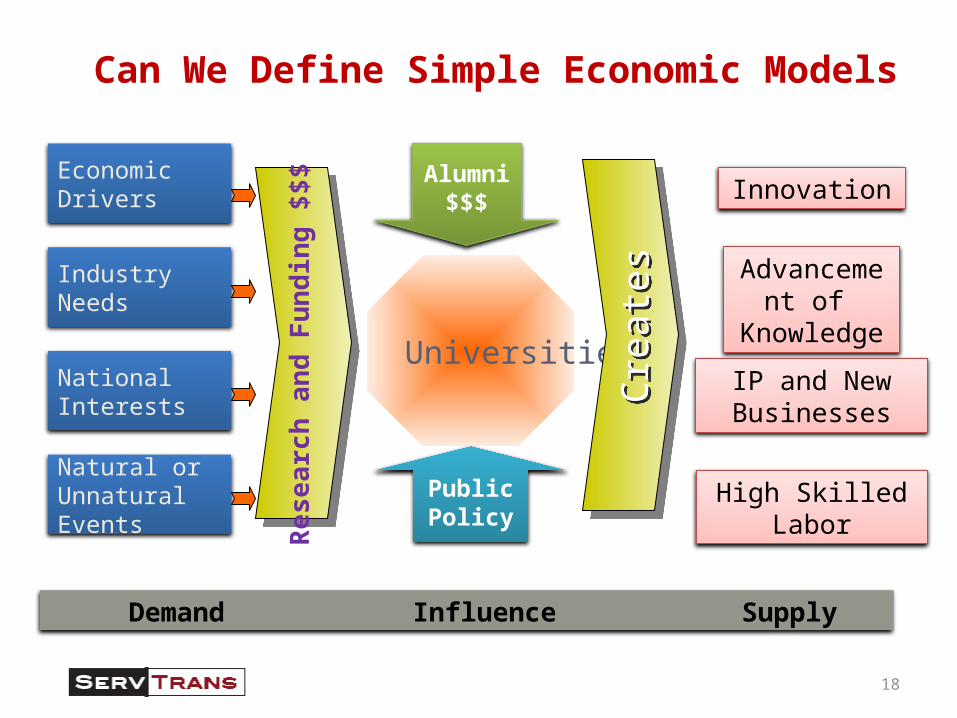
Universities
Economic Drivers
Industry Needs
National Interests
Natural or Unnatural Events
Rese
arch
and
Fun
ding
$$$
Innovation
IP and New Businesses
High Skilled LaborPublic Policy
Alumni $$$
Demand SupplyInfluenceCr
eate
sCr
eate
s
Can We Define Simple Economic Models
Advancement of Knowledge
18

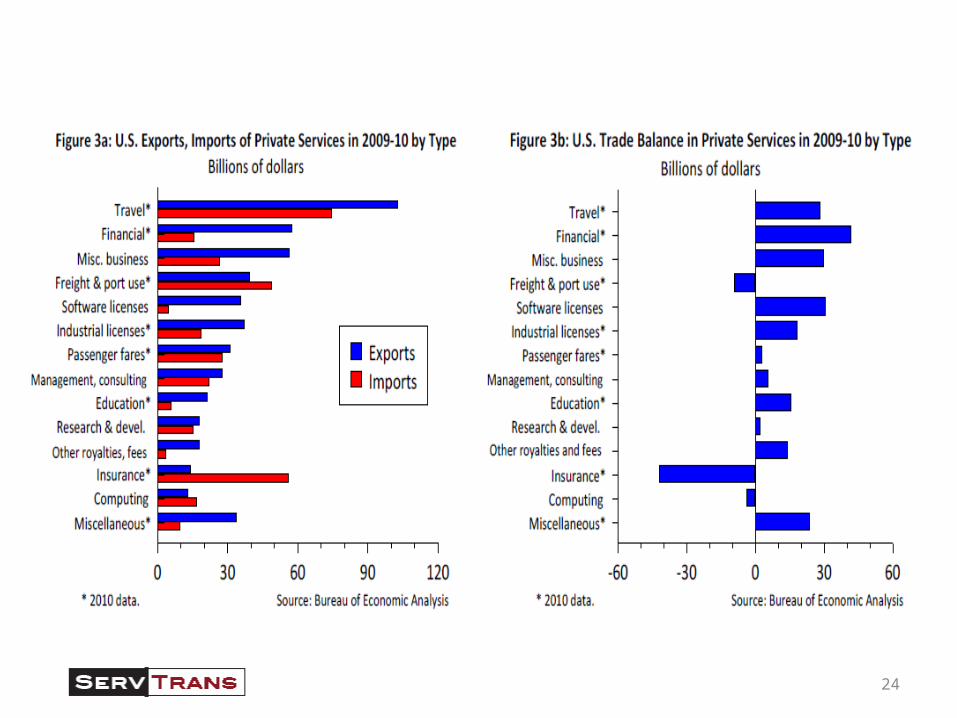
U.S. trade in commercial knowledge-intensive services and intangible assets—business, financial, and communications services, and payments of royalties and fees—has produced a consistent and growing surplus (figure O-38). It reached a record $108 billion in 2008, sufficient to counter-balance the high-technology goods deficit, and has been flat since then, reflecting the recession's effect. The EU's surplus was sharply off, and that of the Asia-8 fell as well—reflections of the continuing effects of the global recession.
NSF Science and Engineering Indicators 2012
19

How Do We Measure the Services Economy ?
Service as Percent of GDP
http://wdi.worldbank.org/table/4.2
http://data.worldbank.org/indicator/NV.SRV.TETC.ZS/countries
U.S. Bureau of Economic Analysis ( BEA )
http://www.bea.gov/itable/index.cfm
NAICS / SIC Codes and Other Classification Systems are outdated
http://www.census.gov/eos/www/naics/
Are Consumption Economics and Service Economic Related?
http://www.tsia.com/research/books-by-tsia/consumption-economics.html
Nation Master Data
http://www.nationmaster.com/country-info/stats/Economy/GDP
Are Services best measured as a 3rd Generation of the Industrial Revolution?
http://www.theguardian.com/sustainable-business/jeremy-rivkin-third-industrial-revolution
Some Informational Links
20
© Services Transformation & Innovation Group, LLC All rights reserved.
1
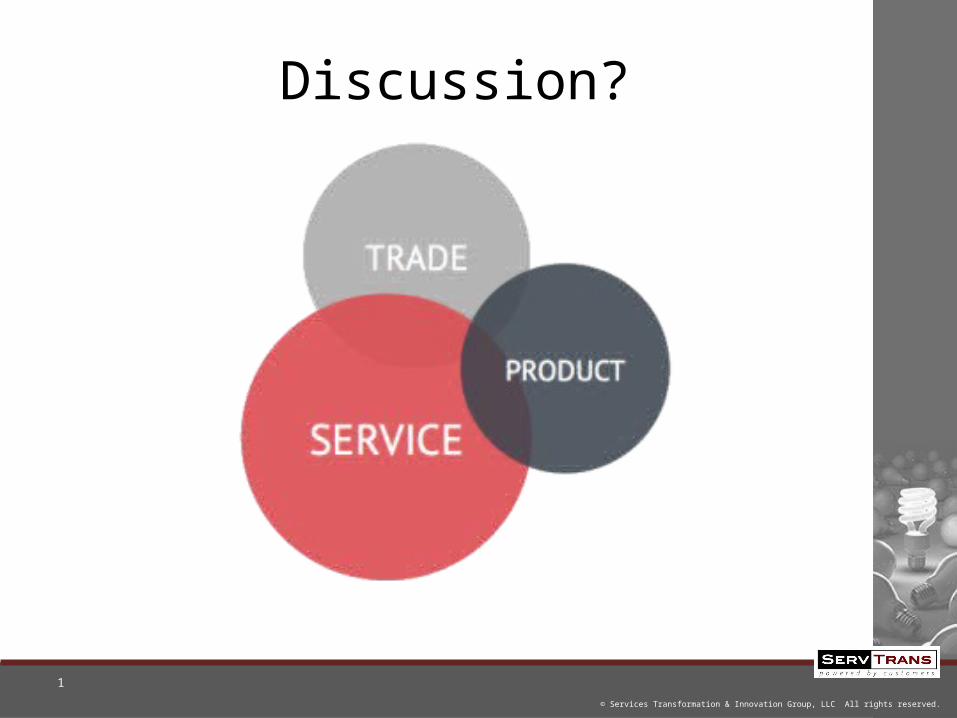
Discussion?

By country, the largest U.S. surpluses in services are with Canada, Japan, Ireland, Brazil, the United Kingdom, China and Mexico. The U.S. services surplus with China has accelerated rapidly since 2007, from $2.4 billion to $10.4 billion in 2010, because of sharp gains in exports and relatively flat imports, according to ESA data.
Exports support more than 10 million American jobs, and those whose jobs depend on trade earn 13 to 18 percent more than the national average. As a result of administration policies and the global economic rebound, exports grew 17 percent in 2010 compared to 2009 – the largest year-to-year percent change in more than 20 years.
Private services are defined as non-tangible items of value that are either consumed when purchased or at a later date by their terms of sale, such as school tuition or an airplane ticket. These are distinct from tangible items, or “goods,” such as oranges or motor vehicles.
U.S. services driving overall exports growth, topping half a trillion dollarsThe U.S. Department of Commerce’s Economics and Statistics Administration (ESA) released a report showing U.S. trade in private services totaled $526.6 billion in 2010, representing a trade surplus that is growing, rising from $66.7 billion in 2003 to $168 billion in 2010.
22

U.S. Surplus with China is Growing Rapidly Figure 4: Trade Balance in Private Services Billions of dollars 1992 1995 1998 2001 2004 2007 2010 -40 -200 20 40 60 80 100 -40 -20 020 40 60 80 100 Royalties and license fees Travel and fares Freight and port use Other private services Source: Bureau of Economic Analysis. Figure 5: Largest U.S. Surpluses and Deficits by Country in 2010* Private services trade, billions of dollars Canada Japan Ireland (2009) Brazil United Kingdom China Mexico India Bermuda (2009) -30 -20 -10 0 10 20 30 Source: Bureau of Economic Analysis. * 2009 data is used if 2010 is not available.
23
24