RESEARCHARTICLE …2846/document.pdf(p
21
RESEARCH ARTICLE Asthma, Airway Symptoms and Rhinitis in Office Workers in Malaysia: Associations with House Dust Mite (HDM) Allergy, Cat Allergy and Levels of House Dust Mite Allergens in Office Dust Fang Lee Lim 1 , Zailina Hashim 1 *, Leslie Thian Lung Than 2 , Salmiah Md Said 3 , Jamal Hisham Hashim 4,5 , Dan Norbäck 6 1 Department of Environmental and Occupational Health, Faculty of Medicine and Health Sciences, Universiti Putra Malaysia, UPM, Serdang, Selangor, Malaysia, 2 Department of Medical Microbiology and Parasitology, Faculty of Medicine and Health Sciences, Universiti Putra Malaysia, UPM, Serdang, Selangor, Malaysia, 3 Department of Community Health, Faculty of Medicine and Health Sciences, Universiti Putra Malaysia, UPM, Serdang, Selangor, Malaysia, 4 United Nations University-International Institute for Global Health (UNU-IIGH), Kuala Lumpur, Malaysia, 5 Department of Community Health, National University of Malaysia, Kuala Lumpur, Malaysia, 6 Uppsala University, Department of Medical Science, Occupational and Environmental Medicine, University Hospital, Uppsala, Sweden * [email protected] Abstract A prevalence study was conducted among office workers in Malaysia (N= 695). The aim of this study was to examine associations between asthma, airway symptoms, rhinitis and house dust mites (HDM) and cat allergy and HDM levels in office dust. Medical data was collected by a questionnaire. Skin prick tests were performed for HDM allergens (Dermato- phagoides pteronyssinus, Dermatophagoides farinae) and cat allergen Felis domesticus. Indoor temperature and relative air humidity (RH) were measured in the offices and vacu- umed dust samples were analyzed for HDM allergens. The prevalence of D. pteronyssinus, D. farinae and cat allergy were 50.3%, 49.0% and 25.5% respectively. Totally 9.6% had doctor-diagnosed asthma, 15.5% had current wheeze and 53.0% had current rhinitis. The Der p 1 (from D. pteronyssinus) and Der f 1 (from D. farinae) allergens levels in dust were 556 ng/g and 658 ng/g respectively. Statistical analysis was conducted by multilevel logistic regression, adjusting for age, gender, current smoking, HDM or cat allergy, home damp- ness and recent indoor painting at home. Office workers with HDM allergy had more wheeze (p= 0.035), any airway symptoms (p= 0.032), doctor-diagnosed asthma (p= 0.005), current asthma (p= 0.007), current rhinitis (p= 0.021) and rhinoconjuctivitis (p< 0.001). Cat allergy was associated with wheeze (p= 0.021), wheeze when not having a cold (p= 0.033), any airway symptoms (p= 0.034), doctor-diagnosed asthma (p= 0.010), current asthma (p= 0.020) and nasal allergy medication (p= 0.042). Der f 1 level in dust was associated with daytime breathlessness (p= 0.033) especially among those with HDM allergy. Der f 1 levels were correlated with indoor temperature (p< 0.001) and inversely correlated with RH PLOS ONE | DOI:10.1371/journal.pone.0124905 April 29, 2015 1 / 21 OPEN ACCESS Citation: Lim FL, Hashim Z, Than LTL, Md Said S, Hisham Hashim J, Norbäck D (2015) Asthma, Airway Symptoms and Rhinitis in Office Workers in Malaysia: Associations with House Dust Mite (HDM) Allergy, Cat Allergy and Levels of House Dust Mite Allergens in Office Dust. PLoS ONE 10(4): e0124905. doi:10.1371/journal.pone.0124905 Academic Editor: Maosheng Yao, Peking University, CHINA Received: November 16, 2014 Accepted: March 8, 2015 Published: April 29, 2015 Copyright: © 2015 Lim et al. This is an open access article distributed under the terms of the Creative Commons Attribution License, which permits unrestricted use, distribution, and reproduction in any medium, provided the original author and source are credited. Data Availability Statement: All relevant data are within the paper. Funding: This study was supported by grants from the Universiti Putra Malaysia (UPM) for Research University Grant Scheme (RUGS, grant number: 9199671) and the Swedish Research Council (VR) (grant number: 2013-6762). The funders supported the project financially. The funders had no role in study design, data collection and analysis, decision to publish, or preparation of manuscript.
Transcript of RESEARCHARTICLE …2846/document.pdf(p

RESEARCH ARTICLE
Asthma, Airway Symptoms and Rhinitis inOffice Workers in Malaysia: Associations withHouse Dust Mite (HDM) Allergy, Cat Allergyand Levels of House Dust Mite Allergens inOffice DustFang Lee Lim1, Zailina Hashim1*, Leslie Thian Lung Than2, Salmiah Md Said3,Jamal Hisham Hashim4,5, Dan Norbäck6
1 Department of Environmental and Occupational Health, Faculty of Medicine and Health Sciences,Universiti Putra Malaysia, UPM, Serdang, Selangor, Malaysia, 2 Department of Medical Microbiology andParasitology, Faculty of Medicine and Health Sciences, Universiti Putra Malaysia, UPM, Serdang, Selangor,Malaysia, 3 Department of Community Health, Faculty of Medicine and Health Sciences, Universiti PutraMalaysia, UPM, Serdang, Selangor, Malaysia, 4 United Nations University-International Institute for GlobalHealth (UNU-IIGH), Kuala Lumpur, Malaysia, 5 Department of Community Health, National University ofMalaysia, Kuala Lumpur, Malaysia, 6 Uppsala University, Department of Medical Science, Occupational andEnvironmental Medicine, University Hospital, Uppsala, Sweden
AbstractA prevalence study was conducted among office workers in Malaysia (N= 695). The aim of
this study was to examine associations between asthma, airway symptoms, rhinitis and
house dust mites (HDM) and cat allergy and HDM levels in office dust. Medical data was
collected by a questionnaire. Skin prick tests were performed for HDM allergens (Dermato-phagoides pteronyssinus, Dermatophagoides farinae) and cat allergen Felis domesticus.Indoor temperature and relative air humidity (RH) were measured in the offices and vacu-
umed dust samples were analyzed for HDM allergens. The prevalence of D. pteronyssinus,D. farinae and cat allergy were 50.3%, 49.0% and 25.5% respectively. Totally 9.6% had
doctor-diagnosed asthma, 15.5% had current wheeze and 53.0% had current rhinitis. The
Der p 1 (from D. pteronyssinus) and Der f 1 (from D. farinae) allergens levels in dust were
556 ng/g and 658 ng/g respectively. Statistical analysis was conducted by multilevel logistic
regression, adjusting for age, gender, current smoking, HDM or cat allergy, home damp-
ness and recent indoor painting at home. Office workers with HDM allergy had more
wheeze (p= 0.035), any airway symptoms (p= 0.032), doctor-diagnosed asthma (p= 0.005),
current asthma (p= 0.007), current rhinitis (p= 0.021) and rhinoconjuctivitis (p< 0.001). Cat
allergy was associated with wheeze (p= 0.021), wheeze when not having a cold (p= 0.033),
any airway symptoms (p= 0.034), doctor-diagnosed asthma (p= 0.010), current asthma
(p= 0.020) and nasal allergy medication (p= 0.042). Der f 1 level in dust was associated with
daytime breathlessness (p= 0.033) especially among those with HDM allergy. Der f 1 levels
were correlated with indoor temperature (p< 0.001) and inversely correlated with RH
PLOSONE | DOI:10.1371/journal.pone.0124905 April 29, 2015 1 / 21
OPEN ACCESS
Citation: Lim FL, Hashim Z, Than LTL, Md Said S,Hisham Hashim J, Norbäck D (2015) Asthma, AirwaySymptoms and Rhinitis in Office Workers in Malaysia:Associations with House Dust Mite (HDM) Allergy,Cat Allergy and Levels of House Dust Mite Allergensin Office Dust. PLoS ONE 10(4): e0124905.doi:10.1371/journal.pone.0124905
Academic Editor: Maosheng Yao, Peking University,CHINA
Received: November 16, 2014
Accepted: March 8, 2015
Published: April 29, 2015
Copyright: © 2015 Lim et al. This is an open accessarticle distributed under the terms of the CreativeCommons Attribution License, which permitsunrestricted use, distribution, and reproduction in anymedium, provided the original author and source arecredited.
Data Availability Statement: All relevant data arewithin the paper.
Funding: This study was supported by grants fromthe Universiti Putra Malaysia (UPM) for ResearchUniversity Grant Scheme (RUGS, grant number:9199671) and the Swedish Research Council (VR)(grant number: 2013-6762). The funders supportedthe project financially. The funders had no role instudy design, data collection and analysis, decision topublish, or preparation of manuscript.
(p< 0.001). In conclusion, HDM and cat allergies were common and independently associat-
ed with asthma, airway symptoms and rhinitis. Der f 1 allergen can be a risk factor for
daytime breathlessness.
IntroductionMalaysia is a tropical country with warm and humid climate throughout the year. Continuouswarm and humid environment will facilitate the growth and proliferation of both house dustmites (HDM) and storage mites. The mites have the ability to build up large populations asthey can complete at least 12 life cycles per year [1]. One Malaysian study showed that Blomiatropicalis (8,934 mites/g), Dermatophagoides pteronyssinus (4,553 mites/g) andMalayoglyphusintermedius (1,020 mites/g) were three most common in home dust [2], while in Malaysianschools, levels of HDM (Der p 1 and Der f 1) and Blomia tropicalis (Blo t) allergens in schooldust were low [3]. Clinical studies in patients demonstrated that allergy to HDM and cat aller-gens were the most common allergies in Malaysia [4–7]. However, we found no previous popu-lation based epidemiological study fromMalaysia investigating associations between HDMallergens in office dust and the prevalence of asthma, airway symptoms and rhinitis inoffice workers.
Asthma and rhinitis are common respiratory diseases which are increasing globally [8,9], es-pecially among the younger population in Asian cities [8]. The prevalence of rhinitis can be upto 45% in children and adolescents in low and middle-income countries in Asia [10]. However,there is a large variation of asthma among adults between Asian countries, the prevalence rang-ing from 0.7% to 11.9% [11]. One Asia-Pacific study reported that the average prevalence ofallergic rhinitis was 8.7% among both children and adults [12]. The prevalence of doctor-diagnosed allergic rhinitis among children and adults ranged from 2.5% in Philipines to 12.3%in Vietnam [12]. These large variation indicates that environmental factors could play a role inthe occurrence of asthma and rhinitis in Asia.
Sensitization to HDM and cat allergens may cause asthma [13–17] and rhinitis [18,19].HDM allergens are a major indoor risk factor for asthma [20] triggering respiratory symptomsin many Asia countries [4,6,21–23]. Most epidemiology studies on HDM and cat allergens arefrom home environments [24,25] and few studies are available on allergens levels in office dust[26,27]. Some office environment studies from temperate climate have found low levels ofHDM in office dust [28,29]. One study from the US reported a positive association betweenlevels of HDM allergens in office dust and respiratory symptoms in office workers [30].
In a post-industrial society, a large proportion of the working population have office work.Since the 1980s there has been a focus on health effects due to the indoor environment in of-fices in the USA [31,32] and Europe [33]. However, there are few studies on associations be-tween indoor environment in offices and asthma or rhinitis [34]. Respiratory illness amongoffice workers has economical implications since they can increase sickness absentism and lostwork time as well as decrease of quality of life [35]. Nevertheless, we found few epidemiologicalstudies on associations between the office environment and respiratory health among officeworkers in tropical countries [36–38].
Carpets in offices can act as a reservoir of particle pollutants, including mites and mite aller-gens [39]. One study reported that offices with wall-to-wall carpet floors may contain HDM al-lergen in the carpets [26]. Offices with carpets have reported to have an excess of respiratorysymptoms among the office workers [40–42] as well as impaired work performance and
Respiratory Symptoms amongMalaysian Office Workers
PLOS ONE | DOI:10.1371/journal.pone.0124905 April 29, 2015 2 / 21
Competing Interests: The authors have declaredthat no competing interests exist.

productivity [43]. These studies indicate that carpeting in offices can cause impaired respirato-ry health in office workers. However, no previous office study was found on respiratory healthand HDM allergen levels in relation to carpeting in tropical countries.
The warm and humid conditions in tropics could provide suitable growth conditions forhouse dust mites in the office environment, especially if there are carpets. Thus, this studyhas investigated associations between selected office indoor environmental exposures; per-sonal factors such as age, gender, current tobacco smoke status, HDM and cat allergy; andthe respiratory health of office workers. The first aim was to measure the prevalence of sensi-tization to HDM and cat allergens, asthma, airway symptoms and rhinitis among officeworkers in an academic institution in Malaysia. The second aim was to study associations be-tween personal factors and the health variables mentioned above. The third aim was to deter-mine the HDM allergens levels in settled office dust, indoor temperature, relative airhumidity (RH) and carbon dioxide (CO2) levels in the offices and the associations betweenwall-to-wall carpets and HDM allergens dust concentrations with the health variablesmentioned above.
Materials and Methods
Study PopulationThe administrative office of the institution (UPM) provided a list of 61 offices in total. Admin-istrative offices equipped with air-conditioning mechanical ventilation system with at least 15office workers in one office were selected. Among the 61 offices listed, 50 fulfilled this inclusioncriteria. However, four offices were excluded because the work tasks were different from ordi-nary office work. A letter was sent to the management of the 46 offices for study approval and40 offices granted written or verbal permission. Thus, our study included 40 offices.
There were totally 2192 workers employed in the 40 offices selected and 701 workers agreedto participate (32.0%). All administrative workers aged 18 to 60 years were invited throughemails or announcements by office representatives a few days before the data collection day.On the data collection day, the workers were invited again through face-to-face invitations. Sixworkers were excluded due to pregnancy thereby leaving 695 participants. A self-administeredquestionnaire was distributed to the respondents and collected within two weeks. The respon-dents had no information on the environmental data being collected from the offices when an-swering the questionnaires. The filled in questionnaires were reviewed and respondents wereconsulted if there were any uncertainty in the information provided. Among the 695 partici-pants, two were excluded from skin prick test due to recent severe asthma leaving 463 workers(66.7%) participating in the skin prick test.
Potential selection bias was investigated by interviewing non-participants at the end ofthe study. One to two randomly selected workers from each office, who did not participatein the questionnaire study, answered four yes/no health questions (ever doctor-diagnosedasthma, ever allergic rhinitis, rhinitis in the past 12 months and ever eczema) in a face-to-face interview. These interview questions were exactly the same questions as in thequestionnaire study.
QuestionnaireThe questionnaire was adapted from the European Community Respiratory Health Survey(ECRHS) [44] and the International Study of Asthma and Allergies in Childhood (ISAAC)[45]. It contained questions on the history of asthma, as well as airway and rhinitis symptoms.Respiratory symptoms in this study were defined as asthma, airway or rhinitis symptoms. Thequestionnaire consisted of four sections. The sections are described bellows:
Respiratory Symptoms amongMalaysian Office Workers
PLOS ONE | DOI:10.1371/journal.pone.0124905 April 29, 2015 3 / 21
Questions on personal factors and the home environment.
1) Gender (male/female);
2) Age;
3) Ethnicity (Malay/Chinese/Indian/Others);
4) What is your tobacco smoking status? (Never smoked/former smoker/current smoker);
5) Are there any pets at your dwelling? (yes/no);
(i) If “Yes”, what type of pet? (dog/cat/bird/fish/others);
6) Have the interior of your dwelling been painted during the last 12 months? (yes/no);
7) Have any of the following been identified in your dwelling during the last 12 months?
(i) Water leakage or water damage indoors in walls, floor or ceiling (yes/no);
(ii) Bubbles or yellow discoloration on plastic floor covering or black discoloration on par-quet floor (yes/no);
(iii) Visible mould growth on indoors on walls, floor or ceilings (yes/no);
(iv) The smell of mould in one or more rooms (not the basement) (yes/no);
Questions on airway symptoms.
8) Have you had wheezing or whistling in the chest at any time in the last 12 months? (yes/no);
9) Have you been at all breathless when the wheezing noise was present? (yes/no);
10) Have you had this wheezing or whistling when you did not have a cold? (yes/no);
11) Have you had an attack of shortness of breath that came on during the day when being atrest at any time in the last 12 months? (yes/no);
12) Have you had an attack of shortness of breath that came on following strenuous activity atany time in the last 12 months? (yes/no);
13) Have you ever been woken by an attack of shortness of breath in the last 12 months? (yes/no);
Questions on asthma.
14) Have you ever had asthma? (yes/no);
15) Was the asthma diagnosed by a physician? (yes/no);
16) Have you had any attack of asthma in the last 12 months? (yes/no);
17) Are you currently using any asthma medication? (spray, inhalation powders, tablets) (yes/no);
Questions on rhinitis.
18) Do you have any nasal allergies, including hay fever? (yes/no);
19) Have you ever had a problem with sneezing, or a runny or a blocked nose when you didnot have a cold or the flu in the last 12 months? (yes/no);
20) Has this nose problem been accompanied by itchy or watery eyes? (yes/no);
Respiratory Symptoms amongMalaysian Office Workers
PLOS ONE | DOI:10.1371/journal.pone.0124905 April 29, 2015 4 / 21

21) Have you used any steroid nasal sprays, antihistamines pills, capsules or tablets for treat-ment of your nasal disorder in the last 12 months? (yes/no);
Skin prick testThe office workers were informed on the procedure for the skin prick test one week before thetesting. In addition, they were advised to avoid using any antihistamine drug until they hadcompleted the test. Pregnant women (n = 6), subjects on beta-blocker medication, with severedermatographism or persistent severe or unstable asthma (n = 2) were excluded from testing toavoid risk of anaphylaxis or difficulties in interpretation of test result [46].
The skin prick tests were carried out by experienced hospital nurses. Workers had to share in-formation about their recent medication intake before the skin prick test was performed. Skinprick test kits (ALK Abello SA, Madrid, Spain) forD. pteronyssinus, D. farinae and Felis domesti-cus were used. The concentration ofD. pteronyssinus and D. farinae allergen extracts were 30HEP (histamine equivalent prick) while Felis domesticus allergen extract was 10 HEP. Normal sa-line solution and histamine were used as negative and positive controls. After 20 minutes, thewheal diameter was measured by adding the largest diameter and its perpendicular diameter anddividing the sum with two [22]. The mean wheal diameter for each control and allergen were cal-culated. The test result was considered as positive if the mean wheal diameter was� 3 mm.
Building inspection and climate measurementDue to time constrains, 25 offices out of the 40 were randomly selected for building inspection, aswell as indoor and outdoor climate measurements. Then 15 offices (60%) which had 15 to 55 of-fice workers were selected from the 25. Subsequently 10 offices (66%) with more than 55 officeworkers were then selected from 15 offices. In each of these 25 offices, one to five administrativerooms were included in the environmental measurements, depending on the size of the office. Allrooms involved in dust sample collection were inspected and the indoor climate was measured.
A building inspection was carried out before indoor climate measurements and dust sam-plings were obtained. Signs of dampness such as water leakage, indoor mould growth, odor inthe offices, information on the building materials, floor furnish, types of ventilation systems andpresence of indoor plants in the office room were recorded. Questions were asked on the fre-quency of office cleaning and maintenance of the mechanical ventilation systems. A Q-trak in-door air quality monitor 7565 (TSI Incorporated, St. Paul, MN, USA) was used to measureindoor temperature (°C), RH (%), CO2 concentration (ppm) and carbon monoxide (CO) (ppm)during normal activities in the center of room. The Q-trak monitor was placed at height 1–1.5m above the floor level and around 1 m from the workers for 50–70 minutes by logging averagevalues per minute [47]. There was one Q-trak measurement for each office room during thedust sample collection, and two large offices had two Q-trak measurements. The outdoor cli-mate was measured by the Q-trak instrument outside the office building on the same day.
Dust collectionIn each of the 25 offices, dust was collected from one to five administrative rooms (2–10 dustsamples), depending on the size of the office. Dust samples were collected from the main admin-istrative rooms of each office. Each room was divided into two parts (entrance side half and win-dow side half) and a dust sample was collected from each part [48]. Settled dust on floor, tablesand chairs was collected by using a 1800W electric power vacuum cleaner (Model PVC-31A,Pensonic, Malaysia) equipped with a special dust collector fitted with a Millipore filter (pore size
Respiratory Symptoms amongMalaysian Office Workers
PLOS ONE | DOI:10.1371/journal.pone.0124905 April 29, 2015 5 / 21

6 μm) (ALK Abello, Copenhagen, Denmark). The dust samples were collected by vacuum clean-ing for eight minutes per sample, four minutes vacuuming of floor and four minutes vacuumingof tables/ chairs. The settled dust samples were sieved (particle diameter< 400 μm) to obtainfine dust [47]. The sieved dust samples was weighted and stored at -20°C until extraction [48].
Extraction and analysis of dust mites’ allergenFor extraction of house dust mite allergens, 2 ml of phosphate-buffer saline with Tween(PBS-T) was added into each fine dust sample (100 ± 5 mg) in a centrifuge tube. The centrifugetubes were shaken for two hours at room temperature and centrifuged for 10 minutes at 3000rpm [49]. Then, the supernatants were transferred into Eppendorf tube and stored at -20°Cuntil analysis of dust mites. Two-sites monoclonal antibody (MAB) sandwich ELISAs (IndoorBiotechnologies, Inc., Charlottesville, VA) were used to analyze for Der p 1 and Der f 1. Analy-sis were performed according to the manufacturer’s protocols with the exception that Strepta-vidin-horseradish peroxidase was obtained from Nacalai Tesque, Inc., Kyoto, Japan. All unitswere expressed as ng/g [50]. The detection limit for HDM allergens was 10 ng/g.
Statistical analysisAll statistical tests were performed by the Statistical Package for the Social Sciences (SPSS) 21.0or the STATA statistical package 11.0 (for multi-level logistic regression). Initially, associationsbetween personal factors (age, gender, smoking status, HDM allergy and cat allergy), asthmaand respiratory symptoms were analyzed by Chi-square test. The symptom differences betweenparticipants and non-participant groups in the questionnaire study, skin prick test and envi-ronmental sampling study were also examined by Chi-square test.
The Der p 1 and Der f 1 level from dust samples were not normally distributed, thus medi-an, interquartile range, minimum and maximum were reported and non-parametric statisticaltests were used. Kendall’s tau beta test was applied to study the correlations between Der p 1and Der f 1 levels in office dust; and environmental variables (indoor temperature, RH, CO2,CO and amount of sieved dust). MannWhitney-U test was applied to test the differences be-tween offices with and without carpeting, amount of dust and allergen level. Chi-square testwas used to study associations between floor carpeting and respiratory symptoms.
Finally, associations between risk factors and symptoms were studied by two-level multiple lo-gistic regression (individual level and office level) with each model including personal risk factorssuch as age, gender, smoking status, HDM and cat allergy. The associations between level of al-lergens in office dust samples and floor carpeting were analyzed with adjustment for age, gender,smoking status, HDM and cat allergy, any home dampness and indoor home painting in the last12 months. Stratified analysis (stratified for HDM allergy) was performed using the samemodels.Two-tailed tests and a 5% level of significance were applied in all statistical analysis.
Ethics StatementThe study was approved by the Ethics Committee for Research Involving Human Subjects inUniversiti Putra Malaysia (UPM). Written consents were obtained from all respondents afterthe briefing on the study objective and procedures. For data collection on the study location,permission was obtained from the authorities.
ResultA total of 695 workers participated in the study and 66.6% were females. The mean age was 34years (range 18–59 years), with a majority of Malay (97.8%), followed by Chinese (0.9%).
Respiratory Symptoms amongMalaysian Office Workers
PLOS ONE | DOI:10.1371/journal.pone.0124905 April 29, 2015 6 / 21

Overall, there were higher prevalence of current airway symptoms and asthma among femalesas compared to males (Table 1). Breathlessness during wheeze, daytime attack of breathlessnessat rest, any daytime breathlessness, doctor-diagnosed asthma, current asthma medication, cur-rent asthma attack and current asthma were significantly higher among females. However,there was no significant difference in airway, asthma and rhinitis symptoms between smokersand non-smokers. A total of 30.2% of the men and 0.4% of the women were current smokers(p< 0.001).
Table 1. Asthma and respiratory symptoms among office workers, stratified for gender and smoking (n = 695).
Respiratory symptoms Male(n = 232),n (%)
Female(n = 463),n (%)
OR 95% CI p-value Non-smoker(n = 619),n (%)
Smoker(n = 72),n (%)
OR 95% CI p-value
Total(n = 695),n (%)
Questionson currentairwaysymptoms
Wheeze or whistlingin the chest
29 (12.6) 78 (17.0) 1.42 0.90 – 2.25 0.148 97 (15.7) 10 (13.9) 0.87 0.43 – 1.75 0.863 107 (15.5)
Breathlessnessduring wheeze
14 (6.1) 56 (12.2) 2.15 1.17–3.95 0.011* 65 (10.5) 5 (6.9) 0.64 0.25 – 1.64 0.415 70 (10.1)
Wheezing orwhistling when didnot have cold
11 (4.8) 34 (7.4) 1.60 0.79 – 3.21 0.252 40 (6.5) 5 (6.9) 1.08 0.41 – 2.83 0.875 45 (6.5)
Daytime attack ofbreathlessness atrest
13 (5.7) 58 (12.6) 2.40 1.28 – 4.47 0.005** 67 (10.8) 4 (5.6) 0.49 0.17 – 1.37 0.165 71 (10.3)
Daytime attack ofbreathlessness afterstrenuous activity
25 (10.8) 79 (17.2) 1.72 1.07 – 2.78 0.032* 95 (15.3) 9 (12.5) 0.79 0.38 – 1.64 0.604 104 (15.1)
Any daytimebreathlessness
29 (12.5) 99 (21.4) 1.90 1.22 – 2.98 0.005** 118 (18.9) 10 (13.9) 0.69 0.34 – 1.39 0.339 128 (18.4)
Nocturnal attacks ofbreathlessness
18 (7.8) 56 (12.2) 1.64 0.94 – 2.87 0.090 67 (10.8) 7 (9.7) 0.89 0.39 – 2.01 1.000 74 (10.7)
At least one airwaysymptoms a
51 (22.0) 133 (28.7) 1.43 0.99 – 2.07 0.068 168 (27.0) 16 (22.2) 0.77 0.43 – 1.39 0.481 184 (26.5)
Questionson asthma
Ever asthma 22 (9.5) 63 (13.6) 1.50 0.90–2.51 0.140 80 (12.8) 5 (6.9) 0.51 0.20 – 1.30 0.184 85 (12.2)
Doctor-diagnosedasthma
13 (5.6) 54 (11.7) 2.22 1.19 – 4.17 0.010* 64 (10.3) 3 (4.2) 0.38 0.12 – 1.24 0.136 67 (9.6)
Current asthmamedication
11 (4.7) 45 (9.7) 2.16 1.10 – 4.27 0.026* 53 (8.5) 3 (4.2) 0.47 0.14 – 1.54 0.256 56 (8.1)
Current asthmaattacks
8 (3.4) 41 (8.9) 2.72 1.25 – 5.90 0.007** 46 (7.4) 3 (4.2) 0.55 0.17 – 1.80 0.464 49 (7.1)
Current asthmab 12 (5.2) 49 (10.6) 2.17 1.13 – 4.17 0.022* 58 (9.3) 3 (4.2) 0.42 0.13 – 1.39 0.187 61 (8.8)
Questionson rhinitis
Ever allergic rhinitis 56 (24.1) 98 (21.2) 0.84 0.58 – 1.23 0.384 137 (22.0) 17 (23.6) 1.10 0.62 – 1.95 0.765 154 (22.2)
Rhinitis in the last12 months
134 (57.8) 234 (50.5) 0.75 0.54 – 1.03 0.077 325 (52.2) 43 (59.7) 1.36 0.83 – 2.23 0.262 368 (53.0)
Rhinoconjuctivitis inthe last 12 months
76 (32.8) 162 (35.0) 1.11 0.79 – 1.54 0.611 212 (34.1) 26 (36.1) 1.09 0.66 – 1.82 0.793 238 (34.3)
Nasal allergiesmedication in thelast 12 months
30 (12.9) 55 (11.9) 0.91 0.56 – 1.46 0.713 73 (11.7) 12 (16.7) 1.51 0.77 – 2.93 0.252 85 (12.2)
aWheeze or whistling in the chest, daytime attacks of breathless at rest or at exercise, or nocturnal attacks of breathlessness during the last 12 months.bCurrent asthma medication or asthma attacks during the last 12 months.
*p<0.05
**p<0.01
doi:10.1371/journal.pone.0124905.t001
Respiratory Symptoms amongMalaysian Office Workers
PLOS ONE | DOI:10.1371/journal.pone.0124905 April 29, 2015 7 / 21
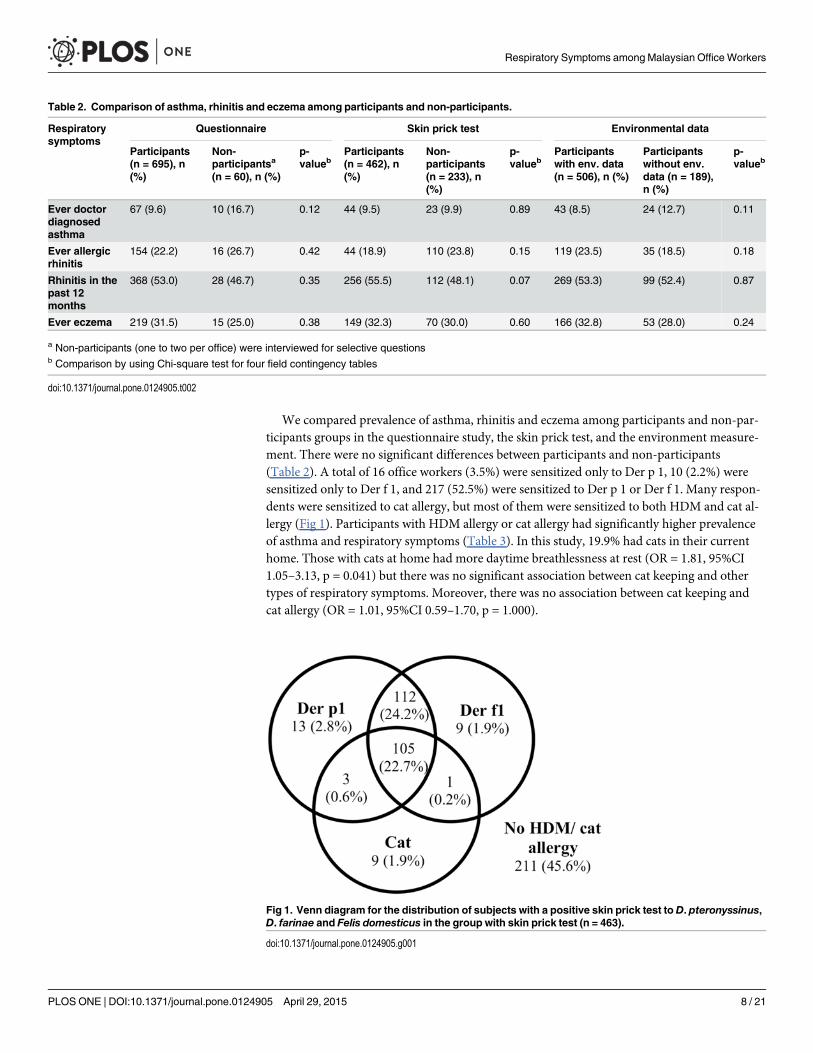
We compared prevalence of asthma, rhinitis and eczema among participants and non-par-ticipants groups in the questionnaire study, the skin prick test, and the environment measure-ment. There were no significant differences between participants and non-participants(Table 2). A total of 16 office workers (3.5%) were sensitized only to Der p 1, 10 (2.2%) weresensitized only to Der f 1, and 217 (52.5%) were sensitized to Der p 1 or Der f 1. Many respon-dents were sensitized to cat allergy, but most of them were sensitized to both HDM and cat al-lergy (Fig 1). Participants with HDM allergy or cat allergy had significantly higher prevalenceof asthma and respiratory symptoms (Table 3). In this study, 19.9% had cats in their currenthome. Those with cats at home had more daytime breathlessness at rest (OR = 1.81, 95%CI1.05–3.13, p = 0.041) but there was no significant association between cat keeping and othertypes of respiratory symptoms. Moreover, there was no association between cat keeping andcat allergy (OR = 1.01, 95%CI 0.59–1.70, p = 1.000).
Table 2. Comparison of asthma, rhinitis and eczema among participants and non-participants.
Respiratorysymptoms
Questionnaire Skin prick test Environmental data
Participants(n = 695), n(%)
Non-participantsa
(n = 60), n (%)
p-valueb
Participants(n = 462), n(%)
Non-participants(n = 233), n(%)
p-valueb
Participantswith env. data(n = 506), n (%)
Participantswithout env.data (n = 189),n (%)
p-valueb
Ever doctordiagnosedasthma
67 (9.6) 10 (16.7) 0.12 44 (9.5) 23 (9.9) 0.89 43 (8.5) 24 (12.7) 0.11
Ever allergicrhinitis
154 (22.2) 16 (26.7) 0.42 44 (18.9) 110 (23.8) 0.15 119 (23.5) 35 (18.5) 0.18
Rhinitis in thepast 12months
368 (53.0) 28 (46.7) 0.35 256 (55.5) 112 (48.1) 0.07 269 (53.3) 99 (52.4) 0.87
Ever eczema 219 (31.5) 15 (25.0) 0.38 149 (32.3) 70 (30.0) 0.60 166 (32.8) 53 (28.0) 0.24
a Non-participants (one to two per office) were interviewed for selective questionsb Comparison by using Chi-square test for four field contingency tables
doi:10.1371/journal.pone.0124905.t002
Fig 1. Venn diagram for the distribution of subjects with a positive skin prick test to D. pteronyssinus,D. farinae and Felis domesticus in the group with skin prick test (n = 463).
doi:10.1371/journal.pone.0124905.g001
Respiratory Symptoms amongMalaysian Office Workers
PLOS ONE | DOI:10.1371/journal.pone.0124905 April 29, 2015 8 / 21

Tab
le3.
Asthmaan
dresp
iratory
symptomsam
ongofficeworkerswithsk
inprick
test
(n=46
3),s
tratifiedforhouse
dust
mite(H
DM)a
ndca
talle
rgy.
Res
piratory
symptoms
NoHDM
allergy
(n=22
0),n
(%)
AnyHDM
allergy
(n=24
3),n
(%)
OR
95%
CI
p-value
Noca
tallergy
(n=34
5),n
(%)
Cat
Alle
rgy
(n=11
8),
n(%
)
OR
95%
CI
p-value
Total
(n=46
3),
n(%
)
Ques
tions
oncu
rren
tairw
aysy
mptoms
Whee
zeorwhistling
inthech
est
24(10.9)
54(22.6)
2.38
1.42
–4.01
0.00
1**
46(13.4)
32(27.8)
2.50
1.50
–4.17
0.00
1**
78(17.0)
Breathless
nes
sduringwhee
ze13
(5.9)
38(15.9)
3.01
1.56
–5.82
0.00
1**
29(8.4)
22(19.1)
2.57
1.41
–4.68
0.00
3**
51(11.1)
Whee
zingor
whistlingwhen
did
nothav
eco
ld
10(4.5)
24(10.0)
2.34
1.09
–5.02
0.03
1*18
(5.2)
16(13.9)
2.93
1.44
–5.95
0.00
4**
34(7.4)
Day
timeattack
of
breathless
nes
sat
rest
21(9.5)
33(13.7)
1.49
0.84
–2.69
0.19
335
(10.2)
19(16.2)
1.71
0.94
–3.13
0.09
554
(11.7)
Day
timeattack
of
breathless
nes
safter
strenuousac
tivity
26(11.8)
47(19.4)
1.80
1.07
–3.02
0.03
0*49
(14.2)
24(20.5)
1.56
0.91
–2.68
0.10
973
(15.8)
Anyday
time
breathless
nes
s34
(15.5)
56(23.0)
1.64
1.02
–2.63
0.04
6*60
(17.4)
30(25.4)
1.62
0.98
–2.67
0.06
090
(19.4)
Nocturnal
attack
sof
breathless
nes
s19
(8.7)
33(13.6)
1.66
0.92
–3.02
0.10
636
(10.5)
16(13.7)
1.36
0.72
–2.55
0.39
752
(11.3)
Atleas
toneairw
aysy
mptoms
a46
(20.9)
84(34.6)
2.00
1.31
–3.04
0.00
1**
82(23.8)
48(40.7)
2.20
1.41
–3.43
0.00
1**
130(28.1)
Ques
tions
onas
thma
Eve
ras
thma
12(5.5)
45(18.5)
3.94
2.02
–7.67
<0.00
1***
28(8.1)
29(24.6)
3.69
2.09
–6.52
<0.00
1***
57(12.3)
Doctor-diagnose
das
thma
8(3.6)
37(15.2)
4.76
2.17
–10
.47
<0.00
1***
21(6.1)
24(20.3)
3.94
2.10
–7.39
<0.00
1***
45(9.7)
Curren
tas
thma
med
ication
6(2.7)
24(9.9)
3.91
1.57
–9.75
0.00
2**
15(4.3)
19(16.1)
4.22
2.07
–8.62
<0.00
1***
34(7.3)
Curren
tas
thma
attack
s6(2.7)
24(9.9)
3.91
1.57
–9.75
0.00
2**
14(4.1)
16(13.6)
3.71
1.75
–7.86
0.00
1**
30(6.5)
Curren
tas
thma
b6(2.7)
31(12.8)
5.22
2.13
–12
.76
<0.00
1***
17(4.9)
20(16.9)
3.94
1.99
–7.81
<0.00
1***
37(8.0)
Ques
tions
onnas
alallergies
Eve
rallergic
rhinitis
27(12.3)
84(34.6)
3.78
2.33
–6.11
<0.00
1***
58(16.8)
53(44.9)
4.04
2.55
–6.39
<0.00
1***
111(24.0)
Rhinitis
inthepas
t12
months
102(46.4)
155(63.8)
2.04
1.40
–2.96
<0.00
1***
176(51.0)
81(68.6)
2.09
1.34
–3.25
0.00
1**
257(55.5)
Rhinoco
njuctivitisin
thepas
t12
months
51(23.2)
113(46.5)
2.88
1.93
–4.31
<0.00
1***
107(31.0)
57(48.7)
2.11
1.38
–3.24
0.00
1**
164(35.5)
Nas
alallergies
med
icationin
the
pas
t12
months
18(8.2)
44(18.1)
2.48
1.39
–4.44
0.00
2**
35(10.1)
27(22.9)
2.63
1.51
–4.57
0.00
1**
62(13.4)
aWhe
ezeor
whistlingin
thech
est,da
ytim
eattacksof
brea
thless
atrest
orat
exercise
,orno
cturna
latta
cksof
brea
thlessne
ssdu
ringthelast
12mon
ths.
bCurrent
asthmamed
icationor
asthmaattacksdu
ringthelast
12mon
th
*p<0.05
;
**p<
0.01
;
***p
<0.00
1
doi:10.1371/journal.pone.0124905.t003
Respiratory Symptoms amongMalaysian Office Workers
PLOS ONE | DOI:10.1371/journal.pone.0124905 April 29, 2015 9 / 21
All 35 office rooms in the 25 offices were in concrete buildings with mechanical ventilationsystem. Most of the rooms had split unit air conditioning systems, seven rooms had centralizedair conditioning systems and eight rooms had a combination of centralized and split unit airconditioning systems. Among these 35 office rooms, three had visible indoor mould growthand seven had signs of water leakage. In total, 15 office rooms had a wall-to-wall carpet, 17 hadtiles (stone materials), two had PVC (Polyvinyl chloride) plastic and one had a wooden floor.
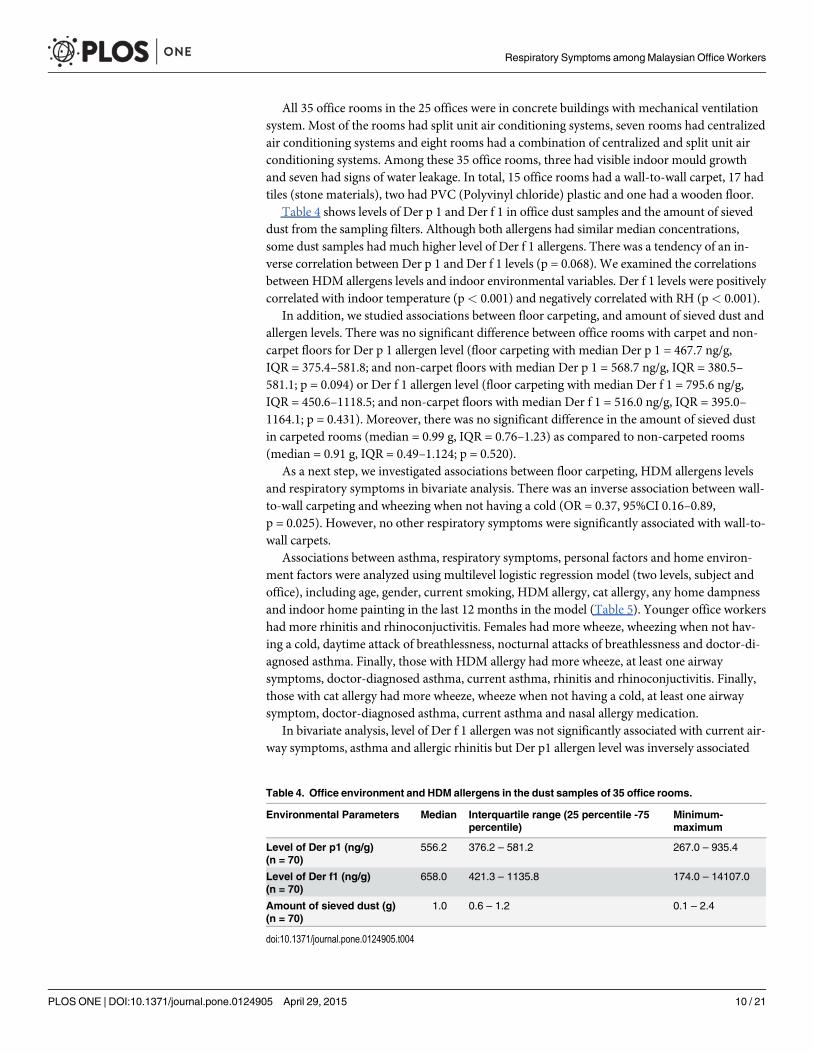
Table 4 shows levels of Der p 1 and Der f 1 in office dust samples and the amount of sieveddust from the sampling filters. Although both allergens had similar median concentrations,some dust samples had much higher level of Der f 1 allergens. There was a tendency of an in-verse correlation between Der p 1 and Der f 1 levels (p = 0.068). We examined the correlationsbetween HDM allergens levels and indoor environmental variables. Der f 1 levels were positivelycorrelated with indoor temperature (p< 0.001) and negatively correlated with RH (p< 0.001).
In addition, we studied associations between floor carpeting, and amount of sieved dust andallergen levels. There was no significant difference between office rooms with carpet and non-carpet floors for Der p 1 allergen level (floor carpeting with median Der p 1 = 467.7 ng/g,IQR = 375.4–581.8; and non-carpet floors with median Der p 1 = 568.7 ng/g, IQR = 380.5–581.1; p = 0.094) or Der f 1 allergen level (floor carpeting with median Der f 1 = 795.6 ng/g,IQR = 450.6–1118.5; and non-carpet floors with median Der f 1 = 516.0 ng/g, IQR = 395.0–1164.1; p = 0.431). Moreover, there was no significant difference in the amount of sieved dustin carpeted rooms (median = 0.99 g, IQR = 0.76–1.23) as compared to non-carpeted rooms(median = 0.91 g, IQR = 0.49–1.124; p = 0.520).
As a next step, we investigated associations between floor carpeting, HDM allergens levelsand respiratory symptoms in bivariate analysis. There was an inverse association between wall-to-wall carpeting and wheezing when not having a cold (OR = 0.37, 95%CI 0.16–0.89,p = 0.025). However, no other respiratory symptoms were significantly associated with wall-to-wall carpets.
Associations between asthma, respiratory symptoms, personal factors and home environ-ment factors were analyzed using multilevel logistic regression model (two levels, subject andoffice), including age, gender, current smoking, HDM allergy, cat allergy, any home dampnessand indoor home painting in the last 12 months in the model (Table 5). Younger office workershad more rhinitis and rhinoconjuctivitis. Females had more wheeze, wheezing when not hav-ing a cold, daytime attack of breathlessness, nocturnal attacks of breathlessness and doctor-di-agnosed asthma. Finally, those with HDM allergy had more wheeze, at least one airwaysymptoms, doctor-diagnosed asthma, current asthma, rhinitis and rhinoconjuctivitis. Finally,those with cat allergy had more wheeze, wheeze when not having a cold, at least one airwaysymptom, doctor-diagnosed asthma, current asthma and nasal allergy medication.
In bivariate analysis, level of Der f 1 allergen was not significantly associated with current air-way symptoms, asthma and allergic rhinitis but Der p1 allergen level was inversely associated
Table 4. Office environment and HDM allergens in the dust samples of 35 office rooms.
Environmental Parameters Median Interquartile range (25 percentile -75percentile)
Minimum-maximum
Level of Der p1 (ng/g)(n = 70)
556.2 376.2 – 581.2 267.0 – 935.4
Level of Der f1 (ng/g)(n = 70)
658.0 421.3 – 1135.8 174.0 – 14107.0
Amount of sieved dust (g)(n = 70)
1.0 0.6 – 1.2 0.1 – 2.4
doi:10.1371/journal.pone.0124905.t004
Respiratory Symptoms amongMalaysian Office Workers
PLOS ONE | DOI:10.1371/journal.pone.0124905 April 29, 2015 10 / 21

Tab
le5.
Ass
ociationsbetwee
nas
thma,
resp
iratory
symptoms,
perso
nal
factors
andhomeen
vironmen
tfac
tors
amongofficeworkers(n
=46
1)[O
R(95%
CI)].
Variables
Whee
zeor
whistlingin
thech
est
Whee
zingor
whistlingwhen
did
nothav
eco
ld
Anyday
time
breathless
nes
sNocturnal
attack
sofbreathless
nes
sAtleas
tone
airw
aysy
mptomsa
Doctor-
diagnose
das
thma
Curren
tas
thmab
Rhinitis
inthepas
t12
months
Rhino-
conjuctivitis
Nas
alallergies
med
icationin
the
pas
t12
months
Agec
1.07
0.94
0.81
0.79
0.88
0.95
1.06
0.72
0.69
0.92
(0.81–
1.40
)(0.62–
1.41
)(0.61–
1.07
)(0.56–
1.12
)(0.69–
1.11
)(0.66–
1.37
)(0.73–
1.55
)(0.`58
–0.88
)**
(0.54–
0.87
)**(0.67–
1.27
)
Gen
der
1.88
3.15
2.33
2.98
1.60
2.41
2.08
1.03
1.38
1.23
(1.00–
3.55
)*(1.13–
8.81
)*(1.26–
4.33
)*(1.27–
7.01
)*(0.96–
2.66
)(1.07–
5.40
)*(0.88–
4.51
)(0.65–
1.63
)(0.85–
2.26
)(0.62–
2.43
)
Curren
tSmoking
1.25
2.30
1.27
2.19
1.08
0.88
1.00
1.27
1.28
1.55
(0.49–
3.50
)(0.57–
9.23
)(0.50–
3.24
)(0.69–
6.94
)(0.50–
2.35
)(0.22–
3.49
)(0.25–
4.03
)(0.63–
2.53
)(0.63–
2.61
)(0.60–
3.97
)
HDM
allergy
1.91
1.69
1.63
1.77
1.70
3.54
3.84
1.66
2.75
1.97
(1.05–
3.50
)*(0.69–
4.15
)(0.94–
2.83
)(0.90–
3.50
)(1.05–
2.76
)*(1.47–
8.52
)**
(1.43–
10.30)**
(1.08–
2.56
)*(1.73–
4.37
)***
(0.99–
3.91
)
Cat
allergy
2.06
2.59
1.36
1.08
1.74
2.55
2.49
1.52
1.25
1.97
(1.12–
3.79
)*(1.08–
6.22
)*(0.76–
2.43
)(0.53–
2.21
)(1.04–
2.90
)*(1.25–
5.22
)*(1.16–
5.38
)*(0.92–
2.53
)(0.76–
2.06
)(1.02–
3.79
)*
*p-value
<0.05
**p-va
lue<
0.01
***p
-value
<0.00
1aWhe
ezeor
whistlingin
thech
est,da
ytim
eattacksof
brea
thless
atrest
orat
exercise
,orno
cturna
latta
cksof
brea
thlessne
ssdu
ringthelast
12mon
ths.
bCurrent
asthmamed
icationor
asthmaattacksdu
ringthelast
12mon
thc O
Rca
lculated
for10
year
increa
sein
age
Eac
hmutua
ladjus
tmen
tmod
elwas
analyzed
bytwo-leve
llog
istic
regres
sion
keep
ingag
e,ge
nder,c
urrent
smok
ingstatus
,HDM
allergy,
cata
llergy,
anyho
meda
mpn
ess,
indo
or
homepa
intin
gin
thelast
12mon
thsin
themod
els.
doi:10.1371/journal.pone.0124905.t005
Respiratory Symptoms amongMalaysian Office Workers
PLOS ONE | DOI:10.1371/journal.pone.0124905 April 29, 2015 11 / 21
with wheeze (p = 0.025) and at least one airway symptom (p = 0.014). We applied multilevel lo-gistic regression analysis (two levels, subject and office), to analyze associations between levelsof Der p 1, Der f 1, office floor carpeting and the 10 asthma and respiratory symptoms, adjustingfor age, gender, current smoking status, HDM allergy, cat allergy, any home dampness and in-door home painting in the last 12 months (Table 6). Level of Der p 1 was negatively associatedwith wheeze and at least one airway symptoms. In contrast, level of Der f 1 was positively associ-ated with any daytime breathlessness. We also analyzed the significant associations stratifyingfor HDM allergy. The negative association between wheeze and Der p 1 level was strongeramong those with no HDM allergy (OR = 0.61, 95%CI 0.35–1.06, p = 0.082) as compared tothose with HDM allergy (OR = 0.74, 95%CI 0.52–1.07, p = 0.110). The inverse association be-tween at least one airway symptoms and the Der p 1 level was significant among those withHDM allergy (OR = 0.73, 95%CI 0.54–1.00, p = 0.054), but not among those without HDM al-lergy (OR = 0.71, 95%CI 0.47–1.09, p = 0.117). Finally, the positive association between any day-time breathlessness and the Der f 1 level was significant among those with HDM allergy(OR = 1.16, 95%CI 1.01–1.32, p = 0.033) but not among those without HDM allergy(OR = 1.03, 95%CI 0.79–1.35, p = 0.809).
DiscussionHDM and cat allergies were very common among the office workers in this study and these al-lergies were independently associated with asthma, respiratory symptoms and rhinitis. Themajority of those with HDM allergy were sensitized to both Der p 1 and Der f 1. Der f 1 level inoffice dust was correlated with indoor temperature but inversely correlated with indoor relativeair humidity and there was a positive association between Der f 1 levels in office dust and day-time breathlessness, especially in HDM sensitized subjects. One limitation of this study is thatwe did not include other allergens, such as cockroach and Blomia tropicalis (storage mites) inour skin prick test. Thus, we might underestimate the true prevalence of Ig E-mediated allergyamong the office workers.
We invited all offices within a major academic institution in Klang Valley, Malaysia. The of-fice rooms involved in environmental data sampling were randomly selected from the officelist. Thus, bias due to selection of buildings or rooms is less likely. Since the participation ratewas relatively low in this study, we collected data on respiratory health among a sub-sample ofnon-participants by conducting a short face-to-face interview using questions from the studyquestionnaire. We found no significant difference in respiratory health between respondentsand non-respondents in the questionnaire study, in the allergy testing and in theenvironmental measurements.
Information bias can influence epidemiological studies. In this study, the respondents didnot have any information on the results of environmental measurement or the clinical testswhen they answered the questionnaire. The questionnaire was answered before the clinical in-vestigation and the environmental measurements. Therefore, information bias is less likely. En-vironmental sampling was conducted within two weeks from the day when respondentsanswered the questionnaire and all the dust samples were analyzed after the questionnaire datacollection was completed. The same calibrated instrument was used all measurements. Dustsamples were analyzed in an arbitrary sequence at the laboratory without any knowledge aboutthe health status of respondents or environmental measurements. All dust samples were ana-lyzed by the same person using the same laboratory equipment.
The data was analyzed by both bivariate and multivariate statistical analysis, mostly withsimilar results. Thus, we believe that our conclusions were not seriously influenced by selec-tion or information bias or choice of a particular statistical model. However, cross sectional
Respiratory Symptoms amongMalaysian Office Workers
PLOS ONE | DOI:10.1371/journal.pone.0124905 April 29, 2015 12 / 21

Tab
le6.
Ass
ociationsbetwee
nas
thma,
resp
iratory
symptoms,
leve
lsofD
erp1an
dDer
f1in
officedust
samplesan
dofficefloorca
rpetingam
ongofficeworkers(n
=37
1)[O
R(95%
CI)].
Variables
Whee
zeor
whistlingin
thech
est
Whee
zingor
whistling
when
did
not
hav
eco
ld
Anyday
time
breathless
nes
sNocturnal
attack
sof
breathless
nes
s
Atleas
tone
airw
aysy
mptomsa
Doctor-
diagnose
das
thma
Curren
tas
thmab
Rhinitis
inthepas
t12 months
Rhino-
conjuctivitis
Nas
alallergies
med
icationin
thepas
t12
months
Lev
elof
Der
p1c
0.69
0.84
0.81
0.85
0.72
0.89
0.70
0.97
0.90
1.11
(0.51–
0.93
)*
(0.53–
1.34
)(0.61–
1.08
)(0.60–
1.21
)(0.55–
0.92
)**
(0.59–
1.33
)(0.45–
1.10
)(0.76–
1.24
)(0.71–
1.15
)(0.75–
1.65
)
Lev
elof
Der
f1d
0.90
1.01
1.12
0.93
1.05
0.97
0.84
1.03
1.04
1.07
(0.75–
1.08
)(0.82–
1.25
)(1.00–
1.25
)*(0.77–
1.14
)(0.95–
1.17
)(0.80–
1.19
)(0.60–
1.19
)(0.92–
1.15
)(0.93–
1.15
)(0.92–
1.25
)
Floor
carpeting
0.96
0.55
0.60
1.03
0.98
1.00
0.91
1.07
0.85
0.81
(0.51–
1.82
)(0.19–
1.60
5)(0.32–
1.12
)(0.48–
2.18
)(0.58–
1.66
)(0.42–
2.37
)(0.35–
2.35
)(0.63–
1.81
)(0.50–
1.46
)(0.34–
1.93
)
*p-value
<0.05
**p-va
lue<
0.01
aWhe
ezeor
whistlingin
thech
est,da
ytim
eattacksof
brea
thless
atrest
orat
exercise
,orno
cturna
latta
cksof
brea
thlessne
ssdu
ringthelast
12mon
ths.
bCurrent
asthmamed
icationor
asthmaattacksdu
ringthelast
12mon
thc O
Rca
lculated
for10
0ng
/gincrea
sein
leve
lofD
erp1allergen
dORca
lculated
for10
00ng
/gincrea
sein
leve
lofD
erf1
allergen
Eac
hmod
elwas
analyzed
bytwo-leve
llog
istic
regres
sion
andad
justingforag
e,ge
nder,c
urrent
smok
ingstatus
,HDM
allergy,
cata
llergy,
anyho
meda
mpn
essan
dindo
orho
me
paintin
gin
thelast
12mon
thsinthemod
els.
doi:10.1371/journal.pone.0124905.t006
Respiratory Symptoms amongMalaysian Office Workers
PLOS ONE | DOI:10.1371/journal.pone.0124905 April 29, 2015 13 / 21

study design limits the possibility to draw conclusions about causal relationships. The majori-ty of respondents were Malays, and the study was performed in one major academic institu-tion in the Klang Valley only. To our knowledge, our study is the first study of office workersin Malaysia using skin prick allergy testing. Further larger studies in different areas are neededto verify the high prevalence of respiratory symptoms and HDM and cat allergy among officeworkers in Malaysia.
The prevalence of doctor-diagnosed asthma (9.6%), current wheeze (15.5%) and currentrhinitis (53.0%) was high among the office workers. According to the world health survey [51],the prevalence of doctor-diagnosed adult asthma in Malaysia was 5.2%. In Singapore, 5.1% ofadults had doctor-diagnosed adult asthma [52] and in Thailand, the prevalence of doctor-diag-nosed asthma was 11.6% [53]. Song and colleagues has reviewed adult asthma in Asia andfound a large variation between countries. The prevalence of adult asthma ranged from 0.7% inrural areas outside Beijing (China) to 12.0% in Al Ain (United Arab Emirates) [11]. For theother respiratory symptoms, the prevalence of wheeze in the last 12 months among adults inMalaysia has been reported to be 7.55% [51] and the prevalence of allergic rhinitis in Malaysiahas been reported to be 7.1% [12]. The prevalence of adult allergic rhinitis in the Asia-Pacificregion ranges from 8.7%, with Australia on the top rank (13.2%) and followed by Vietnam(12.3%) and Taiwan (9.6%) [12]. The prevalence of respiratory symptoms in this study washigher than in many other studies from Asian countries, which may be due to the high preva-lence of HDM and cat allergies among office workers in this study. Previous population basedstudies have showed significant associations between HDM or cat sensitization with higherprevalence of asthma and respiratory symptoms [54,55]. Moreover, respondents with HDMsensitization reported higher prevalence of nasal symptoms compared to respondents with noHDM sensitization [56].
One important risk factor for asthma and airway symptoms in our study was female gender.This is in agreement with some previous population studies from western countries, but genderdifferences in respiratory health in Asia seem to be more unclear. One reason could be that inmany Asian countries, very few women are smokers while the prevalence of smoking is highamong men. However in our study, the gender differences remained significant even after ad-justing for smoking habits. A population study among adults in European Union countries re-ported that females have a higher incidence of asthma in adulthood [57]. A population basedcohort study found that the incidence of non-allergic asthma was higher in women than men[58]. All available studies in gender differences in population studies from Asia are prevalencestudies. One prevalence study from Ulaanbaatar, Mongolia, reported that women had slightlyhigher prevalence of doctor-diagnosed asthma, wheeze and allergic rhinitis [59]. In contrast, astudy among university students in Phitsanulok, Thailand, found a lower prevalence of wheezeand asthma among females as compared to men [60]. One study from the northern part ofVietnam reported that males had more asthma, but they found no gender differences for aller-gic rhinitis [61]. One nationwide population survey in Thailand did not find any gender differ-ences in respiratory symptoms [62].
In this study, the prevalence of cat allergy was high (25.4%) and 19.9% of respondents hada cat in their current dwelling. Cat allergy is a common allergy in some parts of Europe, Aus-tralia and New Zealand [44,63]. The overall prevalence of cat allergy in the 10-year follow upof the ECRHS (ECRHS II) was 7.8% [64]. However it seems that cat allergy has not been stud-ied much in Asian countries, especially not among adults in South East Asia. One populationstudy reported 4.1% cat allergy among children in Thailand [65]. Another study amongadults in the northern part of Vietnam found 4.5% cat allergy [22] and one population studyfrom China, including both children and adults, found 1.6% cat allergy [66]. Thus, the preva-lence of cat allergy in our study was higher than previous studies on cat allergy from Asia.
Respiratory Symptoms amongMalaysian Office Workers
PLOS ONE | DOI:10.1371/journal.pone.0124905 April 29, 2015 14 / 21

There are also studies on cat allergy among hospital cases of patients with asthma and aller-gic rhinitis. Two studies among rhinitis patients in Malaysia found 20.0% [6] and 41.6% [7] ofcat allergy respectively. One study among university staff and students in Thailand reportedthat 45.6% of the asthmatic subjects had cat allergy [53]. In Singapore, one study on rhinitis pa-tients including both children and adults found 29.1% cat allergy [67] and another Singaporeadult rhinitis patient study found 9.4% cat allergy [68]. One Hong Kong study which includedchildren and adult patients with chronic rhinitis reported that 14% had cat allergy [69]. A mul-ticenter study in China among patients with asthma and/or rhinitis found prevalence of 10.3%cat allergy [23].
We found cat allergy was significantly related to wheeze, wheeze when not have a cold, atleast one airway symptoms, doctor-diagnosed asthma, current asthma and nasal allergies medi-cation, even after mutual adjustment in statistical tests. Moreover, cat allergy was an indepen-dent risk factor for respiratory symptoms of the respondents, even after adjusting for HDMallergy and other potential confounders in this study. This result supports the finding of previ-ous research that cat sensitization is an important risk factor for asthma in adults [57,70]. Onelimitation of our study is that we have no data on the cat allergen level in the office environ-ment. In a community with high levels of cat ownership, people who are allergic to cats mayget exposed to high levels of cat allergen, even though they do not own a cat in their home,since cat allergens can be passively transported with ease through clothing [71]. Our results in-dicate a clear need to further study the prevalence of cat allergy and its health implication inMalaysia as well as in other Asian countries.
HDM allergy was very common in our study and the majority (52.5%) of the office workerswere sensitized to HDM allergens (D. pteronyssinus or D. farinae). Most (46.9%) were sensi-tized to both allergens, only 2.8% and 1.9% were sensitized to one HDM allergen only (only D.pteronyssinus or only D. farinae). We did not find any previous population based study ofHDM allergy among adults in Malaysia. There is a limited number of population based studiesinvestigating HDM allergy among adults in other countries in Asia. One population basedstudy from Singapore found that 68.5% of adults were sensitized to D. pteronyssinus [72]. An-other population study from Thailand found that 38% of adult asthmatics and 25% of adultswithout asthma were sensitized to HDM allergens [21]. One population based study from thenorthern part of Vietnam reported lower prevalence of HDM allergy among adults, 13.3%allergy to D. pteronyssinus and 10.5% allergy to D. farinae [22]. One population study fromFukui prefecture and central Hokuriku area of Japan found that 50% of all adults were sensi-tized to HDM allergens [73]. The ECRHS II, a population study performed in 10 differentcountries (mainly in Western Europe) reported that 14.1% of adults were sensitized to HDM[64]. Thus, the high prevalence of HDM allergy in our study is in agreement with most popula-tion studies from Asia.
Most studies on HDM allergy in Asia had been performed among hospital patients withasthma or allergic rhinitis [21,53,67,68,74–77]. We found five patient studies of HDM allergyin Malaysia, mostly including both children and adults. One study reported 80.0% HDM aller-gy among adult patients [78]. Another study found 63.3% HDM allergy by skin prick testamong adult patients [4]. Another study (age range 6–60 years) reported 82% HDM allergy[5]. Another study (age range 12–76 years) found 81.4% allergy to D. farinae and 93.6% allergyto D. pteronyssinus [6]. Finally, one recent study (age range 5–64 years) found 69.7% of HDMallergy [7]. One large multicenter study among allergy patients at different hospitals in Chinaobserved the prevalence of HDM allergy increased from north to south and with increasingtemperature and RH [23]. Warm and humid climate facilitate HDM growth and can explainthe high prevalence of HDM allergy found in this study as well as other studies in parts of Asiawith similar climate.
Respiratory Symptoms amongMalaysian Office Workers
PLOS ONE | DOI:10.1371/journal.pone.0124905 April 29, 2015 15 / 21

Our findings concerning the health associations for HDM allergy are in agreement withmany previous early studies, reporting that HDM allergy and exposure to HDM allergens wereassociated with asthma [79–81], asthma symptoms [82–86], and rhinitis [22]. HDM allergenscan cause allergy, asthma and allergic airway inflammation by inducing adaptive Th2-basedadaptive immune responses [87] and also activate innate immune cells [88,89].
The major site of exposure to HDM allergens is in the home environment, since HDMmainly live in bed mattresses [1,28,90]. Home environment studies fromMalaysia reportedhigh prevalence and density of B. tropicalis (average 8,934 mites/g per month), D. pteronyssinus(average 4,553 mites/g per month) andM. intermedius (average 1,020 mites/g per month) [2].The allergens might be transported from the home by cloths. Neal and colleagues found liveand dead mites in automobiles and clothing [91]. Nevertheless, the mites can also multiply orcolonize in carpets or upholstered furniture if provided with sufficient food, protection,warmth and moisture [2,26]. One recent study on allergens in school dust in Malaysia foundvery low levels of house dust mites Der p 1 (range 2–33 ng/g); Der f 1 (range 4–50 ng/g), as wellas low levels of the tropical storage mite Blo t (range 0.6–5.3 AU/g) [3]. There are few studieson HDM allergens in office dust. The levels of HDM allergens in office dust in our study waslower than the HDM allergen levels measured in the large United States office study [26] buthigher than the HDM allergen levels measured in an Italian office study [27]. The levels in ourstudy were comparable with the levels from another office study performed in Nanjing, Chinaand United States [90].
To our knowledge, our study is the first study measuring HDM allergen levels in offices inMalaysia. We found positive associations between Der f 1 level and daytime breathlessness es-pecially in subjects allergic to HDM. Moreover, we found higher levels of Der f 1 as comparedto Der p 1 in office dust. Most other studies from the Asia-Pacific region were performed inhomes, and have reported higher levels of Der p 1 level as compared to Der f 1 [92]. However,two other office studies found higher levels of Der f 1 level as compared to Der p 1 [26,28].This might be because the dry indoor climate of the mechanical ventilated and air conditionedoffices promoted the growth of D. farinae. There are biological and ecological differences be-tween D. pteronyssinus and D. farinae. D. farinae is able to survive better than D. pteronyssinusin drier areas [93,94]. In our study, negative associations between Der p 1 level with wheezeand at least one airway symptoms were found. However, it cannot be interpreted as Der p 1 hasprotective effect on wheeze and airway symptoms because Der p 1 allergen involve in mecha-nisms (modulate differentiation and maturation of dendritic cells) which leading to Th2 cyto-kine immune response [89]. This negative association might be due to residual confoundingsince it was most pronounced in non-allergic subjects.
In conclusion, in our study HDM allergy, cat allergy and respiratory symptoms and rhinitiswere very common among office workers in Malaysia. Moreover, HDM allergy and cat allergywere independently associated with asthma, airway symptoms and rhinitis. Further studies onallergy among office workers and other population studies in Malaysia should include allergytesting against HDM and cat allergy since these two types of allergens seem to be major aller-gens in this country. However, the health relevance of other less common IgE-mediated aller-gies in Malaysia also need to be further investigated. In office environments in Malaysia, Der f1 allergens can be a risk factor for daytime respiratory symptoms among office workers.
AcknowledgmentsWe acknowledge the assistance of the hospital staff from Department of Othorinolaringology,Hospital Serdang. The doctor and staff nurses including Dr. Saraiza bt. Abu Bakar, Khattabiyahbt Ab. Jalal, Lee Seok Heng, Wan Rahana binti Wan Derman and Siti Rohani binti Mohamad
Respiratory Symptoms amongMalaysian Office Workers
PLOS ONE | DOI:10.1371/journal.pone.0124905 April 29, 2015 16 / 21
Noor, in helping to conduct the skin prick test. We are especially grateful to the office workerswho participated in the study and representatives of the office workers who provided assistancefor our study.
Author ContributionsConceived and designed the experiments: FLL ZH DN SMS JHH. Performed the experiments:FLL ZH DN LTLT. Analyzed the data: FLL DN SMS. Contributed reagents/materials/analysistools: ZH DN LTLT JHH. Wrote the paper: FLL DN ZH.
References1. Nadchatram M. House dust mites, our intimate associates. Trop Biomed. 2005 Jun; 22(1): 23–37.
PMID: 16880751
2. Mariana A, Ho TM,Wong AL. House dust mite fauna in the Klang Valley, Malaysia. Southeast Asian JTrop Med Public Health. 2000 Dec; 31(4): 712–21. PMID: 11414418
3. Norbäck D, Markowicz P, Cai GH, Hashim Z, Ali F, Zheng YW, et al. Endotoxin, ergosterol, fungal DNAand allergens in dust from schools in Johor Bahru, Malaysia—associations with asthma and respiratoryinfections in pupils. PLoS One. 2014 Feb 11; 9(2): e88303. doi: 10.1371/journal.pone.0088303 PMID:24523884
4. Asha’ari ZA, Yusof S, Ismail R, Che Hussin CM. Clinical features of allergic rhinitis and skin prick testanalysis based on the ARIA classification: a preliminary study in Malaysia. Ann Acad Med Singapore.2010 Aug; 39(8): 619–24. PMID: 20838703
5. Ho TM, Murad S, Kesavapillai R, Singaram SP. Prevalence of allergy to some inhalants among rhinitispatients in Malaysia. Asian Pac J Allergy Immunol. 1995 Jun; 13(1): 11–6. PMID: 7488338
6. Liam CK, Loo KL, Wong CM, Lim KH, Lee TC. Skin prick test reactivity to common aeroallergens inasthmatic patients with and without rhinitis. Respirology. 2002; 7(4): 345–50. PMID: 12421243
7. Samiah Yasmin AK, Karim AJ, Rohani M, Pathak R, Aye AM, Saeid RD, et al. Skin prick test reactivityto common aeroallergens among patients with rhinitis. American Journal of Ressaerch Communication.2013; 1(3): 18–26.
8. Asher MI, Montefort S, Björkstén B, Lai CKW, Strachan DP, Weiland SK, et al. Worldwide time trends inthe prevalence of symptoms of asthma, allergic rhinoconjunctivitis, and eczema in childhood: ISAACPhases One and Three repeat multicountry cross-sectional surveys. Lancet. 2006 Aug 26; 368(9537):733–43. PMID: 16935684
9. Bousquet J, Khaltaev N, Cruz AA, Denburg J, Fokkens WJ, Togias A, et al. Allergic Rhinitis and its Im-pact on Asthma (ARIA) 2008 Update (in collaboration with the World Health Organization, GA(2)LENand AllerGen). Allergy. 2008 Apr; 63 Suppl 86: 8–160. doi: 10.1111/j.1398-9995.2007.01620.x PMID:18331513
10. Björkstén B, Clayton T, Ellwood P, Stewart A, Strachan D. Worldwide time trends for symptoms of rhini-tis and conjunctivitis: phase III of the International Study of Asthma and Allergies in Childhood. PediatrAllergy Immunol. 2008 Mar; 19(2): 110–24. PMID: 17651373
11. SongWJ, Kang MG, Chang YS, Cho SH. Epidemiology of adult asthma in Asia: toward a better under-standing. Asia Pac Allergy. 2014 Apr; 4(2): 75–85. doi: 10.5415/apallergy.2014.4.2.75 PMID:24809012
12. Katelaris CH, Lai CKW, Rhee CS, Lee SH, YunWD, Lim VL, et al. Nasal allergies in the Asian-Pacificpopulation: results from the allergies in Asia-Pacific Survey. Am J Rhinol Allergy. 2011 Sep–Oct; 25Suppl 1: S3–15. doi: 10.2500/ajra.2011.25.3674 PMID: 22185687
13. Arbes SJ, Gergen P, Vaughn B, Zeldin D. Asthma cases attributable to atopy: results from the Third Na-tional Health and Nutrition Examination Survey. J Allergy Clin Immunol. 2007 Nov; 120(5): 1139–45.PMID: 17889931
14. Kusel MM, de Klerk NH, Kebadze T, Vohma V, Holt PG, Johnston SL, et al. Early-life respiratory viral in-fections, atopic sensitization, and risk of subsequent development of persistent asthma. J Allergy ClinImmunol. 2007 May; 119(5): 1105–10. PMID: 17353039
15. Lowe L, Woodcock A. Lung function at age 3 years: effect of pet ownership and exposure to indoor al-lergens. Arch Pediatr Adolesc Med. 2004 Oct; 158(10): 996–1001. PMID: 15466689
16. Simpson A, Woodcock A, Custovic A. Housing characteristics and mite allergen levels: to humidity andbeyond. Clin Exp Allergy. 2001 Jun; 31(6): 803–5. PMID: 11422141
Respiratory Symptoms amongMalaysian Office Workers
PLOS ONE | DOI:10.1371/journal.pone.0124905 April 29, 2015 17 / 21

17. Simpson BM, Custovic A, Simpson A, Hallam CL, Walsh D, Marolia H, et al. NACManchester Asthmaand Allergy Study (NACMAAS): risk factors for asthma and allergic disorders in adults. Clin Exp Allergy.2001 Mar; 31(3): 391–9. PMID: 11260150
18. Milián E, Díaz AM. Allergy to house dust mites and asthma. P R Health Sci J. 2004 Mar; 23(1): 47–57.PMID: 15125219
19. Shaaban R, Zureik M, Soussan D, Neukirch C, Heinrich J, Sunyer J, et al. Rhinitis and onset of asthma:a longitudinal population-based study. Lancet. 2008; 372(9643): 1049–57. doi: 10.1016/S0140-6736(08)61446-4 PMID: 18805333
20. Custovic A, Simpson A. The role of inhalant allergens in allergic airways disease. J Investig AllergolClin Immunol. 2012; 22(6): 393–401. PMID: 23101182
21. Daengsuwan T, Lee B, Visitsuntorn N, Charroenratanakul S, Ruangrak S, Jirapongsananuruk O, et al.Allergen sensitization to aeroallergens including Blomia tropicalis among adult and childhood astha-matics in Thailand. Asian Pac J Allergy Immunol. 2003 Dec; 21(4): 199–204. PMID: 15198336
22. Lâm HT, Ekerljung L, Bjerg A, Tủờng NV, Lundbäck B, Rönmark E. Sensitization to airborne allergensamong adults and its impact on allergic symptoms: a population survey in northern Vietnam. Clin TranslAllergy. 2014 Feb 10; 4(1): 6. doi: 10.1186/2045-7022-4-6 PMID: 24512828
23. Li J, Sun B, Huang Y, Lin X, Zhao D, Tan G, et al. A multicentre study assessing the prevalence of sen-sitizations in patients with asthma and/or rhinitis in China. Allergy. 2009 Jul; 64(7): 1083–92. doi: 10.1111/j.1398-9995.2009.01967.x PMID: 19210346
24. NamHS, Siebers R, Lee SH, Park JS, Kim YB, Choi YJ, et al. House dust mite allergens in domestichomes in Cheonan, Korea. Korean J Parasitol. 2008 Sep; 46(3): 187–9. doi: 10.3347/kjp.2008.46.3.187PMID: 18830061
25. Zock JP, Heinrich J, Jarvis D, Verlato G, Norbäck D, Plana E, et al. Distribution and determinants ofhouse dust mite allergens in Europe: the European Community Respiratory Health Survey II. J AllergyClin Immunol. 2006 Sep; 118(3): 682–90. PMID: 16950288
26. Macher JM, Tsai FC, Burton LE, Liu KS (2005) Concentrations of cat and dust-mite allergens in dustsamples from 92 large US office buildings from the BASE Study. Indoor Air. 2005; 15 Suppl 9: 82–8.PMID: 15910533
27. Perfetti L, Ferrari M, Galdi E, Pozzi V, Cottica D, Grignani E, et al. House dust mites (Der p 1, Der f 1),cat (Fel d 1) and cockroach (Bla g 2) allergens in indoor work-places (offices and archives). Sci TotalEnviron. 2004 Jul 26; 328(1–3): 15–21. PMID: 15207590
28. Brunetto B, Barletta B, Brescianini S, Masciulli R, Perfetti L, Moscato G, et al. Differences in the pres-ence of allergens among several types of indoor environments. Ann Ist Super Sanita. 2009; 45(4):409–14. PMID: 20061661
29. Konishi E, Uehara K. Contamination of public facilities with Dermatophagoidesmites (Acari: Phyrogly-phidae) in Japan. Exp Appl Acarol. 1999; 23: 41–50.
30. Menzies D, Comtois P, Pasztor J, Nunes F, Hanley JA. Aeroallergens and work-related respiratorysymptoms among office workers. J Allergy Clin Immunol. 1999 Jan; 101(1 Pt 1): 38–44.
31. Repace JL. Indoor air pollution. Environ Int. 1982; 8: 21–36.
32. Weschler CJ. Changes in indoor pollutants since the 1950s. Atmos Environ. 2009; 43(1): 153–69.
33. Skov P, Valbjørn O. The “sick” building syndrome in the office environment: the Danish town hall study.Environ Int. 1987; 13(4–5): 339–49.
34. Akpinar Elci M, Siegel PD, Cox Ganser JM, Stemple KJ, White SK, Hilsbos K, et al. Respiratory inflam-matory responses among occupants of a water-damaged office building. Indoor Air. 2008 Apr; 18(2):125–30. doi: 10.1111/j.1600-0668.2007.00514.x PMID: 18333992
35. Cox Ganser JM, White SK, Jones R, Hilsbos K, Storey E, Enright PL, et al. Respiratory morbidity in of-fice workers in a water-damaged building. Environ Health Perspect. 2005 Apr; 113(4): 485–90. PMID:15811840
36. Li C, Hsu C, Lu C. Dampness and respiratory symptoms among workers in daycare centers in a sub-tropical climate. Arch Environ Health. 1997 Jan–Feb; 52(1): 68–71. PMID: 9039861
37. Ooi PL, Goh KT, Phoon MH, Foo SC, Yap HM. Epidemiology of sick building syndrome and its associ-ated risk factors in Singapore. Occup Environ Med. 1998 Mar; 55(3): 188–93. PMID: 9624270
38. WanG, Li C. Dampness and airway inflammation and systemic symptoms in office building workers.Arch Environ Health. 1999 Jan–Feb; 54(1): 58–63. PMID: 10025418
39. Custovic A, Murray CS, Gore RB, Woodcock A. Controlling indoor allergens. Ann Allergy AsthmaImmunol. 2002 May; 88(5): 432–42. PMID: 12027062
40. Jaakkola JJ, Ieromnimon A, Jaakkola MS. Interior surface materials and asthma in adults: a population-based incident case-control study. Am J Epidemiol. 2006 Oct 15; 164(8): 742–9. PMID: 16877535
Respiratory Symptoms amongMalaysian Office Workers
PLOS ONE | DOI:10.1371/journal.pone.0124905 April 29, 2015 18 / 21
41. Park JH, Cox Ganser J, Rao C, Kreiss K. Fungal and endotoxin measurements in dust associated withrespiratory symptoms in a water-damaged office building. Indoor Air. 2006 Jun; 16(3): 192–203. PMID:16683938
42. Nishihara N, Wargocki P, Tanabe S. Cerebral blood flow, fatigue, mental effort, and task performancein offices with two different pollution loads. Build Environ. 2014; 71: 153–64.
43. Wyon DP. The effects of indoor air quality on performance and productivity. Indoor Air. 2004; 14 Suppl7: 92–101. PMID: 15330777
44. Burney P, Malmberg E, Chinn S, Jarvis D, Luczynska C, Lai E. The distribution of total and specificserum IgE in the European Community Respiratory Health Survey. J Allergy Clin Immunol. 1997 Mar;99(3): 314–22. PMID: 9058686
45. Asher MI, Keil U, Anderson HR, Beasley R, Crane J, Martinez F, et al. International study of asthmaand allergies in childhood (ISAAC): rationale and methods. Eur Respir J. 1995 Mar; 8: 483–91. PMID:7789502
46. Australasian Society of Clinical Immunology and Allergy [Internet]. Balgowlah: Australasian Society ofClinical Immunology and Allergy; 2006 [updated 2012 Oct; cited 2014 Apr 23]. Skin prick testing for thediagnosis of allergic disease: a manual for practitioners. Available: http://www.allergy.org.au/images/stories/pospapers/ASCIA_SPT_Manual_November_2013.pdf
47. Zhao Z, Sebastian A, Larsson L, Wang Z, Zhang Z, Norbäck D. Asthmatic symptoms among pupils inrelation to microbial dust exposure in schools in Taiyuan, China. Pediatr Allergy Immunol. 2008 Aug; 19(5): 455–65. doi: 10.1111/j.1399-3038.2007.00664.x PMID: 18221461
48. Zhang X, Zhao Z, Nordquist T, Larsson L, Sebastian A, Norbäck D. A longitudinal study of sick buildingsyndrome among pupils in relation to microbial components in dust in schools in China. Sci Total Envi-ron. 2011 Nov 15; 409(24): 5253–9. doi: 10.1016/j.scitotenv.2011.08.059 PMID: 21943723
49. Prester L, Brcić Karaconji I, Macan J. Determination of mite allergens in house dust using the enzymeimmunoassay. Arh Hig Rada Toksikol. 2007 Dec; 58(4): 413–9. PMID: 18063526
50. Zhao ZH, Elfman L, Wang ZH, Zhang Z, Norbäck D. A comparative study of asthma, pollen, cat anddog allergy among pupils and allergen levels in schools in Taiyuan city, China, and Uppsala, Sweden.Indoor Air. 2006 Dec; 16(6): 404–13. PMID: 17100662
51. To T, Stanojevic S, Moores G, Gershon AS, Bateman ED, Cruzz AA, et al. Global asthma prevalence inadults: findings from the cross-sectional world health survey. BMC Public Health. 2012 Mar 19; 12: 204.doi: 10.1186/1471-2458-12-204 PMID: 22429515
52. Lu Y, Feng L, Lim L, Ng TP. Asthma, life events and psychiatric disorders: a population-based study.Soc Psychiatry Psychiatr Epidemiol. 2013 Aug; 48(8): 1273–82. doi: 10.1007/s00127-013-0655-5PMID: 23370618
53. Uthaisangsook S. Risk factors for development of asthma in Thai adults in Phitsanulok: a university-based study. Asian Pac J Allergy Immunol. 2010 Mar; 28(1): 23–8. PMID: 20527512
54. Jarvis D, Zock JP, Heinrich J, Svanes C, Verlato G, Olivieri M, et al. Cat and dust mite allergen levels,specific IgG and IgG4, and respiratory symptoms in adults. J Allergy Clin Immunol. 2007 Mar; 119(3):697–704. PMID: 17270260
55. Brunetto B, Brescianini S, Barletta B, Butteroni C, Rotondi D, Masciulli R, et al. Exposure to indoor aller-gens and association with allergy symptoms of employees in a work environment. Ann Ist Super Sanita.2009; 45(4): 415–22. PMID: 20061662
56. Vidal C, Boquete O, Gude F, Rey J, Meijide LM, Fernández Merino MC, et al. High prevalence of stor-age mite sensitization in a general adult population. Allergy. 2004 Apr; 59(4): 401–5. PMID: 15005763
57. Antó JM, Sunyer J, Basagaña X, Garcia Esteban R, Cerveri I, de Marco R, et al. Risk factors of new-onset asthma in adults: a population-based international cohort study. Allergy. 2010 Aug; 65(8):1021–30. doi: 10.1111/j.1398-9995.2009.02301.x PMID: 20132157
58. Leynaert B, Neukirch C, Kony S, Guénégou A, Bousquet J, Aubier M, et al. Association between asth-ma and rhinitis according to atopic sensitization in a population-based study. J Allergy Clin Immunol.2004 Jan; 113(1): 86–93. PMID: 14713912
59. Sonomjamts M, Dashdemberel S. Prevalence of asthma and allergic rhinitis among adult population inUlaanbaatar, Mongolia. Asia Pac Allergy. 2014 Jan; 4(1): 25–31. doi: 10.5415/apallergy.2014.4.1.25PMID: 24527407
60. Uthaisangsook S. Prevalence of asthma, rhinitis, and eczema in the university population of Phitsanu-lok, Thailand. Asian Pac J Allergy Immunol. 2007 Jun–Sep; 25(2–3): 127–32. PMID: 18402299
61. Lâm HT, Rönmark E, Tủờng NV, Ekerljung L, Chúc NTK, Lundbäck B. Increase in asthma and a highprevalence of bronchitis: results from a population study among adults in urban and rural Vietnam.Respir Med. 2011 Feb; 105(2): 177–85. doi: 10.1016/j.rmed.2010.10.001 PMID: 21030231
Respiratory Symptoms amongMalaysian Office Workers
PLOS ONE | DOI:10.1371/journal.pone.0124905 April 29, 2015 19 / 21
62. Dejsomritrutai W, Nana A, Chierakul N, Tscheikuna J, Sompradeekul S, Ruttanaumpawan P, et al.Prevalence of bronchial hyperresponsiveness and asthma in the adult population in Thailand. Chest.2006 Mar; 129(3): 602–9. PMID: 16537857
63. Svanes C, Jarvis D, Chinn S, Burney P. Childhood environment and adult atopy: results from the Euro-pean Community Respiratory Health Survey. J Allergy Clin Immunol. 1999 Mar; 103(3 Pt 1): 415–20.PMID: 10069874
64. Bakolis I., Heinrich J, Zock JP, Norbäck D, Svanes C, Chen CM, et al. House dust-mite allergen expo-sure is associated with serum specific IgE but not with respiratory outcomes. Indoor Air. 2014 Jun 11.doi: 10.1111/ina.12137
65. Prasarnphanich T, Sindhurat S. Sensitization to common indoor allergens and its association with aller-gic diseases in Thai female high-school students. Pediatr Allergy Immunol. 2005 Aug; 16(5): 402–7.PMID: 16101932
66. Kim JS, Ouyang F, Pongracic JA, Fang Y, Wang B, Liu X, et al. Dissociation between the prevalence ofatopy and allergic disease in rural China among children and adults. J Allergy Clin Immunol. 2008 Nov;122(5): 929–35. doi: 10.1016/j.jaci.2008.08.009 PMID: 18805578
67. Chew FT, Lim SH, Goh DY, Lee BW. Sensitization to local dust-mite fauna in Singapore. Allergy. 1999Nov; 54(11): 1150–9. PMID: 10604550
68. John AB, Lee HS, Lee FY, Chng HH. Allergen skin test and total IgE in adults with rhinitis in Singapore.Asian Pac J Allergy Immunol. 1996 Jun; 14(1): 9–12. PMID: 8980794
69. Yuen APW, Cheung S, Tang KC, HoWK, Wong BYH, Cheung AC, et al. The skin prick test results of977 patients suffering from chronic rhinitis in Hong Kong. Hong Kong Med J. 2007 Apr; 13(2): 131–6.PMID: 17406040
70. Olivieri M, Zock JP, Accordini S, Heinrich J, Jarvis D, Künzli N, et al. Risk factors for new-onset cat sen-sitization among adults: a population-based international cohort study. J Allergy Clin Immunol. 2012Feb; 129(2): 420–5. doi: 10.1016/j.jaci.2011.10.044 PMID: 22168997
71. Arbes SJ, Cohn R, Yin M, Muilenberg M, FriedmanW, Zeldin DC. Dog allergen (Can f 1) and cat aller-gen (Fel d 1) in US homes: results from the National Survey of Lead and Allergens in Housing. J AllergyClin Immunol. 2014 Jul; 114(1): 111–7.
72. Andiappan AK, Puan KJ, Lee B, Nardin A, Poidinger M, Connolly J, et al. Allergic airway diseases in atropical urban environment are driven by dominant mono-specific sensitization against house dustmites. Allergy. 2014 Apr; 69(4): 501–9. doi: 10.1111/all.12364 PMID: 24456108
73. Sakashita M, Hirota T, Harada M, Nakamichi R, Tsunoda T, Osawa Y, et al. Prevalence of allergic rhini-tis and sensitization to common aeroallergens in a Japanese population. Int Arch Allergy Immunol.2010; 151(3): 255–61. doi: 10.1159/000242363 PMID: 19786806
74. Lal A, SunainaWaghray S, Nand Kishore NN. Skin prick testing and immunotherapy in nasobronchialallergy: our experience. Indian J Otolaryngol Head Neck Surg. 2011 Apr; 63(2): 132–5. doi: 10.1007/s12070-010-0064-y PMID: 22468248
75. Pumhirun P, Towiwat P, Mahakit P. Aeroallergen sensitivity of Thai patients with allergic rhinitis. AsianPac J Allergy Immunol. 1997 Dec; 15(4): 183–5. PMID: 9579610
76. Ramos JDA, Castillo MPS, Rosario M, Gapay MAS, Go TP, Kamantigue EG. Allergenicity and cross-reactivity of 3 house dust mite species among Filipino allergic patients. Philipp J Sci. 2007 Dec; 136(2):139–46.
77. Yong SB, Wu CC, Tzeng YC, HungWC, Yang KD. Different profiles of allergen sensitization in differentages and geographic areas in Changhua, Taiwan. J Microbiol Immunol Infect. 2013 Aug; 46(4):295–301. doi: 10.1016/j.jmii.2012.07.002 PMID: 23058910
78. Asha’ari ZA, Suhaimi Y, Yusof RA, Rushdan I, Maraina CHC. Comparison of serum specific IgE withskin prick test in the diagnosis of allergy in Malaysia. Med J Malaysia. 2011 Aug; 66(3): 202–6. PMID:22111441
79. Chew GL, Reardon AM, Correa JC, Young M, Acosta L, Mellins R, et al. Mite sensitization among Lati-na women in New York, where dust-mite allergen levels are typically low. Indoor Air. 2009 Jun; 19(3):193–7. doi: 10.1111/j.1600-0668.2008.00578.x PMID: 19220508
80. Jaakkola MS, Ieromnimon A, Jaakkola JJ. Are atopy and specific IgE to mites and molds important foradult asthma? J Allergy Clin Immunol. 2006 Mar; 117(3): 642–8. PMID: 16522465
81. StevensW, Addo Yobo E, Roper J, Woodcock A, James H, Platts Mills T, et al. Differences in both prev-alence and titre of specific immunoglobulin E among children with asthma in affluent and poor commu-nities within a large town in Ghana. Clin Exp Allergy. 2011 Nov; 41(11): 1587–94. doi: 10.1111/j.1365-2222.2011.03832.x PMID: 21810123
Respiratory Symptoms amongMalaysian Office Workers
PLOS ONE | DOI:10.1371/journal.pone.0124905 April 29, 2015 20 / 21

82. Gehring U, Heinrich J, Jacob B, Richter K, Fahlbusch B, Schlenvoiqt G, et al. Respiratory symptoms inrelation to indoor exposure to mite and cat allergens and endotoxins. Eur Respir J. 2001 Sep; 18(3):555–63. PMID: 11589355
83. Langley SJ, Goldthorpe S, Craven M, Woodcock A, Custovic A. Relationship between exposure to do-mestic allergens and bronchial hyperresponsiveness in non-sensitised, atopic asthmatic subjects. Tho-rax. 2005 Jan; 60(1): 17–21. PMID: 15618577
84. Li J, Wang H, Chen Y, Zheng J, Wong GW, Zhong N. House dust mite sensitization is the main risk fac-tor for the increase in prevalence of wheeze in 13- to 14-year-old schoolchildren in Guangzhou city,China. Clin Exp Allergy. 2013 Oct; 43(10): 1171–9. doi: 10.1111/cea.12157 PMID: 24074335
85. Raukas Kivioja A, Raukas ES, Meren M, Loit HM, Rönmark E, Lundbäck B. Allergic sensitization tocommon airborne allergens among adults in Estonia. Int Arch Allergy Immunol. 2007; 142(3): 247–54.PMID: 17114890
86. van der Heide S, Dubois AE, Kauffman HF, de Monchy JG. Allergy to mites: relation to lung functionand airway hyperresponsiveness. Allergy. 1998; 53(48 Suppl): 104–7. PMID: 10096820
87. Jacquet A. The role of innate immunity activation in house dust mite allergy. Trends Mol Med. 2011 Oct;17(10): 604–11. doi: 10.1016/j.molmed.2011.05.014 PMID: 21741880
88. Jacquet A. Innate immune responses in house dust mite allergy. ISRN Allergy. 2013 Feb 28; 2013:735031. doi: 10.1155/2013/735031 PMID: 23724247
89. Wang JY. The innate immune response in house dust mite-induced allergic inflammation. Allergy Asth-ma Immunol Res. 2013 Mar; 5(2): 68–74. doi: 10.4168/aair.2013.5.2.68 PMID: 23450108
90. Yao M, Wu Y, Zhen S, Mainelis G. A comparison of airborne and dust-borne allergens and toxins col-lected from home, office and outdoor environments both in New Haven, United States and Nanjing,China. Aerobiologia (Bologna). 2009; 25: 183–92.
91. Neal JS, Arlian LG, Morgan MS. Relationship among house-dust mites, Der 1, Fel d 1, and Can f 1 onclothing and automobile seats with respect to densities in houses. Ann Allergy Asthma Immunol. 2002Apr; 88(4): 410–5. PMID: 11991559
92. Wickens K, de Bruyne J, Calvo M, Choon Kook S, Jayaraj G, Lai CK, et al. The determinants of dustmite allergen and its relationship to the prevalence of symptoms of asthma in the Asia-Pacific region.Pediatr Allergy Immunol. 2004 Feb; 15(1): 55–61. PMID: 14998383
93. Arlian LG. Water balance and humidity requirements of house dust mites. Exp Appl Acarol. 1992 Nov;16(1–2): 15–35. PMID: 1493740
94. Arlian LG, Morgan MS. Biology, ecology, and prevalence of dust mites. Immunol Allergy Clin North Am.2003 Aug; 23(3): 443–68. PMID: 14524385
Respiratory Symptoms amongMalaysian Office Workers
PLOS ONE | DOI:10.1371/journal.pone.0124905 April 29, 2015 21 / 21