
-megavision-discussion-materials
25
Megavisión Discussion Materials Strictly Private and Confidential July 2013 Citi Corporate and Investment Banking | Latin America TMT Investment Banking
-
Upload
free-lancer -
Category
Business
-
view
344 -
download
1
Transcript of -megavision-discussion-materials

Megavisión Discussion Materials
Strictly Private and Confidential
July 2013
Citi Corporate and Investment Banking | Latin America TMT Investment Banking

Table of Contents
1. Banchile Citi Latin America Qualifications 1
2. Chilean Macroeconomic Outlook 4
3. Chilean Advertising & TV Market Overview 6
4. Megavisión Overview 9
5. Appendix 15

1. Banchile Citi Latin America Qualifications

Citigroup Global Markets Inc. (“Citi”) and Banchile Citi Global Markets (together “Banchile Citi”) have a dedicated
team of experienced professionals with industry, product and regional knowledge to assist Sony Pictures in the
evaluation of strategic alternatives involving Megavisión S.A. (“Megavisión or “Mega”).
The Citi Investment Banking Team
TMT Investment Banking Latin America Investment Banking Banchile Citi
Ketan Mehta
Managing Director
Global Head of TMT M&A
+1 212 816-2877
Alberto Pandolfi
Managing Director
Head of Investment Banking LatAm
+1 212 816-6177
Jorge Muñoz
Managing Director
Head of Investment Banking Chile
+56 2 2380-8770
Federico Storani
Director
LatAm TMT
+1 212 816-5037
Alfonso Yanez
Director
+56 2 2380-8743
Francesco Piaggio
Associate
+1 212 816-9020
William Stanton
Associate
+56 2 2380-8516
Raniero Lopez
Analyst
+1 212 816-3945
Emilio Vergara
Analyst
+56 2 2380-8160
1

$9,679 $8,334
$7,543 $6,875
Celfin Santander Larraín Vial
Leadership in Local Debt
Capital Market1 2012, US$ mm
$787
$637
$328
$213
IM Trust Santander BBVA
Leadership in Bank & Debt Capital Markets Deals (Selected Debt Transactions)
Active M&A Presence (Selected M&A Transactions)
Local Equity Leadership (Selected Equity Transactions)
Advisor to TimerWarner
in its Acquisition of
Chilevisión
Undisclosed
2010
Advisor to Mitsubishi in
the merger of CMP and
CMH
US$924 mm
2010
Follow On
US$445 mm
2011
Leadership in Local Equity
Capital Market1 2003-2012, US$ mm
IPO
US$373 mm 2011
Corfo’s
Secondary Sale of 30% of
US$984 mm 2011
Follow On
US$130 mm 2011
&
Best Bond House 2011
Best M&A Transaction 2010
Corfo’s Secondary Sale of its stakes
in Essbio and Esval
US$564 mm 2011
Investment Banking Leadership
Banchile Citi Global Markets is the
Investment Banking & Capital Markets arm
of Banco de Chile and Citi in Chile
: Leading Investment Bank in Chile
Advisor to MS Infrastructure Partners on the sale of its 50%
stake in SAESA
Undisclosed 2011
Advisor to ING on
the sale of its life &
health insurance
business
Undisclosed
2009 & 2007
Corfo’s Secondary Sale of its stake in
US$88 mm 2012
Advisor to PreUnic
on its merger with
Undisclosed
2012
Advisor to Enagas on its
announced acquisition of
40% of GNL Quintero US352 mm
2012
Follow On
US$ 174 mm 2011
Follow On
US$ 505 mm
2012
Follow On
US$ 448 mm
2012
Advisor to
Christus Health on its
40% acquisition of
Red Salud UC
Confidential
2013
Local Bond
UF 1.7 mm
UF 3.3 mm
2012
Local Bond
UF 1.5 mm
2012
Best Investment Bank Chile 2012
Republic of Chile
Best Sovereign Bond
US$ 1,520mm - Dual
Currency
International Bond
Best Sovereign Issuer 2010
Best Investment Bank Chile 2013
Follow on
US$ 530 mm 2012-2013
Follow on US$ 500 mm
2013 (ongoing)
Follow on
US$ 5.690 mm 2013
Local Bond UF 1,5 mm
2012
Local Bond UF 7,8 mm
2012
Local Bond UF 2,5 mm
2013
Local Bond UF 6,0 mm
2013
Advisor to Duke Energy
on its acquisition of
US$ 415 mm
2012 Best Investment Bank Chile 2012
Source: (1) Based on Santiago Stock Exchange databases. League tables considers partial credit. Transactions recorded in US$.
Cross border M&A transactions
2
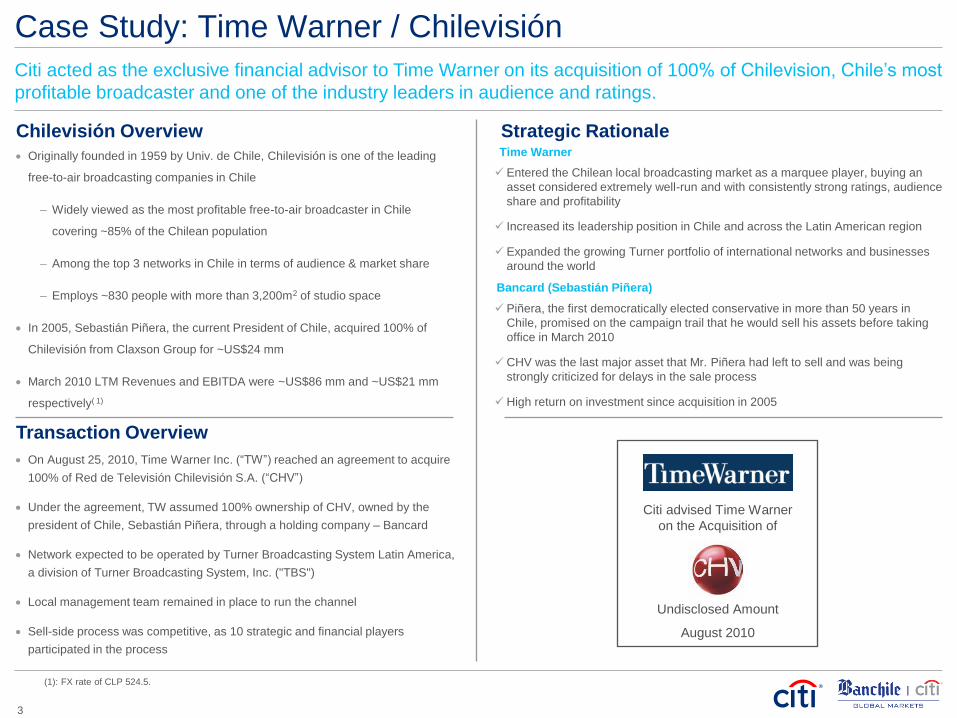
Originally founded in 1959 by Univ. de Chile, Chilevisión is one of the leading
free-to-air broadcasting companies in Chile
– Widely viewed as the most profitable free-to-air broadcaster in Chile
covering ~85% of the Chilean population
– Among the top 3 networks in Chile in terms of audience & market share
– Employs ~830 people with more than 3,200m2 of studio space
In 2005, Sebastián Piñera, the current President of Chile, acquired 100% of
Chilevisión from Claxson Group for ~US$24 mm
March 2010 LTM Revenues and EBITDA were ~US$86 mm and ~US$21 mm
respectively( 1)
Piñera, the first democratically elected conservative in more than 50 years in
Chile, promised on the campaign trail that he would sell his assets before taking
office in March 2010
CHV was the last major asset that Mr. Piñera had left to sell and was being
strongly criticized for delays in the sale process
High return on investment since acquisition in 2005
Case Study: Time Warner / Chilevisión
Citi advised Time Warner
on the Acquisition of
August 2010
Undisclosed Amount
Strategic Rationale
Transaction Overview
Chilevisión Overview
On August 25, 2010, Time Warner Inc. (“TW”) reached an agreement to acquire
100% of Red de Televisión Chilevisión S.A. (“CHV”)
Under the agreement, TW assumed 100% ownership of CHV, owned by the
president of Chile, Sebastián Piñera, through a holding company – Bancard
Network expected to be operated by Turner Broadcasting System Latin America,
a division of Turner Broadcasting System, Inc. ("TBS")
Local management team remained in place to run the channel
Sell-side process was competitive, as 10 strategic and financial players
participated in the process
Entered the Chilean local broadcasting market as a marquee player, buying an
asset considered extremely well-run and with consistently strong ratings, audience
share and profitability
Increased its leadership position in Chile and across the Latin American region
Expanded the growing Turner portfolio of international networks and businesses
around the world
Time Warner
Bancard (Sebastián Piñera)
Citi acted as the exclusive financial advisor to Time Warner on its acquisition of 100% of Chilevision, Chile’s most
profitable broadcaster and one of the industry leaders in audience and ratings.
(1): FX rate of CLP 524.5.
3

2. Chilean Macroeconomic Outlook

(1.0%)
0.0%
1.0%
2.0%
3.0%
4.0%
5.0%
6.0%
7.0%
25.0 125.0 225.0
1.80
1.20
1.10
0.95
0.90
0.80
0.78
0.75
0.72
0.70
0.60
0.60
0.55
0.50
0.30 #15
#14
#13
#12
#11
#10
#9
#8
#7
#6
#5
#4
#3
#2
#1 NorwaySingapore
SwitzerlandSwedenFinlandCanada
AustraliaTaiwan
GermanyChile
New ZelandS. KoreaDenmark
NetherlandsUS
Chile’s highly attractive risk-return profile
Chile’s Key Macroeconomic Strengths
Chile is considered to have the most stable economy in Latin America, due to strong and consistent
macroeconomic fundamentals and policies. Overall, Chile offers a limited risk and high growth profile.
Risk/Return Profile
BlackRock’s Sovereign Risk Rating Index 5-Year CDS Spread and S&P Rating
Highest GDP per capita in Latin America
Only country in South America member of the OECD
Best Latin American sovereign risk rating (AA-)
Low tax on corporate profits (20%)
Ranked among the top 20 destinations for investment by multinational companies
for the next 2 years(1)
Source: Economist Intelligence Unit, Citi research, The BlackRock Sovereign Risk Index Report January 2013 , and FactSet.
(1) World Investment Report 2011 (United Nations).
(2) Average between Germany, France and UK.
BlackRock’s Sovereign Risk Index
ranks Chile in 10th place out of 44
countries, above countries like
Denmark or the U.S.
Lower Growth/
Higher Risk
Higher Growth /
Higher Risk
Higher Growth/
Lower Risk
Lower Growth/
Lower Risk 2013E
Gro
wth
5 Year CDS Spread – July 5, 2013
July 2013:
Chile: 107 bps
Average(2):54 bps
Spread: +53bps
0
50
100
150
200
250
300
350
Jul/08 Jul/09 Jul/10 Jul/11 Jul/12 Jul/13
Germany (AAA) Chile (AA-) France (AA+) UK (AAA)
4

10.3%
5.5%
3.8%3.0% 2.9%
2.5%
Argentina Brazil Mexico Chile Peru Colombia
Chile’s Macroeconomic Overview
16,870
12,190 11,600 11,210
7,9907,230
Chile Brazil Mexico Argentina Colombia Peru
Foreign Investment (’13 – ’17E, Total - US$ mm)
Nominal GDP per Capita (’13E, US$)
(1)
Inflation Forecasts (’12 – ’17E, Average Inflation – Local Currency)
Peru Chile Colombia Mexico Argentina Brazil
Peru Chile Colombia Mexico Argentina Brazil
Source: EIU data as of May 2013.
(1) IHS Global Insight based on official inflation rates from the Government of Argentina as of May 2013.
5.6%
4.7% 4.5%
3.7% 3.7%3.4%
Peru Chile Colombia Mexico Argentina Brazil
Real GDP Growth (’13 – ’18E, CAGR)
Peru Chile Colombia Mexico Argentina Brazil
342,634
135,000 121,500103,364
61,773 48,200
Brazil Mexico Chile Colombia Peru Argentina
Peru Chile Colombia Mexico Argentina Brazil
5

3. Chilean Advertising & TV Market Overview

436 491 500 527 587 645 659 706 736 771
876 982 998 982
1,143
1,303 1,334
1,436 1,523
1,628
2006 2007 2008 2009 2010 2011 2012 2013E2014E2015E
TV Print Outdoor Internet Others
Free to Air 89%
Pay TV 11%
TV 49%
Print 27%
Outdoor 9%
Internet 8%
Others 7%
Chile Advertising Market
Highlights
There is a high correlation between advertising and GDP growth
Chile’s advertising market is ahead of its Latam peers, but still lags developed
countries:
– Ad-spend per capita in Chile is ~US$78 per year vs. ~US$57(1) in its Latam
peers and ~US$513 in the USA
– Chilean advertising expenditure represented 0.5% of its 2012 GDP, still
substantially below developed countries like USA (1.0%), Japan (0.9%), UK
(0.8%), and Germany (0.7%)
TV remains the most relevant medium for advertising, representing 49% of total
advertising expenditures, with high concentration in FTA
Ad spending remained almost flat during crisis years, while TV spending
continued to grow
Advertising Expenditure by Medium (2012)
Chilean advertising market has grown in line with the country’s GDP, at a nominal rate of approximately 7 - 8%
per year in pre-crisis and post-crisis periods. The market is dominated by free-to-air (“FTA”) television, which
represents 44% of total ad-spend in 2012.
(2)
Total Advertising
US$ 1,334 mm
Sources: Historical Advertising Expenditure from Asociación Chilena de Agencias de Publicidad (“ACHAP”); Projected Advertising Expenditure from ZenithOptimedia, June 2013;
Advertising Expenditure by Country from ZenithOptimedia report of June 2013, and nominal GDP and population from EIU as of May 2013.
Note: Exchange rates as of June 28, 2013 (99.34 JPY/US$; 0.77 EUR/US$; 0.66 GBP/US$; 505.95 CLP/US$).
(1) Average for Chile’s Latam peers: Argentina, Brazil, Colombia, Mexico, Peru and Venezuela. (2) Includes Cinema and Radio.
Total TV
US$ 659 mm
Historical and Projected Advertising Expenditure (‘06 –’15E, US$ mm)
CAGR
06’ –08’
CAGR
10’ –12’
CAGR
12‘–15E’
4.3% 7.2% 5.1%
37.5% 29.1% 21.0%
5.5% 17.7% 4.1%
5.6% 5.0% 6.3%
7.1% 5.9% 5.4%
Projected
Advertising Expenditure by Country (2012)
% of GDP Per Capita (US$)
1.0%
0.9% 0.8%
0.7%
0.5%
0.7%
USA Japan UK Germany Chile
513
329 294 291
78 57
USA Japan UK Germany Chile Latam
Peers (1)
Latam
Peers (1)
(2)
6

Mon Tue Wed Thu Fri Sat Sun
6.00-17.59
18.00-19.59
20.00-24.30
00.30-26.59
Chile FTA TV Market Overview
Key Players Audience Share Evolution (% of Total)
There are 5 main players in the Chilean free to air TV space with total revenues of US$ 528 mm in 2012. Up until
2010, TVN and Canal 13 were dominant players specially in terms of revenue.
Overview of Chilean TV Demand
Revenue Share Evolution (% of Total)
Content Launch Ownership Aud. Share
(2012)
All segments, with expertise in Reality
Shows 1958
Grupo Luksic / Catholic University
27.0%
All segments, with great success in Morning
Shows and Soap Opera 1968 State Owned 23.6
All segments, with good rating in Soap Opera
1960 Time Warner 21.8
All segments, with focus in off prime time
1990 Grupo Bethia 20.2
Generalist programs, Films
1991 Remigio Angel
Gonzalez 7.4
0%
5%
10%
15%
20%
25%
30%
35%
40%
2005 2006 2007 2008 2009 2010 2011 2012
C13 TVN CHV Mega Red
0%
5%
10%
15%
20%
25%
30%
35%
40%
2005 2006 2007 2008 2009 2010 2011 2012
C13 TVN CHV Mega Red
TBC WS Off Prime
Prime
Off Prime
Off P
rim
e
Transition
Off P
rim
e
Source: Audience share Timelbope.
(1) % Revenue Share / % Rating Share.
Acquisition of C13 by Luksic
Acquisition of CHV by Time Warner
Power
Ratio(1)
1.2
1.2
1.0
0.6
0.4
Acquisition of Mega
by Bethia
7

Key Media Regulatory Considerations Topic Comments
Federal
Regulators
Undersecretary of Telecommunications (Subtel): acts on behalf of the Ministry of Transportation and Telecommunications
CNTV (“Consejo Nacional de Televisión”): reporting to the President through the General Secretary Ministry
Responsibilities / Mandates include:
– Promoting deregulation and market competition
– Granting concessions
– Executing day-to-day regulation/supervision of concessionaires and ensuring compliance; evaluating bids submitted for concessions and
opining on grant assignment and extension
Tribunal de la Libre Competencia (TDLC): antitrust agency; approves the assignment or transfer of television and telecommunications concessions
Concessions
Television Broadcasting licenses are awarded by service areas through a public bidding process coordinated by CNTV, on the basis of technical
and economic offers as overseen by the Subsecretaria de Telecomunicaciones (SUBTEL)
– Until 1992, concessions were granted for an indefinite term
– From 1992 onwards, concessions have a maximum 25-year term with a ROFR in the new bidding process; no separation between national
and regional licenses (maximum 1 license per area); license covers analogue TV services only
With the DTT platform migration underway, the regulatory framework is currently under discussion (see DTT migration below)
Convergence
(Triple-Play)
The General Law of Telecommunications, issued in 1982, allows concessionaires to provide complementary services through their networks and
thus, offer triple-play packages
Content
Restrictions
Minimum of 40% of programming must be locally produced
Minimum of 1 hour per week of cultural programming in prime time
Restrictions on
Advertising
Tobacco advertisements are required to display a clear and precise warning of damaging effects of its consumption
– Warning message should cover at least 50% of the total ad area and may not be broadcasted during non-adult programming
Foreign
Ownership Limits
There are no restrictions on foreign investment in Chile
Chilean law states that presidents, managers, directors and legal representatives of a terrestrial broadcasters must be Chilean
– Foreigners can hold Director positions, provided they do not constitute a majority
DTT Migration
The project is still in final discussion in Congress. Approval is expected for end of year. Four main issues are still being discussed
– “Retransmision consentida” - considers the payment from cable providers to FTA TV channels
– If the investment will be shared among TV channels
– Timeframes – likely to be 3 years to reach 85% coverage, and 5 years to reach 100% coverage
– Length of concessions – 20-year term for owned concessions, and 5-year term for concessions from third parties, with a ROFR in the new
bidding process
The ISDB-T standard (with MPEG4) was selected
8

4. Megavisión Overview
News 24%
Entertainment 20%
Talk Shows 16%
Movies 12%
Soap Opera 11%
Series 11%
Other 6%
27%
24%
22%
20%
7%
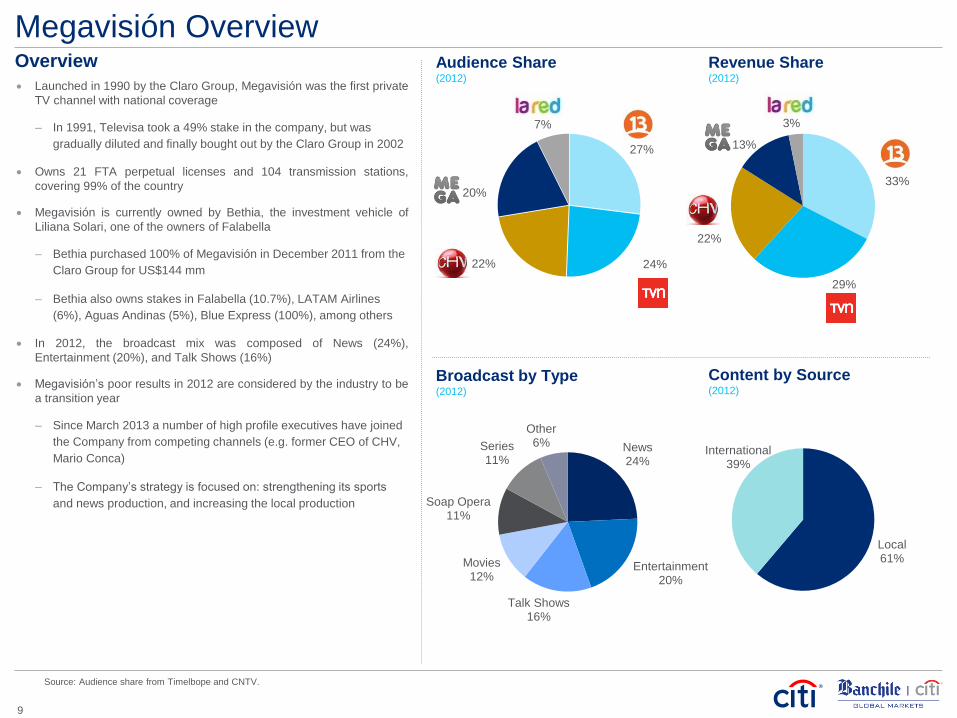
Megavisión Overview
Launched in 1990 by the Claro Group, Megavisión was the first private
TV channel with national coverage
– In 1991, Televisa took a 49% stake in the company, but was
gradually diluted and finally bought out by the Claro Group in 2002
Owns 21 FTA perpetual licenses and 104 transmission stations,
covering 99% of the country
Megavisión is currently owned by Bethia, the investment vehicle of
Liliana Solari, one of the owners of Falabella
– Bethia purchased 100% of Megavisión in December 2011 from the
Claro Group for US$144 mm
– Bethia also owns stakes in Falabella (10.7%), LATAM Airlines
(6%), Aguas Andinas (5%), Blue Express (100%), among others
In 2012, the broadcast mix was composed of News (24%),
Entertainment (20%), and Talk Shows (16%)
Megavisión’s poor results in 2012 are considered by the industry to be
a transition year
– Since March 2013 a number of high profile executives have joined
the Company from competing channels (e.g. former CEO of CHV,
Mario Conca)
– The Company’s strategy is focused on: strengthening its sports
and news production, and increasing the local production
Audience Share (2012)
Source: Audience share from Timelbope and CNTV.
Broadcast by Type (2012)
Revenue Share (2012)
Local 61%
International 39%
Content by Source (2012)
33%
29%
22%
13%
3%
Overview
9

Bethia S.A. (“Grupo Bethia” or “Bethia”) is the investment vehicle of Liliana Solari,
and owns 10.7% of S.A.C.I. Falabella (“Falabella”) shares
Falabella has a market capitalization of ~US$25 bn, making it Bethia’s main asset
Falabella has presence in Chile, Colombia, Peru, Argentina and Brazil with
different business lines (department stores, financial services, home
improvement, supermarkets, and real estate):
Other Investments of Grupo Bethia include:
– Agribusiness
– Transport
– Telecom
– Equestrian
– Real estate
– Wine
– Healthcare
– Potable water
Mega represents less than 5% of Grupo Bethia’s total assets
Business Unit Revenues (LTM (1) in US$ bn) Presence
Department Stores 4.5
Home Improvement 5.4
Supermarkets 1.9
Financial Services 6.0
Real Estate n.a.
Bethia Group Overview
Source: Grupo Bethia web page, Falabella’s Corporate Presentation of June 2013, Superintendencia de Valores y Seguros de Chile, and Bloomberg.
(1) LTM as of March 2013.
(2) Citi estimates considering Mega’s firm value the same as when acquired by Bethia.
(3) Exchange rate 519 CLP/US$.
(2)
Transaction Valuation
Transaction Overview
In December 2011, Bethia agreed to acquire 100% of Megavisión from
CIECSA, a subsidiary of Cristalerías de Chile and controlled by the Claro
Group
– Bethia paid US$144 mm plus cash available at the moment of the
purchase
– Transaction included the Megavisión channel along with the children's
channel “ETC…TV” and the radio station “Candela”
– Cristalerías de Chile reported a profit of US$59 mm from the sale
With the purchase of Megavisión, Bethia completed its objective of entering the
Chilean TV market. Previously, Bethia had actively participated in the sale
process of both Chilevisión and Canal 13, which were finally sold to Time
Warner and the Luksic Group, respectively
Case Study: Bethia’s Acquisition of Megavisión
Transaction Valuation US$ mm(3)
Purchase Price $169.6
% Acquired 100.0
Implied Equity Value 169.6
(+) Debt 0.0
(+) Minority Interest 0.2
(-) IUCS 0.0
(-) Cash (26.1)
Implied Firm Value $143.7
EBITDA 2011 17.1
Net Income 2011 10.9
Transaction Multiples
FV / EBITDA 2011 8.4x
Equity Value / Net Income 2011 15.5x
10
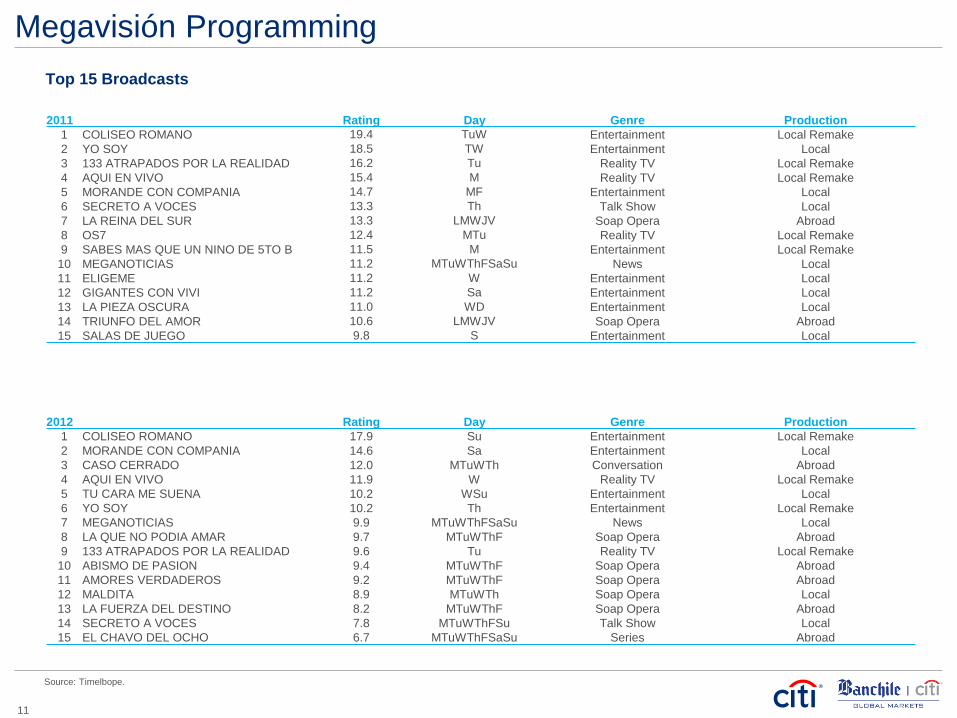
Megavisión Programming
Top 15 Broadcasts
2011 Rating Day Genre Production
1 COLISEO ROMANO 19.4 TuW Entertainment Local Remake
2 YO SOY 18.5 TW Entertainment Local
3 133 ATRAPADOS POR LA REALIDAD 16.2 Tu Reality TV Local Remake
4 AQUI EN VIVO 15.4 M Reality TV Local Remake
5 MORANDE CON COMPANIA 14.7 MF Entertainment Local
6 SECRETO A VOCES 13.3 Th Talk Show Local
7 LA REINA DEL SUR 13.3 LMWJV Soap Opera Abroad
8 OS7 12.4 MTu Reality TV Local Remake
9 SABES MAS QUE UN NINO DE 5TO B 11.5 M Entertainment Local Remake
10 MEGANOTICIAS 11.2 MTuWThFSaSu News Local
11 ELIGEME 11.2 W Entertainment Local
12 GIGANTES CON VIVI 11.2 Sa Entertainment Local
13 LA PIEZA OSCURA 11.0 WD Entertainment Local
14 TRIUNFO DEL AMOR 10.6 LMWJV Soap Opera Abroad
15 SALAS DE JUEGO 9.8 S Entertainment Local
2012 Rating Day Genre Production
1 COLISEO ROMANO 17.9 Su Entertainment Local Remake
2 MORANDE CON COMPANIA 14.6 Sa Entertainment Local
3 CASO CERRADO 12.0 MTuWTh Conversation Abroad
4 AQUI EN VIVO 11.9 W Reality TV Local Remake
5 TU CARA ME SUENA 10.2 WSu Entertainment Local
6 YO SOY 10.2 Th Entertainment Local Remake
7 MEGANOTICIAS 9.9 MTuWThFSaSu News Local
8 LA QUE NO PODIA AMAR 9.7 MTuWThF Soap Opera Abroad
9 133 ATRAPADOS POR LA REALIDAD 9.6 Tu Reality TV Local Remake
10 ABISMO DE PASION 9.4 MTuWThF Soap Opera Abroad
11 AMORES VERDADEROS 9.2 MTuWThF Soap Opera Abroad
12 MALDITA 8.9 MTuWTh Soap Opera Local
13 LA FUERZA DEL DESTINO 8.2 MTuWThF Soap Opera Abroad
14 SECRETO A VOCES 7.8 MTuWThFSu Talk Show Local
15 EL CHAVO DEL OCHO 6.7 MTuWThFSaSu Series Abroad
Source: Timelbope.
11

10
13 12
18 18
0 -3
0
15% 17% 16%
20% 21%
0%
-19%
-1%
2007 2008 2009 2010 2011 2012 Mar/12 Mar/13
Megavisión Financial Overview
Source: SVS and Company Filings.
Note: All figures converted to USD at an FX rate of CLP / USD of 505. In 2010 Megavisión changed accounting standards from Chilean GAAP to IFRS.
(1) Prime time defined as from 20:00 to 00:30 hrs, off prime from 06:00 to 20:00 hrs.
6
10 10
13 11
-9
-6
-2
9%
14% 14% 15% 13%
-13%
-45%
-11%
2007 2008 2009 2010 2011 2012 Mar/12 Mar/13
Megavisión has seen a drop in its revenues and net income in 2012 with respect
to 2011
– This is explained by a drop in average home ratings from 7.7 to 6.6 points
that impacted revenues (decrease of 19%) and an increase in costs due to
a more expensive programming lineup (increase of 12%)
The drop in ratings was experienced both in prime(1) (from 9.9 to 8.1 points) and
off prime(1) (from 6.8 to 6.0 points)
– The drop in ratings is explained in large part by the market share captured
by Canal 13 in prime time and the underperformance of Megavisión
programming including the late night soap opera “Maldita”
In the second quarter of 2013, Megavisión has had success with third party
programming such as “Pablo Escobar” and “El Barco”, which should translate to
an increase in revenues in upcoming quarters
Megavisión recently purchased the transmission rights for football matches of the
Chilean national team for US$106 mm for the 2014 - 2018 world cup campaign,
as well as the transmission rights for the Champions League 2014 – 2017
Overview Revenues and Rating (US$ mm and points of rating)
Net Income and Net Income Margin (US$ mm and %)
EBITDA and EBITDA Margin (US$ mm and %)
68 75 74
90 84
68
13 17
9.0 9.3 8.6 8.3 7.7
6.6
2007 2008 2009 2010 2011 2012 Mar/12 Mar/13
7.5 8.1 8.6 10.9 10.9 10.3
Revenues / Rating (US$ mm per Point of Rating)
Gross margin dropped from 32%
in 2011 to 6% in 2012
12

25% 23% 23% 21%
8%
Canal 13 TVN Mega CHV Red
Compared to its peers, Megavisión has a relatively larger positioning in Off Prime and C3-D segments.
28% 26%
22%
18%
6%
Canal 13 TVN CHV Mega Red
Audience Share by Time Slot and Socio - Economic Segment
Positioning by Time Slot Prime Audience Share %
Off- Prime Audience Share %
32%
24%
20%
16%
8%
Canal 13 TVN CHV Mega Red
26% 23% 23% 21%
7%
Canal 13 TVN CHV Mega Red
Positioning by Socio-Economic Segment ABC1 – C2 (Higher Segment) Audience Share %
C3-D (Lower Segment) Audience Share %
Source: Audience share from Timelbope.
13
-19%
12%
43%
22%
46%
25%
-2%
19%
-7%
26%
35%
-4%
-19% -19% -17%
2010 2011 2012
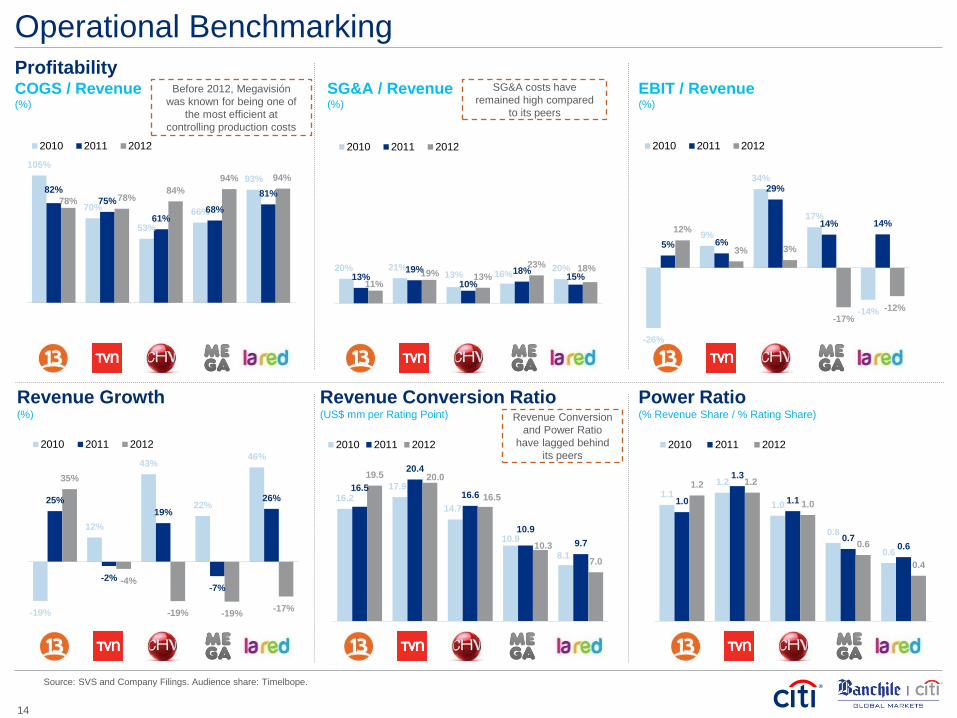
Operational Benchmarking Profitability
Revenue Conversion Ratio (US$ mm per Rating Point)
Power Ratio (% Revenue Share / % Rating Share)
16.2
17.9
14.7
10.9
8.1
16.5
20.4
16.6
10.9
9.7
19.5 20.0
16.5
10.3
7.0
2010 2011 2012
1.1
1.2
1.0
0.8
0.6
1.0
1.3
1.1
0.7 0.6
1.2 1.2
1.0
0.6
0.4
2010 2011 2012
COGS / Revenue (%)
SG&A / Revenue (%)
EBIT / Revenue (%)
105%
70%
53%
66%
93% 82%
75%
61% 68%
81% 78% 78%
84%
94% 94%
2010 2011 2012
20% 21% 13% 16%
20% 13%
19%
10%
18% 15%
11% 19% 13%
23% 18%
2010 2011 2012
-26%
9%
34%
17%
-14%
5% 6%
29%
14% 14% 12%
3% 3%
-17%
-12%
2010 2011 2012
Source: SVS and Company Filings. Audience share: Timelbope.
Before 2012, Megavisión
was known for being one of
the most efficient at
controlling production costs
SG&A costs have
remained high compared
to its peers
Revenue Conversion
and Power Ratio
have lagged behind
its peers
Revenue Growth (%)
14

5. Appendix

Latin America Media Comparables
Note: Stock prices as of July 2, 2012. Multiples calculated in local currency.
Source: Company financials and Wall Street research.
15
Stock Market Firm FV / Revenues FV / EBITDA P/E CAGR '12 - '15E LTM EBITDA
(US$ in mm, except stock pr.) Price Cap. Value 2013E 2014E 2013E 2014E 2013E 2014E Revenue EBITDA Margin
Televisa $4.28 $12,203 $13,366 2.5x 2.3x 6.4x 6.1x 18.5x 16.8x 5.2% 2.2% 40.8%
TV Azteca 0.66 1,961 2,060 2.1 1.9 5.6 5.3 NA NA 1.6 0.6 34.7
Median -- -- -- 2.3x 2.1x 6.0x 5.7x 18.5x 16.8x 3.4% 1.4% 37.8%
Mean -- -- -- 2.3 2.1 6.0 5.7 18.5 16.8 3.4 1.4 37.8

5.1x
10.5x
16.3x
13.8x
10.9x
0.0x
7.0x
8.4x
Latin America Media Precedents
NA
Median: 10.5x
Oct-02 Oct-04 Dec-06 Oct-07 Mar-10 Aug-10 Aug-10 Dec-11
CIECSA Bancard
Inversiones
Prisa TBS Time Warner Luksic Group Time Warner Bethia
Megavisión Chilevisión Ibero-american Claxson HBO LatAm Canal 13 Chilevisión Megavisión
$29 $34 $102 $234 $1,033 $55 $155 $144
Acquiror:
Target:
Value (US$ mm):
Note: Multiple = FV / LTM EBITDA, based on public information.
Source: SDC, Bloomberg and Citi Deal Intelligence.
(1) EBITDA of Canal 13 was negative at the time of purchase, as a reference, the FV / LTM Sales as of June 2010 was 0.8x.
(1)
FV / LTM EBITDA
~
~
16

4,721 4,658
3,918
2,431 2,237
Santander Celfin MerrillLynch
BBVA
9,679
8,267 7,543
6,875
5,150 4,485
3,988
3,025 2,519
1,923
16.1%
13.7% 12.5%
11.4%
8.6% 7.5%
6.6% 5.0% 4.2% 3.2%
Celfin Santander Larraín Vial Merrill Lynch IMTrust JP Morgan Deutsche BBVA Credit Suisse
1,602 1,590
1,275 1,121 1,054
IMTrust Santander Larraín Vial Celfin
3,635 3,374
3,056
2,575 2,251
Larraín Vial Celfin IMTrust Merrill Lynch
Follow-On (1)
US$ mm
IPO (1)
US$ mm
Block Trades (1)
US$ mm
: #1 Chilean Equity House of the Decade
# Deals 13 7 14 2 4 7 6 5 12 6 25 19 21 10 5
Total Issuances 2003 – 2012 YTD – Full Credit (1)
US$ mm
# Deals 38 41 17 46 8 21 7 5 6 2
Source: Banchile Citi estimates based on public information from SVS (Chilean SEC), Santiago Stock Exchange, and companies filings.
(1) Includes transactions over US$ 20 million with a known advisor. Excludes transactions with holding companies, debt capitalization, and others that could be considered
as part of a M&A process.
#1
#1 #2
After capital markets re-opening in Chile, over US$25 bn have been placed in ECM, including IPOs, Follow-Ons
and Block Trades.
#2
17

Citi believes that sustainability is good business practice. We work closely with our clients, peer financial institutions, NGOs and other partners to finance solutions to climate change, develop industry standards, reduce our
own environmental footprint, and engage with stakeholders to advance shared learning and solutions. Highlights of Citi’s unique role in promoting sustainability include: (a) releasing in 2007 a Climate Change Position
Statement, the first US financial institution to do so; (b) targeting $50 billion over 10 years to address global climate change: includes significant increases in investment and financing of renewable energy, clean technology,
and other carbon-emission reduction activities; (c) committing to an absolute reduction in GHG emissions of all Citi owned and leased properties around the world by 10% by 2011; (d) purchasing more than 234,000 MWh of
carbon neutral power for our operations over the last three years; (e) establishing in 2008 the Carbon Principles; a framework for banks and their U.S. power clients to evaluate and address carbon risks in the financing of
electric power projects; (f) producing equity research related to climate issues that helps to inform investors on risks and opportunities associated with the issue; and (g) engaging with a broad range of stakeholders on the
issue of climate change to help advance understanding and solutions.
Citi works with its clients in greenhouse gas intensive industries to evaluate emerging risks from climate change and, where appropriate, to mitigate those risks.
efficiency, renewable energy and mitigation
© 2013 Citigroup Global Markets Inc. Member SIPC. All rights reserved. Citi and Citi and Arc Design are trademarks and service marks of Citigroup Inc. or its affiliates and are used and registered throughout the world.
IRS Circular 230 Disclosure: Citigroup Inc. and its affiliates do not provide tax or legal advice. Any discussion of tax matters in these materials (i) is not intended or written to be used, and cannot be used or relied upon, by
you for the purpose of avoiding any tax penalties and (ii) may have been written in connection with the "promotion or marketing" of any transaction contemplated hereby ("Transaction"). Accordingly, you should seek advice
based on your particular circumstances from an independent tax advisor.
In any instance where distribution of this communication is subject to the rules of the US Commodity Futures Trading Commission (“CFTC”), this communication constitutes an invitation to consider entering into a derivatives
transaction under U.S. CFTC Regulations §§ 1.71 and 23.605, where applicable, but is not a binding offer to buy/sell any financial instrument.
Any terms set forth herein are intended for discussion purposes only and are subject to the final terms as set forth in separate definitive written agreements. This presentation is not a commitment to lend, syndicate a financing, underwrite or
purchase securities, or commit capital nor does it obligate us to enter into such a commitment, nor are we acting as a fiduciary to you. By accepting this presentation, subject to applicable law or regulation, you agree to keep confidential the
information contained herein and the existence of and proposed terms for any Transaction.
Prior to entering into any Transaction, you should determine, without reliance upon us or our affiliates, the economic risks and merits (and independently determine that you are able to assume these risks) as well as the legal, tax and accounting
characterizations and consequences of any such Transaction. In this regard, by accepting this presentation, you acknowledge that (a) we are not in the business of providing (and you are not relying on us for) legal, tax or accounting advice, (b)
there may be legal, tax or accounting risks associated with any Transaction, (c) you should receive (and rely on) separate and qualified legal, tax and accounting advice and (d) you should apprise senior management in your organization as to
such legal, tax and accounting advice (and any risks associated with any Transaction) and our disclaimer as to these matters. By acceptance of these materials, you and we hereby agree that from the commencement of discussions with
respect to any Transaction, and notwithstanding any other provision in this presentation, we hereby confirm that no participant in any Transaction shall be limited from disclosing the U.S. tax treatment or U.S. tax structure of such Transaction.
We are required to obtain, verify and record certain information that identifies each entity that enters into a formal business relationship with us. We will ask for your complete name, street address, and taxpayer ID number. We may also
request corporate formation documents, or other forms of identification, to verify information provided.
Any prices or levels contained herein are preliminary and indicative only and do not represent bids or offers. These indications are provided solely for your information and consideration, are subject to change at any time without notice and are
not intended as a solicitation with respect to the purchase or sale of any instrument. The information contained in this presentation may include results of analyses from a quantitative model which represent potential future events that may or
may not be realized, and is not a complete analysis of every material fact representing any product. Any estimates included herein constitute our judgment as of the date hereof and are subject to change without any notice. We and/or our
affiliates may make a market in these instruments for our customers and for our own account. Accordingly, we may have a position in any such instrument at any time.
Although this material may contain publicly available information about Citi corporate bond research, fixed income strategy or economic and market analysis, Citi policy (i) prohibits employees from offering, directly or indirectly, a favorable or
negative research opinion or offering to change an opinion as consideration or inducement for the receipt of business or for compensation; and (ii) prohibits analysts from being compensated for specific recommendations or views contained in
research reports. So as to reduce the potential for conflicts of interest, as well as to reduce any appearance of conflicts of interest, Citi has enacted policies and procedures designed to limit communications between its investment banking and
research personnel to specifically prescribed circumstances.


![[MATERIALS Enabling DISCUSSION] Electrification](https://static.fdocuments.in/doc/165x107/61bd023461276e740b0e6ad3/materials-enabling-discussion-electrification.jpg)