auburntarl.weebly.comauburntarl.weebly.com/.../7/0/9/5/7095137/18_bardeen_et_al_2013.pdf ·...
13
1 23 Journal of Psychopathology and Behavioral Assessment ISSN 0882-2689 Volume 35 Number 4 J Psychopathol Behav Assess (2013) 35:495-505 DOI 10.1007/s10862-013-9359-0 Testing a Hierarchical Model of Distress Tolerance Joseph R. Bardeen, Thomas A. Fergus & Holly K. Orcutt
Transcript of auburntarl.weebly.comauburntarl.weebly.com/.../7/0/9/5/7095137/18_bardeen_et_al_2013.pdf ·...

1 23
Journal of Psychopathology andBehavioral Assessment ISSN 0882-2689Volume 35Number 4 J Psychopathol Behav Assess (2013)35:495-505DOI 10.1007/s10862-013-9359-0
Testing a Hierarchical Model of DistressTolerance
Joseph R. Bardeen, Thomas A. Fergus &Holly K. Orcutt

1 23
Your article is protected by copyright and all
rights are held exclusively by Springer Science
+Business Media New York. This e-offprint is
for personal use only and shall not be self-
archived in electronic repositories. If you wish
to self-archive your article, please use the
accepted manuscript version for posting on
your own website. You may further deposit
the accepted manuscript version in any
repository, provided it is only made publicly
available 12 months after official publication
or later and provided acknowledgement is
given to the original source of publication
and a link is inserted to the published article
on Springer's website. The link must be
accompanied by the following text: "The final
publication is available at link.springer.com”.
Testing a Hierarchical Model of Distress Tolerance
Joseph R. Bardeen & Thomas A. Fergus & Holly K. Orcutt
Published online: 19 June 2013# Springer Science+Business Media New York 2013
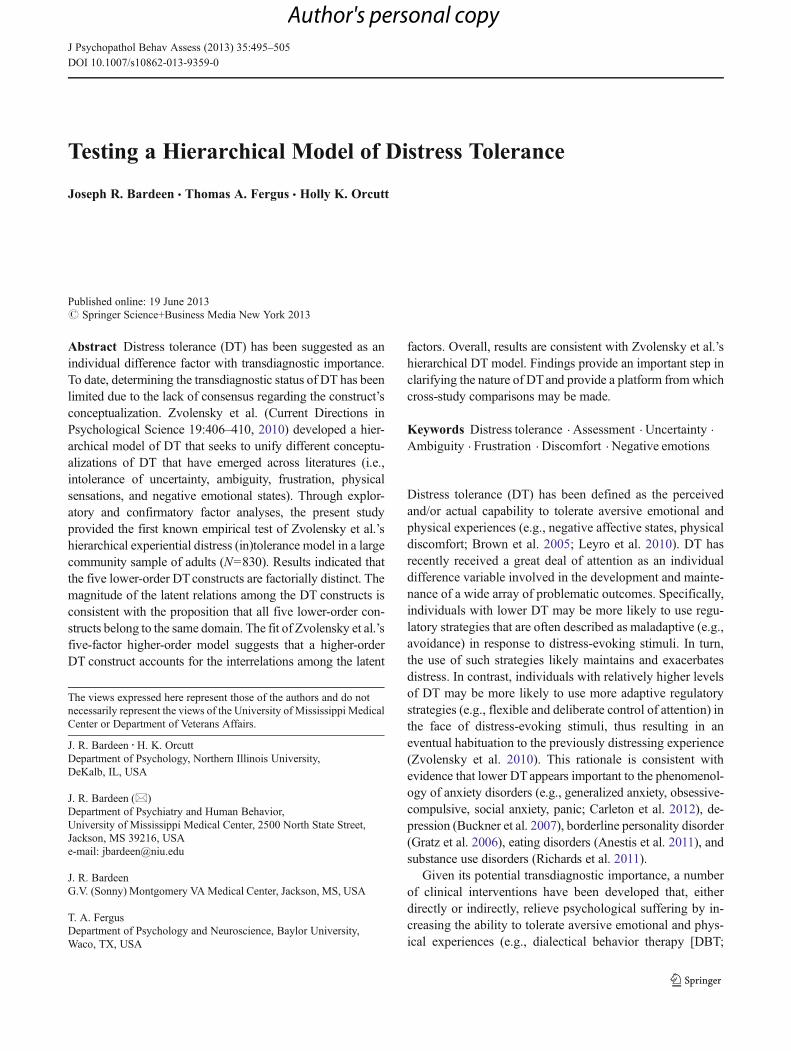
Abstract Distress tolerance (DT) has been suggested as anindividual difference factor with transdiagnostic importance.To date, determining the transdiagnostic status of DT has beenlimited due to the lack of consensus regarding the construct’sconceptualization. Zvolensky et al. (Current Directions inPsychological Science 19:406–410, 2010) developed a hier-archical model of DT that seeks to unify different conceptu-alizations of DT that have emerged across literatures (i.e.,intolerance of uncertainty, ambiguity, frustration, physicalsensations, and negative emotional states). Through explor-atory and confirmatory factor analyses, the present studyprovided the first known empirical test of Zvolensky et al.’shierarchical experiential distress (in)tolerance model in a largecommunity sample of adults (N=830). Results indicated thatthe five lower-order DTconstructs are factorially distinct. Themagnitude of the latent relations among the DT constructs isconsistent with the proposition that all five lower-order con-structs belong to the same domain. The fit of Zvolensky et al.’sfive-factor higher-order model suggests that a higher-orderDT construct accounts for the interrelations among the latent
factors. Overall, results are consistent with Zvolensky et al.’shierarchical DT model. Findings provide an important step inclarifying the nature of DTand provide a platform fromwhichcross-study comparisons may be made.
Keywords Distress tolerance . Assessment . Uncertainty .
Ambiguity . Frustration . Discomfort . Negative emotions
Distress tolerance (DT) has been defined as the perceivedand/or actual capability to tolerate aversive emotional andphysical experiences (e.g., negative affective states, physicaldiscomfort; Brown et al. 2005; Leyro et al. 2010). DT hasrecently received a great deal of attention as an individualdifference variable involved in the development and mainte-nance of a wide array of problematic outcomes. Specifically,individuals with lower DT may be more likely to use regu-latory strategies that are often described as maladaptive (e.g.,avoidance) in response to distress-evoking stimuli. In turn,the use of such strategies likely maintains and exacerbatesdistress. In contrast, individuals with relatively higher levelsof DT may be more likely to use more adaptive regulatorystrategies (e.g., flexible and deliberate control of attention) inthe face of distress-evoking stimuli, thus resulting in aneventual habituation to the previously distressing experience(Zvolensky et al. 2010). This rationale is consistent withevidence that lower DTappears important to the phenomenol-ogy of anxiety disorders (e.g., generalized anxiety, obsessive-compulsive, social anxiety, panic; Carleton et al. 2012), de-pression (Buckner et al. 2007), borderline personality disorder(Gratz et al. 2006), eating disorders (Anestis et al. 2011), andsubstance use disorders (Richards et al. 2011).
Given its potential transdiagnostic importance, a numberof clinical interventions have been developed that, eitherdirectly or indirectly, relieve psychological suffering by in-creasing the ability to tolerate aversive emotional and phys-ical experiences (e.g., dialectical behavior therapy [DBT;
The views expressed here represent those of the authors and do notnecessarily represent the views of the University of Mississippi MedicalCenter or Department of Veterans Affairs.
J. R. Bardeen :H. K. OrcuttDepartment of Psychology, Northern Illinois University,DeKalb, IL, USA
J. R. Bardeen (*)Department of Psychiatry and Human Behavior,University of Mississippi Medical Center, 2500 North State Street,Jackson, MS 39216, USAe-mail: [email protected]
J. R. BardeenG.V. (Sonny) Montgomery VAMedical Center, Jackson, MS, USA
T. A. FergusDepartment of Psychology and Neuroscience, Baylor University,Waco, TX, USA
J Psychopathol Behav Assess (2013) 35:495–505DOI 10.1007/s10862-013-9359-0
Author's personal copy

Linehan 1993], acceptance and commitment therapy [ACT;Hayes et al. 1999], Unified Protocol [Barlow et al. 2004]). Inparticular, a brief treatment (6 sessions) specifically designedto increase DT was shown to be effective in significantlyreducing depressive symptoms in patients with substance usedisorders in a residential treatment program (Bornovalovaet al. 2012). Moreover, the brief DT treatment, in comparisonto supportive counseling and treatment-as-usual, evidencedhigher rates of clinically significant improvement in DT(Bornovalova et al. 2012).
Despite its clinical utility and potential transdiagnosticimportance, at present, there is a lack of consensus regardingthe conceptualization of DT. In one study, McHugh and Otto(2012) used a largely data-driven approach in an attempt toclarify the conceptualization of the DT construct. These re-searchers developed a 10-item measure that purportedlyassesses the core construct of DT. The items for this measurewere identified through both an exploratory and confirmatoryfactor analysis (EFA, CFA, respectively) of four existingmeasures that McHugh and Otto contended were representa-tive of the range of DT constructs. These measures assessedintolerance of frustration, physical discomfort, negative emo-tions, and anxiety sensitivity. Although informative, McHughand Otto’s conceptualization of DT diverges from other con-ceptualizations of DT found in the existing literature in anumber of important ways. For example, the bulk of the items(i.e., six) in McHugh and Otto’s 10-item measure assessintolerance of negative emotions, which, as is described inmore detail below, is conceptualized as just one-of-the-fivecore dimensions of DT in other conceptual models (Zvolenskyet al. 2010). Moreover, McHugh and Otto suggested anxietysensitivity as a component of DT, whereas other researchersview anxiety sensitivity as being distinct fromDT (Leyro et al.2010). The distinctiveness of anxiety sensitivity from DT issupported by empirical research showing differential concur-rent relations between these constructs and anxiety-relatedsensations and behaviors (Bonn-Miller et al. 2009), as wellas substance use behaviors (Zvolensky et al. 2009).
In an alternative conceptualization of DT, Zvolensky et al.(2010) identified five core dimensions of DT based on Leyroet al.’s (2010) theoretical review of the extant DT literature.These five dimensions are indicative of intolerance of dis-tinct types of emotional and/or physical experiences, includ-ing (a) uncertainty, (b) ambiguity, (c) frustration, (d) physicaldiscomfort, and (e) negative emotion. These dimensions arebriefly presented below to orient readers to the operationaldefinition of each dimension. Readers interested in a morein-depth review of these five dimensions should refer toLeyro et al.’s review.
Dugas and Robichaud (2007) defined intolerance of un-certainty as “a dispositional characteristic resulting fromnegative beliefs about uncertainty and its implications”(p. 24). Individuals with relatively high levels of intolerance
of uncertainty dislike uncertainty to such an extent that theyprefer known negative outcomes to uncertain ones (Dugaset al. 2004). Intolerance of ambiguity has been defined as theinability to tolerate stimuli perceived as complex, vague, orsubject to more than one conflicting interpretation (McLain1993). Intolerance of frustration is an individual differencevariable that largely originated from Harrington’s (2005)Frustration-Discomfort Scale. Harrington’s measure assessesthe perceived capacity for withstanding frustration in thecontexts of (a) instant gratification and fairness, (b) the easeof life, (c) achievement/tasks, and (d) negative emotions.Intolerance of physical discomfort has been conceptualizedas the perceived inability to withstand uncomfortable bodilysensations (Schmidt et al. 2006). As noted by Leyro et al.,discomfort intolerance refers to bodily sensations that areuncomfortable, rather than being specific to one type ofinternal stimuli (e.g., pain tolerance, anxiety sensitivity).Finally, intolerance of negative emotion is an individual dif-ference variable that originated from Simons and Gaher’s(2005) measure of DT, which Leyro et al. contend best cap-tures one’s perceived capacity for tolerating negative emotionsthat result from aversive cognitive or physical processes.
Within Zvolensky et al.’s (2010) conceptualization of DT,a higher-order factor, labeled “experiential (in)tolerance,” isviewed as a common uniting factor among the five DTdimensions presented above. In other words, although thetype of distress represented in these DT dimensions maydiffer, all of the dimensions share the overarching theme ofdifferences in the ability to tolerate experiential distress. Thiscommon uniting factor purportedly accounts for the interre-lations among the five DT dimensions. Unfortunately, de-spite its promise for helping to clarify our understanding ofthe DT construct, the tenability of Zvolensky et al.’s hierar-chical model has yet to be examined in the extant literature.The lack of empirical data surrounding Zvolensky et al.’smodel represents a significant gap in the literature, as it isdifficult to compare competing models of DT when thestructure of one of the models has yet to be validated.Moreover, clarifying the nature of DT through empiricalresearch is necessary for determining its transdiagnosticimportance. For example, as noted, intolerance of uncertaintyand intolerance of negative emotional states both are concep-tualized by Zvolensky et al. as distinct dimensions of DT.However, these two dimensions have historically been exam-ined within separate literatures. Specifically, intolerance ofuncertainty has been most commonly examined in relationto generalized anxiety disorder and obsessive-compulsive dis-order, whereas intolerance of negative emotional states hasbeen most commonly examined in relation to borderline per-sonality disorder and substance-related problems (Leyro et al.2010). The result of isolating relations between certain puta-tive DT dimensions and specific forms of psychopathology isa literature base from which one is unable to compare across
496 J Psychopathol Behav Assess (2013) 35:495–505
Author's personal copy
studies. Validating the structure of Zvolensky et al.’s modelcan help increase confidence that different dimensions of DTare in fact representative of the same overarching construct.
The Present Study
The present study sought to provide the first known empir-ical test of Zvolensky et al.’s (2010) hierarchical experientialdistress (in)tolerance model. Before testing the higher-ordermodel, an EFAwas used to confirm the distinctiveness of thefive lower-order dimensions. Confirming the distinctivenessamong the lower-order dimensions is especially importantbecause “the extent to which various measures of distresstolerance genuinely measure the same underlying constructremains unclear” (Richards et al. 2011, p. 184). Moreover,researchers have questioned whether some of the dimensionswithin Zvolensky et al.’s model are in fact distinguishable.For example, the operational definitions of intolerance ofuncertainty and intolerance of ambiguity are similar andhave often been used interchangeably (Grenier et al. 2005).Next, a higher-order CFA approach was used to confirm thefindings from the EFA and test whether an overarchinggeneral factor accounted for the interrelations among thelower-order DT dimensions. As noted by Brown (2006), “agoal of higher order factor analysis is to provide a moreparsimonious account for the correlations among lower orderfactors” (p. 321). Given that all five lower-order DT dimen-sions are putatively distinct (Leyro et al. 2010), but belong tothe same domain, we predicted that the five DT dimensionswould be factorially distinguishable, but would all signifi-cantly correlate. Following Zvolensky et al.’s model, wefurther predicted that a higher-order experiential distress(in)tolerance construct would account for the interrelationsamong the latent DT dimensions.
Method
Participants
Participant recruitment took place using Amazon MechanicalTurk, an online labor market where researchers can recruitcommunity adults to complete questionnaires in exchange forpayment. Participants (N=993) completed the informed con-sent process via a secure online survey program. Of these, 24participants failed to provide enough item-level responses tocalculate any of the variables of interest, and thus, were re-moved from the sample. The quality of data collected viaAmazon Mechanical Turk has been demonstrated in a numberof studies (e.g., Behrend et al. 2011; Buhrmester et al. 2011;Paolacci et al. 2010). However, to allay concerns regarding dataquality, and ensure participants were being attentive, three
catch questions were embedded in the online survey (e.g.,“While watching television, have you ever had a fatal heartattack?, Please select ‘Much’ if you are paying attention rightnow.”; Oppenheimer et al. 2009; Paolacci et al. 2010).Approximately 14 % (n=139) of the reduced sample (n=969)failed to meet our a-priori benchmark of answering two-out-ofthree catch questions correctly (Bardeen, Fergus, Orcutt, inpress) and were thus excluded from the present study. The finalsample (N=830) was 60.5 % female and had an average age of34.1 years (SD=12.5). In regard to race, 81.2 % of the sampleself-identified asWhite, 6.7% as Black, 6.4% as Asian, 1% asAmerican Indian or Alaska Native, 2.9 % endorsed “other”,while 1.8 % preferred not to respond. Additionally, 6.9 % ofparticipants identified as Hispanic.
To conduct the proposed analyses (EFA and CFA), thesample was randomly halved. Sample 1 (n=415) was 60.5 %female and had an average age of 33.9 years (SD=12.5). Inregard to race, 81.9 % of the sample self-identified as White,6.5 % as Black, 7.2 % as Asian, 1 % as American Indian orAlaska Native, 2.2 % endorsed “other”, while 1.2 % pre-ferred not to respond. Additionally, 6.5 % of participantsidentified as Hispanic. Sample 2 (n=415) was 60.5 % femaleand had an average age of 34.3 years (SD=12.6). In regard torace, 80.2 % of the sample self-identified as White, 7.0 % asBlack, 5.5 % as Asian, 1 % as American Indian or AlaskaNative, 3.6 % endorsed “other”, while 2.4 % preferred not torespond. Additionally, 7.2 % of participants identified asHispanic. Race and ethnicity were collapsed into a singledummy-coded variable (coded as White and Non-Hispanic[n=622, 74.9 %] versus all others [n=208, 25.1 %]). The twosamples did not differ significantly on age (t(828)=0.67,p=.67), race (χ2
(1)=0.10, p=.75), and gender (χ2(1)=1.83,
p=.40).
Self-Report Measures for Each Lower-Order Construct
Uncertainty
The Intolerance of Uncertainty Index-Part A (IUI-A; originalFrench version: Gosselin et al. 2008; English version:Carleton et al. 2010) is a 15-item measure that assessesintolerance of uncertainty (e.g., “I find it intolerable to haveto deal with unpredictable situations”). The IUI-A has shownadequate psychometric properties, including internal consis-tency, retest reliability over a 5-week interval, and conver-gent and discriminant validity (Carleton et al. 2010; Gosselinet al. 2008). In the present study, internal consistency for theIUI-Awas adequate (α=.96) and the IUI-A total score servedas an indicator for the uncertainty construct.
The Intolerance of Uncertainty Scale (IUS; originalFrench version: Freeston et al. 1994; English version: Buhrand Dugas 2002) is a 27-item measure of intolerance ofuncertainty. Through exploratory and confirmatory factor
J Psychopathol Behav Assess (2013) 35:495–505 497
Author's personal copy
analysis, a two-factor model of the IUS was shown to besuperior to the one-factor model (Sexton and Dugas 2009).The IUS-I dimension represents the degree to which onebelieves that uncertainty reflects poorly on them and willresult in negative outcomes (e.g., “Being uncertain meansthat a person is disorganized”) and the IUS-U dimensionrepresents the degree to which one believes that an uncertainfuture is unfair and distressing (e.g., “Uncertainty makes meuneasy, anxious, or stressed”). The two-factor IUS has dem-onstrated high internal consistency and concurrent validity(Sexton and Dugas 2009). In the present study, internalconsistency for the IUS-I and IUS-U was adequate (IUS-Iα=.96; IUS-U α=.93). and each of these scales served asindicators for the uncertainty construct.
Ambiguity
TheMultiple Stimulus Types Ambiguity Tolerance-I (MSTAT-I; McLain 1993) is a 22-item measure that assesses intoler-ance of ambiguity (e.g., “I try to avoid problems whichdon’t seem to have only one best solution”). The MSTAT-I has demonstrated adequate psychometric properties, in-cluding internal consistency and convergent and discrimi-nant validity (McLain 1993). In the present study, internalconsistency for the MSTAT-I was adequate (α=.91) and theMSTAT-I was used in the present study as an indicator forthe ambiguity construct.
The Tolerance of Ambiguity Scale—12 (TAS-12; Hermanet al. 2010), a revised version of Budner’s (1962) 16-itemTAS, is a 12-item measure that assesses intolerance of ambi-guity (e.g., “A good job is one where what is to be done andhow it is to be done are always clear”). Herman et al. contendthat their revised version of the TAS addresses limitations inBudner’s original TAS (e.g., low internal consistency); how-ever, psychometric data for the TAS-12 is limited. In thepresent study, internal consistency for the TAS-12 was ade-quate (α=.76) and the TAS-12 served as an indicator for theambiguity construct.
Physical Discomfort
The Somatosensory Amplification Scale (SSAS; Barskyet al. 1990) is a 10-item (e.g., “Even something minor, likean insect bite or splinter, really bothers me”) measure thatassesses “the tendency to experience somatic and visceralsensation as unusually intense, noxious, and disturbing”(Barsky et al. 1990, p. 323). The SSAS has shown adequatepsychometric properties, including internal consistency,retest reliability over approximately 10 weeks (Barskyet al. 1990), and convergent validity (Fergus and Valentiner2010). In the present study, internal consistency for theSSAS was adequate (α=.76) and the total score served asan indicator for the physical discomfort construct.
The Discomfort Intolerance Scale (DIS; Schmidt et al.2006) is a 5-item measure that assesses the degree to whichparticipants believe they can withstand uncomfortable bodilysensations. The DIS consists of two factors, discomfort in-tolerance (DIS-I; e.g., “I can tolerate a great deal of physicaldiscomfort”) and discomfort avoidance (DIS-A; e.g., “I takeextreme measures to avoid feeling physically uncomfort-able”). DIS-I assesses one’s ability to withstand pain anddiscomfort and DIS-A assesses the degree to which oneavoids pain and discomfort. The DIS has demonstrated ade-quate psychometric properties, including internal consisten-cy, retest reliability over approximately twelve weeks, andconvergent and discriminant validity (Schmidt et al. 2006).In the present study, internal consistency for both DIS scaleswas adequate (DIS-I α=.88; DIS-A α=.74) and the DIS-Iand DIS-A served as indicators for the physical discomfortconstruct.
Frustration
The Frustration Discomfort Scale (FDS; Harrington 2005) isa 28-item measure that assesses one’s perceived capacity forwithstanding frustration across four domains (i.e., entitle-ment [FDS-E; e.g., “I can’t stand it if other people act againstmy wishes”], discomfort intolerance [FDS-DI; e.g., “I can’tstand having to push myself at tasks”], achievement [FDS-A;e.g., “I can’t stand feeling that I’m not on top of my work”],emotional intolerance [FDS-EI]). Because items from theFDS-EI scale (e.g., “I can’t bear disturbing feelings”) aretoo closely aligned with the negative emotion construct, asmeasured via the Distress Tolerance Scale (e.g., “I can’thandle feeling distressed or upset”), FDS-EI was not usedas an indicator of the frustration tolerance construct. TheFDS has shown adequate psychometric properties, includinginternal consistency and discriminant validity (Harrington2005). In the present study, internal consistency for the threeFDS scales was adequate (FDS-E α=.87; FDS-DI α=.89;FDS-A α=.85) and each of these scales served as an indicatorfor the frustration construct.
Negative Emotion
The Distress Tolerance Scale (DTS; Simons and Gaher2005) is a 15-item measure that assesses the degree to whichparticipants believe they can withstand the distress associat-ed with negative emotional states. The DTS is made up offour factors: (1) Tolerance (i.e., the ability to tolerate nega-tive emotions [DTS-T; e.g., “Feeling distressed or upset isunbearable to me”]), (2) Appraisal (i.e., perception of nega-tive emotions as distressing [DTS-AP; e.g., “I am ashamedof myself when I feel distressed or upset”]), (3) Absorption(i.e., inability to concentrate on anything else when emotion-al distress is present [DTS-AB; e.g., “My feelings of distress
498 J Psychopathol Behav Assess (2013) 35:495–505
Author's personal copy

are so intense that they completely take over”]), and (4)Regulation (i.e., degree of effort to alleviate emotional dis-tress [DTS-R; e.g., “I’ll do anything to stop feeling distressedor upset”]). The DTS has demonstrated adequate psychomet-ric properties, including internal consistency of the total andsubscale scores, retest reliability over a 6-month period, andconvergent and discriminant validity (Simons and Gaher2005). In the present study, internal consistency for all fourDTS scales was adequate (DTS-T α=.82; DTS-AP α=.86;DTS-AB α=.86; DTS-R α=.83) and each of the four DTSscales served as an indicator for the negative emotionconstruct.
Procedure
For this institutional review board approved study, informedconsent and questionnaires were completed using a secureonline survey program. Participants were told, via informedconsent, that they would be asked to complete questionnairesrelated to mood, attention, and self-regulation if they choseto participate. Participants could complete the study fromany computer with internet access. Questionnaires werepresented in random order across participants. It took partic-ipants an average of 32.4 min (SD=20.59) to complete studyquestionnaires (participants with completion times >2.5 SDsfrom the mean were removed from this analysis [n=18]).Participants were paid $0.50 upon study completion, anamount which is consistent with precedence for payingMechanical Turk workers in similar questionnaire studies(Buhrmester et al. 2011).
Data Analytic Strategy
The EFA of the DT dimensions consisted of principal factorsextraction with oblique rotation on the respective measuresubscale scores. Although factors have often been chosenbased on having eignevalues greater than 1.0, some havesuggested that this criterion is overly restrictive, and a moreliberal eigenvalue of 0.7 should be used (Jolliffe 2002).These criteria were both used in the present study; the EFAwas run twice using each eigenvalue cut-point to identify thenumber of factors. Identification of different factor structuresallowed for a more comprehensive comparison of alternateDT models using CFA. Factor loadings were interpretedbased on Comrey and Lee’s (1992) suggestion that loadingsgreater than .71 are excellent, .63 are very good, .55 aregood, .45 are fair, and .32 are poor.
Following the EFA, a higher-order CFA approach, fol-lowing Brown (2006) and using Amos software (Version 19;Arbuckle 2010), was used to further test the latent structureof the DT construct put forth by Zvolensky et al. (2010), aswell as any competing first-order model(s) identified via theEFA. Following Brown, lower-order CFA measurement
models were initially used to confirm the fit of the first-order models before evaluating the fit of a second-ordermodel. The metric of each latent construct was set byconstraining one of the unstandardized factor loadings, be-tween the latent construct and manifest indicator, to 1.0.Indicators exhibiting unreliability (factor loadings <.32;Tabachnick and Fidell 2007) were trimmed from the models.Upon fitting an adequate first-order model, a higher orderCFA was used to test whether a second-order factor couldaccount for the latent correlations among the lower-orderconstructs. Within this model, first-order factor correlationswere removed from the baseline first-order model and directeffects from the second-order factor to each of the first-orderfactors were added. Maximum likelihood estimation wasused to test all of the CFA models.
CFA models were evaluated using standard goodness-of-fitindices, including the comparative fit index (CFI), non-normedfit index (NNFI), and root mean square error of approximation(RMSEA). For the CFI and NNFI, values >.90 indicate ade-quate fit (Bentler 1990; Jöreskog et al. 2000; Meyers et al.2006). For the RMSEA index, values <.05 indicate excellentfit, values from .05 to .08 indicate adequate fit (Browne andCudeck 1993), and values from .08 to .1 indicatemediocre/acceptable fit, whereas values >.10 indicate inade-quate fit (Meyers et al. 2006). The chi-square difference testwas used to examine whether there was a significant differencein model fit (Kline 2011). However, because chi-square differ-ence testing with large sample sizes may indicate significantdifferences when differences in parameter estimates are trivial inmagnitude (Cheung and Rensvold 2002), RMSEA 90 % con-fidence intervals (CIs) were also compared. Overlapping 90 %RMSEA CIs between models may suggest non-significant dif-ferences in model fit (Wang and Russell 2005). In addition, thechange in CFI (ΔCFI) was also examined to compare models(Kline 2011). A ΔCFI value of less than or equal to .002suggests trivial differences in model fit (Meade et al. 2008).
Results
Exploratory Factor Analysis
Four factors were extracted with eigenvalues greater than1.0 (7.04, 1.87, 1.25, 1.09) and one factor exceeded theeigenvalue threshold of .70 (.71). These five factorsaccounted for the following variance: factor 1=46.9 %,factor 2=12.5 %, factor 3=8.3 %, factor 4=7.3 %, factor5=4.8 %. The pattern of loadings for both the four-factor(only those indicators with eigenvalues>1.0) and five-factor models (indicators with eigenvalues >0.7) showedwell defined structures (see Tables 1 and 2, respectively).For the four-factor model, subscales representing intoler-ance of uncertainty and ambiguity loaded on the same factor,
J Psychopathol Behav Assess (2013) 35:495–505 499
Author's personal copy

while the remaining subscales loaded on their respectivefactors (i.e., intolerance of frustration, negative emotion,and physical discomfort). For the five-factor model, allsubscales loaded on their respective factors. Factor corre-lations for both models are presented in Table 3. Both thefour- and five-factor models from the EFAwere retained forthe subsequent CFAs.
Four-Factor Lower-Order CFA
All factors were allowed to correlate and there were nosecondary loadings. Results from the CFA indicated that allof the factor loadings were significant (ps<.001). However,one indicator exhibited unreliability (i.e., DIS-Intolerancesubscale: factor loading=.21), and thus, was trimmed from
Table 1 Factor loadings for the4-factor solution
n=415 (Sample 1). Items loadingon each factor are bolded
Factor
1 2 3 4Subscale Frustration Negative emotion Physical discomfort Uncertainty & ambiguity
IUS-I .32 .13 .03 −.53IUS-U .34 .08 −.02 −.62IUI-A .35 .17 −.04 −.55MAT −.16 .06 .03 −.88TAS .01 −.03 .05 −.68FDS-A .76 .10 −.08 .01
FDS-E .75 .02 −.02 −.23
FDS-D .53 .07 .10 −.35
DTS-R .06 .70 .01 .07
DTS-AB −.04 .90 .01 −.03
DTS-AP −.03 .82 .01 −.09
DTS-T −.06 .89 −.01 .01
DCI-A .36 .11 .46 .04
DCI-I −.18 .02 .62 −.06
SAS .44 −.04 .48 −.08
Table 2 Factor loadings for the5-factor solution
n=415 (Sample 1). Items loadingon each factor are bolded
Factor
1 2 3 4 5Subscale Uncertainty Negative emotion Ambiguity Physical discomfort Frustration
IUS-I .77 .09 .10 .05 .04
IUS-U .76 .05 .19 −.01 .09
IUI-A .56 .16 .21 −.02 .19
MAT .22 .10 .72 .03 −.06
TAS .02 −.01 .69 .05 .15
FDS-A .08 .08 −.04 −.04 .72
FDS-E .01 .01 .19 .01 .86
FDS-D .19 .07 .22 .13 .52
DTS-R −.15 .70 .03 .01 .15
DTS-AB .12 .88 −.03 .02 −.06
DTS-AP .21 .80 −.02 .02 −.09
DTS-T −.05 .88 .04 −.01 −.01
DCI-A .15 .09 −.11 .48 .23
DCI-I −.10 .03 .12 .62 −.15
SAS .24 −.06 −.05 .52 .28
500 J Psychopathol Behav Assess (2013) 35:495–505
Author's personal copy

the model. This adjustment resulted in a reduction from threeto two indicators to represent the physical discomfort con-struct. Although three indicators or more per construct ispreferable, two indicators per construct is acceptable (i.e.,just-identified; Kline 2011). The model was re-estimated andall factor loadings were adequate in size (standardized co-efficients from .47 to .94). The model fit was adequate,χ2 (71, n=415)=323.63, p<.001, RMSEA=.093 with a90 % confidence interval of .083 to .103, CFI=.94, andNNFI=.92. All of the fit indices met or exceeded the specifiedguidelines. The correlations among the latent constructs ofthis model are presented in Table 4.
Five-Factor Lower-Order CFA
All factors were allowed to correlate and there were no sec-ondary loadings. Results from the CFA indicated that all of thefactor loadings in this model were significant (ps<.001). As
above, the DIS-Intolerance subscale exhibited unreliability(i.e., factor loading=.22), and thus, was trimmed from themodel. The model was re-estimated and all factor loadingswere adequate in size (standardized coefficients from .61 to.94). The model fit was adequate, χ2 (67, N=415)=230.95,p<.001, RMSEA=.077 with a 90 % confidence interval of.066 to .088, CFI=.96, and NNFI=.95. All of the fit indicesmet or exceeded the specified guidelines. The correlationsamong the latent constructs of this model are presented inTable 4.
When comparing the four- and five-factor lower-ordermodels, all of the fit indices were more favorable for thefive-factor model relative to the four-factor mode. Moreover,chi-square difference testing, χ2D=92.68 (df=4, p<.001)and a ΔCFI>.002, suggested that the five-factor modelprovided a significantly better fit to the data in comparisonto the four-factor model. However, overlapping 90 %RMSEA CIs were observed, thus suggesting the possibilityof a non-significant difference in model fit. Overall, based onthe model comparisons, the five-factor model was consid-ered to provide a significantly better fit to the data in com-parison to the four-factor model.
One-Factor Lower-Order CFA
Amore parsimonious one-factor lower-order model, consistingof all of the DT indicators loading on a single latent con-struct, was also considered. None of the fit indices met orexceeded the specified guidelines, χ2 (77, n=415)=1580.28,p<.001, RMSEA=.217 with a 90 % confidence interval of.208 to .227, CFI=.63, and NNFI=.56. In addition, chi-squaredifference testing, as well as evidence of non-overlapping90 % RMSEA CIs and ΔCFIs>.002, indicated that boththe five-factor [χ2D=1349.33 (df=10, p<.001)] and four-factor [χ2D=1256.65 (df=6, p<.001)] lower-order modelsprovided a significantly better fit to the data in comparison tothe one-factor model. Based on the tested lower-order CFAmodels, the five-factor model was retained for the subse-quent higher-order CFA.
Higher-Order CFA
The higher-order CFA provided an adequate fit to the data,χ2 (72, n=415)=246.03, p<.001, RMSEA=.076 with a90 % confidence interval of .066 to .087, CFI=.96, andNNFI=.95. All of the fit indices met or exceeded the spec-ified guidelines. As seen in Fig. 1, the factor loadings on thehigher-order factor were all significant (p<.001). The chi-square difference test, χ2D=15.08 (df=5, p<.05), indicatedthat the five-factor first-order model provided a significantlybetter fit to the data compared to the higher-order model;however, as mentioned above, the chi-square difference testis prone to type I error when used in large samples. Further,
Table 3 Factor correlations among factors of both the four and five-factor models from exploratory factor analysis
Four-factor model 1 2 3 4
1. Uncertainty/ambiguity –
2. Frustration −.49 –
3. Negative emotion −.50 .36 –
4. Physical discomfort −.30 .20 .26 –
Five factor model 1 2 3 4 5
1. Uncertainty –
2. Ambiguity .45 –
3. Frustration .59 .30 –
4. Negative emotion .43 .37 .33 –
5. Physical discomfort .28 .27 .23 .24 –
n=415 (Sample 2)
Table 4 Latent correlations among factors of both the four and five-factor models
Four-factor model 1 2 3 4
1. Uncertainty/ambiguity –
2. Frustration .75 –
3. Negative emotion .46 .37 –
4. Physical discomfort .72 .67 .26 –
Five factor model 1 2 3 4 5
1. Uncertainty –
2. Ambiguity .69 –
3. Frustration .75 .51 –
4. Negative emotion .46 .39 .37 –
5. Physical discomfort .71 .50 .67 .26 –
n=415 (Sample 2). All coefficients are statistically significant atp<.001
J Psychopathol Behav Assess (2013) 35:495–505 501
Author's personal copy

the fit indices from the higher-order model were comparableto the five-factor lower-order model. Finally, the overlapping90 % RMSEA CIs and the ΔCFI<.002 suggested a non-significant difference in fit between the two models. Overall,the higher-order CFA did not appear to provide a significantdecrement in model fit relative to the five-factor first-ordermodel.
Discussion
Researchers have suggested DT as an individual differencefactor with transdiagnostic importance (e.g., Leyro et al.2010; McHugh and Otto 2012; Zvolensky et al. 2010).However, several different measures, representing conceptu-ally distinct constructs, have been used to represent DT in theextant literature. Although a great deal of evidence suggeststhat these various constructs play a role in the maintenance ofa wide variety of problematic outcomes, to the extent thatthese constructs do not represent the same higher-order DTconstruct, an argument for the trandiagnostic status of DTwould not be particularly compelling. In other words, thecurrent lack of consensus regarding the conceptualization ofDT makes it difficult to compare findings across studies anddetermine the transdiagnositic status of the DT construct. Onthe basis of this rationale, Zvolensky et al. provided a modelof DT that clearly specifies the content domain of the
construct. However, the tenability of Zvolensky et al.’s mod-el had yet to be empirically evaluated. The present studysought to address this gap in the extant literature by evaluat-ing Zvolensky et al.’s DT model using EFA and CFA.
Overall, results provide preliminary evidence in supportof Zvolensky et al.’s (2010) hierarchical experiential distress(in)tolerance model. First, as predicted, results indicated thatthe five DT constructs are factorially distinct, and thus, bestconceptualized as unique dimensions of DT. In addition, anexamination of correlations among the lower-order DT con-structs showed that all five lower-order constructs weresignificantly correlated, with medium to large effects for allassociations. The magnitude of the latent relations among theDT constructs is consistent with the proposition that all fivelower-order constructs belong to the same domain. Further,the fit of the higher-order model suggests that the higher-order experiential distress (in)tolerance model accounted forthe interrelations among Zvolensky et al.’s five DT dimen-sions. Overall, these results are consistent with Zvolenskyet al.’s DT model, in which each of the five identified DTdimensions share the overarching theme of difficulties toler-ating experiential distress.
The present findings provide an important step in under-standing the nature of DT. As described by Leyro et al.(2010), “explicating the nomological net of distress tolerancewill facilitate a clearer understanding of its shared and/orunique role in the development and maintenance of
Uncertainty Physical Discomfort
FDS-A
FDS-E
FDS-D
DTS-R
DTS-AB
DTS-AP
DTS-T
DCI-A
SAS MAT TAS IUS
- I
IUS-U
IUI-A
Negative Emotion
Frustration Ambiguity
Global Distress
Tolerance
.96.71 .7
8 .47.75
.63
.72.88
.86.90.73
.86
.94
.77
.65
.88
.94 .90 .92
Fig. 1 Factor loadings on the higher-order experiential distress intolerance model (Zvolensky et al. 2010)
502 J Psychopathol Behav Assess (2013) 35:495–505
Author's personal copy

psychopathology” (p. 592). With the present results helpingto further inform our understanding of the latent structure ofDT, an important next step is to complete prospective re-search examining relations among, as well as the incrementalcontribution between, the hierarchical experiential distress(in)tolerance construct and theoretically related constructs(e.g., anxiety sensitivity, experiential avoidance, emotiondysregulation) in predicting various forms of psychopatholo-gy. Clarifying relations among DT and related constructs willallow researchers to further expand the nomological networkof regulatory processes underlying psychopathology.
In addition to examining Zvolensky et al.’s (2010) over-arching distress (in)tolerance construct, it will be importantto examine differential relations of the lower-order factors tovarious forms of psychopathology, as well as examiningtheir incremental contribution. To date, specific lower-orderDT constructs seem to be examined almost exclusively inrelation to specific forms of psychopathology. For example,as noted by Leyro et al. (2010), intolerance of uncertainty hasbeen studied most often in relation to generalized anxietydisorder, discomfort intolerance has received the most atten-tion in relation to panic disorder, and intolerance of negativeemotions is examined frequently in relation to a number ofpathological conditions (e.g., borderline personality disorder,substance use disorders). Adopting this disorder-specific ap-proach does not allow for a comprehensive understanding ofthe transdiagnostic importance of each of the five DT dimen-sions targeted in the present research.
Study limitations must be acknowledged. First, our exclu-sive reliance on self-report may have resulted in inflation ofthe magnitude of relations of study variables. However, giventhe relatively large magnitude of effects, study findings shouldbe relatively robust, and thus, this assessment limitation is notlikely to have resulted in spurious effects. When possible,multiple measures were used to assess Zvolensky et al.’s(2010) five DT dimensions. Unfortunately, only a single mea-sure was identified to assess certain dimensions (e.g., intoler-ance of frustration). As such, it is possible that idiosyncrasiesof particular operationalizations of the targeted dimensionsmight have impacted observed relations. Moreover, measure-ment selection largely paralleled suggestions made by Leyroet al. (2010), with the exception of the intolerance of ambigu-ity dimension. The measures of this DT dimension reviewedby Leyro et al. generally evidenced poor reliability (internalconsistency) or were too lengthy to be included in the presentquestionnaire battery. As such, replication of the present re-sults using measures reviewed by Leyro et al. to assess theintolerance of ambiguity dimension might be warranted.
Furthermore, in order to have a sufficient number of in-dicators to validate Zvolensky et al.’s (2010) higher-ordermodel, eight self-report measures were used in the presentstudy. To reduce the length of questionnaire batteries, itwould be useful to develop a relatively short self-report
measure that assesses the five dimensions of the hierarchicaldistress (in)tolerance construct. Following the approach usedby McHugh and Otto (2012) in their development of a10-item DT measure, items from measures assessing eachof the five DT dimensions could be exposed to an EFAin the pursuit of developing a relatively short, multidimen-sional, self-report measure of Zvolensky et al.’s distress(in)tolerance construct. Developing such a measure seems tobe an important step in allowing researchers to compare theutility of Zvolensky et al.’s model to competing models of DT(e.g., McHugh and Otto 2012).
One important extension of the present findings will be toinvestigate the relations of behavioral indices of DT (e.g.,cold presser task) to the hierarchical model as well as the fivelower-order constructs. Additionally, although the use of acommunity sample in the present study should be considereda relative strength, caution is warranted in generalizing studyfindings to a clinical population. To ensure generalizabilityof the present findings, future research should seek replica-tion in clinical samples. Further, in future research, it will beimportant to examine the incremental explanatory power ofthe hierarchical model in explaining individual differences incriterion commonly associated with the construct of distresstolerance (e.g., depression, anxiety).
Distress tolerance has been implicated in the maintenanceand exacerbation of a broad range of deleterious outcomes.However, to date, determining the transdiagnostic status ofDT has been limited due to the lack of consensus regardingthe conceptualization and measurement of the construct.Findings from the present study provide an important steptoward determining the transdiagnostic relevance of DT byproviding support for one of the most comprehensive modelsof DT to date. The present findings are important in clarify-ing the nature of DT, but there is still much work to be done.Importantly, validation of Zvolensky et al.’s (2010) hierar-chical experiential distress (in)tolerance model provides aplatform from which to build a nomological network ofregulatory processes underlying psychopathology.
References
Anestis, M. D., Fink, E. L., Smith, A. R., Selby, E. A., & Joiner, T. E.(2011). Eating disorders. In M. Zvolensky, A. Bernstein, & A.Vujanovic (Eds.), Distress tolerance: Theory, research, and clinicalapplications (pp. 245–260). New York: Guilford Press.
Arbuckle, J. L. (2010). Amos (Version 19.0) [Computer software].Chicago, IL: SPSS.
Bardeen, J. R. Fergus, T. A., & Orcutt, H. K. (in press). Experientialavoidance as a moderator of the relationship between anxietysensitivity and perceived stress. Behavior Therapy.
Barlow, D. H., Allen, L. B., & Choate, M. L. (2004). Toward a unifiedtreatment for emotional disorders. Behavior Therapy, 35, 205–230.
J Psychopathol Behav Assess (2013) 35:495–505 503
Author's personal copy

Barsky, A. J., Wyshak, G., & Klerman, G. L. (1990). The somatosen-sory amplification scale and its relationship to hypochondriasis.Journal of Psychiatric Research, 24, 323–334.
Behrend, T. S., Sharek, D. J., Meade, A.W., &Wiebe, E. N. (2011). Theviability of crowdsourcing for survey research. Behavior ResearchMethods, 43, 1–14.
Bentler, P. M. (1990). Comparative fit indices in structural models.Psychological Bulletin, 107, 238–246.
Bonn-Miller, M. O., Zvolensky, M. J., & Bernstein, A. (2009).Discomfort intolerance: evaluation of incremental validity forpanic-relevant symptoms using 10% carbon dioxide-enriched airprovocation. Journal of Anxiety Disorders, 23, 197–203.
Bornovalova, M. A., Gratz, K. L., Daughters, S. B., Hunt, E. D., &Lejuez, C. W. (2012). Initial RCT of a distress tolerance treatmentfor individuals with substance use disorders. Drug and AlcoholDependence, 122, 70–76.
Brown, T. A. (2006). Confirmatory factor analysis for applied re-search. New York: Guilford Press.
Brown, R. A., Lejuez, C. W., Kahler, C. W., Strong, D. R., &Zvolensky, M. J. (2005). Distress tolerance and early smokinglapse. Clinical Psychology Review, 25, 713–733.
Browne, M. W., & Cudeck, R. (1993). Alternative ways of assessingmodel fit. In K. Bollen & J. Long (Eds.), Testing structuralequation models (pp. 136–162). Newbury Park, CA: Sage.
Buckner, J. D., Keough, M. E., & Schmidt, N. B. (2007). Problematicalcohol and cannabis use among young adults: the roles of depres-sion and discomfort and distress tolerance. Addictive Behaviors,32, 1957–1963.
Budner, S. (1962). Intolerance of ambiguity as a personality variable.Journal of Personality, 30, 29–50.
Buhr, K., & Dugas, M. J. (2002). The intolerance of uncertainty scale:psychometric properties of the English version. Behaviour Researchand Therapy, 40, 931–945.
Buhrmester, M., Kwang, T., & Gosling, S. D. (2011). Amazon’sMechanical Turk: a new source of inexpensive, yet high quality,data? Perspectives on Psychological Science, 6, 3–5.
Carleton, R. N., Gosselin, P., & Asmundson, G. J. G. (2010). Theintolerance of uncertainty index: replication and extension withan English sample. Psychological Assessment, 22, 396–406.
Carleton, R. N., Mulvogue, M. K., Thibodeau, M. A., McCabe, R.,Antony, M. M., & Asmundson, G. J. G. (2012). Increasinglycertain about uncertainty: intolerance of uncertainty across anxietyand depression. Journal of Anxiety Disorders, 26, 468–479.
Cheung, G. W., & Rensvold, R. B. (2002). Evaluating goodness-of-fitindexes for testing measurement invariance. Structural EquationModeling, 9, 233–255.
Comrey, A. L., & Lee, H. B. (1992). A first course in factor analysis(2nd ed.). Hillsdale, NJ: Lawrence Erlbaum Associates.
Dugas, M. J., & Robichaud, M. (2007). Cognitive-behavioral treatmentfor generalized anxiety disorder: From science to practice. NewYork: Routledge.
Dugas, M. J., Buhr, K., & Ladouceur, R. (2004). The role of intoleranceof uncertainty in the etiology and maintenance of generalizedanxiety disorder. In R. Heimberg, C. Turk, & D. Mennin (Eds.),Generalized anxiety disorder: advances in research and practice(pp. 143–163). New York: Guilford Press.
Fergus, T. A., & Valentiner, D. P. (2010). Disease phobia and disease convic-tion are separate dimensions underlying hypochondriasis. Journal ofBehavior Therapy and Experimental Psychiatry, 41, 438–444.
Freeston, M. H., Rheaume, J., Letarte, H., Dugas, M. J., & Ladouceur,R. (1994). Why do people worry? Personality and IndividualDifferences, 17, 791–802.
Gosselin, P., Ladouceur, R., Evers, A., Laverdiere, A., Routhier, S., &Tremblay-Picard, M. (2008). Evaluation of intolerance of uncer-tainty: development and validation of a new self-report measure.Journal of Anxiety Disorders, 22, 1427–1439.
Gratz, K. L., Rosenthal, M. Z., Tull, M. T., Lejuez, C. W., & Gunderson, J.G. (2006). An experimental investigation of emotion dysregulation inborderline personality disorder. Journal of Abnormal Psychology,115, 850–855.
Grenier, S., Barrette, A., & Ladouceur, R. (2005). Intolerance of uncer-tainty and intolerance of ambiguity: similarities and differences.Personality and Individual Differences, 39, 593–600.
Harrington, N. (2005). The frustration discomfort scale: development andpsychometric properties. Clinical Psychology & Psychotherapy, 12,374–387.
Hayes, S. C., Strosahl, K., & Wilson, K. G. (1999). Acceptance andcommitment therapy: An experiential approach to behaviorchange. New York, NY: Guilford Press.
Herman, J. L., Stevens, M. J., Bird, A., Mendenhall, M., & Oddou, G.(2010). The tolerance for ambiguity scale: towards a more refinedmeasure for international management research. InternationalJournal of Intercultural Relations, 34, 58–65.
Jolliffe, I. T. (2002). Principal component analysis (2nd ed.). NewYork: Springer.
Jöreskog, K. G., Sörbom, D., du Toit, S., & du Toit, M. (2000).LISEREL 8: new statistical features (2nd ed.). Chicago, IL:Scientific Software International.
Kline, R. B. (2011). Principles and practice of structural equationmodeling (3rd ed.). New York: Guilford Press.
Leyro, T. M., Zvolesnky, M. J., & Bernstein, A. (2010). Distresstolerance and psychopathological symptoms and disorders: a re-view of the empirical literature among adults. PsychologicalBulletin, 136, 576–600.
Linehan, M. M. (1993). Cognitive-behavioral treatment of borderlinepersonality disorder. New York, NY: Guilford Press.
McHugh, K. R., & Otto, M. W. (2012). Refining the measurement ofdistress intolerance. Behavior Therapy, 43, 641–651.
McLain, D. L. (1993). The MSTAT-I: a new measure of an individual’stolerance for ambiguity. Educational and Psychological Measurement,53, 183–189.
Meade, A. W., Johnson, E. C., & Braddy, P. W. (2008). Power andsensitivity of alternative fit indices in tests of measurement invari-ance. Journal of Applied Psychology, 93, 568–592.
Meyers, L. S., Gamst, G., & Guarino, A. (2006). Applied multivariateresearch: Design and interpretation. Thousand Oaks, CA: SagePublishers.
Oppenheimer, D. M., Meyvis, T., & Davidenko, N. (2009).Instructional manipulation checks: detecting satisficing to increasestatistical power. Journal of Experimental Social Psychology, 45,867–872.
Paolacci, G., Chandler, J., & Ipeirotis, P. G. (2010). Running experi-ments on Amazon Mechanical Turk. Judgment and DecisionMaking, 5, 411–419.
Richards, J. M., Daughters, S. B., Bornovalova, M. A., Brown, R. A., &Lejuez, C. W. (2011). Substance use disorders. In M. Zvolensky,A. Bernstein, & A. Vujanovic (Eds.), Distress tolerance: Theory,research, and clinical applications (pp. 171–197). New York:Guilford Press.
Schmidt, N. B., Richey, J. A., & Fitzpatrick, K. K. (2006).Discomfort intolerance: development of a construct and mea-sure relevant to panic disorder. Journal of Anxiety Disorders,20, 263–280.
Sexton, K., & Dugas, M. J. (2009). Defining distinct negativebeliefs about uncertainty: validating the factor structure of theintolerance of uncertainty scale. Psychological Assessment,21, 176–186.
Simons, J., & Gaher, R. (2005). The distress tolerance scale: develop-ment and validation of a self-report measure. Motivation andEmotion, 29, 83–102.
Tabachnick, B. G., & Fidell, L. S. (2007). Using multivariate statistics(5th ed.). Boston: Allyn & Bacon.
504 J Psychopathol Behav Assess (2013) 35:495–505
Author's personal copy

Wang, M., & Russell, S. S. (2005). Measurement equivalence of the jobdescriptive index across Chinese and American workers: resultsfrom confirmatory factor analysis and item response theory.Educational and Psychological Measurement, 65, 709–732.
Zvolensky, M. J., Marshall, E. C., Johnson, K., Hogan, J., Bernstein, A.,& Bonn-Miller, M. O. (2009). Relations between anxiety sensitiv-ity, distress tolerance, and fear reactivity to bodily sensations to
coping and conformity marijuana use motives among young adultmarijuana users. Experimental and Clinical Psychopharmacology,17, 31–42.
Zvolensky, M. J., Vujanovic, A. A., Bernstein, A., & Leyro, T. (2010).Distress tolerance: theory, measurement, and relations to psycho-pathology. Current Directions in Psychological Science, 19, 406–410.
J Psychopathol Behav Assess (2013) 35:495–505 505
Author's personal copy