
Debt Intolerance
74
Debt Intolerance In this paper we argue that history matters: that a country’s record at meeting its debt obligations and managing its macroeconomy in the past is relevant to forecasting its ability to sustain moderate to high levels of indebtedness, both domestic and internal, for many years into the future. We introduce the concept of “debt intolerance” (drawing an analogy to, for example, “lactose intolerance”), which manifests itself in the extreme duress many emerging market economies experience at overall debt lev- els that would seem quite manageable by the standards of the advanced industrial economies. For external debt, “safe” thresholds for highly debt- intolerant emerging markets appear to be surprisingly low, perhaps as low as 15 to 20 percent of GNP in many cases, and these thresholds depend heavily on the country’s record of default and inflation. Debt intolerance is indeed intimately linked to the pervasive phenomenon of serial default that has plagued so many countries over the past two centuries. Debt- intolerant countries tend to have weak fiscal structures and weak financial systems. Default often exacerbates these problems, making these same countries more prone to future default. Understanding and measuring debt intolerance is fundamental to assessing the problems of debt sustainabil- ity, debt restructuring, and capital market integration, and to assessing the scope for international lending to ameliorate crises. 1 CARMEN M. REINHART International Monetary Fund KENNETH S. ROGOFF International Monetary Fund MIGUEL A. SAVASTANO International Monetary Fund The opinions expressed in this paper are those of the authors and do not necessarily represent the views of the International Monetary Fund. The authors would like to thank Morris Goldstein, Harold James, Jens Nystedt, Vincent Reinhart, Christopher Sims, and John Williamson for useful comments and suggestions. Ethan Ilzetzki, Kenichiro Kashi- wase, and Yutong Li provided excellent research assistance.
description
Debt Intolerance
Transcript of Debt Intolerance
Debt Intolerance
In this paper we argue that history matters: that a country’s record atmeeting its debt obligations and managing its macroeconomy in the pastis relevant to forecasting its ability to sustain moderate to high levels ofindebtedness, both domestic and internal, for many years into the future.We introduce the concept of “debt intolerance” (drawing an analogy to,for example, “lactose intolerance”), which manifests itself in the extremeduress many emerging market economies experience at overall debt lev-els that would seem quite manageable by the standards of the advancedindustrial economies. For external debt, “safe” thresholds for highly debt-intolerant emerging markets appear to be surprisingly low, perhaps as lowas 15 to 20 percent of GNP in many cases, and these thresholds dependheavily on the country’s record of default and inflation. Debt intoleranceis indeed intimately linked to the pervasive phenomenon of serial defaultthat has plagued so many countries over the past two centuries. Debt-intolerant countries tend to have weak fiscal structures and weak financialsystems. Default often exacerbates these problems, making these samecountries more prone to future default. Understanding and measuring debtintolerance is fundamental to assessing the problems of debt sustainabil-ity, debt restructuring, and capital market integration, and to assessing thescope for international lending to ameliorate crises.
1
C A R M E N M . R E I N H A R TInternational Monetary Fund
K E N N E T H S . R O G O F FInternational Monetary Fund
M I G U E L A . S A V A S T A N OInternational Monetary Fund
The opinions expressed in this paper are those of the authors and do not necessarilyrepresent the views of the International Monetary Fund. The authors would like to thankMorris Goldstein, Harold James, Jens Nystedt, Vincent Reinhart, Christopher Sims, andJohn Williamson for useful comments and suggestions. Ethan Ilzetzki, Kenichiro Kashi-wase, and Yutong Li provided excellent research assistance.
1440-01 BPEA/Reinhart 07/17/03 08:10 Page 1
Certainly, the idea that factors such as sound institutions and a historyof good economic management affect the interest rate at which a countrycan borrow is well developed in the theoretical literature. Also well estab-lished is the notion that, as its external debt rises, a country becomes morevulnerable to being suddenly shut out of international capital markets,that is, to suffer a debt crisis.1 However, there has to date been no attemptto make these abstract theories operational by identifying the factors (inparticular, a history of serial default or restructuring) that govern howquickly a country becomes vulnerable to a debt crisis as its external obli-gations accumulate. One goal of this paper is to quantify this debt intoler-ance, drawing on a history of adverse credit events going back to the1820s. We argue that a country’s current level of debt intolerance can beapproximated empirically as the ratio of the long-term average of itsexternal debt (scaled by GNP or exports) to an index of default risk. Werecognize that other factors, such as the degree of dollarization, indexa-tion to inflation or short-term interest rates, and the maturity structure of acountry’s debt, are also relevant to assessing a country’s vulnerability tosymptoms of debt intolerance.2 We argue, however, that in general thesefactors are different manifestations of the same underlying institutionalweaknesses. Indeed, unless these weaknesses are addressed, the notionthat the “original sin” of serial defaulters can be extinguished throughsome stroke of financial engineering, allowing these countries to borrowin the same amounts, relative to GNP, as more advanced economies,much less at the same interest rates, is sheer folly.3
The first section of the paper gives a brief overview of the history ofserial default on external debt, showing that it is a remarkably pervasiveand enduring phenomenon: the European countries set benchmarks, cen-turies ago, that today’s emerging markets have yet to surpass. For exam-ple, Spain defaulted on its external debt thirteen times between 1500 and1900, whereas Venezuela, the recordholder in our sample for the periodsince 1824, has defaulted “only” nine times. We go on to show how coun-
2 Brookings Papers on Economic Activity, 1:2003
1. See Obstfeld and Rogoff (1996, chapter 6).2. See Goldstein (2003) for a comprehensive discussion of these factors.3. Some analysts, such as Eichengreen, Hausmann, and Panizza (2002), have put the
blame for recurring debt cycles on the incompleteness of international capital markets andhave proposed mechanisms to make it easier for emerging market economies to borrowmore. Needless to say, our view is that the main problem for these countries is how to bor-row less. For another critical discussion of the notion of original sin, argued on differentgrounds, see Reinhart and Reinhart (2003).
1440-01 BPEA/Reinhart 07/17/03 08:10 Page 2
tries can be divided into debtors’ “clubs” and, within those clubs, more orless debt-intolerant “regions,” depending on their credit and inflation his-tory. We also develop first broad-brush measures of safe debt thresholds.The data overwhelmingly suggest that the thresholds for emerging marketeconomies with high debt intolerance are much lower than those foradvanced industrial economies or for those emerging market economiesthat have never defaulted on their external debt. Indeed, fully half of alldefaults or restructurings since 1970 took place in countries with ratios ofexternal debt to GNP below 60 percent.4
Our key finding, presented in the second section of the paper, is that acountry’s external debt intolerance can be explained by a very small num-ber of variables related to its repayment history, indebtedness level, andhistory of macroeconomic stability. Markets view highly debt-intolerantcountries as having an elevated risk of default, even at relatively lowratios of debt to output or exports. Whether markets adequately price thisrisk is an open question, but it is certainly a risk that the citizens of debt-intolerant countries should be aware of when their leaders engage inheavy borrowing.
The third section turns to the question of how debt intolerance affectsconventional calculations of debt sustainability, which typically assumecontinual market access. For debt-intolerant countries, sustaining accessto capital markets can be problematic unless debt ratios are quicklybrought down to safer levels. To assess how such “deleveraging” mightbe accomplished, we examine how, historically, emerging marketeconomies with substantial external debts have managed to work themdown. To our knowledge, this is a phenomenon that has previouslyreceived very little, if any, attention. We analyze episodes of large debtreversals, where countries’ external debt fell by more than 25 percentagepoints of GNP over a three-year period. Of the twenty-two such reversalsthat we identify for a broad group of middle-income countries since 1970,two-thirds involved some form of default or restructuring. (Throughout
Carmen M. Reinhart, Kenneth S. Rogoff, and Miguel A. Savastano 3
4. See Sims (2001) for a model that implies that an economy with low taxation and lowindebtedness may optimally repudiate its debt, or inflate at high rates, more frequently thanan economy that has inherited high levels of taxation and debt (as have some industrialeconomies). Indeed, as we shall see, and consistent with some of the predictions of thatmodel, the countries with the highest historical default probabilities, and the highest proba-bility of inflation rates above 40 percent a year, also had (on average) much lower levels ofdebt than the typical industrial economy.
1440-01 BPEA/Reinhart 07/17/03 08:10 Page 3
the paper “restructuring” denotes a recontracting of debt service paymentsat terms that are tantamount to a partial default.) Only in one case—Swaziland in 1985—was a country able to bring down a high ratio ofexternal debt to GNP solely as a result of rapid output growth.
Because history plays such a large role in our analysis, we focus pri-marily on understanding emerging market economies’ access to externalcapital markets. For most emerging markets, external borrowing has beenthe only financial game in town for much of the past two centuries, andour debt thresholds are calculated accordingly. Over the past decade or so,however, a number of emerging market economies have, for the first time,seen a rapid expansion in domestic, market-based debt, as we documentusing an extensive new data set, which we present in the paper’s fourthsection. The calculus of domestic default obviously differs from that ofdefault on external debt, and we lack sufficient historical data to investi-gate the question fully. However, we argue that a record of external debtintolerance is likely to be a good predictor of future domestic debt intoler-ance. It is certainly the case that many of the major debt crises of the pastten years have involved domestic debt, and that the countries that seem tobe experiencing domestic debt intolerance rank high on our debt intoler-ance measures.5
Finally, if serial default is such a pervasive phenomenon, why do mar-kets repeatedly lend to debt-intolerant countries to the point where therisk of a credit event—a default or a restructuring—becomes significant?Part of the reason may have to do with the procyclical nature of capitalmarkets, which have repeatedly lent vast sums to emerging marketeconomies in boom periods (which are often associated with low returns
4 Brookings Papers on Economic Activity, 1:2003
5. Some policymakers, of course, have come to recognize the problem at least since theMexican debt crisis of 1994. The academic literature has lagged behind, in part because oflack of data, but also because the theoretical connections between external and domesticdebt have not been well articulated. Nonetheless, among the participants in this debate,Ronald McKinnon merits special mention for anticipating the emergence of domestic gov-ernment debt as a problem to be reckoned with. McKinnon wrote in 1991 that “One of themost striking developments of the late 1980s was the extent to which the governments ofMexico, Argentina and Brazil went into debt domestically. Because of the cumulativeeffect of very high interest rates (over 30 percent real was not unusual) on their existingdomestic liabilities, government-debt-to-GNP ratios have been building up in an unsustain-able fashion even though most of these countries are not paying much on their debts tointernational banks. In many [developing countries], people now anticipate that govern-ments will default on its own domestic bonds—as in March 1990 with the Brazilian gov-ernment’s freeze of its own outstanding liabilities” (McKinnon, 1991, p. 6).
1440-01 BPEA/Reinhart 07/17/03 08:10 Page 4
in the industrial countries) only to retrench when adverse shocks occur,producing painful “sudden stops.”6 As for the extent to which borrowingcountries themselves are complicit in the problem, one can only concludethat, throughout history, governments have often been too short-sighted(or too corrupt) to internalize the significant risks that overborrowing pro-duces over the longer term. Moreover, in the modern era, multilateralinstitutions have been too complacent (or have had too little leverage)when loans were pouring in. Thus a central conclusion of this paper isthat, for debt-intolerant countries, mechanisms to limit borrowing, eitherthrough institutional change on the debtor side, or—in the case of externalborrowing—through changes in the legal or regulatory systems of credi-tor countries, are probably desirable.7
Debt Intolerance: Origins and Implications for Borrowing
We begin by sketching the history of debt intolerance and serialdefault, to show how this history importantly influences what “debtors’club” a country belongs to.
Debt Intolerance and Serial Default in Historical Perspective
A bit of historical context will help to explain our approach, whichdraws on a country’s long-term debt history. The basic point is that manycountries that have defaulted on their external debts have done so repeat-edly, with remarkable similarities across the cycles. For example, manyof the Latin American countries that are experiencing severe debt prob-lems today also experienced debt problems in the 1980s—and in the1930s, and in the 1870s, and in the 1820s, and generally at other times aswell. Brazil, whose debt problems have attracted much attention lately,
Carmen M. Reinhart, Kenneth S. Rogoff, and Miguel A. Savastano 5
6. The procyclicality of capital flows to developing countries has been amply docu-mented, particularly since Carlos Díaz-Alejandro called attention to the phenomenon onthe eve of the Latin American debt crisis of the 1980s (Díaz-Alejandro, 1983, 1984). For arecent and systematic review of the evidence on the procyclicality of capital flows, seeKaminsky, Reinhart, and Végh (2003).
7. The need for institutional and legal changes to help rechannel capital flows to devel-oping countries from debt toward foreign direct investment, other forms of equity, and aid,so as to prevent the recurrence of debt crises, is the central theme of Bulow and Rogoff(1990).
1440-01 BPEA/Reinhart 07/17/03 08:10 Page 5
has defaulted seven times on its external debt over the past 175 years.During that same period, Venezuela has defaulted nine times, as alreadynoted, and Argentina four times, not counting its most recent episode. Butthe problem is by no means limited to Latin America. For example,Turkey, which has been a center of attention of late, has defaulted sixtimes over the past 175 years. These same countries have at times alsodefaulted, de facto, on their internal obligations, including through highinflation or hyperinflation. On the other side of the ledger, a number ofcountries have strikingly averted outright default, or restructuring thatreduced the present value of their debt, over the decades and centuries.India, Korea, Malaysia, Singapore, and Thailand are members of thishonor roll.
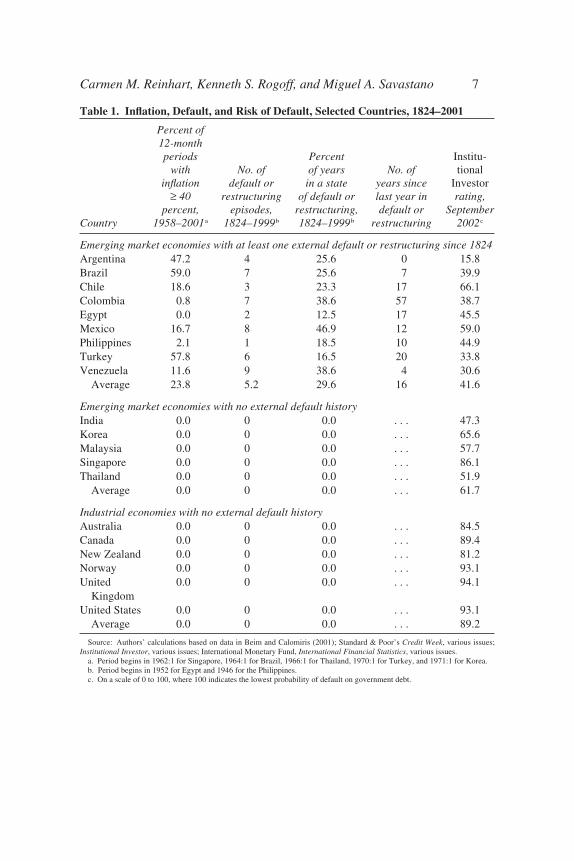
The contrast between the histories of the nondefaulters and those of theserial defaulters, summarized in table 1, is stunning. Default can becomea way of life. Over the period from 1824 to 1999, the debts of Brazil andArgentina were either in default or undergoing restructuring a quarter ofthe time, those of Venezuela and Colombia almost 40 percent of the time,and that of Mexico for almost half of all the years since its independence.On average, the serial defaulters have had annual inflation exceeding40 percent roughly a quarter of the time as well.8 By contrast, the emerg-ing market economies in the table that have no external default history donot count a single twelve-month period with inflation over 40 percentamong them. For future reference, the table also includes a sampling ofadvanced economies with no modern history of external default.
Today’s emerging markets did not invent serial default. It has beenpracticed in Europe since at least the sixteenth century, as table 2 illus-trates. As already noted, Spain defaulted on its debt thirteen times fromthe sixteenth through the nineteenth centuries, with the first recordeddefault in 1557 and the last in 1882. In the nineteenth century alone, Por-tugal, Germany, and Austria defaulted on their external debts five times,and Greece, with four defaults during that period, was not far behind.France defaulted on its debt eight times between 1550 and 1800. (Admit-tedly, the French governments’ debts were mainly held internally before
6 Brookings Papers on Economic Activity, 1:2003
8. The list of serial defaulters in table 1 is far from complete. Russia’s 1998 default washardly the first for that country (as table 2 shows, although the period covered does notinclude the default on the tsarist debt after the 1917 revolution). Many other countries havealso defaulted on their external debts, including, recently, Indonesia and Ukraine in 1998,Pakistan in 1999, and Ecuador in 2000.
1440-01 BPEA/Reinhart 07/17/03 08:10 Page 6
Carmen M. Reinhart, Kenneth S. Rogoff, and Miguel A. Savastano 7
Table 1. Inflation, Default, and Risk of Default, Selected Countries, 1824–2001
Percent of 12-monthperiods Percent Institu-
with No. of of years No. of tionalinflation default or in a state years since Investor
≥ 40 restructuring of default or last year in rating,percent, episodes, restructuring, default or September
Country 1958–2001a 1824–1999b 1824–1999b restructuring 2002c
Emerging market economies with at least one external default or restructuring since 1824Argentina 47.2 4 25.6 0 15.8Brazil 59.0 7 25.6 7 39.9Chile 18.6 3 23.3 17 66.1Colombia 0.8 7 38.6 57 38.7Egypt 0.0 2 12.5 17 45.5Mexico 16.7 8 46.9 12 59.0Philippines 2.1 1 18.5 10 44.9Turkey 57.8 6 16.5 20 33.8Venezuela 11.6 9 38.6 4 30.6
Average 23.8 5.2 29.6 16 41.6
Emerging market economies with no external default historyIndia 0.0 0 0.0 . . . 47.3Korea 0.0 0 0.0 . . . 65.6Malaysia 0.0 0 0.0 . . . 57.7Singapore 0.0 0 0.0 . . . 86.1Thailand 0.0 0 0.0 . . . 51.9
Average 0.0 0 0.0 . . . 61.7
Industrial economies with no external default historyAustralia 0.0 0 0.0 . . . 84.5Canada 0.0 0 0.0 . . . 89.4New Zealand 0.0 0 0.0 . . . 81.2Norway 0.0 0 0.0 . . . 93.1United 0.0 0 0.0 . . . 94.1
KingdomUnited States 0.0 0 0.0 . . . 93.1
Average 0.0 0 0.0 . . . 89.2
Source: Authors’ calculations based on data in Beim and Calomiris (2001); Standard & Poor’s Credit Week, various issues;Institutional Investor, various issues; International Monetary Fund, International Financial Statistics, various issues.
a. Period begins in 1962:1 for Singapore, 1964:1 for Brazil, 1966:1 for Thailand, 1970:1 for Turkey, and 1971:1 for Korea. b. Period begins in 1952 for Egypt and 1946 for the Philippines.c. On a scale of 0 to 100, where 100 indicates the lowest probability of default on government debt.
1440-01 BPEA/Reinhart 07/17/03 08:10 Page 7
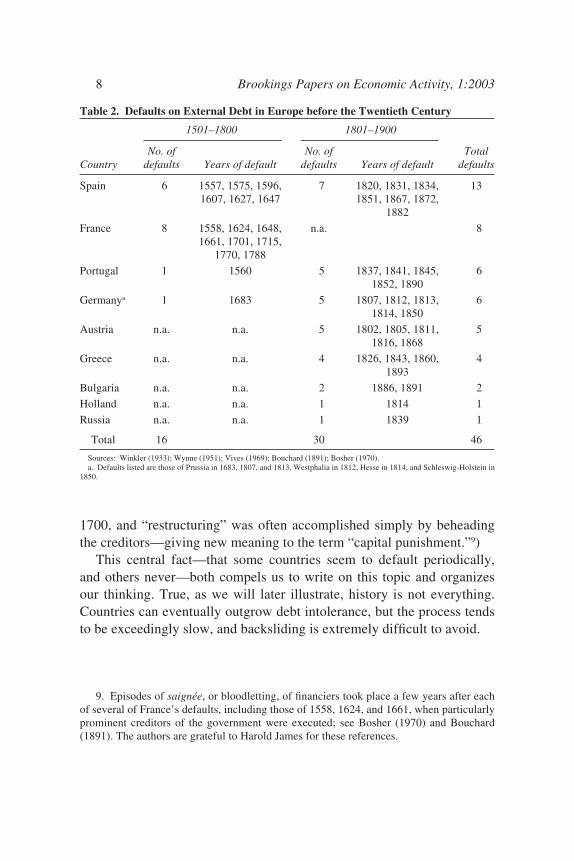
1700, and “restructuring” was often accomplished simply by beheadingthe creditors—giving new meaning to the term “capital punishment.”9)
This central fact—that some countries seem to default periodically,and others never—both compels us to write on this topic and organizesour thinking. True, as we will later illustrate, history is not everything.Countries can eventually outgrow debt intolerance, but the process tendsto be exceedingly slow, and backsliding is extremely difficult to avoid.
8 Brookings Papers on Economic Activity, 1:2003
9. Episodes of saignée, or bloodletting, of financiers took place a few years after eachof several of France’s defaults, including those of 1558, 1624, and 1661, when particularlyprominent creditors of the government were executed; see Bosher (1970) and Bouchard(1891). The authors are grateful to Harold James for these references.
Table 2. Defaults on External Debt in Europe before the Twentieth Century
1501–1800 1801–1900
No. of No. of Total Country defaults Years of default defaults Years of default defaults
Spain 6 1557, 1575, 1596, 7 1820, 1831, 1834, 131607, 1627, 1647 1851, 1867, 1872,
1882
France 8 1558, 1624, 1648, n.a. 81661, 1701, 1715,
1770, 1788
Portugal 1 1560 5 1837, 1841, 1845, 61852, 1890
Germanya 1 1683 5 1807, 1812, 1813, 61814, 1850
Austria n.a. n.a. 5 1802, 1805, 1811, 51816, 1868
Greece n.a. n.a. 4 1826, 1843, 1860, 41893
Bulgaria n.a. n.a. 2 1886, 1891 2
Holland n.a. n.a. 1 1814 1
Russia n.a. n.a. 1 1839 1
Total 16 30 46
Sources: Winkler (1933); Wynne (1951); Vives (1969); Bouchard (1891); Bosher (1970).a. Defaults listed are those of Prussia in 1683, 1807, and 1813, Westphalia in 1812, Hesse in 1814, and Schleswig-Holstein in
1850.
1440-01 BPEA/Reinhart 07/17/03 08:10 Page 8
Is Serial Default Really Such a Problem?
What does history tell us about the true costs of default? Might peri-odic default (or, equivalently, restructuring) simply be a mechanism formaking debt more equity-like, that is, for effectively indexing a country’sdebt service to its output performance? After all, defaults typically occurduring economic downturns.10 Although there must be some truth to thisargument, our reading of history is that the deadweight costs to defaultingon external debt can be significant, particularly for a country’s trade,investment flows, and economic growth. In more advanced economies,external default can often cause lasting damage to a country’s financialsystem, not least because of linkages between domestic and foreign finan-cial markets. Indeed, although we do not investigate the issue here, weconjecture that one of the reasons why countries without a default historygo to great lengths to avoid defaulting is precisely to protect their bankingand financial systems. Conversely, weak financial intermediation in manyserial defaulters lowers their penalty to default. The lower costs of finan-cial disruption that these countries face may induce them to default atlower thresholds, further weakening their financial systems and perpetuat-ing the cycle. One might make the same comment about tax systems, apoint to which we will return at the end of the paper. Countries where cap-ital flight and tax avoidance are high tend to have greater difficulty meet-ing debt payments, forcing governments to seek more revenue fromrelatively inelastic tax sources, in turn exacerbating flight and avoidance.Default amplifies and ingrains this cycle.
We certainly do not want to overstate the costs of default or restructur-ing, especially for serial defaulters. In fact, we will later show that debt-intolerant countries rarely choose to grow or pay their way out of heavydebt burdens without at least partial default. This revealed preference onthe part of debt-intolerant countries surely tells us something. Indeed,many question whether, in the long run, the costs of allowing or precipi-tating a default exceed the costs of an international bailout, at least forsome spectacular historical cases. But there is another side to the question
Carmen M. Reinhart, Kenneth S. Rogoff, and Miguel A. Savastano 9
10. Bulow and Rogoff (1989) argue that one alternative, namely, formal output index-ation clauses, although preferable to nonindexed debt, might be difficult to verify orenforce.
1440-01 BPEA/Reinhart 07/17/03 08:10 Page 9
of whether debt-intolerant countries really do borrow too much, and thathas to do with the benefit side of the equation. Our reading of the evi-dence, at least from the 1980s and 1990s, is that external borrowing wasoften driven by shortsighted governments that were willing to take signif-icant risks to raise consumption temporarily, rather than to foster high-return investment projects. The fact that the gains from borrowing comequickly, whereas the increased risk of default is borne only in the future,tilts shortsighted governments toward excessive debt. So, although thecosts of default are indeed often overstated, the benefits to be reaped fromexternal borrowing are often overstated even more, especially if one looksat the longer-term welfare of the citizens of debtor countries.
What does history tell us about the lenders? We do not need to tacklethis question here. Each of the periodic debt cycles the world has wit-nessed has had its own unique character, either in the nature of the lender(for example, bondholders in the 1930s and 1990s versus banks in the1970s and 1980s) or in the nature of the domestic borrower (for example,state-owned railroads in the 1870s versus core governments themselves inthe 1980s). There are, however, clearly established cycles in lending toemerging markets, with money often pouring in when rates of return inindustrial countries are low. Heavy borrowers are particularly vulnerableto “sudden stops” or reversals of capital flows, when returns in industrialcountries once again pick up.
Debt Thresholds
Few macroeconomists would be surprised to learn that emerging mar-ket economies with ratios of external debt to GNP above 150 percent runa significant risk of default. After all, among advanced economies,Japan’s current debt-to-GDP ratio, at 120 percent, is almost universallyconsidered high. Yet default can and does occur at ratios of external debtto GNP that would not be considered excessive for the typical advancedeconomy: for example, Mexico’s 1982 debt crisis occurred at a ratio ofdebt to GNP of 47 percent, and Argentina’s 2001 crisis at a ratio slightlyabove 50 percent.
We begin our investigation of the debt thresholds of emerging marketeconomies by chronicling all episodes of default or restructuring of exter-nal debt among middle-income economies during the period from 1970 to
10 Brookings Papers on Economic Activity, 1:2003
1440-01 BPEA/Reinhart 07/17/03 08:10 Page 10
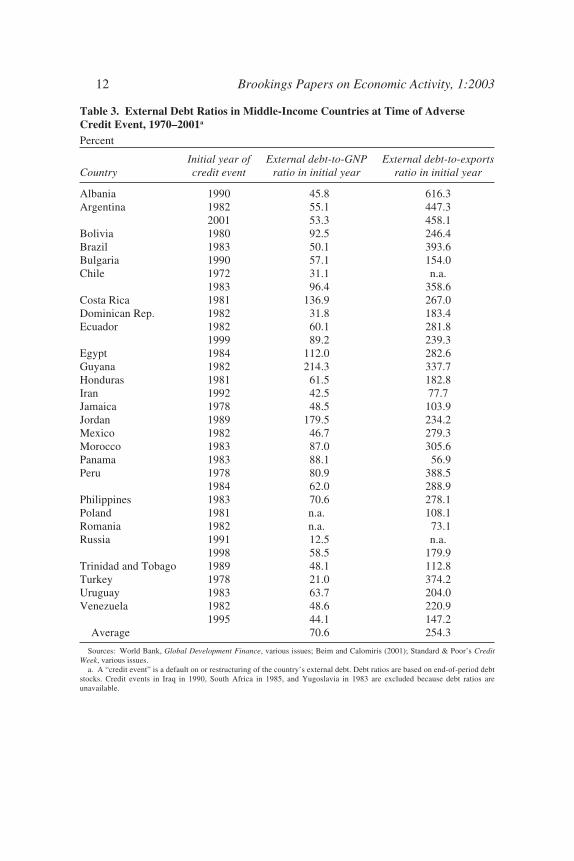
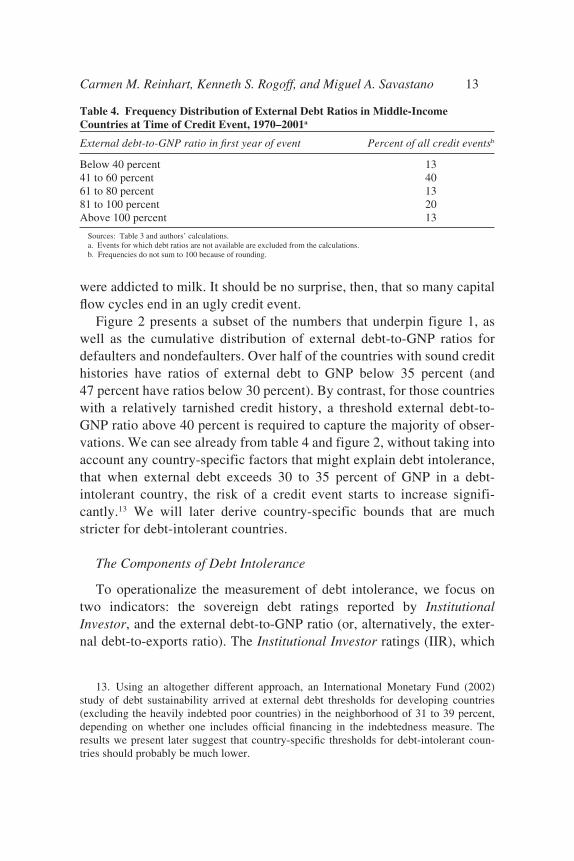
2001.11 Table 3 lists twenty-seven countries that suffered at least onedefault or restructuring during that period, the first year of each episode,and the country’s ratios of external debt to GNP and to exports at the endof the year in which the episode occurred. (Many episodes lasted severalyears.) It is obvious from the table that Mexico’s 1982 default andArgentina’s 2001 default were not exceptions: many other countries alsosuffered adverse credit events at levels of debt below 50 percent of GNP.Table 4 shows further that external debt exceeded 100 percent of GNP inonly 13 percent of these episodes, that more than half of these episodesoccurred at ratios of debt to GNP below 60 percent, and that defaultsoccurred despite debt being less than 40 percent of GNP in 13 percent ofepisodes.12 (Indeed, the external debt-to-GNP thresholds reported in table3 are biased upward, because the debt-to-GNP ratios corresponding to theyear of the credit event are driven up by the real depreciation that typi-cally accompanies the event.)
We next compare the external indebtedness profiles of emerging mar-ket economies with and without a history of default. The top panel of fig-ure 1 shows the frequency distribution of the external debt-to-GNP ratio,and the bottom panel the external debt-to-exports ratio, for two groups ofcountries over the period 1970–2000. The two distributions are very dis-tinct and show that defaulters borrow more (even though their ratings tendto be worse at a given level of debt) than nondefaulters. The gap in exter-nal debt ratios between those emerging market economies with and thosewithout a history of default widens further when the ratio of external debtto exports is considered. It appears that those countries that risk defaultthe most when they borrow (that is, those with the greatest debt intoler-ance) also borrow the most—much as if a lactose-intolerant individual
Carmen M. Reinhart, Kenneth S. Rogoff, and Miguel A. Savastano 11
11. Following the World Bank, for some purposes we divide developing countries byincome per capita into two broad groups: middle-income countries (those developing coun-tries with GNPs per capita higher than $755 in 1999) and low-income countries (thosebelow that level). Most but not all emerging market economies—defined here as develop-ing countries with substantial access to private external financing—are middle-incomecountries, and most but not all low-income countries have no access to private capital mar-kets and instead rely primarily on official sources of external funding.
12. Tables 3 and 4 measure gross total external debt, as debtor governments have littlecapacity to tax or otherwise confiscate private citizens’ assets held abroad. When Argentinadefaulted in 2001 on $140 billion of external debt, for example, the foreign assets held byits citizens abroad were estimated by some commentators at about $120 billion to $150 bil-lion. This phenomenon is not uncommon and indeed was the norm in the 1980s debt crisis.
1440-01 BPEA/Reinhart 07/17/03 08:10 Page 11
12 Brookings Papers on Economic Activity, 1:2003
Table 3. External Debt Ratios in Middle-Income Countries at Time of AdverseCredit Event, 1970–2001a
Percent
Initial year of External debt-to-GNP External debt-to-exports Country credit event ratio in initial year ratio in initial year
Albania 1990 45.8 616.3Argentina 1982 55.1 447.3
2001 53.3 458.1Bolivia 1980 92.5 246.4Brazil 1983 50.1 393.6Bulgaria 1990 57.1 154.0Chile 1972 31.1 n.a.
1983 96.4 358.6Costa Rica 1981 136.9 267.0Dominican Rep. 1982 31.8 183.4Ecuador 1982 60.1 281.8
1999 89.2 239.3Egypt 1984 112.0 282.6Guyana 1982 214.3 337.7Honduras 1981 61.5 182.8Iran 1992 42.5 77.7Jamaica 1978 48.5 103.9Jordan 1989 179.5 234.2Mexico 1982 46.7 279.3Morocco 1983 87.0 305.6Panama 1983 88.1 56.9Peru 1978 80.9 388.5
1984 62.0 288.9Philippines 1983 70.6 278.1Poland 1981 n.a. 108.1Romania 1982 n.a. 73.1Russia 1991 12.5 n.a.
1998 58.5 179.9Trinidad and Tobago 1989 48.1 112.8Turkey 1978 21.0 374.2Uruguay 1983 63.7 204.0Venezuela 1982 48.6 220.9
1995 44.1 147.2Average 70.6 254.3
Sources: World Bank, Global Development Finance, various issues; Beim and Calomiris (2001); Standard & Poor’s CreditWeek, various issues.
a. A “credit event” is a default on or restructuring of the country’s external debt. Debt ratios are based on end-of-period debtstocks. Credit events in Iraq in 1990, South Africa in 1985, and Yugoslavia in 1983 are excluded because debt ratios areunavailable.
1440-01 BPEA/Reinhart 07/17/03 08:10 Page 12
were addicted to milk. It should be no surprise, then, that so many capitalflow cycles end in an ugly credit event.
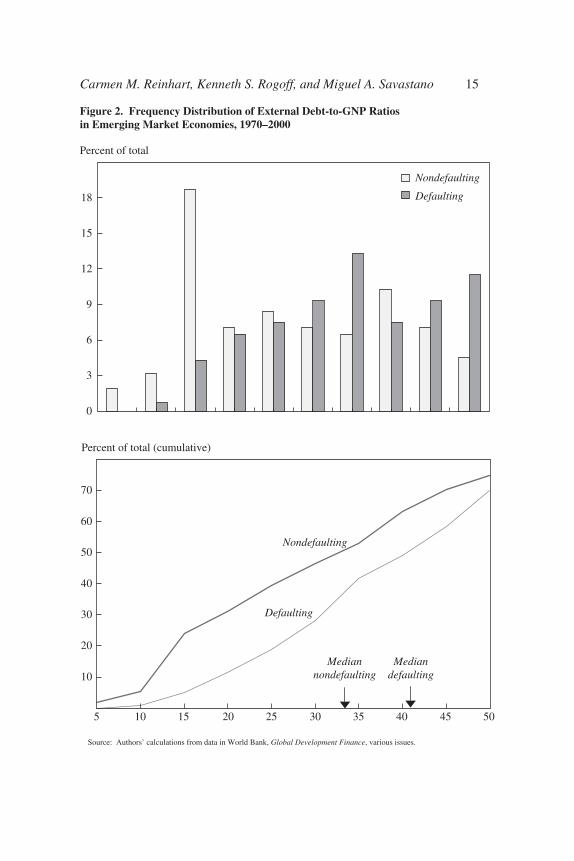
Figure 2 presents a subset of the numbers that underpin figure 1, aswell as the cumulative distribution of external debt-to-GNP ratios fordefaulters and nondefaulters. Over half of the countries with sound credithistories have ratios of external debt to GNP below 35 percent (and47 percent have ratios below 30 percent). By contrast, for those countrieswith a relatively tarnished credit history, a threshold external debt-to-GNP ratio above 40 percent is required to capture the majority of obser-vations. We can see already from table 4 and figure 2, without taking intoaccount any country-specific factors that might explain debt intolerance,that when external debt exceeds 30 to 35 percent of GNP in a debt-intolerant country, the risk of a credit event starts to increase signifi-cantly.13 We will later derive country-specific bounds that are muchstricter for debt-intolerant countries.
The Components of Debt Intolerance
To operationalize the measurement of debt intolerance, we focus ontwo indicators: the sovereign debt ratings reported by InstitutionalInvestor, and the external debt-to-GNP ratio (or, alternatively, the exter-nal debt-to-exports ratio). The Institutional Investor ratings (IIR), which
Carmen M. Reinhart, Kenneth S. Rogoff, and Miguel A. Savastano 13
13. Using an altogether different approach, an International Monetary Fund (2002)study of debt sustainability arrived at external debt thresholds for developing countries(excluding the heavily indebted poor countries) in the neighborhood of 31 to 39 percent,depending on whether one includes official financing in the indebtedness measure. Theresults we present later suggest that country-specific thresholds for debt-intolerant coun-tries should probably be much lower.
Table 4. Frequency Distribution of External Debt Ratios in Middle-IncomeCountries at Time of Credit Event, 1970–2001a
External debt-to-GNP ratio in first year of event Percent of all credit eventsb
Below 40 percent 1341 to 60 percent 4061 to 80 percent 1381 to 100 percent 20Above 100 percent 13
Sources: Table 3 and authors’ calculations.a. Events for which debt ratios are not available are excluded from the calculations.b. Frequencies do not sum to 100 because of rounding.
1440-01 BPEA/Reinhart 07/17/03 08:10 Page 13
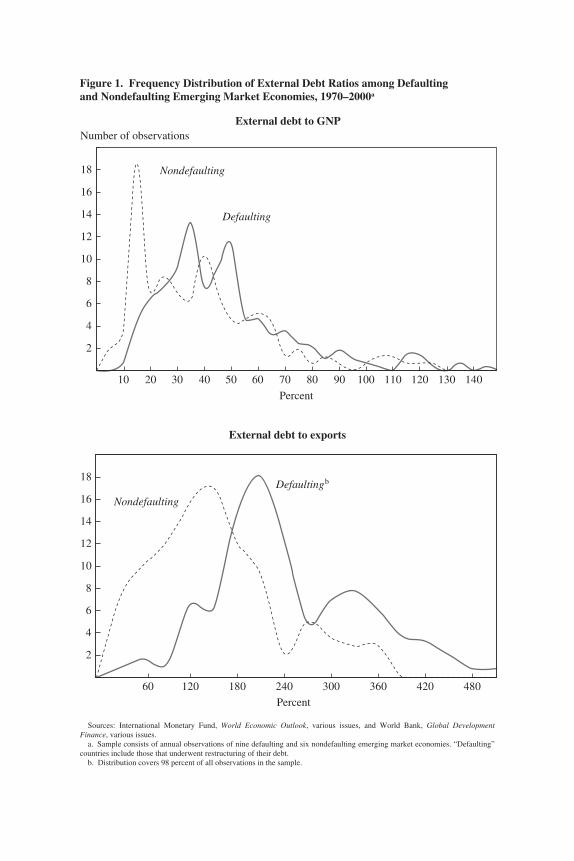
Figure 1. Frequency Distribution of External Debt Ratios among Defaulting and Nondefaulting Emerging Market Economies, 1970–2000a
Sources: International Monetary Fund, World Economic Outlook, various issues, and World Bank, Global DevelopmentFinance, various issues.
a. Sample consists of annual observations of nine defaulting and six nondefaulting emerging market economies. “Defaulting”countries include those that underwent restructuring of their debt.
b. Distribution covers 98 percent of all observations in the sample.
2
4
6
8
10
12
14
16
18
10 20 30 40 50 60 70 80 90 100 110 120 130 140
External debt to GNP
Nondefaulting
Defaulting
Number of observations
2
4
6
8
10
12
14
16
18
60 120 180 240 300 360 420 480
External debt to exports
Nondefaulting
Defaultingb
Percent
Percent
1440-01 BPEA/Reinhart 07/17/03 08:11 Page 14
Carmen M. Reinhart, Kenneth S. Rogoff, and Miguel A. Savastano 15
Figure 2. Frequency Distribution of External Debt-to-GNP Ratios in Emerging Market Economies, 1970–2000
Source: Authors’ calculations from data in World Bank, Global Development Finance, various issues.
10
20
30
40
50
60
70
5 10 15 20 25 30 35 40 45 50
Defaulting
Nondefaulting
Mediannondefaulting
Mediandefaulting
0
3
6
9
12
15
18
Nondefaulting
Defaulting
Percent of total
Percent of total (cumulative)
1440-01 BPEA/Reinhart 07/17/03 08:11 Page 15
are compiled twice a year, are based on information provided by econo-mists and sovereign risk analysts at leading global banks and securitiesfirms. The ratings grade each country on a scale from 0 to 100, with a rat-ing of 100 given to those countries perceived as having the lowest chanceof defaulting on their government debt obligations.14 Hence we take thetransformed variable (100 – IIR) as a proxy for default risk. Market-basedmeasures of default risk are also available, but only for a much smallergroup of countries and over a much shorter sample period.15
The second major component of our debt intolerance measure is totalexternal debt, scaled either by GNP or by exports. We emphasize total(public and private) external debt because most government debt inemerging markets until the late 1980s was external, and because it oftenhappens that external debt that was private before a crisis becomes publicafter the fact.16 (As we later show, however, in future analyses it will beequally important to measure intolerance with reference to the growingstock of domestic public debt.)
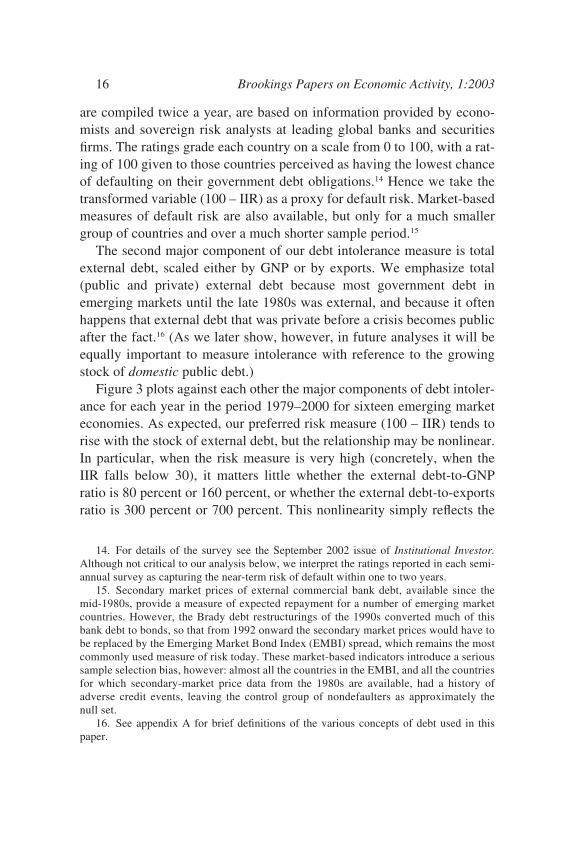
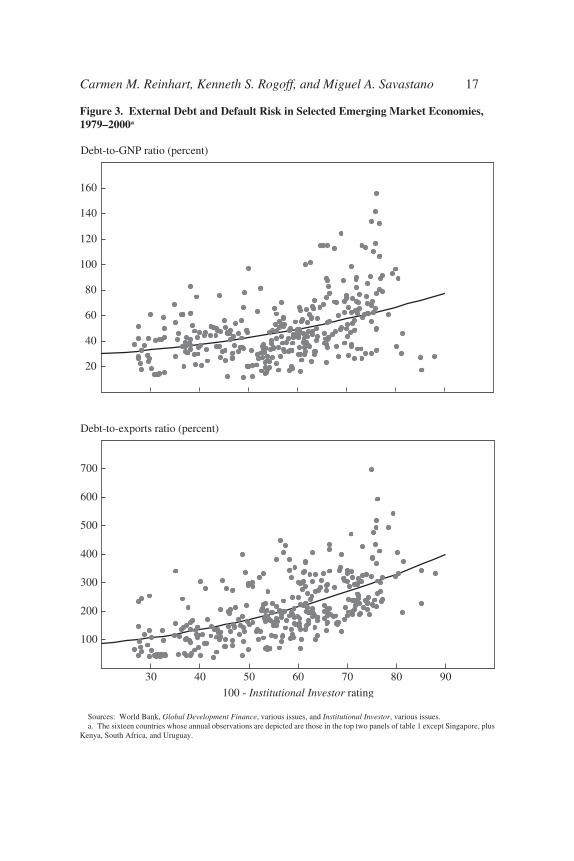
Figure 3 plots against each other the major components of debt intoler-ance for each year in the period 1979–2000 for sixteen emerging marketeconomies. As expected, our preferred risk measure (100 – IIR) tends torise with the stock of external debt, but the relationship may be nonlinear.In particular, when the risk measure is very high (concretely, when theIIR falls below 30), it matters little whether the external debt-to-GNPratio is 80 percent or 160 percent, or whether the external debt-to-exportsratio is 300 percent or 700 percent. This nonlinearity simply reflects the
16 Brookings Papers on Economic Activity, 1:2003
14. For details of the survey see the September 2002 issue of Institutional Investor.Although not critical to our analysis below, we interpret the ratings reported in each semi-annual survey as capturing the near-term risk of default within one to two years.
15. Secondary market prices of external commercial bank debt, available since themid-1980s, provide a measure of expected repayment for a number of emerging marketcountries. However, the Brady debt restructurings of the 1990s converted much of thisbank debt to bonds, so that from 1992 onward the secondary market prices would have tobe replaced by the Emerging Market Bond Index (EMBI) spread, which remains the mostcommonly used measure of risk today. These market-based indicators introduce a serioussample selection bias, however: almost all the countries in the EMBI, and all the countriesfor which secondary-market price data from the 1980s are available, had a history ofadverse credit events, leaving the control group of nondefaulters as approximately thenull set.
16. See appendix A for brief definitions of the various concepts of debt used in thispaper.
1440-01 BPEA/Reinhart 07/17/03 08:11 Page 16
Carmen M. Reinhart, Kenneth S. Rogoff, and Miguel A. Savastano 17
Figure 3. External Debt and Default Risk in Selected Emerging Market Economies,1979–2000a
Sources: World Bank, Global Development Finance, various issues, and Institutional Investor, various issues.a. The sixteen countries whose annual observations are depicted are those in the top two panels of table 1 except Singapore, plus
Kenya, South Africa, and Uruguay.
20
40
60
80
100
120
140
160
100
200
300
400
500
600
700
30 40 50 60 70 80 90
100 - Institutional Investor rating
Debt-to-GNP ratio (percent)
Debt-to-exports ratio (percent)
1440-01 BPEA/Reinhart 07/17/03 08:11 Page 17
fact that, below a certain threshold of the IIR, typically about 24, thecountry has usually lost all access to private capital markets.17
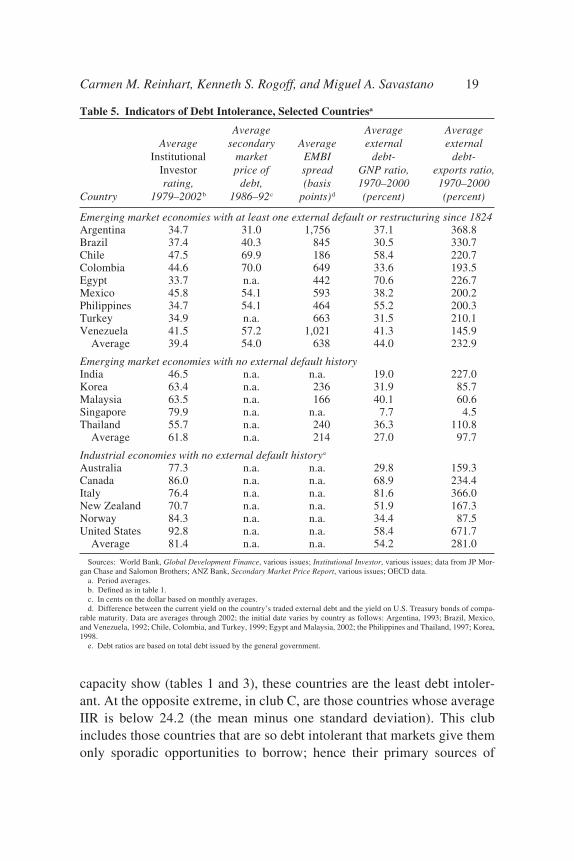
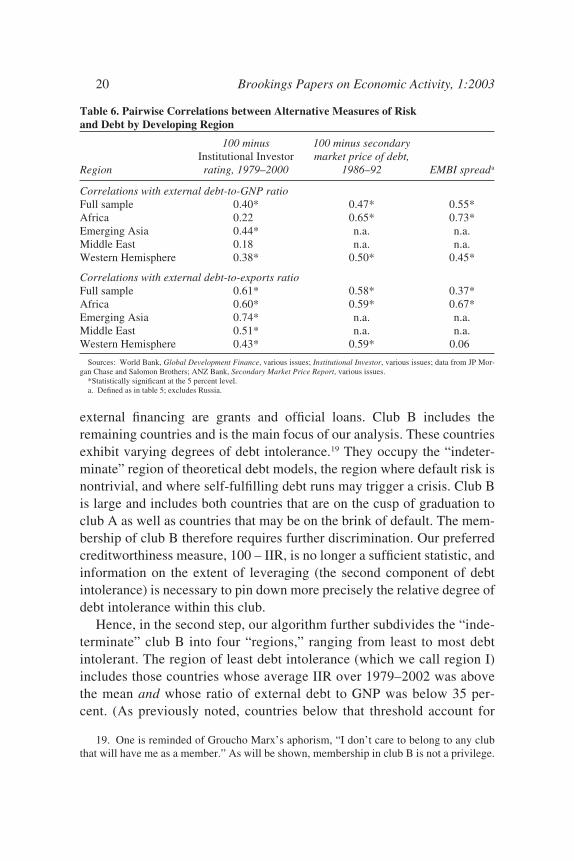
Table 5 shows the period averages of various measures of risk andexternal debt (the components of debt intolerance) for a representativesample of countries, which we will refer to as our core sample (see appen-dix B). Because some researchers have argued that the “right” benchmarkfor emerging market indebtedness is the level of public debt thatadvanced economies are able to sustain,18 table 5 also includes this mea-sure for a group of nondefaulting advanced economies. The table makesplain that, although the relationship between external debt and risk maybe monotonic for emerging market economies, it is clearly not monotonicfor the public debt of advanced economies; in those countries, relativelyhigh levels of government debt can coexist with low levels of risk.Table 5, together with table 6, which shows the panel pairwise correla-tions between the two debt ratios and three measures of risk for a largersample of developing economies, also highlights the fact that the differentmeasures of risk present a very similar picture both of countries’ relativedebt intolerance and of the correlation between risk and indebtedness. Asanticipated by figure 3, the correlations are uniformly positive in allregional groupings and are usually statistically significant.
Debt Intolerance: Clubs and Regions
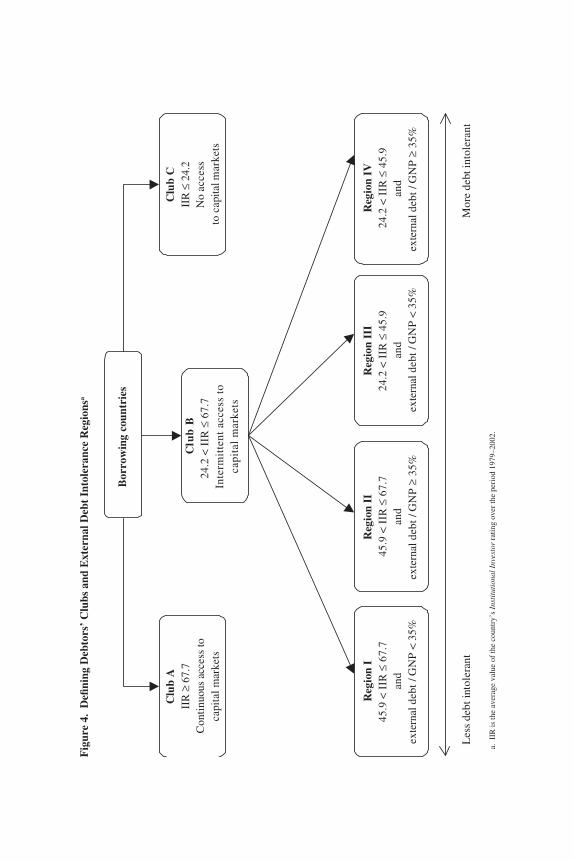
We next use our component measures of debt intolerance—IIR riskratings and external debt ratios—in a two-step algorithm, mapped in fig-ure 4, to define debtors’ clubs and vulnerability regions. We begin by cal-culating the mean (45.9) and standard deviation (21.8) of the IIR forfifty-three developing and industrial countries over 1979–2002, and weuse these statistics to loosely group countries into three “clubs” (the coun-tries and their period averages are listed in appendix table B1). Club Aincludes those countries whose average IIR over the period 1979–2002 is67.7 (the mean plus one standard deviation) or above; members of thisclub—essentially, the advanced economies—enjoy virtually continuousaccess to capital markets. As their repayment history and debt absorption
18 Brookings Papers on Economic Activity, 1:2003
17. A similar picture emerges (for a smaller sample, not shown) when one uses othermeasures of risk, such as secondary market prices of commercial bank debt or EMBIspreads.
18. See, for example, Reisen (1989).
1440-01 BPEA/Reinhart 07/17/03 08:11 Page 18
capacity show (tables 1 and 3), these countries are the least debt intoler-ant. At the opposite extreme, in club C, are those countries whose averageIIR is below 24.2 (the mean minus one standard deviation). This clubincludes those countries that are so debt intolerant that markets give themonly sporadic opportunities to borrow; hence their primary sources of
Carmen M. Reinhart, Kenneth S. Rogoff, and Miguel A. Savastano 19
Table 5. Indicators of Debt Intolerance, Selected Countriesa
Average Average AverageAverage secondary Average external external
Institutional market EMBI debt- debt-Investor price of spread GNP ratio, exports ratio,rating, debt, (basis 1970–2000 1970–2000
Country 1979–2002b 1986–92c points)d (percent) (percent)
Emerging market economies with at least one external default or restructuring since 1824Argentina 34.7 31.0 1,756 37.1 368.8Brazil 37.4 40.3 845 30.5 330.7Chile 47.5 69.9 186 58.4 220.7Colombia 44.6 70.0 649 33.6 193.5Egypt 33.7 n.a. 442 70.6 226.7Mexico 45.8 54.1 593 38.2 200.2Philippines 34.7 54.1 464 55.2 200.3Turkey 34.9 n.a. 663 31.5 210.1Venezuela 41.5 57.2 1,021 41.3 145.9
Average 39.4 54.0 638 44.0 232.9
Emerging market economies with no external default historyIndia 46.5 n.a. n.a. 19.0 227.0Korea 63.4 n.a. 236 31.9 85.7Malaysia 63.5 n.a. 166 40.1 60.6Singapore 79.9 n.a. n.a. 7.7 4.5Thailand 55.7 n.a. 240 36.3 110.8
Average 61.8 n.a. 214 27.0 97.7
Industrial economies with no external default historye
Australia 77.3 n.a. n.a. 29.8 159.3Canada 86.0 n.a. n.a. 68.9 234.4Italy 76.4 n.a. n.a. 81.6 366.0New Zealand 70.7 n.a. n.a. 51.9 167.3Norway 84.3 n.a. n.a. 34.4 87.5United States 92.8 n.a. n.a. 58.4 671.7
Average 81.4 n.a. n.a. 54.2 281.0
Sources: World Bank, Global Development Finance, various issues; Institutional Investor, various issues; data from JP Mor-gan Chase and Salomon Brothers; ANZ Bank, Secondary Market Price Report, various issues; OECD data.
a. Period averages.b. Defined as in table 1.c. In cents on the dollar based on monthly averages. d. Difference between the current yield on the country’s traded external debt and the yield on U.S. Treasury bonds of compa-
rable maturity. Data are averages through 2002; the initial date varies by country as follows: Argentina, 1993; Brazil, Mexico,and Venezuela, 1992; Chile, Colombia, and Turkey, 1999; Egypt and Malaysia, 2002; the Philippines and Thailand, 1997; Korea,1998.
e. Debt ratios are based on total debt issued by the general government.
1440-01 BPEA/Reinhart 07/17/03 08:11 Page 19
external financing are grants and official loans. Club B includes theremaining countries and is the main focus of our analysis. These countriesexhibit varying degrees of debt intolerance.19 They occupy the “indeter-minate” region of theoretical debt models, the region where default risk isnontrivial, and where self-fulfilling debt runs may trigger a crisis. Club Bis large and includes both countries that are on the cusp of graduation toclub A as well as countries that may be on the brink of default. The mem-bership of club B therefore requires further discrimination. Our preferredcreditworthiness measure, 100 – IIR, is no longer a sufficient statistic, andinformation on the extent of leveraging (the second component of debtintolerance) is necessary to pin down more precisely the relative degree ofdebt intolerance within this club.
Hence, in the second step, our algorithm further subdivides the “inde-terminate” club B into four “regions,” ranging from least to most debtintolerant. The region of least debt intolerance (which we call region I)includes those countries whose average IIR over 1979–2002 was abovethe mean and whose ratio of external debt to GNP was below 35 per-cent. (As previously noted, countries below that threshold account for
20 Brookings Papers on Economic Activity, 1:2003
19. One is reminded of Groucho Marx’s aphorism, “I don’t care to belong to any clubthat will have me as a member.” As will be shown, membership in club B is not a privilege.
Table 6. Pairwise Correlations between Alternative Measures of Risk and Debt by Developing Region
100 minus 100 minus secondary Institutional Investor market price of debt,
Region rating, 1979–2000 1986–92 EMBI spreada
Correlations with external debt-to-GNP ratioFull sample 0.40* 0.47* 0.55*Africa 0.22 0.65* 0.73*Emerging Asia 0.44* n.a. n.a.Middle East 0.18 n.a. n.a.Western Hemisphere 0.38* 0.50* 0.45*
Correlations with external debt-to-exports ratioFull sample 0.61* 0.58* 0.37*Africa 0.60* 0.59* 0.67*Emerging Asia 0.74* n.a. n.a.Middle East 0.51* n.a. n.a.Western Hemisphere 0.43* 0.59* 0.06
Sources: World Bank, Global Development Finance, various issues; Institutional Investor, various issues; data from JP Mor-gan Chase and Salomon Brothers; ANZ Bank, Secondary Market Price Report, various issues.
*Statistically significant at the 5 percent level.a. Defined as in table 5; excludes Russia.
1440-01 BPEA/Reinhart 07/17/03 08:11 Page 20
Fig
ure
4.D
efini
ng D
ebto
rs’
Clu
bs a
nd E
xter
nal D
ebt
Into
lera
nce
Reg
ions
a
a.II
R is
the
aver
age
valu
e of
the
coun
try’
s In
stit
utio
nal I
nves
tor
ratin
g ov
er th
e pe
riod
197
9–20
02.
Clu
b A
IIR
≥ 6
7.7
Con
tinu
ous
acce
ss to
capi
tal m
arke
ts
Reg
ion
IV24
.2 <
IIR
≤ 4
5.9
and
exte
rnal
deb
t / G
NP
≥ 3
5%
Reg
ion
III
24.2
< I
IR ≤
45.
9an
dex
tern
al d
ebt /
GN
P <
35%
Reg
ion
II45
.9 <
IIR
≤ 6
7.7
and
exte
rnal
deb
t / G
NP
≥ 3
5%
Reg
ion
I45
.9 <
IIR
≤ 6
7.7
and
exte
rnal
deb
t / G
NP
< 3
5%
Clu
b C
IIR
≤ 2
4.2
No
acce
ssto
cap
ital m
arke
ts
Clu
b B
24.2
< I
IR ≤
67.
7In
term
itte
nt a
cces
s to
capi
tal
mar
kets
Les
s de
bt in
tole
rant
Mor
e de
bt in
tole
rant
Bor
row
ing
coun
trie
s
1440-01 BPEA/Reinhart 07/17/03 08:11 Page 21
over half of the observations among nondefaulters over 1970–2001.)Region II includes countries whose average IIR is above the mean butwhose external debt-to-GNP ratio is above 35 percent. Because theirhigher-than-average long-run creditworthiness enables them to sustain ahigher-than-average debt burden, countries in this group are the second-least debt-intolerant group. More debt intolerant still are the region IIIcountries, whose long-run creditworthiness (as measured by the averageIIR) is below the mean and whose external debt is below 35 percent ofGNP. Lastly, the countries with the highest debt intolerance are those inregion IV, with an average IIR below the mean and external debt levelsabove 35 percent of GNP. Countries in region IV can easily fall intoclub C, losing their market access to credit. For example, in early 2000Argentina’s IIR was 43 and its external debt-to-GNP ratio was 51 percent,making it a region IV country. As of September 2002, Argentina’s IIRhad dropped to 15.8, indicating that the country had backslid into club C.As we will see, countries do not graduate to higher clubs easily; indeed, itcan take many decades of impeccable repayment performance and lowdebt levels to graduate from club B to club A.
Debt Intolerance: The Role of History
We begin this section by offering some basic insights into the histori-cal origins of country risk, which some have mislabeled “original sin.”20
In particular, we focus on countries’ credit and inflation histories. Wethen use our core results for several purposes: to illustrate how to calcu-late country-specific debt thresholds, in contrast to the coarse threshold(an external debt-to-GNP ratio of 35 percent) derived earlier; to showhow countries in club B shift between debt intolerance regions over time;to illustrate how countries may graduate into a better club; and to showhow a simple summary statistic can rank countries within club B accord-ing to their relative degree of debt intolerance.
Historical Determinants of Country Risk
To prepare to investigate econometrically the link between a country’sexternal credit and inflation history, on the one hand, and its sovereign
22 Brookings Papers on Economic Activity, 1:2003
20. See, for example, Eichengreen, Hausmann, and Panizza (2002).
1440-01 BPEA/Reinhart 07/17/03 08:11 Page 22
risk, on the other, we broaden our sample from the twenty countries listedin table 5 to the fifty-three industrial and developing economies listed inappendix table B1. The IIR rating, our preferred measure of creditworthi-ness, is the dependent variable in all the regressions. To measure a coun-try’s credit history, we calculate the percentage of years in the samplewhen the country was either in default on its external debt or undergoinga restructuring of its debt. Two different periods are analyzed: 1824–1999and 1946–1999. Another indicator of credit history we use is the numberof years since the country’s last default or restructuring on its externaldebt. We also calculate for each country the percentage of twelve-monthperiods during 1958–2000 when annual inflation was above 40 percent.21
Although it is quite reasonable to expect that debt intolerance may itselflead to a higher probability of default (because markets charge a higherpremium on borrowing) or a higher probability of inflation (because oftenthe country has no other sources of deficit financing), we are not too con-cerned about the potential endogeneity of these two regressors, becausethey are largely predetermined relative to the main sample period, whichis 1979–2000.22
However, using 1970–2000 averages of the external debt-to-GNP ratio(or the external debt-to-exports ratio) as a regressor does pose a potentialendogeneity problem. Therefore we report the results of both ordinaryleast-squares and instrumental variable estimations, in the latter caseusing the average debt-to-GNP ratio during 1970–78 as an instrument.Because White’s test revealed heteroskedasticity in the residuals, we cor-rect accordingly to ensure the consistency of the standard errors. Toinvestigate whether the differences in debt tolerance between countries inclub A and the rest of the sample are systematic, we also use a dummyvariable for club A in the regressions, allowing the club A countries tohave a different slope coefficient on the debt-to-GNP ratio.
Table 7 presents the results of six different specifications of the cross-country regressions. The results show that few variables suffice toaccount for a significant portion (about 75 percent) of the cross-country
Carmen M. Reinhart, Kenneth S. Rogoff, and Miguel A. Savastano 23
21. For a discussion of why 40 percent seems a reasonable threshold for high inflation,see Easterly (2001) and Reinhart and Rogoff (2002).
22. An obvious way of extending this analysis of credit history would be to distinguishbetween peacetime and wartime defaults and gather additional information about govern-ments’ violation of other contracts, such as defaults on domestic debt or forcible conver-sions of dollar deposits into local currency (as occurred in Bolivia in 1982, Mexico in 1982,Peru in 1985, and Argentina in 2002).
1440-01 BPEA/Reinhart 07/17/03 08:11 Page 23
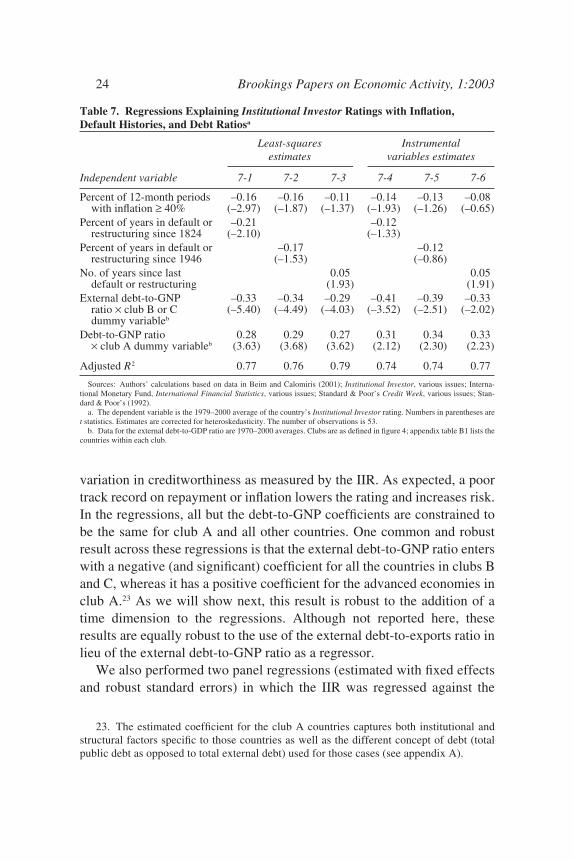
variation in creditworthiness as measured by the IIR. As expected, a poortrack record on repayment or inflation lowers the rating and increases risk.In the regressions, all but the debt-to-GNP coefficients are constrained tobe the same for club A and all other countries. One common and robustresult across these regressions is that the external debt-to-GNP ratio enterswith a negative (and significant) coefficient for all the countries in clubs Band C, whereas it has a positive coefficient for the advanced economies inclub A.23 As we will show next, this result is robust to the addition of atime dimension to the regressions. Although not reported here, theseresults are equally robust to the use of the external debt-to-exports ratio inlieu of the external debt-to-GNP ratio as a regressor.
We also performed two panel regressions (estimated with fixed effectsand robust standard errors) in which the IIR was regressed against the
24 Brookings Papers on Economic Activity, 1:2003
23. The estimated coefficient for the club A countries captures both institutional andstructural factors specific to those countries as well as the different concept of debt (totalpublic debt as opposed to total external debt) used for those cases (see appendix A).
Table 7. Regressions Explaining Institutional Investor Ratings with Inflation, Default Histories, and Debt Ratiosa
Least-squares Instrumental estimates variables estimates
Independent variable 7-1 7-2 7-3 7-4 7-5 7-6
Percent of 12-month periods –0.16 –0.16 –0.11 –0.14 –0.13 –0.08with inflation ≥ 40% (–2.97) (–1.87) (–1.37) (–1.93) (–1.26) (–0.65)
Percent of years in default or –0.21 –0.12restructuring since 1824 (–2.10) (–1.33)
Percent of years in default or –0.17 –0.12restructuring since 1946 (–1.53) (–0.86)
No. of years since last 0.05 0.05default or restructuring (1.93) (1.91)
External debt-to-GNP –0.33 –0.34 –0.29 –0.41 –0.39 –0.33ratio × club B or C (–5.40) (–4.49) (–4.03) (–3.52) (–2.51) (–2.02)dummy variableb
Debt-to-GNP ratio 0.28 0.29 0.27 0.31 0.34 0.33× club A dummy variableb (3.63) (3.68) (3.62) (2.12) (2.30) (2.23)
Adjusted R2 0.77 0.76 0.79 0.74 0.74 0.77
Sources: Authors’ calculations based on data in Beim and Calomiris (2001); Institutional Investor, various issues; Interna-tional Monetary Fund, International Financial Statistics, various issues; Standard & Poor’s Credit Week, various issues; Stan-dard & Poor’s (1992).
a. The dependent variable is the 1979–2000 average of the country’s Institutional Investor rating. Numbers in parentheses aret statistics. Estimates are corrected for heteroskedasticity. The number of observations is 53.
b. Data for the external debt-to-GDP ratio are 1970–2000 averages. Clubs are as defined in figure 4; appendix table B1 lists thecountries within each club.
1440-01 BPEA/Reinhart 07/17/03 08:11 Page 24
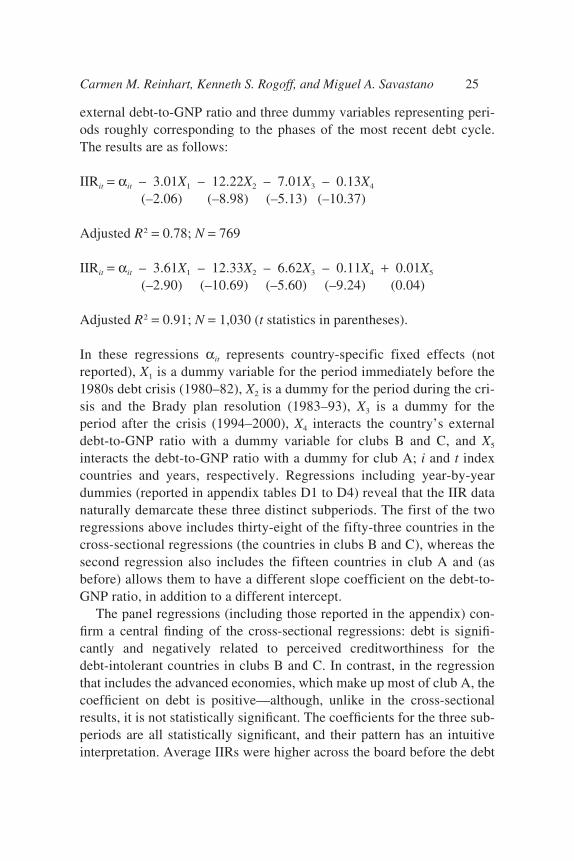
external debt-to-GNP ratio and three dummy variables representing peri-ods roughly corresponding to the phases of the most recent debt cycle.The results are as follows:
IIRit = αit – 3.01X1 – 12.22X2 – 7.01X3 – 0.13X4
(–2.06) (–8.98) (–5.13) (–10.37)
Adjusted R2 = 0.78; N = 769
IIRit = αit – 3.61X1 – 12.33X2 – 6.62X3 – 0.11X4 + 0.01X5
(–2.90) (–10.69) (–5.60) (–9.24) (0.04)
Adjusted R2 = 0.91; N = 1,030 (t statistics in parentheses).
In these regressions αit represents country-specific fixed effects (notreported), X1 is a dummy variable for the period immediately before the1980s debt crisis (1980–82), X2 is a dummy for the period during the cri-sis and the Brady plan resolution (1983–93), X3 is a dummy for theperiod after the crisis (1994–2000), X4 interacts the country’s externaldebt-to-GNP ratio with a dummy variable for clubs B and C, and X5
interacts the debt-to-GNP ratio with a dummy for club A; i and t indexcountries and years, respectively. Regressions including year-by-yeardummies (reported in appendix tables D1 to D4) reveal that the IIR datanaturally demarcate these three distinct subperiods. The first of the tworegressions above includes thirty-eight of the fifty-three countries in thecross-sectional regressions (the countries in clubs B and C), whereas thesecond regression also includes the fifteen countries in club A and (asbefore) allows them to have a different slope coefficient on the debt-to-GNP ratio, in addition to a different intercept.
The panel regressions (including those reported in the appendix) con-firm a central finding of the cross-sectional regressions: debt is signifi-cantly and negatively related to perceived creditworthiness for thedebt-intolerant countries in clubs B and C. In contrast, in the regressionthat includes the advanced economies, which make up most of club A, thecoefficient on debt is positive—although, unlike in the cross-sectionalresults, it is not statistically significant. The coefficients for the three sub-periods are all statistically significant, and their pattern has an intuitiveinterpretation. Average IIRs were higher across the board before the debt
Carmen M. Reinhart, Kenneth S. Rogoff, and Miguel A. Savastano 25
1440-01 BPEA/Reinhart 07/17/03 08:11 Page 25
crisis of the 1980s; these ratings then plummeted as the debt crisisunfolded, and they recovered only partially in the 1990s, never quitereaching their precrisis levels. Thus debt intolerance is long lived.
Country-Specific Debt Thresholds
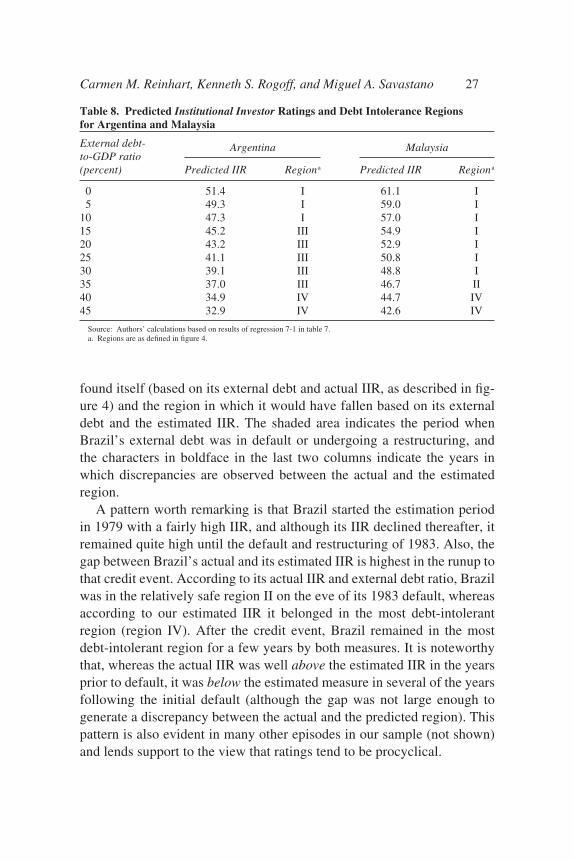
We now use some of our core results to illustrate that, although anexternal debt-to-output ratio of 35 percent is a minimal debt “safety”threshold for those countries that have not made it to club A, countrieswith a weak credit history may become highly vulnerable even at muchlower levels of external debt. To illustrate this basic but critical point, weperform the following exercise. We use the estimated coefficients fromthe first regression in table 7, together with the actual values of the regres-sors, to predict values of the IIR for varying ratios of external debt to GNPfor a given country. Table 8 illustrates the exercise for the cases of Argen-tina and Malaysia for levels of external debt ranging from 0 to 45 percentof GNP. Until Argentina’s default in December 2001, both countries weremembers of club B.
The exercise shows clearly that Argentina’s precarious debt intoler-ance situation is more severe than Malaysia’s. Argentina remains in therelatively safe region I only as long as its external debt remains below15 percent of GNP, whereas Malaysia remains in region I up to a debt-to-GNP ratio of 35 percent, and it is still in the relatively safe region II witha debt of 40 percent of GNP. These contrasting patterns can be seenacross a number of other cases (results not shown): Argentina is represen-tative of the many countries with a relatively weak credit and inflationhistory, whereas Malaysia is representative of countries with no history ofdefault or high inflation.
Moving between Debt Intolerance Regions
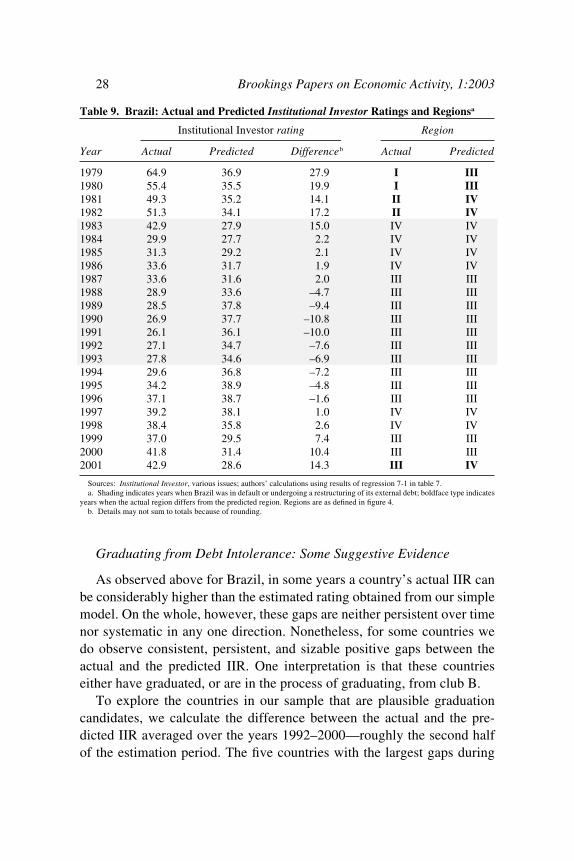
To illustrate how countries in club B can become more or less vulnera-ble over time, table 9 presents an exercise similar to that in table 8 for thecase of Brazil. The main difference is that, this time, rather than usinghypothetical debt ratios, we estimate IIRs for Brazil using the country’sactual external debt-to-GNP ratios for each year from 1979 to 2001. Inaddition to these estimated IIRs, we report Brazil’s actual IIR in the sameyear as well as the difference between the two. The last two columnsshow the debt intolerance region within club B in which Brazil actually
26 Brookings Papers on Economic Activity, 1:2003
1440-01 BPEA/Reinhart 07/17/03 08:11 Page 26
found itself (based on its external debt and actual IIR, as described in fig-ure 4) and the region in which it would have fallen based on its externaldebt and the estimated IIR. The shaded area indicates the period whenBrazil’s external debt was in default or undergoing a restructuring, andthe characters in boldface in the last two columns indicate the years inwhich discrepancies are observed between the actual and the estimatedregion.
A pattern worth remarking is that Brazil started the estimation periodin 1979 with a fairly high IIR, and although its IIR declined thereafter, itremained quite high until the default and restructuring of 1983. Also, thegap between Brazil’s actual and its estimated IIR is highest in the runup tothat credit event. According to its actual IIR and external debt ratio, Brazilwas in the relatively safe region II on the eve of its 1983 default, whereasaccording to our estimated IIR it belonged in the most debt-intolerantregion (region IV). After the credit event, Brazil remained in the mostdebt-intolerant region for a few years by both measures. It is noteworthythat, whereas the actual IIR was well above the estimated IIR in the yearsprior to default, it was below the estimated measure in several of the yearsfollowing the initial default (although the gap was not large enough togenerate a discrepancy between the actual and the predicted region). Thispattern is also evident in many other episodes in our sample (not shown)and lends support to the view that ratings tend to be procyclical.
Carmen M. Reinhart, Kenneth S. Rogoff, and Miguel A. Savastano 27
Table 8. Predicted Institutional Investor Ratings and Debt Intolerance Regions for Argentina and Malaysia
External debt-to-GDP ratio(percent) Predicted IIR Regiona Predicted IIR Regiona
0 51.4 I 61.1 I5 49.3 I 59.0 I
10 47.3 I 57.0 I15 45.2 III 54.9 I20 43.2 III 52.9 I25 41.1 III 50.8 I30 39.1 III 48.8 I35 37.0 III 46.7 II40 34.9 IV 44.7 IV45 32.9 IV 42.6 IV
Source: Authors’ calculations based on results of regression 7-1 in table 7.a. Regions are as defined in figure 4.
Argentina Malaysia
1440-01 BPEA/Reinhart 07/17/03 08:11 Page 27
Graduating from Debt Intolerance: Some Suggestive Evidence
As observed above for Brazil, in some years a country’s actual IIR canbe considerably higher than the estimated rating obtained from our simplemodel. On the whole, however, these gaps are neither persistent over timenor systematic in any one direction. Nonetheless, for some countries wedo observe consistent, persistent, and sizable positive gaps between theactual and the predicted IIR. One interpretation is that these countrieseither have graduated, or are in the process of graduating, from club B.
To explore the countries in our sample that are plausible graduationcandidates, we calculate the difference between the actual and the pre-dicted IIR averaged over the years 1992–2000—roughly the second halfof the estimation period. The five countries with the largest gaps during
28 Brookings Papers on Economic Activity, 1:2003
Table 9. Brazil: Actual and Predicted Institutional Investor Ratings and Regionsa
Institutional Investor rating Region
Year Actual Predicted Differenceb Actual Predicted
1979 64.9 36.9 27.9 I III1980 55.4 35.5 19.9 I III1981 49.3 35.2 14.1 II IV1982 51.3 34.1 17.2 II IV1983 42.9 27.9 15.0 IV IV1984 29.9 27.7 2.2 IV IV1985 31.3 29.2 2.1 IV IV1986 33.6 31.7 1.9 IV IV1987 33.6 31.6 2.0 III III1988 28.9 33.6 –4.7 III III1989 28.5 37.8 –9.4 III III1990 26.9 37.7 –10.8 III III1991 26.1 36.1 –10.0 III III1992 27.1 34.7 –7.6 III III1993 27.8 34.6 –6.9 III III1994 29.6 36.8 –7.2 III III1995 34.2 38.9 –4.8 III III1996 37.1 38.7 –1.6 III III1997 39.2 38.1 1.0 IV IV1998 38.4 35.8 2.6 IV IV1999 37.0 29.5 7.4 III III2000 41.8 31.4 10.4 III III2001 42.9 28.6 14.3 III IV
Sources: Institutional Investor, various issues; authors’ calculations using results of regression 7-1 in table 7.a. Shading indicates years when Brazil was in default or undergoing a restructuring of its external debt; boldface type indicates
years when the actual region differs from the predicted region. Regions are as defined in figure 4.b. Details may not sum to totals because of rounding.
1440-01 BPEA/Reinhart 07/17/03 08:11 Page 28
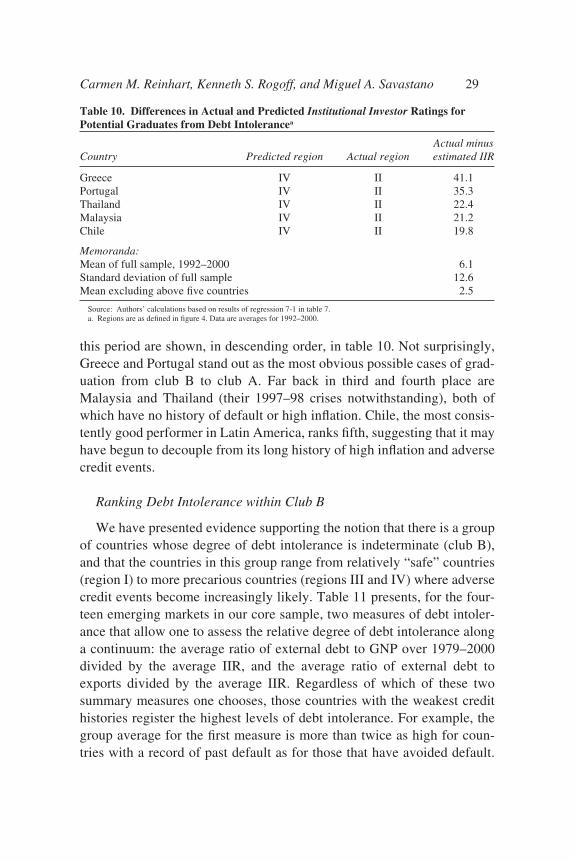
this period are shown, in descending order, in table 10. Not surprisingly,Greece and Portugal stand out as the most obvious possible cases of grad-uation from club B to club A. Far back in third and fourth place areMalaysia and Thailand (their 1997–98 crises notwithstanding), both ofwhich have no history of default or high inflation. Chile, the most consis-tently good performer in Latin America, ranks fifth, suggesting that it mayhave begun to decouple from its long history of high inflation and adversecredit events.
Ranking Debt Intolerance within Club B
We have presented evidence supporting the notion that there is a groupof countries whose degree of debt intolerance is indeterminate (club B),and that the countries in this group range from relatively “safe” countries(region I) to more precarious countries (regions III and IV) where adversecredit events become increasingly likely. Table 11 presents, for the four-teen emerging markets in our core sample, two measures of debt intoler-ance that allow one to assess the relative degree of debt intolerance alonga continuum: the average ratio of external debt to GNP over 1979–2000divided by the average IIR, and the average ratio of external debt toexports divided by the average IIR. Regardless of which of these twosummary measures one chooses, those countries with the weakest credithistories register the highest levels of debt intolerance. For example, thegroup average for the first measure is more than twice as high for coun-tries with a record of past default as for those that have avoided default.
Carmen M. Reinhart, Kenneth S. Rogoff, and Miguel A. Savastano 29
Table 10. Differences in Actual and Predicted Institutional Investor Ratings forPotential Graduates from Debt Intolerancea
Actual minus Country Predicted region Actual region estimated IIR
Greece IV II 41.1Portugal IV II 35.3Thailand IV II 22.4Malaysia IV II 21.2Chile IV II 19.8
Memoranda:Mean of full sample, 1992–2000 6.1Standard deviation of full sample 12.6Mean excluding above five countries 2.5
Source: Authors’ calculations based on results of regression 7-1 in table 7.a. Regions are as defined in figure 4. Data are averages for 1992–2000.
1440-01 BPEA/Reinhart 07/17/03 08:11 Page 29
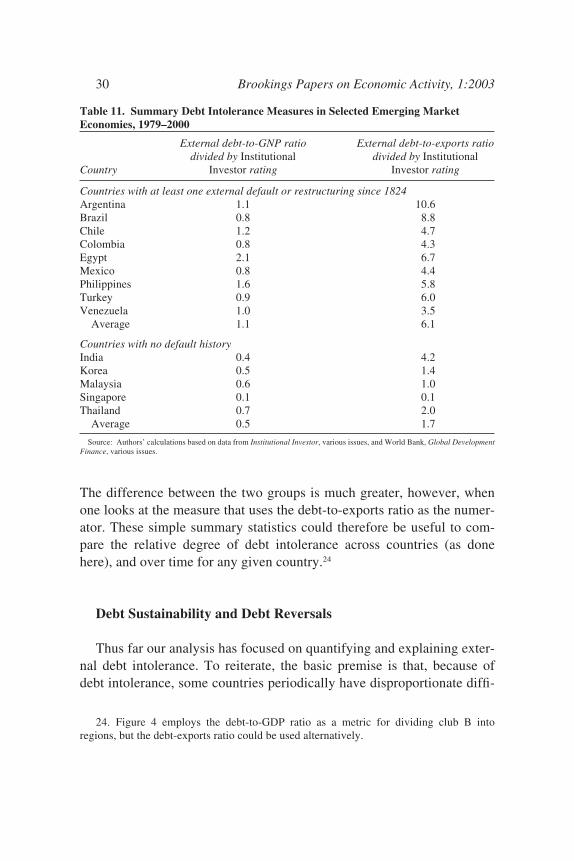
The difference between the two groups is much greater, however, whenone looks at the measure that uses the debt-to-exports ratio as the numer-ator. These simple summary statistics could therefore be useful to com-pare the relative degree of debt intolerance across countries (as donehere), and over time for any given country.24
Debt Sustainability and Debt Reversals
Thus far our analysis has focused on quantifying and explaining exter-nal debt intolerance. To reiterate, the basic premise is that, because ofdebt intolerance, some countries periodically have disproportionate diffi-
30 Brookings Papers on Economic Activity, 1:2003
24. Figure 4 employs the debt-to-GDP ratio as a metric for dividing club B intoregions, but the debt-exports ratio could be used alternatively.
Table 11. Summary Debt Intolerance Measures in Selected Emerging MarketEconomies, 1979–2000
External debt-to-GNP ratio External debt-to-exports ratio divided by Institutional divided by Institutional
Country Investor rating Investor rating
Countries with at least one external default or restructuring since 1824Argentina 1.1 10.6Brazil 0.8 8.8Chile 1.2 4.7Colombia 0.8 4.3Egypt 2.1 6.7Mexico 0.8 4.4Philippines 1.6 5.8Turkey 0.9 6.0Venezuela 1.0 3.5
Average 1.1 6.1
Countries with no default historyIndia 0.4 4.2Korea 0.5 1.4Malaysia 0.6 1.0Singapore 0.1 0.1Thailand 0.7 2.0
Average 0.5 1.7
Source: Authors’ calculations based on data from Institutional Investor, various issues, and World Bank, Global DevelopmentFinance, various issues.
1440-01 BPEA/Reinhart 07/17/03 08:11 Page 30
culty repaying their debts on the original terms, even at levels of indebt-edness that would be considered moderate for countries that are not debtintolerant. Here we first discuss the implications of debt intolerance forstandard debt sustainability analyses, and then turn our attention to whatwe call debt reversals—episodes during which countries have managed tosignificantly reduce their external debt relative to GNP. The latter analy-sis will show that debt-intolerant countries very rarely achieve significantreductions in their debt burden solely through sustained growth or lowerinterest rates, but instead require some kind of adverse credit event(default or restructuring) to reduce their debt. In addition, the analysiswill show that, following such an event, governments in emerging marketcountries often quickly amass debt once again, and the symptoms of debtintolerance reemerge, often leading to serial default. This evidence willuncover some critical shortcomings of standard sustainability exercises.
Implications of Debt Intolerance for Debt Sustainability Analysis
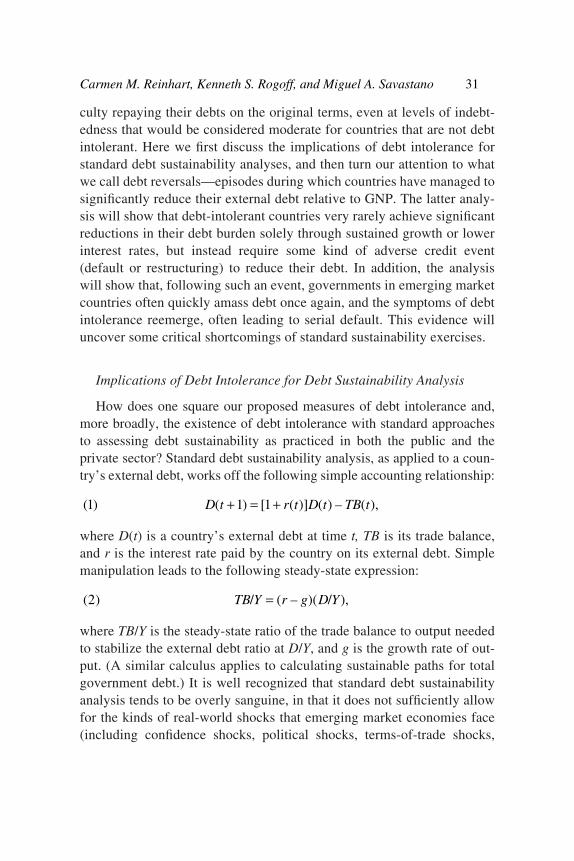
How does one square our proposed measures of debt intolerance and,more broadly, the existence of debt intolerance with standard approachesto assessing debt sustainability as practiced in both the public and theprivate sector? Standard debt sustainability analysis, as applied to a coun-try’s external debt, works off the following simple accounting relationship:
where D(t) is a country’s external debt at time t, TB is its trade balance,and r is the interest rate paid by the country on its external debt. Simplemanipulation leads to the following steady-state expression:
where TB/Y is the steady-state ratio of the trade balance to output neededto stabilize the external debt ratio at D/Y, and g is the growth rate of out-put. (A similar calculus applies to calculating sustainable paths for totalgovernment debt.) It is well recognized that standard debt sustainabilityanalysis tends to be overly sanguine, in that it does not sufficiently allowfor the kinds of real-world shocks that emerging market economies face(including confidence shocks, political shocks, terms-of-trade shocks,
( ) / ( – )( / ),2 TB Y r g D Y=
( ) ( ) [ ( )] ( ) – ( ),1 1 1D t r t D t TB t+ = +
Carmen M. Reinhart, Kenneth S. Rogoff, and Miguel A. Savastano 31
1440-01 BPEA/Reinhart 07/17/03 08:11 Page 31
and, not least, shocks to returns in industrial countries). Efforts havetherefore been made to find ways to “stress-test” these sustainabilitycalculations.25
Such efforts are useful, but our analysis of debt intolerance suggeststhat it is also crucial to take other factors into account. First, it is neces-sary to recognize that the interest rate a country must pay on its debt is anendogenous variable, which depends, among other things, on the coun-try’s debt-to-output (or debt-to-exports) ratio. Because the interest rate ondebt to private creditors can rise very sharply with the level of debt (therate charged by official creditors, such as the international financial insti-tutions, typically does not change), a trajectory that may seem margin-ally sustainable according to standard calculations may in fact be muchmore problematic when debt intolerance is taken into account (not anuncommon situation, to say the least). This is particularly likely in situa-tions where a country’s debt-to-GNP ratio is initially projected to rise inthe near future, and only later projected to fall (again, a very commonsituation).
Second, sustainability analyses need to take into account that a coun-try’s initial level of debt (scaled by output or exports) may alreadyexceed, or be close to exceeding, what history suggests is that country’stolerable debt burden. In cases where the initial level of debt or the initialrise in D/Y takes a club B country into a region of extreme debt intoler-ance (that is, into region IV), conventional sustainability analyses are notlikely to be meaningful or useful. Once a country is in the “risk of default”region identified in sovereign debt models and approximated by our ear-lier analysis,26 there is a risk of both dramatically higher interest rates anda sudden loss of access to market financing. And, as we will see below,the probability that a “virtuous cycle” of falling interest rates and rapidgrowth will take the country’s debt burden back to a safe region is, unfor-tunately, typically low.
32 Brookings Papers on Economic Activity, 1:2003
25. See International Monetary Fund (2002) for a recent discussion of theseapproaches. As noted, the approaches sometimes focus on total government debt ratherthan total external debt, but the issues raised here are similar for both. See Williamson(2002) and Goldstein (2003) for recent applications of the standard framework to the caseof Brazil.
26. Such models include those of Obstfeld (1994), Velasco (1996), Morris and Shin(forthcoming), and Jahjah and Montiel (2003).
1440-01 BPEA/Reinhart 07/17/03 08:11 Page 32
Identifying Debt Reversals
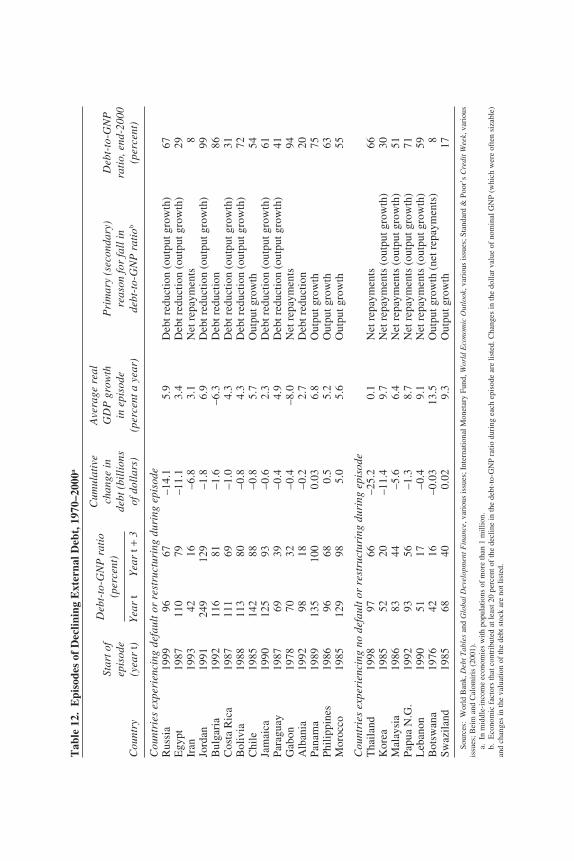
To identify episodes of large debt reversals for middle- and low-income countries over the period 1970–2000, we select all episodeswhere the ratio of external debt to GNP fell 25 percentage points or morewithin any three-year period, and then ascertain whether the decline inthis ratio was caused by a fall in the numerator, a rise in the denominator,or some combination of the two.27 To exclude cases where the decline inthe ratio was primarily driven by changes in the nominal value of dollarGNP, we consider only those episodes where either the decline in the dol-lar value of external debt was 10 percent or more over the three-year win-dow, or average growth in the three-year period was 5 percent a year orhigher. This two-stage approach allows us to identify the proximatecauses of the debt reversal. If it is a decline in debt, it may be due to eitherrepayment or some type of reduction in the present value of debt (that is,a restructuring); alternatively, if the decline was due primarily (or solely)to growth, it suggests that the country grew out of its debt.
We conducted the exercise for both low- and middle-income developingeconomies. The algorithm yielded a total of fifty-three debt reversal episodesfor the period 1970–2000, twenty-six of which occurred in middle-incomecountries and the rest in low-income countries.
The Debt Reversal Episodes
Table 12 lists those debt reversal episodes that occurred in middle-income developing countries with populations of at least 1 million, sepa-rating those cases that involved an adverse credit event (a default or arestructuring) from those that did not.28 Of the twenty-two debt reversalsidentified, fifteen coincided with some type of default or restructuring ofexternal debt obligations. In five of the seven episodes that did not coin-cide with a credit event, the debt reversal was primarily effected throughnet debt repayments; in only one of these episodes (Swaziland in 1985)did the debt ratio decline strictly because the country grew out of its debt.However, growth was also the principal factor explaining the decline inthe debt ratio in four of the fifteen credit event cases (Chile, Morocco,
Carmen M. Reinhart, Kenneth S. Rogoff, and Miguel A. Savastano 33
27. Our basic results appear reasonably robust to our choice of “windows” of 25 per-cent decline and three years—see the analysis of Brady plan countries below, however.
28. A similar table summarizing the debt reversals of the low-income countries isavailable from the authors upon request.
1440-01 BPEA/Reinhart 07/17/03 08:11 Page 33
Tab
le 1
2.E
piso
des
of D
eclin
ing
Ext
erna
l Deb
t, 1
970–
2000
a
Cum
ulat
ive
Ave
rage
rea
l St
art o
fch
ange
in
GD
P g
row
th
Pri
mar
y (s
econ
dary
)D
ebt-
to-G
NP
epis
ode
debt
(bi
llio
ns
in e
piso
de
reas
on fo
r fa
ll in
ra
tio,
end
-200
0 C
ount
ry(y
ear
t)Y
ear
tY
ear
t+3
of d
olla
rs)
(per
cent
a y
ear)
debt
-to-
GN
P r
atio
b(p
erce
nt)
Cou
ntri
es e
xper
ienc
ing
defa
ult o
r re
stru
ctur
ing
duri
ng e
piso
deR
ussi
a19
9996
67–1
4.1
5.9
Deb
t red
ucti
on (
outp
ut g
row
th)
67E
gypt
1987
110
79–1
1.1
3.4
Deb
t red
ucti
on (
outp
ut g
row
th)
29Ir
an19
9342
16–6
.83.
1N
et r
epay
men
ts8
Jord
an19
9124
912
9–1
.86.
9D
ebt r
educ
tion
(ou
tput
gro
wth
)99
Bul
gari
a19
9211
681
–1.6
–6.3
Deb
t red
ucti
on
86C
osta
Ric
a19
8711
169
–1.0
4.3
Deb
t red
ucti
on (
outp
ut g
row
th)
31B
oliv
ia19
8811
380
–0.8
4.3
Deb
t red
ucti
on (
outp
ut g
row
th)
72C
hile
1985
142
88–0
.85.
7O
utpu
t gro
wth
54Ja
mai
ca19
9012
593
–0.6
2.3
Deb
t red
ucti
on (
outp
ut g
row
th)
61P
arag
uay
1987
6939
–0.4
4.9
Deb
t red
ucti
on (
outp
ut g
row
th)
41G
abon
1978
7032
–0.4
–8.0
Net
rep
aym
ents
94A
lban
ia19
9298
18–0
.22.
7D
ebt r
educ
tion
20P
anam
a19
8913
510
00.
036.
8O
utpu
t gro
wth
75P
hili
ppin
es19
8696
680.
55.
2O
utpu
t gro
wth
63M
oroc
co19
8512
998
5.0
5.6
Out
put g
row
th55
Cou
ntri
es e
xper
ienc
ing
no d
efau
lt o
r re
stru
ctur
ing
duri
ng e
piso
deT
hail
and
1998
9766
–25.
20.
1N
et r
epay
men
ts66
Kor
ea19
8552
20–1
1.4
9.7
Net
rep
aym
ents
(ou
tput
gro
wth
)30
Mal
aysi
a19
8683
44–5
.66.
4N
et r
epay
men
ts (
outp
ut g
row
th)
51P
apua
N.G
.19
9293
56–1
.38.
7N
et r
epay
men
ts (
outp
ut g
row
th)
71L
eban
on19
9051
17–0
.49.
1N
et r
epay
men
ts (
outp
ut g
row
th)
59B
otsw
ana
1976
4216
–0.0
313
.5O
utpu
t gro
wth
(ne
t rep
aym
ents
)8
Sw
azil
and
1985
6840
0.02
9.3
Out
put g
row
th17
Sou
rces
:W
orld
Ban
k, D
ebt T
able
san
d G
loba
l Dev
elop
men
t Fin
ance
, var
ious
issu
es; I
nter
nati
onal
Mon
etar
y F
und,
Wor
ld E
cono
mic
Out
look
, var
ious
issu
es; S
tand
ard
& P
oor’
s C
redi
t Wee
k, v
ario
usis
sues
; Bei
m a
nd C
alom
iris
(20
01).
a.In
mid
dle-
inco
me
econ
omie
s w
ith
popu
lati
ons
of m
ore
than
1 m
illi
on.
b.E
cono
mic
fac
tors
that
con
trib
uted
at l
east
20
perc
ent o
f th
e de
clin
e in
the
debt
-to-
GN
P r
atio
dur
ing
each
epi
sode
are
list
ed. C
hang
es in
the
doll
ar v
alue
of
nom
inal
GN
P (
whi
ch w
ere
ofte
n si
zabl
e)an
d ch
ange
s in
the
valu
atio
n of
the
debt
sto
ck a
re n
ot li
sted
.
Deb
t-to
-GN
P r
atio
(per
cent
)
1440-01 BPEA/Reinhart 07/17/03 08:11 Page 34
Panama, and the Philippines) and a lesser factor in seven of those epi-sodes, as well as in four episodes that did not coincide with a credit event.Overall, this exercise shows that growth alone is typically not sufficient toallow countries to substantially reduce their debt burden—yet anotherreason to be skeptical of overly sanguine standard sustainability calcula-tions for debt-intolerant countries.
Of those cases involving credit events, Russia and Egypt obtained byfar the largest reductions in their nominal debt burden in their restructur-ing deals: $14 billion and $11 billion, respectively. Two countriesinvolved in the 1997–98 Asian crisis—Thailand and Korea—engineeredthe largest debt repayments among those episodes where a credit eventwas avoided.
Conspicuously absent from the large debt reversal episodes shown intable 12 are the well-known Brady restructuring deals of the 1990s.Although our algorithm does place Bulgaria, Costa Rica, Jordan, Nigeria,and Vietnam in the debt reversal category, larger countries such as Brazil,Mexico, and Poland do not register. The reasons for this apparent puzzleare examined below.
The Missing Brady Bunch: Episodes of Rapid Releveraging
Table 13 traces the evolution of external debt in the seventeen develop-ing countries whose external obligations were restructured under theumbrella of the Brady Plan deals pioneered by Mexico and Costa Rica inthe late 1980s.29 It is clear from the table why our debt reversal algorithmfailed to pick up twelve of these seventeen countries. In ten of those twelvecases, the reason is that the decline in the external debt-to-GNP ratio pro-duced by the Brady restructuring was less than 25 percentage points. Butthis is only part of the story. Argentina, Nigeria, and Peru had higher debt-to-GNP ratios just three years after their Brady deals than in the yearbefore the restructuring. Moreover, by the end of 2000, seven of the seven-teen countries that had undertaken a Brady-type restructuring (Argentina,Brazil, Ecuador, Peru, the Philippines, Poland, and Uruguay) had ratios ofexternal debt to GNP that were higher than they were three years after theBrady deal, and four of those countries (Argentina, Brazil, Ecuador, andPeru) had higher debt ratios by the end of 2000 than just before the Brady
Carmen M. Reinhart, Kenneth S. Rogoff, and Miguel A. Savastano 35
29. For details on the Brady debt restructurings of the 1990s, see Cline (1995) andInternational Monetary Fund (1995). For a survey of the debate prior to the Brady Plan seeWilliamson (1988).
1440-01 BPEA/Reinhart 07/17/03 08:11 Page 35
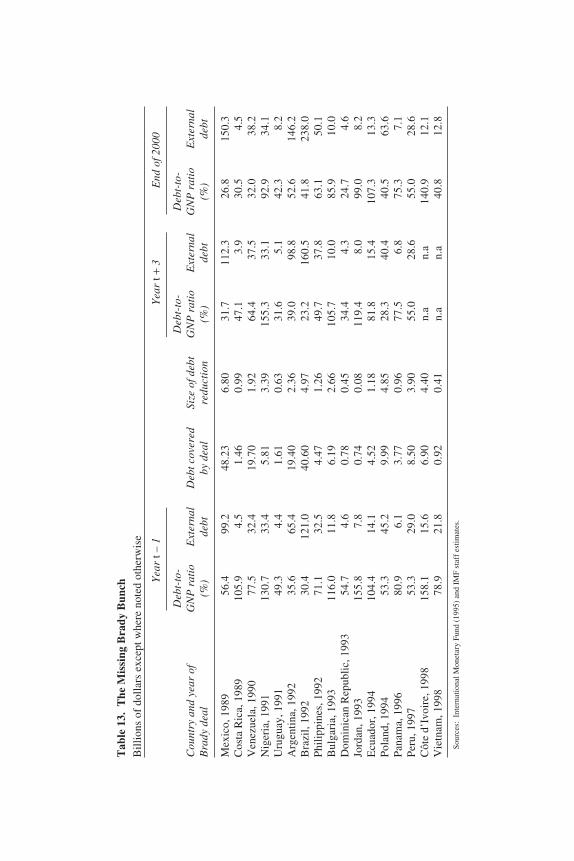
Tab
le 1
3.T
he M
issi
ng B
rady
Bun
chB
illi
ons
of d
olla
rs e
xcep
t whe
re n
oted
oth
erw
ise
Yea
r t–
1Y
ear
t+3
End
of 2
000
Deb
t-to
-D
ebt-
to-
Deb
t-to
-C
ount
ry a
nd y
ear
ofG
NP
rat
ioE
xter
nal
Deb
t cov
ered
Si
ze o
f deb
t G
NP
rat
io
Ext
erna
l G
NP
rat
ioE
xter
nal
Bra
dy d
eal
(%)
debt
by
dea
lre
duct
ion
(%)
debt
(%)
debt
Mex
ico,
198
956
.499
.248
.23
6.80
31.7
112.
326
.815
0.3
Cos
ta R
ica,
198
910
5.9
4.5
1.46
0.99
47.1
3.9
30.5
4.5
Ven
ezue
la, 1
990
77.5
32.4
19.7
01.
9264
.437
.532
.038
.2N
iger
ia, 1
991
130.
733
.45.
813.
3915
5.3
33.1
92.9
34.1
Uru
guay
, 199
149
.34.
41.
610.
6331
.65.
142
.38.
2A
rgen
tina
, 199
235
.665
.419
.40
2.36
39.0
98.8
52.6
146.
2B
razi
l, 19
9230
.412
1.0
40.6
04.
9723
.216
0.5
41.8
238.
0P
hili
ppin
es, 1
992
71.1
32.5
4.47
1.26
49.7
37.8
63.1
50.1
Bul
gari
a, 1
993
116.
011
.86.
192.
6610
5.7
10.0
85.9
10.0
Dom
inic
an R
epub
lic,
199
354
.74.
60.
780.
4534
.44.
324
.74.
6Jo
rdan
, 199
315
5.8
7.8
0.74
0.08
119.
48.
099
.08.
2E
cuad
or, 1
994
104.
414
.14.
521.
1881
.815
.410
7.3
13.3
Pol
and,
199
453
.345
.29.
994.
8528
.340
.440
.563
.6P
anam
a, 1
996
80.9
6.1
3.77
0.96
77.5
6.8
75.3
7.1
Per
u, 1
997
53.3
29.0
8.50
3.90
55.0
28.6
55.0
28.6
Côt
e d’
Ivoi
re, 1
998
158.
115
.66.
904.
40n.
an.
a14
0.9
12.1
Vie
tnam
, 199
8 78
.921
.80.
920.
41n.
an.
a40
.812
.8
Sou
rces
:In
tern
atio
nal M
onet
ary
Fun
d (1
995)
and
IM
F s
taff
est
imat
es.
1440-01 BPEA/Reinhart 07/17/03 08:11 Page 36
deal. By 2002 three members of the Brady bunch had once again defaultedon their external debt (Argentina, Côte d’Ivoire, and Ecuador), and a fewothers were teetering on the brink. The evidence clearly suggests that,when assessing debt restructuring programs for highly debt-intolerantcountries, it is critical to ask whether measures can be taken to reduce thelikelihood of the problem remerging in the near term.
Domestic Debt, Dollarization, and Liberalization
Up to this point, our analysis of debt intolerance has focused on acountry’s total external debt. The reasons for this are twofold. First, untilrecently, the theoretical literature on public debt in emerging marketeconomies focused primarily on external debt rather than on total govern-ment debt. This common practice was grounded in the observation thatgovernments in most emerging markets had little scope for financing theirfiscal deficits by resorting to the domestic placement of marketable debt.Second, a key point of our empirical analysis has been to show that theexternal debt burdens that countries are able, and have been able, to toler-ate are systematically related to their own credit and inflation histories.We have investigated this proposition using time series for countries’level of external indebtedness dating back to the 1970s. Unfortunately,there is not a sufficient past record to allow a comparable empirical analy-sis of domestic government debt. That said, an early read of the availableevidence suggests that a history of external debt intolerance is probably agood predictor of domestic debt intolerance today.
Domestically issued, market-based government debt has becomeincreasingly important for emerging market economies, both as a sourceof government financing and as a trigger for generalized debt and finan-cial crises. Domestically issued foreign currency debt (the infamoustesobonos) was at the center of the Mexican crisis of December 1994.Such debt also contributed to the costly collapse of the convertibilityregime in Argentina in late 2001. And that debt presently accounts for thelion’s share of public debt in Brazil and Turkey and will ultimately deter-mine the fate of those countries’ efforts at financial stabilization. Argen-tina, Brazil, Mexico, and Turkey, of course, all exhibit high external debtintolerance by our historical measures.
Recognizing this fact, in this section we discuss some conceptualissues related to the role of domestic government debt in emerging market
Carmen M. Reinhart, Kenneth S. Rogoff, and Miguel A. Savastano 37
1440-01 BPEA/Reinhart 07/17/03 08:11 Page 37
economies, and we document and explain some related manifestations ofdebt intolerance—such as dollarization—and offer some explanations forthe rapid growth of domestic government debt in recent years. The growthof such debt turns out to be a widespread phenomenon in these econo-mies. We conjecture that, in the future, the same historical factors thatexplain external debt intolerance will extend to domestic debt intolerance,as will the conclusions we have drawn about how rare it is for countries togrow their way out of heavy indebtedness.
There is no easy way to aggregate domestically issued and externallyissued government debt for the purpose of assessing financial vulner-ability or the likelihood of a debt crisis, and views differ on how to doso.30 To be sure, the view that external debt is completely separable fromdomestically issued debt is dead wrong. As a by-product of capital mobil-ity and financial integration, foreigners hold increasingly large amountsof the domestically issued debt of governments of emerging markets, andtheir residents increasingly hold instruments issued by governments inadvanced economies. Financial integration and open capital accountsencourage active arbitrage across the two markets. In such a setting, adefault on domestic government debt can easily trigger a default on for-eign debt, first for reputational reasons, and second because induced out-put and exchange rate effects can easily affect a country’s prospects forservicing its foreign debt, not least through the havoc that domesticdefault wreaks on the banking system.
That said, it is also clearly wrong to assume that domestically issuedand foreign-issued debt are perfect substitutes. First, foreigners typicallydo hold a large share of externally issued debt, whereas domestic resi-dents typically hold most domestically issued debt. Second, the risks of acutoff of international trade credits and the risks to future internationalborrowing are undeniably greater following a default on foreign-issueddebt. Thus the default calculus simply cannot be the same for the twoclasses of debt instruments, and they will not, in general, be equivalent.(The fundamental distinction between them is clearly reflected in the factthat, at times, rating agencies give the sovereign foreign-issued debt of acountry a significantly higher grade than its domestically issued debt.)
38 Brookings Papers on Economic Activity, 1:2003
30. The recent IMF study on debt sustainability, for example, proposes to undertakeparallel assessments of external and public (domestic and external) debt burdens (Interna-tional Monetary Fund, 2002).
1440-01 BPEA/Reinhart 07/17/03 08:11 Page 38
Given the lack of theoretical clarity on the distinction between foreign-issued and domestically issued government debt, our objective in this sec-tion is to present some basic facts and explore whether the symptoms ofdebt intolerance seem broadly similar for both types of instrument. Weleave it to future research to delineate more clearly the dividing linesbetween domestic and external debt in a global economy.
The Growth of Domestic Government Debt: New Data
Figure 5 illustrates the rapid growth of marketable domestic govern-ment debt in emerging market economies in the late 1990s. By the end of2001, the stock of domestic government debt of the twenty-four countriesrepresented in the figure amounted to approximately $800 billion. Morethan 25 percent of that stock consisted of debt linked to a foreign cur-rency, and the bulk of the rest was often indexed to some other marketvariable (for example, as of the end of 2002, about 45 percent of Brazil’sdomestic government debt was linked to the overnight interest rate). Thefraction of domestic government debt that is not indexed to a market vari-able is typically of very short maturity. Indeed, the successful issuance ofnonindexed domestic currency bonds for long-term financing remains aselusive today for the majority of emerging market economies as it wastwo or three decades ago.
These trends suggest that domestic debt intolerance can manifest itselfin a manner similar to external debt intolerance. Indeed, as we will latershow for dollarization, many of the variables typically linked to the vul-nerability of a country’s debt position (maturity structure, indexation, andthe like) are manifestations of debt intolerance and may be viewed aslinked to a common set of factors.
The surge in domestic government debt is also apparent in the emerg-ing market economies that formed the core sample of our analysis ofexternal debt intolerance. Table 14 shows that the stock of domestic gov-ernment debt in this group of countries has increased markedly over thelast two decades. The rise has been particularly large in the Asian coun-tries—both in those with no default history and in the Philippines, whichhas defaulted only once in its modern history. But domestic governmentdebt has also risen significantly in a number of Latin American countries,as well as in Turkey.
Carmen M. Reinhart, Kenneth S. Rogoff, and Miguel A. Savastano 39
1440-01 BPEA/Reinhart 07/17/03 08:11 Page 39
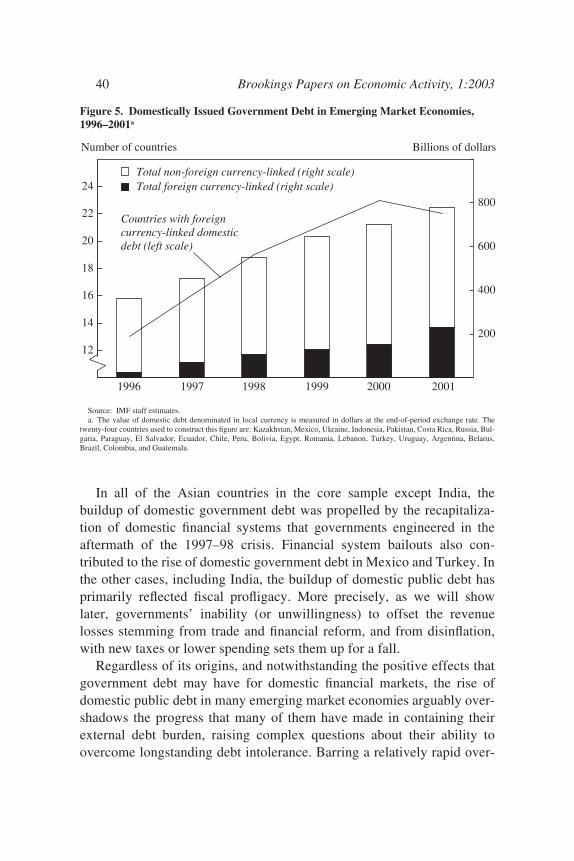
In all of the Asian countries in the core sample except India, thebuildup of domestic government debt was propelled by the recapitaliza-tion of domestic financial systems that governments engineered in theaftermath of the 1997–98 crisis. Financial system bailouts also con-tributed to the rise of domestic government debt in Mexico and Turkey. Inthe other cases, including India, the buildup of domestic public debt hasprimarily reflected fiscal profligacy. More precisely, as we will showlater, governments’ inability (or unwillingness) to offset the revenuelosses stemming from trade and financial reform, and from disinflation,with new taxes or lower spending sets them up for a fall.
Regardless of its origins, and notwithstanding the positive effects thatgovernment debt may have for domestic financial markets, the rise ofdomestic public debt in many emerging market economies arguably over-shadows the progress that many of them have made in containing theirexternal debt burden, raising complex questions about their ability toovercome longstanding debt intolerance. Barring a relatively rapid over-
40 Brookings Papers on Economic Activity, 1:2003
Figure 5. Domestically Issued Government Debt in Emerging Market Economies,1996–2001a
Source: IMF staff estimates.a. The value of domestic debt denominated in local currency is measured in dollars at the end-of-period exchange rate. The
twenty-four countries used to construct this figure are: Kazakhstan, Mexico, Ukraine, Indonesia, Pakistan, Costa Rica, Russia, Bul-garia, Paraguay, El Salvador, Ecuador, Chile, Peru, Bolivia, Egypt, Romania, Lebanon, Turkey, Uruguay, Argentina, Belarus,Brazil, Colombia, and Guatemala.
12
14
16
18
20
22
24
1996 1997 1998 1999 2000 2001
200
400
600
800
Countries with foreign currency-linked domestic debt (left scale)
Total non-foreign currency-linked (right scale)Total foreign currency-linked (right scale)
Number of countries Billions of dollars
1440-01 BPEA/Reinhart 07/17/03 08:11 Page 40
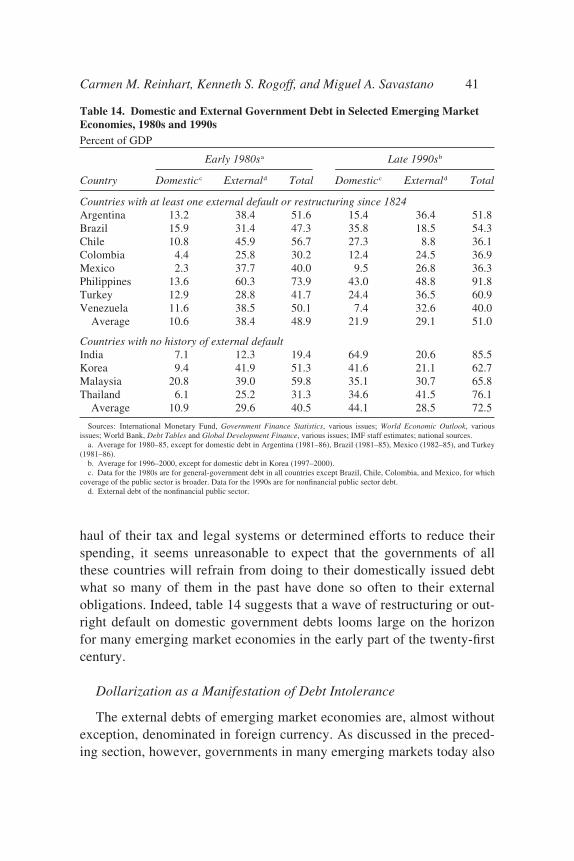
haul of their tax and legal systems or determined efforts to reduce theirspending, it seems unreasonable to expect that the governments of allthese countries will refrain from doing to their domestically issued debtwhat so many of them in the past have done so often to their externalobligations. Indeed, table 14 suggests that a wave of restructuring or out-right default on domestic government debts looms large on the horizonfor many emerging market economies in the early part of the twenty-firstcentury.
Dollarization as a Manifestation of Debt Intolerance
The external debts of emerging market economies are, almost withoutexception, denominated in foreign currency. As discussed in the preced-ing section, however, governments in many emerging markets today also
Carmen M. Reinhart, Kenneth S. Rogoff, and Miguel A. Savastano 41
Table 14. Domestic and External Government Debt in Selected Emerging MarketEconomies, 1980s and 1990sPercent of GDP
Early 1980sa Late 1990sb
Country Domesticc Externald Total Domesticc Externald Total
Countries with at least one external default or restructuring since 1824Argentina 13.2 38.4 51.6 15.4 36.4 51.8Brazil 15.9 31.4 47.3 35.8 18.5 54.3Chile 10.8 45.9 56.7 27.3 8.8 36.1Colombia 4.4 25.8 30.2 12.4 24.5 36.9Mexico 2.3 37.7 40.0 9.5 26.8 36.3Philippines 13.6 60.3 73.9 43.0 48.8 91.8Turkey 12.9 28.8 41.7 24.4 36.5 60.9Venezuela 11.6 38.5 50.1 7.4 32.6 40.0
Average 10.6 38.4 48.9 21.9 29.1 51.0
Countries with no history of external defaultIndia 7.1 12.3 19.4 64.9 20.6 85.5Korea 9.4 41.9 51.3 41.6 21.1 62.7Malaysia 20.8 39.0 59.8 35.1 30.7 65.8Thailand 6.1 25.2 31.3 34.6 41.5 76.1
Average 10.9 29.6 40.5 44.1 28.5 72.5
Sources: International Monetary Fund, Government Finance Statistics, various issues; World Economic Outlook, variousissues; World Bank, Debt Tables and Global Development Finance, various issues; IMF staff estimates; national sources.
a. Average for 1980–85, except for domestic debt in Argentina (1981–86), Brazil (1981–85), Mexico (1982–85), and Turkey(1981–86).
b. Average for 1996–2000, except for domestic debt in Korea (1997–2000).c. Data for the 1980s are for general-government debt in all countries except Brazil, Chile, Colombia, and Mexico, for which
coverage of the public sector is broader. Data for the 1990s are for nonfinancial public sector debt.d. External debt of the nonfinancial public sector.
1440-01 BPEA/Reinhart 07/17/03 08:11 Page 41
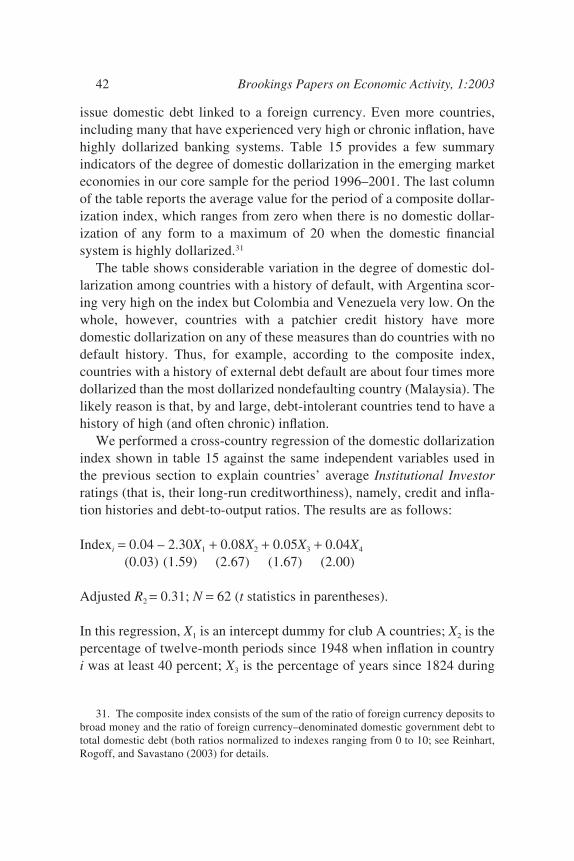
issue domestic debt linked to a foreign currency. Even more countries,including many that have experienced very high or chronic inflation, havehighly dollarized banking systems. Table 15 provides a few summaryindicators of the degree of domestic dollarization in the emerging marketeconomies in our core sample for the period 1996–2001. The last columnof the table reports the average value for the period of a composite dollar-ization index, which ranges from zero when there is no domestic dollar-ization of any form to a maximum of 20 when the domestic financialsystem is highly dollarized.31
The table shows considerable variation in the degree of domestic dol-larization among countries with a history of default, with Argentina scor-ing very high on the index but Colombia and Venezuela very low. On thewhole, however, countries with a patchier credit history have moredomestic dollarization on any of these measures than do countries with nodefault history. Thus, for example, according to the composite index,countries with a history of external debt default are about four times moredollarized than the most dollarized nondefaulting country (Malaysia). Thelikely reason is that, by and large, debt-intolerant countries tend to have ahistory of high (and often chronic) inflation.
We performed a cross-country regression of the domestic dollarizationindex shown in table 15 against the same independent variables used inthe previous section to explain countries’ average Institutional Investorratings (that is, their long-run creditworthiness), namely, credit and infla-tion histories and debt-to-output ratios. The results are as follows:
Indexi = 0.04 – 2.30X1 + 0.08X2 + 0.05X3 + 0.04X4
(0.03) (1.59) (2.67) (1.67) (2.00)
Adjusted R2 = 0.31; N = 62 (t statistics in parentheses).
In this regression, X1 is an intercept dummy for club A countries; X2 is thepercentage of twelve-month periods since 1948 when inflation in countryi was at least 40 percent; X3 is the percentage of years since 1824 during
42 Brookings Papers on Economic Activity, 1:2003
31. The composite index consists of the sum of the ratio of foreign currency deposits tobroad money and the ratio of foreign currency–denominated domestic government debt tototal domestic debt (both ratios normalized to indexes ranging from 0 to 10; see Reinhart,Rogoff, and Savastano (2003) for details.
1440-01 BPEA/Reinhart 07/17/03 08:11 Page 42
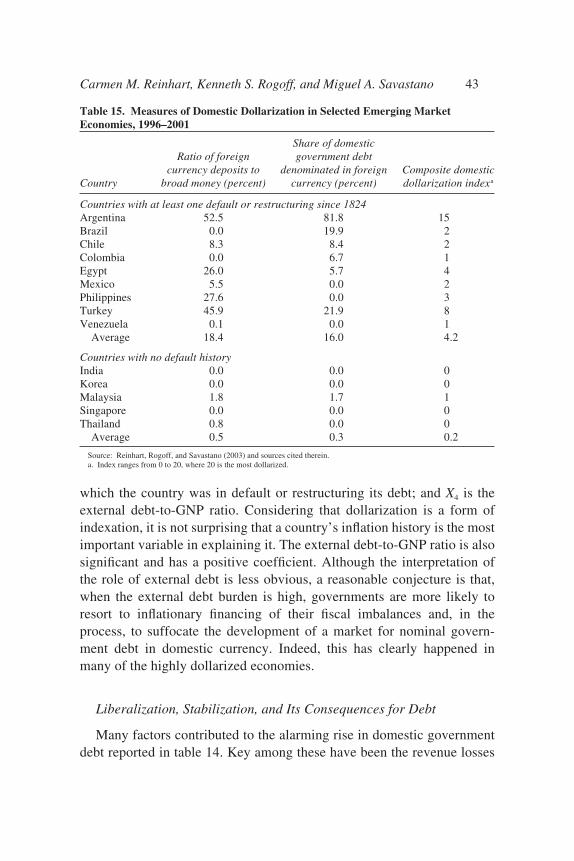
which the country was in default or restructuring its debt; and X4 is theexternal debt-to-GNP ratio. Considering that dollarization is a form ofindexation, it is not surprising that a country’s inflation history is the mostimportant variable in explaining it. The external debt-to-GNP ratio is alsosignificant and has a positive coefficient. Although the interpretation ofthe role of external debt is less obvious, a reasonable conjecture is that,when the external debt burden is high, governments are more likely toresort to inflationary financing of their fiscal imbalances and, in theprocess, to suffocate the development of a market for nominal govern-ment debt in domestic currency. Indeed, this has clearly happened inmany of the highly dollarized economies.
Liberalization, Stabilization, and Its Consequences for Debt
Many factors contributed to the alarming rise in domestic governmentdebt reported in table 14. Key among these have been the revenue losses
Carmen M. Reinhart, Kenneth S. Rogoff, and Miguel A. Savastano 43
Table 15. Measures of Domestic Dollarization in Selected Emerging MarketEconomies, 1996–2001
Share of domesticRatio of foreign government debt
currency deposits to denominated in foreign Composite domesticCountry broad money (percent) currency (percent) dollarization indexa
Countries with at least one default or restructuring since 1824Argentina 52.5 81.8 15Brazil 0.0 19.9 2Chile 8.3 8.4 2Colombia 0.0 6.7 1Egypt 26.0 5.7 4Mexico 5.5 0.0 2Philippines 27.6 0.0 3Turkey 45.9 21.9 8Venezuela 0.1 0.0 1
Average 18.4 16.0 4.2
Countries with no default history India 0.0 0.0 0Korea 0.0 0.0 0Malaysia 1.8 1.7 1Singapore 0.0 0.0 0Thailand 0.8 0.0 0
Average 0.5 0.3 0.2
Source: Reinhart, Rogoff, and Savastano (2003) and sources cited therein.a. Index ranges from 0 to 20, where 20 is the most dollarized.
1440-01 BPEA/Reinhart 07/17/03 08:11 Page 43
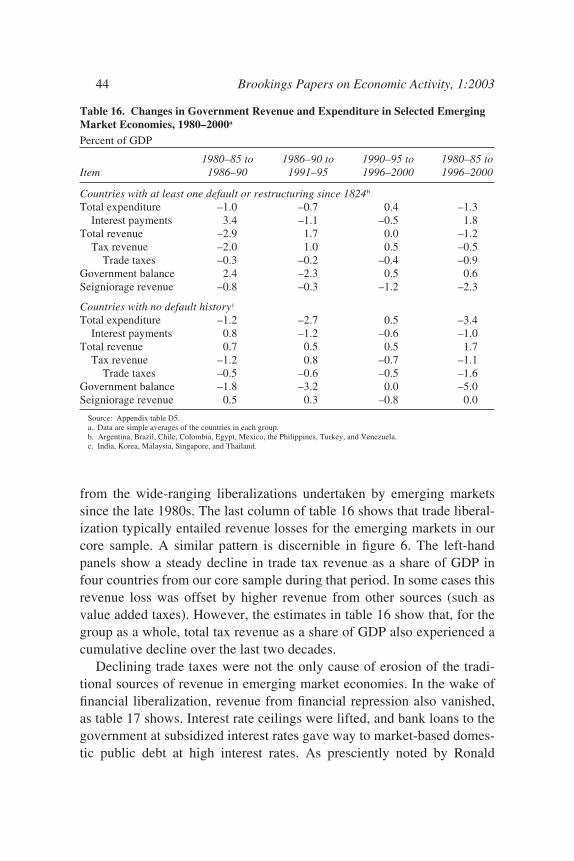
from the wide-ranging liberalizations undertaken by emerging marketssince the late 1980s. The last column of table 16 shows that trade liberal-ization typically entailed revenue losses for the emerging markets in ourcore sample. A similar pattern is discernible in figure 6. The left-handpanels show a steady decline in trade tax revenue as a share of GDP infour countries from our core sample during that period. In some cases thisrevenue loss was offset by higher revenue from other sources (such asvalue added taxes). However, the estimates in table 16 show that, for thegroup as a whole, total tax revenue as a share of GDP also experienced acumulative decline over the last two decades.
Declining trade taxes were not the only cause of erosion of the tradi-tional sources of revenue in emerging market economies. In the wake offinancial liberalization, revenue from financial repression also vanished,as table 17 shows. Interest rate ceilings were lifted, and bank loans to thegovernment at subsidized interest rates gave way to market-based domes-tic public debt at high interest rates. As presciently noted by Ronald
44 Brookings Papers on Economic Activity, 1:2003
Table 16. Changes in Government Revenue and Expenditure in Selected EmergingMarket Economies, 1980–2000a
Percent of GDP
1980–85 to 1986–90 to 1990–95 to 1980–85 to Item 1986–90 1991–95 1996–2000 1996–2000
Countries with at least one default or restructuring since 1824b
Total expenditure –1.0 –0.7 0.4 –1.3Interest payments 3.4 –1.1 –0.5 1.8
Total revenue –2.9 1.7 0.0 –1.2Tax revenue –2.0 1.0 0.5 –0.5
Trade taxes –0.3 –0.2 –0.4 –0.9Government balance 2.4 –2.3 0.5 0.6Seigniorage revenue –0.8 –0.3 –1.2 –2.3
Countries with no default historyc
Total expenditure –1.2 –2.7 0.5 –3.4Interest payments 0.8 –1.2 –0.6 –1.0
Total revenue 0.7 0.5 0.5 1.7Tax revenue –1.2 0.8 –0.7 –1.1
Trade taxes –0.5 –0.6 –0.5 –1.6Government balance –1.8 –3.2 0.0 –5.0Seigniorage revenue 0.5 0.3 –0.8 0.0
Source: Appendix table D5.a. Data are simple averages of the countries in each group.b. Argentina, Brazil, Chile, Colombia, Egypt, Mexico, the Philippines, Turkey, and Venezuela.c. India, Korea, Malaysia, Singapore, and Thailand.
1440-01 BPEA/Reinhart 07/17/03 08:11 Page 44
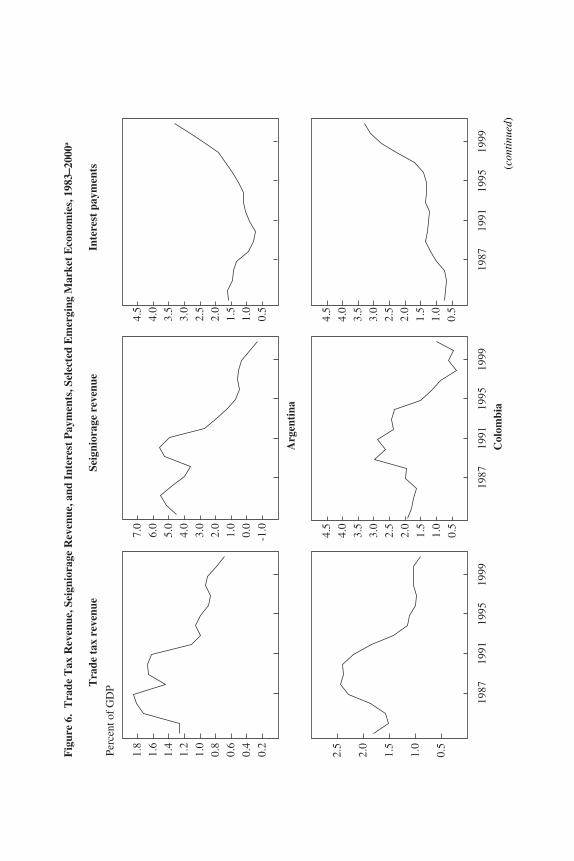
Fig
ure
6.T
rade
Tax
Rev
enue
, Sei
gnio
rage
Rev
enue
, and
Int
eres
t P
aym
ents
, Sel
ecte
d E
mer
ging
Mar
ket
Eco
nom
ies,
198
3–20
00a
0.2
0.4
0.6
0.8
1.0
1.2
1.4
1.6
1.8
-1.00.0
1.0
2.0
3.0
4.0
5.0
6.0
7.0
0.5
1.0
1.5
2.0
2.5
3.0
3.5
4.0
4.5
0.5
1.0
1.5
2.0
2.5
1987
1991
1995
1999
4.5
4.0
3.5
3.0
2.5
2.0
1.5
1.0
0.5
1987
1991
1995
1999
0.5
1.0
1.5
2.0
2.5
3.0
3.5
4.0
4.5
1987
1991
1995
1999
Tra
de t
ax r
even
ueSe
igni
orag
e re
venu
eIn
tere
st p
aym
ents
Arg
enti
na
Col
ombi
a
Perc
ent o
f G
DP
(con
tinu
ed)
1440-01 BPEA/Reinhart 07/17/03 08:11 Page 45
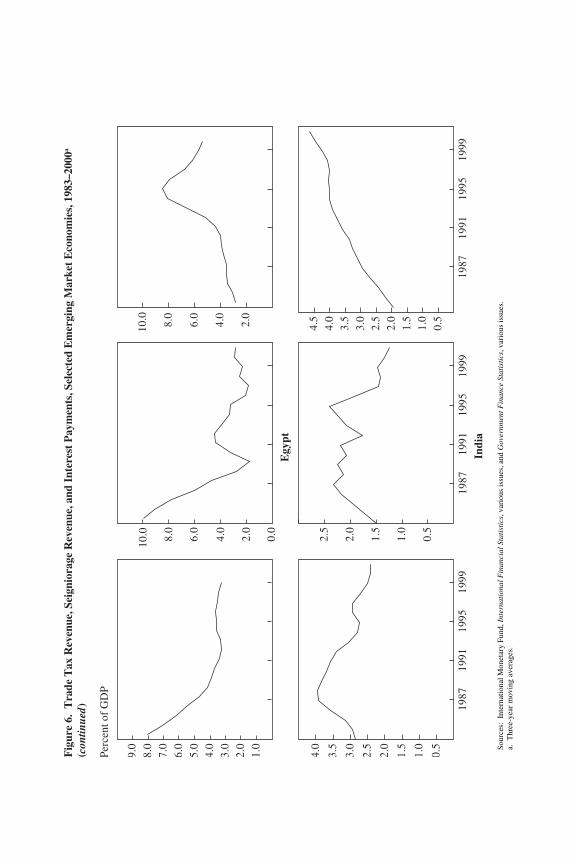
Fig
ure
6.T
rade
Tax
Rev
enue
, Sei
gnio
rage
Rev
enue
, and
Int
eres
t Pay
men
ts, S
elec
ted
Em
ergi
ng M
arke
t Eco
nom
ies,
198
3–20
00a
(con
tinue
d)
1.0
2.0
3.0
4.0
5.0
6.0
7.0
8.0
9.0
Perc
ent o
f G
DP
0.0
2.0
4.0
6.0
8.0
10.0
2.0
4.0
6.0
8.0
10.0
0.5
1.0
1.5
2.0
2.5
3.0
3.5
4.0
1987
1991
1995
1999
0.5
1.0
1.5
2.0
2.5
1987
1991
1995
1999
0.5
1.0
1.5
2.0
2.5
3.0
3.5
4.0
4.5
1987
1991
1995
1999
Egy
pt
Indi
a
Sour
ces:
Inte
rnat
iona
l Mon
etar
y Fu
nd, I
nter
nati
onal
Fin
anci
al S
tati
stic
s, v
ario
us is
sues
, and
Gov
ernm
ent F
inan
ce S
tati
stic
s, v
ario
us is
sues
.a.
Thr
ee-y
ear
mov
ing
aver
ages
.
1440-01 BPEA/Reinhart 07/17/03 08:11 Page 46
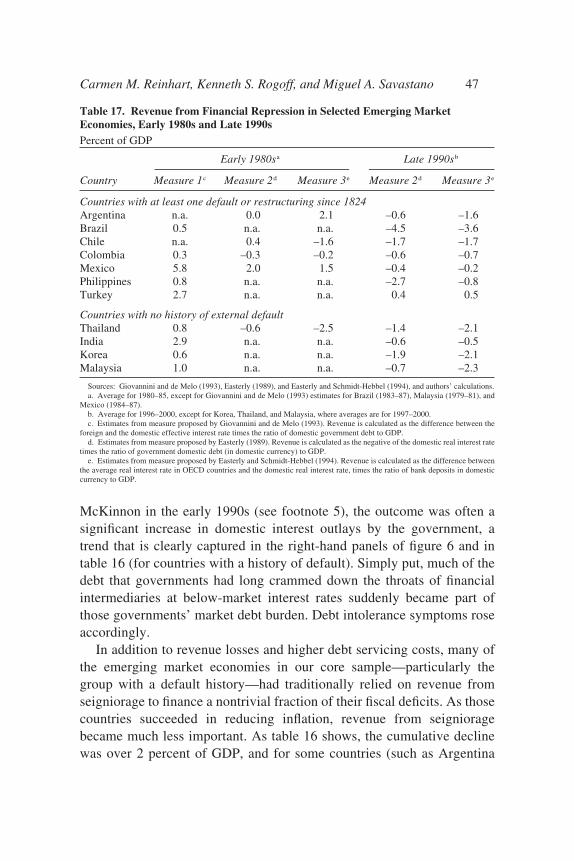
McKinnon in the early 1990s (see footnote 5), the outcome was often asignificant increase in domestic interest outlays by the government, atrend that is clearly captured in the right-hand panels of figure 6 and intable 16 (for countries with a history of default). Simply put, much of thedebt that governments had long crammed down the throats of financialintermediaries at below-market interest rates suddenly became part ofthose governments’ market debt burden. Debt intolerance symptoms roseaccordingly.
In addition to revenue losses and higher debt servicing costs, many ofthe emerging market economies in our core sample—particularly thegroup with a default history—had traditionally relied on revenue fromseigniorage to finance a nontrivial fraction of their fiscal deficits. As thosecountries succeeded in reducing inflation, revenue from seignioragebecame much less important. As table 16 shows, the cumulative declinewas over 2 percent of GDP, and for some countries (such as Argentina
Carmen M. Reinhart, Kenneth S. Rogoff, and Miguel A. Savastano 47
Table 17. Revenue from Financial Repression in Selected Emerging MarketEconomies, Early 1980s and Late 1990sPercent of GDP
Early 1980sa Late 1990sb
Country Measure 1c Measure 2d Measure 3e Measure 2d Measure 3e
Countries with at least one default or restructuring since 1824Argentina n.a. 0.0 2.1 –0.6 –1.6Brazil 0.5 n.a. n.a. –4.5 –3.6Chile n.a. 0.4 –1.6 –1.7 –1.7Colombia 0.3 –0.3 –0.2 –0.6 –0.7Mexico 5.8 2.0 1.5 –0.4 –0.2Philippines 0.8 n.a. n.a. –2.7 –0.8Turkey 2.7 n.a. n.a. 0.4 0.5
Countries with no history of external defaultThailand 0.8 –0.6 –2.5 –1.4 –2.1India 2.9 n.a. n.a. –0.6 –0.5Korea 0.6 n.a. n.a. –1.9 –2.1Malaysia 1.0 n.a. n.a. –0.7 –2.3
Sources: Giovannini and de Melo (1993), Easterly (1989), and Easterly and Schmidt-Hebbel (1994), and authors’ calculations.a. Average for 1980–85, except for Giovannini and de Melo (1993) estimates for Brazil (1983–87), Malaysia (1979–81), and
Mexico (1984–87).b. Average for 1996–2000, except for Korea, Thailand, and Malaysia, where averages are for 1997–2000.c. Estimates from measure proposed by Giovannini and de Melo (1993). Revenue is calculated as the difference between the
foreign and the domestic effective interest rate times the ratio of domestic government debt to GDP.d. Estimates from measure proposed by Easterly (1989). Revenue is calculated as the negative of the domestic real interest rate
times the ratio of government domestic debt (in domestic currency) to GDP.e. Estimates from measure proposed by Easterly and Schmidt-Hebbel (1994). Revenue is calculated as the difference between
the average real interest rate in OECD countries and the domestic real interest rate, times the ratio of bank deposits in domesticcurrency to GDP.
1440-01 BPEA/Reinhart 07/17/03 08:11 Page 47
and Egypt, as shown in the middle panels of figure 6) the decline waseven greater. All in all, for those governments that did not manage tobring expenditure in line with the new realities, one outcome of liberal-ization and inflation stabilization has been a heavier reliance on domesticor foreign debt financing, or both.
Reflections on Policies for Debt-Intolerant Countries
The sad fact that our analysis reveals is that once a country slips intobeing a serial defaulter, it retains a high level of debt intolerance that isdifficult to shed. Countries can and do graduate to greater creditworthi-ness, but the process is seldom fast or easy. Absent the pull of an outsidepolitical anchor, such as the European Union or, one hopes, the NorthAmerican Free Trade Agreement for Mexico, recovery may take decadesor even centuries. The implications are certainly sobering for sustainabil-ity exercises that ignore debt intolerance, and even for debt restructuringplans that pretend to cure the problem permanently, simply through a one-time reduction in the face value of a country’s debt.
How serious are the consequences of debt intolerance? Is a countrywith weak internal structures that make it intolerant to debt doomed tofollow a trajectory of slower growth and higher macroeconomic volatil-ity? At some level, the answer has to be yes, but constrained access tointernational capital markets is best viewed as a symptom, not a cause, ofthe disease.
Rather, the institutional failings that make a country intolerant to debtpose the real impediment. The basic problem is threefold. First, the mod-ern empirical growth literature increasingly points to “soft” factors, suchas institutions, corruption, and governance, as far more important thandifferences in capital-labor ratios in explaining cross-country differencesin income per capita. Simply equalizing the marginal product of physicalcapital across countries (the sine qua non of capital market integration ina deterministic world) only goes a limited way toward equalizing mar-ginal labor products.32 Second, quantitative methods have similarly sug-gested that the risk-sharing benefits of capital market integration (that is,the lowering of consumption volatility as opposed to the acceleration of
48 Brookings Papers on Economic Activity, 1:2003
32. For a broader discussion, see International Monetary Fund, World Economic Out-look, April 2003, chapter 3.
1440-01 BPEA/Reinhart 07/17/03 08:11 Page 48
consumption growth) may also be relatively modest. Moreover, theseresults pertain to an idealized world where one does not have to worryabout gratuitous, policy-induced macroeconomic instability, poor domes-tic bank regulation, corruption, and (not least) policies that distort capitalinflows toward short-term debt.33 Third, there is evidence to suggest thatcapital flows to emerging markets are markedly procyclical, and that thismay make macroeconomic policies in these countries procyclical as well,as, for instance, when capital outflows force a tightening of fiscal policyand the raising of interest rates.34 Arguably, more limited, but also morestable, access to capital markets may do more to improve welfare than theboom-bust pattern so often observed in the past. The deeply entrenchedidea that an emerging market economy’s growth trajectory will be ham-pered by limited access to debt markets is no longer as compelling as wasonce thought.
The modern empirical growth literature does not actually paint sharpdistinctions between different types of capital flows, whether it be debtversus equity, portfolio versus direct investment, or long-term versusshort-term. Practical policymakers, of course, are justifiably quite con-cerned with the form that cross-border flows take. For example, foreigndirect investment (FDI) is generally thought to have properties that makeit preferable to debt: it is less volatile, it is often associated with technol-ogy transfer, and so on.35 We generally share the view that FDI and otherforms of equity investment are somewhat less problematic than debt, butone wants to avoid overstating the case. In practice, the three main typesof capital inflows—FDI, portfolio equity, and loans—are often inter-linked: for example, foreign firms often bring cash into a country inadvance of building or acquiring plant facilities. Moreover, derivative
Carmen M. Reinhart, Kenneth S. Rogoff, and Miguel A. Savastano 49
33. Prasad and others (2003) find that, during the 1990s, economies whose financialsectors were de facto relatively open experienced, on average, a rise in consumptionvolatility relative to output volatility, contrary to the premise that capital market integrationspreads country-specific output risk. The same authors also argue that the cross-countryempirical evidence on the effects of capital market integration on growth shows only weakpositive effects at best, and arguably none.
34. See Kaminsky, Reinhart, and Végh (2003) on this issue.35. Of course, it was not always so. Before the 1980s, many governments viewed
allowing FDI as equivalent to mortgaging their countries’ future, and therefore they pre-ferred borrowing in order to retain full ownership of the country’s assets. And, of course,where FDI was more dominant (for example, in investment in oil and other naturalresources in the 1950s and 1960s), pressure for nationalization increased. Thus FDI shouldnot be regarded as a panacea for poor growth performance.
1440-01 BPEA/Reinhart 07/17/03 08:11 Page 49
contracts often blur the three categories, and even the most diligent statis-tical authorities can find it hard to distinguish accurately among differenttypes of foreign capital inflows (not to mention that, when in doubt, somecountries prefer to label a given investment as FDI, to lower their appar-ent vulnerability). Even with these qualifications, however, we believethat governments in advanced economies can do more to discourageemerging market economies from excessive dependence on risky nonin-dexed debt relative to other forms of capital flows.36
Lastly, short-term debt, although typically identified as the main cul-prit in precipitating debt crises, also helps facilitate trade in goods and isnecessary in some measure to allow private agents to execute hedgingstrategies. Of course, one would imagine that most of the essential bene-fits to having access to capital markets could be enjoyed with relativelymodest debt-to-GNP ratios.
All in all, debt intolerance need not be fatal to growth and macro-economic stability. However, the evidence presented here suggests that,to overcome debt intolerance, policymakers need to be prepared to keepdebt levels—especially government debt levels—low for extended peri-ods while undertaking more basic structural reforms to ensure that thecountry can eventually digest a heavier debt burden. This applies not onlyto external debt but also to the very immediate and growing problem ofdomestic government debt. Policymakers who face tremendous short-term pressures will still choose to engage in high-risk borrowing, and, atthe right price, markets will let them. But an understanding of the basicproblem, at least, should guide the citizens of such countries, not to men-tion the international lending institutions and the broader internationalcommunity, in making their own decisions.
In our view, developing a better understanding of the problem of serialdefault on external debt obligations is essential to designing better domes-tic and international economic policies aimed at crisis prevention andresolution. As we have shown, debt intolerance can be captured systemat-ically by a relatively small number of variables, principally a country’sown history of default and high inflation. Debt-intolerant countries facesurprisingly low thresholds for external borrowing, beyond which therisks of default or restructuring become significant. With the recent explo-
50 Brookings Papers on Economic Activity, 1:2003
36. Rogoff (1999) and Bulow and Rogoff (1990) argue that creditor countries’ legalsystems should be amended so that they no longer tilt capital flows toward debt.
1440-01 BPEA/Reinhart 07/17/03 08:11 Page 50
sion of domestic borrowing, as documented by the new data presented inthis paper, these thresholds for external debt are now clearly even lower,although it remains an open question to what extent domestic and externaldebt can be aggregated for purposes of analysis. This question needsurgently to be addressed, in part because many questions involvingbailouts by the international community surround it. Our initial resultssuggest that the same factors that determine external debt intolerance (notto mention other manifestations of debt intolerance, such as dollarization)are also likely to impinge heavily on domestic debt intolerance. We havealso shown that whereas debt-intolerant countries need badly to find waysto bring their debt-GNP ratios down to safer ground, doing so is not easy.Historically, those countries that have escaped high external debt-GNPratios, through rapid growth or through sizable repayments over manyyears, are very much the exception. Most large reductions in the externaldebt of emerging markets have instead been achieved primarily throughrestructuring or default. The challenge today is to find ways other thanstill more debt to channel capital to debt-intolerant countries, to preventthe cycle from repeating itself for yet another century to come.
Conclusions
Cycles in capital flows to emerging market economies have been withus now for nearly 200 years. Some of the players, both borrowers andlenders, may change, but the patterns that the cycles follow haveremained quite similar over time. When interest rates are low, when liq-uidity is ample, and when the prospects for equity markets dim in theworld’s financial centers, investors will seek higher returns elsewhere.During these periods, it is easier for governments in emerging markets toborrow abroad—and borrow they do. But history has shown that, formany of these countries, to borrow is to brook default. As the trackrecord of serial default highlights, many of these booms ended in tears.The policy challenge for these countries is to address a chronic long-termproblem—their own debt intolerance—rather than take remedial mea-sures that will allow them to regain the favor of international capital mar-kets for a few brief months or years.
This paper has taken a first step toward making the concept of debtintolerance operational. We have conjectured that, beyond reputational
Carmen M. Reinhart, Kenneth S. Rogoff, and Miguel A. Savastano 51
1440-01 BPEA/Reinhart 07/17/03 08:11 Page 51
factors, serial default may owe to a vicious cycle in which default weak-ens a country’s institutions, in turn making subsequent default morelikely. We have also stressed that safe debt thresholds vary from countryto country and depend importantly on history. Clearly, much moreresearch is needed to shed light on what other factors—economic, politi-cal, institutional—figure in the calculus of what debt levels, external anddomestic, are sustainable and what are the true long-term costs of default.
A P P E N D I X A
Definitions
External debt: the total liabilities of a country with foreign creditors,both official (public) and private. Creditors often determine all the termsof the debt contracts, which are normally subject to the jurisdiction of theforeign creditors or (for multilateral credits) to international law.
Total government (or public) debt: the total debt liabilities of agovernment with both domestic and foreign creditors, where “govern-ment” normally comprises the central administration, provincial andlocal governments, and all entities that borrow with an explicit govern-ment guarantee.
Government domestic debt: all debt liabilities of a government that areissued under—and subject to—national jurisdiction, regardless of thenationality of the creditor. Terms of the debt contracts may be marketdetermined or set unilaterally by the government.
Government foreign currency domestic debt: debt liabilities of a gov-ernment that are issued under national jurisdiction but expressed in (orlinked to) a currency different from the national currency.
A P P E N D I X B
Sample Description
To illustrate the extent to which modern-day debt intolerance arisesfrom countries’ own external credit histories (because of persistence incertain economic and social characteristics as well as reputational fac-tors), we use throughout the paper a core sample comprising three groups
52 Brookings Papers on Economic Activity, 1:2003
1440-01 BPEA/Reinhart 07/17/03 08:11 Page 52
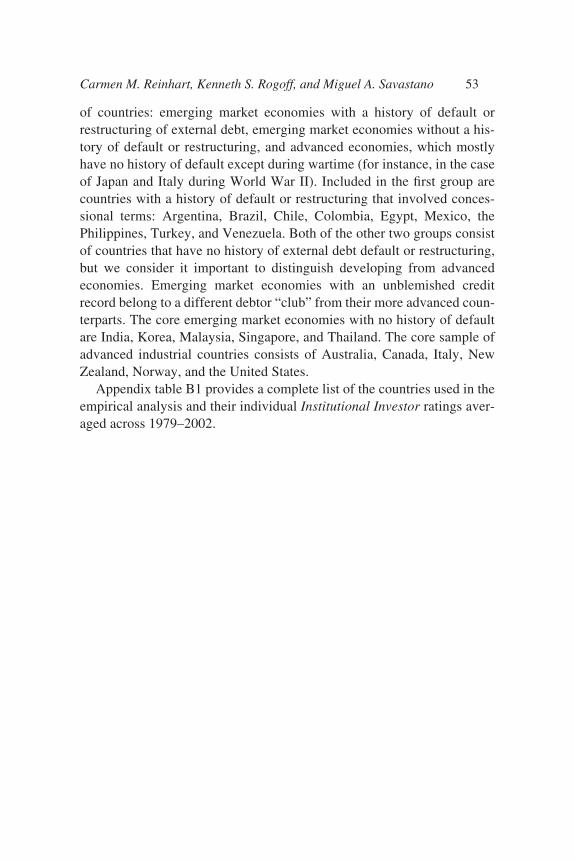
of countries: emerging market economies with a history of default orrestructuring of external debt, emerging market economies without a his-tory of default or restructuring, and advanced economies, which mostlyhave no history of default except during wartime (for instance, in the caseof Japan and Italy during World War II). Included in the first group arecountries with a history of default or restructuring that involved conces-sional terms: Argentina, Brazil, Chile, Colombia, Egypt, Mexico, thePhilippines, Turkey, and Venezuela. Both of the other two groups consistof countries that have no history of external debt default or restructuring,but we consider it important to distinguish developing from advancedeconomies. Emerging market economies with an unblemished creditrecord belong to a different debtor “club” from their more advanced coun-terparts. The core emerging market economies with no history of defaultare India, Korea, Malaysia, Singapore, and Thailand. The core sample ofadvanced industrial countries consists of Australia, Canada, Italy, NewZealand, Norway, and the United States.
Appendix table B1 provides a complete list of the countries used in theempirical analysis and their individual Institutional Investor ratings aver-aged across 1979–2002.
Carmen M. Reinhart, Kenneth S. Rogoff, and Miguel A. Savastano 53
1440-01 BPEA/Reinhart 07/17/03 08:11 Page 53
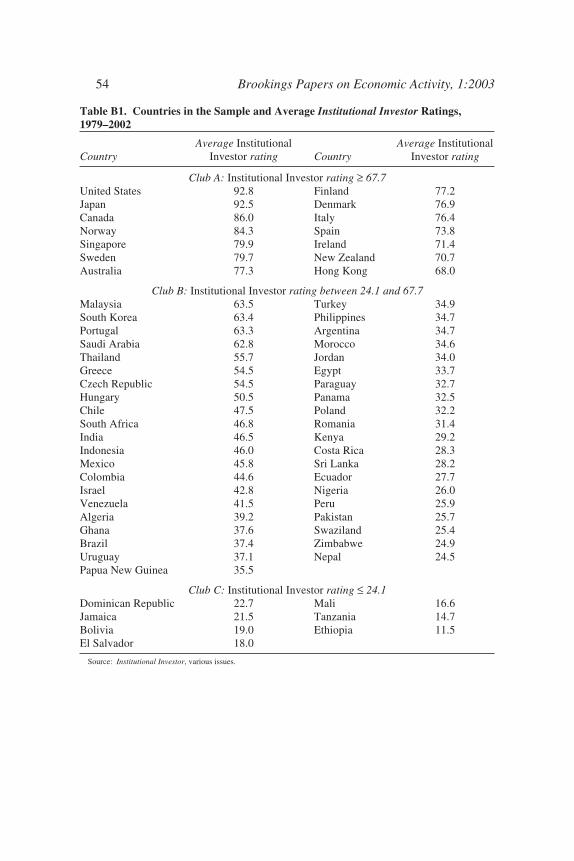
54 Brookings Papers on Economic Activity, 1:2003
Table B1. Countries in the Sample and Average Institutional Investor Ratings,1979–2002
Average Institutional Average Institutional Country Investor rating Country Investor rating
Club A: Institutional Investor rating ≥ 67.7 United States 92.8 Finland 77.2Japan 92.5 Denmark 76.9Canada 86.0 Italy 76.4Norway 84.3 Spain 73.8Singapore 79.9 Ireland 71.4Sweden 79.7 New Zealand 70.7Australia 77.3 Hong Kong 68.0
Club B: Institutional Investor rating between 24.1 and 67.7Malaysia 63.5 Turkey 34.9South Korea 63.4 Philippines 34.7Portugal 63.3 Argentina 34.7Saudi Arabia 62.8 Morocco 34.6Thailand 55.7 Jordan 34.0Greece 54.5 Egypt 33.7Czech Republic 54.5 Paraguay 32.7Hungary 50.5 Panama 32.5Chile 47.5 Poland 32.2South Africa 46.8 Romania 31.4India 46.5 Kenya 29.2Indonesia 46.0 Costa Rica 28.3Mexico 45.8 Sri Lanka 28.2Colombia 44.6 Ecuador 27.7Israel 42.8 Nigeria 26.0Venezuela 41.5 Peru 25.9Algeria 39.2 Pakistan 25.7Ghana 37.6 Swaziland 25.4Brazil 37.4 Zimbabwe 24.9Uruguay 37.1 Nepal 24.5Papua New Guinea 35.5
Club C: Institutional Investor rating ≤ 24.1 Dominican Republic 22.7 Mali 16.6Jamaica 21.5 Tanzania 14.7Bolivia 19.0 Ethiopia 11.5El Salvador 18.0
Source: Institutional Investor, various issues.
1440-01 BPEA/Reinhart 07/17/03 08:11 Page 54
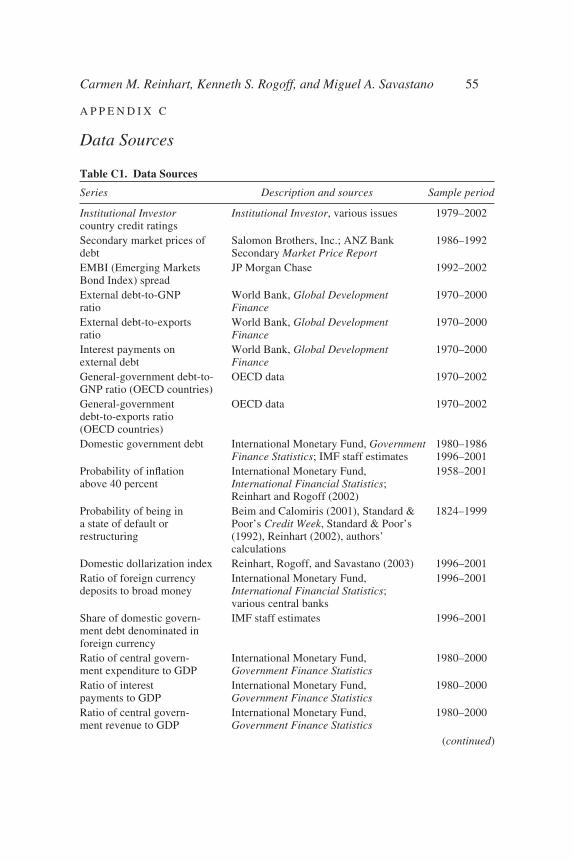
A P P E N D I X C
Data Sources
Carmen M. Reinhart, Kenneth S. Rogoff, and Miguel A. Savastano 55
Table C1. Data Sources
Series Description and sources Sample period
Institutional Investor Institutional Investor, various issues 1979–2002country credit ratingsSecondary market prices of Salomon Brothers, Inc.; ANZ Bank 1986–1992debt Secondary Market Price ReportEMBI (Emerging Markets JP Morgan Chase 1992–2002Bond Index) spreadExternal debt-to-GNP World Bank, Global Development 1970–2000ratio FinanceExternal debt-to-exports World Bank, Global Development 1970–2000ratio FinanceInterest payments on World Bank, Global Development 1970–2000external debt FinanceGeneral-government debt-to- OECD data 1970–2002GNP ratio (OECD countries)General-government OECD data 1970–2002debt-to-exports ratio (OECD countries)Domestic government debt International Monetary Fund, Government 1980–1986
Finance Statistics; IMF staff estimates 1996–2001Probability of inflation International Monetary Fund, 1958–2001above 40 percent International Financial Statistics;
Reinhart and Rogoff (2002)Probability of being in Beim and Calomiris (2001), Standard & 1824–1999a state of default or Poor’s Credit Week, Standard & Poor’s restructuring (1992), Reinhart (2002), authors’
calculationsDomestic dollarization index Reinhart, Rogoff, and Savastano (2003) 1996–2001Ratio of foreign currency International Monetary Fund, 1996–2001deposits to broad money International Financial Statistics;
various central banksShare of domestic govern- IMF staff estimates 1996–2001ment debt denominated in foreign currencyRatio of central govern- International Monetary Fund, 1980–2000ment expenditure to GDP Government Finance StatisticsRatio of interest International Monetary Fund, 1980–2000payments to GDP Government Finance StatisticsRatio of central govern- International Monetary Fund, 1980–2000ment revenue to GDP Government Finance Statistics
(continued)
1440-01 BPEA/Reinhart 07/17/03 08:11 Page 55
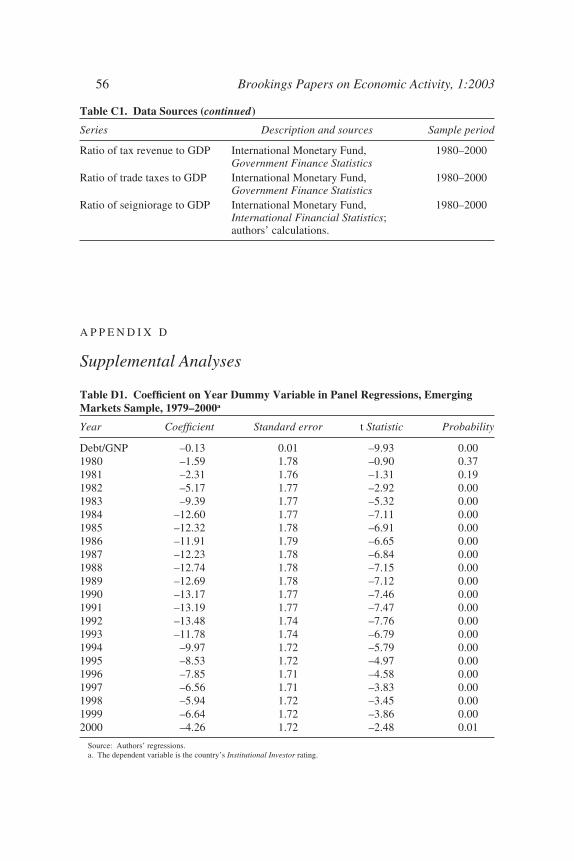
A P P E N D I X D
Supplemental Analyses
56 Brookings Papers on Economic Activity, 1:2003
Table D1. Coefficient on Year Dummy Variable in Panel Regressions, EmergingMarkets Sample, 1979–2000a
Year Coefficient Standard error t Statistic Probability
Debt/GNP –0.13 0.01 –9.93 0.001980 –1.59 1.78 –0.90 0.371981 –2.31 1.76 –1.31 0.191982 –5.17 1.77 –2.92 0.001983 –9.39 1.77 –5.32 0.001984 –12.60 1.77 –7.11 0.001985 –12.32 1.78 –6.91 0.001986 –11.91 1.79 –6.65 0.001987 –12.23 1.78 –6.84 0.001988 –12.74 1.78 –7.15 0.001989 –12.69 1.78 –7.12 0.001990 –13.17 1.77 –7.46 0.001991 –13.19 1.77 –7.47 0.001992 –13.48 1.74 –7.76 0.001993 –11.78 1.74 –6.79 0.001994 –9.97 1.72 –5.79 0.001995 –8.53 1.72 –4.97 0.001996 –7.85 1.71 –4.58 0.001997 –6.56 1.71 –3.83 0.001998 –5.94 1.72 –3.45 0.001999 –6.64 1.72 –3.86 0.002000 –4.26 1.72 –2.48 0.01
Source: Authors’ regressions.a. The dependent variable is the country’s Institutional Investor rating.
Table C1. Data Sources (continued)
Series Description and sources Sample period
Ratio of tax revenue to GDP International Monetary Fund, 1980–2000Government Finance Statistics
Ratio of trade taxes to GDP International Monetary Fund, 1980–2000Government Finance Statistics
Ratio of seigniorage to GDP International Monetary Fund, 1980–2000International Financial Statistics;authors’ calculations.
1440-01 BPEA/Reinhart 07/17/03 08:11 Page 56
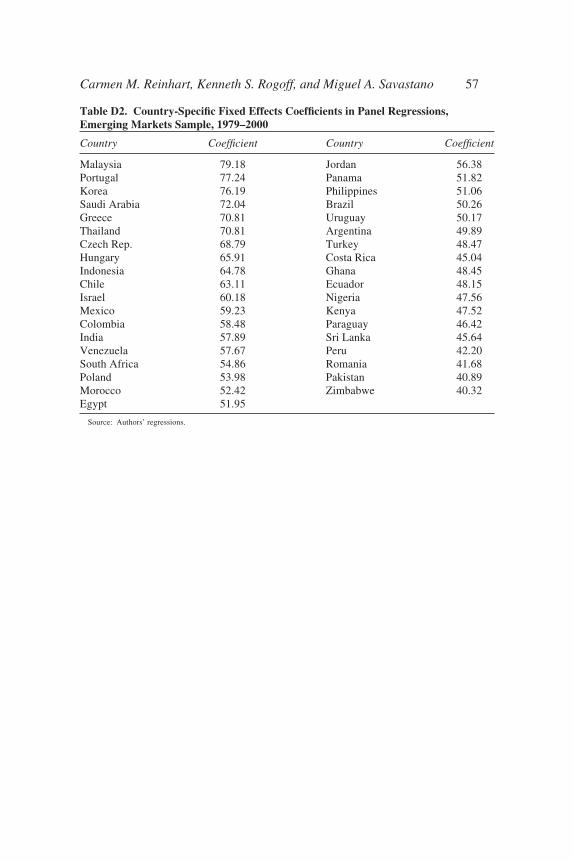
Carmen M. Reinhart, Kenneth S. Rogoff, and Miguel A. Savastano 57
Table D2. Country-Specific Fixed Effects Coefficients in Panel Regressions,Emerging Markets Sample, 1979–2000
Country Coefficient Country Coefficient
Malaysia 79.18 Jordan 56.38Portugal 77.24 Panama 51.82Korea 76.19 Philippines 51.06Saudi Arabia 72.04 Brazil 50.26Greece 70.81 Uruguay 50.17Thailand 70.81 Argentina 49.89Czech Rep. 68.79 Turkey 48.47Hungary 65.91 Costa Rica 45.04Indonesia 64.78 Ghana 48.45Chile 63.11 Ecuador 48.15Israel 60.18 Nigeria 47.56Mexico 59.23 Kenya 47.52Colombia 58.48 Paraguay 46.42India 57.89 Sri Lanka 45.64Venezuela 57.67 Peru 42.20South Africa 54.86 Romania 41.68Poland 53.98 Pakistan 40.89Morocco 52.42 Zimbabwe 40.32Egypt 51.95
Source: Authors’ regressions.
1440-01 BPEA/Reinhart 07/17/03 08:11 Page 57
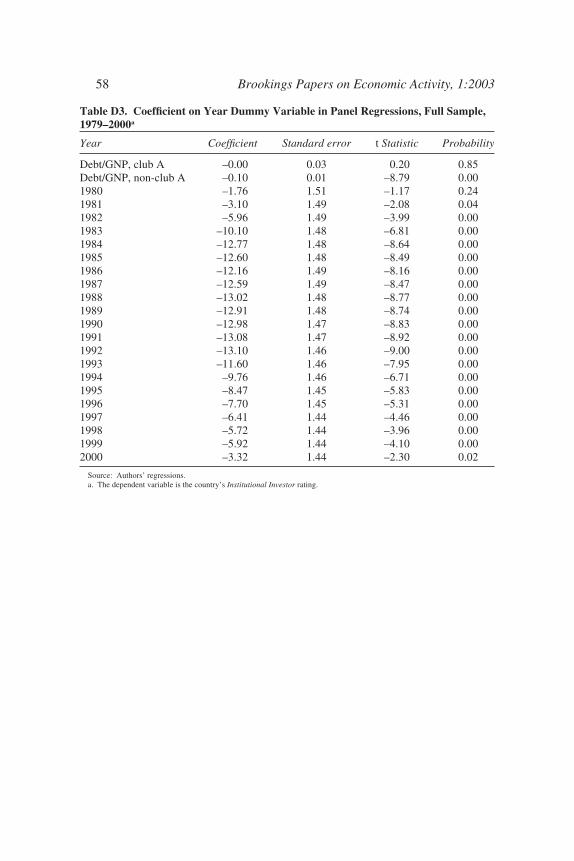
58 Brookings Papers on Economic Activity, 1:2003
Table D3. Coefficient on Year Dummy Variable in Panel Regressions, Full Sample,1979–2000a
Year Coefficient Standard error t Statistic Probability
Debt/GNP, club A –0.00 0.03 0.20 0.85Debt/GNP, non-club A –0.10 0.01 –8.79 0.001980 –1.76 1.51 –1.17 0.241981 –3.10 1.49 –2.08 0.041982 –5.96 1.49 –3.99 0.001983 –10.10 1.48 –6.81 0.001984 –12.77 1.48 –8.64 0.001985 –12.60 1.48 –8.49 0.001986 –12.16 1.49 –8.16 0.001987 –12.59 1.49 –8.47 0.001988 –13.02 1.48 –8.77 0.001989 –12.91 1.48 –8.74 0.001990 –12.98 1.47 –8.83 0.001991 –13.08 1.47 –8.92 0.001992 –13.10 1.46 –9.00 0.001993 –11.60 1.46 –7.95 0.001994 –9.76 1.46 –6.71 0.001995 –8.47 1.45 –5.83 0.001996 –7.70 1.45 –5.31 0.001997 –6.41 1.44 –4.46 0.001998 –5.72 1.44 –3.96 0.001999 –5.92 1.44 –4.10 0.002000 –3.32 1.44 –2.30 0.02
Source: Authors’ regressions.a. The dependent variable is the country’s Institutional Investor rating.
1440-01 BPEA/Reinhart 07/17/03 08:11 Page 58
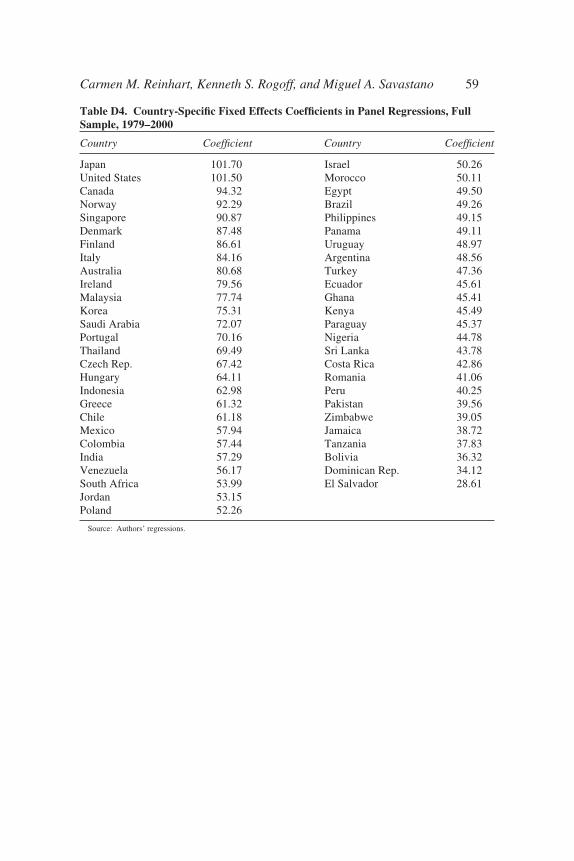
Carmen M. Reinhart, Kenneth S. Rogoff, and Miguel A. Savastano 59
Table D4. Country-Specific Fixed Effects Coefficients in Panel Regressions, FullSample, 1979–2000
Country Coefficient Country Coefficient
Japan 101.70 Israel 50.26United States 101.50 Morocco 50.11Canada 94.32 Egypt 49.50Norway 92.29 Brazil 49.26Singapore 90.87 Philippines 49.15Denmark 87.48 Panama 49.11Finland 86.61 Uruguay 48.97Italy 84.16 Argentina 48.56Australia 80.68 Turkey 47.36Ireland 79.56 Ecuador 45.61Malaysia 77.74 Ghana 45.41Korea 75.31 Kenya 45.49Saudi Arabia 72.07 Paraguay 45.37Portugal 70.16 Nigeria 44.78Thailand 69.49 Sri Lanka 43.78Czech Rep. 67.42 Costa Rica 42.86Hungary 64.11 Romania 41.06Indonesia 62.98 Peru 40.25Greece 61.32 Pakistan 39.56Chile 61.18 Zimbabwe 39.05Mexico 57.94 Jamaica 38.72Colombia 57.44 Tanzania 37.83India 57.29 Bolivia 36.32Venezuela 56.17 Dominican Rep. 34.12South Africa 53.99 El Salvador 28.61Jordan 53.15Poland 52.26
Source: Authors’ regressions.
1440-01 BPEA/Reinhart 07/17/03 08:11 Page 59
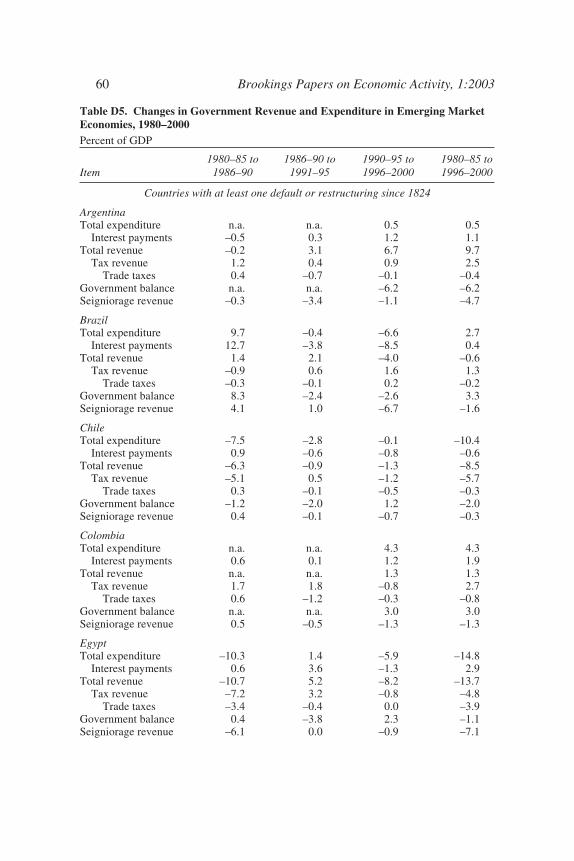
60 Brookings Papers on Economic Activity, 1:2003
Table D5. Changes in Government Revenue and Expenditure in Emerging MarketEconomies, 1980–2000Percent of GDP
1980–85 to 1986–90 to 1990–95 to 1980–85 to Item 1986–90 1991–95 1996–2000 1996–2000
Countries with at least one default or restructuring since 1824
ArgentinaTotal expenditure n.a. n.a. 0.5 0.5
Interest payments –0.5 0.3 1.2 1.1Total revenue –0.2 3.1 6.7 9.7
Tax revenue 1.2 0.4 0.9 2.5Trade taxes 0.4 –0.7 –0.1 –0.4
Government balance n.a. n.a. –6.2 –6.2Seigniorage revenue –0.3 –3.4 –1.1 –4.7
BrazilTotal expenditure 9.7 –0.4 –6.6 2.7
Interest payments 12.7 –3.8 –8.5 0.4Total revenue 1.4 2.1 –4.0 –0.6
Tax revenue –0.9 0.6 1.6 1.3Trade taxes –0.3 –0.1 0.2 –0.2
Government balance 8.3 –2.4 –2.6 3.3Seigniorage revenue 4.1 1.0 –6.7 –1.6
ChileTotal expenditure –7.5 –2.8 –0.1 –10.4
Interest payments 0.9 –0.6 –0.8 –0.6Total revenue –6.3 –0.9 –1.3 –8.5
Tax revenue –5.1 0.5 –1.2 –5.7Trade taxes 0.3 –0.1 –0.5 –0.3
Government balance –1.2 –2.0 1.2 –2.0Seigniorage revenue 0.4 –0.1 –0.7 –0.3
ColombiaTotal expenditure n.a. n.a. 4.3 4.3
Interest payments 0.6 0.1 1.2 1.9Total revenue n.a. n.a. 1.3 1.3
Tax revenue 1.7 1.8 –0.8 2.7Trade taxes 0.6 –1.2 –0.3 –0.8
Government balance n.a. n.a. 3.0 3.0Seigniorage revenue 0.5 –0.5 –1.3 –1.3
EgyptTotal expenditure –10.3 1.4 –5.9 –14.8
Interest payments 0.6 3.6 –1.3 2.9Total revenue –10.7 5.2 –8.2 –13.7
Tax revenue –7.2 3.2 –0.8 –4.8Trade taxes –3.4 –0.4 0.0 –3.9
Government balance 0.4 –3.8 2.3 –1.1Seigniorage revenue –6.1 0.0 –0.9 –7.1
1440-01 BPEA/Reinhart 07/17/03 08:11 Page 60
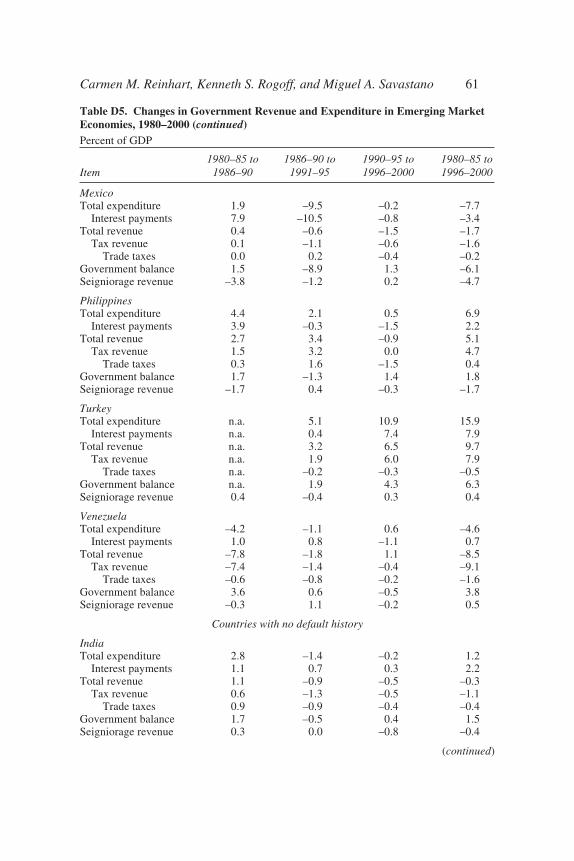
Carmen M. Reinhart, Kenneth S. Rogoff, and Miguel A. Savastano 61
Table D5. Changes in Government Revenue and Expenditure in Emerging MarketEconomies, 1980–2000 (continued)Percent of GDP
1980–85 to 1986–90 to 1990–95 to 1980–85 to Item 1986–90 1991–95 1996–2000 1996–2000
MexicoTotal expenditure 1.9 –9.5 –0.2 –7.7
Interest payments 7.9 –10.5 –0.8 –3.4Total revenue 0.4 –0.6 –1.5 –1.7
Tax revenue 0.1 –1.1 –0.6 –1.6Trade taxes 0.0 0.2 –0.4 –0.2
Government balance 1.5 –8.9 1.3 –6.1Seigniorage revenue –3.8 –1.2 0.2 –4.7
PhilippinesTotal expenditure 4.4 2.1 0.5 6.9
Interest payments 3.9 –0.3 –1.5 2.2Total revenue 2.7 3.4 –0.9 5.1
Tax revenue 1.5 3.2 0.0 4.7Trade taxes 0.3 1.6 –1.5 0.4
Government balance 1.7 –1.3 1.4 1.8Seigniorage revenue –1.7 0.4 –0.3 –1.7
TurkeyTotal expenditure n.a. 5.1 10.9 15.9
Interest payments n.a. 0.4 7.4 7.9Total revenue n.a. 3.2 6.5 9.7
Tax revenue n.a. 1.9 6.0 7.9Trade taxes n.a. –0.2 –0.3 –0.5
Government balance n.a. 1.9 4.3 6.3Seigniorage revenue 0.4 –0.4 0.3 0.4
VenezuelaTotal expenditure –4.2 –1.1 0.6 –4.6
Interest payments 1.0 0.8 –1.1 0.7Total revenue –7.8 –1.8 1.1 –8.5
Tax revenue –7.4 –1.4 –0.4 –9.1Trade taxes –0.6 –0.8 –0.2 –1.6
Government balance 3.6 0.6 –0.5 3.8Seigniorage revenue –0.3 1.1 –0.2 0.5
Countries with no default history
IndiaTotal expenditure 2.8 –1.4 –0.2 1.2
Interest payments 1.1 0.7 0.3 2.2Total revenue 1.1 –0.9 –0.5 –0.3
Tax revenue 0.6 –1.3 –0.5 –1.1Trade taxes 0.9 –0.9 –0.4 –0.4
Government balance 1.7 –0.5 0.4 1.5Seigniorage revenue 0.3 0.0 –0.8 –0.4
(continued)
1440-01 BPEA/Reinhart 07/17/03 08:11 Page 61
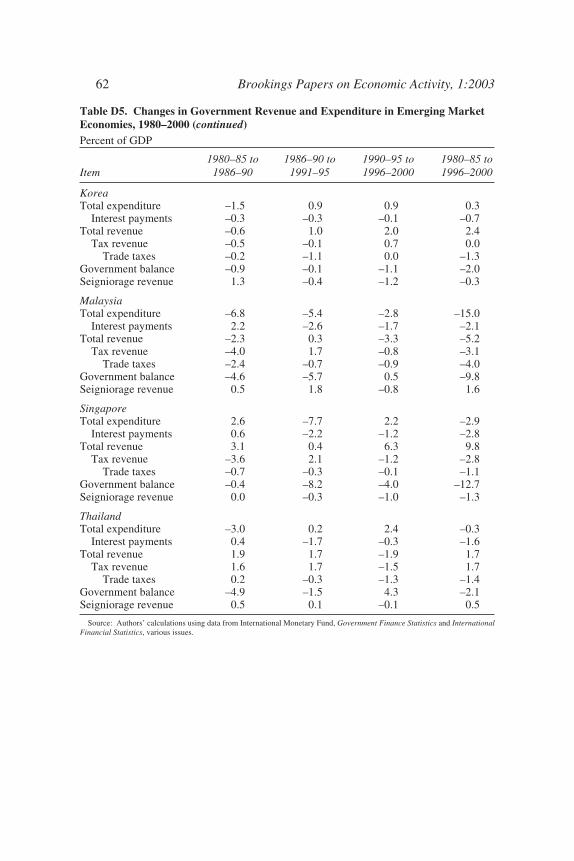
62 Brookings Papers on Economic Activity, 1:2003
Table D5. Changes in Government Revenue and Expenditure in Emerging MarketEconomies, 1980–2000 (continued)Percent of GDP
1980–85 to 1986–90 to 1990–95 to 1980–85 to Item 1986–90 1991–95 1996–2000 1996–2000
KoreaTotal expenditure –1.5 0.9 0.9 0.3
Interest payments –0.3 –0.3 –0.1 –0.7Total revenue –0.6 1.0 2.0 2.4
Tax revenue –0.5 –0.1 0.7 0.0Trade taxes –0.2 –1.1 0.0 –1.3
Government balance –0.9 –0.1 –1.1 –2.0Seigniorage revenue 1.3 –0.4 –1.2 –0.3
MalaysiaTotal expenditure –6.8 –5.4 –2.8 –15.0
Interest payments 2.2 –2.6 –1.7 –2.1Total revenue –2.3 0.3 –3.3 –5.2
Tax revenue –4.0 1.7 –0.8 –3.1Trade taxes –2.4 –0.7 –0.9 –4.0
Government balance –4.6 –5.7 0.5 –9.8Seigniorage revenue 0.5 1.8 –0.8 1.6
SingaporeTotal expenditure 2.6 –7.7 2.2 –2.9
Interest payments 0.6 –2.2 –1.2 –2.8Total revenue 3.1 0.4 6.3 9.8
Tax revenue –3.6 2.1 –1.2 –2.8Trade taxes –0.7 –0.3 –0.1 –1.1
Government balance –0.4 –8.2 –4.0 –12.7Seigniorage revenue 0.0 –0.3 –1.0 –1.3
ThailandTotal expenditure –3.0 0.2 2.4 –0.3
Interest payments 0.4 –1.7 –0.3 –1.6Total revenue 1.9 1.7 –1.9 1.7
Tax revenue 1.6 1.7 –1.5 1.7Trade taxes 0.2 –0.3 –1.3 –1.4
Government balance –4.9 –1.5 4.3 –2.1Seigniorage revenue 0.5 0.1 –0.1 0.5
Source: Authors’ calculations using data from International Monetary Fund, Government Finance Statistics and InternationalFinancial Statistics, various issues.
1440-01 BPEA/Reinhart 07/17/03 08:11 Page 62
Comments and Discussion
Christopher A. Sims: We learn from this paper that repeated defaults onsovereign debt are by no means a new problem, that countries with a his-tory of repeated default tend to persist in this behavior over long periods,and that such countries sometimes default with ratios of debt to nationaloutput or to exports that are low by the standards of advanced countrieswith long default-free histories. These are facts well worth bringing out,and they support the paper’s most important policy implication: that thedifficulties defaulting countries have in gaining access to internationalcredit are not exogenous imperfections in the market, but instead proba-bly reflect in large measure the risks of lending to these countries. Indeed,the paper suggests by its language, without actually supporting in detail,the hypothesis that international capital markets are imperfect mainly inlending too freely to countries with a history of default.
But the paper merely asserts that debt and serial default involve impor-tant deadweight losses. It is plausible that, as the paper suggests, defaultinjures financial institutions and drives countries toward inefficient fiscalsystems. But these assertions are only plausible, not obvious, and they arenot supported in this paper by any evidence. This leaves it an open ques-tion whether, in countries with a default history, policymakers and inter-national agencies should focus directly on reducing, eliminating, oravoiding debt. Debt and default might instead be regarded merely assymptoms of underlying problems, and possibly even as responses thatalleviate the effects of these underlying problems.
If default occurred cleanly, without costs other than the direct costs toinvestors who do not receive promised returns and to the borrower whomay face higher future borrowing costs, it would be hard to argue that
63
1440-01 BPEA/Reinhart 07/17/03 08:11 Page 63
default is in itself a problem. Default in such a world is a way to makedebt a contingent claim, and contingent debt is a useful financing tool. Inan earlier paper (which the authors cite),1 I presented a highly stylizedmodel of such cost-free default that predicts many of the statistical asso-ciations uncovered in this paper: that poorer countries will default moreoften; that default is consistent with fairly prompt renewal of borrowingand indeed with real debt quickly exceeding predefault levels; that highlyvariable inflation rates are associated with high default probabilities; thatreal debt burdens are seldom reduced rapidly except by sudden defaults orepisodes of inflation; and that rich countries will have both higher levelsof real debt relative to GDP and lower probabilities of default. These pre-dictions emerge as implications of optimal government behavior in amodel in which governments can make firm commitments about theirfuture fiscal behavior.
The logic behind these predictions is that governments whose onlysources of revenue are distorting taxes should use debt to smooth taxrates, keeping taxes and real debt near constant except in times of fiscalcrisis. These ideas were first worked out in papers by Robert Barro and byRobert Lucas and Nancy Stokey.2 Barro showed that if a government canissue only indexed debt, the expected path of future taxes and debt shouldbe approximately constant. Lucas and Stokey showed that if debt can bemade contingent on exogenous events, taxes and debt should be approxi-mately constant. My paper considers debt that is contingent only throughinflation and studies the optimal time path of defaults under commitment.
The model that makes these predictions is not meant as a completedescription of the real world—there are in fact deadweight costs to defaultof the kinds listed in this paper. But in order to make policy recommenda-tions, we need to assess how great the deadweight costs of default are.This is difficult to sort out, because the wealth redistributions and recog-nitions of losses that are enforced by default understandably cause wide-spread anguish and complaint but are not in themselves deadweightlosses. I am prepared to believe, if presented with evidence, that the dead-weight losses are indeed large. But this paper presents no evidence to thiseffect.
64 Brookings Papers on Economic Activity, 1:2003
1. Sims (2001).2. Barro (1979); Lucas and Stokey (1983).
1440-01 BPEA/Reinhart 07/17/03 08:11 Page 64
This paper makes the case that lending to “debt-intolerant” countriestends to expand in boom times and then contract, with accompanyingdefaults, when the boom tails off. Does this mean that poorer countriesshould not borrow in boom times? Not obviously. It appears that they maybe borrowing and financing substantial investment when capital is cheapin world markets, then having to cut back when it becomes more expen-sive. These countries would certainly be better off with a steadier flow ofcapital, but episodic flows of foreign investment may be better than none,particularly if default frees them from having to make excessive realtransfers to creditors when the flow of new credit slows.
The authors’ table 12 presents evidence that there have been fewepisodes of middle-income countries substantially reducing their debtover a three-year span, except through some form of default. This is pre-sented as evidence for how heavy the burden of debt is. But, of course,this is also exactly the result predicted by the simple theory of optimal taxsmoothing. The paper argues that there is a recognizable class of debt-intolerant countries, that these countries have a “threshold” ratio of debtto GNP or to exports above which default becomes likely, and that thisthreshold is low by the standards of rich-country borrowers. The evidencefor the existence of such a threshold is not very convincing. The authors’figure 1 shows the distributions of debt-to-GNP and debt-to-exports ratiosfor developing defaulters and developing nondefaulters. It is clear thatvery few defaulters have debt-to-GNP ratios below 15 percent, whereasquite a few nondefaulters have such low debt ratios. But the upper tails ofthe two distributions are quite similarly fat. In other words, there is noclear threshold ratio of debt to GNP above which there are many moredefaulters than nondefaulters. For the debt-to-exports ratio there is such athreshold, but it is very high (around 400 percent) and thus captures onlya small fraction of all defaulters. Looking at these distributions does notsuggest the existence of any sharp threshold that separates defaulters fromnondefaulters. Figure 3 yields a somewhat similar conclusion. If we triedto predict a country’s IIR from its debt ratios, we would do extremelypoorly, unless we concentrated on debt-to-GNP ratios above about 70 per-cent and debt-to-export ratios above about 400 percent.
The authors correctly observe that it is not uncommon for developingcountries with a history of default to default at debt ratios that othercountries, even other developing countries, manage to carry without
Carmen M. Reinhart, Kenneth S. Rogoff, and Miguel A. Savastano 65
1440-01 BPEA/Reinhart 07/17/03 08:11 Page 65
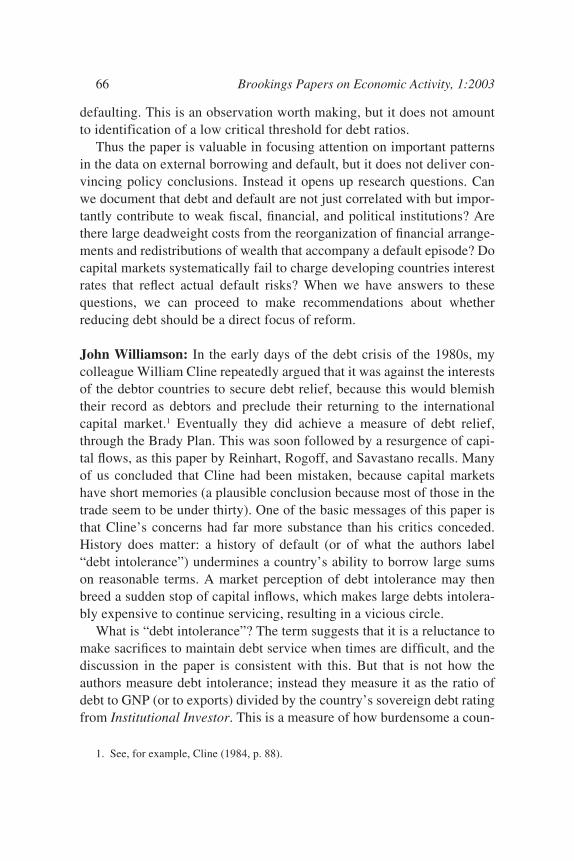
defaulting. This is an observation worth making, but it does not amountto identification of a low critical threshold for debt ratios.
Thus the paper is valuable in focusing attention on important patternsin the data on external borrowing and default, but it does not deliver con-vincing policy conclusions. Instead it opens up research questions. Canwe document that debt and default are not just correlated with but impor-tantly contribute to weak fiscal, financial, and political institutions? Arethere large deadweight costs from the reorganization of financial arrange-ments and redistributions of wealth that accompany a default episode? Docapital markets systematically fail to charge developing countries interestrates that reflect actual default risks? When we have answers to thesequestions, we can proceed to make recommendations about whetherreducing debt should be a direct focus of reform.
John Williamson: In the early days of the debt crisis of the 1980s, mycolleague William Cline repeatedly argued that it was against the interestsof the debtor countries to secure debt relief, because this would blemishtheir record as debtors and preclude their returning to the internationalcapital market.1 Eventually they did achieve a measure of debt relief,through the Brady Plan. This was soon followed by a resurgence of capi-tal flows, as this paper by Reinhart, Rogoff, and Savastano recalls. Manyof us concluded that Cline had been mistaken, because capital marketshave short memories (a plausible conclusion because most of those in thetrade seem to be under thirty). One of the basic messages of this paper isthat Cline’s concerns had far more substance than his critics conceded.History does matter: a history of default (or of what the authors label“debt intolerance”) undermines a country’s ability to borrow large sumson reasonable terms. A market perception of debt intolerance may thenbreed a sudden stop of capital inflows, which makes large debts intolera-bly expensive to continue servicing, resulting in a vicious circle.
What is “debt intolerance”? The term suggests that it is a reluctance tomake sacrifices to maintain debt service when times are difficult, and thediscussion in the paper is consistent with this. But that is not how theauthors measure debt intolerance; instead they measure it as the ratio ofdebt to GNP (or to exports) divided by the country’s sovereign debt ratingfrom Institutional Investor. This is a measure of how burdensome a coun-
66 Brookings Papers on Economic Activity, 1:2003
1. See, for example, Cline (1984, p. 88).
1440-01 BPEA/Reinhart 07/17/03 08:11 Page 66
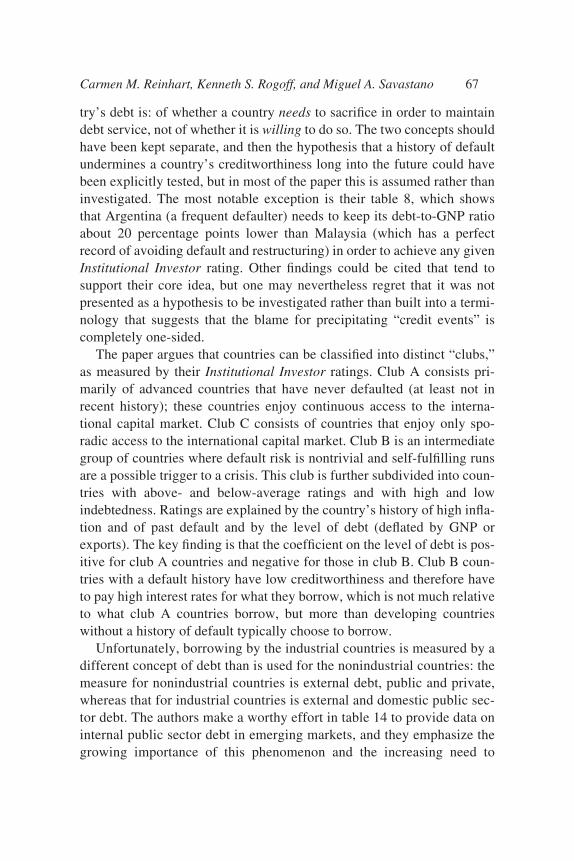
try’s debt is: of whether a country needs to sacrifice in order to maintaindebt service, not of whether it is willing to do so. The two concepts shouldhave been kept separate, and then the hypothesis that a history of defaultundermines a country’s creditworthiness long into the future could havebeen explicitly tested, but in most of the paper this is assumed rather thaninvestigated. The most notable exception is their table 8, which showsthat Argentina (a frequent defaulter) needs to keep its debt-to-GNP ratioabout 20 percentage points lower than Malaysia (which has a perfectrecord of avoiding default and restructuring) in order to achieve any givenInstitutional Investor rating. Other findings could be cited that tend tosupport their core idea, but one may nevertheless regret that it was notpresented as a hypothesis to be investigated rather than built into a termi-nology that suggests that the blame for precipitating “credit events” iscompletely one-sided.
The paper argues that countries can be classified into distinct “clubs,”as measured by their Institutional Investor ratings. Club A consists pri-marily of advanced countries that have never defaulted (at least not inrecent history); these countries enjoy continuous access to the interna-tional capital market. Club C consists of countries that enjoy only spo-radic access to the international capital market. Club B is an intermediategroup of countries where default risk is nontrivial and self-fulfilling runsare a possible trigger to a crisis. This club is further subdivided into coun-tries with above- and below-average ratings and with high and lowindebtedness. Ratings are explained by the country’s history of high infla-tion and of past default and by the level of debt (deflated by GNP orexports). The key finding is that the coefficient on the level of debt is pos-itive for club A countries and negative for those in club B. Club B coun-tries with a default history have low creditworthiness and therefore haveto pay high interest rates for what they borrow, which is not much relativeto what club A countries borrow, but more than developing countrieswithout a history of default typically choose to borrow.
Unfortunately, borrowing by the industrial countries is measured by adifferent concept of debt than is used for the nonindustrial countries: themeasure for nonindustrial countries is external debt, public and private,whereas that for industrial countries is external and domestic public sec-tor debt. The authors make a worthy effort in table 14 to provide data oninternal public sector debt in emerging markets, and they emphasize thegrowing importance of this phenomenon and the increasing need to
Carmen M. Reinhart, Kenneth S. Rogoff, and Miguel A. Savastano 67
1440-01 BPEA/Reinhart 07/17/03 08:11 Page 67
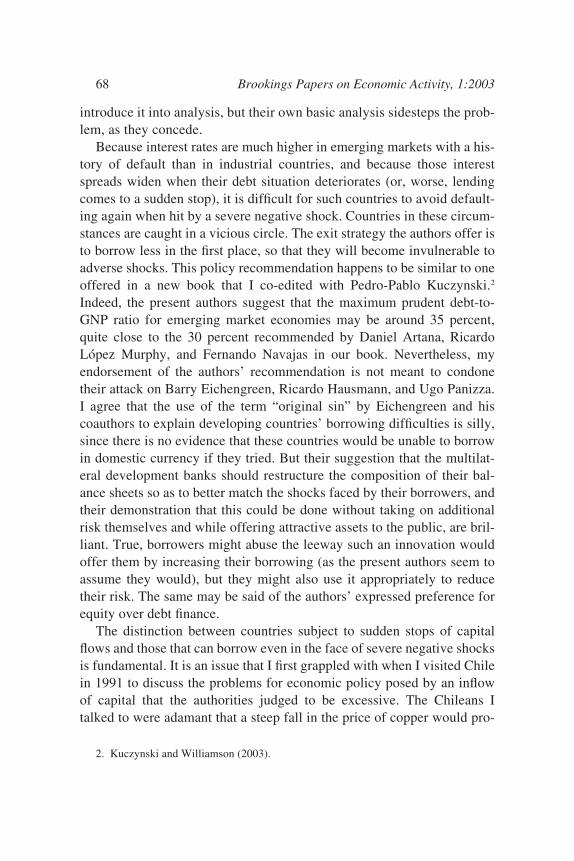
introduce it into analysis, but their own basic analysis sidesteps the prob-lem, as they concede.
Because interest rates are much higher in emerging markets with a his-tory of default than in industrial countries, and because those interestspreads widen when their debt situation deteriorates (or, worse, lendingcomes to a sudden stop), it is difficult for such countries to avoid default-ing again when hit by a severe negative shock. Countries in these circum-stances are caught in a vicious circle. The exit strategy the authors offer isto borrow less in the first place, so that they will become invulnerable toadverse shocks. This policy recommendation happens to be similar to oneoffered in a new book that I co-edited with Pedro-Pablo Kuczynski.2
Indeed, the present authors suggest that the maximum prudent debt-to-GNP ratio for emerging market economies may be around 35 percent,quite close to the 30 percent recommended by Daniel Artana, RicardoLópez Murphy, and Fernando Navajas in our book. Nevertheless, myendorsement of the authors’ recommendation is not meant to condonetheir attack on Barry Eichengreen, Ricardo Hausmann, and Ugo Panizza.I agree that the use of the term “original sin” by Eichengreen and hiscoauthors to explain developing countries’ borrowing difficulties is silly,since there is no evidence that these countries would be unable to borrowin domestic currency if they tried. But their suggestion that the multilat-eral development banks should restructure the composition of their bal-ance sheets so as to better match the shocks faced by their borrowers, andtheir demonstration that this could be done without taking on additionalrisk themselves and while offering attractive assets to the public, are bril-liant. True, borrowers might abuse the leeway such an innovation wouldoffer them by increasing their borrowing (as the present authors seem toassume they would), but they might also use it appropriately to reducetheir risk. The same may be said of the authors’ expressed preference forequity over debt finance.
The distinction between countries subject to sudden stops of capitalflows and those that can borrow even in the face of severe negative shocksis fundamental. It is an issue that I first grappled with when I visited Chilein 1991 to discuss the problems for economic policy posed by an inflowof capital that the authorities judged to be excessive. The Chileans Italked to were adamant that a steep fall in the price of copper would pro-
68 Brookings Papers on Economic Activity, 1:2003
2. Kuczynski and Williamson (2003).
1440-01 BPEA/Reinhart 07/17/03 08:11 Page 68
voke a sudden stop of private capital inflows, rather than allow anincrease in borrowing to finance a countercyclical policy—a predictionthat proved all too correct in 1998. Given the situation as they perceivedit, we agreed that it made sense to restrain capital inflows: hence theencaje.3 Complete capital account liberalization was for that perhaps-distant day when the capital markets would treat Chile as a developedcountry. Ricardo Ffrench-Davis summarized my advice as “first join theOECD, then liberalize the capital account” (although subsequenthistory—first in Mexico, then in Korea—showed all too clearly that sim-ply joining the OECD is not enough). It is important to note that suddenstops are not confined to countries with a history of default: three of thefive countries classified as “Emerging market countries with no externaldefault history” in the authors’ table 1 suffered from sudden stops in1997, namely, Korea, Malaysia, and Thailand.
The most profound question raised by this paper is how countries cangraduate from one club to a higher one, with graduation to club A (wheresudden stops no longer happen) being the really important event. We doknow that Chile and Mexico have attained investment-grade ratings ontheir debt in recent years, and it is interesting to see in table 9 that Brazilhad a rating from Institutional Investor very close to that needed foradmission to club A in 1979, before the debt crisis. And of course a lot oftoday’s advanced countries defaulted as late as the nineteenth century.These facts give some reason to hope that default in 1824 does not implypermanent exclusion from club A. But what is needed to win acceptancethere? Is it the attainment of industrial country living standards (in whichcase Singapore ought already to be in the club)? Is it a long track record ofservicing debt, such as can be achieved by restraining borrowing and soreducing debt vulnerability (which seems to be the approach favored byReinhart and colleagues)?4 Is it a network of institutions that will supportcontinued debt service—such as an efficient tax system to raise theneeded revenue, and pension funds dependent on continued receipt of
Carmen M. Reinhart, Kenneth S. Rogoff, and Miguel A. Savastano 69
3. The encaje was a capital control in the form of an unremunerated reserve require-ment for one year on all foreign loans.
4. Incidentally, I do not regard their table 12 as compelling evidence that countries areincapable of outgrowing debt: the bar (growth sufficient to reduce the debt-to-GNP ratio by25 percentage points in three years) has simply been set too high. One would expect outputgrowth to have played a far more important role in slower reductions in debt vulnerabilitythan those shown in the table (and even there it plays a role in seventeen of the twenty-threeinstances cited).
1440-01 BPEA/Reinhart 07/17/03 08:11 Page 69
interest income in order to maintain a decent standard of living for theretired? Can perhaps the long process of investment in demonstrating“debt tolerance” be accelerated by not defaulting when the pressure is on?If so, one has to be thankful that IMF policy toward Brazil in 2002 wasnot guided by the argument of this paper!
General discussion: Mark Gertler drew a parallel between the differ-ences in leverage ratios observed across countries and the differences inleverage ratios observed across U.S. firms. In a given industry, larger andmore mature firms typically have higher leverage ratios than younger andsmaller firms, which also exhibit higher default rates. Theories based onasymmetric information and imperfect contract enforceability provide arationale for these outcomes. Furthermore, default rates and leverage arepositively correlated across small firms, although this relation is endoge-nous. When hit by a negative shock, small firms do not default right awaybut rather build up debt while trying to smooth production in the presenceof low cash flows. They default only when their capacity to borrow moreis exhausted.
William Brainard agreed that such endogeneity would be important incountry data, because sovereign debt crises have large effects on coun-tries’ incomes. Because of this, the importance of the variability ofincome for the leverage ratio cannot be inferred using data for the wholesample, but rather from only those observations that are not subject to thisendogeneity. Brainard also stressed that the paper does not go far enoughin accounting for fundamentals that might help explain when countriesare likely to default. For firms, one traditionally computes various kindsof coverage ratios in order to assess the relationship between debt-to-equity ratios and default rates, taking into account the variance of earn-ings and other fundamentals. By comparison, measures such as the exportcoverage ratio are very crude indicators of a country’s position. Somecountries’ exports may be largely manufactured goods tied to imports ofintermediate materials, whereas for others they may consist mainly of rawmaterials. Export coverage ratios should be interpreted quite differently inthese two cases.
Shang-Jin Wei considered a main message of the paper to be that thefirst default is very costly, because it increases the cost of future debt,apparently forever. He noted that this view conflicts with the idea thatcapital markets have very short memories, a point that Barry Eichengreen
70 Brookings Papers on Economic Activity, 1:2003
1440-01 BPEA/Reinhart 07/17/03 08:11 Page 70
and William Cline, among others, have stressed. Wei suggested thatinvestors want to forgive past behavior and even look for excuses to do soafter some years have passed since the last crisis. He noted that a changein government often provides such an excuse and suggested that the coun-try time series in the paper could be used to investigate this idea. CarolGraham questioned whether reforms in developing countries are neces-sarily associated with large revenue losses. Although the authors note thatrevenue losses from trade and tariff reforms have increased debt in manysuch countries, other reforms, such as the privatization of unprofitablestate enterprises, would be expected to increase revenue. She suggestedthat analyzing revenue by individual country or by group of countriesmight illuminate the effect of different reforms and the net effect ofreform generally.
Carmen M. Reinhart, Kenneth S. Rogoff, and Miguel A. Savastano 71
1440-01 BPEA/Reinhart 07/17/03 08:11 Page 71
References
Artana, Daniel, Ricardo López Murphy, and Fernando Navajas. 2003. “A FiscalPolicy Agenda.” In After the Washington Consensus: Restarting Growth andReform in Latin America, edited by Pedro-Pablo Kuczynski and JohnWilliamson. Washington: Institute for International Economics.
Barro, Robert J. 1979. “On the Determination of the Public Debt.” Journal ofPolitical Economy 87(5, part 1): 940–71.
Beim, David O., and Charles W. Calomiris. 2001. Emerging Financial Markets.New York: McGraw-Hill/Irwin.
Bosher, J. F. 1970. French Finances 1770–1795: From Business to Bureaucracy.Cambridge University Press.
Bouchard, Léon. 1891. System Financier de l’Ancien Regime. Paris: Guillaumin.Bulow, Jeremy, and Kenneth Rogoff, 1989. “Sovereign Debt: Is to Forgive to
Forget?” American Economic Review 79(1): 43–50.———. 1990. “Cleaning Up Third-World Debt Without Getting Taken to the
Cleaners.” Journal of Economic Perspectives 4(1): 31–42.Cline, William R. 1984. International Debt: Systemic Risk and Policy Response.
Washington: Institute for International Economics.———. 1995. International Debt Reexamined. Washington: Institute for Interna-
tional Economics.Díaz-Alejandro, Carlos F. 1983. “Stories of the 1930s for the 1980s.” In Finan-
cial Policies and the World Capital Market: The Problem of Latin AmericanCountries, edited by Pedro Aspe-Armella, Rudiger Dornbusch, and MauriceObstfeld. University of Chicago Press.
———. 1984. “Latin American Debt: I Don’t Think We Are in Kansas Any-more.” BPEA, 2:1984, 335−403.
Easterly, William R. 1989. “Fiscal Adjustment and Deficit Financing During theDebt Crisis.” In Dealing with the Debt Crisis, edited by Ishrat Husain and IshacDiwan. Washington: World Bank.
———. 2001. The Elusive Quest for Growth. MIT Press.Easterly, William R., and Klaus Schmidt-Hebbel. 1994. “Fiscal Adjustment and
Macroeconomic Performance.” In Public Sector Deficits and MacroeconomicPerformance, edited by William R. Easterly, Carlos A. Rodriguez, and KlausSchmidt-Hebbel. Oxford University Press for the World Bank.
Eichengreen, Barry, Ricardo Hausmann, and Ugo Panizza. 2002. “Original Sin:The Pain, the Mystery, and the Road to Redemption.” University of California,Berkeley (November).
Giovannini, Alberto, and Martha de Melo. 1993. “Government Revenue fromFinancial Repression.” American Economic Review 83(4): 953–63.
Goldstein, Morris. 2003. “Debt Sustainability, Brazil, and the IMF.” WorkingPaper WP03-1. Washington: Institute for International Economics (February).
72 Brookings Papers on Economic Activity, 1:2003
1440-01 BPEA/Reinhart 07/17/03 08:11 Page 72
International Monetary Fund. 1995. Private Market Financing for DevelopingCountries. Washington: International Monetary Fund.
———. 2002. “Assessing Sustainability.” Washington: International MonetaryFund (May).
Jahjah, Samir, and Peter J. Montiel. 2003. “Exchange Rate Policy and DebtCrises in Emerging Economies.” IMF Working Paper WP/03/60. Washington:International Monetary Fund (March).
Kaminsky, Graciela L., Carmen M. Reinhart, and Carlos A. Végh. 2003. “WhenIt Rains, It Pours: Procyclical Capital Flows and Policies.” Washington:George Washington University.
Kuczynski, Pedro-Pablo, and John Williamson, eds. 2003. After the WashingtonConsensus: Restarting Growth and Reform in Latin America. Washington:Institute for International Economics.
Lucas, Robert E. J., and N. Stokey. 1983. “Optimal Fiscal and Monetary Policy inan Economy without Capital.” Journal of Monetary Economics 12(1): 55–93.
McKinnon, Ronald I. 1991. The Order of Economic Liberalization. Johns Hop-kins University Press.
Morris, Stephen, and Hyun Song Shin. Forthcoming. “Coordination Risk and thePrice of Debt.” European Economic Review.
Obstfeld, Maurice. 1994. “The Logic of Currency Crises.” Cahiers Economiqueset Monetaires 43.
Obstfeld, Maurice, and Kenneth S. Rogoff. 1996. Foundations of InternationalMacroeconomics. MIT Press.
Prasad, Eswar, and others. Forthcoming. “Effects of Financial Globalization onDeveloping Countries: Some Empirical Evidence.” IMF Occasional Paper.Washington: International Monetary Fund.
Reinhart, Carmen M. 2002. “Default, Currency Crises, and Sovereign Credit Rat-ings.” World Bank Economic Review 16(2): 151–70.
Reinhart, Carmen M., and Vincent R. Reinhart. 2003. “Twin Fallacies AboutExchange Rate Policy in Emerging Markets.” NBER Working Paper 9670.Cambridge, Massachusetts: National Bureau of Economic Research (April).
Reinhart, Carmen M., and Kenneth S. Rogoff. 2002. “The Modern History ofExchange Rate Arrangements: A Reinterpretation.” NBER Working Paper8963. Cambridge, Massachusetts: National Bureau of Economic Research(June).
Reinhart, Carmen M., Kenneth S. Rogoff, and Miguel A. Savastano. 2003.“Addicted to Dollars.” Washington: International Monetary Fund.
Reisen, Helmut. 1989. “Public Debt: North and South.” In Dealing with the DebtCrisis, edited by Ishrat Husain and Ishac Diwan. Washington: World Bank.
Rogoff, Kenneth S. 1999. “International Institutions for Reducing Global Finan-cial Instability.” Journal of Economic Perspectives 13(4): 21–42.
Carmen M. Reinhart, Kenneth S. Rogoff, and Miguel A. Savastano 73
1440-01 BPEA/Reinhart 07/17/03 08:11 Page 73
Sims, Christopher. 2001. “Fiscal Consequences for Mexico of Adopting the Dol-lar.” Journal of Money, Credit, and Banking 33(2, part 2): 597–616.
Velasco, Andrés. 1996. “Fixed Exchange Rates: Credibility, Flexibility and Mul-tiplicity.” European Economic Review 40: 1023–35.
Vives, Jaime Vicens. 1969. An Economic History of Spain. Princeton UniversityPress.
Williamson, John. 1988. Voluntary Approaches to Debt Relief. Policy Analysesin International Economics 25. Washington: Institute for InternationalEconomics.
———. 2002. “Is Brazil Next?” International Economics Policy Briefs PB 02-7.Washington: Institute for International Economics.
Winkler, Max. 1933. Foreign Bonds: An Autopsy. Philadelphia: R. Swain.Wynne, William H. 1951. State Insolvency and Foreign Bondholders, Vol. 2.
Yale University Press.
74 Brookings Papers on Economic Activity, 1:2003
1440-01 BPEA/Reinhart 07/17/03 08:11 Page 74