- Industry Report 97/11 - Stormwater Gross Pollutants€¦ · This report summarises the...
26
INDUSTRY REPORT INDUSTRY REPORT
Transcript of - Industry Report 97/11 - Stormwater Gross Pollutants€¦ · This report summarises the...

INDUSTRY REPORTINDUSTRY REPORT

Stormwater GrossPollutants
by
Robin Allison, Francis Chiew and Tom McMahon.
Industry ReportReport 97/11
December 1997

ii
Allison, Robin Angus
Stormwater gross pollutants industry report
Bibliography
ISBN 1 876006 27 7.
1. Urban runoff – Environmental aspects – Australia
2. Water – Pollution – Australia.
3. Water quality management – Australia.
4. Environmental policy – Australia. I. Chiew, F.H.S. II. McMahon,
T. A. (Thomas Aquinas). III. Cooperative Research Centre for Catchment
Hydrology. IV. Title. (Series: Report (Cooperative Research Centre for
Catchment Hydrology): 97/11.
628.2120994
Keywords
Pollutants
Storm Sewage
Stormwater Management
Runoff (Urban)
Pollution (Surface Water)
Trap
Water Quality Monitoring
Loading
Pollution Sources
Urban Areas
Transport
Litter
© Cooperative Research Centre for Catchment Hydrology 1997
CRC for Catchment Hydrology Office
Department of Civil Engineering
Monash University
Clayton, Victoria 3168
Australia
Telephone: (03) 9905 2704
Fax: (03) 9905 5033
Web page: http://www-civil.eng.monash.edu.au/centres/crcch/
Photographs were provided by:
• Robin Allison
• Melbourne Water
• Ian Rutherfurd
Background cover photo: Aerial view of Murray River billabong near Albury, NSW.

iii
This industry report is one of a series prepared by the Cooperative Research Centre (CRC) for Catchment Hydrology to help provide
agencies and consultants in the Australian land and water industry with improved ways of managing catchments.
Through this series of reports and other forms of technology transfer, industry is now able to benefit from the Centre’s high-
quality, comprehensive research on salinity, forest hydrology, waterway management, urban hydrology and flood hydrology.
This particular Report represents a major contribution from the CRC’s urban hydrology program, and presents key findings
from research on stormwater gross pollutants in the project entitled ‘Design and management procedures for urban waterways
and detention basins’. (More detailed explanations and research findings from the project can be found in the Reports and
Working Documents published by the Centre.)
The CRC welcomes feedback on the work reported here, and is keen to discuss opportunities for further collaboration with
industry to expedite the process of getting research into practice.
Russell Mein
Director, Cooperative Research Centre for Catchment Hydrology
Foreword

iv
This report summarises the Cooperative Research Centre (CRC) for Catchment Hydrology’s research on gross pollutants in urban stormwater. This study is part
of the CRC’s project C2 ‘Design and management procedures for urban waterways and detention basins’. The following topics are covered in this report:
• the CRC’s gross pollutant monitoring programs
• stormwater gross pollutant characteristics (loads and types)
• gross pollutant trapping systems
• field monitoring of two gross pollutant traps
• estimating gross pollutant loads and comparing different trapping strategies.
A feature of the project was the range of organisations it brought together, particularly in monitoring gross pollutant characteristics and evaluating two types
of gross pollutant traps. The authors wish to thank all of the partners for their generous cooperation and support. The participants in the project included:
• Australian Water Technologies
• Banyule City Council
• CDS Technologies
• Environment Australia
• Melbourne Water
• Merri Creek Management Committee
• Moreland City Council
• The University of Melbourne
Preface
Testing gross pollutant traps 12
• CDS device testing 12
• Side entry pit trap testing 14
Selecting trapping strategies 16
Further reading 17
Contents
v
Foreword iii
Preface iv
Introduction 1
• CRC monitoring programs 1
Gross pollutant characteristics 2
• Gross pollutant loads 2
• Gross pollutant composition 3
• Gross pollutant transport during storms 5
Trapping gross pollutants 7
• Side entry pit trap (SEPT) 8
• Litter control device (LCD) 8
• Trash rack 8
• Continuous deflective separation (CDS) 9
• Gross pollutant trap (GPT) 9
• Floating debris trap (FDT) 10
• Summary of other recently developed Australian gross pollutant 10
trapping systems

vi
Gross pollutants come in all shapes and sizes

1
IntroductionGross pollutants are large pieces of debris flushed through urban catchments
and stormwater systems. For the purpose of this report, gross pollutants are
defined as debris items larger than five millimetres. They typically include
litter (mainly paper and plastics) and vegetation (leaves and twigs), which
are transported by stormwater runoff into receiving waters (urban creeks,
rivers and estuaries). Gross pollutants are a threat to wildlife and aquatic
habitats, look unpleasant, smell and attract vermin.
Although the environmental
problems associated with gross
pollutants in urban waterways
are recognised, there has been
little research in Australia into
gross pollutant characteristics
and movement. There is also
limited information on the
performance of structural
devices to trap gross pollutants.
This report describes a
monitoring study undertaken by
the CRC for Catchment
Hydrology as part of its Project
C2: Design and management
procedures for urban waterways
and detention basins to address
this knowledge gap.
CRC M O N I T O R I N G PR O G R A M S
The CRC project involved two field
monitoring programs in Coburg,
Melbourne. The study site is 8 km
north of central Melbourne and is
typical of inner city suburbs in
Australian capital cities. Results from
this study could therefore be applied
to the management of gross pollutants
in other Australian cities.
In the first program, CRC researchers
monitored stormwater flows and
gross pollutants, and manually
collected water samples during storm
events at several sites. These data
were used to investigate the variation
of gross pollutant concentrations and
loads throughout a runoff event.
In the second program, the CRC
investigated the performance of two
promising gross pollutant trapping
systems. The first device (CDS, see page 9) had a very high trapping
efficiency, and thus provided excellent data on the gross pollutant
characteristics for the catchment. In evaluating the second system (SEPTs,
see page 8), the CRC installed traps at all 192 publicly owned road-side
entrances in the catchment, providing data on the distribution of gross
pollutants across the catchment.Gross pollutants – an environmental hazard
CRC researcher retrieving data from astormwater flow meter.

2
Analyses of data collected from many storm events indicate that rainfall
and runoff are the best explanatory variables for estimating gross pollutant
loads. The relationships in Figures 1 and 2 are derived from the CRC
monitoring data, and can be used to estimate gross pollutant loads in
Melbourne and other cities with similar rainfall and runoff patterns.
Gross PollutantCharacterist ics
G R O S S P O L L U T A N T L O A D S
Results from the CRC monitoring program
suggest that urban areas contribute about
20-40 kilograms (dry mass) per hectare per year
of gross pollutants to stormwater. For Melbourne,
this is equivalent to approximately 60,000 tonnes
or 230,000 cubic metres of gross pollutants
(about 120 Olympic-sized swimming pools) and
about 2 billion items of litter annually
(about one item per person per day).
Collecting gross pollutants from a continuous deflective separation trap for analysis
Sorting gross pollutants into various classifications
Figure 1: Dry litter loads plotted against rainfall
Figure 2: Dry litter loads plotted against runoff

3
GROSS POLLUTANT COMPOSITION
In the CRC studies, organic material – leaves, twigs and grass clippings –
constituted the largest proportion of gross pollutant load (by mass) carried by
urban stormwater (Figure 3). This was observed across all urban land-use types.
Vegetation, however, is not
a major source of nutrients
compared to other sources.
The CRC monitoring
study indicated that the
potential total phosphorus
and total nitrogen loads
from vegetation in
stormwater are about
two orders of magnitude
lower than the loads
measured in stormwater
samples. However, because
of its large volume, plant
matter should be taken
into account in the design
of gross pollutant traps,
particularly where they
could cause pipe blockages
or habitat destruction. Most of the litter analysed – by mass and frequency – comprised paper
and plastics. These enter the drainage network as street litter from mainly
commercial areas. Large quantities of food, drink and cigarette refuse were
also found during the monitoring (see Figures 4 and 5).Gross pollutants mainly compriseplant matter
Figure 3: Composition of gross pollutants by mass
Figure 4: Composition of litter by mass

4
Laboratory testing of gross pollutants showed that typically only 20 percent
of the litter and less than 10 percent of the vegetation usually floats. This
has implications for traps designed to catch only floating material.
These findings suggest that fast food consumers and smokers are a
significant source of litter in urban streams.
Figure 5: Composition of litter by count
Categories of gross pollutants after sorting
Floating gross pollutants collecting behind a fallen branch in the Merri Creek, Melbourne

5
Gross pollutant samplers (developed by Dr CharlesEssery, Australian Water Technologies ) in actionat Coburg, Melbourne
Bagging pollutants for analysis Figure 6: Rainfall, discharge and gross pollutant loads and concentrations during onestorm monitored at one of the CRC’s Coburg sites
GROSS POLLUTANT TRANSPORT
DUR ING STORMS
Figure 6 shows rainfall, discharge, gross pollutant concentration and gross
pollutant load rate during a typical storm event at one of the CRC
monitoring sites at Coburg. These show that:
• the composition of gross pollutants during events remains relatively constant
compared to the concentration and load fluctuations
• gross pollutant concentrations are highest during the early stages of runoff,
but most of the load is transported during times of high discharge
• the loads and concentrations of gross pollutants generated by a storm are
similar to those generated by other storms occurring earlier on the same day.

6
The large amount of gross pollutants observed in the CRC studies suggests
that stormwater channels are effective in transporting gross pollutants from
urban areas. The CRC monitoring also showed that not only do discharge
and pollutant conditions in stormwater drains change and vary consider-
ably, but so does the material carried. It may be any size, shape, density or
hardness. This is the challenge that trap designers face. Trapping systems
should be geared to treat the maximum possible discharge, and to cope
with multiple storms in a day.
Concrete-lined drains transport pollutants efficiently
Gross pollutants commonly accumulate on urban beaches

7
Increasing concern about
the quantity of gross
pollutants in urban
waterways is leading to
greater use of gross
pollutant trapping devices.
Although different types
of trapping devices are
now available, there is
little information on
their performance.
This is the focus of the CRC`s second monitoring program.
Two main characteristics determine the performance of a gross pollutant
trap: trapping efficiency, and maintenance requirements. The trapping
efficiency is defined as the proportion of the total mass of gross pollutants
transported by stormwater that is retained by the trap. A low trapping
efficiency means that gross pollutants pass through the trap and reach
downstream waters. A poorly maintained trap will be inefficient at trapping
pollutants, and is also a potential source of pollutants as trapped materials
break down.
The first gross pollutant traps were built in the late 1970s using simple
designs. More recent technologies have incorporated high-tech design
and construction. Six trapping systems commonly used in Australia are
described here, from those designed for the upper parts of catchments
(e.g. SEPTs), to those intended for slow-moving waterways (litter booms)
further down the catchment.
Trapping GrossPollutantsMethods for reducing gross pollutants in urban waterways can be grouped into
two categories:
• Structural methods are traps placed in side entry pits in gutters, or
installed inside stormwater channels to separate and contain gross
pollutants, and
• Non-structural methods involve changing the attitudes and actions of
the community (including business, industry and residents).
Drain labels like this remind people of the link between street litter and waterways
Street sweeping helps reduce gross pollutants in drains

8
SI D E EN T R Y P I T TR A P (SEPT)Side entry pit traps (SEPTs) are
baskets fitted below the entrance
to drains from road gutters.
When stormwater passes through
the baskets to the drain, material
larger than the basket mesh size
(5-20 mm) is retained. This
material remains in the basket
until it is removed by a
maintenance crew, typically every
four to six weeks. SEPTs are
intended to be used at many
locations throughout an urban
area, and can catch up to 80
percent of the litter in a
catchment.
L I T T E R C O N T R O L D E V I C E (LCD)North Sydney City Council
developed the litter control device
(LCD) in response to publicity
surrounding a clean-up campaign.
The baskets sit below the entry
point of the inlet pipe. Water
entering the baskets flows out
through the holes, while debris
larger than the pore size is
retained. As debris builds up,
it reduces the pore sizes, allowing smaller material to be caught. Trapping
efficiencies of 30 to 80 percent have been reported, depending on a monthly
or weekly cleaning frequency.
TR A S H R A C K
Trash racks consist of vertical or horizontal steel bars – typically 40-100 mm
apart – fitted across stormwater channels up to 10 metres wide. They are
manually cleaned, usually monthly. When water passes through the trash
rack, it retains material larger than the bar spacing. As material builds up
behind the trash rack, finer material is collected. However, this frequently
blocks the rack, causing overflows that carry collected pollutants downstream.
Side entry pit trap (SEPT) in a controlled experiment
A litter trap in Melbourne based on the littercontrol device (LCD) principle
Trash rack in Cup and Saucer Creek, Sydney

CO N T I N U O U S DE F L E C T I V E
SE P A R A T I O N (CDS)The continuous deflective separation (CDS) device is installed in
stormwater channels and works by diverting the incoming flow of
stormwater and pollutants into a pollutant separation and containment
chamber. Solids within the separation chamber are kept in continuous
motion, and are prevented from ‘blocking’ the screen. Water passes through
the screen and flows downstream. The non-blocking screen ensures that all
gross pollutants are retained except for flows that overflow the by-pass weir
during large floods. Floating objects are kept in continuous motion on the
water surface, while heavier pollutants settle into a containment sump from
where they can be routinely removed.
GR O S S PO L L U T A N T TR A P (GPT)
Gross pollutant traps (GPTs) consist of a large concrete-lined wet basin
upstream of a weir. A trash rack is located above the weir. The decreased
flow velocities in the wet basin encourage coarse sediments to settle to the
bottom. Gross pollutants are retained by the trash rack – usually made from
vertical steel bars – at the downstream end of the basin. The trash rack collects
floating and submerged debris in the same way as conventional trash racks.
Major and minor GPTs have been developed to accommodate small (2–50 ha)
and large (50–500 ha) catchments. Both operate with the same principles.
9
A continuous deflective separation device (CDS) in the laboratory
A major gross pollutant trap (GPT) at Tuggeranong Lake, Canberra

Float ing debris trap (FDT)
Floating debris traps (FDTs), or litter booms, are made by stringing partly
submerged floating booms across waterways. The booms collect floating
objects as they collide with it. Newer designs use floating polyethylene boom
arms with fitted skirts to deflect floating debris through a flap gate into a
storage compartment. The performance of any boom is influenced by the
flow conditions of the waterway – they are best suited to slow-moving
waters. Because more pollutants sink than float, the traps are only useful
for trapping highly buoyant materials, and thus miss most of the gross
pollutant load.
10
Floating debris trap in the Yarra River, Melbourne
Summary of other recentlydeveloped australian grosspollutant trapping systemsWhile many traps have been developed in Australia over the last couple ofyears, information on their trapping performance is still being gathered.Table 1 lists some of the more promising traps, and provides a comment ontheir performance.

11
Table 1: Recent Australian gross pollutant trapping systems
Device Catchment area Cleaning frequency Comments on performance(hectares)
Baramy 10–100 monthly Trash moves down an inclined screen with theforce of the water, pushing pollutants onto aholding shelf to await collection. This systemshows promise for economically trapping grosspollutants. Some units have been installed inNSW.
Diston 10–50 monthly The trap uses three types of filtration to retaingross pollutants. Water firstly falls into a litterbasket, then goes through a submerged outlet (toretain floatables) and then into a chamber thathas a trash rack. Several units have been installedin Victoria.
Litterguard 5–50 monthly A boom is located on the bed of a channel and itdiverts flow and pollutants into a retentionchamber. During high flows, the boom lifts withthe flow and diverts only the floating materials.Several units have been installed in Melbourne.
Ecosol RSF4000 10–200 unknown Stormwater and pollutants are diverted into alitter-collection basket by a hydraulically drivenbarrier created by the water exiting the basket.Pollutants are retained in the basket by directfiltration. Several units have been installed inSouth Australia.
Ski-jump 10–60 unknown A trash rack inclined towards the flow collectspollutants during low flows. During large flows,the collected pollutants are pushed downstreaminto a collection chamber. Several units have beeninstalled in NSW.
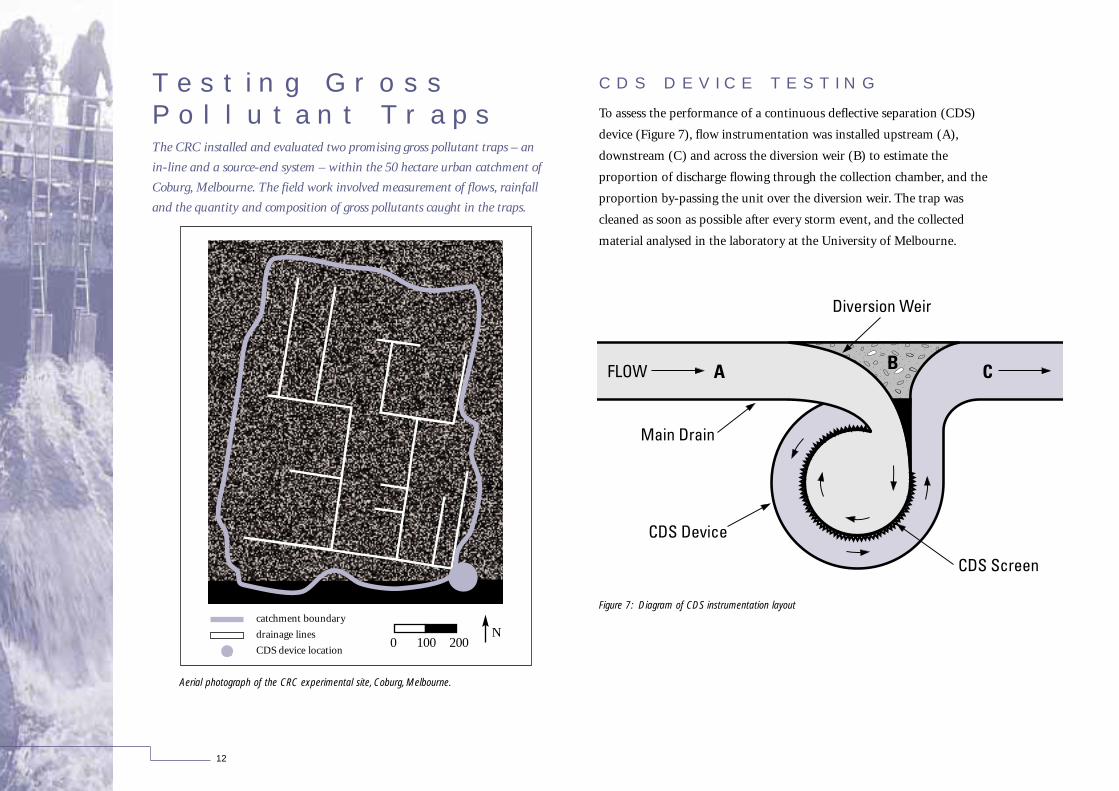
C D S D E V I C E T E S T I N G
To assess the performance of a continuous deflective separation (CDS)
device (Figure 7), flow instrumentation was installed upstream (A),
downstream (C) and across the diversion weir (B) to estimate the
proportion of discharge flowing through the collection chamber, and the
proportion by-passing the unit over the diversion weir. The trap was
cleaned as soon as possible after every storm event, and the collected
material analysed in the laboratory at the University of Melbourne.
12
Test ing GrossPollutant TrapsThe CRC installed and evaluated two promising gross pollutant traps – an
in-line and a source-end system – within the 50 hectare urban catchment of
Coburg, Melbourne. The field work involved measurement of flows, rainfall
and the quantity and composition of gross pollutants caught in the traps.
N0 100 200
catchment boundary
drainage lines
CDS device location
Aerial photograph of the CRC experimental site, Coburg, Melbourne.
Figure 7: Diagram of CDS instrumentation layout
���������
@@@@@@@@@
���������
ÀÀÀÀÀÀÀÀÀ
���������
@@@@@@@@@
���������
ÀÀÀÀÀÀÀÀÀ
���������
yyyyyyyyy

13
Construction of the CDS device (clockwise from top left): digging the hole for construction; walls of the collection chamber; fitting the separation screen; and the final product at road level
CDS instrumentation included depth probes (above)and flow meters (below)
The results demonstrate that CDS
devices are efficient gross pollutant
traps. During three months of
monitoring, practically all gross
pollutants transported by the
stormwater were trapped by the CDS
device (i.e. 100 percent removal rate).
In addition, the device appears to cause
minimal interference to flow in the
stormwater drain, and is therefore
suitable for most urban areas. However
CDS devices are expensive to install and
require a complex construction process. But, once constructed, they require
infrequent cleaning (about once every 3 months) at one location within a
catchment.

14
S I D E E N T R Y P I T T R A P
(S E P T ) T E S T I N G
SEPTs were installed at all 192 accessible road entrances (Figure 8) in
the same catchment. Because the CDS device traps practically all gross
pollutants, it was used as a downstream ‘control’ system against which to
measure the SEPTs’ trapping performance.
SEPTs and the CDS device were cleaned on the same day four times over a
three-month period. Data analysis indicated that SEPTs can trap significant
quantities of gross pollutants. They are cheap, easy to install and, because
The CRC study included an
investigation of cleaning
procedures for the CDS device.
After cleaning, remaining material
was collected and compared to the
mass removed. The study revealed
that a vacuum cleaning method is
best suited to the Coburg
installation.
left: Cleaning the CDS unit with a sump basket
below: Cleaning the CDS with a largevacuum truck
Figure 8: Coburg catchment showing drain entrances

15
they can be installed on individual drainage entrances, can be used in
specific areas. If placed on all public roadside entry pits, they can trap up
to about 80 percent of the litter load and 65 percent of the total gross
pollutant load entering a catchment’s drainage system.
The frequent cleaning required by SEPTs means that putting traps on all
roadside entry pits is unlikely. It is possible, however, to trap two-thirds of the
litter with only half of the drainage entrances fitted with SEPTs (Figure 9).
CRC data analysis revealed that side entry pits deliver more gross pollutants to
the drainage system than grates, and should therefore be targetted in
clean-up programs.
SEPT in Coburg with trapped debris
Figure 9: Plot of trapping efficiency against proportion of entrances fitted with SEPTs

The results of this study have been incorporated into a decision-support-
system (DSS) for managers to use in choosing from a range of gross
pollutant traps described in this report (Figure 10). The DSS estimates gross
pollutant loads from rainfall data and land-use type information, as well as
trapping performance and costs associated with alternative trapping
strategies. The DSS is a simple reference tool for urban stormwater managers
to use in selecting appropriate gross pollutant reduction strategies for given
resources and management needs, based on our current understanding of
gross pollutant movement and trapping. For further information or queries
regarding the DSS computer program and user manual please contact the
CRC Catchment Hydrology centre office on (03) 9905 2704.
16
Figure 10: Structure of the CRC decision-support-system (DSS) for evaluating gross pollutanttrapping strategies
Select ing TrappingStrategiesThe CRC’s findings demonstrate that, although large amounts of gross
pollutants are carried from urban catchments via stormwater, technologies are
available to trap these pollutants.
Trapping gross pollutants in the urban drainage system, however, can be
expensive. Because of the large area occupied by towns and cities in Australia,
it is unlikely that gross pollutant traps will be located on all urban catchments.
Stormwater managers must therefore select appropriate trapping techniques,
and decide where best to locate traps within a particular drainage network.
Gross pollutants in a city drain during a garbage collection strike

Further readingAllison, R.A., Walker, T.A., Chiew, F.H.S., O’Neill, I.C. and McMahon, T.A.
(in press) From roads to rivers - Gross pollutant removal from urban
waterways, Cooperative Research Centre for Catchment Hydrology Report.
Allison, R.A. , Chiew, F.H.S., and McMahon, T.A. (in press) A decision-
support-system for determining effective gross pollutant trapping strategies
for gross pollutants, Cooperative Research Centre for Catchment Hydrology
Report.
Armitage, N.P., Rooseboon, A., Nel, C. and Townshend, P. (in press) The
removal of trash from stormwater conduits, Report to Water Research
Commission of South Africa.
Board of Works, EPA Victoria, Merri Creek Parklands and City of Coburg
(1989) Litter control in urban waterways, Melbourne Water Internal
Report, Book Number 006915.
Department of Land and Water Conservation, NSW (1996) The manager’s
guide to: sediment, nutrient and gross pollutant control. First edition,
Resource Management Division, Sydney (Draft Document).
EPA Victoria, Melbourne Water, Municipal Association of Victoria, and
Natural Resources and Environment (in press) Best Practice Environmental
Management Guidelines for Urban Stormwater (Draft Document)
McKay, P. and Marshall, M. (1993) Backyard to Bay: Tagged litter report,
Melbourne Water.
Melbourne Water (1995) A guide to current technologies for removing litter
and sediment from drains and waterways, Internal Report, Waterways and
Drainage Group.
17

18

Established and supported under the Australian Government’s Cooperative
Research Centres Program
A cooperative venture between:Bureau of MeteorologyCSIRO Land and WaterDepartment of Natural Resources andEnvironment, VicGoulburn-Murray WaterMelbourne WaterMonash UniversityMurray-Darling Basin CommissionSouthern Rural WaterThe University of MelbourneWimmera-Mallee Water
Associates:Department of Land and WaterConservation, NSWDepartment of Natural Resources, QldHydro-Electric Corporation, TasState Forests of NSW
Centre OfficeDepartment of Civil Engineering
Monash UniversityClayton, Victoria 3168 Australia
http://www–civil.eng.monash.edu.au/centres/crcch/