Contentmccibd.org/images/uploadimg/publication_file/Quarterly_Review/QR... · hours was 7,211...
28
Transcript of Contentmccibd.org/images/uploadimg/publication_file/Quarterly_Review/QR... · hours was 7,211...


Content02-04
Executive Summary
04-06Agriculture
06-09Industry
09-14Monetary and Credit Developments
14Capital Market
14-15Public Finance
16Exports
16-17Imports
17-18Remittances
18Foreign Aid
18-19Foreign Direct Investment (FDI)
19Balance of Payment
20Exchange Rate
20Foreign Exchange Reserves
21Employment Situation
22Price Situation
23Chamber’s Projection on Some Selected Economic Indicators
24Concluding Observations

2 QUARTERLY REVIEW
GeneralBBS has estimated the GDP growth at 6.12 percent in FY14, which is 1.08 percentage points lower than the target of 7.2 percent. Inadequate infrastructure, shortage of power and energy, and political instability in the first half of FY14 were responsible for the lower growth of the economy. These impediments must be removed to restore the confidence of the country’s business and investor community.
Major challenges facing the government in the present fiscal are to boost private investment, bring momentum in economic activities, achieve a higher GDP growth, and contain inflation. Above all, there is the need to establish and sustain political stability, which is an essential precondition for reaching middle income country status for the country by 2021.
AgricultureDespite political unrest, the agriculture sector recorded an impressive 2.46 percent growth in FY14 compared to 1.47 percent in FY13, thanks to the steady growth in crop production and output in fisheries and horticulture sub-sectors.
IndustryBBS has estimated the growth of the broad industrial sector at 8.39 percent in FY14, 1.25 percentage points lower than the previous year’s 9.64 percent. Shortage of power and gas, political violence, labour unrest in the garments sector, insufficient private investment and shortage of industrial lands in export processing zones were the main reasons behind the low growth of the industrial sector.
The manufacturing sub-sector witnessed a lower growth of 8.68 percent in FY14, compared to 10.31 percent in FY13. The small scale manufacturing was the worst performer, growing by just 6.60 percent in FY14, compared to 8.81 percent in FY13. The large and medium industries sub-sector grew by 9.16 percent in FY14, compared to 10.65 percent in FY13.
Construction, Power and ServicesThe construction sub-sector grew at 8.56 percent in FY14, compared to 8.04 percent in FY13. The real estate, renting and business activities have also performed better in the period as it marked a 4.24 percent growth in FY14 from 4.04 percent in FY13. In spite of the tremendous potential of the construction and real estate sector, various factors are responsible for adversely affecting its development. These factors are: land value distortion and tax evasion, absence of secondary property market, asset securitization and sale of mortgages, backward linkage industries such as cement, ceramic, brick manufacturing industries, etc.
The power supply situation improved in the quarter under review but the demand for power increased, too. As of 30 June 2014, total actual generation during peak hours was 7,211 megawatt (mw) and demand was 7,050 mw. Although total installed capacity was 10,416 mw, and derated/present capacity was 9,821 mw. Production is less due to gas shortage and because some power stations were shut for maintenance. The maximum generation in 2014 was 7,356 mw on 30 March 2014 and it was also the maximum generation in BPDB’s history.
The services sector witnessed a better performance in FY14 compared to the previous fiscal. Although political violence gripped the country in first six months of FY14, the services sector growth increased by 0.32 percentage point to 5.83 percent in FY14 from 5.51 percent in FY13.
Money and Capital MarketBroad money (M2) recorded a 15.3 percent increase but domestic credit recorded a lower growth of 10.1 percent (y-o-y) at the end of May 2014, compared to 12.3 percent growth recorded at the end of May 2013, mainly because of the slowdown in import growth and political instability.
The excess liquidity of scheduled banks stood higher at Tk.1,402 billion as of end May 2014 compared to Tk.794 billion as of end June 2013. About 74 percent of this excess liquidity is held in the form of government securities and the rest is held in the form of cash and balances with the Sonali Bank and the Bangladesh Bank.
ExEcuTivE SuMMArY

April-June 2014Issue 04
Trade deficit narrowed in July-May of FY14, compared to the same period of FY13 due to a rise in exports and a lower growth in imports.
remittance inflows recorded a decline for the first time in 13 consecutive years in FY14. The decline was due to a shrinking outflow of migrant workers, falling receipts from Middle Eastern nations, appreciation of the taka against the dollar, and prolonged political turmoil in some labour importing countries. However, there was a turnaround in remittances during the quarter under review (Q4 of FY14) when remittances increased by 11.77 percent, rising to US$3.73 billion from US$3.34 billion in the same period of the previous fiscal.
The current account balance decreased by US$803 million to uS$1.54 billion in July-May of FY14 from uS$2.35 billion in the same period of FY13 partly due to a lower growth in remittances and partly due to a decline in the balance of the financial account. Overall balance, however, still increased by US$311 million or 6.7 percent to US$4.97 billion in July-May of FY14 compared to uS$4.66 billion during the corresponding period of FY13.
Foreign aid disbursement increased by 15 percent to US$2.62 billion during July-May of FY14, compared to uS$2.28 billion in the same period of FY13, but the commitment of foreign aid dipped by 37.8 percent to US$3.46 billion, compared to US$5.56 billion in the same period of FY13. Of the uS$3.46 billion aid commitments, the development partners committed only US$81.54 million as grants.
FDi fell by uS$158 million in the first eleven months of FY14, compared to the corresponding period of the previous fiscal year. According to industry insiders, the investors are still to get back the confidence, fearing further political turmoil. The prospective foreign investors have adopted a ‘go-slow’ strategy in making fresh investments since 2013.
The disbursement of industrial term loans slowed down in the first half of FY14 due to political instability. The recovery of industrial term loans, on the other hand, increased. The net disbursement of industrial term loans in absolute terms was, therefore, significantly lower. Likewise, the net disbursement of agricultural and non-farm rural credit also declined in the quarter under review.
In FY14, the stock market came out of the bearish trends caused by bouts of pre-election violence across the country. The average daily turnover was higher in FY14, compared to the turnover in FY13. Healthy corporate declarations by listed companies and optimistic investors pushed the market into positives.
Public Finance
The NBr collected Tk.103,630 crore in revenue during July-May of FY14, which is 82.9 percent of the revised revenue target of Tk.1,25,000 crore. This means that NBr might not have been able to fulfill the revenue target in the fiscal. in fact, the NBr authorities were complaining that a cut in tax-at-source on export earnings, sluggish business activities due to the political impasse and a reduction in banks’ income were resulting in lower revenue collection.
The government implemented 95 percent of the revised ADP in FY14. The rate of overall ADP implementation was one percentage point lower in FY14 than the previous fiscal year’s implementation of 96 percent. The implementation rate could have been much higher, had ministries and divisions were able to implement more donor-funded projects and if the country did not witness destructive political programmes in the beginning of the fiscal.
External Sector: Export, Import, Remittances, Foreign Aid, FDI and Exchange Rate
in June 2014, exports grew by 3.51 percent month-on-month to US$2.800 billion from US$2.705 billion but remained 8.79 percent below the strategic monthly target of US$3.07 billion. This shortfall was because the country was yet to fully recover from the fallout of the political unrest. However, exports rose 8.34 percent in the quarter under review (April-June of FY14), compared to the corresponding quarter of FY13. The export growth was mostly driven by the rMG sector, which, despite political turmoil and labour unrest, registered 13.83 percent growth.
import payments during July-May of FY14 rose by 20.20 percent mainly due to higher imports of food grains and consumer goods ahead of ramadan along with capital machinery and industrial raw materials.

4 QUARTERLY REVIEW
favourable weather conditions. Therefore, it may not be difficult to achieve the production target of 18.916 mmt as against last year’s 18.778 mmt.
Food grains ImportIn FY14, some 374.56 tmt (thousand metric tons) of rice was imported, of which 99.2 percent was imported by the private sector and the balance 0.8 percent was imported by the public sector. In the same period, a total of 2,689.95 tmt of wheat was imported, of which about 65.6 percent was imported by the private sector and the balance was imported by the public sector.
Domestic ProcurementThe government’s domestic food procurement target (for rice and wheat) for FY14 was 1.6 mmt. The main objective was to provide a price incentive to farmers. The government started its procurement of at least 1.10 mmt of boro rice (1,000 tmt of rice and 150 tmt of paddy) at Tk.31.0 per kg for parboiled rice, at Tk.30.0 per kg for white rice and at Tk.20.0 per kg for paddy from the
Taka appreciated marginally (by 0.17%) in terms of US dollar at the end of June 2014, showing relative stability in the foreign exchange market. On the inter-bank market, the uS dollar was quoted at Tk.77.6300 at the end of June 2014. The exchange rate was Tk.77.7593 at the end of June 2013.
Inflationin June 2014, overall point to point inflation in the country fell by 1.08 percentage points to 6.97 percent from 8.05 percent in June 2013. The fall in the inflation rate can be attributed to a massive decline in the non-food inflation, which fell by 2.30 percentage points to 5.45 percent in June 2014 from 7.75 percent in June 2013. The food inflation also declined, by 0.26 percentage point to 8.00 percent in June 2014 from 8.26 percent in June 2013.
The government had set a target to contain point to point inflation within 7.0 percent in FY14. in line with the official target, the monthly inflation on point to point basis
showed a declining trend as it stood at 6.97 percent in June 2014 compared to 7.48 percent in the previous month (May).
The food inflation in June experienced a fall as it went down to 8.0 percent from 9.09 percent in May 2014. But the non-food inflation moved upward to 5.45 percent in June from 5.16 percent in May 2014 because people increased their spending on clothing and other consumer items ahead of Eid-ul-Fitr. Also house rent, furniture and house expenditures, medical and transport costs, and cost of educational equipment, and different products and services had of late increased. The people are now buying relatively more non-food items than before and hence non-food inflation may go up even further.
During FY14, the rate of inflation was higher in urban areas than in rural areas.
1.0 AGriculTurEAs an economy develops, the contribution of agriculture to GDP necessarily declines, but the sector must still play an essential role in providing food and nutritional security for the common people. The reduction in poverty and hunger is greatly dependent on good growth of agriculture. The agriculture sector currently (FY14) employs about 47.5 percent of Bangladesh’s total labour force and accounts for about 16.3 percent of the country’s GDP. Despite political unrest, the sector recorded an impressive 2.46 percent growth in FY14 compared to 1.47 percent in FY13, thanks to the steady growth in crop production and output in fisheries and horticulture sub-sectors.
1.1 Food grains Situation Domestic Production The Department of Agricultural Extension (DAE) had set the food grains production target at 35.887 million metric tons (mmt) for FY14, of which individual targets for aman, aus, boro and wheat were 13.28 mmt, 2.41 mmt, 18.916 mmt, and 1.281 mmt, respectively. The FY14 target was 2.28 percent higher than the actual production in FY13 (35.088 mmt). Estimates of aus, aman and wheat production have been finalized by the BBS at 2.326 mmt, 13.023 mmt and 1.375 mmt which are, respectively, 7.78 percent, 0.98 percent and 9.56 percent higher than the previous year’s actual production (2.158 mmt, 12.897 mmt and 1.255 mmt). According to the latest monitoring report of DAE, boro has been cultivated in a larger land area of nearly 4.803 million hectares in FY14 compared to 4.730 million hectares in FY13 along with sufficient input supports (fertilizer, irrigation water etc.) from government, and also amid
April-June 2014Issue 04
domestic market. The drive began on 1 May 2014 and will continue until 31 August 2014. As of 10 July 2014, some 469.22 tmt of boro rice was procured and arrangement to procure another 810.08 tmt was finalized. As for wheat, the collection programme started on 1 April 2014 and 149.29 tmt of wheat was collected up to 30 June 2014.
Public DistributionThe government has enhanced its efforts to ease the hardship of poor households by distributing subsidized grains through open market sale (OMS) and fair price card (FPC) channels. The target is to distribute a total of 2.74 mmt food grains this fiscal (FY15) as against the actual distribution of 2.22 mmt in FY14. Over the fortnight ending 10 July 2014, a total of 1.9 tmt food grains was distributed mainly through OMS (1.0 tmt) and EP (0.8 tmt). The OMS drive, which was resumed in small scale only in major metropolitan areas, continues, with rice being sold at Tk.24 per Kg and atta at Tk.22 per Kg.
Public StockAccording to the Directorate General of Food, the public food grains stock, as of 10 July 2014, stood at 1,161.40 tmt - 800.40 tmt for rice and 361 tmt for wheat.
Domestic Market Pricesin the fortnight ending 10 July 2014, the wholesale price of rice (Swarna) in Dhaka city markets fell by 0.7 percent, down to Tk.33.75 per Kg, while the retail price remained unchanged at Tk.35.50 per Kg. The wholesale
and retail prices now are, respectively, 9.8 percent and 8.2 percent higher than they were a year ago. Over the same period, the wholesale price of atta in Dhaka city markets fell by 2.0 percent, down to Tk.24.50 per Kg, while the retail price remained unchanged at Tk.32.0 per Kg. The wholesale and retail prices are, respectively, 8.1 percent and 4.5 percent lower now than a year ago.
International Market Prices in the fortnight ending 11 July 2014, the prices of vietnam 15% white, and India 5% parboiled rice rose by 2.1 percent, and 0.7 percent, up to US$390 per mt, and US$413 per mt, respectively. By contrast, the price of West Bengal (Burdwan) coarse rice rose by 2.1 percent, up to US$400 per mt, while the prices of Thai 5% parboiled and Pakistan 5% parboiled rice remained unchanged at US$420 per mt, and US$440 per mt, respectively. The wholesale price of rice in Dhaka city stood at US$435 per mt on the same date. in the fortnight ending 11 July 2014, the price of uS Soft red Winter (SrW), russia and ukraine wheat sharply decreased by 3.2 percent, 11.0 percent and 10.8 percent down to US$225 per mt, US$251 per mt and uS$247 per mt, respectively. On the same date, Dhaka city wholesale wheat price stood at US$341 per mt.
1.2 Fisheries, Livestock and PoultryAccording to the Bangladesh Bureau of Statistics (BBS), the fisheries and livestock sectors contributed around 5.5 percent while the fish sector contributed around 3.7 percent to GDP in FY14. The livestock and poultry sectors contributed around 1.8 percent to the total agricultural GDP while 90 percent of the animal protein came from the livestock sub-sector. Nearly 17.1 million people are involved in the fish sector, while the poultry sector has created job opportunities for around 6.5 million people.
The production of fish increased substantially in FY14. According to statistics available with Department of Fisheries (DoF), the production of fish, in last 10 years, doubled to 3.56 million tonnes. Of the total fish production,
6 QUARTERLY REVIEW
2.0 iNDuSTrYShortage of energy, both power and gas, was taking its toll on production in the country’s industry sector, even before the sector suffered the worst impact of shutdowns and blockades during the first half of FY14. For FY14, BBS has estimated the growth of the broad industrial sector at 8.39 percent, 1.25 percentage points lower than the previous year’s 9.64 percent. Political violence, labour unrest in the garment sector, insufficient private investment and shortage of industrial lands in export processing zones with required facilities were the main reasons behind the low growth of the industrial sector. Due to these reasons, many industrial units are running well below their production capacity.
2.1 Manufacturing IndustriesGrowth of manufacturing industries (large, medium and small) plunged to 8.68 percent in FY14 from 10.31 percent in FY13. The small scale manufacturing sub-sector performed the worst as its growth declined to 6.60 percent in FY14, some 2.21 percentage points lower than the 8.81 percent growth experienced in FY13. In comparison, the growth rate in the large and medium scale industries sub-sector was 1.49 percentage points lower at 9.16 percent in FY14 compared to 10.65 percent in the previous fiscal.
Manufacturing industries, which held 19.45 percent share in the GDP in FY14, have long been experiencing difficulties due to power and gas shortages and also insufficiency of land for setting up industries at appropriate locations. There are over 0.24 million large, small and medium size manufacturing units in the country, but due to the shortage of gas and electricity these units can utilize only 60 percent of their overall capacity. Therefore, manufacturing units, mostly bulk gas users, producing glass and glassware, carpet and rugs, petroleum refinery, industrial chemicals, leather products, transport equipment, tobacco, pharmaceuticals, wood products, ceramic, cement and electronic goods recorded a slow growth due to the energy shortage in the quarter under review.
about 27.3 percent comes from inland open water catch, 17.1 percent from marine catch and 55.6 percent from fish farming. last year, 70,000 tonnes of fish were exported with the rest being consumed locally. According to DoF, Bangladesh procured 50,000 tonnes of fish, mostly from India and Myanmar.
According to the poultry industry leaders and researchers of the Bangladesh Poultry Industries Coordination committee (BPicc), the country’s poultry industry has achieved self-sufficiency in meeting local demand for meat and eggs. The industry now produces 1,500 metric tonnes (mt) of poultry meat per day against the target of 1,400 mt. It also produces 16 million eggs per day against the demand for 15 million, and almost 10 million pieces of chicken every week against a demand for nearly 9 million pieces per week. The local producers have been making additional production in the last few months while the investment has now crossed Tk.250 billion and may be doubled within 2030 if the government properly supports the sector. Though the country has achieved self sufficiency in production, the local producers do not get the actual benefits due to the absence of proper marketing arrangements. The demand for the products is gradually increasing both at home and abroad, but the sector is failing to export the products due to various difficulties, such as shortage of surplus over domestic demand, inability to maintain international standard, and lack of sufficient safeguard mechanism at the firm level. The industry, which provides employment to about 6.5 million people, was hit hard by the bird flu in 2007 and 2009 as the number of poultry firms dropped to 55,000 in 2013 from 1,15,000 in 2007. To overcome the situation, the producers will need to make international standard products to compete with global companies in the export arena and also focus on some value addition in its products in the market to generate export surplus.
April-June 2014Issue 04
2.2 Mining and QuarryingThe growth of mining and quarrying sub-sector decelerated sharply in FY 14. The growth rate in natural gas and crude petroleum sub-sectors was 1.74 percent, and the growth rate in other mineral and coal resources extraction was estimated at 10.72 percent. The growth rates in these two sub-sectors in FY13 were 7.55 percent and 12.34 percent, respectively.
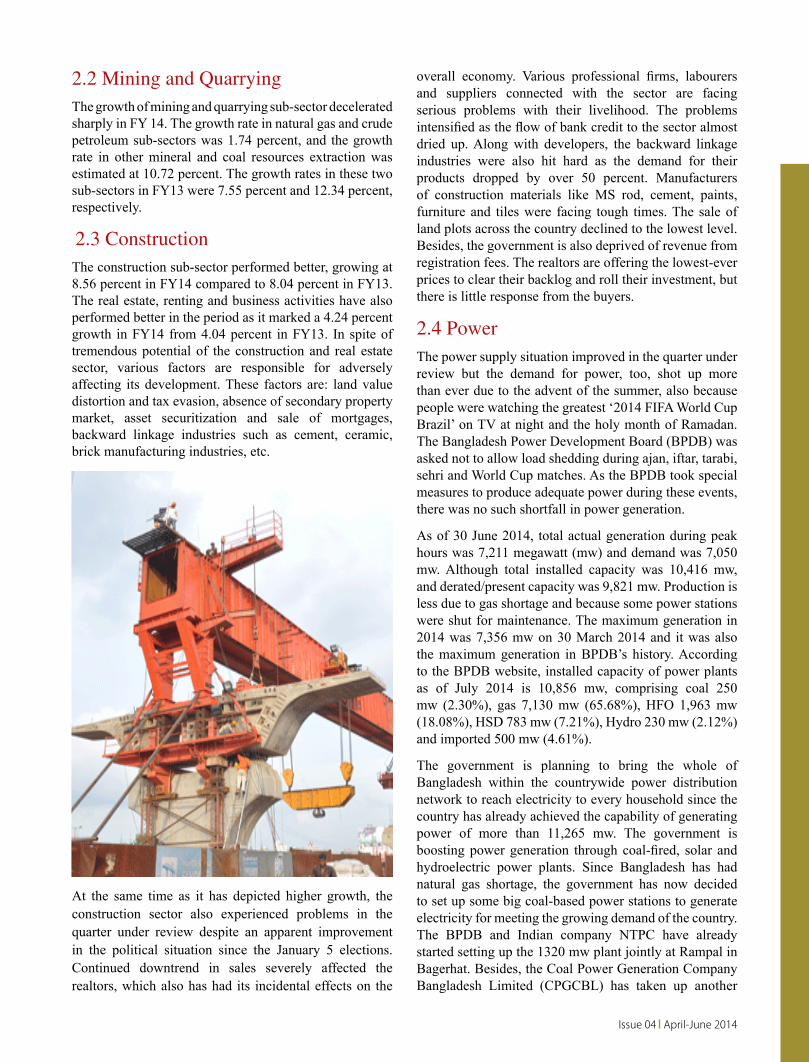
2.3 ConstructionThe construction sub-sector performed better, growing at 8.56 percent in FY14 compared to 8.04 percent in FY13. The real estate, renting and business activities have also performed better in the period as it marked a 4.24 percent growth in FY14 from 4.04 percent in FY13. In spite of tremendous potential of the construction and real estate sector, various factors are responsible for adversely affecting its development. These factors are: land value distortion and tax evasion, absence of secondary property market, asset securitization and sale of mortgages, backward linkage industries such as cement, ceramic, brick manufacturing industries, etc.
overall economy. various professional firms, labourers and suppliers connected with the sector are facing serious problems with their livelihood. The problems intensified as the flow of bank credit to the sector almost dried up. Along with developers, the backward linkage industries were also hit hard as the demand for their products dropped by over 50 percent. Manufacturers of construction materials like MS rod, cement, paints, furniture and tiles were facing tough times. The sale of land plots across the country declined to the lowest level. Besides, the government is also deprived of revenue from registration fees. The realtors are offering the lowest-ever prices to clear their backlog and roll their investment, but there is little response from the buyers.
2.4 Power The power supply situation improved in the quarter under review but the demand for power, too, shot up more than ever due to the advent of the summer, also because people were watching the greatest ‘2014 FiFA World cup Brazil’ on Tv at night and the holy month of ramadan. The Bangladesh Power Development Board (BPDB) was asked not to allow load shedding during ajan, iftar, tarabi, sehri and World cup matches. As the BPDB took special measures to produce adequate power during these events, there was no such shortfall in power generation.
As of 30 June 2014, total actual generation during peak hours was 7,211 megawatt (mw) and demand was 7,050 mw. Although total installed capacity was 10,416 mw, and derated/present capacity was 9,821 mw. Production is less due to gas shortage and because some power stations were shut for maintenance. The maximum generation in 2014 was 7,356 mw on 30 March 2014 and it was also the maximum generation in BPDB’s history. According to the BPDB website, installed capacity of power plants as of July 2014 is 10,856 mw, comprising coal 250 mw (2.30%), gas 7,130 mw (65.68%), HFO 1,963 mw (18.08%), HSD 783 mw (7.21%), Hydro 230 mw (2.12%) and imported 500 mw (4.61%).
The government is planning to bring the whole of Bangladesh within the countrywide power distribution network to reach electricity to every household since the country has already achieved the capability of generating power of more than 11,265 mw. The government is boosting power generation through coal-fired, solar and hydroelectric power plants. Since Bangladesh has had natural gas shortage, the government has now decided to set up some big coal-based power stations to generate electricity for meeting the growing demand of the country. The BPDB and Indian company NTPC have already started setting up the 1320 mw plant jointly at rampal in Bagerhat. Besides, the Coal Power Generation Company Bangladesh Limited (CPGCBL) has taken up another
At the same time as it has depicted higher growth, the construction sector also experienced problems in the quarter under review despite an apparent improvement in the political situation since the January 5 elections. Continued downtrend in sales severely affected the realtors, which also has had its incidental effects on the

8 QUARTERLY REVIEW
1200 mw coal-fired power station project at Matarbari in cox’s Bazar with the financial support of the Japanese government. in addition, a joint-venture of the state-owned North-West Power Generation company limited (NWPGCL) and a Chinese company would set up the third 1320 mw coal-fired ultra-super critical power plant at Dhankhali of Kalapara upazila in south-western Patuakhali.
Moreover, the power generation got a boost following the installation of new plants in both public and private sectors. Fifty-eight power plants were set up in the country in between 2009 and 2013 with a total capacity to generate 4,483 mw. Contracts of some of these plants would expire this year and the next but some major base-load power plants like Summit Power’s Meghnaghat 340 mw and Bibiyana-2 340 mw would go into commercial operation soon. Another 34 power plants with capacity to generate 884 mw are under construction and these plants will start (operation) in phases between 2014 and 2018. The tender process for constructing 21 power plants with a capacity of 5,264 mw was underway, a plan to set up 8 power plants with 3,407 mw capacity, and a work on the construction of a 1,000 mw nuclear power plant was also in progress. The government is also planning to build 25 more plants with a capacity to generate at least 6,100 mw. The government plans to increase power generation to around 10,000 mw by 2015 and 24,000 mw by 2021.
To improve efficiency in power sector, the Power Division recently carried out a study. According to the study, some 2,640 mw of electricity could be saved from the current use of 7,650 mw through efficient devices and equipment. The study found that
there is a potential for saving 1020 mw of electricity from residential and commercial uses. Currently, the residential and commercial lights, particularly the bulbs, consume 1700 mw of the country’s total electricity. But if the conventional and CFL bulbs in residences and offices are replaced with the lED bulbs, the power consumption will come down significantly as LED bulbs consume much less electricity than any other bulbs. Sometimes LED bulbs consume only 12 percent electricity to provide 100 percent light of an incandescent lamp or conventional bulb. The study found that about 30 mw load could be saved from tube-lights from the existing 120 mw of their consumption if their ballasts are replaced with improved ones.
The study also found that fans used in residences, offices and other places are consuming 1300 mw of electricity. But this consumption is possible to bring down to 780 mw by using efficient fans through replacement of the existing ones saving 520 mw of electricity. Existing fans normally consume 80-100 watt of electricity, but now efficient fan was invented and these fans consume 60 watt of electricity. The highest electricity is now being consumed by motors used for different purposes in industries and other places. According to the study, the motors consume 1800 mw. But if ‘variable drive’, a new device, is installed in the motor, it will improve its efficiency and reduce the electricity consumption. Through this device, 20 percent load could be reduced in each motor and in total 360 mw load could be saved. The refrigerators consume 350 mw of electricity while air conditioners consume 1600 mw of electricity. But once inverters are installed in the compressors of the refrigerators and air conditioners, this will improve significantly their efficiency and reduce their consumption. In this case, 70 mw load will be reduced in refrigerators while 640 mw load will be saved from the air conditioners. The efficient devices are now costly but reducing their prices by reducing taxes and giving incentives, the people could be encouraged to use the energy efficient devices and equipment. The study found that the commercial value of the potential saving of 2,640 mw electricity is big as it requires about US$6.0 billion investment to produce this amount of electricity.
2.5 Services SectorAccording to the provisional estimates of BBS, the services sector witnessed a better performance in FY14 compared to the previous fiscal. Although political violence gripped the country in first six months of FY14, the services sector growth increased by 0.32 percentage point to 5.83 percent in FY14 from 5.51 percent in FY13. Of the different sub-sectors, transport, storage & communications, hotel & restaurant, financial
April-June 2014Issue 04
intermediation, real estate, renting & other business activities, health and social work, education, and public administration & defence have performed better in FY14 compared to that of the previous fiscal.
BBS data shows that the transport, storage & communications sub-sector expanded to 6.47 percent in FY14, 0.20 percentage points higher than in the previous fiscal year. The hotel & restaurant also marked higher growth of 6.70 percent in FY14 compared to 6.49 percent in FY13. Financial intermediation, real estate, renting & other business activities, health & social work, education, and public administration & defence sub-sectors also performed better, growing by 9.12 percent, 4.24 percent, 5.02 percent, 8.22 percent, and 7.06 percent in FY14 compared to 9.11 percent, 4.04 percent, 4.76 percent, 6.30 percent, and 6.53 percent, respectively, in FY13.
It is noticeable that the share of the services sector in GDP, which was at its peak at 55.59 percent in FY06, has been continuously declining thereafter, dropping to 54.05 percent in FY14. However, among the different services sub-sectors, the wholesale and retail business held the highest share in GDP at 14.08 percent in FY14 compared to 14.03 percent in FY13. The GDP shares of certain other sub-sectors that recorded an increase in FY14 were: transport, storage & communications (11.54%), financial intermediation (3.39%), public administration & defence (3.39%), and education (2.28%). Sub-sectors that witnessed a decline in their share in GDP in FY14 were: community, social & personal services (9.82%), real estate, renting & other business activities (6.95%), and health & social works (1.85%).
Efforts to recoup the losses suffered during the political crises were underway in all services sub-sectors during the quarter under review but these efforts will need to be stretched much longer in the future.
3.0 MONETArY AND crEDiT DEvElOPMENTSAccording to BB data, broad money (M2) recorded a lower growth of 15.3 percent y-o-y at the end of May 2014, compared to the growth of 18.1 percent till May 2013. Domestic credit recorded a lower growth of 10.1 percent (y-o-y) at the end of May 2014, compared to 12.3 percent growth at the end of May 2013.
Among the components of domestic credit, private sector credit registered a growth of 11.39 percent during the period between May 2013 and May 2014, which was slightly lower than the 11.43 percent growth recorded for the corresponding 12-month period up to May 2013. Private sector credit growth slowed mainly because of the slowdown in import growth and the political unrest. Public sector credit, on the other hand, increased at a much lower rate of 5.5 percent at the end of May 2014, compared to the increase of 15.5 percent at the end of May 2013. Among components of public sector credit, credit to government (net) increased by 9.4 percent, while credit to the other public sector decreased by 18.3 percent, during the period (Table 1).

10 QUARTERLY REVIEW
Table 1: Monetary and Credit Indicators (Taka in crore)
Particulars
Outstanding Stock Changes in Outstanding Stock
June, 2012R
June, 2013R
May2014P FY13 July-May
FY14
May 2014 over
May 2013
July-May FY13
May 2013 over
May 2012
Total Domestic Credit 514973 571737 620581 56765
(+11.02)48844
(+8.54)57095
(+10.13)48513
(+9.42)61572
(+12.27)
Credit to Public Sector 107071 119580 125861 12509
(+11.68)6281
(+5.25)6528
(+5.47)12262
(+11.45)16013
(+15.50)
Net Credit to Government Sector 91729 110125 111954 18396
(+20.05)1830
(+1.66)9645
(+9.43)10580
(+11.53)14427
(+16.42)
credit to Other Public Sector 15342 9455 13906 (-)5887
(-38.37)4451
(47.08)(-)3117
(-18.31)1681
(+10.96)1586
(+10.28)
Credit to Private Sector 407902 452157 494721 44256
(+10.85)42563
(+9.41)50567
(+11.39)36252
(+8.89)45559
(+11.43)
reserve Money (rM) 97803 112489 123853 14687
(+15.02)11363
(+10.10)12114
(+10.84)13936
(+14.25)19352
(+20.95)
Broad Money (M2) 517110 603505 682161 86396(+16.71)
78655(+13.03)
90279(+15.25)
74773(+14.46)
90793(+18.12)
Note: P=Provisional; R=Revised; Figures in brackets indicate percentage changes
Source: Bangladesh Bank
Total liquid assets of the scheduled banks stood higher at Tk.210,596 crore as of end May 2014 compared to Tk.174,170 crore as of end June 2013. Since, however, the required liquidity (Slr) of the scheduled banks stood lower at Tk.70,354 crore, the excess liquidity of scheduled banks as of end May 2014 stood higher at Tk.140,242 crore, compared to Tk.79,439 crore as of end June 2013 (Table 2).
Table 2: Liquidity Position of Scheduled Banks (Taka in crore)
Bank Group
As of end June, 2013R As of end May, 2014P
Total liquid assets
Required liquidity
(SLR)
Excess liquidity
Total liquid assets
Required liquidity
(SLR)
Excess liquidity
1 2 3 4 (2-3) 5 6 7 (5-6)
State owned banks 53467 26434 27033 72586 20768 51818
Private banks (other than Islamic) 79516 47538 31978 90258 36650 53608
Private banks (Islamic) 21836 11297 10539 23484 6432 17052
Foreign banks 14274 6396 7878 20027 4756 15271
Specialized banks* 5077 3066 2011 4241 1748 2493
Total 174170 94731 79439 210596 70354 140242
Notes: P=Provisional; R=Revised; *= SLR does not apply to Specialized banks (except BASIC Bank) as exempted by the government Source: Bangladesh Bank
Bangladesh Bank data shows that, of the total liquid assets of scheduled banks as of end May 2014, some 4.01 percent is held in the form of Cash in vault and Balances with Sonali Bank, 21.56 percent in the form of Balances with Bangladesh Bank, and the remainder 74.43 percent in the form of Unencumbered approved securities.
April-June 2014Issue 04
3.1 Interest Rate Developments
Bangladesh Bank (BB) employs repo, reverse repo, and BB bill rates as policy instruments for influencing financial and real sector prices. Effective from 1 February 2013, the repo and reverse repo rates have remained unchanged at 7.25 percent and 5.25 percent, respectively (Table 3).
Table 3: Interest Rate (weighted average) movements in FY13 and FY14 (in percent)
Month Repo Reverse Repo Lending Rate Deposit Rate Interest Spread
FY13R
July 7.75 5.75 13.77 8.30 5.47
December 7.75 5.75 13.80 8.47 5.33
January 7.75 5.75 13.73 8.60 5.13
February 7.25 5.25 13.73 8.68 5.05
April 7.25 5.25 13.73 8.67 5.06
April 7.25 5.25 13.64 8.65 4.99
May 7.25 5.25 13.63 8.65 4.98
June 7.25 5.25 13.67 8.54 5.13
FY14P
July 7.25 5.25 13.63 8.61 5.02
August 7.25 5.25 13.56 8.55 5.01
September 7.25 5.25 13.51 8.50 5.01
October 7.25 5.25 13.42 8.47 4.95
November 7.25 5.25 13.42 8.45 4.97
December 7.25 5.25 13.45 8.39 5.06
January 7.25 5.25 13.39 8.40 4.99
February 7.25 5.25 13.40 8.34 5.06
March 7.25 5.25 13.36 8.21 5.15
April 7.25 5.25 13.25 8.11 5.14
May 7.25 5.25 13.23 8.01 5.22Notes: P=Provisional, R=Revised, NA=Not AvailableSource: Bagnladesh Bank
interest rate Spread: The weighted average spread between commercial banks’ lending and deposit interest rates hit 17-month high in May 2014 as banks massively cut interest rates on their deposit products due to increasing trend in excess liquidity in the banks. According to the latest BB data, the interest spread stood at 5.22 percent in May against 5.14 percent in April 2014 (Table 3). in December 2012, the spread was 5.33 percent after which the rate declined gradually in almost every month in 2013, however, it maintained an upward trend from the beginning of 2014 and hit 5.22 percent in May 2014. The average lending rate and deposit rate in May 2014 was 13.23 percent and 8.01 percent, respectively. These rates were, respectively, 13.25 percent and 8.11 percent in April 2014 (Table 3).
12 QUARTERLY REVIEW
3.2 Industrial Term Loan
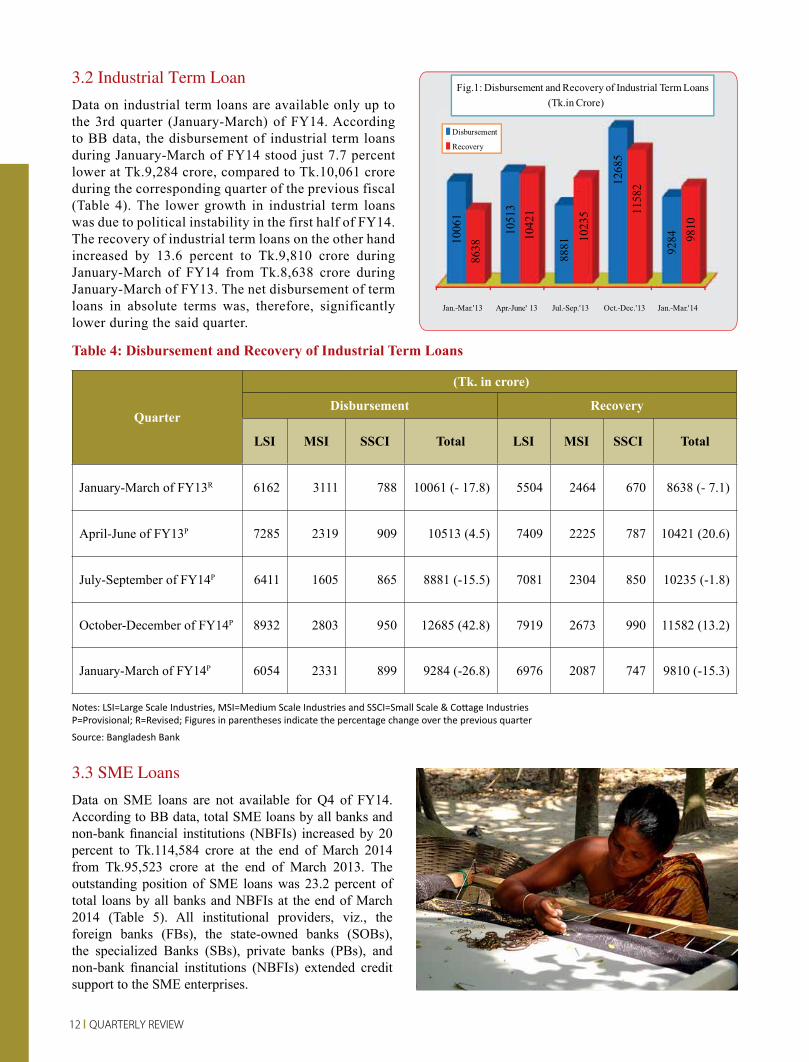
Data on industrial term loans are available only up to the 3rd quarter (January-March) of FY14. According to BB data, the disbursement of industrial term loans during January-March of FY14 stood just 7.7 percent lower at Tk.9,284 crore, compared to Tk.10,061 crore during the corresponding quarter of the previous fiscal (Table 4). The lower growth in industrial term loans was due to political instability in the first half of FY14. The recovery of industrial term loans on the other hand increased by 13.6 percent to Tk.9,810 crore during January-March of FY14 from Tk.8,638 crore during January-March of FY13. The net disbursement of term loans in absolute terms was, therefore, significantly lower during the said quarter.
Table 4: Disbursement and Recovery of Industrial Term Loans
Quarter
(Tk. in crore)
Disbursement Recovery
LSI MSI SSCI Total LSI MSI SSCI Total
January-March of FY13r 6162 3111 788 10061 (- 17.8) 5504 2464 670 8638 (- 7.1)
April-June of FY13P 7285 2319 909 10513 (4.5) 7409 2225 787 10421 (20.6)
July-September of FY14P 6411 1605 865 8881 (-15.5) 7081 2304 850 10235 (-1.8)
October-December of FY14P 8932 2803 950 12685 (42.8) 7919 2673 990 11582 (13.2)
January-March of FY14P 6054 2331 899 9284 (-26.8) 6976 2087 747 9810 (-15.3)
Notes: LSI=Large Scale Industries, MSI=Medium Scale Industries and SSCI=Small Scale & Cottage Industries P=Provisional; R=Revised; Figures in parentheses indicate the percentage change over the previous quarter
Source: Bangladesh Bank
3.3 SME Loans
Data on SME loans are not available for Q4 of FY14. According to BB data, total SME loans by all banks and non-bank financial institutions (NBFis) increased by 20 percent to Tk.114,584 crore at the end of March 2014 from Tk.95,523 crore at the end of March 2013. The outstanding position of SME loans was 23.2 percent of total loans by all banks and NBFIs at the end of March 2014 (Table 5). All institutional providers, viz., the foreign banks (FBs), the state-owned banks (SOBs), the specialized Banks (SBs), private banks (PBs), and non-bank financial institutions (NBFis) extended credit support to the SME enterprises.

April-June 2014Issue 04
3.4 Agricultural Credit and Non-farm Rural Credit
In the quarter (Q4) under review, the disbursement of agricultural credit and non-farm rural credit by banks increased by 2.8 percent or by Tk.124 crore over the corresponding period of the previous fiscal (Table 6 and Fig. 1). The disbursement in Q4 in absolute terms was much lower than in each of the previous three quarters due to a decreased credit demand from the agricultural sector amid political unrest. The recovery, however, increased by 8.1 percent to Tk.4,623 crore in Q4 of FY14 from Tk.4,278 crore in the corresponding period of the previous fiscal year. Since, in FY14, the disbursement and recovery of agricultural credit and non-farm rural credit by banks increased by 9.3 percent and 18.7 percent, respectively, over the corresponding period of the previous fiscal, the net disbursement of agricultural credit and non-farm rural credit by banks in FY14 was lower than in FY13.
Table 6: Disbursement and Recovery of Agricultural Credit and Non-farm Rural Credit
(Taka in crore)
MonthFY14P FY13R
Disbursement Recovery Disbursement Recovery July 981.95 800.23 737.32 1605.56 August 567.55 1000.82 619.21 537.01 September 1312.08 1306.45 936.00 548.22
Total of Q1 2861.58(24.8)
3107.50(15.5)
2292.53(11.7)
2690.79(-16.0)
October 1260.87 1511.39 1035.26 1265.39 November 1378.50 1476.39 1233.92 1171.41 December 1949.30 2257.39 1858.74 1963.71
Total of Q2 4588.67(11.2)
5245.17(19.2)
4127.92(12.2)
4400.51(36.4)
January 1369.71 1475.47 1303.15 861.24 February 1287.89 1301.31 1062.45 1024.25 March 1337.94 1293.18 1414.02 1107.60
Total of Q3 3995.54(5.7)
4069.96(36.0)
3779.62(9.3)
2993.09(22.2)
April 1663.74 1319.34 1540.10 1318.77 May 1011.36 1109.44 1255.06 1153.86 June 1915.92 2194.61 1672.27 1805.27Total of Q4 4591.02
(2.8)4623.39
(8.1)4467.43
(14.6)4277.90
(21.6)Total of July-June
16036.81(9.3)
17046.02(18.7)
14667.50(11.7)
14362.29(16.2)
Notes: P=Provisional, R=Revised; Figures in parentheses indicate the percentage change over the previous fiscal year
Source: Bangladesh Bank
Table 5: Outstanding Position of SME Loans (Tk. in crore)
Quarter Types of Loans SOBs PBs FBs SBs NBFIs Total
Jan.-Mar. of FY13rTotal LoansSME Loans
9020812944
(+14.4)
28719469520
(+24.2)
230302222
(+9.7)
282627558
(+26.7)
258073280
(+12.7)
45450095523
(+21.0)
April-June of FY13PTotal LoansSME Loans
9022513351
(+14.8)
29583673789
(+24.9)
233472403
(+10.3)
296127951
(+26.9)
271423370
(+12.4)
466162100864(+21.6)
July-Sept. of FY14p Total LoansSME Loans
8404514946
(+17.8)
30539179021
(+25.9)
241352349
(+9.7)
298878805
(+29.5)
297853478
(+11.7)
473243108599(+22.9)
Oct.-Dec. of FY14PTotal LoansSME Loans
8404015445
(+18.4)
31532985333
(+27.1)
238532265
(+9.5)
312149269
(+29.7)
314493572
(+11.4)
485885115884(+23.9)
Jan.-Mar. of FY14P Total LoansSME Loans
8502615402
(+18.1)
32120983873
(+26.1)
230692061
(+8.9)
314559435
(+30.0)
325483812
(+11.7)
493307114584(+23.2)
% change of SME loans at the end of March 2014 over March 2013 +19.0 +20.7 -7.3 +24.8 +16.2 +20.0
Notes: P=Provisional, R=Revised; SOBs= State Owned Banks, PBs= Private Banks, FBs= Foreign Banks, SBs= Specialized Banks, NBFIs= Non-bank Financial Institutions; Figures in parentheses indicate SME loans as percentage of total loans
Source: Bangladesh Bank

14 QUARTERLY REVIEW
4.0 cAPiTAl MArKET In FY14, stocks gained 9.16 percent amid a series of bearish trends caused by bouts of pre-election violence across the country. Nevertheless, the average daily turnover was higher at Tk.4.71 billion in FY14, compared to Tk.3.70 billion in FY13. Healthy corporate declarations by listed companies and optimistic investors pushed the market into positives, according to the capital market analysts. However, stocks ended flat with volatility on the last trading day of FY14, as late profit booking selling pressure erased some of the early gains. DSEX, the benchmark general index of the Dhaka Stock Exchange (DSE), fell 6.55 points or 0.15 percent to 4,480. The shariah index of the premier bourse, DSES, rose 2.17 points or 0.21 percent, to close at 1,019. The comprising blue chips DS30 closed at 1,645, inching up almost 6 points or 0.37 percent. Turnover declined 0.75 percent to Tk.3.87 billion, compared to the previous day. The losers took a strong lead over gainers with 161 to 98. Of the 289 issues that traded on the DSE, 30 issues remained unchanged. The Chittagong Stock Exchange (CSE) also closed negative with its selective categories index, CSCX, fell 34 points to 8,506.
Net foreign investment in the DSE shot up by 108 percent year-on-year in FY14 on the back of favourable macro-economic indicators and easing of political tension in recent months. Overseas investors bought shares worth Tk.40.14 billion and sold shares worth Tk.14.56 billion, raising their net investment to Tk.25.58 billion in FY14. The foreign investment in the DSE marked a significant jump in June (Tk.3.63 billion) compared to May 2014 (Tk.1.29 billion) as overseas investors, especially multinational companies, injected fresh funds into fundamentally strong stocks (Table 7). Also known as portfolio investment, foreign investment accounts for around 2 percent of DSE’s total market capitalization.
Table 7: Monthly Trends of Foreign Investment in DSE
Month Net Foreign Investment (in billion Tk.)
FY14P FY13R
July 1.89 0.18August 1.55 0.19September 0.85 0.84October 2.27 0.70November 2.77 0.52December 0.65 0.43January 2.78 0.99February 1.21 1.04March 0.97 0.91April 5.72 0.83May 1.29 2.32June 3.63 3.37Total of July-June 25.58 12.32
Notes: P=Provisional; r=revisedSource: DSE
5.0 PuBlic FiNANcEThe government had initially set a collection target of Tk.1,36,090 crore for FY14 for the National Board of revenue (NBr) but as the growth in revenue collection remained slow, the target was later downsized at Tk.1,25,000 crore. The NBr authorities had been arguing that a cut in tax-at-source on export earnings, sluggish business activities due to political impasse and a reduction in banks’ income resulted in lower revenue income.

April-June 2014Issue 04
The tax authorities collected Tk.103,630 crore in revenue during July-May of FY14 (Table 8 and Fig. 3). As things were progressing, it appears unlikely that the NBr was able to achieve even the lowered-down revenue collection target by the end of the fiscal year (FY14).Total tax revenue collection (NBr and non-NBr) rose at 11.4 percent in July-May of FY14, compared to the 15.2 percent increase in the corresponding period of FY13. The slide may be attributed mainly to stagnant investment, decline in the import of revenue-generating products, and fall in businesses of major corporate taxpayers.
Table 8: Government Tax Revenue Collections
Month
Tax Revenue Collections ( in crore Taka)NBR Non-
NBr GrandTotal Customs
Duties vAT IncomeTax Others* Total
FY14P
July 1199 3434 1906 1333 7872 392 8264August 952 3001 2063 1285 7301 256 7557September 1088 3464 3551 1620 9723 398 10121October 1020 3280 2948 1650 8898 287 9185November 995 3292 2617 1465 8369 315 8684December 1044 3278 2550 1353 8225 315 8540January 1084 3518 2697 1800 9099 402 9501February 1051 3465 2568 1776 8860 378 9238March 1125 3736 4151 1815 10827 389 11216April 1232 4322 4131 1849 11534 470 12004May 1474 4625 4859 1964 12922 451 13373
July – May 12264(3.1)
39415(10.6)
34041(16.6)
17910(10.3)
103630(11.4)
4053(10.3)
107683(11.4)
FY13R
July 1131 2830 1464 1022 6447 363 6810August 946 2698 1547 1234 6425 221 6646September 1101 2876 2751 1461 8189 327 8516October 1094 3125 2122 1387 7728 299 8027November 1098 3147 2108 1416 7769 307 8076December 956 3077 2993 1340 8366 334 8700January 1207 3743 2526 1687 9163 431 9594February 1051 3113 2823 1817 8804 317 9121March 1026 3463 4124 1570 10183 308 10491April 1172 3744 3489 1612 10017 403 10420May 1113 3836 3262 1685 9896 366 10262
July – May 11895(0.1)
35652(12.9)
29209(34.8)
16231(4.3)
92987(15.2)
3676(13.1)
96663(15.2)
Notes: P=Provisional; R=Revised, Figures in parentheses indicate the percentage change over the previous fiscal year; *=include supplementary duties and travel taxSources: NBR and Office of the Controller General of Accounts
5.1 Public ExpenditureThe government implemented 95 percent or Tk.567.93 billion of the revised Annual Development Programme (ADP) in FY14. The original ADP for FY14 was Tk.658.70 billion, which was later revised down to Tk.600 billion. According to the implementation, Monitoring and Evaluation Division (iMED), government’s implementing agencies preferred spending more money on projects financed by the government’s own resources rather than the donor-funded ones. in FY14, government ministries and divisions spent Tk.380 billion or 97.9 percent of the allocation from the government’s own funds (Tk.388 billion) in the ADP due to less rigorous monitoring and supervision from the government side. However, the government agencies spent Tk.186.50 billion or 88 percent of total Tk.212 billion allocations from the external resources (project aid) in the fiscal due to strict monitoring and supervision by the development partners. According to the iMED, the rate of overall ADP implementation was one percentage point lower in FY14 than the previous fiscal year’s implementation of 96 percent. The implementation rate could, however, be much higher, had ministries and divisions were able to implement more donor-funded projects under the development budget and if the country did not witness destructive political programmes like strike and blockades in the beginning of the fiscal.Among the 54 ministries and divisions, 7 ministries and divisions, including the Power Division, the rural Development & co-operative Division, the Ministry of Disaster Management & relief Affairs, the Ministry of Expatriates Welfare, the Ministry of Housing & Public Works, the Ministry of civil Aviation, and the Ministry of defence spent 100 percent of their allocations during FY14. Eleven ministries and divisions, including the roads Division, the Ministry of Agriculture, the Ministry of Home, the Ministry of Water resource, the Ministry of Science & Technology, the Ministry of Primary & Mass Education, the Ministry of Information, and the Ministry of Fisheries & Livestock spent 99 percent of their allocations, while the implementation rate of the Ministry of Education, the Ministry of railway, and the Bridges Divisions stood at 96 percent.

16 QUARTERLY REVIEW
6.0 ExPOrTSin June 2014, exports grew by 3.51 percent month-on-month to uS$2.800 billion from uS$2.705 billion but 8.79 percent below the strategic monthly target of US$3.07 billion as the country was yet to fully recover from the fallout of the political unrest. However, exports rose 8.34 percent to US$7.934 billion in the quarter under review (April-June of FY14), compared to the corresponding quarter of FY13 (Table 9 and Fig. 4). in FY14, exports rose by 11.65 percent year-on-year to over US$30 billion from over US$27 billion. This growth fell 1.06 percent short of the target (US$30.50 billion) set by the government for FY14. The export growth was mostly driven by the rMG sector, which, despite political turmoil and labour unrest, registered 13.83 percent growth to around US$24.49 billion.
Table 9: Monthly Trends in ExportsMonth Exports (million US$) Growth
RateFY14P FY13R
July 3024 2439 23.99August 2014 1952 3.18September 2590 1901 36.24 Total of Q1 7628 6292 21.23October 2119 2077 2.02November 2212 1765 25.33December 2726 2466 10.54 Total of Q2 7057 6308 11.87January 2754 2554 7.83February 2389 2247 6.32March 2414 2303 4.82 Total of Q3 7557 7104 6.38April 2412 2079 16.02May 2722 2539 7.21June 2800 2705 3.51Total of Q4 7934 7323 8.34Total of July-June 30176 27027 11.65
Notes: P=Provisional; R=Revised Sources: EPB and Bangladesh Bank
7.0 iMPOrTSimport payments in the first eleven months (July-May) of FY14 rose by 20.20 percent to US$37.428 billion from US$31.138 billion in the corresponding months of the previous fiscal. imports increased during the period mainly due to higher imports of food grains ahead of ramadan along with consumer goods, capital machinery and industrial raw materials. In May 2014, imports stood higher by US$560 million or by 18.96 percent at US$3,513 million, against US$2,953 million in May 2013 while imports were lower by 3.73 percent than in the previous month, according to the BB data (Table 10 and Fig. 5).
According to EPB data, knitwear items registered 15.02 percent growth in FY14, exceeding the strategic target by 4.09 percent. Also, export earnings from woven garments rose by 12.70 percent but below the target by 1.03 percent. Among other products, exports of agricultural products (vegetables, dry food, spices and tea), pharmaceutical, and frozen food showed, respectively, 14.81 percent, 15.75 percent, and 17.35 percent, growth while earnings from jute and jute goods, engineering products, and petroleum bi-products witnessed a negative growth of 20.0 percent, 0.23 percent, and 48.29 percent, respectively, during the fiscal, compared to the previous fiscal year.
The country’s Export Processing Zones (EPZs) recorded a significant growth in exports in FY14, despite political unrest in the first half of the fiscal. According to the BEPZA data, exports from EPZs moved up by 13.78 percent to US$5.525 billion in FY14 compared to US$4.856 billion in the previous fiscal year.

April-June 2014Issue 04
8.0 rEMiTTANcESremittance inflows in Bangladesh recorded a decline for the first time in 13 consecutive years in FY14. The decline was variously due to a shrinking outflow of migrant workers, falling receipts from Middle Eastern nations, appreciation of the taka against the dollar, and prolonged political turmoil in some of the major labour employing countries. According to BB data, remittances declined by 1.61 percent to US$14.23 billion in FY14 from US$14.46 billion in FY13 (Table 11 and Fig.6). However, there was a turnaround in remittances during the quarter under review (Q4 of FY14) when remittances increased by 11.77 percent, rising to US$3.73 billion from US$3.34 billion in the same period of the previous fiscal.
Table 11: Monthly Trends in Remittances
MonthRemittances (million US$) Growth
RateFY14P FY13R
July 1238 1201 3.08August 1006 1179 (-) 14.67September 1026 1179 (-) 12.98 Total of Q1 3270 3559 (-) 8.12October 1231 1454 (-) 15.34November 1061 1102 (-) 3.72December 1210 1287 (-) 5.98 Total of Q2 3502 3843 (-) 8.87January 1261 1327 (-) 4.97February 1173 1163 0.86March 1289 1229 4.88 Total of Q3 3723 3719 0.11April 1231 1194 3.10May 1215 1087 11.78June 1286 1058 21.55Total of Q4 3732 3339 11.77Total of July-
June 14227 14460 (-) 1.61
Notes: P=Provisional; R=Revised
Table 10: Monthly Trends in Imports
Month Imports (million US$) Growth RateFY14P FY13R
July 3453 2836 21.76August 3081 2520 22.26September 3449 2977 15.85October 3135 2627 19.34November 3268 2925 11.73December 3338 2570 29.88January 3645 3369 8.19February 3241 2608 24.27March 3656 2913 25.51April 3649 2840 28.49May 3513 2953 18.96July-May 37428 31138 20.20
Notes: P=Provisional; R=RevisedSource: Bangladesh Bank
The BB data showed that import of food grains, particularly rice and wheat jumped by 125.71 percent to US$1.31 billion in July-May of FY14 compared to uS$580.40 million during the same period of FY13. The fall in prices of food products, including rice and wheat, in the global market and appreciation of the local currency against the US dollar led to an increase in the nominal value of imports. The overall import of consumer goods registered a 43.15 percent increase to uS$4.24 billion during July-May of FY14 from US$2.96 billion in the same period of the previous fiscal because of the additional demand for consumer goods during the holy month of ramadan. The import of industrial raw materials and capital machinery also increased as the businesspeople saw signs of improved investment climate as the political situation apparently eased. The BB data also shows that the import of petroleum products registered a 3.56 percent increase to uS$4.07 billion during July-May of FY14 compared with that of US$3.93 billion during the same period of FY13. The import of machinery for miscellaneous
industries also witnessed a 19.77 percent growth to US$3.15 billion compared to US$2.63 billion in the same period of the previous fiscal year. On the other hand, the import of intermediate goods like coal, hard coke, clinker and scrap vessels declined by 0.77 percent to US$2.59 billion during July-May of FY14 from uS$2.61 billion in the corresponding period of the previous fiscal year.

18 QUARTERLY REVIEW
10.0 FOrEiGN DirEcT INvESTMENT (FDI)
FDi fell by uS$158 million in the first eleven months of FY14 compared to the corresponding period of the previous fiscal year (see Table 12 below). According to industry insiders, the investors are still to get back the confidence, fearing further political turmoil. The prospective foreign investors have adopted a ‘go-slow’ strategy in making fresh investments since 2013.
However, according to the Board of Investment (BoI) data, a total of 457 investment proposals (local, joint-venture and foreign) were registered with the BoI involving an aggregate investment of Tk.160 billion in April-June of FY14. The proposed investment was 3.23 percent higher than that in the previous quarter (Tk.155 billion). Of the 457 proposals, 431 were local involving Tk.155 billion. Besides, 10 proposals were foreign and 16 were joint-venture worth Tk.5.0 billion. Among the proposals, 24.73 percent were registered for the services sector, 24.37 percent for the textiles sector, 23.36 percent for agro-processing, 11.40 percent for the chemical industry, and 16.14 percent for other sectors.
Export Processing Zones (EPZs) of the country witnessed a remarkable growth in investment in FY14, despite political unrest in the first half of the fiscal. According to the BEPZA, investment in the country’s eight EPZs posted a 22.54 percent increase to US$402.58 million in FY14 compared to US$328.53 million in the previous fiscal. The investment was made by enterprises, both operational and under implementation, in eight EPZs. Of the investment of uS$402.58 million, the chittagong EPZ received uS$109.46 million, Dhaka EPZ uS$125.79 million, Karnaphuli EPZ uS$44.67 million, Adamjee EPZ uS$73.75 million, comilla EPZ uS$23.39 million, uttara EPZ uS$17.27 million, ishwardi EPZ uS$3.15 million and Mongla EPZ received uS$5.10 million. With this, the cumulative investment stands at US$3.188 billion.
Also, Bangladesh received foreign portfolio investment. As mentioned in Section 4.0 above, net foreign investment in Dhaka Stock Exchange’s (DSE) stocks more than doubled year-on-year in FY14.
Source: Bangladesh Bank
To expedite the flow of inward remittances through official channel, the central bank has of late met with senior officials of 34 commercial banks seeking their suggestions. Currently, 30 exchange houses operating across the globe have set up 992 drawing outlets abroad to expedite the remittance inflow. Earlier, the central bank took a series of measures to encourage the expatriate Bangladeshis to send their earnings through the formal banking channel, instead of the illegal ‘hundi’ system to help bolster the country’s foreign exchange reserve. Four state-run commercial banks and dozens of private commercial banks have stepped up efforts to increase remittance flow from the Middle East, the United Kingdom, Malaysia, Singapore, Italy and the United States.
9.0 FOrEiGN AiD Foreign aid data showed a mixed picture during the first 11 months of FY14 amid a fair rise in aid disbursement but a significant fall in aid commitment, indicating a slow development aid outlook for the country. According to the Economic relations Division (ErD), the disbursement of foreign aid has increased by 15 percent to uS$2.62 billion during July-May of FY14, compared to uS$2.28 billion in the same period of FY13. Of the disbursed US$2.62 billion, US$1.96 billion was in loans and uS$654.58 million was in grants. On the other hand, the commitment of foreign aid dipped by 37.8 percent to US$3.46 billion until May of FY14, compared to uS$5.56 billion in the same period of FY13. Of the US$3.46 billion, the development partners provided only US$81.54 million in grants. Development experts said that since a large amount of foreign assistance (US$17.5 billion) is stuck up in the aid pipeline due to the utilization failure of the project implementing agencies, the donors might take a cautious approach in making aid commitment in the future.
Meanwhile, the government repaid US$1.05 billion as principal and interest for the outstanding public sector loans to the bilateral and multilateral lenders during July-May of FY14. Debt repayment in the corresponding 11 months of the previous fiscal was uS$835 million.

April-June 2014Issue 04
11.0 BAlANcE OF PAYMENTSThe country’s trade deficit narrowed by uS$119 million to uS$6.19 billion in July-May of FY14 compared with US$6.30 billion during the same period of FY13 due to a rise in exports and a lower growth in imports. Import growth was slow due to sluggish economic activities amid political uncertainty. The investors and business community were yet to regain their confidence to expand their business, which resulted in lower import requirement by the industrial sector in recent months. The businesspersons are still following a cautious policy to import the industrial raw materials and capital machinery as they think that the political unrest may again comeback in near future. Trade deficit in the services sector, however, increased by uS$792 million to uS$3.73 billion in July-May of FY14 from uS$2.93 billion in the corresponding period of FY13. in the first 11 months of FY14, the country received uS$2.87 billion from the services sector but it paid out US$6.60 billion for different services during the same period.
The surplus in the current account balance shrank by uS$803 million to uS$1.54 billion in July-May of FY14 from US$2.35 billion in the same period of FY13 mainly due to a lower growth in remittances. The net foreign direct investment decreased by 10.1 percent to uS$1.41 billion in the first eleven months of FY14 from that of uS$1.57 billion in the same period of FY13. The financial account of the balance of payments declined by uS$807 million to uS$2.36 billion in July-May of FY14 from uS$3.17 billion during the same period of FY13. Overall balance, however, increased by uS$311 million or 6.7 percent to uS$4.97 billion in July-May of FY14 compared to uS$4.66 billion during the corresponding period of FY13 (Table 12).
Table 11: Balance of Payments (in million US$)Items July-May of FY14P July-May of FY13R ChangeTrade Balance -6185 -6304 +119 Exports f.o.b (including EPZ)* 27000 23927 imports f.o.b (including EPZ)* 33185 30231Services -3725 -2933 -792 Credit 2873 2495 Debit 6598 5428Primary Income -2151 -2155 +4 Credit 157 112 Debit 2308 2267 Of which: Official interest Payment 488 413Secondary Income 13604 13738 -134 Official Transfers 74 60 Private Transfers 13530 13678 Of which: Workers’ remittances (current a/c portion) 12839 13172 -333current Account Balance 1543 2346 -803capital Account 580 530 Capital Transfers 580 530Financial Account 2363 3170 -807 Foreign Direct Investment (net) 1413 1571 -158 Portfolio Investment (net) 757 188 Of which: Workers’ remittances (financial a/c portion) 102 115 Other investment (net) 193 1411Errors and Omissions 485 -1386 1871Overall Balance 4971 4660 311
Notes: P=Provisional; R=Revised; * = Exports and Imports both are compiled on the basis of shipment data Source: Bangladesh Bank
To attract more FDI, the existing facilities and incentives should not only continue but also increase. High bank interest rates and ineffective tax regime have been thwarting investment, including FDI, which need to be rationalized. The one-stop service meant to be provided by the Board of Investment (BoI) should be made truly effective. For that purpose the BoI needs to be strengthened, bringing all relevant agencies under its ambit. The proposed economic
zones authority and the public-private partnership cell should be brought under its umbrella rather than allowed to function as separate entities. Moreover, the government will have to solve problems of infrastructure bottlenecks, including the scarcity of lands, the lack of policy continuity, bureaucratic red tape, weak governance, political instability, poor skills of the labour force, administrative impediments and inadequate utilities, including gas, electricity and water.
20 QUARTERLY REVIEW
12.0 ExcHANGE rATE Taka appreciated marginally (by 0.17%) in terms of US dollar at the end of June 2014, showing stability in the foreign exchange market. On the inter-bank market, the uS dollar was quoted at Tk.77.6300 at the end of June 2014. The Taka-dollar exchange rate was Tk.77.7593 at the end of June 2013 (Table 13).
Table 13: Monthly Exchange Rate
Month2013-14P (Taka per US$) 2012-13R (Taka per US$)
Month Average
End Month
Month Average
End Month
July 77.7570 77.7500 81.7715 81.6049
August 77.7537 77.7500 81.5160 81.7199
September 77.7502 77.7505 81.7286 81.5900
October 77.7506 77.7500 81.3123 81.2005
November 77.7509 77.7540 81.4540 81.3811
December 77.7510 77.7500 80.5349 79.7521
January 77.7505 77.7500 79.5484 79.2000
February 77.7502 77.7311 79.0110 78.8500
March 77.7113 77.6700 78.5819 78.1500
April 77.6633 77.6500 78.0301 77.9332
May 77.6414 77.6300 77.8425 77.7504
June 77.6301 77.6300 77.7550 77.7593
Note: i) P=Provisional; R=Revised ii) Exchange rate represents the mid-value of buying and selling rates
Source: Bangladesh Bank
13.0 FOrEiGN ExcHANGE rESErvESBB’s gross foreign currency reserves rose to uS$21.56 billion (with Acu liability of uS$970 million) on 30 June 2014 breaking the earlier record set in April 2014 (Table 14 and Fig. 7). The reserves crossed the US$21 billion mark on 16 June 2014 for the first time, thanks to a robust growth of export earnings and rising trend of inward remittances. The amount is sufficient to cover more than six months’ import bills. The BB has also continued purchasing US dollars from the commercial banks directly, in order to keep the exchange rate stable, which, incidentally has also contributed to the increase in the foreign exchange reserve. The BB had purchased around US$5.15 billion in FY14 and around US$4.54 billion in FY13, which is also a reason behind the increase of foreign exchange reserve. The BB bought the uS currency in last two consecutive fiscal years but did not sell any single US dollar in the market. The central bank sold maximum US$1.28 billion in FY11 to meet the demand for the greenback in the market.
Table 14: Monthly Trends in Foreign Exchange Reserves
MonthForeign Exchange Reserve (million US$)
FY14P FY13R
July 15534 10570
August 16252 11435
September 16155 11252
October 17346 12339
November 17106 11754
December 18075 12751
January 18119 13076
February 19152 13848
March 19295 13971
April 20370 14829
May 20267 14531
June 21558 15315Notes: P=Provisional; R=RevisedSource: Bangladesh Bank

April-June 2014Issue 04
14.0 OvErSEAS EMPlOYMENT SiTuATiON
Manpower export remained subdued in the last one and half year as unstable situation was prevailing in different Middle-Eastern counties. The country’s manpower export faced difficulties following suspension of labour import by various Middle-Eastern countries, including Iraq, Libya and Kuwait. Manpower demand from the Kingdom of Saudi Arabia (KSA) has also shrunken recently, according to market operators. While both public and the private sectors are trying to expand manpower export in different countries, including Thailand and Japan, only 111,889 Bangladeshis entered the international markets with jobs during the quarter under review (April-June of 2014). Of them, 36,611 went in April, 37,430 in May and 37,848 went in June, according to Bureau of Manpower, Employment and Training (BMET). The number of emigrants was 96,068 during the previous quarter (January-March of 2014). Of them, 34,200 went in January, 28,510 in February, and 33,358 went in March.
Meanwhile, the government is reportedly making various efforts in order to reverse the declining trend of overseas jobs. Several meetings have been held with stakeholders in Bangladeshi embassies in various potential job markets in the Middle East and Libya. It is trying to send more workers following the government-to-government migration process to Malaysia. The government is also trying to explore markets in Europe, russia and Belarus as there is potential demand for foreign workers in those countries. The government, in the meantime, has increased the number of labour wings in the overseas missions from 16 to 28 in the worker receiving countries. recently the government has set up six new labour wings in Greece, Spain, russia, Switzerland, Thailand and Australia and appointed six new labour attachés, seven counsellors and 13 first secretaries, in a bid to open new job markets for Bangladeshi workers.
Besides, a growing number of female workers are now going abroad to seek jobs. In fact, 19,682 female workers entered the international markets with jobs during April-June of 2014, whereas it was 16,393 during January-March of 2014. The overseas employment of female workers increased remarkably to 56,400 in 2013 from 37,304 in 2012, according to the BMET data. Female workers, mostly housemaids and garment workers, were being employed in Jordan, lebanon, uAE, Oman and Qatar.
Lack of skills is the major challenge for generating employment in Bangladesh making them less competitive in the international labour market compared with the workforce from neighbouring countries.
Although Bangladesh has 65 million workforce, they often do not find good jobs because of their lack of skills. For the same reason Bangladesh cannot utilise the job opportunities available abroad as other developing countries like india can. According to a recently published BBS survey report (Findings of the Survey on the use of remittance (Sur) 2013), about 88 percent of Bangladeshi workers migrated abroad without taking any formal training whatsoever before leaving the country while only 12 percent of the country’s expatriates undertook some level of formal training at home. Among the trained migrants, the highest share, 6.01 percent, received vocational training followed by 1.79 percent on language, 0.38 percent on computer, 1.59 percent on driving and 2.23 percent on others.
countries like Singapore, Japan, France and canada account for a small share of total expatriate Bangladeshis. These countries are predominantly the destination of trained workers. At the same time, Middle-Eastern countries have become the main destination of untrained Bangladeshi workers. Labour migration experts have expressed concern over the preponderance of unskilled labour migration, saying that such trend would decrease remittance inflow in future and squeeze the country’s labour market abroad. They have called upon the government to take specific plans and programmes to ensure a systematic labour migration process and ensure human resources development for overseas employment.
22 QUARTERLY REVIEW
15.0 PricE SiTuATiONin June 2014, overall point to point inflation in the country fell by 1.08 percentage point to 6.97 percent from 8.05 percent in June 2013 (Table 15). The fall in the inflation rate can be attributed to a massive decline in the non-food inflation, which fell by 2.30 percentage points to 5.45 percent in June 2014 from 7.75 percent in June 2013. The food inflation also declined, by 0.26 percentage point to 8.00 percent in June 2014 from 8.26 percent in June 2013.
The government had set a target to contain point to point inflation within 7.0 percent in FY14. in line with the official target, the monthly inflation on point to point basis showed a declining trend as it stood at 6.97 percent in June 2014 compared to 7.48 percent in the previous month (May) due to the lower price trend of food items. The food inflation in June experienced a fall as it went down to 8.0 percent from 9.09 percent in May 2014. But the non-food inflation showed an upward trend at 5.45 percent in June from 5.16 percent in May 2014 because people increased their spending on clothing and other consumer items ahead of Eid-ul-Fitr, which was the main reason behind the increase of non-food inflation. Also house rent, furniture and house expenditures, medical and transport costs, and cost of educational equipment, and different products and services had of late increased. As, with increase in income, the people are now buying relatively more non-food items than food items, the inflation in non-food items may go up further, according to the research cell of this chamber.
A comparison of inflation data for urban and rural areas during FY14 (monthly point to point) shows that the inflation rate was higher in urban areas than in rural areas. Thus, the point to point general, food and non-food inflation in rural areas in June 2014 were 6.73 percent, 7.64 percent and 5.12 percent, respectively, while these inflation rates in urban areas were 7.42 percent, 8.87 percent and 5.91 percent, respectively. BBS data, however, shows that the inflation rate eased in both urban and rural areas in FY14 compared to the previous fiscal. in June 2014, the point to point general inflation in both rural and urban areas declined to 6.73 percent and 7.42 percent, respectively, from 7.27 percent and 7.92 percent in May 2014.
Table 15: Monthly Trends in Inflation (Base: 2005-06=100) (Percent)
PeriodPoint to Point-All Point to Point-Rural Point to Point-Urban
General Food Non-food General Food Non-food General Food Non-food
FY13r
June 8.05 8.26 7.75 7.53 7.58 7.43 9.08 9.94 8.21
FY14P
July 7.85 8.14 7.40 7.43 7.52 7.27 8.64 9.65 7.59
August 7.39 8.09 6.35 6.90 7.50 5.83 8.34 9.52 7.08
September 7.13 7.93 5.94 6.77 7.43 5.59 7.82 9.11 6.44
October 7.03 8.38 5.02 6.78 7.86 4.84 7.52 9.64 5.28
November 7.15 8.55 5.08 6.92 8.06 4.88 7.58 9.67 5.35
December 7.35 9.00 4.88 7.22 8.63 4.69 7.58 9.89 5.13
January 7.50 8.81 5.53 7.24 8.39 5.17 7.97 9.80 6.04
February 7.44 8.84 5.37 7.17 8.42 4.92 7.97 9.84 5.99March 7.48 8.96 5.26 7.21 8.53 4.83 7.98 9.98 5.88April 7.46 8.95 5.23 7.19 8.52 4.81 7.96 9.99 5.83May 7.48 9.09 5.16 7.27 8.72 4.71 7.92 9.98 5.79June 6.97 8.00 5.45 6.73 7.64 5.12 7.42 8.87 5.91
Notes: i) P=Provisional; ii) Food includes food, beverages and tobacco Source: Bangladesh Bureau of Statistics

April-June 2014Issue 04
16.0 cHAMBEr’S PrOJEcTiON ON SOME SElEcTED EcONOMic iNDicATOrS
On the basis of observations in the previous nine months, projections on some selected economic indicators are made here for the first quarter of the present fiscal year (Q1 of FY15) (Table 16).
Table 16: Projection on Some Selected Indicators in Q1 of FY15
IndicatorsFY14 FY15
Oct. Nov. Dec. Jan. Feb. Mar. April May June July August Sept.
Export(million US$) 2119 2212 2726 2754 2389 2414 2412 2722 2800 2850 2890 2920
Import (million US$) 3135 3268 3338 3645 3241 3656 3649 3513 3600 3620 3630 3640
remittance(million US$) 1231 1061 1210 1261 1173 1289 1231 1215 1286 1480 1485 1490
Forex reserve(million US$) 17346 17106 18075 18119 19152 19295 20370 20267 21558 20388 21700 20530
inflation, Point to Point (percent)
7.03 7.15 7.35 7.50 7.44 7.48 7.46 7.48 6.97 7.40 7.20 7.10
Note: October – June of FY14: actual figures except June value of Import; July - September of FY15: projections (figures in bold)Sources: Bangladesh Bank, Bangladesh Bureau of Statistics and Author’s calculation
it is assumed that the relatively calm political situation of the present will continue in the first quarter of the present fiscal year. Therefore, export, import, and remittances will increase further. The foreign exchange reserve can be expected to fall in July and September due to the payment to the Asian clearing union (Acu) against imports. The rate of inflation can be expected to go up in July because of increased demand during the ramadan and the Eid-ul-Fitr but fall slightly thereafter.

24 QUARTERLY REVIEW
17.0 cONcluDiNG OBSErvATiONS
The overall economic condition was positive as indicated by steady improvements in the major economic indicators in the just completed fiscal year (FY14). The
economy experienced stable growth, inflation was under control, the exchange rate remained stable, and foreign exchange reserves rose and remained at comfortable level. The international rating agencies have given stable ratings to Bangladesh as they have done for a number of years now. The agriculture sector performed well in the quarter under review, but continuous government support with inputs and finance will be needed to sustain the sector’s growth. The performance of manufacturing sector needs to be improved by removing bottlenecks in physical infrastructure and the crisis in power and energy supplies. Services sectors are doing well but will need government support to be able to recover the losses they suffered during the political crisis last year. However, in order to achieve the government’s growth and inflation targets, the political stability should be maintained. violence caused by the political unrest hurts economic activity thus hindering growth, and disrupts the supply chain of goods which
pushes up inflation. Adequate infrastructure, energy, skilled manpower, political stability and investment-friendly climate are the key factors for higher economic growth.
Growth prospects of the economy are being badly hurt by political uncertainty. Entrepreneurs, whether local or foreign, are not encouraged to make any new investment in the present political environment. Foreign investors have adopted a ‘go-slow’ strategy in making fresh investments since 2013. While public investment has increased, it cannot be an alternative to private investment, which is crucial to accelerating economic growth. The damages inflicted by political unrest last year to the national economy also dented the confidence level of the intending investors causing a slower growth in investment in the private sector. Maintaining macroeconomic stability, restoring momentum in economic activities, enhancing revenue collection, achieving the export target, containing inflation, and above all, improving law and order conditions in the country will be the major challenges for the government, which has set itself the target of achieving 7.3 percent GDP growth in the current fiscal.