Final Report (MET... · Web vie
110
Final Report Socio-Economic Household Survey: Integrated Community- Based Eco-System Management Prepared by Social Impact Assessment and Policy Analysis Corporation (Pty) Ltd. (SIAPAC) for the Ministry of Environment and Tourism October, 2006
-
Upload
nguyencong -
Category
Documents
-
view
215 -
download
0
Transcript of Final Report (MET... · Web vie

Final Report
Socio-Economic Household Survey: Integrated Community-
Based Eco-System Management
Prepared by Social Impact Assessment and Policy Analysis Corporation
(Pty) Ltd. (SIAPAC)
for the
Ministry of Environment and Tourism
October, 2006
Table of Contents
TABLE OF CONTENTS......................................................................................IILIST OF TABLES, FIGURES AND MAPS..........................................................III1 INTRODUCTION..........................................................................................4
1.1 INTRODUCTION...................................................................................................41.2 AIM AND OBJECTIVES..........................................................................................81.3 STRUCTURE OF THE REPORT................................................................................8
2 METHODOLOGY AND APPROACH..............................................................92.1 OVERVIEW..........................................................................................................92.2 APPROACH..........................................................................................................92.3 METHODOLOGY: START-UP AND TRAINING...........................................................9
2.3.1 Inception...................................................................................................92.3.2 Start-Up and Design................................................................................102.3.3 Sampling.................................................................................................112.3.4 Training...................................................................................................122.3.5 Pre-Testing..............................................................................................152.3.6 Final Arrangements Prior to Fieldwork..................................................16
2.4 METHODOLOGY: IMPLEMENTATION....................................................................162.4.1 Field Team Management.........................................................................162.4.2 Field Team Procedures...........................................................................172.4.3 Detailed Field Report – Kunene Region..................................................182.4.4 Detailed Field Report – Caprivi Region...................................................22
2.5 METHODOLOGY: DATA ENTRY/VALIDATION, ANALYSIS AND WRITE-UP.................272.5.1 Data Entry/Validation..............................................................................272.5.2 Data Analysis/Report Write-Up...............................................................28
3 KEY FINDINGS..........................................................................................293.1 INTRODUCTION.................................................................................................293.2 HOUSEHOLD ASSETS.........................................................................................293.3 LIVESTOCK, SMALL RUMINANTS AND POULTRY OWNERSHIP AND PRODUCTION......313.4 CROP PRODUCTION...........................................................................................323.5 RESTRICTIONS ON RESOURCE USE.....................................................................323.6 PARTICIPATION IN CONSERVANCY.......................................................................34
ANNEX A: TERMS OF REFERENCE................................................................37TERMS OF REFERENCE................................................................................................37CONSULTANT’S UNDERSTANDING OF THE TOR.............................................................41
Annex B: Field Instruments........................................................................................45
- ii -

List of Tables, Figures and MapsTables
Table 2-1: Replaced PSUs in the Epupa Control Area................................................19Table 2-2: Questionnaires Completed in Epupa Control Area....................................19Table 2-3: Questionnaires Completed in Ehirovapuka Conservancy..........................20Table 2-4: Questionnaire Completed in Purros Conservancy.....................................20Table 2-5: Questionnaires Completed in #Khoadi //Hoas Conservancy......................21Table 2-6: Questionnaires Completed in Torra Conservancy.....................................22Table 2-7: Questionnaires Completed in Mayuni Conservancy...................................23Table 2-8: Questionnaires Completed in Kwandu Conservancy..................................23Table 2-9: Questionnaires Completed in Salambala Conservancy..............................24Table 2-10: Questionnaires Completed in Kasika Conservancy.................................26Table 2-11: Questionnaire Completed in Kabulabula Control Area............................27Table 3-1: Household Assets (ownership)...................................................................29Table 3-2: Livestock, Small Ruminant and Poultry Resources...................................31Table 3-3: Crops Produced.........................................................................................32Table 3-4: Plans and Activities....................................................................................36
Figures
Figure 3-1: Restrictions on Resource Use..................................................................33Figure 3-2: Knowledge of Local Conservancy............................................................34Figure 3-3: Household Member Involvement in Conservancy....................................35
Maps
Map 1: Map of Namibia Highlighting Kunene Region and Caprivi Region.................5Map 2: Map Showing Conservancies in Kunene Region.............................................6Map 3: Map Showing Conservancies in Caprivi Region..............................................7
- iii -

1 Introduction
1.1 Introduction
In 2006 a socio-economic household survey was conducted for the Integrated Community-Based Eco-System Management (ICEMA) Project. The ICEMA Project is funded by the Global Environment Facility, through the World Bank, as well as the French Global Environmental Fund, and is implemented by the Ministry of Environment and Tourism (MET). The Project aim is to support “community-based integrated ecosystem management practices through the National [Community-Based Natural Resource Management] CBNRM framework … to … restore, secure and enhance key ecosystem processes in targeted conservancies, with biodiversity and land conservation and sustainable use as a goal” (Terms of Reference).
As part of the monitoring and evaluation requirements of the ICEMA Project, one key measure is to establish the varied impacts conservancies have had on rural livelihoods and local economic activity. Terms of Reference (TOR) for a survey were therefore issued in May, 2006, and awarded in June to Social Impact Assessment and Policy Analysis Corporation (SIAPAC), a Namibian socio-economic research firm. SIAPAC reported to a Reference Group, while an advisor from the Environment Department at the World Bank (Dr. Sushenjit Bandjopadhyay) designed the two questionnaires, subsequently revised and finalised by MET, the World Bank, and SIAPAC. There were some changes to the Terms of Reference, reflected in the Final Inception Report. The TOR, and the comments on the TOR, are noted in Annex A.
The survey was conducted in Kunene Region in the far north west, and Caprivi Region in the far north east. These regions are indicated in the following map:
- 4 -

Map 1: Map of Namibia Highlighting Kunene Region and Caprivi Region
- 5 -

Sampled conservancies are indicated in the following map:
Map 2: Map Showing Conservancies in Kunene Region
- 6 -
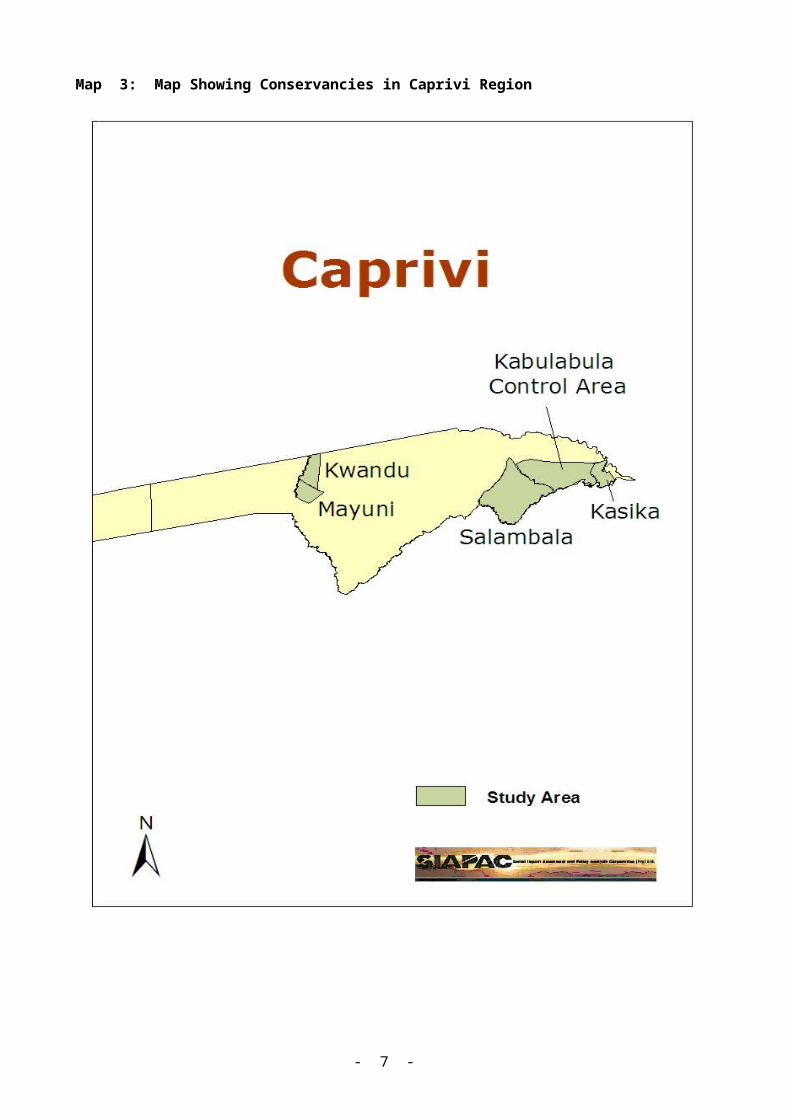
Map 3: Map Showing Conservancies in Caprivi Region
- 7 -

1.2 Aim and Objectives
The aim of the study is to provide an assessment of the impact of community conservancies on the poverty and welfare of rural households’. The objectives of the study were as follows:
“extend and improve the database on household economies generated by the previous survey, by providing more detailed economic information on households in conservancy areas and by including households from non-conservancy areas for comparison;
facilitate a deeper understanding of the factors that determine how individuals and households spend their time and money through the analysis of income, expenditure, consumption and time use data, collected from a wide range of different households;
provide a basis for quantitative comparisons between the livelihood strategies of households in the areas where conservancies have been established, and the strategies of households outside those areas;
examine whether households’ livelihood strategies are changing over time, as conservancies become more established;
illuminate policy issues concerning the rural household economy (labour market policies, wages and income policies, equity) and how these issues are affected by access or lack of access to important natural resources”.
1.3 Structure of the Report
The report serves as a record of the conduct of the study, and also includes analysis across key variables, presented by conservancy; the bulk of the analysis will be conducted by the World Bank. Therefore, the structure of the report is as follows:
Chapter 1 Introduction and OverviewChapter 2 Methodology and ApproachChapter 3 Key Findings
Field instruments are included in Annex B.
- 8 -
2 Methodology and Approach
2.1 Overview
In this section, the approach for the field investigation is described, and methods used to obtain relevant information presented.
2.2 Approach
Primary data collection involved the use of two approaches:
Administration of a highly-structured quantitative questionnaire to 960 heads of households; Administration of a total of 66 community level quantitative interviews to village leaders and Conservancy Management Committee members.
2.3 Methodology: Start-Up and Training
2.3.1 Inception
An Inception Report was submitted as the first deliverable for the consultancy. The purpose of the Inception Report was to detail the agreed upon approach for project implementation. The Inception Report was finalised after the following meetings:
The Inception Meeting between the Project Management Committee and SIAPAC was held on 13 June 2006 in the MET Conference Room. The meeting covered the following main agenda items: 1) background to the project; 2) implementation plan; 3) development of data collection instruments; and 4) involvement of the World Bank Data Analyst.
A Questionnaire Development Meeting was held on 27 June 2006 in the MET Meeting Room. The meeting was attended by 3 representatives of SIAPAC, 3 representatives of MET and 1 representative of the World Bank. The main purpose of this meeting was to discuss the implementation of the household questionnaire and community-based questionnaire based on results from the pre-test.
Continuous discussion took place with regards to project training and implementation between SIAPAC and MET.
The above meetings contributed towards the development of the Draft Inception Report and the Final Inception Report, the latter submitted to MET in final form in July, 2006.
2.3.2 Start-Up and Design
An Inception Meeting was held on 13 June 2006 in the MET Conference Room. At this meeting, the following were considered:
- 9 -
Background to the Project – Dr. Barnes from MET gave background information on the reasons for the field investigation. He noted that the WILD Project had planned a socio-economic impact assessment of conservancies from the year 2000. With assistance from a consultant from Sweden, a questionnaire was prepared. However, because of varied interests and high expectations from a variety of sources, the socio-economic impact assessment issues of interest to the economists in MET were severe diluted. In the end, there were many aspects of the survey, implemented in 2002, that were not measured in sufficient detail, and in a sufficiently useful fashion, to meet the information needs of the economists in MET. Nevertheless, the 2002 and the 2006 surveys did cover the same areas, although the 2002 survey did not include a control group. The ICEMA Project offered an opportunity to collect the information required, as part of its monitoring and applied research component. This survey represents one of the key data collection activities under IDEMA. The information to be collected by the survey is specified by MET, and is meant to meet the specific needs of MET.
Implementation Plan – Mr. Mouton from SIAPAC outlined activities by dates. He highlighted the particular importance of securing census data for the survey locations in a timely manner, given problems that had arisen in the past in this regard. He noted that the schedule as shown in the Proposal was still in place, and described activities underway to meet these deadlines.
Involvement of the World Bank Data Analyst – MET noted that a primary reason for the survey was that the data will ultimately be analysed econometrically. The Client will be assisted in this by the World Bank’s Environment Department. Thus, a Data Analyst from the World Bank would arrive on 17 June in Namibia to assist with the survey.
Data Collection Instrument Development – A draft Quantitative Questionnaire was provided to the Consultants on 12 June, and discussed at the Inception Meeting in broad terms. It was noted that the Consultant should take the draft Quantitative Questionnaire and prepare a pre-training version of the questionnaire by 19 June. Discussions were also held about the Focus Group Discussion (FGD) Instrument. It was noted that the main purpose of the FGD Instrument was to provide information that would contextualise information provided through the Quantitative Questionnaire. A related purpose was to collect ‘conservancy level’ data that would yield important data on prices and standardise units of measurement.
While the Consultants developed a draft household questionnaire and a draft focus group discussion instrument, with the arrival of the World Bank Data Analyst, both of these were altered significantly. In the end, the focus group discussion instrument was replaced by a community level leader questionnaire (included in Annex A).
A Questionnaire Development Meeting was held on 27 June 2006 in the MET Meeting Room. In this meeting, the following were discussed:
The main purpose of this meeting was to discuss the results of the pre-test that took place on 26 June 2006 at the Tsiseb Conservancy in the Erongo North and Kunene South regional areas. This pre-test covered the household questionnaire developed by the World Bank Data Analyst. The findings of the pre-test were: 1) the administrative length on the household questionnaire was at least 1.5 hours, and in some cases over two hours; 2) some indicators such as quantifying use of resources were problematic; 3) cancelling the planned
- 10 -

key informant interview instrument and the inclusion of the community-level quantitative questionnaire.
The meeting agreed that the household questionnaire was too long in administrative length and that it needed to be reduced by 30% to be implementable. The meeting studied the questionnaire and reduced it by approximately 30%.
The meeting agreed that more time needed to be allocated to training to ensure that all trainees understood, in the same manner, indicators dealing with the quantification of resources used. The meeting agreed that the community-level quantitative questionnaire would be administered to 68 Village Headmen and 8 Conservancy Management Committee representatives.
2.3.3 Sampling
An equal probability sample was drawn within each strata in the selected conservancy areas, while all PSUs within the control areas were automatically included. Across strata, over- and under-sampling took place, allowing for strata-level analysis, with data weighting to accommodate over- and under-sampling to be carried out by the World Bank Data Analyst.
It was originally planned to have a quantitative sample size of 1,100. This sample size was reduced to 960 quantitative interviews in order to provide for the following:
an additional 68 community-level quantitative interviews; a longer household quantitative questionnaire in administrative time; and the complexity of the household quantitative questionnaire.
The above sample size was discussed and agreed upon by the World Bank Data Analyst and MET.The issue of securing 2001 census data and census maps was highlighted at the Inception Meeting. With these maps and the corresponding data, organised by PSUs, a proper sample was be pulled. Data obtained from the Central Bureau of Statistics were:
total number of households for each Primary Sampling Unit (PSU) in the sample locations;
conservancy maps with PSUs across each conservancy; andmaps showing the ‘match’ between the sample locations and the PSU.
From available 2001 census data, a Probability Proportionate to Size (PPS) sample was drawn within the conservancy area, while all PSUs in the control areas were automatically included. Effectively, this meant that each unit of analysis (in this case, a household) had an equal opportunity to appear in the sample (within each of the PSU listings). This meant that some larger PSUs had multiple clusters selected for the sample, and that thirty clusters per zone were randomly identified using the PPS
- 11 -

procedure across 73 PSUs (26 PSUs in the Kunene Area and 47 PSUs in the Caprivi Area).
Within each cluster, households for interviews were randomly selected. Because of the lack of village locations and names within PSUs, each PSUs boundary was first established on the ground. The data collection team, with conservancy management members and village leaders, therefore established PSU boundaries. The centre of each selected PSU was identified from where ‘spinning the bottle’ random selection procedure was use to identify a random starting direction. Each enumerator selected a random number between 1 and 10 to determine the interval for the first house to be selected for interview. If a household was abandoned, or otherwise unavailable for interview (in the case of temporary absences, up to three repeat visits were made to try and secure an interview), these households were substituted with the household to the right of the closest entry/exit point to the household where the interview was conducted.
A few sampling challenges were created by the lack of key data and circumstances on the ground.
It proved impossible to collect data on all locations within each PSU, because this information was unavailable within the CBS census database. This was especially the case in conservancy areas in the eastern parts of the Caprivi Region (the floodplain area). In some PSUs, only one or two major villages were indicated.
Floods in the eastern Caprivi floodplain area made it extremely difficult to reach PSUs in Kasika and Kabulabula Conservancies.
2.3.4 Training
Training was originally planned to involve training the field officers to administer the household questionnaire and KIIs. Because of changes in the types of data collection tools, this section is divided into two: 1) training household questionnaire and 2) training community level questionnaire. Training took place from 22 to 29 June 2006, including Saturday and Sunday.
2.3.4.1Training for the Household QuestionnaireA total of 2 Field Survey Co-ordinators, 4 Field Supervisors and 16 Enumerators were employed for fieldwork (four teams of five members comprising 1 Field Supervisor and 4 Enumerators, overseen by a Field Survey Co-ordinator who oversaw two teams). Language skill requirements were as follows:
- 12 -

Two teams of Otjiherero- and Damara-speakers (both also speaking Afrikaans) for Kunene and Erongo regions.
Two teams of siLozi-speakers for Caprivi Region.
To ensure that a sufficient number of experienced and trained field officers were available for fieldwork, the Consultants identified field officers from its extensive database of officers it had employed on previous surveys. For the 16 enumerators needed for fieldwork, a total of 18 were identified to attend training, from which the best 16 were selected.
Training took place at the NamPower Convention Centre in Windhoek, while pre-testing took place in Tsiseb Conservancy that runs across northern Erongo and southern Kunene regions. Training lasted nine days, including the pre-tests. This meant that the Damara and Otjiherero pre-tests were conducted, but that siLozi pre-testing could only be done among trainees (with non pre-test in Caprivi Region). Training lasted one day longer than originally planned because of the complexity of the field instruments.
Training was conducted by the World Bank Data Analyst, SIAPAC’s Team Leader and SIAPAC’s Field Survey Co-ordinators. Mr. Mouton, SIAPAC’s Team Leader, attended training virtually full time due to questionnaire complexity. The two other SIAPAC trainers thereafter served as Field Survey Co-ordinators for the northeast and northwest. The World Bank Data Analyst, Dr. Sushenjit Bandyopadhyay, attended training full time. Training included the following:
An overview of the investigation – Mr. Mouton gave an overview of the investigation, while Dr. Jon Barnes provided background information to CBNRM, the ICEMA programme and goals and objectives of the household survey.
A discussion of the basic principles of quantitative and qualitative research – detailed discussion were held regarding the basic principles of research, conducted by Mr. Mouton.
Training on field sampling procedures – this was a straightforward task as all trainees had implemented this type of sampling strategy before.
A detailed review of the Household Questionnaire. Survey Co-ordinators and trainees participated actively in training. Each question was discussed in detail until all trainees understood the purpose behind the questions, potential responses and the manner in which questions should be asked. An extended set of discussions took place for questions that were difficult in structure and nature, such as the following:
o Need for name of household head and GPS coordinates of household locations and issues regarding confidentiality.
o Structure of the questionnaire prohibited control by supervisors in terms of marking codes.
- 13 -
o Questionnaire was considered too long for implementation.o Structure of the questionnaire was problematic for implementation.o Measurement of distances to facilities.o Reliability of expenditure responses.o Measuring quantity of products.o Measuring crop production and income from it.o Measuring use of natural resource as income.
Collective solutions were found to concerns raised with regard to the above. The World Bank Data Analyst was satisfied with the way forward in terms of measuring the above-mentioned indicators. The Consultants still had some important concerns, in particular regarding the accuracy of overall measures of income and expenditure. Despite this, every effort was be made to ensure that the results of the survey were acceptable.
Several revisions to the questionnaires were made based on comments during training. The results of training and pre-testing lead to a restructured questionnaire, which was 30% shorter. It was found that some questions might be difficult to answer in the field, especially direct income and expenditure questions, and that the questionnaire was too long for practical implementation.
Training included hand written translation of the questions into Otjiherero, and Afrikaans and siLozi, which would serve for the pre-test activities. Translations were carried out by the ‘language teams’ comprising trainees with the requisite language skills. Translation was a group work activity, allowing debate and thereafter agreement on how to phrase questions.
Training was planned for 8 days in Windhoek, including the first pre-test, but as noted questionnaire length and complexity resulted in 9 days of training.
2.3.4.2Training: Community Level QuestionnaireThe Consultant was informed that the key informant interview approach was to be replaced by a community-level quantitative questionnaire before pre-testing took place. The World Bank Data Analyst was primarily responsible for training supervisors on this community level questionnaire. SIAPAC Survey Coordinators and the Team Leader were provided the opportunity to comment on the questionnaire. The main concern about the community level questionnaire was its length (at over two hours in administrative length), while a second concern was its complexity.
- 14 -
2.3.5 Pre-Testing
2.3.5.1Pre-Testing the Household QuestionnaireAs noted above, practical limitations dictated that pre-testing were conducted in Otjiherero and Damara, and conducted within a few hours drive from Windhoek; the Tsiseb Conservancy was identified for pre-testing by MET. Field pre-testing in siLozi was not practical, given distances. Therefore, ‘internal’ pre-testing took place for siLozi speakers, pre-testing among trainees and supervisors. The World Bank Data Analyst accompanied the Survey Coordinators during the pre-tests, which took place on 26 June, 2006. The pre-test in Tsiseb allowed the research team to identify problems arising in administration. Co-operation was high, and many questions worked well. However, it was found that the administrative length of the questionnaire was at least 1.5 hours. The shortest duration was 50 minutes while the longest was 2 hours and 40 minutes. It was also found that the structure of the questionnaire made implementation somewhat difficult.
The pre-test was discussed in detail the following day and revisions were made in length and structure. The questionnaire was reduced in administrative length by approximately 30%. The Consultants felt that the revisions of the questionnaire resulted in a document that was far more implementable. Concerns about measurements in terms of resource use, expenditure and income were discussed in great detail based on experiences learned during the pre-test. One example was, how would one determine the size of a bundle of wood in northern Kunene, which is very different from a bundle of wood in southern Kunene and Caprivi. This was discussed in detail, leading to a common understanding of measurements. Trainees developed a common understanding of measurement techniques. However, while it must be noted that there were still some concerns about the reliability of some data collection procedures on the part of the Consultant, the World Bank Data Analyst indicated that he was satisfied with results.
2.3.5.2Pre-Testing the Community Level QuestionnaireSupervisors and one Survey Co-ordinator pre-tested the community level questionnaire. During the pre-test, it was found that the questionnaire took too long to administer, although respondents were actively participating. Difficult questions were discussed after the pre-test, and as per standard practice changes were made to make the questionnaire more implementable.
- 15 -

2.3.6 Final Arrangements Prior to Fieldwork
Following MET’s acceptance of the final version of the household questionnaire and the community-level questionnaire, it was copied by MET and distributed to the two teams. It should be noted that only half of the questionnaires were ready with fieldwork start-up and that the remainder was couriered to the field teams.
It was noted as especially important that the Client inform the participating conservancies of the survey in advance, so that no problems were experienced in the field in this regard. The following took place:
A fax/letter/telephone call/radio call to each conservancy committee a week before the teams were due to leave for their first location, giving expected dates.A letter, to be carried by the enumerators, in Otjiherero, Afrikaans and siLozi, introducing the survey and asking for the co-operation of the respondents. Radio messages in Otjiherero, siLozi, Damara and Afrikaans announcing the survey, approximately one week before the survey.Advertisements in The Namibian, The New Era, and Die Republikein announcing the survey.
Draft versions of written materials were prepared by the Consultant, and finalised by the Client.
2.4 Methodology: Implementation2.4.1 Field Team ManagementThere were a total of four teams, two per zone. Each team comprised four Enumerators, managed by a Field Supervisor, and overseen by an experienced Field Survey Co-ordinator. The Field Survey Co-ordinators were responsible for all logistical and liaison activities, problem resolution and problem prevention, and team management, moving across two teams. All questionnaires were checked by the Field Supervisors while in the field and spot-checked by the Field Survey Co-ordinators, usually on a day when the teams were in or near a location where any problems could be resolved. Community-level questionnaires were implemented by the Field Supervisors.
The Team Leader and the World Bank Data Analyst visited the Kunene teams on their first day of data collection on 3 July, 2006. Household questionnaires and community-level questionnaires were checked by these two officers, specifically looking for inconsistencies, contradictions and other complications. It was found that the teams, as expected on the first day, made a few mistakes. These mistakes were discussed in detail and arrangements made to overcome these problems.
- 16 -

The Team Leader also spent three days, from 11 to 13 July 2006, with the Caprivi teams working in the Salambala Conservancy at the time. The Team Leader checked questionnaires and met with the Survey Co-ordinator and Supervisors to discuss mistakes that were made. As with the Kunene teams, some mistakes were expected during the first few days of implementation, with problems dealt with through daily team meetings before and after fieldwork.
For 960 household interviews and 66 community level questionnaires, 21 days of fieldwork were utilised, compared to the 16 days originally planned, or an over-run of over 30%. This resulted from the following:
difficult access in flooded areas in the Caprivi Region; length of questionnaire; one of the Chiefs in the Kunene Region refused to cooperate with the team,
necessitating the replacement of the conservancy area; village being far apart even within PSUs, and some villages being extremely
small in population size; breakdown of one car that needed to be returned to Windhoek; two Enumerators in the Kunene Region discontinued their involvement in the
project; and NamPost Courier taking 4 days to deliver questionnaires in Kamanjab.
2.4.2 Field Team ProceduresEach day, prior to beginning field interviews, the teams held a meeting to go over issues arising from previous days, and to discuss goals and procedures for the day. Field procedures entailed the listing of eligible households, random selection of households to be interviewed, and the conduct of interviews. Field Supervisors checked on the enumerators at a subset of interview sites, and received questionnaires throughout the day, checking each and every questionnaire carefully. Any issues that arose were discussed with the enumerator. Problems were identified while the teams were in the same PSUs, allowing Enumerators to return to households in cases where gaps needed filled or where inconsistencies or contradictions needed to be clarified.
2.4.3 Detailed Field Report – Kunene Region
Fieldwork started on 2 July, 2006, with the two Kunene/Erongo region teams travelling to Kunene Region and setting up camp. The two teams started together in the #Khaodi /Hoas conservancy at Anker to allow the Team Leader and the World Bank Data Analyst to meet the team and check the first questionnaires. After this meeting the teams separated into two teams: one team of Damara/Nama speakers and one team of Otjiherero-speakers. Both teams were provided with 4-wheel drive
- 17 -

vehicles and camping equipment. One team remained in the #Khaodi /Hoas conservancy, while the other team moved to the Purros Conservancy. After the two teams completed all interviews in the above conservancies, one team then went to Torra Conservancy while the other team went to the Epupa Control Area.
Fieldwork progressed well, although the following problems were experienced by one of the teams:
One vehicle broke down and had to be returned to Windhoek, because of the lack of mechanical repair services in Kamanjab and other towns. The vehicle was immediately replaced with another 4 wheel drive vehicle.
Copied questionnaires from Windhoek arrived 4 days late, although the team still had questionnaires to work for most of the time.
Mr Alex Kuaere and Mr Bencious Kahirimana discontinued their involvement in the survey before the survey was completed.
The Survey Co-ordinators, Field Supervisors and Enumerators had meetings to discuss the above challenges and communicated possible solutions to the Team Leader. The following was done to expedite fieldwork and to solve the human resources and time constraints:
One of the trainees who were put on stand-by was requested to join the team. Mrs. Judy Muusuo who attended training full-time replaced one of the Enumerators.
One Enumerator from the Damara/Nama speaking team was allocated to the Otjiherero team, because the Damara/Nama speaking team was ahead of schedule; some households in the Otjiherero speaking area could speak Damara/Nama or Afrikaans.
The timeframe for completion was extended for this team to complete all questionnaires.
The other team in the Kunene area did not experience any problems.
Successes and challenges within each conservancy are discussed in the following sub-sections.
2.4.3.1Epupa Control AreaSome of the PSU’s in the Epupa Control Area had to be replaced because of the non-cooperation of one of the Chiefs. One of the Chiefs in the Epupa area refused to cooperate with the data collection team, unless the Minister of MET and the Director of SIAPAC visited him first. He indicated that he ‘only communicates with people with authority’. In addition, he did not want the data collection team to interview ‘my people’, because ‘my people would not provide us with true information’. He expected the team to only have an interview with him. This problem was discussed with MET and it was decided to replace the three ‘problematic’ PSUs with PSUs that
- 18 -

fell outside of the jurisdiction of the above-mentioned chief. Replacement PSUs are indicated in the following table:
Table 2-1: Replaced PSUs in the Epupa Control AreaOriginally selected PSUs Replacement PSUs
70199019 7019901170199020 7019900170199008 70199002
Questionnaires completed in the Epupa Control Area are presented in the table below.
Table 2-2: Questionnaires Completed in Epupa Control AreaType of Questionnaire Planned Completed
Primary Sampling Units 7 7Household Questionnaire 112 112Community Level Questionnaire with Village Headmen
7 7
Community Level Questionnaire with Conservancy Management Committee Members
1 1
2.4.3.2Ehirovapuka ConservancyOne PSU was replaced in this conservancy. The originally selected PSU (70699007) was totally deserted at the time of interviews. This area is considered a seasonal grazing area. Due to good rainfall this year, people have moved to another location, as they did not have to travel far for grazing, according to community leaders consulted in the conservancy. This PSU was replaced with PSU 101099024 that was the next closest PSU. Again this PSU (101099024), situated in the northern part of the conservancy had less than 16 households because it was overlapping with other areas outside the conservancy. Therefore, only 14 questionnaires could be completed. Another new PSU (70699010) was selected from the southern part of the conservancy to make up for the PSU with lesser households. This PSU also had less than 10 households as the rest of the households fell outside of the Ehirovapuka Conservancy. In this PSU, 6 questionnaires were completed. Please note that 8 instead of 7 community-level questionnaires were administered to village leaders because of the shortfall explained below.
Questionnaires completed in the Ehirovapuka Conservancy are presented in the table below.
Table 2-3: Questionnaires Completed in Ehirovapuka ConservancyType of Questionnaire Planned Completed
Primary Sampling Units 7 7
- 19 -

Household Questionnaire 112 112 + 4Community Level Questionnaire with Village Headmen
7 8
Community Level Questionnaire with Conservancy Management Committee Members
1 1
2.4.3.3Purros ConservancyNo PSU replacements occurred in Purros Conservancy. Only one community-level questionnaire was completed and not two because the traditional authority and the Conservancy Management Committee managed only one community in this PSU.
Questionnaires completed in the Purros Conservancy are presented in the table below.
Table 2-4: Questionnaire Completed in Purros ConservancyType of Questionnaire Planned Completed
Primary Sampling Units 1 1Household Questionnaire 16 16Community Level Questionnaire with Village Headmen
1 1
Community Level Questionnaire with Conservancy Management Committee Members
1 1
- 20 -
2.4.3.4#Khoadi //Hoas ConservancyAll PSUs within the #Khoadi //Hoas Conservancy were selected to participate in this survey, while more than one cluster was selected within some of the PSUs. This is a huge conservancy with very scattered farms and communities. Some communities in PSUs did not have leaders as they depended on leaders living within other PSUs. Please note that the area does not have many communities, but rather comprise mostly small farms managed by individual families. Most community leaders and activists responsible for some of these remote communities and farms lived in the main settlement areas of the conservancy, but outside some PSUs. It was therefore impossible to do the total number of community-level questionnaires. It should be noted that community-level questionnaires were only completed in 4 out of 12 PSUs, e.g., 3 community-level questionnaires were completed in PSU no. 70699018, because three clusters were randomly selected within this PSU. Only 9 out of 12 community-level questionnaires were completed.
It should be noted that in total 66 out of 68 community-level questionnaires were completed, because more were done in other areas where it could be done, to make up for areas such as the above where it was impossible to reach the required amount.
Questionnaires completed in the #Khoadi //Hoas Conservancy are presented in the table below.
Table 2-5: Questionnaires Completed in #Khoadi //Hoas ConservancyType of Questionnaire Planned Completed
Primary Sampling Units 12 12Household Questionnaire 192 192Community Level Questionnaire with Village Headmen
12 9
Community Level Questionnaire with Conservancy Management Committee Members
1 1
2.4.3.5Torra ConservancyNo major challenges presented themselves in this conservancy. No community-level questionnaire was conducted in PSU no. 70399002 because it fell under the Bersig community, which is the main settlement of the conservancy but outside this PSU, but two community level questionnaires were done in PSU no. 70399001.
Questionnaires completed in the Torra Conservancy are presented in the table below.
Table 2-6: Questionnaires Completed in Torra ConservancyType of Questionnaire Planned Completed
- 21 -

Primary Sampling Units 3 3Household Questionnaire 48 48Community Level Questionnaire with Village Headmen
3 3
Community Level Questionnaire with Conservancy Management Committee Members
1 1
2.4.4 Detailed Field Report – Caprivi Region
Fieldwork started on 4 July 2006 with the teams travelling for a full day from Windhoek to the Caprivi Region and setting up camp. The two teams started together in the Mayuni Conservancy to allow the Team Leader to meet the team and check the first questionnaires. After the completion of the Mayuni Conservancy the teams separated into two teams. Both teams were provided with 4 wheel drive vehicles and camping equipment.
Fieldwork progressed well, although the team had difficulties accessing PSUs in the Kasika Conservancy and Kabulabula Control Area due to floods.
Successes and challenges within each conservancy are discussed in the following sub-sections.
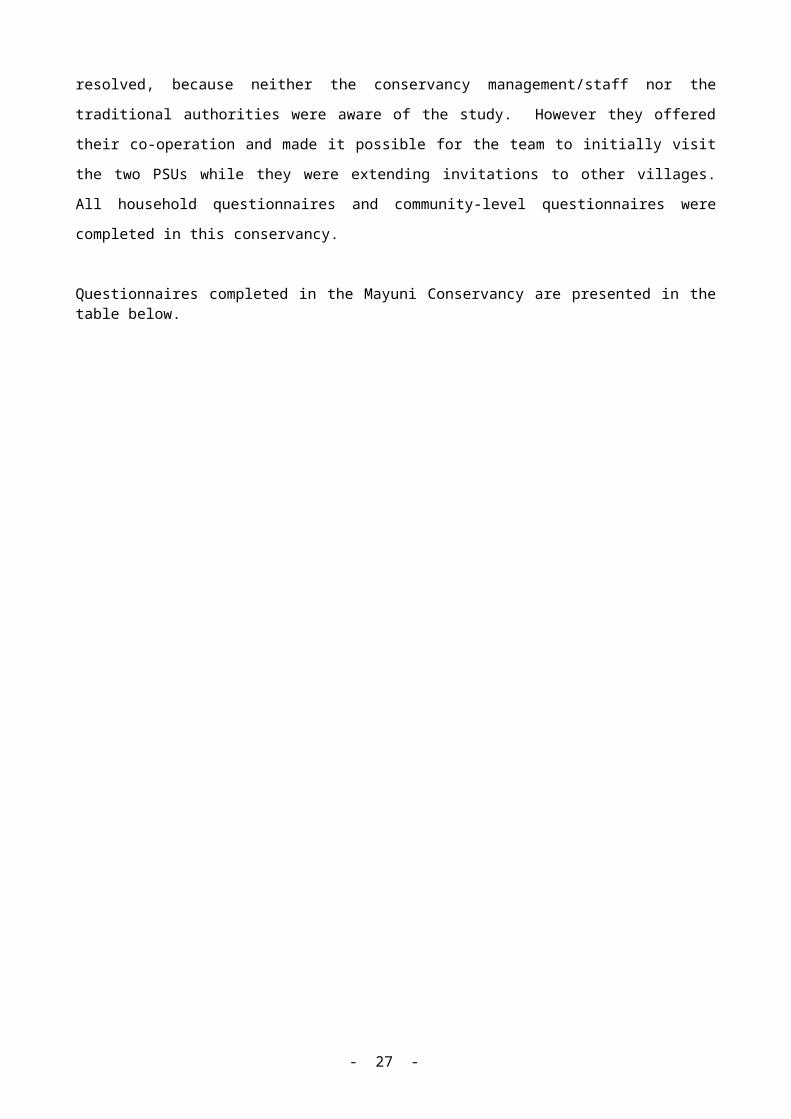
2.4.4.1Mayuni ConservancyTwo PSUs (10599004 & 10599003) were conducted on the first day of fieldwork. This was a result of logistical challenges that had to be resolved, because neither the conservancy management/staff nor the traditional authorities were aware of the study. However they offered their co-operation and made it possible for the team to initially visit the two PSUs while they were extending invitations to other villages. All household questionnaires and community-level questionnaires were completed in this conservancy.
Questionnaires completed in the Mayuni Conservancy are presented in the table below.
- 22 -
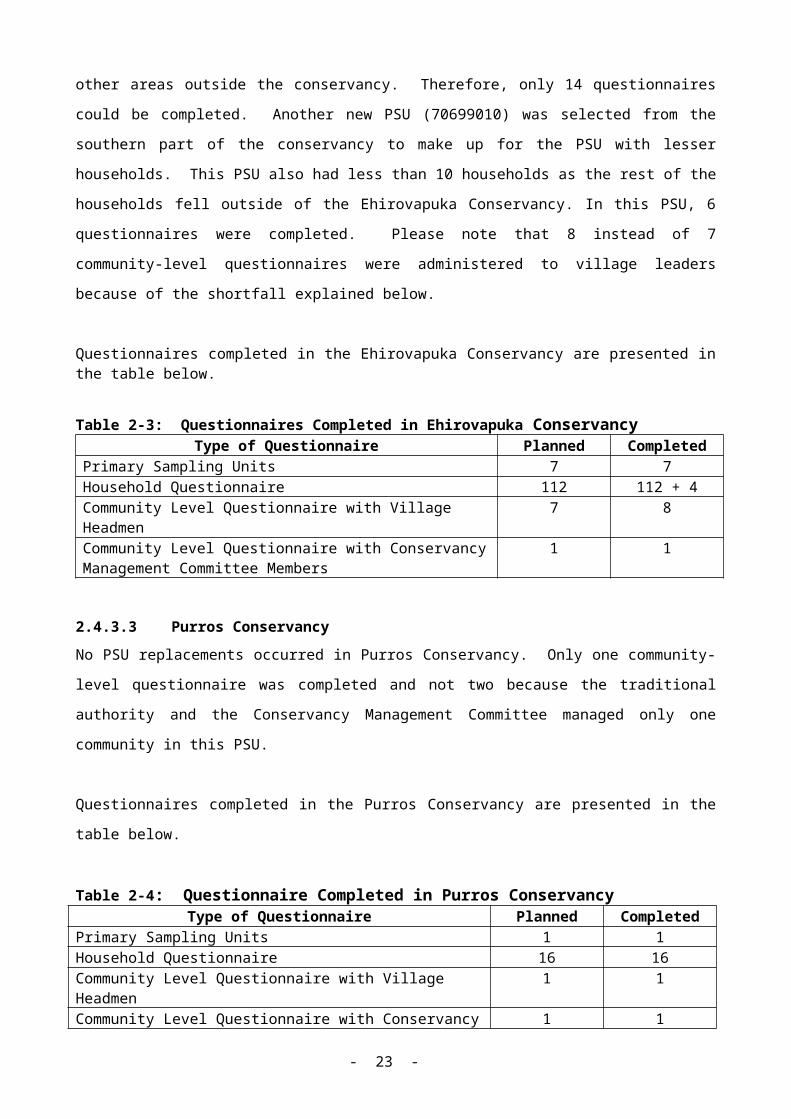
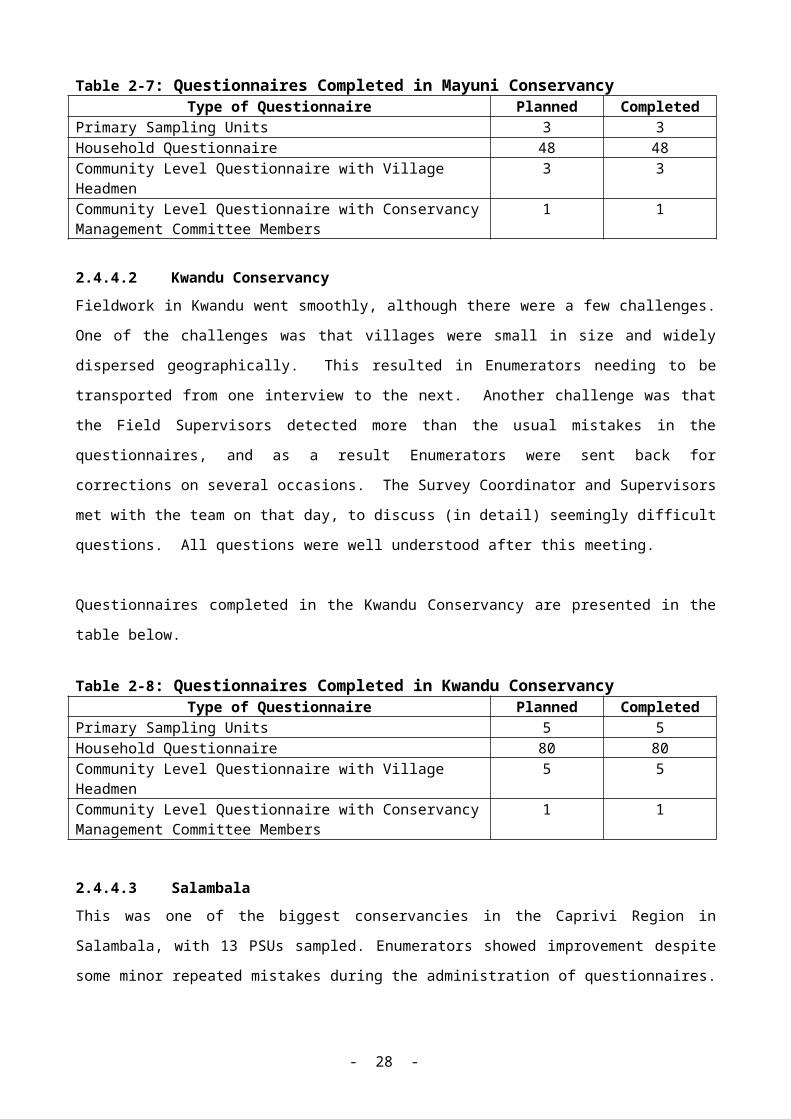
Table 2-7: Questionnaires Completed in Mayuni ConservancyType of Questionnaire Planned Completed
Primary Sampling Units 3 3Household Questionnaire 48 48Community Level Questionnaire with Village Headmen
3 3
Community Level Questionnaire with Conservancy Management Committee Members
1 1
2.4.4.2Kwandu ConservancyFieldwork in Kwandu went smoothly, although there were a few challenges. One of the challenges was that villages were small in size and widely dispersed geographically. This resulted in Enumerators needing to be transported from one interview to the next. Another challenge was that the Field Supervisors detected more than the usual mistakes in the questionnaires, and as a result Enumerators were sent back for corrections on several occasions. The Survey Coordinator and Supervisors met with the team on that day, to discuss (in detail) seemingly difficult questions. All questions were well understood after this meeting.
Questionnaires completed in the Kwandu Conservancy are presented in the table below.
Table 2-8: Questionnaires Completed in Kwandu ConservancyType of Questionnaire Planned Completed
Primary Sampling Units 5 5Household Questionnaire 80 80Community Level Questionnaire with Village Headmen
5 5
Community Level Questionnaire with Conservancy Management Committee Members
1 1
2.4.4.3SalambalaThis was one of the biggest conservancies in the Caprivi Region in Salambala, with 13 PSUs sampled. Enumerators showed improvement despite some minor repeated mistakes during the administration of questionnaires.
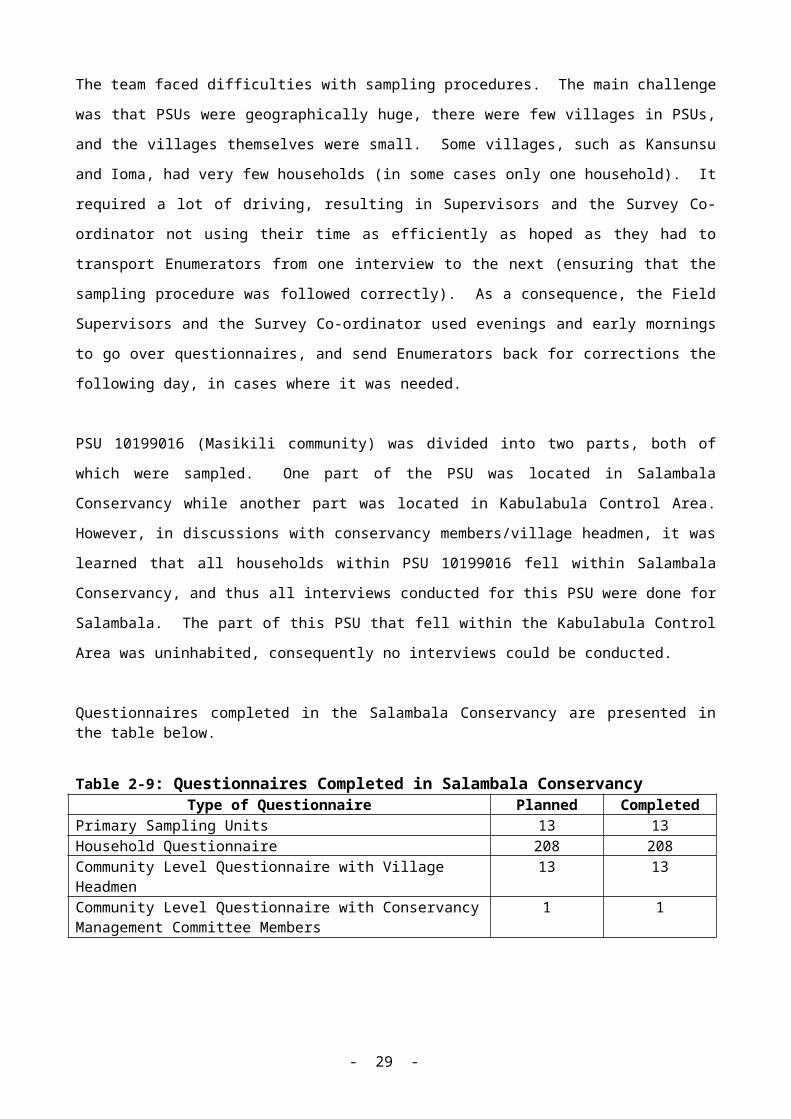
The team faced difficulties with sampling procedures. The main challenge was that PSUs were geographically huge, there were few villages in PSUs, and the villages themselves were small. Some villages, such as Kansunsu and Ioma, had very few households (in some cases only one household). It required a lot of driving, resulting in Supervisors and the Survey Co-ordinator not using their time as efficiently as hoped as they had to transport Enumerators from one interview to the next (ensuring that the sampling procedure was followed correctly). As a consequence, the Field
- 23 -

Supervisors and the Survey Co-ordinator used evenings and early mornings to go over questionnaires, and send Enumerators back for corrections the following day, in cases where it was needed.
PSU 10199016 (Masikili community) was divided into two parts, both of which were sampled. One part of the PSU was located in Salambala Conservancy while another part was located in Kabulabula Control Area. However, in discussions with conservancy members/village headmen, it was learned that all households within PSU 10199016 fell within Salambala Conservancy, and thus all interviews conducted for this PSU were done for Salambala. The part of this PSU that fell within the Kabulabula Control Area was uninhabited, consequently no interviews could be conducted.
Questionnaires completed in the Salambala Conservancy are presented in the table below.
Table 2-9: Questionnaires Completed in Salambala ConservancyType of Questionnaire Planned Completed
Primary Sampling Units 13 13Household Questionnaire 208 208Community Level Questionnaire with Village Headmen
13 13
Community Level Questionnaire with Conservancy Management Committee Members
1 1
2.4.4.4Kasika ConservancyTwo PSUs were sampled within the Kasika Conservancy. Both PSUs could not be reached, however, even with 4 wheel drive vehicles because of floods in the area. The Team Leader contacted the Kasika Conservancy and kindly requested that boats be provided to the teams. The Kasika Conservancy Management Committee Chairperson agreed that they would provide boats as long as the team provided petrol.
Kasika Conservancy could only be reached via Kasane in Botswana about sixty kilometres from Ngoma, Namibia’s border post with Botswana. The team had to drive from Namibia to Botswana and then take boats from Botswana on the Zambezi River back into Namibia to reach sampled PSUs in this conservancy. Project vehicles were left at the border post, where Kasika Conservancy Management Committee members met the team with their boats. One day was spent on travelling because of the complexity of reaching this area. Another day was spent going back to Namibia via Botswana.
- 24 -

The team spent the rest of the first day discussing with the Conservancy Management Committee members how best to reach the sampled PSUs. They found that the villages indicated on the map, which were supposed to be located in PSU 10199032 area, were actually located outside of the conservancy boundaries, while the rest of the same PSU was uninhabited. This PSU was replaced with PSU 10199030 (Kasika), which was also the next closest PSU that was not originally sampled. The correct sampling procedure within the PSU was applied.
PSU 10199031 was very problematic. Villages were very far from each other. It took about two hours to reach each village by boat. Even then, it was found that most were deserted because of the floods. Of those villages that were not deserted, most only had up to three households. Therefore, a change from the normal sampling strategy within the PSU was necessary. This change was discussed with the World Bank Data Analyst who agreed with the revised strategy. Instead of picking a random interval number from the bag and spinning the bottle for direction, the field team conducted interviews in all available households per occupied village. Nevertheless, even after this method was applied, only thirteen interviews could be conducted. Other interviews could not be conducted within this PSU because of the lack of households. An additional three interviews were therefore conducted in PSU 10199030. PSU numbers on these three questionnaires are 10199031, because it was done for this specific PSU.
This meant that, in PSU 10199030, a total of 19 interviews were conducted (16 for this PSU, and 3 by another team for PSU 10199031.
Questionnaires completed in the Kasika Conservancy are presented in the table below.
- 25 -

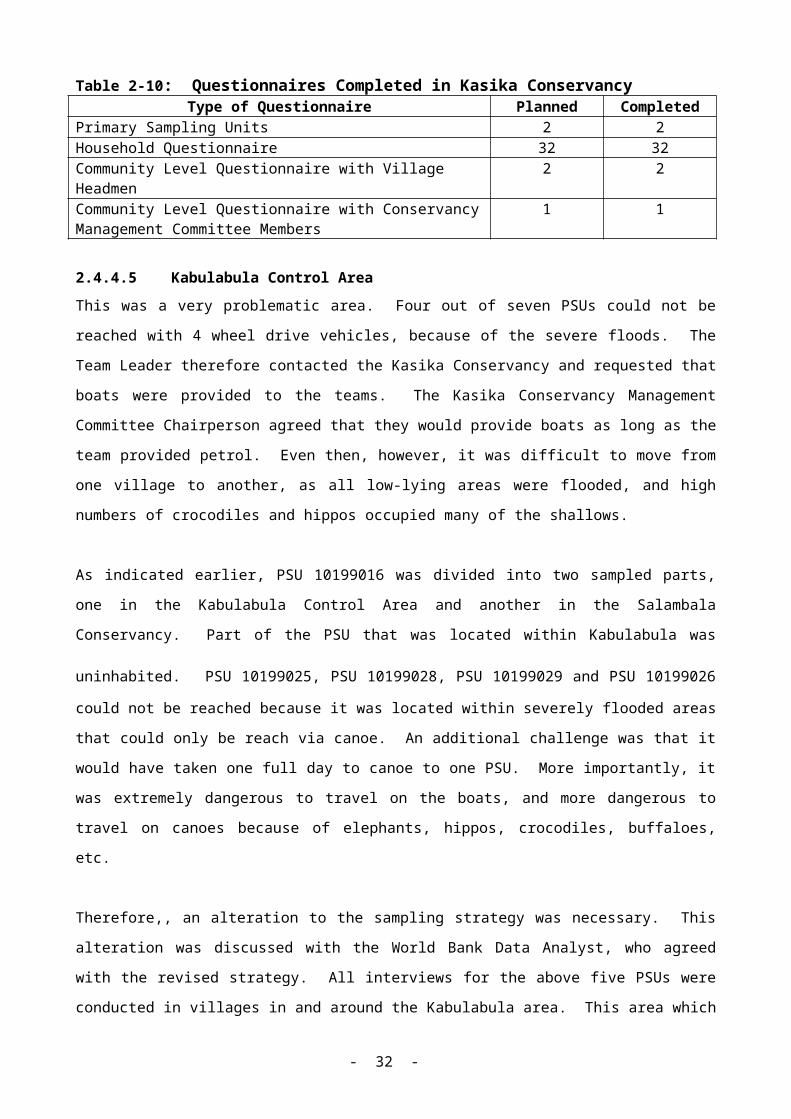
Table 2-10: Questionnaires Completed in Kasika ConservancyType of Questionnaire Planned Completed
Primary Sampling Units 2 2Household Questionnaire 32 32Community Level Questionnaire with Village Headmen
2 2
Community Level Questionnaire with Conservancy Management Committee Members
1 1
2.4.4.5Kabulabula Control AreaThis was a very problematic area. Four out of seven PSUs could not be reached with 4 wheel drive vehicles, because of the severe floods. The Team Leader therefore contacted the Kasika Conservancy and requested that boats were provided to the teams. The Kasika Conservancy Management Committee Chairperson agreed that they would provide boats as long as the team provided petrol. Even then, however, it was difficult to move from one village to another, as all low-lying areas were flooded, and high numbers of crocodiles and hippos occupied many of the shallows.
As indicated earlier, PSU 10199016 was divided into two sampled parts, one in the Kabulabula Control Area and another in the Salambala Conservancy. Part of the PSU
that was located within Kabulabula was uninhabited. PSU 10199025, PSU
10199028, PSU 10199029 and PSU 10199026 could not be reached because it was located within severely flooded areas that could only be reach via canoe. An additional challenge was that it would have taken one full day to canoe to one PSU. More importantly, it was extremely dangerous to travel on the boats, and more dangerous to travel on canoes because of elephants, hippos, crocodiles, buffaloes, etc.
Therefore,, an alteration to the sampling strategy was necessary. This alteration was discussed with the World Bank Data Analyst, who agreed with the revised strategy. All interviews for the above five PSUs were conducted in villages in and around the Kabulabula area. This area which was reachable although team members had to cross river streams (with water up to their knees) to make up for lack of interviews in the above mentioned PSUs. This meant that sufficient numbers of interviews were conducted in the Kabulabula area to cover the five PSUs that were totally unreachable.
PSU 10199015 and 10199018 were reachable by 4 wheel drive vehicles, and as a result normal sampling procedures were followed.
- 26 -
To sum up, the main challenges were to keep both the teams and the questionnaires safe and not water damaged.
Questionnaires completed in the Kabulabula Control Area are presented in the table below.
Table 2-11: Questionnaire Completed in Kabulabula Control AreaType of Questionnaire Planned Completed
Primary Sampling Units 7 7Household Questionnaire 112 112Community Level Questionnaire with Village Headmen
7 7
Community Level Questionnaire with Conservancy Management Committee Members
1 1
2.5 Methodology: Data Entry/Validation, Analysis and Write-Up
2.5.1 Data Entry/ValidationThe data entry database was developed during the last days of training. The Data Entry Manager and the World Bank Data Analyst agreed on a certain format for the database at the end of training. An initial set of questionnaires was entered to check the database, and the database was finalised thereafter. Data entry was originally expected to begin within two weeks after fieldwork began, but this did not happen because questionnaires could not be send from the regions to Windhoek in a safe and reliable manner. In addition, the length and complexity of the questionnaire resulted in further data entry delays. As a result, data entry took two weeks longer then initially anticipated.
Validation of 100% of a data points took place. Variable sorting to check for proper use of ‘skip tos’ and ‘go tos’ were conducted in Excel (the package used for data entry), and thereafter in the Statistical Package for the Social Sciences (SPSS). The following procedures were employed:
- 27 -
Validation of 100% of all data points. Variable sorting to check for proper use of ‘skip tos’ and ‘go tos’. Transfer of data to SPSS.Search for out-of-range values.Variable sorting to check for proper use of ‘skip tos’ and ‘go tos’.Variable checking for logical flow across ‘linked’ variables (outside of main question - sub-question links that rely on skip to and go to instructions). Correction of the SPSS data file.
The few data errors that might remain will be identified during analysis by the World Bank Data Analyst.
Levels of co-operation were quite high, with 91.4% either ‘moderately’ or ‘highly’ co-operative.
2.5.2 Data Analysis/Report Write-UpFollowing completion of data entry/validation and cleaning, and the transfer of data into SPSS and final cleaning, limited analysis was conducted by the Consultant. Analysis focused on key findings, presented by conservancy, and is covered in Chapter 3. The bulk of all data analysis will be conducted by the World Bank Data Analyst.
The raw data was also provided to MET for further analysis, while the data file will be transferred from the World Bank to MET following analysis.
- 28 -
3 Key Findings
3.1 IntroductionIn this chapter, key findings from the survey of households are presented. As noted in Chapter 2, these findings are limited to what were regarded as the most important findings from the survey that did not require econometric analysis. In addition, all analysis of the Community-Level Questionnaire will be conducted by the World Bank Data Analyst.
3.2 Household Assets
Key household assets are as follows:
Table 3-12: Household Assets (ownership)Respon
seTorr
a#Khoa
di/ Hoas
Salam-bala
Mayuni
Ehirova-puka
Purros
Kwandu
Kasika
Epupa
Kabula-bula
PloughYes 2.1 2.6 48.8 31.8 12.8 0.0 26.8 27.3 8.0 39.3No 97.9 97.4 51.2 68.2 87.2 100.0 73.2 72.7 92.0 60.7HoeYes 2.1 3.1 95.2 95.6 29.1 0.0 89.0 84.8 25.9 84.1No 97.9 96.9 4.8 4.4 70.9 100.0 11.0 15.2 74.1 15.9BoatYes 0.0 0.0 1.4 0.0 0.9 0.0 1.2 3.0 0.0 0.9No 100.0 100.0 98.6 100.0 99.1 100.0 98.8 97.0 100.0 99.1CanoeYes 0.0 0.0 22.5 2.2 1.7 0.0 4.9 57.6 0.0 46.7No 100.0 100.0 77.5 97.8 98.3 100.0 95.1 42.4 100.0 53.3Fishing EquipmentYes 2.1 0.0 33.0 4.4 1.7 0.0 6.1 78.8 0.0 56.1No 97.9 100.0 67.0 95.6 98.3 100.0 93.9 21.2 100.0 43.9BicycleYes 4.2 8.3 22.5 6.7 8.5 0.0 6.1 18.2 0.0 26.2No 95.8 91.7 77.5 93.3 91.5 100.0 93.9 81.8 100.0 73.8Motor VehicleYes 25.0 20.2 6.2 0.0 23.1 12.5 3.7 0.0 7.1 6.5No 75.0 79.8 93.8 100.0 76.9 87.5 96.3 100.0 92.9 93.5TractorYes 0.0 0.5 0.5 0.0 0.0 0.0 0.0 0.0 0.0 0.0No 100.0 99.5 99.5 100.0 100.0 100.0 100.0 100.0 100.0 100.0SledgeYes 0.0 0.0 40.2 13.3 1.7 0.0 19.5 21.2 0.0 28.0No 100.0 100.0 59.8 86.7 98.3 100.0 80.5 78.8 100.0 72.0Grinding/Hammer MillYes 0.0 0.5 6.2 0.0 0.0 0.0 1.2 6.1 0.0 9.3No 100.0 99.5 93.8 100.0 100.0 100.0 98.8 93.9 100.0 90.7
- 29 -
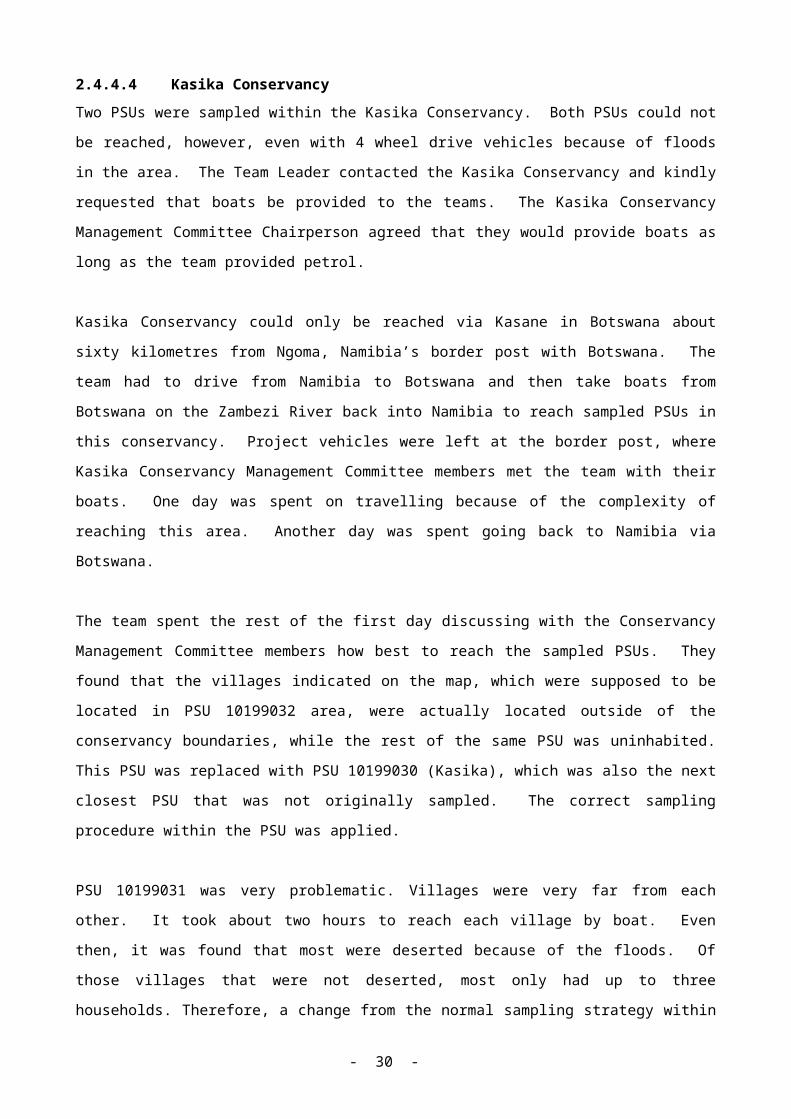
Table 3-1: Household Assets (ownership) (continued)Respon
seTorr
a#Khoa
di/ Hoas
Salam-bala
Mayuni
Ehirova-puka
Purros
Kwandu
Kasika
Epupa
Kabula-bula
RefrigeratorYes 35.4 25.4 8.6 0.0 10.3 6.3 3.7 6.1 4.5 5.6No 64.6 74.6 91.4 100.0 89.7 93.8 96.3 93.9 93.9 95.5TelephoneYes 18.8 14.0 23.4 6.7 16.2 0.0 13.4 18.2 3.6 13.1No 81.3 86.0 76.6 93.3 83.8 100.0 86.6 81.8 96.4 86.9Sewing MachineYes 25.0 42.0 5.3 4.4 56.5 12.5 2.4 0.0 5.4 1.9No 75.0 58.0 94.7 95.6 43.6 87.5 97.6 100.0 94.6 98.1Donkey CartYes 45.8 54.4 4.3 0.0 35.0 6.3 0.0 0.0 4.5 0.9No 54.2 45.6 95.7 100.0 65.0 93.8 100.0 100.0 95.5 99.1DonkeysYes 56.3 66.3 0.5 0.0 53.0 18.8 2.4 0.0 43.8 0.0No 43.8 33.7 99.5 100.0 47.0 81.3 97.6 100.0 56.3 100.0OxenYes 6.3 7.3 51.2 22.2 27.4 6.3 29.3 57.6 35.7 51.4No 93.8 92.7 48.8 77.8 72.6 93.8 70.7 42.4 64.3 48.6HorsesYes 14.6 24.9 0.0 0.0 23.1 6.3 0.0 0.0 17.0 0.0No 85.4 75.1 100.0 100.0 76.9 93.8 100.0 100.0 83.0 100.0Livestock EquipmentYes 43.8 47.7 33.0 15.6 21.4 0.0 17.1 24.2 3.6 26.2No 56.3 52.3 67.0 84.4 78.6 100.0 82.9 75.8 96.4 73.8AxeYes 75.0 83.4 85.2 84.4 76.1 18.8 80.5 72.7 41.1 71.0No 25.0 16.6 14.8 15.6 23.9 81.3 19.5 27.3 58.9 29.0GunYes 4.2 8.3 19.1 6.7 33.3 12.5 4.9 9.1 6.3 20.6No 95.8 91.7 80.9 93.3 66.7 87.5 95.1 90.9 93.8 79.4Water PumpYes 4.2 1.6 1.4 4.4 1.7 6.3 0.0 0.0 0.0 0.0No 95.8 98.4 98.6 95.6 98.3 93.8 100.0 100.0 100.0 100.0Hand Operated Hammer millYes 0.0 2.1 22.0 2.2 2.6 0.0 98 21.2 25.9 19.6No 100.0 97.9 78.0 97.8 97.4 100.0 90.2 78.8 74.1 80.4Hand SawYes 54.2 58.0 27.8 20.0 42.7 6.3 11.0 21.2 2.7 23.4No 45.8 42.0 72.2 80.0 57.3 93.8 89.0 78.8 97.3 76.6Carpentry PlaneYes 2.1 1.6 3.3 0.0 0.9 0.0 1.2 0.0 0.0 0.9No 97.9 98.4 96.7 100.0 99.1 100.0 98.8 100.0 100.0 99.1WheelbarrowYes 22.9 25.9 5.3 4.4 22.2 6.3 1.2 0.0 3.6 1.9No 77.1 74.1 94.7 95.6 77.8 93.8 98.8 100.0 96.4 98.1FurnitureYes 89.6 79.8 40.2 22.2 46.2 12.5 26.8 30.3 8.0 28.0No 10.4 20.2 59.8 77.8 53.8 87.5 73.2 69.7 92.0 72.0TelevisionYes 22.9 13.0 16.7 6.7 1.7 0.0 6.1 3.0 1.8 4.7No 77.1 87.0 83.3 93.3 98.3 100.0 93.9 97.0 98.2 95.3
Patterns of ownership varied across the two regions. Farming implements were largely limited to locations within Caprivi Region, but even there, there were important differences across the conservancies. Overall, ownership of implements was highest in Salambala and Kasika conservancies, with ownership of fishing gear especially high in the floodplain areas of Kasika and Kabulabula. For Kunene Region
- 30 -

conservancies, ownership of resources appropriate to the environment (e.g., donkey carts, livestock, water pumps, etc.) varied considerably across conservancies, with asset ownership higher in Torra, #Khoadi/Hoas and Ehirovapuka conservancies, compared to the emerging conservancy area near Epupa and especially Purros, in the remote north west.
3.3 Livestock, Small Ruminants and Poultry Ownership and ProductionRespondents were asked about ownership of various animal resources. Findings are summarised in the following table:
Table 3-13: Livestock, Small Ruminant and Poultry ResourcesRespon
seTorr
a#Khoa
di/ Hoas
Salam-bala
Mayuni
Ehirova-puka
Purros
Kwandu
Kasika
Epupa
Kabula-bula
CattleYes 43.8 54.2 67.0 35.6 83.8 18.8 43.9 87.9 73.2 68.2No 56.3 45.8 33.0 64.4 16.2 81.3 56.1 12.1 26.8 31.8GoatsYes 83.3 81.3 18.2 6.7 75.2 18.8 11.0 0.0 73.2 3.7No 16.7 18.7 81.8 93.3 24.8 81.3 89.0 100.0 26.8 96.3PigsYes 4.2 1.0 1.4 0.0 0.9 0.0 0.0 3.0 0.0 0.0No 95.8 99.0 98.6 100.0 99.1 100.0 100.0 97.0 100.0 100.0SheepYes 20.8 29.5 0.0 2.2 28.2 18.8 0.0 0.0 47.3 0.0No 79.2 70.5 100.0 97.8 71.8 81.3 100.0 100.0 52.7 100.0PoultryYes 66.7 74.1 71.8 53.3 55.6 0.0 56.1 87.9 25.0 72.0No 33.3 25.9 28.2 46.7 44.4 100.0 43.9 12.1 75.0 28.0HorsesYes 12.5 25.4 0.0 0.0 22.2 6.3 0.0 0.0 16.1 0.0No 87.5 74.6 100.0 100.0 77.8 93.8 100.0 100.0 83.9 100.0Donkeys/MulesYes 58.3 65.8 0.5 0.0 53.8 18.8 0.0 0.0 45.5 0.0No 41.7 34.2 99.5 100.0 46.2 81.3 100.0 100.0 54.5 100.0
With the exception of cattle (common across most locations) and pigs (uncommon across all locations), ownership of these resources varied largely across region. In Kunene Region, Purros stands out as having quite low levels of animal assets compared to other locations in the same Region.
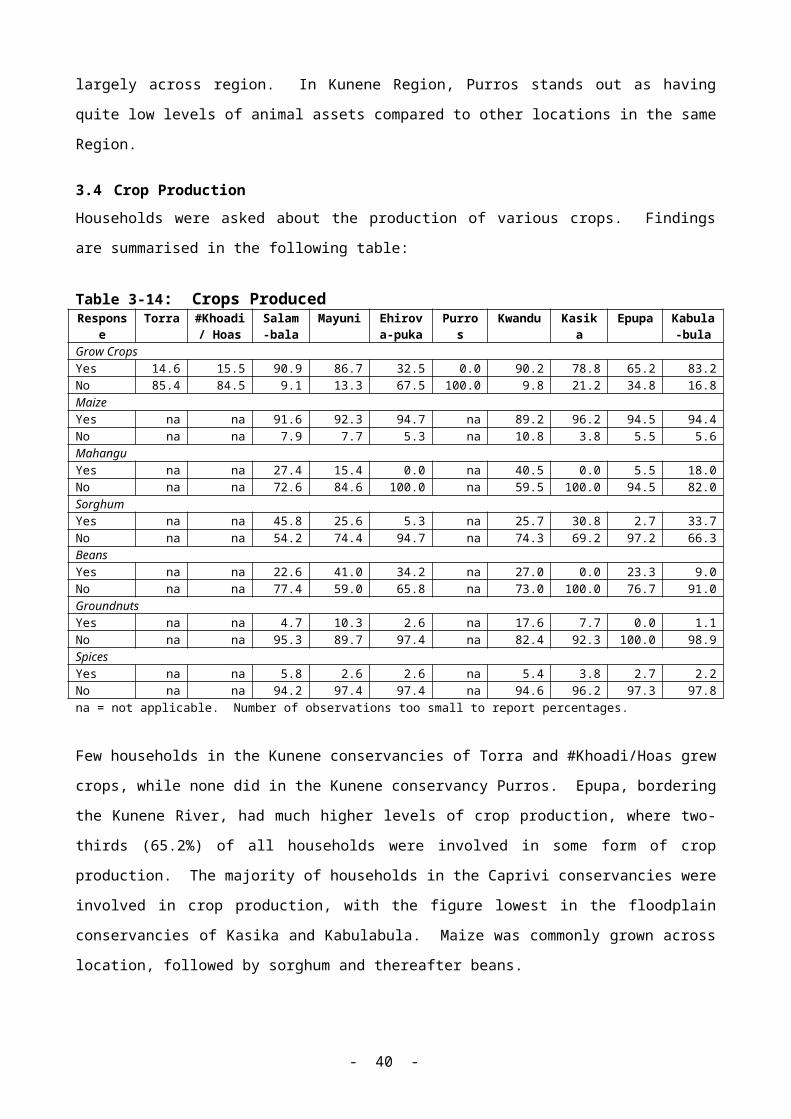
3.4 Crop ProductionHouseholds were asked about the production of various crops. Findings are summarised in the following table:
Table 3-14: Crops ProducedRespon
seTorr
a#Khoa
di/ Hoas
Salam-bala
Mayuni
Ehirova-puka
Purros
Kwandu
Kasika
Epupa
Kabula-bula
Grow CropsYes 14.6 15.5 90.9 86.7 32.5 0.0 90.2 78.8 65.2 83.2No 85.4 84.5 9.1 13.3 67.5 100.0 9.8 21.2 34.8 16.8
- 31 -
MaizeYes na na 91.6 92.3 94.7 na 89.2 96.2 94.5 94.4No na na 7.9 7.7 5.3 na 10.8 3.8 5.5 5.6MahanguYes na na 27.4 15.4 0.0 na 40.5 0.0 5.5 18.0No na na 72.6 84.6 100.0 na 59.5 100.0 94.5 82.0SorghumYes na na 45.8 25.6 5.3 na 25.7 30.8 2.7 33.7No na na 54.2 74.4 94.7 na 74.3 69.2 97.2 66.3BeansYes na na 22.6 41.0 34.2 na 27.0 0.0 23.3 9.0No na na 77.4 59.0 65.8 na 73.0 100.0 76.7 91.0GroundnutsYes na na 4.7 10.3 2.6 na 17.6 7.7 0.0 1.1No na na 95.3 89.7 97.4 na 82.4 92.3 100.0 98.9SpicesYes na na 5.8 2.6 2.6 na 5.4 3.8 2.7 2.2No na na 94.2 97.4 97.4 na 94.6 96.2 97.3 97.8na = not applicable. Number of observations too small to report percentages.
Few households in the Kunene conservancies of Torra and #Khoadi/Hoas grew crops, while none did in the Kunene conservancy Purros. Epupa, bordering the Kunene River, had much higher levels of crop production, where two-thirds (65.2%) of all households were involved in some form of crop production. The majority of households in the Caprivi conservancies were involved in crop production, with the figure lowest in the floodplain conservancies of Kasika and Kabulabula. Maize was commonly grown across location, followed by sorghum and thereafter beans.
3.5 Restrictions on Resource Use
Following a series of questions on resource use, respondents were asked whether there were any restrictions on resource use in their area. If yes, respondents were asked about the impacts of these restrictions. Responses are summarised in the following figure:
- 32 -

Figure 3-1: Restrictions on Resource Use
0
10
20
30
40
50
60
70
80
90
100To
rra
#Kho
adi/H
oas
Salam
abala
May
uni
Ehiro
vapu
ka
Purro
s
Kwan
du
Kasik
a
Epup
a
Kabu
labul
a
Aware restrictions - land Aware restrictions - wildlife Aware restrictions - other resources
Most respondents noted resource use restrictions in their conservancies, in terms of land and, to a lesser extent, other resources, but noted particular restrictions on resource use around wildlife. Of those who noted restrictions around use of wildlife, over 90% across conservancies noted that these restrictions ‘stop us from using the resources the way we want to’. When asked whether these restrictions were beneficial, respondents were more mixed in their opinions. In Torra, Ehirovapuka, and Kasika conservancies, over 80% felt that the restrictions benefited their households, but for most other locations the figure varied between half and two-thirds, with respondents in Kwandu especially likely to note that there were no benefits (58.1% felt that the restrictions did not offer any benefits).
- 33 -
3.6 Participation in ConservancyRespondents were asked whether any member of their household was a member of the local conservancy. Findings for the eight conservancy areas in the study are discussed here (Torra, #Khoadi/Hoas, Salambala, Mayuni, Ehirovapuka, Purros, Kwandu, and Kasika).
Respondents in these eight conservancy areas were asked whether there was a conservancy in their area. Findings are summarised in the following figure:
Figure 3-2: Knowledge of Local Conservancy
0%
20%
40%
60%
80%
100%
DK of Conservancy 0.0 2.6 5.7 2.2 1.7 0.0 2.4 3.0
Know of Conservancy 100.0 97.4 94.3 97.8 97.4 100.0 97.6 97.0
Torra#Khoadi/
HoasSalama-
balaMayuni
Ehirova-puka
Purros Kwandu Kasika
Almost all respondents in all conservancies were aware that there was a conservancy in their area. Of these, almost all correctly named the conservancy, with the exception of Ehirovapuka, when only 69.3% could name the conservancy. Few, however, could name the correct year that the conservancy was established.
Registration in the conservancy by at least one household member is indicated in the following figure:
- 34 -

Figure 3-3: Household Member Involvement in Conservancy
0%
10%
20%
30%
40%
50%
60%
70%
80%
90%
100%
No 8.3 49.2 88.0 69.8 18.4 6.2 76.2 48.4
Yes 91.7 50.8 12.0 30.2 81.6 93.8 23.8 51.6
Torra#Khoadi/Hoas
Salama-bala
MayuniEhirova-
pukaPurros Kwandu Kasika
Involvement varied considerably across conservancy, while conservancy membership was highest in the Kunene conservancies, reaching over 90% in Torra and Purros conservancies, but much lower in Salambala and Kwandu conservancies.
Those aware of their conservancies were asked questions about what plans and activities the conservancies had in place. This included: constitution; Conservancy Committee; Natural Resource Management Plan; Financial Management Plan; Tourism Management Plan; Zonation/Land Use Plan; and game guards/resource monitors. Findings are summarised in the following table:
- 35 -
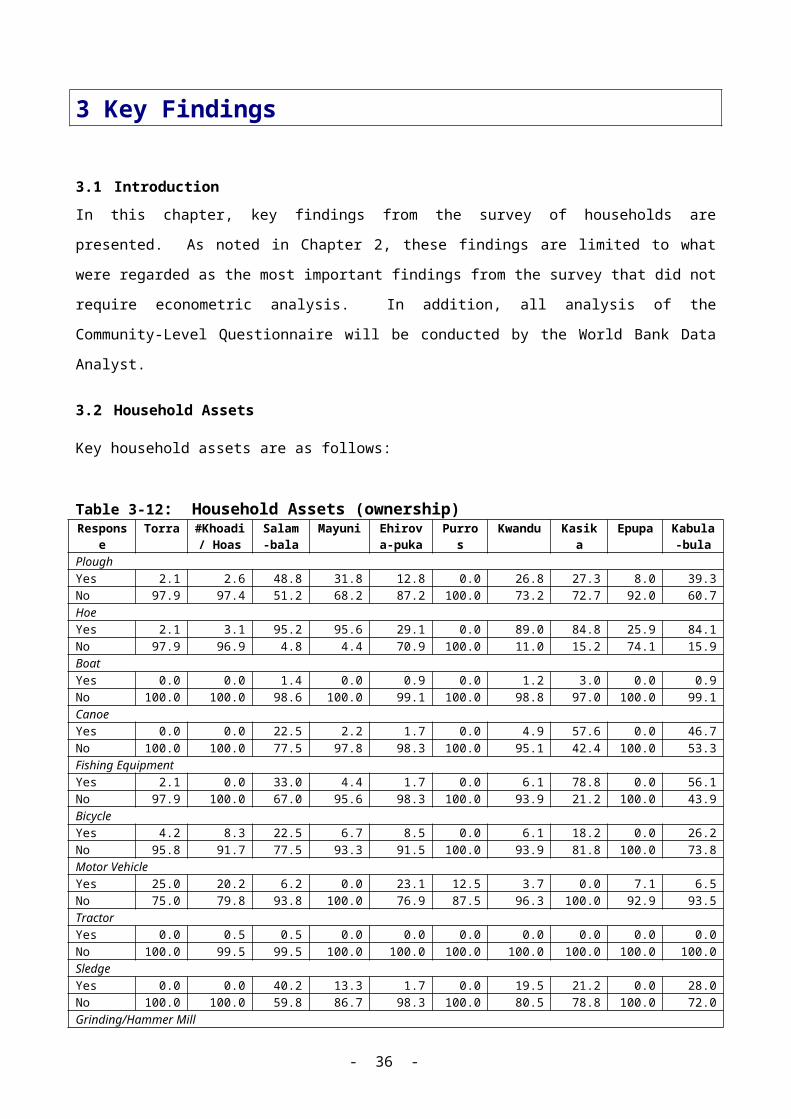
Table 3-15: Plans and ActivitiesRespon
seTorr
a#Khoa
di/ Hoas
Salam-bala
Mayuni
Ehirova-puka
Purros
Kwandu
Kasika
Epupa
Kabula-bula
ConstitutionsYes 95.8 83.5 75.8 65.9 58.8 81.3 58.8 87.5 na naNo 0.0 1.1 1.5 0.0 0.0 0.0 2.5 0.0 na naDK 4.2 15.4 22.7 34.1 41.2 18.8 38.8 12.5 na naConservancy CommitteeYes 97.9 91.4 78.3 77.3 78.9 100.0 57.0 87.5 na naNo 0.0 0.0 2.0 2.3 0.0 0.0 5.1 0.0 na naDK 2.1 8.6 19.7 20.5 21.1 0.0 38.0 12.5 na naNatural Resource Management PlanYes 81.3 79.8 69.7 59.1 45.6 68.8 46.3 84.4 na naNo 0.0 0.5 2.0 0.0 1.8 0.0 75.4 0.0 na naDK 18.8 19.7 28.3 40.9 52.6 31.3 46.3 15.6 na naFinancial Management PlanYes 77.1 76.6 68.7 61.4 50.9 81.3 42.5 78.1 na naNo 2.1 3.2 3.0 0.0 1.8 0.0 10.0 0.0 na naDK 20.8 20.2 28.3 38.6 47.4 18.8 47.5 21.9 na naTourism Management PlanYes 85.4 73.3 69.2 61.4 39.5 68.8 43.8 81.3 na naNo 0.0 2.1 2.5 0.0 3.5 6.3 8.8 0.0 na naDK 14.6 24.6 28.3 38.6 57.0 25.0 47.5 18.8 na naZonational/Land Use PlanYes 85.4 69.7 68.7 50.0 44.7 68.8 43.8 81.3 na naNo 0.0 2.1 2.5 0.0 1.8 0.0 7.5 0.0 na naDK 14.6 28.2 28.8 50.0 53.5 31.3 48.8 18.8 na naGame Guards/Resource MonitorsYes 100.0 92.6 82.3 77.3 64.9 100.0 73.4 93.8 na naNo 0.0 1.1 3.0 2.3 2.6 0.0 3.8 0.0 na naDK 0.0 6.4 14.6 20.5 32.5 0.0 22.8 6.3 na nana - not applicable. No conservancy in area.
Most respondents noted that the conservancy’s constitution was in place, that a Conservancy Committee had been elected, and that some of the key plans were in place. Notable exceptions were Kwandu and, to a lesser extent, Ehirovapuka, where significantly lower numbers were likely to mention any of these.
- 36 -

Annex A: Terms of Reference
Terms of Reference
Ministry of Environment and Tourism -ICEMA ProjectTerms of Reference
Socio-Economic Household Survey
INTRODUCTION
The Government of Republic of Namibia, through the Ministry of Environment and Tourism (MET), has secured funding from the Global Environment Facility (GEF), through the World Bank (WB), for the Integrated Community Based Eco-system Management (ICEMA) Project. This project aims to support "community-based integrated ecosystem management practices through the National CBNRM framework” to “restore, secure and enhance key ecosystem processes in targeted conservancies, with biodiversity and land conservation and sustainable use as a goal."
Under the monitoring and evaluation component of the ICEMA project, one of the tasks is to assess the impacts that conservancy development has on rural livelihoods and the economy. This task includes quantitative survey of the household economy both within and outside of conservancies in order to measure the impacts of conservancy development. The work builds on earlier work along these lines by the Ministry, which included a quantitative household survey, carried out through the Wildlife Integration for Livelihood Diversification (WILD) Project, in conjunction with the MET’s Environmental Economics Unit.
This Terms of Reference is for a consultancy (comprising a firm of consultants) to carry out a stratified quantitative household survey, accompanied by complementary focus group discussions, to process and analyse the results to provide basic statistics, and to provide the MET with the data-base set up for further econometric analysis. The survey will be conducted in five sites in the north western communal lands and five sites in the north eastern communal lands of Namibia.
The Global Environment Facility through the World Bank and the French Global Environment Facility (FFEM) through the French Development Agency have provided funds for this activity.
SURVEY OBJECTIVE
The survey will be designed and carried out with the ultimate objective in mind. This is to provide an assessment of the impact of community conservancies on the poverty and welfare of rural households to:
extend and improve the database on household economies generated by the previous survey, by providing more detailed economic information on households in conservancy areas and by including households from non-conservancy areas for comparison;
facilitate a deeper understanding of the factors that determine how individuals and households spend their time and money through the analysis of income, expenditure, consumption and time use data, collected from a wide range of different households;
- 37 -

provide a basis for quantitative comparisons between the livelihood strategies of households in the areas where conservancies have been established, and the strategies of households outside those areas;
examine whether households’ livelihood strategies are changing over time, as conservancies become more established;
illuminate policy issues concerning the rural household economy (labour market policies, wages and income policies, equity) and how these issues are affected by access or lack of access to important natural resources.
Design of the survey will be done so as to facilitate later econometric analysis of the data-base.
SURVEY INSTRUMENTS
Draft versions of two distinct survey instruments have been developed: a. A structured questionnaire to be implemented at household level, which will
collect information on household characteristics, sources of incomes, expenditure patterns, natural resource-based income sources, relations between households and conservancies, and impacts of conservancies from the viewpoint of households. This survey will be implemented across a stratified sample of some 1,100 households, within conservancies with different degrees of establishment, and also outside conservancies.
b. A focus group discussion questionnaire which will be applied in targeted meetings of various stakeholders (conservancy committees, conservancy employees, registered conservancy members, non-members). Focus group discussions will solicit information to complement that provided through the household survey, such as information on prices, markets and weather conditions. They will also contextualise information provided through the household survey, for example, identifying community- and conservancy-level developments/characteristics and seasonal patterns. They will also provide additional information to evaluate opinions with respect to, for example, the relations between households and conservancies and the impact of conservancies on livelihoods.
These questionnaires will be revised and finalised during the pre-test of the survey.
SURVEY SITES
The questionnaires will be applied in ten pre-selected sites in two zones, which include: 1. The north west zone, which refers to the arid western escarpment areas of
Kunene and Erongo regions (well established and studied in the WILD/EEU study), with high tourism potential and pastoral land use. The following sites will be included in this zone:
a. well developed conservancy :Torra b. well developed conservancy : #Khoadi//Hoas; c. moderately developed conservancy : Ehirovapuka d. moderately developed conservancy : Purros; e. not yet developed as a conservancy : Epupa
2. The north east zone, which refers to the semi-arid/sub-humid north eastern riparian, floodplain and woodland areas of Caprivi region (well established and studied in the WILD EEU survey), with high tourism potential and agro-pastoral land use. Sites will include:
- 38 -

a. well developed conservancy: Salambala b. well developed conservancy: Mayuni. c. moderately developed conservancy: Kwandud. moderately developed conservancy: Kasika. e. not yet developed as a conservancy: Kabulualua.
In each of the sites, random samples of households will be selected, surveyed and recorded, making it possible to revisit the same households in future surveys. The numbers of households surveyed in each site will be roughly proportional to the site population. A total of some 1,100 households will be surveyed. Focus group discussions will be held in each of the ten sites.
SCOPE OF WORK AND EXPECTED OUTPUT
The consultant will carry out the following tasks:
(a) review the two survey instruments described above with the client, form and train teams of enumerators, carry out a survey pre-test, and work with the client to finalise the questionnaires;
(b) design the survey sample and sampling procedures with the client, within the framework of the ten conservancy and non-conservancy sites described above;
(c) carry out the survey of 1,100 households, and hold ten focus group discussions in the survey sites;
(d) process the data, produce basic statistics describing survey results for the two survey zones, write a report on these results bearing in mind the survey objective, and provide the client with a data-base, compatible with the SPSS statistical package, for further econometric analysis.
The consultant or consultant team will work under the supervision of the Project Management Unit. Progress reports, draft and final reports will be presented in accordance with the Terms of Contract.
TIMING
It is anticipated that the survey instruments will be refined, tested and finalised in early June 2006, and that the main survey will be carried out during June and July. It is expected that the draft report will be submitted in mid August, and that the final deliverables will be submitted by the end of August 2006.
- 39 -
DELIVERABLES
The consultant will provide the following deliverables:
1. Ten hard copies of a draft report with basic statistics describing the survey and the analysis - Submitted on 18 August 2006;
2. Ten hard copies and a CD version of a final report with basic statistics describing
the survey and the analysis in task (d), including an executive summary – Submitted on 31st August 2006 ;
3. A PowerPoint presentation of the main findings of the study, which can be used in follow-up meetings with key decision makers – Submitted on 31st August 2006;
4. An electronic data-base, compatible with the SPSS statistical package, for later use in econometric analysis – Submitted on 31st August 2006.
CONSULTANT PROFILE
The consultancy will be carried out by a suitably qualified firm. The firm will need to be able to deploy a team leader with past experience in managing quantitative field surveys, a technical operative with appropriate qualifications in survey design and analysis, two field coordinators and two training coordinators (may be the same persons for training and field coordination) with appropriate qualifications, eight to 12 field operatives to carry out training and survey, and at least one data entry operative with appropriate skills. The firm will also provide for all transport. Materials and supplies shall be provided by the Project Office.
BUDGET
The budget for the survey consultancy is US$99,811.75. All materials and supplies shall be sources directly from Project Office on a need basis. Proposals should include a detailed budget breakdown within this amount, detailing allocations to personnel and direct expenses. The contract will allow for payment of 20% of the budget on signing of the contract, and 40% on receipt of the draft report (deliverable 1), and the remaining 40% on submission of the final deliverables (deliverables 2, 3, and 4), as approved by the client.
PROPOSAL SUBMISSION
Proposals with details of the consultants’ relevant experience and skills, logistical capacities, proposed methodologies, and a budget should be submitted by the 19th of May 2006, to the Ministry of Environment and Tourism (delivered to Dr Jon Barnes, DEA, 6th Floor, Capital Centre, Levinson Arcade, Independence Avenue, Windhoek, or addressed to Dr Jon Barnes, Directorate of Environmental Affairs, Private Bag 13306, Windhoek; Tel: 061 249 015; Fax: 061 240 339). For more information contact Dr Jon Barnes (Cell: 081 285 7638; E-mail: <[email protected]>) or Ms Marie Karaisl (Cell; 081 2312984; E-mail <[email protected]>.
- 40 -

Consultant’s Understanding of the TOR
Based on the original TOR and the Inception Meeting of 13 June, the TOR and actions to be taken in response were included in the final Inception Report, and are reproduced below. One comment on the TOR is noted in bold, as it refers to the structure of this report.
TOR: A draft questionnaire and a draft focus group discussion instrument have been prepared.
Response: The revised quantitative questionnaire and the focus group discussion instrument were circulated immediately prior to the 13 June Inception Meeting. In discussions at the 13 June Inception Meeting, it was decided that the Consultant would prepare a pre-training version of the quantitative questionnaire for consideration by the Client, following which the training version would be prepared.
Further, the purposes of the focus group discussions were explained at the 13 June meeting. It was noted that a key purpose was to cross-check data coming from the quantitative questionnaire. Another purpose was to supplement quantitative information through qualitative approaches when information at a more ‘macro’ level are required. With particular consideration of the first purpose – to cross-check information – it was agreed that key informant interviews would be conducted instead of focus group discussions. This would allow the holding of discussions with both community leaders as well as opinion leaders well informed about the situation facing poorer households, with twenty key informant interview held versus ten focus group discussions.
However, during the instrument development process, with input from the World Bank data analyst, the existing field instruments were completely revised. The KII was replaced with a community level quantitative questionnaire. All changes thereafter were handled by the client, rather than SIAPAC. SIAPAC’s role was thereafter focused on training and pre-testing, and noting problems that arose at these junctures.
TOR: Carry out a survey pre-test.
Response: At the 13 June Inception Meeting, a pre-test site in Erongo Region was identified. Pre-tests took place in Otjiherero, Damara and Afrikaans in the Tsiseb Conservancy in Erongo Region.. For siLozi, ‘internal’ pre-testing took place among siLozi speaking supervisors and enumerators.
Following pre-testing, final versions of the household and community level questionnaires were prepared, and translated into Otjiherero, Afrikaans, and siLozi.
- 41 -

TOR: Census data.
Response: As noted at the 13 June Inception Meeting, accessing census data from the Central Bureau of Statistics (CBS) has proven to be extremely difficult. MET was therefore asked to secure 2001 census data at the enumeration area and primary sampling unit level, including both household and population data. Maps also needed to be solicited. MET initiated the process of soliciting population data and maps from CBS, after which, in order to streamline the process, the Consultant was put in direct contact with CBS. It should be noted that CBS was very helpful in this regard. Household numbers for each PSU within the conservancy and control areas were collected. Maps showing PSU within each conservancy and control areas were also collected. The major complication occurred with the lack of villages within some PSUs, e.g., the Kasika conservancy PSU maps showed that there was only one village in the entire conservancy. Trainees who are from the Kasika area reported that this was not the case, and that more villages existed. CBS informed the consultant they their database did have information on all villages, and that the list was comprehensive. This raised difficulties for sampling, which is explained below.
TOR: The quantitative sample size was indicated at 1,100.
Response: Based on the TOR this comprised 550 interviews in the north west zone and 550 in the north east zone. Thirty clusters were randomly selected in each of the two zones, yielding a total of sixty clusters across the two locations. With an equal number of interviews conducted per cluster, thirty clusters and nineteen interviews per cluster yields 570 interviews per zone, and 1,140 for the two zones.
However, because of the size and complexity of the field instrument and the inclusion of 68 community level quantitative questionnaire, the Client agreed to reduce the sample size of the household survey to 960 (480 household interviews per zone). In addition, one community level quantitative questionnaire will be administered per PSU, resulting in 68 community level quantitative questionnaires in total. One community level questionnaire will also be administered with conservancy management committee members in each conservancy totalling 8.
The TOR indicated that a probability proportionate to population size sample should be pulled. The Consultant advocated a disproportionate sample size procedure that would allow analysis to occur by sub-location. Based on the Client’s needs, this was followed up by dividing the sample into four strata:
1) conservancy areas in Kunene2) control areas in Kunene3) conservancy areas in Caprivi4) control areas in Caprivi.
Each control area consists of 7 PSUs. All PSUs within control areas were automatically included in the sample. A probability proportionate to population size sample was employed for
- 42 -

conservancy areas. This results in 23 randomly selected PSUs in each conservancy area in each zone. This yields a total of 224 interviews in control areas (112 in each control area) and 736 in conservancy areas (368 interviews in each zone).
TOR: The TOR note that randomly-selected households will be identified ‘making it possible to revisit the same households in future surveys’.
Response: It was noted that the names of these household representatives would have to be kept separately from the results of the survey for ethical reasons.
It was also noted that an expected 20% of the sample could expect to be lost between the baseline and impact assessment.
TOR: The target group for interview is the household head, whether de jure or de facto, as the household is the Unit of Analysis.
Response: The head of household or other senior decision-maker will respond on behalf of the household overall, and the unit of analysis is the household. However, this means that two issues need to be considered:
For some indicators, factual information may not be available to the interviewee, but may be known to other household members. This applies in particular to economic data, where different household members may have varied responsibilities that result in them having varied economic information. Therefore, more than one household member may be the subject of the interview, to collect the necessary factual data.For opinion data, the head of the household, or other senior household decision-maker, will be the focus of the interview, without others present.
TOR: The TOR notes that the Consultant shall “process the data, produce basic statistics describing survey results for the two survey zones .”
Response: Because of the length and complexity of the questionnaires and inclusion of the community level questionnaire, resources had to be shifted internally to accommodate additional training, an extended field effort, and more complex data entry/validation. Resources were therefore shifted away from report writing and to these other activities, e.g., Mr Mouton spent more time in training, Mr. Mouton will spend more time in the field, training was extended by one day, and fieldwork was extended by two days. With this in mind, the Consultant’s responsibilities for report writing is now focused on the presentation of key data. The Consultant will therefore only conduct basic analysis, limited to frequencies and crosstabulations. The report will include:
- 43 -
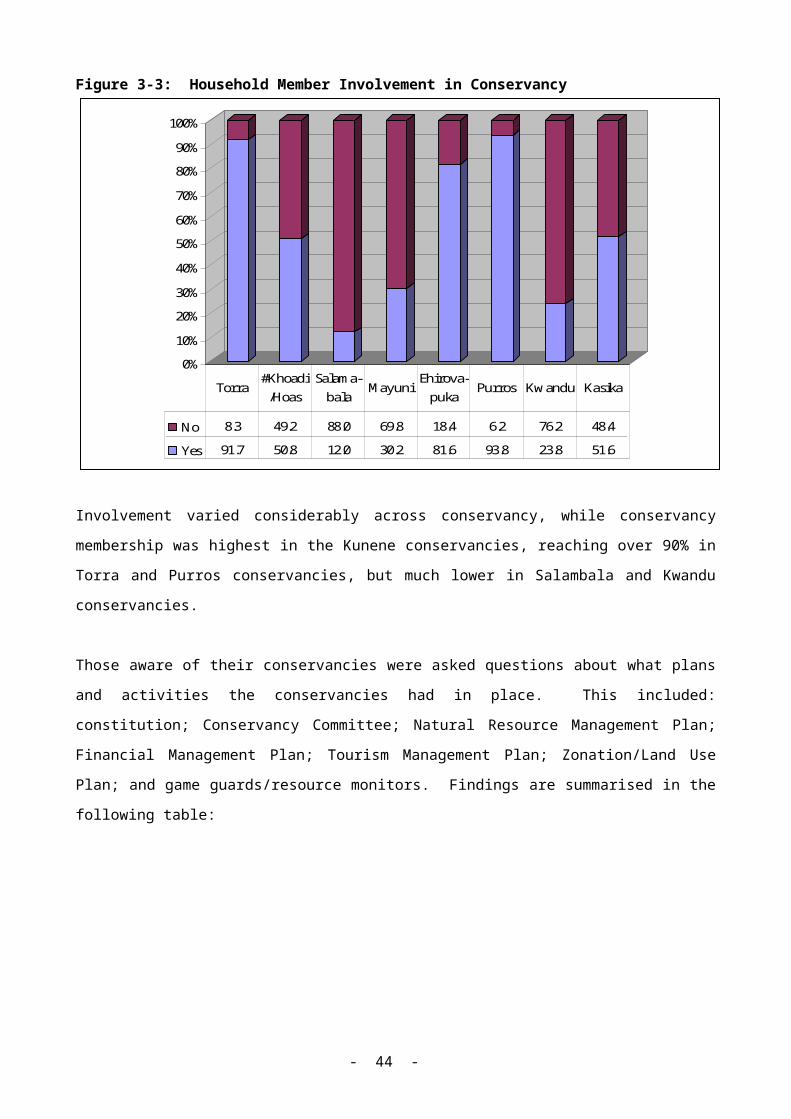
A chapter on methodology.A chapter comprising user friendly presentation of the 8-10 key findings including, for example, frequency, cross tabulation, and difference of means tests on study variables. This chapter would include a few of the key findings from the community questionnaire.An annex containing the two field instruments.
TOR: Concept Note.
Comment/Query: The Concept Note makes reference to links to the previous survey. All such comparisons will be made by the Client.
The Concept Note also makes reference to data from secondary sources and ‘conservancy level data’. Aside from the information collected via key informant interviews, to the extent that such data are available, conservancy level data will be collected by the Client.
The Concept Note is a ‘work in progress’, and therefore elements still lack definition. The Client will be taking the concept note further, in preparation for analysis.
It should be noted that the questionnaire development process was ultimately taken over by the Client, and final designed by the Client.
- 44 -
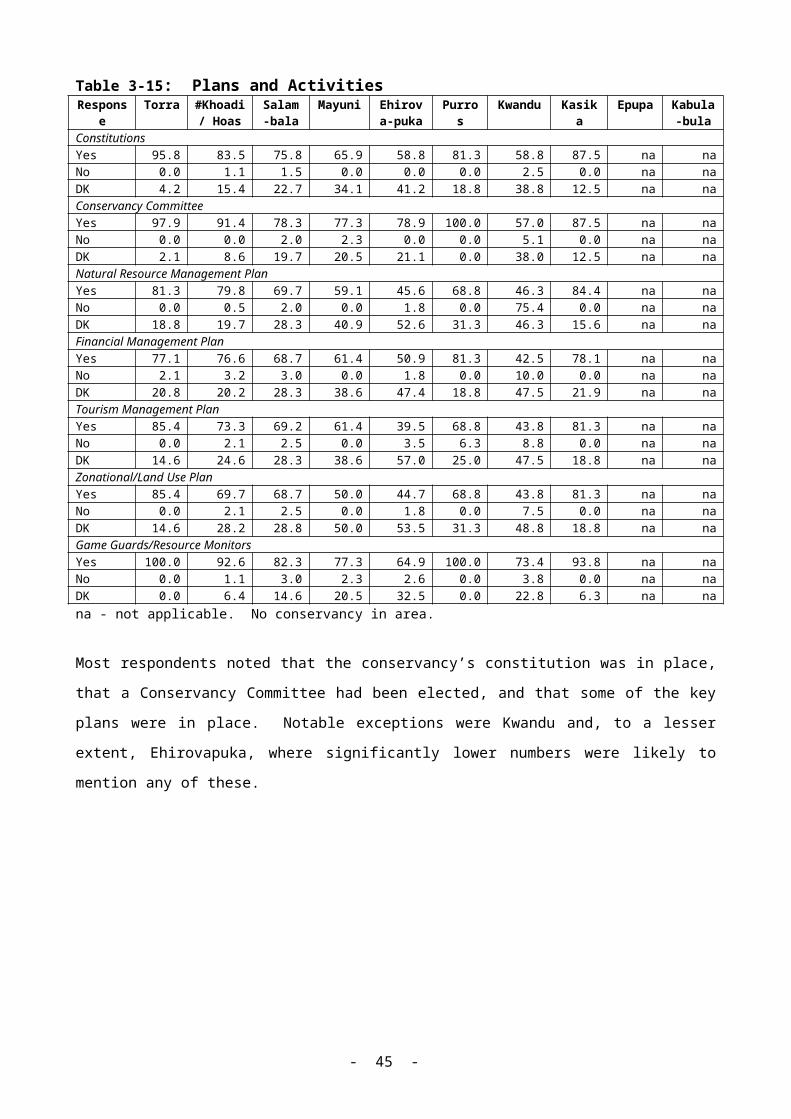
Annex B: Field Instruments
The two field instruments employed for the survey are included following this page.
- 45 -

Questionnaire Number: _________________________VERSION 13- FINAL – 11 July, 2006
ICEMA Socio-Economic Household SurveyPrepared by the Ministry of Environment and Tourism and the ICEMA
Project, with Assistance from SIAPAC and the World Bank, for MET and ICEMA
1) # of Visits: ______________________
2) Enumerator Self Check (field), print surname: ______________________
3) Date questionnaire administered: ______________________
4) Field Supervisor Check (field), print surname: ______________________
5) Date Supervisor Check: ______________________
6) Field Survey Coordinator Check (field), print surname: ______________________
7) Date Survey Coordinator Check: ______________________
8) Field Survey Coordinator Check (office), print surname: ______________________
9) Other Check (field), print surname: ______________________
10) Other Check (office), print surname: ______________________
11) Coding of Open-Ended Responses: ______________________
12) Date Questionnaire Entered ___________________ print surname: ______________________
13) Date Questionnaire Validated ___________________ print surname: ______________________
Supervisor Comments: _____________________________________________________
Data Entry Supervisor Comments: _____________________________________________________________
RESPONDENT CONSENT
ENUM: Please identify the household head of the household to be interviewed. If the household head is not available ask for the alternative decision maker (household head’s spouse) in the household.
Good day, I am _________________(name). I am representing a private institution SIAPAC, which was contracted by the Government of Namibia to do a household survey. I am part of a team of enumerators interviewing people about socio-economic status issues, for people living in rural areas in your region.
You have been selected to participate in this study randomly. The information gathered here will remain confidential. I will not take your full name (just your first name), and you do not have to answer any questions that you do not want to. Your participation in the study is voluntary and you will not be affected in any way if you decide not to participate. If you have questions or concerns after the interview, you may contact Mr. Randolph Mouton at 061-220531, or via post to P.O. Box 90144, Windhoek. If you agree to participate, the interview will take about an hour. We thank you in advance for your patience and your co-operation. May we proceed?
Yes 1 (Continue with the Interview)No 2 (Terminate the interview and substitute)[ENUM: Please circle one to two above]________Interviewer initials
- 46 -

HOUSEHOLD IDENTIFICATION PARTICULARS14. REGION NAME: .. .....Kunene – 1, Erongo – 2, Caprivi – 3 [Enum: For the entire questionnaire, please circle when there is a number and put in the code or value when there is a cell]15. CONSERVANCY NAME: 1 Torra Conservancy 6 Purros Conservancy
2 #Khoadi/Hoas Conservancy 7 Kwandu Conservancy 3 Salambala Conservancy 8 Kasika Conservancy4 Mayuni Conservancy 9 Epupa Emerging Conservancy 5 Ehirovapuka Conservancy 10 Kabulabula
16. COMMUNITY NAME 17. PRIMARY SAMPLING UNIT No.
18. HOUSEHOLD SELECTION STATUS: 1. Originally selected household 2. Replacement household19. IF REPLACEMENT HOUSEHOLD, REASON FOR REPLACING: 1. Refusal 2. Respondent not available 3. Other (Specify) ________________________20. NAME OF HOUSEHOLD HEAD
21. Respondent’s PID No. (if not household head) SERIAL NUMBER FROM HOUSEHOLD ROSTER22. START TIME HOUR MINS
23. FINISH TIME HOUR MINS
24. TOTAL TIME HOURS MINS
- 47 -
SECTION 1: HOUSEHOLD ROSTER [ENUM: Use loose household roster sheet, before you start with this section]
4 5 6 7 8 9 10 11 12 13 14 15
PID
What is the relationship of ……to the head of the household?
[EUNM: REFER TO THE CODES AT THE END OF THE QUESTIONNAIRE]
Is
MALE……..1FEMALE…..2
How old is………now?
RECORD AGE IN COMPLETED YEARS .IF LESS THAN 1 YEAR, RECORD 00
AGE
[ENUM: FOR THOSE AGED 5 YEARS AND ABOVE ONLY]
What was the highest grade…attained?
[EUNM: REFER TO THE CODES AT THE END OF THE QUESTIONNAIRE]
What is ………. main economic activity?
[Eunm: If code is 05 to 15, please skip to question 11]
Who is ………. main employer?
[EUNM: REFER TO THE CODES AT THE END OF THE QUESTIONNAIRE]
To what does …….’s main employer / business relate most? [ENTER MOST IMPORTANT ONLY]
[EUNM: REFER TO THE CODES AT THE END OF THE QUESTIONNAIRE]
Is …. engaged in any other economic activity?YES…..1NO……2=> skip to 15
What is the second economic activity of ……….?
[EUNM: REFER TO THE CODES AT THE END OF THE QUESTIONNAIRE]
Who is ………. second employer?
[EUNM: REFER TO THE CODES AT THE END OF THE QUESTIONNAIRE]
To what does …….’s second main employer / business relate most? ENTER MOST IMPORTANT ONLY]
[EUNM:REFER TO THE CODES AT THE END OF THE QUESTIONNAIRE]
What is ….. ‘s main source of non-farm income?
None ………… ..1Salary/Wage … .2Business 3Gifts/Remittance….4Pensions/Grants … 5Other specify ….....6
1
2
3
- 48 -

SECTION 2: HOUSEHOLD ASSETSINTRODUCTION: I am now going to ask you questions about whether or not your household owns the following items
1 2 3
ASSETS
Does this household own any ……now? 1…. YES 2. …NO => NEXT ASSET.
How many ……. does this household own?
If you were to sell all the…. (s) today, how much would you get?
ADD VALUE (in N$) IF MORE THAN 1]=> NEXT ASSET
1 Plough2 Hoe3 Boat4 Canoe5 Fishing
Equipment6 Bicycle7 Motor
vehicle8 Tractor9 Sledge 10 Grinding/
Hammer Mill
11 Refrigerator 12 Telephone13 Sewing
machine14 Donkey cart15 Donkeys16 Oxen17 Horses 18 Livestock
Equipment 19 Axe20 Gun21 Water
Pumps22 Hand
Hammermills
23 Hand Saw24 Carpentry
Plane25 Wheelbarro
w 26 Furniture27 Television28 Others
Specify
- 49 -
SECTION 3: HOUSEHOLD ACCESS TO FACILITIES
INTRODUCTION: I am now going to ask you questions about distances to various facilities
1 2
Do you know where the nearest …. is located?YES.. 1NO.. 2 >>next facility
How long do you walk/drive from your house to the nearest…………..?
[Enum: Please fill in under the walking or driving columns and not both columns.]
WALKING DRIVING
DAY
HRS
MIN
KMs
1 Shop (including food and groceries)
2 Shop (including food, seeds, fertilizer, agricultural implements)
3 Post office/postal agency
4 Primary School
5 High School
6 Health Facility (Health centre/clinic/hospital)
7 Hammer mill
8 Police station
9 Public transport (road, or rail, or water transport)
10 Public Phone
11 Regional / Constituency Government Offices
12 Main gravel road
13 Tarred Road
14 Agriculture Extension Office / Veterinary Extension office
15 Quarantine Station / Abattoir / Slaughterhouse / Auction Pen
16 Craft Market
17 Open Market
- 50 -

SECTION 4: DAMAGE BY ANIMAL WILDLIFEI would now like to ask you about damage done by wildlife to your household’s property?1 2 3Was any property of your household damaged by wildlife over the pas 12 months? [ENUM: please circle]YES…….1 NO……..2 >> NEXT SECTION
If yes, was …………... damaged?
YES …1NO …..2>> NEXT PROPERTY
Which animals damaged the……… most?
1 Fencing CODE:ANTELOPES (Impala, Wildbeest etc.)….…………1RHINOCEROS …………..2BUFFALOES ….………...3ZEBRAS ………..………..4ELEPHANTS ………...…..5GIRAFFES ..……….…….6HIPPOS ………….….……7WARTHOGS …….………8WILD PIGS ………..….....9MONKEYS ……………...10OTHERS (Specify)………………………...…11…………………….…..…12
2 Buildings / houses
3 Privet Water infrastructure
4 Communal Water Infrastructure
5 Other Property excluding crop and livestock, Specify
- 51 -

SECTION 5: HOUSEHOLD EXPENDITUREINTRODUCTION: I would now like to find out how much money this household spent on different items, as well as how much food was consumed. If you are unsure about expenses please bring in the main caregiver or other person who may be able to provide information.
1 How much was spent on ……………. from July last year until now?[ENUM: Enter school expenditure only for those in PID (Other school expenditure should be taken as remittances]
[GIVE AMOUNT IN N$, IF NONE ENTER ZEROS[NUMBER SHOULD BE WRITTEN OUT WITH ALL DECIMALS, E.G.,N$10,000.00 OR N$150.00]
[ ENUM : Only ask if household has school going children]1. School expenses, including fees, uniforms (including shoes, sock, ties) and contributions other than fees but excluding transport to school
2. Books and stationery
3. Other school expenses2. How much was spent on …….. from July
last year until now?1. Payments to hospital / health centre / surgery (Public)2. Fees to Doctor / Health Assistant / Midwife / Nurse / Dentist, etc. (Private)3. Medicines
4. Fees to Traditional healer ENUM: if No expenses probe for in-kind payments and estimate cash value
3 How much was spent on….from July last year until now? [EXCLUDING SCHOOL UNIFORM] 1. Clothing/Footwear
2. Fabric/material/Tailoring charges
4 How much was spent on….from July last year until now?? 1. Blankets
2. Bed sheets/pillow cases
3. Pillows
5 How much was spent on funeral expenses. from July last year until now?
- 52 -

SECTION 5: HOUSEHOLD EXPENDITURE (CONT’D)ENUM: try to solicit information for the last 1 month OR for the last 3 months, if the respondent feels more confident to know about expenses over this period. [ENUM: Note that ‘0’ is a valid number. If the households did not spent any money, please include ‘0’. Leave blank if the response in not applicable, e.g., if household do not have a vehicle then it will not have vehicle maintenance or repair expenses. In this case leave the cell blank. Also note, that only one response column below should be filled in and not both, depending on whether the expense was incurred in last month or last three months.]6. How much was spent on …….. during June
OR during the April, May and June?[AMOUNT IN N$]Last one month
[AMOUNT IN N$]Last 3 months
1. Home repairs / Mortgage / rent
2. Water
3. Electricity
4. Candles
5. Paraffin/Kerosene
6. Diesel/Gas/Charcoal (for lighting and cooking only)7. Purchased Firewood
8. Telephone (fixed line, tango, telecards, flexicards, contract cell, etc.9. Cable/pay TV (DSTV, CASAT, MNET, SATELITE, NBC) etc.
7. How much was spent on cash remittances during June OR during the April, May and June?
8. What is the cash value of remittances paid in-kind during June OR during the April, May and June?
9. How much was spent on public transport during June OR during April, May and June?1. To and from work
2. To and from school including boarding school and abroad3. To and from nearest town
4. Other transport expenses (to church, to visit, etc)
10. How much was spent on ……. for personal transport during June OR during April, May and June?1. Petrol/diesel/oil
2. Donkey/oxen cart repairs
3. Vehicle / motorbike maintenance and repairs4. Bicycle repairs (tyres, tubes, solution, etc)5. Boat / canoe repairs
- 53 -
SECTION 5: HOUSEHOLD EXPENDITURE (CONT’D)[AMOUNT IN N$]Last one month
[AMOUNT IN N$]Last 3 months
11. How much was spent on …….. during June OR during April, May and June?
1. Toiletries, Cosmetics and Hair dressing (includes bath soap, toothpaste, tissues, shampoos, vaseline, sanitary towels, cotton wool, lotions, complexion creams, make-up, glycerine, perming, shampooing, conditioning, braiding, hair cuts, etc……..) 2. Washing clothes / laundry services (includes detergents, house cleaning materials, such as brooms, mutton cloths, cleaning agents e.g. Ajax, floor cleaners, etc)
3. Domestic worker / Gardener
4. Religious related expenditure such as church bazaar
5. Batteries for radio, torches, watches, telephone, etc.
6. Stamps, parcel post, envelopes, writing pads, etc
- 54 -

SECTION 5: HOUSEHOLD EXPENDITURE (CONT’D)Now I would like to find out about how much this household spent on food and how much was consumed12 What quantity of ………….was purchased during the last one month and how much money was
spent purchase it (total)?
QUANTITYKGs
AMOUNT SPENT IN N$
1. Mealie Meal
2. Maize grain.
3. Bread Flour
4. Grinding expenses……………………………………..THE REST OF THE INFORMATION ON FOOD CONSUMPTION REFERS TO THE LAST 2 WEEKS. PLEASE MAKE SURE THIS IS CLEAR TO THE RESPONDENT.
13 14 15How much was spent on cash purchases of …… in the last 2 weeks? AMOUNT IN N$
How much …..was consumed from own production in the last 2 weeks?ESTIMATED AMOUNT IN N$
How much …..was received through barter or as gifts in the last 2 weeks?ESTIMATED AMOUNT IN N$
1. Cassava
2. Millet/Mahangu
3. Sorghum
4. Rice
5. Sweet Potatoes
6. Potatoes
7. Groundnuts/Ground peas8. Fish
9. Beef (Dried/fresh)
10. Goat meat (Dried/fresh)
11. Sheep meat (Dried/fresh)
12. Pig meat (Dried/fresh)
13. Game meat (Dried/fresh)
- 55 -
13 14 15How much was spent on cash purchases of …… in the last 2 weeks?
AMOUNT IN N$
How much …..was consumed from own production in the last 2 weeks?
ESTIMATED AMOUNT IN N$
How much …..was received through barter or as gifts in the last 2 weeks?ESTIMATED AMOUNT IN N$
14. Chicken and other poultry (Guinea fowl, turkey, ducks, geese, pigeons, rabbits)15. Beans (Dried/fresh)16. Tomatoes
17. Onions
18. Other vegetables (Rape, cabbage, pumpkin leaves, carrots, okra, cucumber, green beans, peas, etc)19. Bread/bread rolls/buns/brochens20. Fruits (Oranges, bananas, pineapples, lemons, avocados, apples, pears, etc)21.Eggs
22. Milk / Sour Milk
23. Milk (Powdered –excluding baby milk)24. Butter/Margarine/ Cheese/jam, etc25. Sugar
26. Honey
27. Salt
28. Cooking oil
29. Non alcoholic beverages (Juices, cool drinks, etc)30. Tea/coffee/cocoa/hot chocolate/milo31. Alcoholic beverages32. Cigarettes/tobacco33. Baby foods (Cerelac/baby milk, etc)34. Edible insects/worms
- 56 -
SECTION 6: LIVESTOCK AND POULTRY OWNERSHIPI would now like to ask you about the livestock and poultry that you own
1 2 3 4
LivestockDid any member of this household own any ….. during the last 12 months?
YES…..1NO……2 >> NEXT ANIMAL
How many …. does this household own now?
Were any of the ……… killed / injured by wildlife in the last 12 months?YES…..1 NO……2 >> NEXT ANIMAL
How many ………. were killed / injured in the last 12 months?
1 Cattle
2 Goats
3 Pigs
4 Sheep
5 Poultry
6 Horses
7 Donkeys / Mules
- 57 -
SECTION 7: LIVESTOCK PRODUCTIONFor each of the livestock that you own we would like to know:
1 2 3 4 5
Livestock
How many …. you consumed from July last year until now.
[ENUM: If household did not own any of the specified livestock below in past 12 months, please go to next item]
How many… you sold and bartered live from July last year until nowIf 0 >> Q4.
How much you earned from these live sales / barters of the ….. (in N$)ENUM: Please estimate the N$ of the barters.
How many …. you slaughtered for sale from July last year until nowIf 0 >> NEXT LIVESTOCK
How much you earned from the sales of these slaughtered ….. (in N$)
1 Cattle
2 Goat
3 Sheep
4 Pig
5 Poultry 6
Donkey7 Horses
6How much income did the household earn from the sale of own produced livestock products such as milk, yoghurt, fat, cheese, hides, eggs, etc in the last 12 months?
7 How much income did the household earn from the sale of cultivated honey, in the last 12 months?
OTHER FARMING INCOME
8How much did the household earn from other farming income (lease of draught animals, tractor, tools, agricultural land, donkey cart, lease of transport for produce, etc.) in the last 12 months?
- 58 -
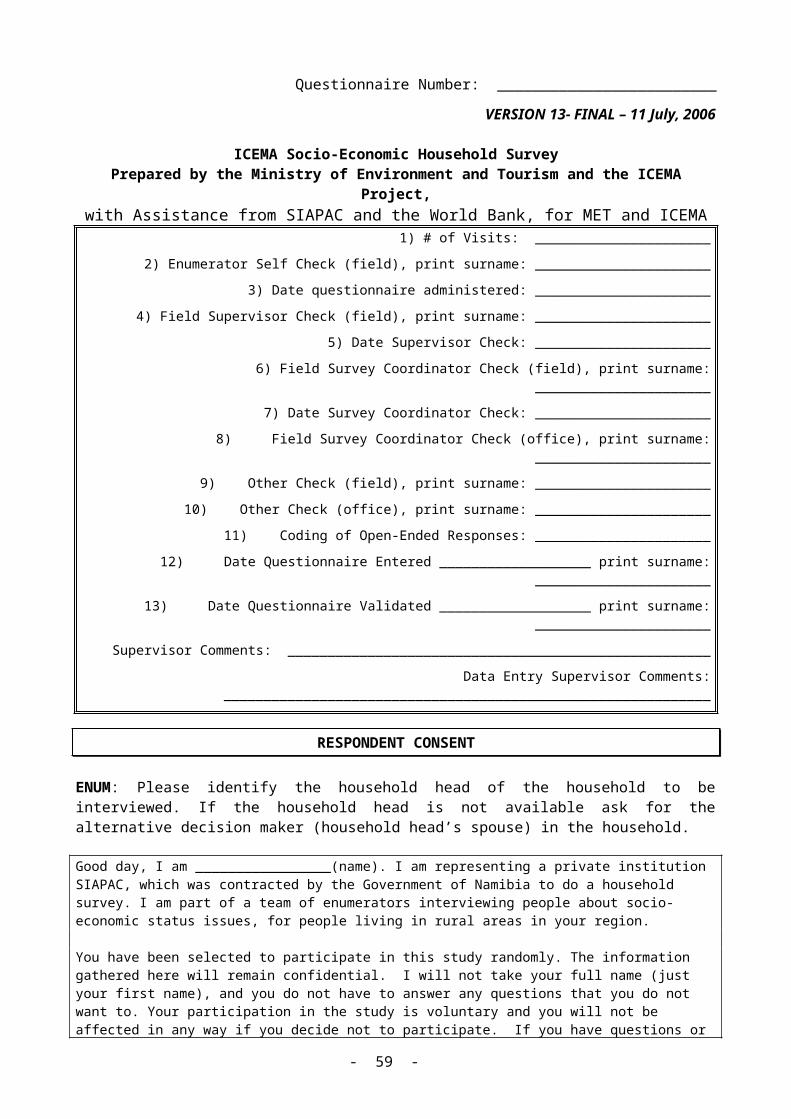
SECTION 8: CROP PRODUCTIONINTRODUCTION: I am now going to ask you questions about Crop Production1. Did any member of this household grow any crops, fruits
and vegetable in the last agriculture (2004/05) season?YES…..1NO……2 >> NEXT SECTION Q5
PRODUCTION
2 3 4 5 6
CROPS
Did any member of this household grow any…… during the last agriculture season?YES ..1NO…2 >> next crop
Area under crop?
ACRE…………………..1HECTARE……………..2SQUARE METERS……3
[ENUM: If less than 1 square meter indicate code 3]
UNIT AREA
What quantity of ….. did all the members of the household harvest?CODES FOR THE UNIT1….. KG2….. 25KG BAG3…..50KG BAG4…..60KG BAG5…..35L CONTAINER6…..NUMBER
UNIT QUANTITY
What quantity of…… did the household sell?
CODES FOR THE UNIT1….. KG2….. 25KG BAG3…..50KG BAG4…..60KG BAG5…..35L CONTAINER6…..NUMBER
UNIT QUANTITY
How much was realised from the sell of……?
[TOTAL VALUE IN N$]
1.Maize2. Mahangu 3. Sorghum4. Beans 5. Groundnuts/ Ground peas6. Spices (chillies) 7. Other 8. Fruit 1: Specify9. Fruit 2: Specify10. Vegetable 1: Specify11. Vegetable 2: Specify12. Other: Specify13. Other: Specify
- 59 -

SECTION 9: CROP DESTRUCTION 1. Were any of the crops, fruits and vegetables your household planted in the last 12 months damaged by wild animals? YES…….1 NO……..2 >> NEXT SECTION [Enum: Please circle one response]
2 3 4If Yes, was….. one of the crops that was destroyed?YES….1 NO….2 >> Next crop
What was the proportion of your field(s) which was destroyed? less than half ……………1half ………….……….…2more than half…….…….3the whole area ….………4
4. Which animals damaged the……… most?
CODE:ANTELOPES (Impala, Wildebeest etc.)….…………………………………..1RHINOCEROS …………………………2BUFALLOES ….……………….……...3ZEBRAS ………..……………….……..4ELEPHANTS ……………….……..…..5GIRAFFES ..………………….….…….6HIPPOS ……………………….….……7WARTHOGS ………………….………8POCUPINE..……………………..….....9MONKEYS …………………………...10OTHERS (Specify)…………………….11[Enum: If other, please specify in the relevant cell below]
1.Maize
2. Mahangu 3. Sorghum4. Beans
5. Vegetables 6. Fruits
7. Spices (chillies) 8. Other
9. Other
10. Other
5.[Enum: If experienced damage to crop or livestock] Where did your household go for help when you experienced crop and/or livestock damage?1……. MET2……. Conservancy Committee3……. Traditional Authority4……. Other. Specify _____________________________________________________
6.1. [Enum: If experienced damage to crop or livestock] Has your household applied for compensation when you experienced crop and/or livestock damage?
1…….Yes2…….No
2. [Enum: If yes to above question] Where did you apply for compensation?1……. MET2……. Conservancy Committee3……. Traditional Authority4……. Other. Specify
SECTION 10: NATURAL RESOURCES WOOD RESOURCESI would like to ask how much all members of your household (combined) collect, sell and receive
- 60 -
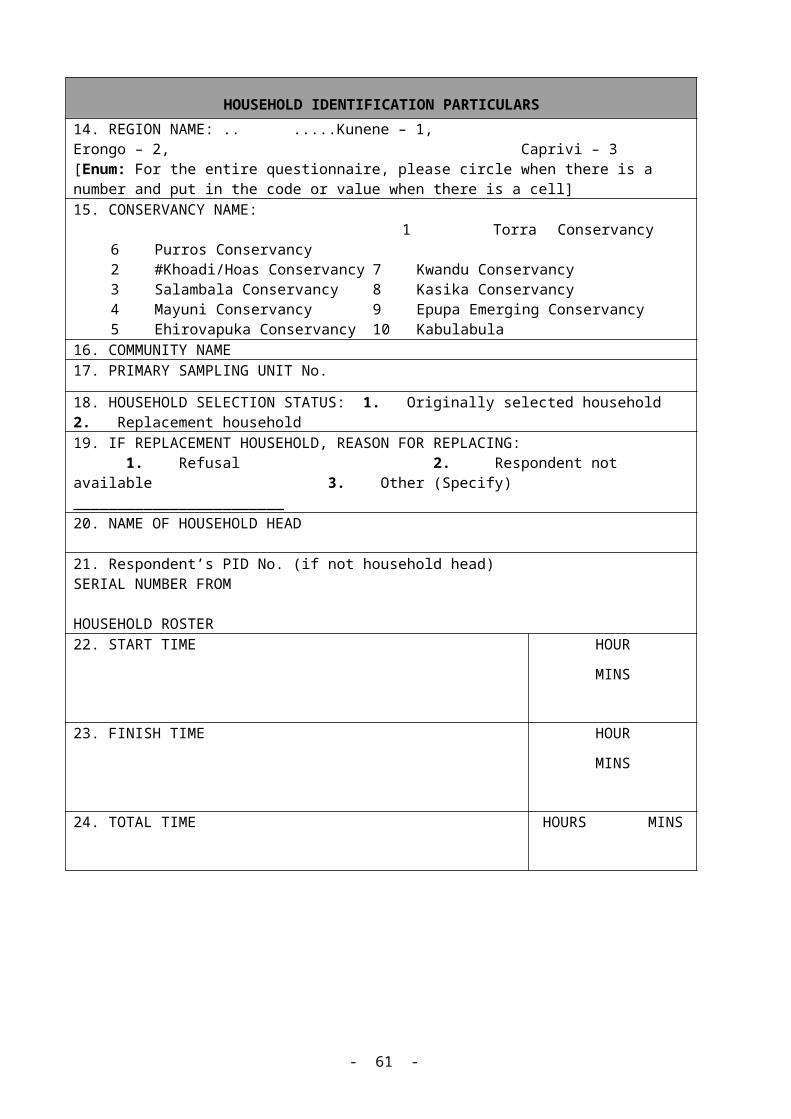
as income from the following sources in the last twelve (12) months: 1 2 3 4Did any member collect …. from July last year until now?
YES ….….1NO……….2 >> NEXT ITEM
How much …was collected over from July last year until now? Number ……….……...1Trees…………….…....2Bundles………….…....3Sledge…………….…..4 Wheel barrow…………5Donkey Cart/ Bakkie….6UNIT QUANTITY
What proportion of the …… did the household sell? CODE None ……………..1 >> NEXT ITEMLess than Half ……2Half ……………....3More than Half …...4All …………….….5
3. How much did all members of your household (combined) receive as income from the sale of …….. in from July last year until now?
AMOUNT in N$
1. Timber
2. Poles
3. Thin Poles
5. Firewood
6Wood for Crafts
7 Other, Specify
- 61 -

SECTION 10: NATURAL RESOURCES (Continued) FISH
I would like to ask you about what types of animals has the household hunted / harvested in the past 12 months:
5 6 7 8Did any member catch …. from July last year until now?
YES ………….1NO………...….2 >> NEXT ANIMAL
How many … were caught from July last year until now?
NUMBER………….……1CATCHES……………...2
UNIT QUANTITY
What proportion of the …… did the household sell? CODE None …………………..1 >> NEXT ANIMALLess than Half …...……2Half ……………….…..3More than Half ……….4All ………………….…5
3. How much did all members of your household (combined) receive as income from the sale of …….. in from July last year until now?
AMOUNT in N$
1 Fish
- 62 -

SECTION 10: NATURAL RESOURCES (Continued) WILD FOODSI would like to ask you about what types of wild foods members of this household harvested in the past 12 months:
9 10 11 12Did any member harvest…. from July last year until now?
YES ….….1NO……….2>> NEXT ITEM
How much … was collected from July last year until now?UNIT CODENumber ………………….1Handfuls…….……..…….2Bundles ……………..…..3Litres……………….…...420 litre tins……….……..5Cups……………….……612.5KG bag…………….725KG bag………………850KG bag…………...….9Kilograms………..……10
UNIT QUANTITY
What proportion of the …… did the household sell? CODE None …………..…..1 >>NEXT ITEMLess than Half ….…2Half ………………..3More than Half ……4All …………………5
3. How much did all members of your household (combined) receive as income from the sale of …….. from July last year until now?
AMOUNT in N$
1 Greens/Leaves
2.
Roots/Tubers
3 Edible Ants
4 Wild Fruits
5 Wild Honey
6 Mushrooms
7 Other edible forest products
- 63 -

SECTION 10: NATURAL RESOURCES (Continued) MEDICINAL PLANTSI would like to ask you about what types of medicinal plants members of this household harvested in the last 12 months:
13 14 15 16Did any member collect ……….in the last 12 months:
YES ….….1NO……….2 >> NEXT ITEM
How much … was collected over the past 12 months? UNIT CODENumber …………………….1Handfuls…………..…….….2Bundles …………………….3Litres……………………….420 litre tins………………....5Cups……………………..…612.5KG bag…………….….725KG bag……………….…850KG bag………………….9Kilograms…………………10UNIT QUANTITY
What proportion of the …… did the household sell? CODE None …………….….. 1>> NEXT ITEMLess than Half ….…2Half ………………..3More than Half ….…4All ……………….…5
3. How much did all members of your household (combined) receive as income from the sale of …….. in the last twelve (12) months?
AMOUNT in N$
1.
Medicinal Barks
2.
Medicinal Roots
3 Medicinal Leaves
4Medicinal Stem
5Whole Medicinal Plants
6 Other medicinal products
7 Other ……………………
- 64 -
SECTION 10: NATURAL RESOURCES (Continued) NON-TIMBER VELD / FOREST PRODUCTSI would like to ask you about How much did all members of your household (combined) collect, sell and receive as income from the following sources in the last twelve (12) months:
17 18 19 20Did any member collect …….….in the last 12 months:
YES ….….1NO……….2>>NEXT ITEM
How much … was collected over the past 12 months?
BUNDLES…………..1DONKEY CARTS/ BAKKIE…………….2SLEIGHS……………3
UNIT QUANTITY
What proportion of the …… did the household sell? CODE None ………….…. 1>>NEXT ITEMLess than Half ……2Half …………..…..3More than Half ..…4All ………………5
3. How much did all members of your household (combined) receive as income from the sale of …….. in the last twelve (12) months?
AMOUNT in N$
1. Thatching grass
2. Palm Leaves
3. Reeds
4. OTHER
SECTION 11 RESOURCE USE IN AREA
1. Are you aware of any restrictions on the use of …… within your area?
1. Land YES…………1NO……….….2
2. wildlife YES…………1NO……….….2
3. other resources
YES…………1NO……….….2
2. [ENUM: If yes to 1] Do these restrictions stop you from using …….. the way you want to?
1. Land YES…………1NO……….….2
2. wildlife YES…………1NO……….….2
3. other resources
YES…………1NO……….….2
3. Do you find these restrictions beneficial to you?YES…………1NO……….….2
- 65 -
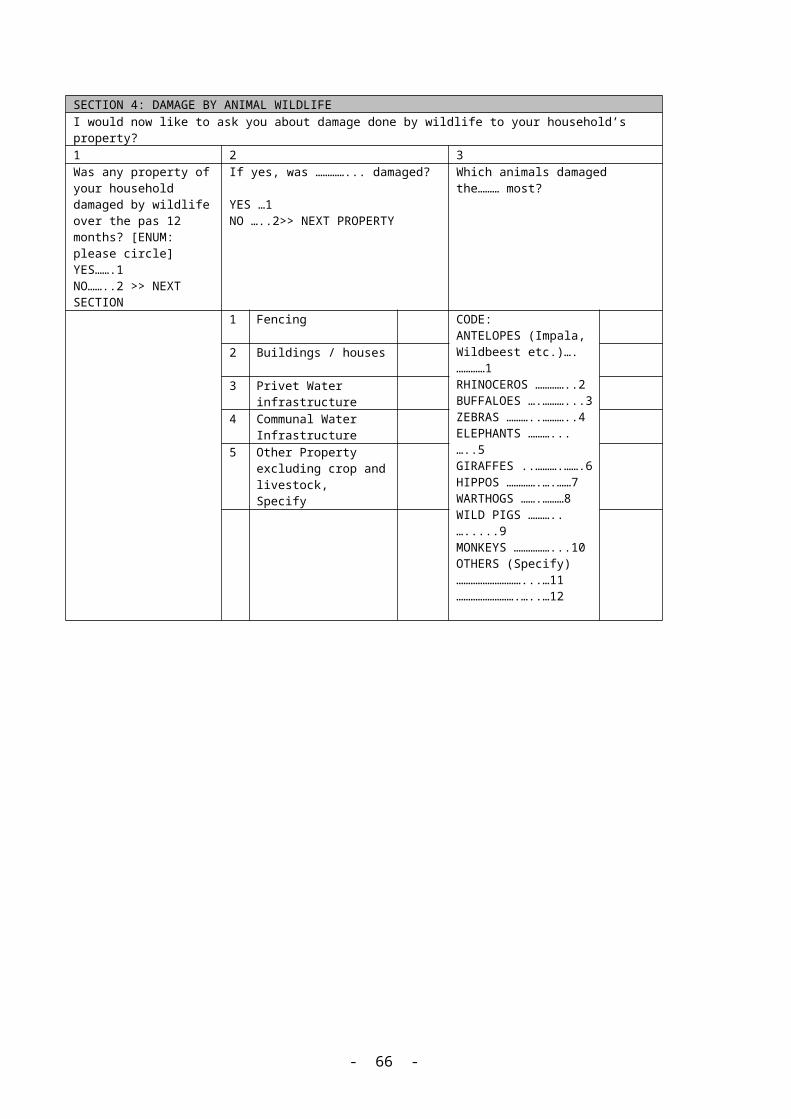
SECTION 12: HOUSEHOLD PARTICIPATION IN CBNRMINTRODUCTION: I am now going to ask you questions about household participation in CBNRM activities
1 2 3 4 5 6
CBO
Is any member of this household a member of a …..?
YES ...1NO…..2 >> NEXT CBO
How long has the longest serving member been a member of this …..?IN MONTHS
Has this member made any in-kind / cash contributions to the CBOYES…….1NO……..2 >>SKIP TO Q5
How much did member(s) pay as cash or in-kind contribution for this club in last 12 months?
Did the household receive any cash or in-kind contribution from …… during the last 12 months?
Yes…..1No……2 Next CBO
How much cash or in-kind contribution did this person(s) receive from the …….. during the last 12 months?
1. Community Forest 2. Community Fish Pond 3. Fishing Group4. Funeral Society 5. Beer-making Group 6. Farmers / Agro Group 7. Women’s Group 8. Credit Group 9. Peer Educators 10. Drama Group 11. Football Group12.Woodcarving Group 13. Basket Group 14. Other Crafts Group 15. Beekeeping Group16. Waterpoint Committee17. Other (specify)
- 66 -
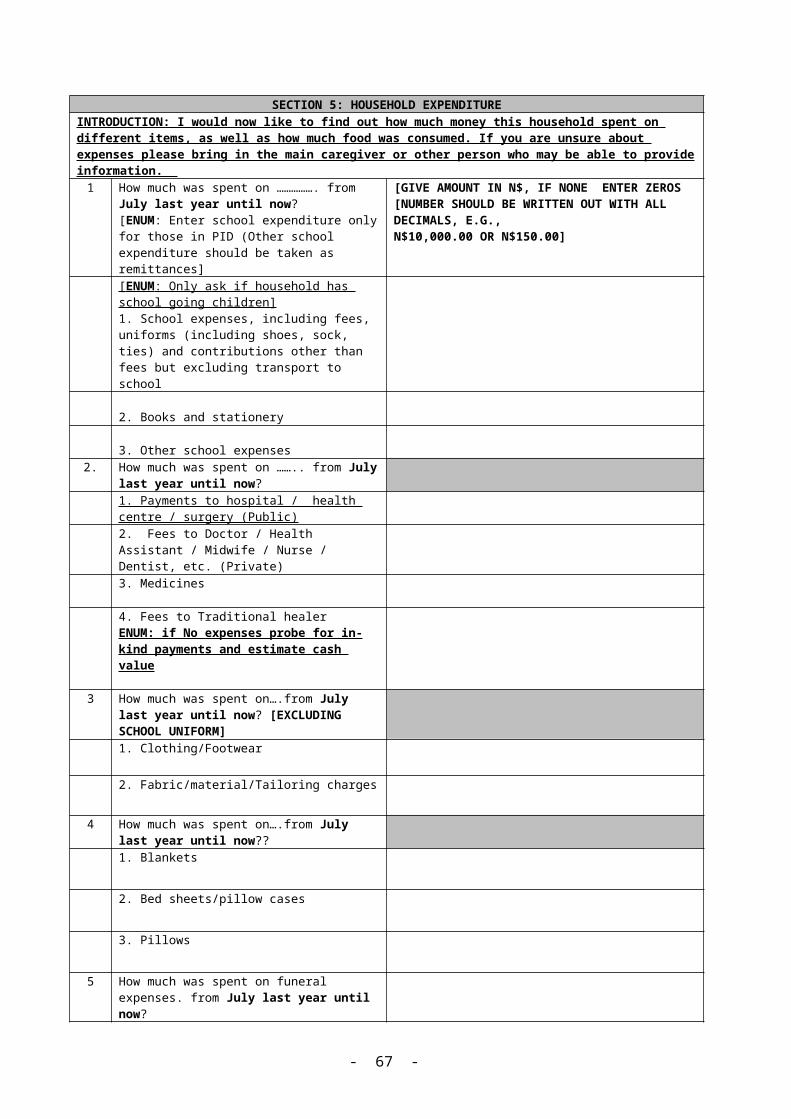
SECTION 13: PARTICIPATION IN CONSERVANCYNO. QUESTION CATEGORY
1 Is there a conservancy in the area? Yes………………….1No…………………..2 [ENUM: END OF INTERVIEW]
2 Could you tell me the name of the conservancy Name stated…___________________________________
Correct…………...….1Incorrect………...…..2Don’t know……….....3
3 Could you tell me in what year this conservancy was established
Year Stated ____________________________________
Correct…………...….1Incorrect…………......2Don’t know……….....3
4 Is anyone in this household registered as a member of the conservancy
Yes……………….….1No……………….…...2
5 If yes to No.4, how many Nr of members
6 Does the conservancy have …..1. Constitution Yes…………………..1
No………...…………2Don’t know……….....3
2. Conservancy Committee Yes…………………..1No………...…………2Don’t know……….....3
3. Natural Resource Management plan Yes…………………..1No………...…………2Don’t know……….....3
4. Financial Management Plan Yes…………………..1No………...…………2Don’t know……….....3
5. Tourism Management Plan Yes…………………..1No………...…………2Don’t know……….....3
6. Zonation / Land Use Plan Yes…………………..1No………...…………2Don’t know……….....3
7. Game Guards / Resource Monitors Yes…………………..1No………...…………2Don’t know……….....3
7 Were any of the household members involved in the development of ….1. Constitution Yes…………………..1
No………...…………2Don’t know……….....3
2. Natural Resource Management plan Yes…………………..1No………...…………2Don’t know……….....3
3. Financial Management Plan Yes…………………..1No………...…………2Don’t know……….....3
4. Tourism Management Plan Yes…………………..1No……………………2Don’t know…………..3
5. Zonation / Land Use Plan Yes…………………..1No………...…………2Don’t know……….....3
8 If none of the household members have been involved, what was the main reason none of household members are registered …………..1lack of time …………….2distance to travel………..3 notified too late………….4 Not notified at all……...…5 Other, specify………….…6
- 67 -

SECTION 14: HOUSEHOLD BENEFITS FROM CONSERVANCY INTRODUCTION: I am now going to ask you further questions on the conservancy
Col. A Col. BNO. QUESTION CODE
Yes…..1No…....2
if yes, total estimated cash income / expenditure
1. Has / is any member of your household been employed by the conservancy over the past 12 months?
2. Has anyone in your household received a non-cash / in-kind dividend from the conservancy over the past 12 months meat, natural resources?)
3 Has anyone in your household received cash dividends from the conservancy over the past 12 months?
4 Has anyone contributed in-cash towards the conservancy in the 12 months?
5 Has anyone contributed in-kind towards the conservancy in the past 12 months?
6 Have there been community-level pay-outs from the conservancy in the past 12 months? [ENUM: This means money given to the community by the conservancy for community projects]
7 If yes, what were these pay-outs used for?
[ENUM: Circle all that apply. Then write amount in N$ in next column
Community business …..1School ………………….2Feeding programme…...….3Infrastructure ……….....4Waterpoint…………..…5Other, specify ………….6
8. Has anyone in your household received training through the conservancy since it was established? Yes ………..1 No ……………..2 [ENUM: If no, please skip to 12]
9 10 11PID If yes, what type of
training has ….. received? Natural resource Mgt………1financial mgt …………....2tourism training ……….….3other business / enterprise .4Other ……………………...5Combination of above…..6
In what form was the training provided Workshop/Classroom ..1Short Course………..2Practical / on the job…. 3Exchange visit ……..4Other, specify………5Combination of above ..6
For how many days did the training last?
NUMBER OF DAYS
12. In the last three years has the conservancy implemented any developmental activities in this area?
YES………………...…………………………………....1NO……………………………………………………….2 Ship to Q 14
13. Has this benefited your household in anyway?
YES………………………………………...……….…...1NO…………………………………………..…………....2
14. In the last three years has the conservancy formed any Clubs / Trusts / Groups in this area?
YES..………………………………………….………….1NO…………………………………………….………….2 >> END
15. Has this benefited your household in anyway?
YES………………………………………………….…...1 NO…………………………………………………..…...2
- 68 -
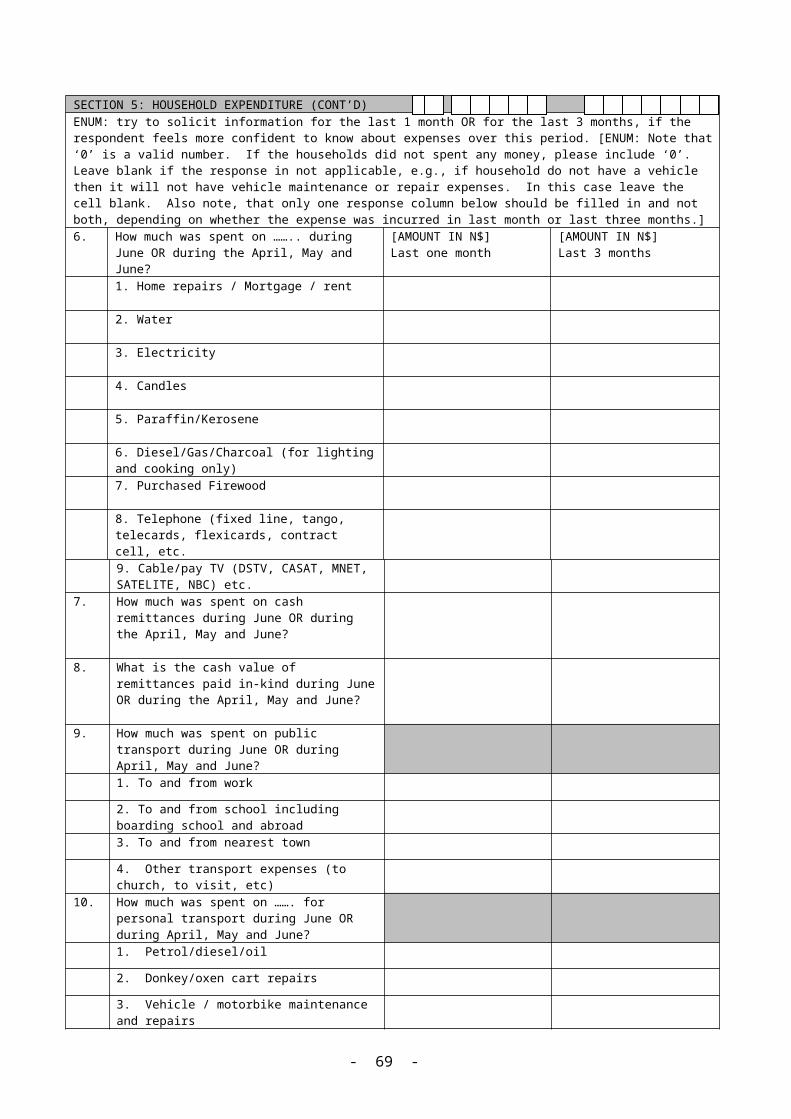
ENUM: PLEASE THANK THE RESPONDENT FOR HIS/HER TIME.
16. Level of Cooperation: 1 High ………………..2 Medium ………………… 3 Low
THE END OF INTERVIEW
- 69 -
SECTION 1: HOUSEHOLD ROSTERINTRODUCTION: I would like to start the interview by asking you questions about yourself and the usual members of the household: 1 2 3SERIAL NUMBER OF HOUSEHOLD MEMBER (PID)
Please give me the names of all persons who usually live with this household, meaning all household members who share the same ‘pot’ for meals on a regular basis. Start with the head of the household and exclude visitors. Include usual members, who are away visiting, in hospital, at boarding schools or college or university etc. Also include visitors who have lived with the household for six months or more.
AGE
1
2
3
4
5
6
7
8
9
10
11
12
13
14
15
16
17
18
19
20
21
22
23
24
25
- 70 -

Codes for section 1Relationship Code for Section 1 Question 4
Education Code for Section 1 Question 7
Economic Activity Codes Employer Code Employer’s Business Code
relationship to the head of the householdHEAD……………..………….…………01SPOUSE.……………….……………….02OWN CHILD………….………….….....03STEP CHILD………….…………..….....04GRAND CHILD………...…….…...……05BROTHER/SISTER……..………..…….06NIECE/NEPHEW….……..………..……07BROTHER/SISTER-IN LAW.……….....08PARENT…………………………..….…09PARENT-IN-LAW…….…………..……10OTHER RELATIVE………………..…...11MAID/NANNY/HOUSE-SERVANT…..12NON-RELATIVE….……………………13COUSIN…………………………………14AUNT/UNCLE………………………….15
– 1993 1993 – Date
CODES To
enter
What is ………. main economic activity?WAGE EMPLOYMENT ALL YEAR…………………….01SEASONAL ………………02OWN BUSINESS RUNNING A BUSINESS/SELF EMPLOYED………….……03EMPLOYED IN FAMILY BUSINESS………………….04WITHIN HOUSEHOLD LIVESTOCK …………………………….05CROPPING……………...06FISHING……………......07NATURAL RESOURCE HARVEST & PROCESSING 08RETIRED (WITH PENSION)………………09NOT WORKING BUT LOOKING FOR WORK…..10NOT WORKING AND NOT LOOKING FOR WORK …..11FULL TIME LEARNER / STUDENT………………12 UNPAID FAMILY WORKER………….............13TOO OLD TO WORK (without pension) ............................14OTHER (SPECIFY)………………15
Who is ………. main employer?
SELF EMPLOYED…01CENTRAL GOVT ……..…… 02REGIONAL GOVT ……03 PARASTATAL..04PRIVATE SECTOR NON TOURISM ..….05PRIVATE SECTOR TOURISM….06NGO …..……07CBO………...08PRIVATE HOUSEHOLD (not own)……..09OTHER SPECIFY)…..10
COMMUNITY CAMPSITE... ………………….. 01PRIVATE LODGES AND CAMPS ………………02TROPHY HUNTING …………………………...03GAME / WILDLIFE VIEWING ………………...04RECREATIONAL FISHING ……. ……….. …...05CRAFTS PRODUCTION………………………..06TOUR GUIDING……………………………...07CULTURAL TOURISM ………...……………08NONRECREATIONAL FISHING…………...09COMMERCIAL AGRICULTURE…………10COMMERCIAL LIVESTOCK PRODUCTION…11AGRIC PRODUCT PROCESSING…………...12TIMBER/ POLE COLLECTING…………….13FUELWOOD COLLECTING ……..………...14GATHERING VELD FOODS ………………. 17OTHER TOURISM / WILDLIFE / FOREST RELATED (SPECIFY)…………………………18CONSERVANCY MANAGEMENT (Game Guards, Committee, Financial Management, etc)……19ANY OTHER ACTIVITY (SPECIFY)…20
Never attended school
00
SUB Std A
Grade 1 01
SUB Std B
Grade 2 02
Standard 1
Grade 3 03
Standard 2
Grade 4 04
Standard 3
Grade 5 05
Standard 4
Grade 6 06
Standard 5
Grade 7 07
Standard 6
Grade 8 08
Standard 7
Grade 9 09
Standard 8
Grade 10 10
Standard 9
Grade 11 11
Standard 10
Grade 12 12
National Certificat
e
13
National Diploma
14
Bachelor Degree
15
Masters and
Above
18
- 71 -

ICEMA Socio-Economic Household SurveyLocal Level
Community Level Instrument
Prepared by the Ministry of Environment and Tourism and the ICEMA Project, with Assistance from SIAPAC and the World Bank, for MET and ICEMA
1 Region ____ - 1 Kunene____ - 2 Erongo____ - 3 Caprivi
2 Conservancy ____ - 1 Torra____ - 2 #Khoadi/Hoas____ - 3 Salambala____ - 4 Mayuni____ - 5 Ehirovapuka
____ - 6 Purros____ - 7 Kwandu____ - 8 Kasika____ - 9 Epupa____ - 10 Kabulabula
3 Community Specify:
4 Category ____ - 1 conservancy committee members____ - 2 traditional leaders____ - 3 community activists
6 LLKII Interviewer
7 Date and Time Date:
Start Time: _______ Finish Time: _______ Total Time: _________________8 Co-operation
____ - 1 high ____ - 2 medium ____ - 3 low9 Person & Date
Note Rewriting10 Person and
Date of Final Check
11 Person and Date Entered
12 Person and Date Checked
13 Person & Date Translated
14 Person & Date Compiled

SECTION 1: Composition of InterviewI would first like to ask you about your own background and in what position you are representing your community in this area today?
1 2 3
Sex Female …..1Male ……..2
In what position do you represent the community?Conservancy committee member.......................1Traditional leader...............................................2Community activists...........................................3Other, specify.....................................................4
May I ask how old you are?
Age in YearsKI 1
KI 2
- 73 -
SECTION 2: PHYSICAL INFRASTRUCTURE AND COMMUNITY INVOLVEMENTI would like to find out about infrastructure developments in this area. If there are buildings or places which were constructed in several steps and financed by several organisations please list them all. Enum: As some of the infastructure may have parts which were constructed / added through different projects in different years, there are multiple options for each of the types of infrastructure. For those which are in the community probe whether parts were added in later years and fill in as appropriate.
1 2 3 4 5
S/N
Type of infrastructure
Is there any… in this Community?YES….1 NO.….2
>> NEXT ITEM
Which organisations financed / the construction of this/these ……?GRN ..........................1IRDNC .......................2NNF...........................3RISE...........................4ICEMA........................5WWF-LIFE .................6Save the Rhino Trust..7Conservation International..............8World Food Programe9 Mud Hut Trading.....10Other NGO...............11Conservancy.............12Other CBO................13Donor.......................14An individual ...........15Other institution (specify below)......................16Don’t know ..............17
In which year did this organization start the construction of ……?
Did the community contribute in any way to the construction of …..?
Yes, Labour only.............1Yes, Materials only.........2Yes, Cash only................3Yes, Labour and materials .......................................4Yes, Labour and cash ....5Yes, Materials and cash 6Yes, Labour, materials & cash................................7Nothing..........................8Other (specify)
In what state is……?
See codes below
1 Primary school – classrooms block
2 Primary school - staff houses
3 Secondary school- classrooms
4 Secondary school - staff houses
CODES FOR Q5: In what State is ….?New or functional needing no repair..................................................................1Functional but needs some repair........................................................................2Dilapidated, unusable without repair...................................................................3Unusable, under construction or repair...............................................................4
- 74 -
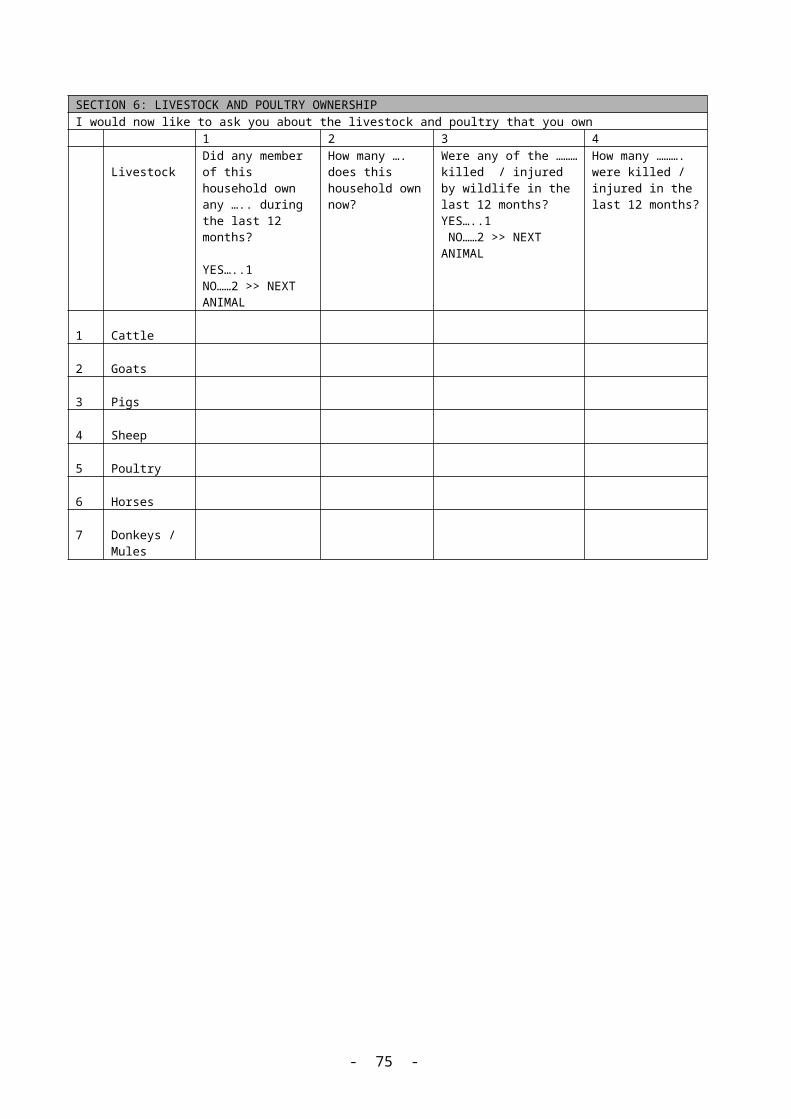
SECTION 2: PHYSICAL INFRASTRUCTURE AND COMMUNITY INVOLVEMENT (continued) 1 2 3 4 5
S/N
Type of infrastructu
re
Is there any… in this Community?YES….1 NO.….2
>> NEXT ITEM
Which organisations financed / the construction of this/these ……?GRN ..........................1IRDNC .......................2NNF...........................3RISE...........................4ICEMA........................5WWF-LIFE .................6Save the Rhino Trust..7Conservation International..............8World Food Programe9 Mud Hut Trading.....10Other NGO...............11Conservancy.............12Other CBO................13Donor.......................14An individual ...........15Other institution (specify below)......................16Don’t know ..............17
In which year did this organization start the construction of ……?
Did the community contribute in any way to the construction of …..?
Yes, Labour only.............1Yes, Materials only.........2Yes, Cash only................3Yes, Labour and materials .......................................4Yes, Labour and cash ....5Yes, Materials and cash 6Yes, Labour, materials & cash................................7Nothing..........................8Other (specify)
In what state is……?
See codes below
5 Health centre
6 Health staff houses
7 Open Market
8 New gravel road
9 Gravel road graded
10 Road tarred
- 75 -
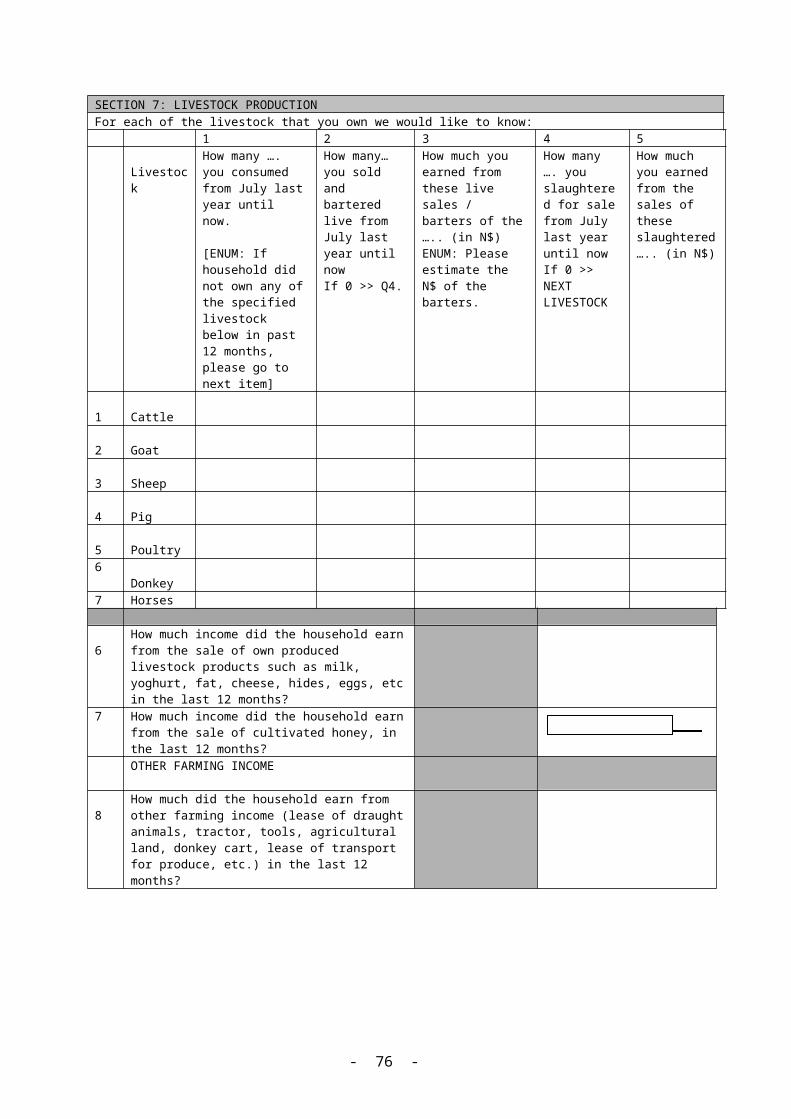
CODES FOR Q5: In what State is ….?New or functional needing no repair..................................................................1Functional but needs some repair........................................................................2 Code Continues -
SECTION 2: PHYSICAL INFRASTRUCTURE AND COMMUNITY INVOLVEMENT (continued)
1 2 3 4 5
S/N
Type of infrastruct
ure
Is there any… in this Community?YES….1 NO.….2
>> NEXT ITEM
Which organisations financed / the construction of this/these ……?GRN ......................1IRDNC ...................2NNF.......................3RISE.......................4ICEMA....................5WWF-LIFE ............6Save the Rhino Trust...............................7Conservation International..........8World Food Programe..............................9 Mud Hut Trading. 10Other NGO...........11Conservancy........12Other CBO...........13Donor...................14An individual .......15Other institution (specify below).....16
In which year did this organization start the construction of ……?
Did the community contribute in any way to the construction of …..?
Yes, Labour only........1Yes, Materials only.....2Yes, Cash only............3Yes, Labour and materials ...................4Yes, Labour and cash 5Yes, Materials and cash ...................................6Yes, Labour, materials & cash........................7Nothing......................8Other (specify)
In what state is……?
See codes below
11 Conservancy office
12 Tourist Lodge
13 Community Campsite
14 Hunting Camp
15 Craft Stall / Centre
- 76 -

CODES FOR Q5: In what State is ….? (Conitunedfrom bottom of previous page)Dilapidated, unusable without repair...................................................................3Unusable, under construction or repair...............................................................4
SECTION 2: PHYSICAL INFRASTRUCTURE AND COMMUNITY INVOLVEMENT (continued) 1 2 3 4 5
S/N
Type of infrastructu
re
Is there any… in this Community?YES….1 NO.….2
>> NEXT ITEM
Which organisations financed / the construction of this/these ……?GRN ..........................1IRDNC .......................2NNF...........................3RISE...........................4ICEMA........................5WWF-LIFE .................6Save the Rhino Trust..7Conservation International..............8World Food Programe9 Mud Hut Trading.....10Other NGO...............11Conservancy.............12Other CBO................13Donor.......................14An individual ...........15Other institution (specify below)......................16Don’t know ..............17
In which year did this organization start the construction of ……?
Did the community contribute in any way to the construction of …..?
Yes, Labour only.............1Yes, Materials only.........2Yes, Cash only................3Yes, Labour and materials .......................................4Yes, Labour and cash ....5Yes, Materials and cash 6Yes, Labour, materials & cash................................7Nothing..........................8Other (specify)
In what state is……?
See codes below
16 Borehole
17 Water Point
18 Dip tank (public)
19 Other (specify)
20 Other (specify)
- 77 -

CODES FOR Q5: In what State is ….?New or functional needing no repair..................................................................1Functional but needs some repair........................................................................2Dilapidated, unusable without repair...................................................................3Unusable, under construction or repair...............................................................4
- 78 -
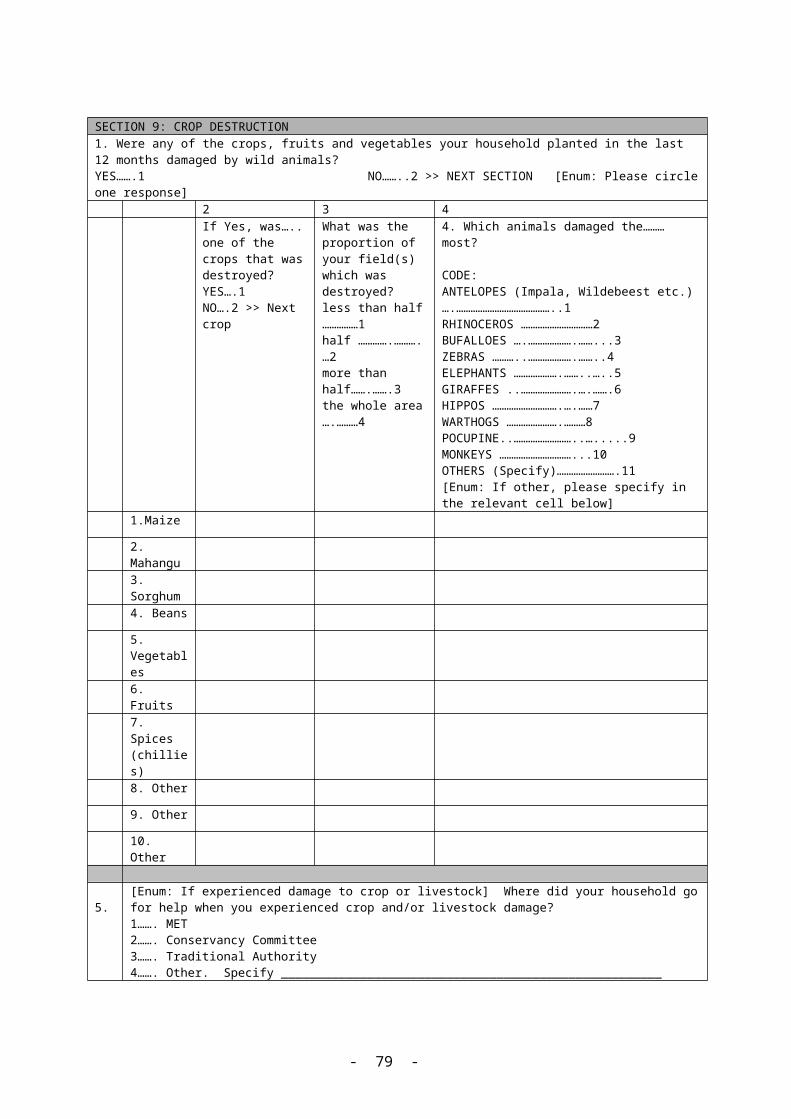
SECTION 3: NGO INVOLVEMENT
I would like to ask about NGOs and their activities.
1 2 3 4 5 6 7 8
S/N
NGOs Is …. active in this community?YES….. 1 >>Q2NO ……2 >> Next NGO
Since which year has ……. been active in the community?
Does ….. support any User Groups?YES….. 1 >>Q4NO ……2 >> Q 5
What is the most important type of User Group supported by….. ?
See codes below
Does ….. support any Income Generating Activites?YES….. 1 >>Q6NO ……2 >> Q 7
What is the most important Income Generating Activity supported by ….. ?See codes below
Does ….. support any Training Activities?YES….. 1>>Q8NO ……2 >> Next NGO
What is the most important Training Activity supported by….. ?
See codes below
1 IRDNC
2 NNF
3 RISE
4 ICEMA
5 WWF-LIFE
6 Save the Rhino Trust
7 Conservation International
8 World Food Programme
9 Mud Hut Trading
10
Other, specify
11
Other, specify
12
Other, specify
Codes for Question 3: Most important type of user group
Codes for Question 5: Most important income generating activities
Codes for Question 7: Most important training activity
Funeral Society.....................1Beermaking Group................2Farmers / Agro Group...........3Women’s Group ....................4Credit Group ........................5Peer Educators.....................6Drama Group ......................7 Football Group ....................8 Woodcarving Group.............9 Basket Group ....................10 Other Crafts Group ............11Beekeeping Group .............12Fishing Group ....................13
Livestock management ...........1Livestock marketing ...............2Agricultural marketing............3Agricultural processing...........4Tourism Development .............5Business development (general).................................................6Tailoring..................................7Carpentry.................................8Black smithing.........................9Kniting...................................10Crafts.....................................11Other (specify).......................12
Financial Management Training....1Business / Enterprise Training ......2Natural Resource Management Training ........................................................3Tourism Training ...........................4Other, specify ...............................5
- 79 -

SECTION 4: CBOs
I would like to ask about community groups and activities:
1 2 3 4 5 6 7
S/N
GROUP
Is there a …. Active in this community?YES…..1 NO……2 >> NEXT GROUP
How many members does this….. (group) have?
No. OF MEMBERS
In which year was this…… started?
YEAR
Are any community members employed by…….?YES………….1 NO…………..2 >>Q6
How many people are employed by ………….?
NUMBER
Does the ….. generate income?
YES……1 NO……..2 >> Next CBO
How much income did the …… generate over the past 12 months?
1 Funeral Society
2 Beermaking Group
3 Farmers / Agro Group
4 Women’s Group
5 Credit Group
6 Peer Educators
7 Drama Group
8 Football Group
9 Woodcarving Group
10 Basket Group
11 Other Crafts Group
12 Beekeeping Group
13 Fishing Group
14 Community Forest
15 Community Fish Pond
16 Water Point Committee
- 80 -
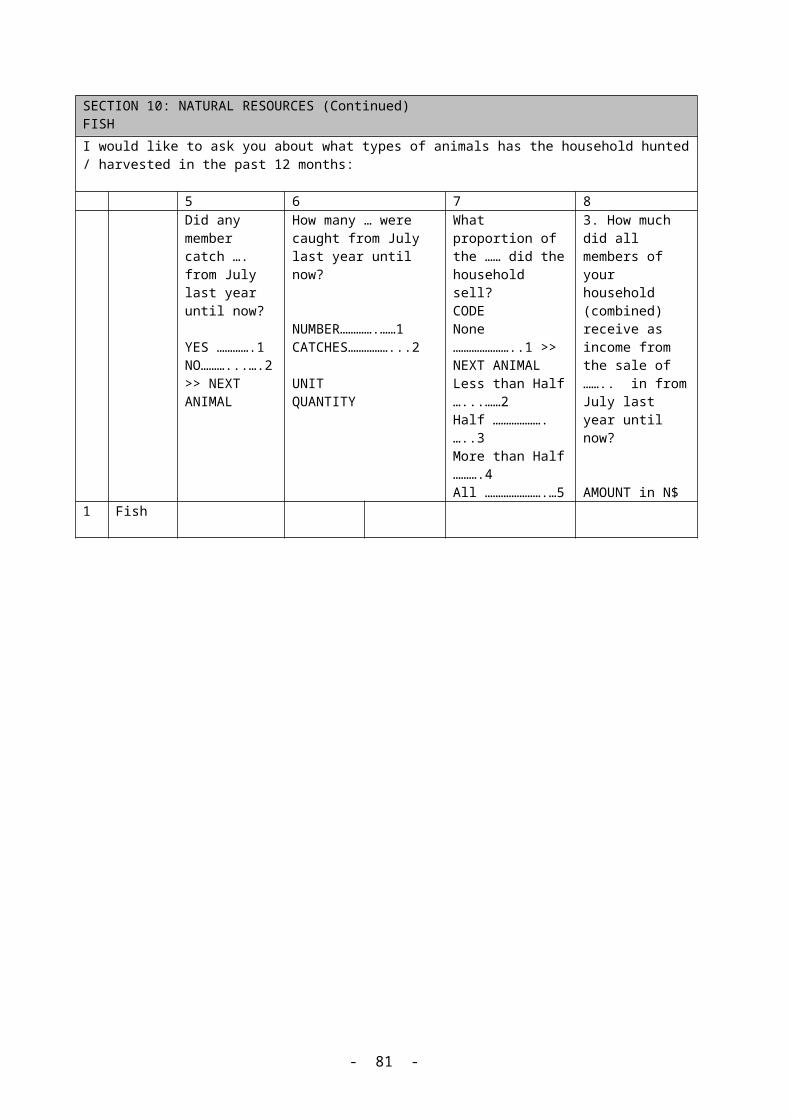
SECTION 5: CONFLICT RESOLUTION
1 Have there been any conflicts in this community in the past 12 months? Yes …….1 >> Q2No………2 >> NEXT SECTION
2 3 4
S/N
Type of Conflict
Did the conflict revolve around….?
YES……………..1NO………………2
Was the conflict about ….. resolved?
YES ………….1NO……………2
Was …..key to the resolution of the … conflict?
Traditional Authorithy……1Conservancy Committee….2Land Board………………3Regional council…………..4NGO………………………5Police……………………...6Other, specify………………7
1 Land issues
2 Use of natural resources
3 Distribution of benefits from CBOs
4 Access to employment opportunities in CBOs
5 Other, specify _______________
6 Other, specify _______________
- 81 -
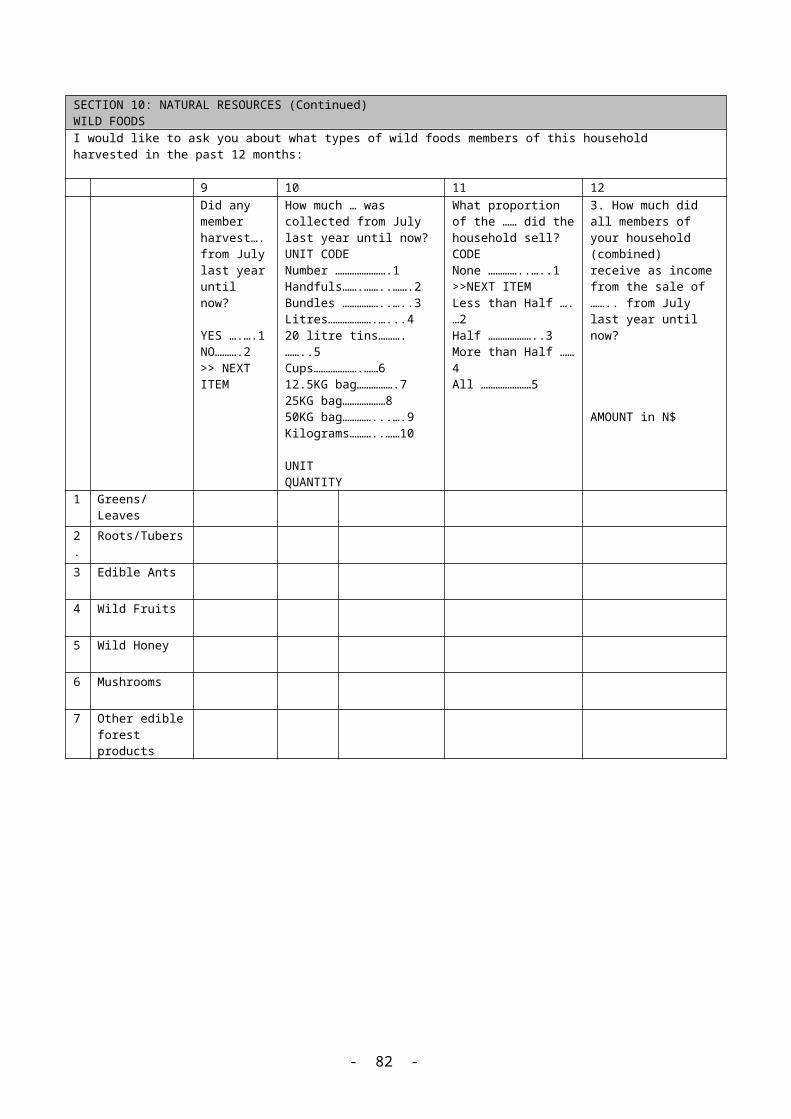
SECTION 6: DAMAGE BY WILDLIFEI would like to ask about human-wildlife conflict and how the conservancy deals with it.
1 2 3Was any community infrastructure or crops damaged by wildlife over the past 12 months?
If yes was …. damaged?
YES ………1NO ………..2 >>Next item
Which animals damaged the……… most?
ENUM: ENTER ONE CODE FOR EACH ITEM
YES…….1 NO……..2 >> NEXT SECTION
ENUM: ENTER CODE BELOW:
1 Fencing
CODE:ANTELOPES (Impala, Wildbeest etc.)….…………1RHINOCEROS …………..2BUFFALOES ….………...3ZEBRAS ………..………..4ELEPHANTS ………..…..5GIRAFFES ..……….…….6HIPPOS ………….….……7WARTHOGS …….………8WILD PIGS ………..….....9MONKEYS ………...…...10OTHERS (Specify)………………………...…11…………………….…..…12
2 Buildings / houses
3 Boreholes
4 Pipelines
5 Solar Panels
6 Crops
7 Other, specify
4 Are there schemes / systems to compensate those households whose property and / or livestock has been damaged?
YES………..1 NO…………2 >> Q7
5 6Is ………responsible to compensate households? YES……….1NO………...2
Is …..’s compensation scheme working? YES……………1NO……………..2
1 MET2 Conservancy 3 Insurance Group 4 Other specify ________________
7 Are there activities to prevent human-wildlife conflict? YES…1 NO…2 >> NEXT SECTION
Method 8 9Do these actions include ……?
YES ………….1NO……………2 >> Next method
Has …. Shown to be effective to prevent damage?YES………..1NO…………2
1 Constructing and maintaining additional water points for wildlife
2 Paying for diesel to run water points for wildlife
3 Construct fences to keep wildlife away
4 Support activities to identify new ways to prevent wildlife damage (e.g. chilli production)
5 Other, specify
- 82 -

SECTION 7: NATURAL RESOURCE USE AND MANAGEMENTI would like to ask about land and natural resource use in the community: 1 Does the region have a land use plan YES …………….1
NO……………….22 Does the community have a land use plan? YES ………………1
NO………………..2if BOTH QUESTIONS ABOVE are answered with YES >> Q 3 If only ONE is answered with YES >> Q 4If BOTH are answered NO, proceed to >> Q 6
3 Are the community and regoinal land use plan harmonised
YES………………1NO………………..2
4 5
S/N
USE
In this / these land use plan(s) are areas set aside for ……?YES……………1NO……………..2 >> NEXT USE
ENUM: Write code below
Do people adhere to the management regime YES……………….1NO ….…………….2ENUM: Write Code below
1 WILDLIFE
2 TOURISM ACTIVITIES (Campsites, Guiding Tours, Hunting)
3 LIVESTOCK Grazing and Watering
4 CROPPING
5 TIMBER and NON-TIMBER Veld and Forest Use
6 HUMAN SETTLEMENT
7 OTHER
6 Is the use of natural resources regulated / restricted
YES ………….1 NO …………...2 >> NEXT SECTION
7 8 9 10
RESOURCE
Is the use of …… restricted / regulated?YES………..1NO…………2 >> NEXT RESOURCE
Who sets the restrictions for ………?Traditional Authority…..1Community……………..2Conservancy…………….3GRN…………………….4Private person…………..5Other……………………6
Are the restrictions for …….being enforced?
YES………..1 NO…………2 >> NEXT RESOURCE
Who enforces the restrictions for……?
Traditional Authority…..1Community……………..2Conservancy…………….3GRN…………………….4Private person…………..5Other……………………6
1 Grazing
2 Fish
3 Crop land
4 Wood resources
5 Wild fruits and vegetables
6 Game
7 Medicinal plants
8 Water
9 OTHER, specify
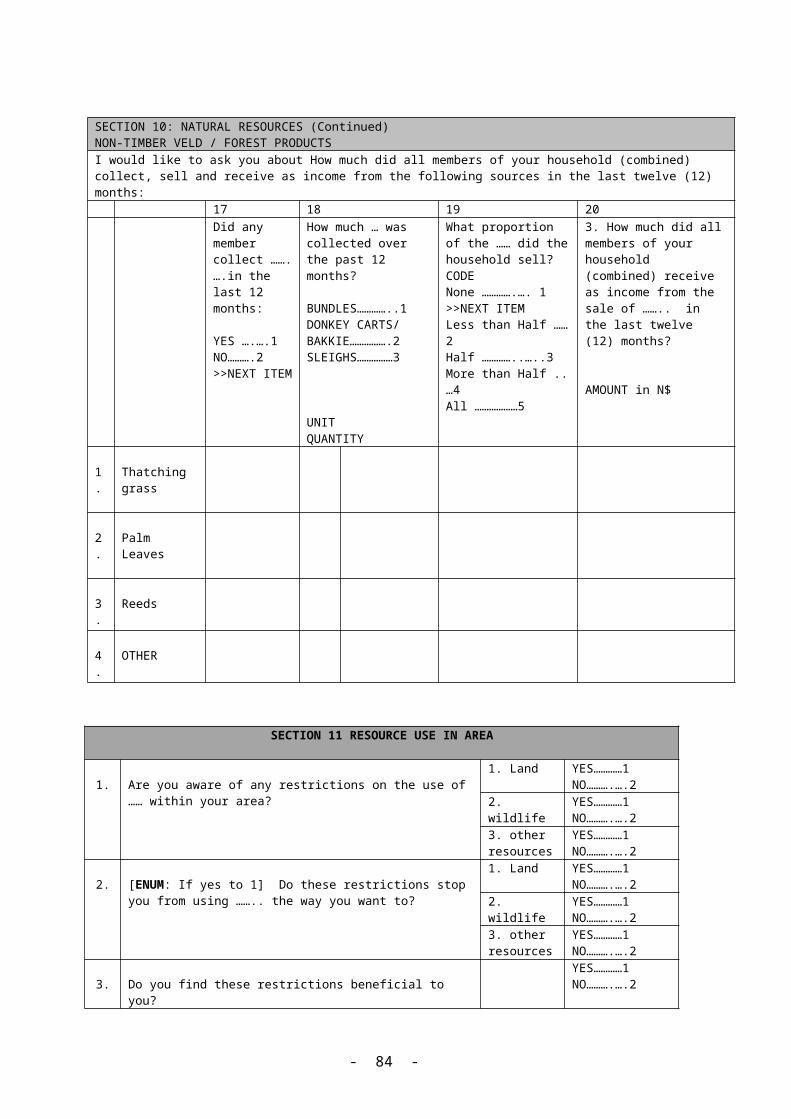
SECTION 8: CONSERVANCY PARTICIPATION
1 Is this community inside a conservancy? YES………….1 NO…………..2 >> END INTERVIEW
2 Is membership to this conservancy automatic to all households living within it’s boundary?
YES …….1 NO…………..2 >> Q 4
3 If yes, does the list of registered members include all households in the conservancy?
YES …..1 >> Q 5NO ……2
4 If no, is membership to this conservancy open to all households living within it’s boudary?
YES……….1NO ……….2
5 How many members of this community are registered members? NUMBER
6 Do you know about Quarterly Planning Meetings organised by IRDNC?
YES………1 NO………..2>> Q 9
7 In the past 12 months how many times did this conservancy send representation to QPMs?
Not at all.................................................1Once ......................................................2Twice......................................................3Three times.............................................4Four times..............................................5
8 Does the conservancy hold regular AGMs? YES ………….1NO…………….2 >> NEXT SECTION
9 How many have been held since the inception of the conservancy NUMBER
10 How are people invited to attend?
Radio announcement..............................1Posters....................................................2Word by mouth.......................................3Through IRDNC......................................4Other, specify.........................................5
11
What proportion of the registered members attends the AGM meetings?
below ¼..................................................1¼.............................................................2½,............................................................3¾ ............................................................4All ..........................................................5
12
Are financial reports and financial management issues ……..during the AGMs?
Discussed................................................1Voted on.................................................2Discussed & voted..................................3None.......................................................4
- 84 -

SECTION 9: CONSERVANCY BENEFITS I would like to ask about benefits that the conservancy generates.
1 Did the conservancy generate any income over the past 12 months?
YES…………1 NO………………….2 >> Q 6
2 How much income has the conservancy generated over the past 12 months? N$
3 Did the conservancy earn its income from ……… YES…………..1NO…………….2
1 Trophy Hunting 2 Community Campsite 3 Other community ventures (specify)4 Other community ventures (specify)5 Royalties from Joint Ventures 6 OTHER, specify 7 OTHER, specify
4 Did the conservancy earn …………….than its costs over the past 12 months
less………………….1 >> Q 6the same……………2 >> Q 6more ……………….3 >> next quesiton Don’t know…………4 >> Q 6
5 Was the profit that the conservancy made….. YES…………..1NO…………….2
1 Paid to households
2 Invested in education infrastructure / materials
3 Invested in health care and infrastructure4 Invested in Community Business5 Saved in bank account 6 Don’t know
6Did the conservancy receive any meat in the past 12 months from trophy hunts and/or own hunts?
YES……………1 NO……………..2 >>Q 9
7 How much meat did the conservancy receive? KG
8 Who received meat distributions All registered conservancy members….….1 Conservancy Committee Members…….…2Poor households ………………………….3Other, specify……………………………..4
9 Are any community members employed by the conservancy?
YES………….1 NO…………..2 >>Q11
10
If yes, how many people are employed by the conservancy?
NUMBER
11
Has the conservancy provided any training to the conservancy members?
YES………1 NO………2 >> END INTERVIEW
12 13
Type of training
Did the conservancy provide……….?
YES….1 NO…...2 >> NEXT TYPE OF TRAINING
Who was eligible to receive the ………….?Conservancy Committee Members …..1Conservancy Employees………………2 All registered members………………..3
1 Financial Management Training 2 Natural Resource Management
Training 3 Business / Enterprise Training 4 Tourism related training 5 Other, specify………………..
- 85 -