© Emeralds on the Equator: An Avoided Deforestation Carbon...
101
Transcript of © Emeralds on the Equator: An Avoided Deforestation Carbon...
© Emeralds on the Equator: An Avoided Deforestation Carbon Markets Strategy Manual
copyright Gabriel Andres Thoumi, 2009. All translations also copyright Gabriel Andres
Thoumi, 2009, including Zamrud di Khatulistiwa: Pasar Karbon di Hutan Yang
Terhindar Dari Kegungulan Pedoman Strategis; Esmeraldas no Equador: Mercado de
Desflorestamento Pelo Carbono Manual de Estrategia; Esmeraldas en el Ecuador:
Mercados de Carbono Para Evitar la Deforestacion Manual Estrategico; and Emeraudes
sur L’Equateur: Un Manuel de Strategies sur les Marches de Carbone Evitant la
Deforestation.
© Illustrations copyright Gabriel Andres Thoumi, 2009.
© Photographs copyright Rhett Butler, 2009.
ISBN: 978-1-4276-3754-3
Preface: Sarwono Kusumaatmadja
Editor: Marie Ward
Translators: Indie Banget, Marcela Verlangieri, Céline Hauglustaine, and Maria Teresa
Corzo Adame.
All rights reserved. No part of this book may be translated or reproduced in any form,
except brief extracts by a reviewer for the purpose of a review, without written
permission of the copyright owner.
Abstract
This strategy for producing and marketing avoided deforestation carbon credits
applies Thoumi’s Rational Convergence Model for effective communication, Thoumi’s
Emeralds on the Equator “Zamrud Khatulistiwa” Model for environmental services,
Afuah’s New Game business model, and Nordhielm’s Big Picture model. Using the value
stream of raw materials, manufacturing, and marketing and sales, the avoided
deforestation project developer can successfully create value through carbon credits
manufacturing and sales for the project owner. The four criteria a developer must use to
successfully bring about an avoided deforestation project are the following: the land
dictates the rules, rural communities are the gatekeepers for a project, governments
dispense rights, and businesses structure risks.
This booklet was originally a practicum submitted in partial fulfillment of the
requirements for the degree of Master of Science Natural Resources and Environment
at the University of Michigan, December 2008. Faculty advisors are Professor Michael R.
Moore and Professor Richard B. Rood, and faculty readers are Professor Linda Y.C. Lim
and Associate Professor Arun Agrawal.
This document reflects the opinions of the author and not necessarily MGM
International.
Mr. Gabriel Thoumi works as Forestry Director for MGM International.

Dedication
To my father, Dr. Francisco Thoumi
To my mother, Susan McGuire
To our gorgeous tropical forest islands,
our emeralds on the equator,
repositories of our imagination, our oxygen, our biodiversity.
Let us save them for all children of all species for all time.
Acknowledgments
Thanks to the Erb Institute for Global Sustainable Enterprise, the Stephen M.
Ross School of Business, the School of Natural Resources and Environment and the
Center for Southeast Asian Studies at the University of Michigan.
Thanks to Allan Afuah and Christie Nordhielm.
Thanks to Pak Sarwono Kusumaatmadja, Michael Moore, Richard Rood, Linda
Lim, Arun Agrawal, Jan McAlpine, Tom Lyon, Tom Gladwin, Andy Hoffman, Tom
Princen, Mark Hunter, Glen Barry, forests.org, Jim Bass, Holly Gibbs, John Holdren,
Drew Horning, Cyndy Cleveland, Dominique Abed, Lisa Yee-Litzenberg, Chris Theriot,
the Malaysian Nature Society, Maye Yap, the International Tropical Timber
Organization, Environmental Finance, Graham Cooper, Mark Nicholls, Matt Colvan, PT
Starling Resources, John Claussen, Rezal Kusumaatmadja, Sarwono Kusumaatmadja,
Dharsono Hartono, Sarah Conway, WWF Indonesia, Daniel Murdiyarso, The Jakarta
Post, Kornelius Purba, Rhett Butler, mongabay.com, Cathy Henkel, Dorjee Sun, John
O’Niles, Felicity Blake, and Laura Rickloff. All greenhouse gases emitted in the
production of this document were offset using community forest carbon projects.
Thanks to my editor, Marie Ward, and my translators Indie Banget, Marcela
Verlangieri, Céline Hauglustaine, and Maria Teresa Corzo Adame.
Thanks to the anonymous business contacts with whom I have spoken to these
past two years.
Thanks to my family and friends.
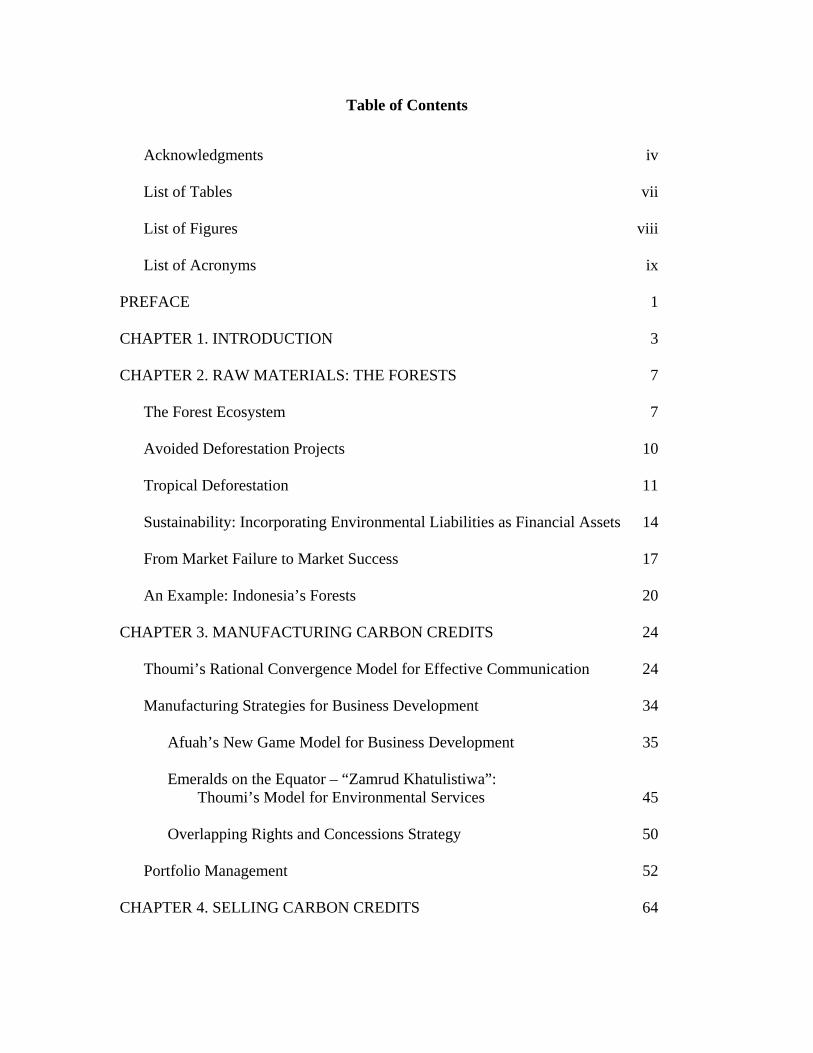
Table of Contents
Acknowledgments iv
List of Tables vii
List of Figures viii
List of Acronyms ix
PREFACE 1
CHAPTER 1. INTRODUCTION 3
CHAPTER 2. RAW MATERIALS: THE FORESTS 7
The Forest Ecosystem 7
Avoided Deforestation Projects 10
Tropical Deforestation 11
Sustainability: Incorporating Environmental Liabilities as Financial Assets 14
From Market Failure to Market Success 17
An Example: Indonesia’s Forests 20
CHAPTER 3. MANUFACTURING CARBON CREDITS 24
Thoumi’s Rational Convergence Model for Effective Communication 24
Manufacturing Strategies for Business Development 34
Afuah’s New Game Model for Business Development 35
Emeralds on the Equator – “Zamrud Khatulistiwa”: Thoumi’s Model for Environmental Services 45
Overlapping Rights and Concessions Strategy 50
Portfolio Management 52
CHAPTER 4. SELLING CARBON CREDITS 64
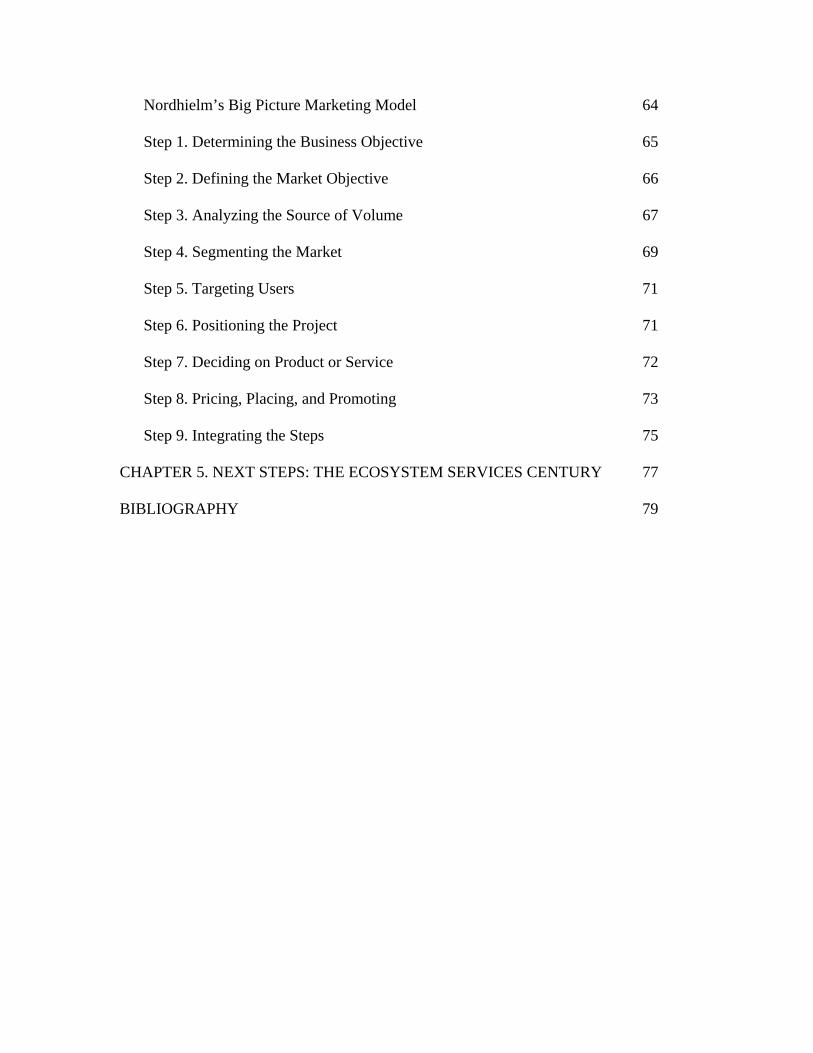
Nordhielm’s Big Picture Marketing Model 64
Step 1. Determining the Business Objective 65
Step 2. Defining the Market Objective 66
Step 3. Analyzing the Source of Volume 67
Step 4. Segmenting the Market 69
Step 5. Targeting Users 71
Step 6. Positioning the Project 71
Step 7. Deciding on Product or Service 72
Step 8. Pricing, Placing, and Promoting 73
Step 9. Integrating the Steps 75
CHAPTER 5. NEXT STEPS: THE ECOSYSTEM SERVICES CENTURY 77
BIBLIOGRAPHY 79
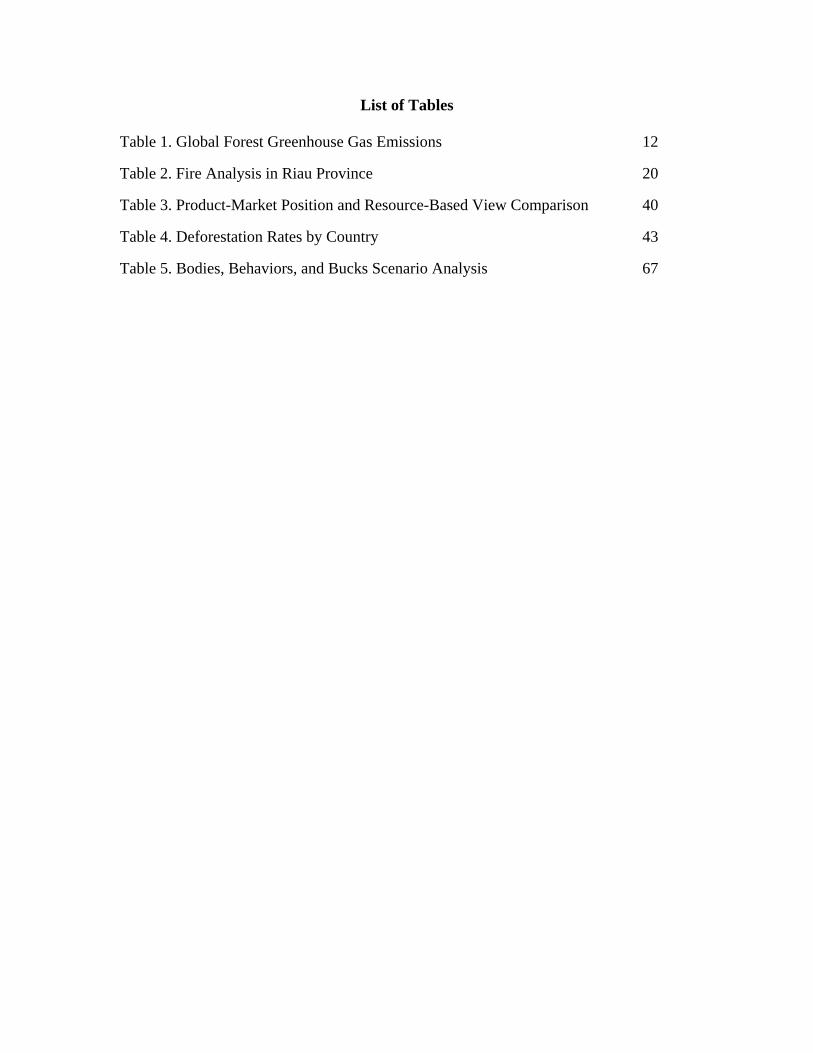
List of Tables
Table 1. Global Forest Greenhouse Gas Emissions 12
Table 2. Fire Analysis in Riau Province 20
Table 3. Product-Market Position and Resource-Based View Comparison 40
Table 4. Deforestation Rates by Country 43
Table 5. Bodies, Behaviors, and Bucks Scenario Analysis 67
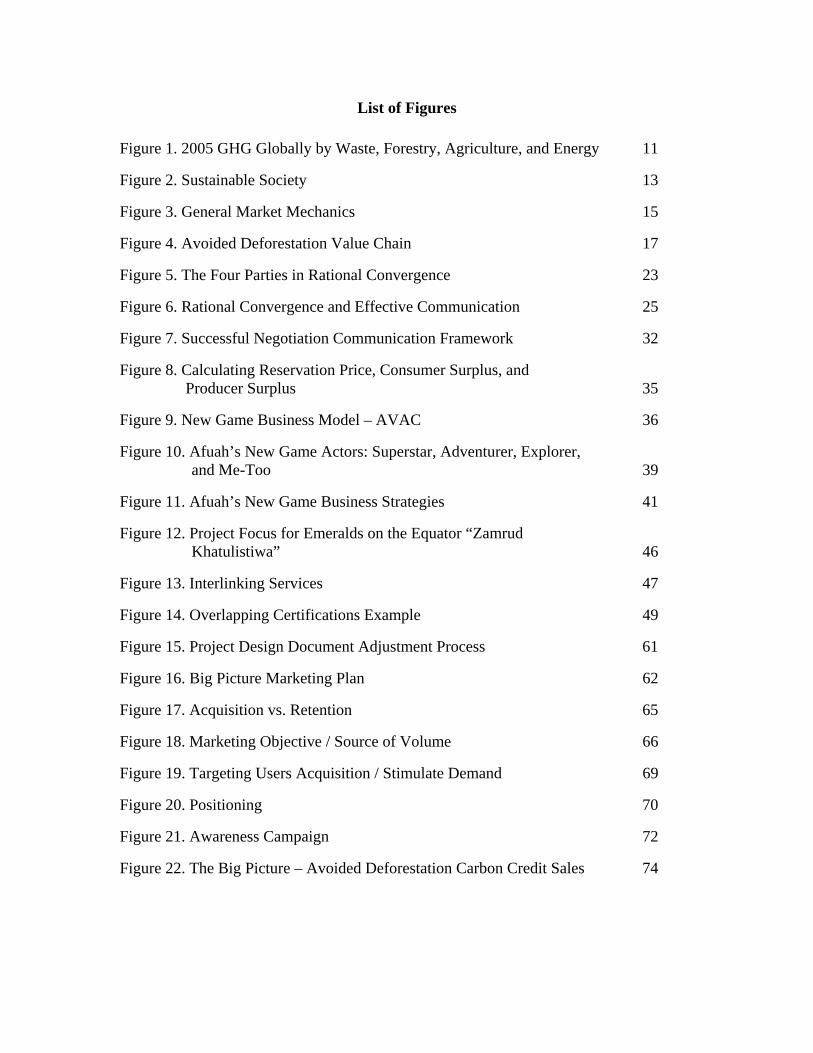
List of Figures
Figure 1. 2005 GHG Globally by Waste, Forestry, Agriculture, and Energy 11
Figure 2. Sustainable Society 13
Figure 3. General Market Mechanics 15
Figure 4. Avoided Deforestation Value Chain 17
Figure 5. The Four Parties in Rational Convergence 23
Figure 6. Rational Convergence and Effective Communication 25
Figure 7. Successful Negotiation Communication Framework 32
Figure 8. Calculating Reservation Price, Consumer Surplus, and Producer Surplus 35
Figure 9. New Game Business Model – AVAC 36
Figure 10. Afuah’s New Game Actors: Superstar, Adventurer, Explorer, and Me-Too 39
Figure 11. Afuah’s New Game Business Strategies 41
Figure 12. Project Focus for Emeralds on the Equator “Zamrud Khatulistiwa” 46
Figure 13. Interlinking Services 47
Figure 14. Overlapping Certifications Example 49
Figure 15. Project Design Document Adjustment Process 61
Figure 16. Big Picture Marketing Plan 62
Figure 17. Acquisition vs. Retention 65
Figure 18. Marketing Objective / Source of Volume 66
Figure 19. Targeting Users Acquisition / Stimulate Demand 69
Figure 20. Positioning 70
Figure 21. Awareness Campaign 72
Figure 22. The Big Picture – Avoided Deforestation Carbon Credit Sales 74
List of Acronyms
AFOLU Agriculture, forestry, and other land uses
AVAC Activities, values, appropriability, and change
BoP Base of the pyramid
CCB Climate, Community, Biodiversity Alliance
CCX Chicago Climate Exchange
CDM Clean development mechanism
DNA Deoxyribonucleic acid
ENSO El niño southern oscillation
FASB Financial Accounting Standards Board
FSC Forest Stewardship Council
GDP Gross domestic product
GHG Greenhouse gas
GIS Geographical information system
HDI Human development index
IAS International accounting standard
IASB International Accounting Standards Board
IPCC Intergovenmental Panel on Climate Change
LULUCF Land use, land-use change, and forestry
MtCO2e Metric ton carbon dioxide equivalent
PDD Project design document
PIN Project information note
PMP Product market position
RNA Ribonucleic acid
RPV Resource-based View
RSPO Roundtable on sustainable palm oil
VCS Voluntary carbon standard
1
PREFACE
In past centuries, the natural wealth and hospitable climate of the tropical lands of
the world, dubbed “Emeralds on the Equator,” or Zamrud Khatulistiwa of the Indonesian
islands, have attracted international trade, colonization, and modern lifestyles. These
influences have brought mixed blessings on the people and undeniably adverse impact on
the natural environment. As economic and social inequity became more pronounced, the
idyllic natural environment of the tropics has deteriorated considerably as well.
Overexploitation of resources and the resulting climate changes have combined to pose
overwhelming challenges to human existence. Awareness that the survival of living
beings depends on the integrity of the natural environment has been rising, but we are
still devising the principles and methodologies as well as the instruments and
communication approaches on which future environmental stewardship shall depend. An
avoided deforestation carbon markets strategy manual written by Gabriel Thoumi brings
convergence to the various instruments of climate stabilization endeavor which may well
become the strategic underpinnings of the economic and political sustainability of the
21st century. Much has to be done to mainstream this new thinking that is still in its
infancy. Nevertheless, Gabriel's contribution should serve and support the pioneering
efforts of various parties which have begun to define the new frontier of carbon markets.
Long-winded and tortuous negotiations on climate global policies hopefully will
come to a long-awaited resolution. The tide of awareness will then turn to an
international resolve to address the inevitable, namely, to stabilize global climate.
Without the needed scientific tools, as well a strong commitment to social justice, the
2
monumental tasks ahead would be impossible to achieve. The path-breaking work of
Gabriel Thoumi and other dedicated scientists will form the foundation in setting the
Emeralds of the Equator in their rightful place, as guarantors of the continuation of all
species and as the focal point of a new civilization that is in harmony with nature.
May history fail to repeat itself.
~ Pak Sarwono Kusumaatmadja, Jakarta, Indonesia, December 2008
3
CHAPTER 1. INTRODUCTION
Our “emeralds on the equator” are the legacy of tropical forests that grace the
Earth like a necklace. Currently, 13 million hectares of forests annually are deforested,
the majority in the tropics. The business strategy for mitigating climactic disruption due
to this deforestation involves creating carbon markets at the source of the problem,
thereby turning an environmental liability into a financial asset, locally and globally.
This paper summarizes my experience working on eleven global tropical forest
projects over three years. Six projects involved avoided deforestation projects in the
Democratic Republic of the Congo, Malaysia, and Indonesia. I also participated in nine
carbon markets conferences and informally interviewed over 350 market participants
from 204 organizations including governmental agencies, for-profit businesses,
multinational corporations, non-governmental organizations, local land conservancies,
scientific organizations, and local community organizations.
Landowners face a strategic business choice in how they choose to manage their
forested land. Avoided deforestation refers to landowners choosing to not deforest their
land. Landowners need business strategies in the carbon markets designed around the
greenhouse gas emissions of the host country, province, and municipality where the
opportunity occurs. Since tropical forest countries such as Indonesia and Brazil emit the
majority of their greenhouse gases from deforestation, it would be prudent that business
strategies proactively engage solutions that will create a financial asset. The source of this
financial asset is the natural capital that makes up the geographic landscape of these
countries.
4
This manual describes a strategy for creating this financial asset by looking at the
parts involved in project development—raw materials, manufacturing, and
marketing/sales. This three-stage value chain includes forests as the raw material, carbon
credits as the manufactured product, and the sale of carbon credits to create the financial
asset for the project owner.
Raw Materials: The Forests
The project developer must understand the raw material as an ecosystem, a
system of relationships between fauna and flora, landscapes, and soil, that exists spatially
and changes over time. Ecosystems range in size from a few hectares to multi-million
hectare landscapes, and the relationships involve climatology and hydrology as well as
human society and the natural biological systems surrounding it. Landscapes change over
time and at different rates, and a developer needs to understand a forest’s inherent fluidity
and dynamism, because a forest’s growth patterns and other natural patterns, such as
weather, hydrology, and soil, can impact carbon calculations.
Manufacturing Carbon Credits
The project developer can clarify and simplify the current avoided deforestation
market, which is dominated by confusion and exaggeration, by using Thoumi’s Rational
Convergence model for communicating with the parties involved in this market. The land
dictates the rules, and it is the through the use of scientific analysis that project
developers know how much carbon can be consumed by the forest ecosystem on the land.
The local communities, the project’s gatekeepers, allow for a project to proceed
5
successfully. Without them and the civil organizations that represent these communities,
project developers will not have a manufacturing base from which to produce carbon
credit offsets. Because governments dispense rights like an accordion (in and out: given
then withdrawn), the project developer needs to secure all the legal rights needed to
develop a project. Finally, the project developer needs to manage and structure its
business risks based around its own core competencies and the core competencies of the
project owners and carbon credit buyers.
The project developer can focus its business strategy by using Afuah’s (2007)
New Game business model for business development. The project developer needs to
decide what quality of project it wants to develop by focusing on action items using the
activities, values, appropriability, and change model. The developer can then decide how
and when to pursue its business strategy with a resource-constrained or position-
constrained project, or both.
The project developer can check the project design document with the ecological
services that are present on the land and used by the local community by using Thoumi’s
Emeralds on the Equator “Zamrud Khatulistiwa” model for environmental services. The
project developer can analyze supporting, cultural, provisioning, and regulating services
to understand and include all aspects of the ecological services into the project design
document and thereby strengthen the project.
Selling Carbon Credits
The project developer can avoid issues that limit project success by using
Nordhielm’s (2006) Big Picture model, an iterative model for project design document
6
development and implementation. As the project is commercialized and marketed,
revenue is generated can be used to implement and expand project scope. Because the
avoided deforestation carbon credit market is an acquisition / stimulate demand market,
the developer needs to educate desired consumers about the benefits of both the brand
and the market. This requires a strong attitudinal and/or aspirational message that can be
packaged into an awareness campaign that attracts new category users by focusing on a
desired belief and consumer message that these credits create value, mitigating global
climatic disruption with local biodiversity and community co-benefits.
Sustainable projects require transparency, liquidity, and assurance of completion.
Through avoided deforestation projects that provide buyers the capacity to comparison
shop, the avoided deforestation carbon model can develop from its current infancy into a
successful global climatic disruption mitigation mechanism.
7
CHAPTER 2. RAW MATERIALS: THE FORESTS
Introduction
The avoided deforestation carbon market relies on a value chain model for project
development, a three-part process for the production of carbon credits involving raw
materials, manufacturing, and marketing and sales. The raw material is the land, managed
by a project owner. The product is carbon credits, determined through various
certifications and standards. The third part of the process is marketing and selling the
avoided deforestation carbon credits.
This chapter lays the groundwork for forests as the raw material for an avoided
deforestation project developer. Topics include the forest ecosystem, avoided
deforestation projects, tropical deforestation, sustainability, market failure to market
success, and Indonesia’s forests as an example.
The Forest Ecosystem
Scales of Space and Time
Forests consist of a complex system of relationships, called ecosystems, between
fauna and flora, landscapes, and soils—relationships that exist spatially and change over
time. In size, ecosystems range from only a couple of hectares to regional multi-million
hectare landscapes. Vertically, ecosystems range from interaction between the biotic
community and weather patterns, which is the science of climatology, to groundwater
seeping down to belowground aquifers, the science of hydrology. Between hydrology and
8
climatology is a complex system that encompasses human society and the natural
biological systems surrounding that society. In this context, forests include local human
communities who affect their surroundings along with nonlocals who affect the
surroundings through externalities we call pollution.
This spatial scale is divided using a temporal scale. A landscape ecosystem
approach looks at various snapshots in time much like photos from one’s childhood.
Landscapes change over time and at different rates, and a developer needs to understand
a forest’s inherent fluidity and dynamism. The trees making up a forest exhibit periodic,
episodic, and rhythmic growth. A forest’s episodic growth patterns will impact carbon
calculations, patterns influenced by weather, hydrology, soil content, and other factors.
Wind, flood, and fire can affect forests within a project area, all natural occurrences that
can temporarily impair carbon uptake.
Forest Phenotype
Forests can be described by genotype and phenotype. Genotype refers to the
genetic source material of DNA and RNA. Phenotype refers to a forest’s physical
manifestation affected by its external environmental influences, which include soil,
nutrients, light, heat, other biota, and time. Forests can be described physically based on
physiognomy, such as a dipterocarp forest. They can be described based on the resident
fauna and flora, such as an orangutan forest. They can be described based on a landscape
ecosystem, such as an area between various geographic points based on physiography:
the geologic base material of the transect.
9
At the tree level, the processes include photosynthesis, respiration, transpiration,
translocation, cellular activities, water and mineral uptake, and chemical reactions. From
this, the phenotype of a tree can be described: age, growth rate periodicity, habitat,
relationship with other biota, and resistance to natural hazards.
Because a developer is concerned with maintaining and promoting a healthier
forest, plasticity of phenotype is critical because at this granularity, a stronger and
strengthening forest will improve carbon uptake, limiting risk and increasing the
developer’s internal rate of return.
Forest Soils
The importance of soil to forest health cannot be underestimated. Forests receive
carbon dioxide from the atmosphere, energy from the sun, and water and nutrients from
the soil. Forest soils are critical to its reproduction ability, as dispersed seeds can
germinate immediately or reside dormant within a soil seed bank until germination
occurs. Sexual tree reproduction requires seed production, dispersal of seeds,
germination, and growth to maturity of the new tree to reproduce again. The developer
needs to understand that trees require fertilization to reproduce and require dispersal of
seeds locally and regionally by secondary actors such as mammals, birds, insects, fish,
and natural elements. Because forest reproduction may depend on fauna (Barnes et al.
1998), developers need to maintain a forest’s biodiversity.
Soil chemistry and structure assist healthy tree development. Soils are
affectionately referred to as the forest’s parent material. The chemical components of soil
assist healthy herbaceous and tree development. Trees need carbon, hydrogen, nitrogen,
10
oxygen, phosphorous, potassium, calcium, sulfur, and magnesium to grow (Barnes et al.
1998). These elements affect soil acidity, measured by pH: the negative log of the
hydrogen ion concentration in the soil. Acidity affects the quantity of nutrients available
for plants and trees. The physical properties of soil are texture, structure, color, and
water. Texture is described by percent sand, silt, and clay. How soil aggregates as a result
of the activities of microorganisms and plants affects herbaceous root structure. Color
provides insights into the soil’s mineral and organic composition and drainage patterns.
Soil formation is not discussed in this paper.
These complex forest systems are studied, measured, and analyzed by scientists
whose purpose it is to describe them. A developer needs to consider how these systems
can influence the project. Because over time these systems are constantly changing, any
systematic understanding must also change. Developers can manage this change over
time using an iterative and adaptive management process. As information changes the
project must also change.
Avoided Deforestation Projects
Deforestation, the conversion of forest to another land use or the long-term
reduction of the tree canopy cover below the minimum 10% threshold (FAO 2005)
produces 20% of anthropogenic global greenhouse gas emissions (Gullison et al. 2007).
Deforestation is primarily caused by corporations conducting oil and gas development,
forestry development, large-scale farming, and exotic-tree plantations (Laurance and
Butler 2008).
11
To protect forests and mitigate greenhouse gas emissions, developers pay
corporations and communities who have title to forests, either through ownership, lease,
or rent, to receive carbon credits in return for not deforesting. Known as avoided
deforestation projects (“projects”), they are paid for by institutions and individuals
(“developers”) who want to make a profit and sustainably develop communities.
Successful developers must understand the science, policy, business, and civil
society frameworks to manage projects successfully. They need to know how to work
with various people and organizations focusing on effective transdisciplinary
communication while also taking a position that may be challenging to explain to the
general population.
Forestry carbon valuations are based on the initial forest carbon plus carbon
uptake over the period. Carbon credits are sold on the voluntary and compliance markets
globally in units of 1 metric ton carbon dioxide equivalent (MtCO2e). Carbon credit
buyers purchase credits from developers because of speculation, pre-compliance and
compliance, investment, and ecosystem services such as biodiversity, carbon, and water
quality reasons. Currently there are over 200 projects active globally.1
Tropical Deforestation
The world’s tropical forests cover only 12% of the world’s terrestrial land yet
account for 40% of the world’s terrestrial carbon. Tropical forest deforestation rates vary
1 Personal anonymous communications with various developers and private research by Mr. Paul Leach.
12
across the 62 nations that have tropical forests. From 1990 to 2005, the deforestation rates
in these 62 nations were 0% to 5% annually (FAO 2005). Within the next 20 years, most
of the world’s tropical forests could be deforested, converted to soy, cattle ranching, oil
palm, oil and gas development, tree plantations, and unused, degraded land.
Indonesia annually emits 2.5 billion MtCO2e into the Earth’s atmosphere solely
through deforestation (PEACE 2007). This is 50% of the European Union’s (27
countries) total emissions of greenhouse gases (GHG) (UNFCCC 2007). Controlling for
and developing mechanisms that effectively end deforestation will mitigate global
climatic disruption.
Eight-five percent of Indonesia’s GHG emissions are from land use, land use
change, and forestry (LULUCF) and deforestation. This sector needs to be enabled for
full participation by countries such as Indonesia within the mitigation framework for
global climatic disruption.
13
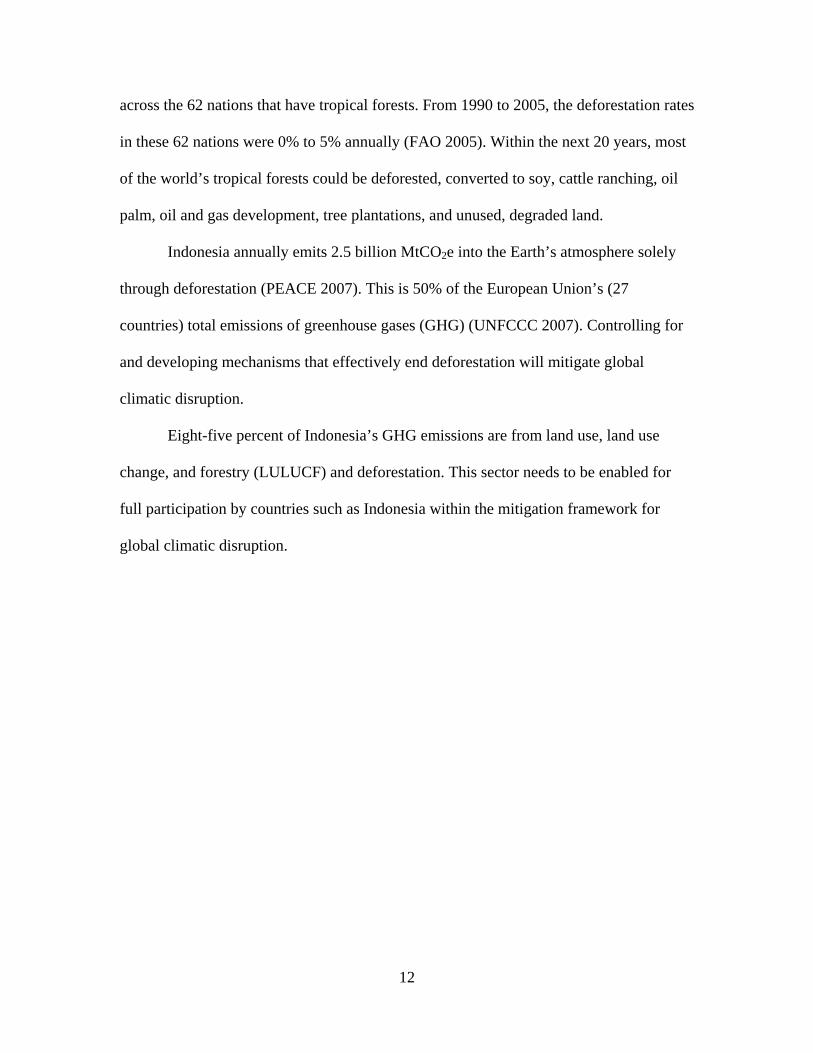
Source: PEACE 2007, p. 2
Figure 1: 2005 GHG Globally by Waste, Forestry, Agriculture, and Energy
Table 1 demonstrates that carbon markets business strategies need to be designed
around each country’s GHG opportunities. Since Indonesia and Brazil emit the majority
of their GHG from deforestation, it is prudent for business to proactively engage in
solutions focusing on deforestation. The business community can turn this environmental
liability into a financial asset.
14
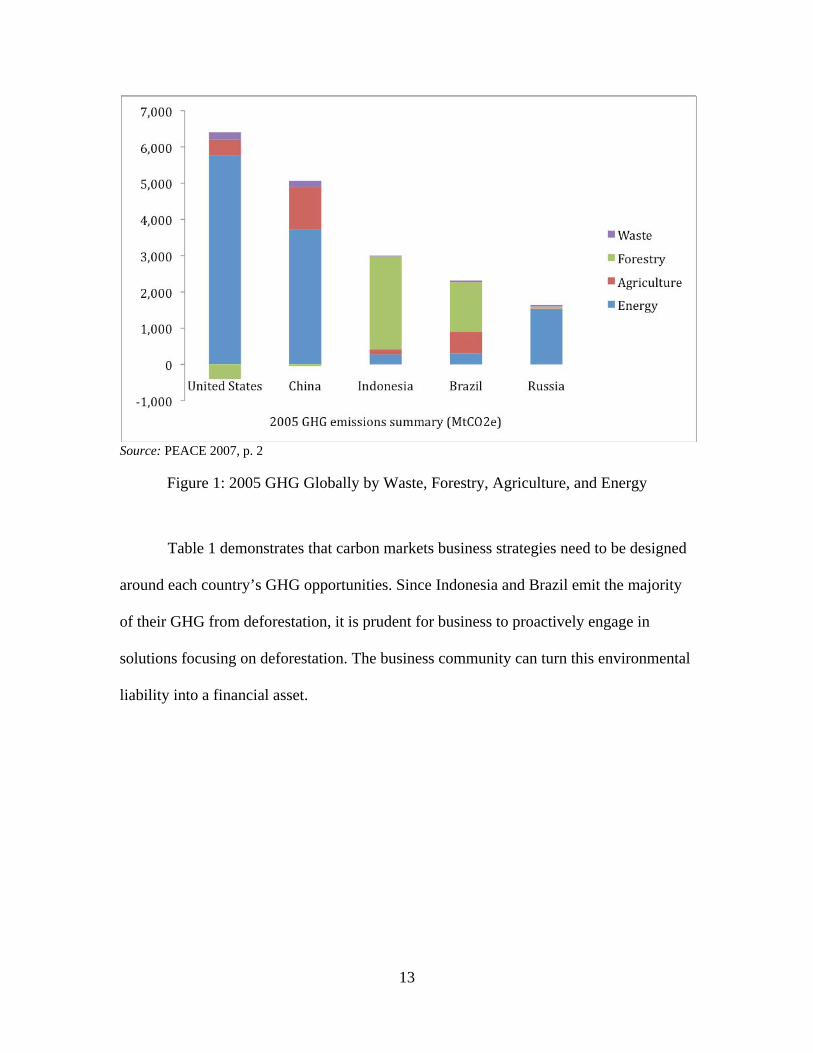
Table 1: Global Forest Greenhouse Gas Emissions
Emissions Source USA China Indonesia Brazil Russia
Forestry (403) (47) 2,563 1,372 54
Energy 5,752 3,720 275 303 1,527
Agriculture 442 1,171 141 598 18
Waste 213 174 25 43 46
Total (MtCO2e) 6,005 5,017 3,014 2,316 1,745
The table excludes EU from the comparison as EU comprises 25 countries. If EU as a block enters the calculation Indonesia stands 4th, and the ranking is US, EU, China and Indonesia. The data for energy emissions are from 2003. The energy data used International Energy Agency’s 2005 annual statistics except for Indonesia where PIE 2005 statistics are used. The data for agriculture emissions are from 2005. Biomass combustion is included in the calculation. The data for forestry (LULUCF) emission are from 2000, from Houghton 2003. [G. Thoumi: This premise is supported by the more recent study of H. Gibbs, the Gibbs/Brown IPCC Tier I vegetation carbon calculation methodologies, and personal communication with H. Gibbs.] The data for waste emissions are from 2005. Table and note source: PEACE 2007, p. 2.
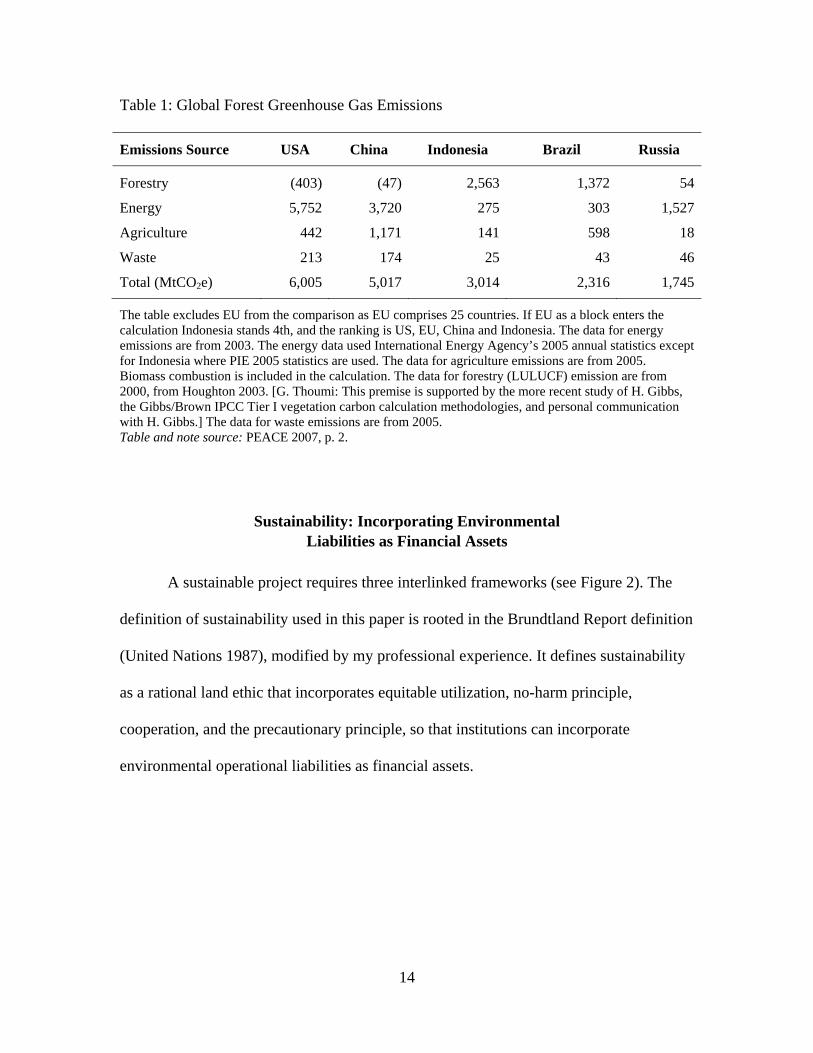
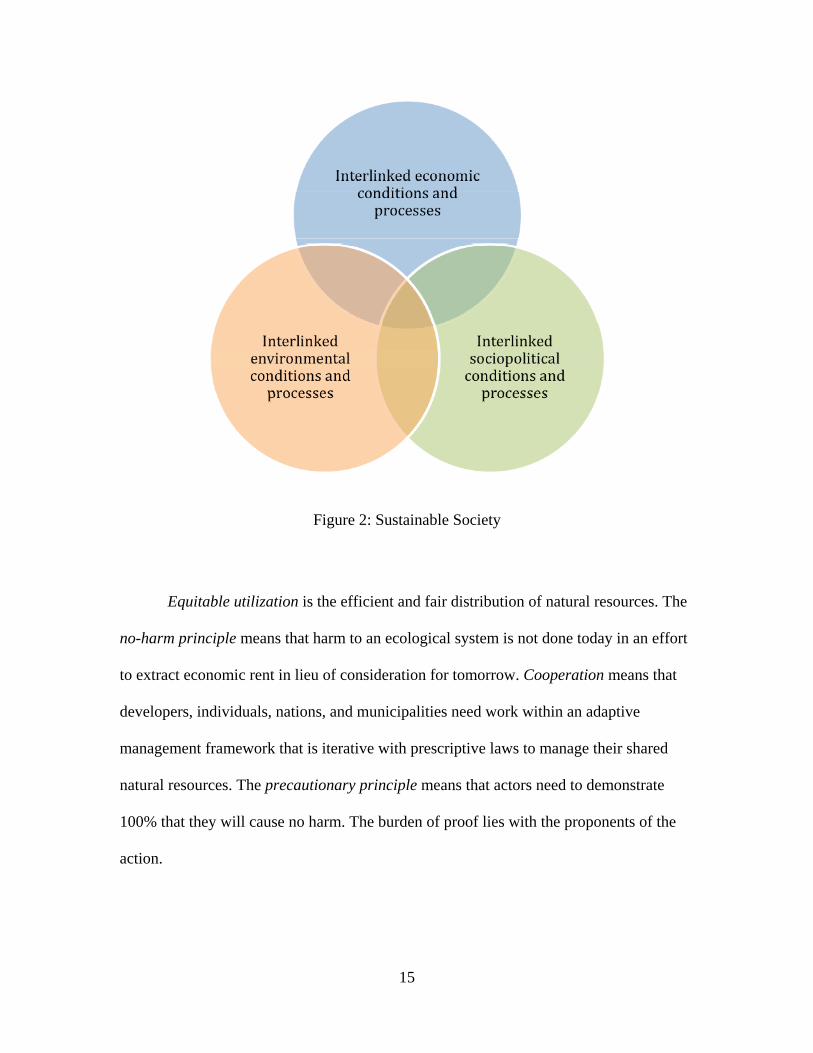
Sustainability: Incorporating Environmental Liabilities as Financial Assets
A sustainable project requires three interlinked frameworks (see Figure 2). The
definition of sustainability used in this paper is rooted in the Brundtland Report definition
(United Nations 1987), modified by my professional experience. It defines sustainability
as a rational land ethic that incorporates equitable utilization, no-harm principle,
cooperation, and the precautionary principle, so that institutions can incorporate
environmental operational liabilities as financial assets.
15
Figure 2: Sustainable Society
Equitable utilization is the efficient and fair distribution of natural resources. The
no-harm principle means that harm to an ecological system is not done today in an effort
to extract economic rent in lieu of consideration for tomorrow. Cooperation means that
developers, individuals, nations, and municipalities need work within an adaptive
management framework that is iterative with prescriptive laws to manage their shared
natural resources. The precautionary principle means that actors need to demonstrate
100% that they will cause no harm. The burden of proof lies with the proponents of the
action.
16
All foundational aspects of a project are interlinked and cannot succeed without
the other. Economics, environment, and sociopolitical conditions and processes each
require success in the other for sustainability to develop. According to Dr. John Holdren,
sustainability includes:
Eradicating poverty and preventable disease, maintaining the integrity of the oceans under increased demands and impacts, managing the intensifying competition for land, water, and terrestrial biota while preserving essential biodiversity, and providing the energy needed to create and sustain prosperity everywhere without wrecking global climate. (Holdren, 2008) Without energy there is no economy, without climate there is no environment. (Holdren, 2008) A project must have a strong economic, environmental, and sociopolitical
backbone to succeed, become profitable, protect biodiversity, and mitigate global
greenhouse gas emissions. Our choice in this century is limited: adapt, mitigate, or suffer.
Our challenge is to develop projects that can mitigate the threat of global climatic
disruption. The global economic system is shifting from market limited to natural
resources limited with ecosystem services becoming an investment class. Where
previously forests and land, water, biodiversity, and air were considered externalities,
developers and nations now consider these untapped wealth. This means liabilities and
environmental externalities are now financial assets.
17
From Market Failure to Market Success
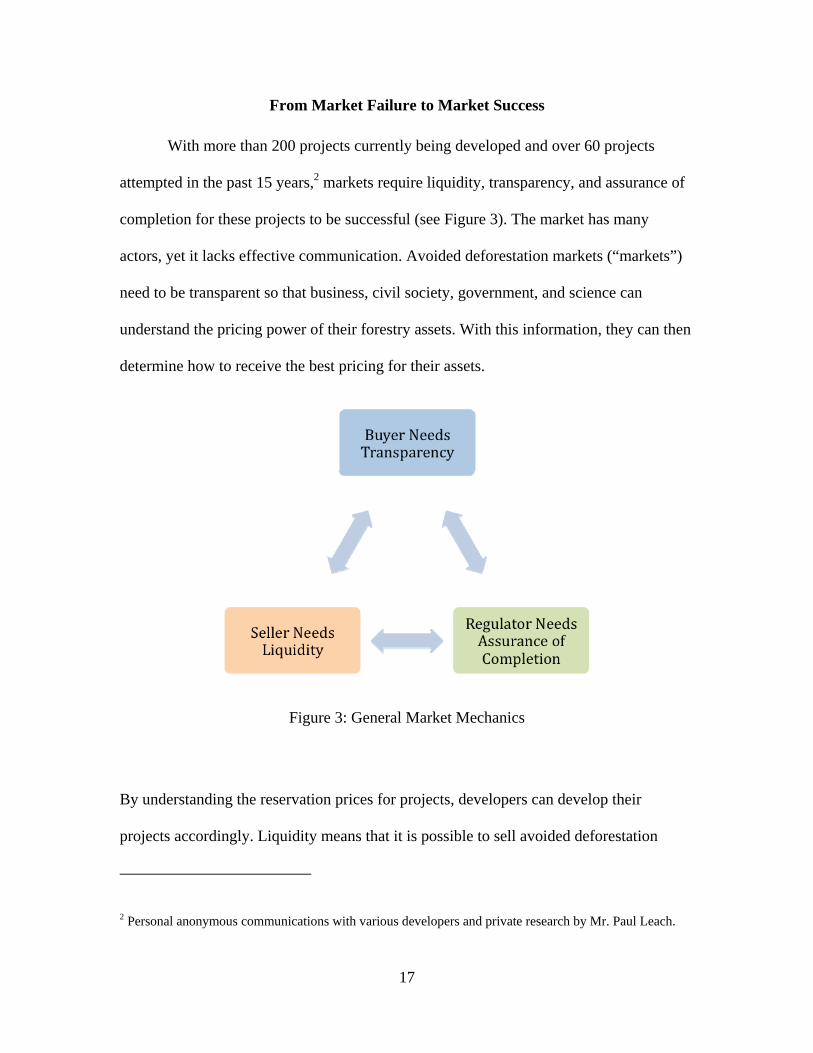
With more than 200 projects currently being developed and over 60 projects
attempted in the past 15 years,2 markets require liquidity, transparency, and assurance of
completion for these projects to be successful (see Figure 3). The market has many
actors, yet it lacks effective communication. Avoided deforestation markets (“markets”)
need to be transparent so that business, civil society, government, and science can
understand the pricing power of their forestry assets. With this information, they can then
determine how to receive the best pricing for their assets.
Figure 3: General Market Mechanics
By understanding the reservation prices for projects, developers can develop their
projects accordingly. Liquidity means that it is possible to sell avoided deforestation
2 Personal anonymous communications with various developers and private research by Mr. Paul Leach.
18
credits from projects quickly. This requires information regarding how others are pricing
their projects so potential buyers can comparison shop. Assurance of completion implies
that what is paid for arrives in a timely manner. Data need to be available publicly on
how projects function and on the projects’ ability to delivery credits and associated
biodiversity, climate, and community co-benefits as promised.
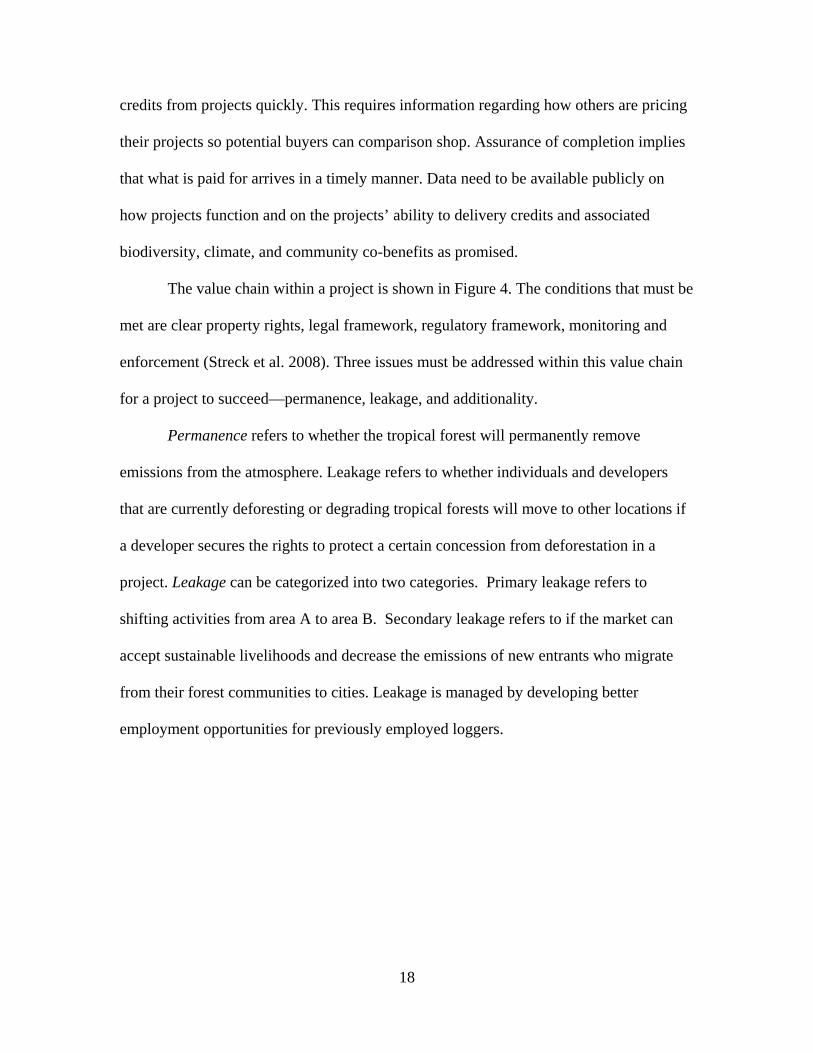
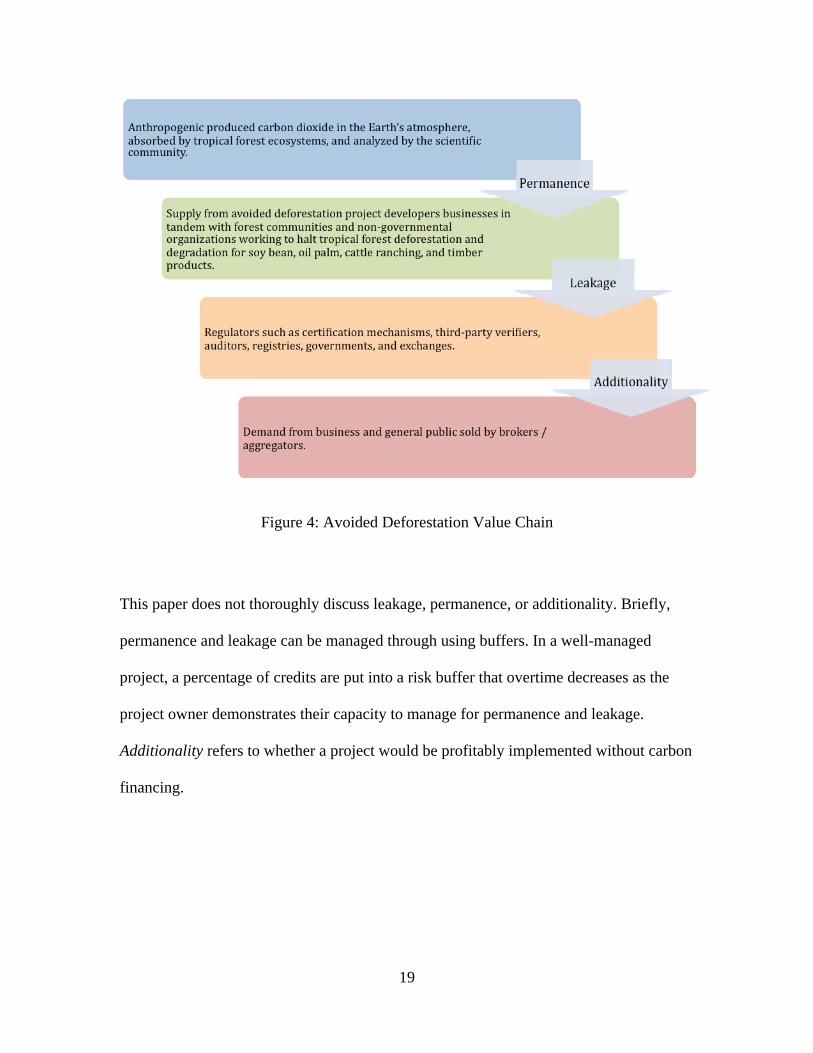
The value chain within a project is shown in Figure 4. The conditions that must be
met are clear property rights, legal framework, regulatory framework, monitoring and
enforcement (Streck et al. 2008). Three issues must be addressed within this value chain
for a project to succeed—permanence, leakage, and additionality.
Permanence refers to whether the tropical forest will permanently remove
emissions from the atmosphere. Leakage refers to whether individuals and developers
that are currently deforesting or degrading tropical forests will move to other locations if
a developer secures the rights to protect a certain concession from deforestation in a
project. Leakage can be categorized into two categories. Primary leakage refers to
shifting activities from area A to area B. Secondary leakage refers to if the market can
accept sustainable livelihoods and decrease the emissions of new entrants who migrate
from their forest communities to cities. Leakage is managed by developing better
employment opportunities for previously employed loggers.
19
Figure 4: Avoided Deforestation Value Chain
This paper does not thoroughly discuss leakage, permanence, or additionality. Briefly,
permanence and leakage can be managed through using buffers. In a well-managed
project, a percentage of credits are put into a risk buffer that overtime decreases as the
project owner demonstrates their capacity to manage for permanence and leakage.
Additionality refers to whether a project would be profitably implemented without carbon
financing.
20
The Challenge for Developers
Projects most likely will not exist absent markets because these projects are
demand-driven by the need for carbon sequestration to occur now and paid for through
the issuance and expiration of carbon credits in the markets. Developers need to value
their projects by estimating the avoided deforestation rate less operations less
permanence and leakage risks to determine their revenue. A developer needs to develop a
complex systems approach when integrating, social, ecological, and economic systems—
the triple bottom-line approach of people, planet, profit.
An Example: Indonesia’s Forests
Asia’s tropical forests account for 17% of the world’s tropical forests and have
the world’s highest deforestation rates (Kumagai et al. 2004). Yet these forests are home
to a high percentage of the world’s biodiversity. In fact, fragmentary secondary forests
now are greater than all remaining old-growth primary forests in SE Asia (Silk 2005).
Indonesia’s forests on Borneo are being deforested at 2% per year. All of the forest
landscape on Indonesia’s part of Borneo, called Kalimantan, may be deforested by 2020
(PEACE 2007).
Kalimantan’s forests have two ecological zones—peat forests with dipterocarp
trees and highland mountainous forests. Peat forests in Kalimantan consist of woody
debris such as roots, shrubs, leaves, fallen trees, and trees. Peat forests are wetlands with
a thin layer of decomposing organic matter. They occupy 3% of the Earth’s surface yet
store 15% of the Earth’s terrestrial carbon (Takai 1996). Sixty-eight percent of the
21
world’s tropical peat forests are in the area of the South China Sea and Indonesia
(Jauhiainen et al. 2005).
Tropical peat forests account for 40% of the carbon storage capacity in the
world’s peat forests. This is 200 gigatons carbon. Kalimantan contains 68,000 sq km of
peat forests (Page et al. 1999). Accordingly, Indonesia’s Kalimantan peat forests have a
27 gigaton carbon storage capacity.
Most commercial timber in Borneo’s lowland peat forests is from dipterocarp
trees. Dipterocarp trees are highly dense—50 to 120 m3 per hectare. When they are
logged, 80% of the canopy is destroyed (Curran et al. 2004). In fact, the volume of
dipterocarp timber exports from Borneo measured in cubic meters is greater than all
tropical wood exported from Latin America and Africa combined since 1980 (Curran et
al. 2004).
Borneo may have the Earth’s greatest biodiversity (Peo 2005). The country has
the Earth’s highest documented tree diversity with, for example, 1,175 species in one 52
hectare plot in Lambir Hills National Park, Sarawak, Malaysia (Peo 2005). In fact, there
are over 6,000 endemic plant species, over 15,000 total plant species, over 2,000 species
of orchids, and over 265 dipterocarp tree species recorded so far in Borneo. For
comparison, there are 50 tree species in Northern Europe (Peo 2005).
Since 1982-83, Indonesia has experienced increasingly catastrophic forests fires
each El Niño Southern Oscillation (ENSO) year. In 1997-98, over 5 million hectares of
rainforest, an area the size of Connecticut and Rhode Island, burned in the province of
East Kalimantan (Cleary 2005). Through ineffective public policy initiatives, large parts
of Indonesian Borneo were degraded and drained of water by corporate interests (Dennis
22
2006). This caused the lowland peat forests to become drier, creating optimal burning
opportunities for ENSO years. This was also impacted by transmigration, corporate
agricultural and timber concerns, and land use policy (Dennis 2006). Fires are expected
to increase in severity as climate change accelerates (Cleary 2005). It is estimated that
during the fires of 1997, 2.18–2.57 gigatons carbon were released into the atmosphere as
a result of fires throughout the Sumatra and Kalimantan. This is 40% of the emissions of
fossil fuels from car emissions globally (Page 2002).
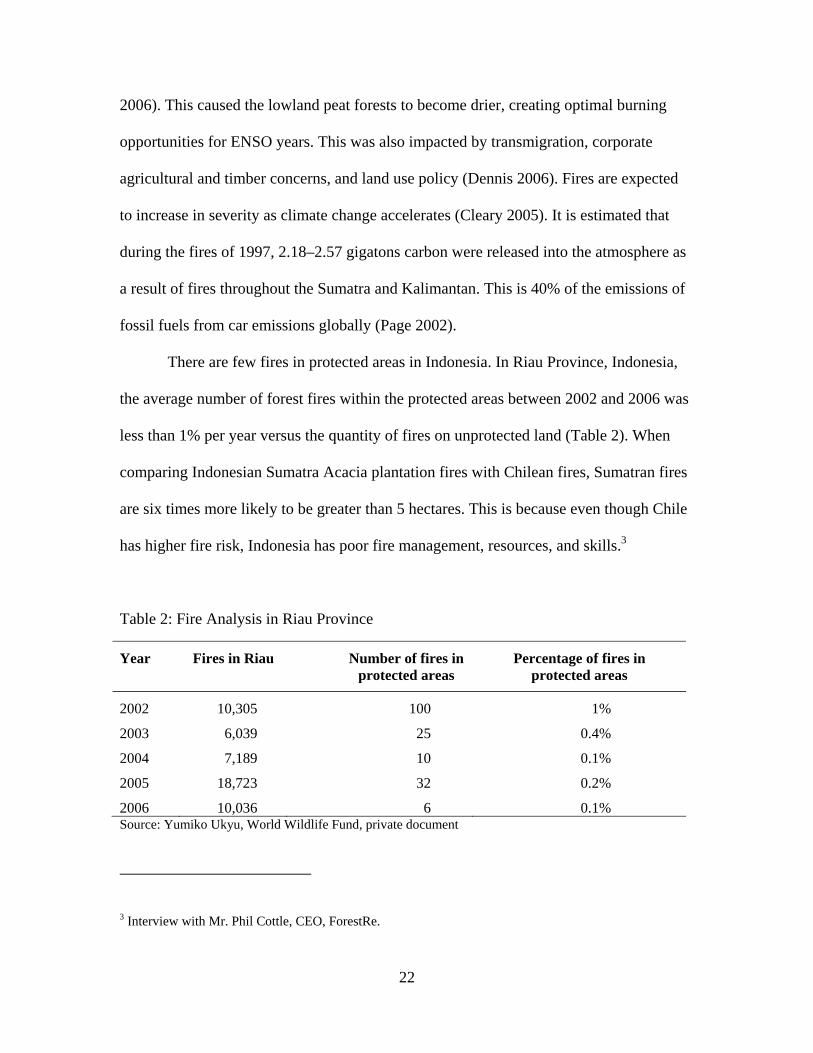
There are few fires in protected areas in Indonesia. In Riau Province, Indonesia,
the average number of forest fires within the protected areas between 2002 and 2006 was
less than 1% per year versus the quantity of fires on unprotected land (Table 2). When
comparing Indonesian Sumatra Acacia plantation fires with Chilean fires, Sumatran fires
are six times more likely to be greater than 5 hectares. This is because even though Chile
has higher fire risk, Indonesia has poor fire management, resources, and skills.3
Table 2: Fire Analysis in Riau Province
Year Fires in Riau Number of fires in protected areas
Percentage of fires in protected areas
2002 10,305 100 1%
2003 6,039 25 0.4%
2004 7,189 10 0.1%
2005 18,723 32 0.2%
2006 10,036 6 0.1% Source: Yumiko Ukyu, World Wildlife Fund, private document
3 Interview with Mr. Phil Cottle, CEO, ForestRe.
23
In fact, Indonesia and Brazil accounted for over 50% of the global carbon emissions from
LULUCF during the 1990s (Houghton 2003).
Peat forests are of critical importance in managing Indonesia’s GHG emissions
and thus represent an opportunity for developers. This demonstrates how forests are the
raw material within the carbon credit manufacturing process.
24
CHAPTER 3. MANUFACTURING CARBON CREDITS
Introduction
The project owner, who has access to the land, will contract with a carbon
markets project developer, external to the community, to manufacture the carbon credits.
This allows the owner to manage business risk by letting a developer manufacture the
carbon credits.
This chapter discusses the necessity of effective communication between the
parties involved in manufacturing carbon credits, with rational convergence as a model.
Manufacturing strategies include Afuah’s New Game model and Thoumi’s Model for
Environmental Services: Emeralds on the Equator “Zamrud Khatulistiwa.” This chapter
also discusses general themes for project management.
Thoumi’s Rational Convergence Model for Effective Communication
To successfully manage the relationships needed to implement and manufacture
carbon credits, it is recommended that developers use the model called rational
convergence.
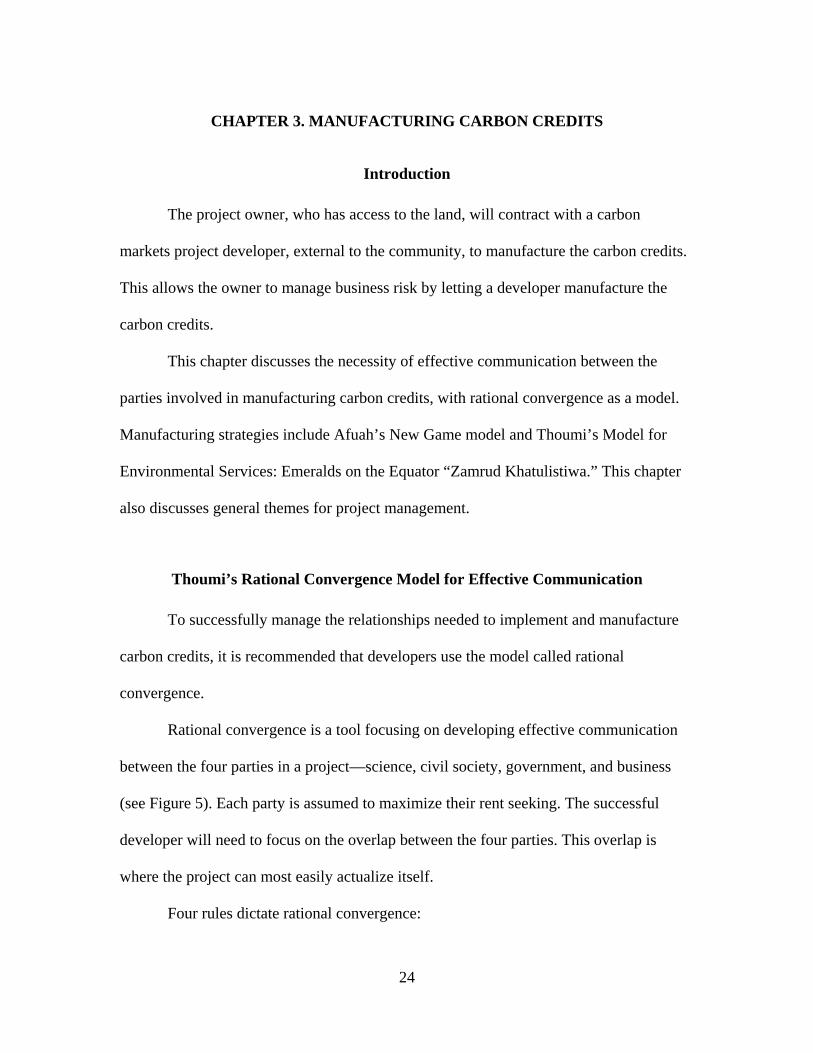
Rational convergence is a tool focusing on developing effective communication
between the four parties in a project—science, civil society, government, and business
(see Figure 5). Each party is assumed to maximize their rent seeking. The successful
developer will need to focus on the overlap between the four parties. This overlap is
where the project can most easily actualize itself.
Four rules dictate rational convergence:
25
1. land dictates the rules
2. local communities are the project’s gatekeepers
3. governments organize rights
4. businesses structure risk
Figure 5: The Four Parties in Rational Convergence
Scientists need unknowns to push intellectual thought forward. This is done by
using the scientific method to test a hypothesis based on observational data and
theoretical understanding. Yet, this uncertainty can be interpreted as a lack of confidence
26
by the other three actors. Government, civil society, and business need to understand that
science will always be uncertain.
Civil society thrives on fighting for the underdog. Because of this, it often
struggles with engaging the other three actors on terms that are not aggressive or
acrimonious. Knowing that civil society may always fight for the underdog, the developer
needs to work hard to gain approval of the project by the local community.
Government organizes and dispenses rights. If a developer wants to gain
governmental support for a project, the developer cannot be understood as removing
rights sovereign to a nation.
Business structures risk. To maintain its profitability, it must manage the project
in a manner that decreases the riskiness of the business concept while maintaining
profitability. In summary, business needs risk to survive. This risk is codified by the use
of rights dispensed by government. Civil society is concerned that government is
eliminating rights that engage locals. Science debates the viability of a hypothesis. It is
within this framework that the developer needs to focus efforts on maximizing the
interests of each of the four actors while developing the project.
Benefits of Rational Convergence
The benefits from using rational convergence are improved communication by
using language mutually intelligible by each of the groups and focused attention on
actionable projects that can be achieved now. By focusing on actualization, the developer
can get beyond rhetoric into developing a sustainable project. This allows a developer to
focus on its core competency, which is managing delivery risk. Specifically, a developer
27
that delivers on promised carbon credits should be rewarded by being able to sell
products at a higher margin than a developer that does not meet its carbon credit sales
obligations.
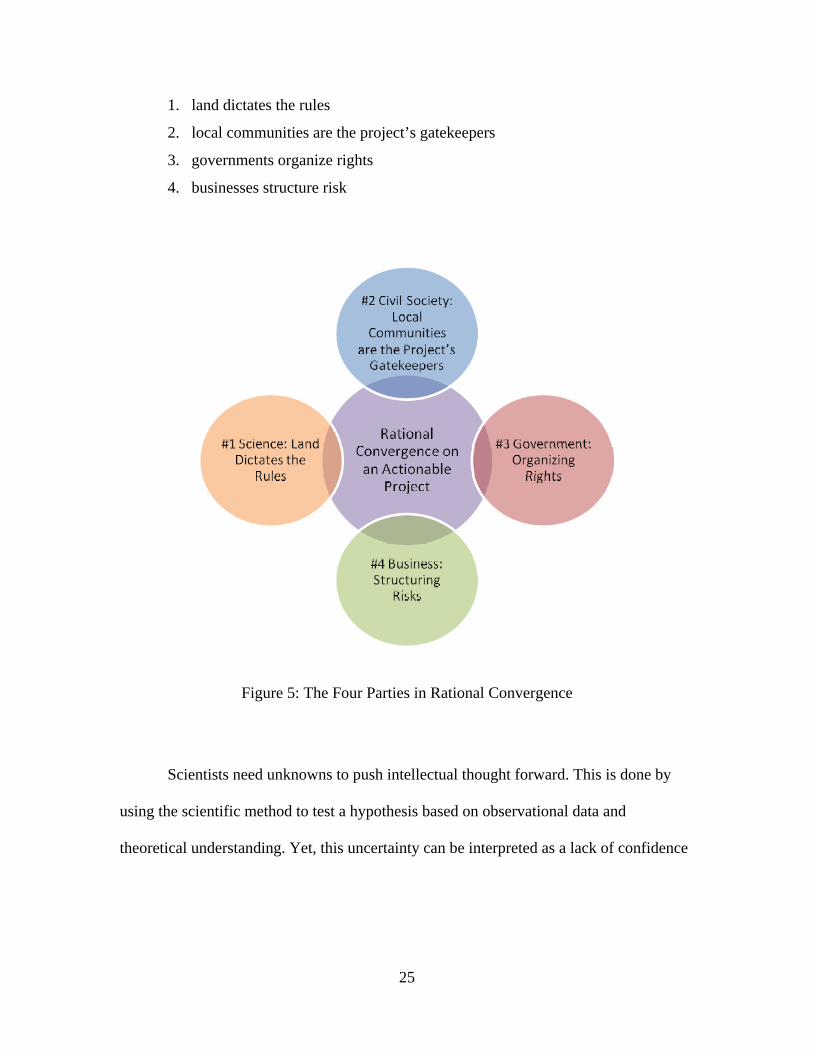
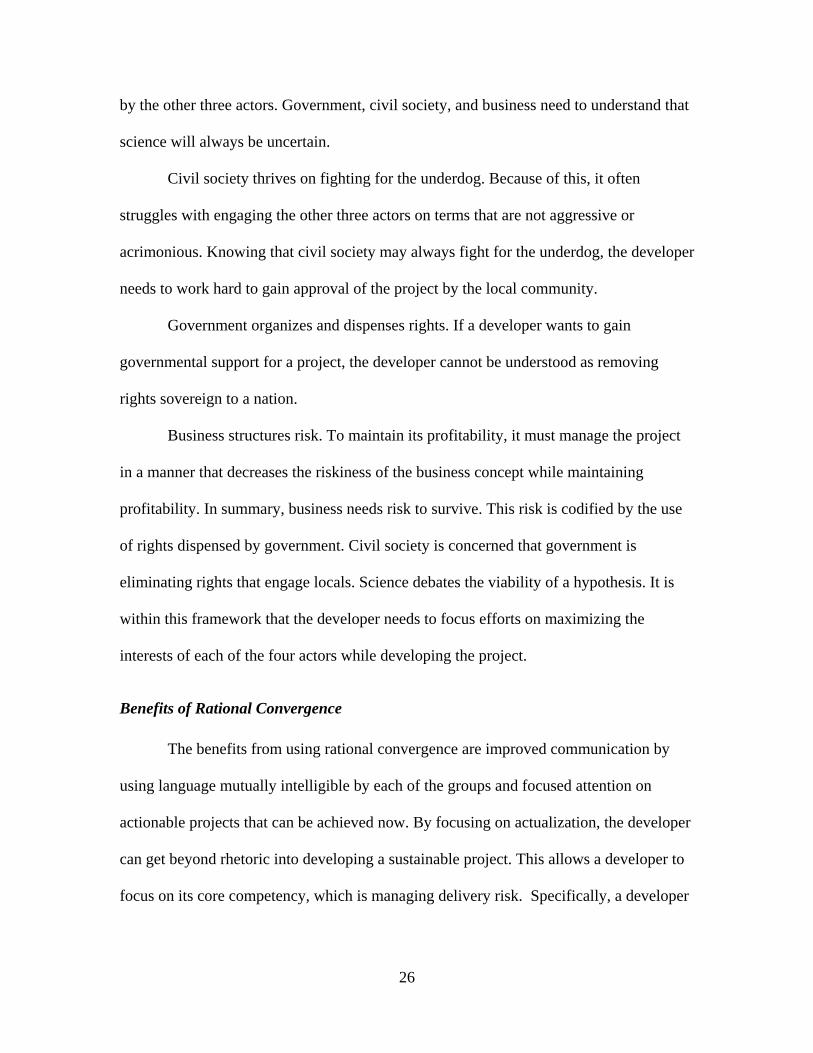
Figure 6 demonstrates how scientists, civil society, governments, and business
leaders might approach a communication challenge. Scientists demonstrate uncertainty
when they say, as in this hypothetical example, “We are 98% sure but still don’t know for
certain.” Civil society assumes, “No one understands communities and conservation like
we do.” Government doesn’t “want to lose our rights to our land” if the project develops.
Figure 6: Rational Convergence and Effective Communication
28
Business needs risk. By gaining support from each actor, the developer promotes
effective communication that promotes an actionable project. This is a manner by which
the developer can employ a triple bottom-line business strategy of people, planet, profit.
Effective Communication with Scientists
Because the land dictates the rules, the developer needs to first understand the
project’s ecological landscape. This can be done by working with local scientists to
understand the ecological framework within and surrounding the project site. Inherently,
the developer needs to take this ecological knowledge and frame what the carbon credit
opportunities would be locally. Once a developer has a strong understanding of the
ecological stage, the developer can then begin to communicate with civil society.
Effective Communication with Civil Society
A successful developer understands that that the local communities are the
gatekeepers because these communities live and work on the land near the project site.
Therefore, local communities can make or break a project. They must be involved in a
manner that is iterative requiring adaptive management. This means encouraging
sustainable community development at the local level—improving water quality,
nutrition, and small business development opportunities and developing local renewable
energy opportunities. In fact, the discussion of carbon credits at the local level may not be
relevant in the beginning. Therefore, effective protection and sustainable community
development depends on developing trust between all rural stakeholders. This can be
done by creating incentive mechanisms such as a community-based forest monitoring
29
program, a sustainable business development program with links to the market for non-
timber forest products, along with micro-financing facilities as part of the project design.
Local communities often view increased conservation as a method in which their
local communal land rights are diminished. Yet a project should facilitate land conflict
resolution hectare by hectare, community by community. With a solid foundation for
consensus building, a project may survive for many years. Having a common framework
at the start of the project allows the developer and the local community to work together
for a successful community sustainable development plan that has a carbon flavor. Local
communities can define incentives to protect their local natural resources on their terms,
while the developer can assist all stakeholders by providing advice, capacity building and
advocacy. Taking the time to plan and implement the winning combination of a host of
solutions is what experts have called best practices in natural resource management. The
developer needs to work within these communities to learn how they understand their
biodiversity, water, forests, and land tenure rights. With this information, the developer
can begin to ask questions related to how nutrition, education, empowerment, land-use
planning, water, sanitation, and energy production can be developed as it relates to
sustainability.
Communities need to be involved in co-developing a land tenure system that
functions for them while enabling the developer to engage the local community with
forest protection. The key first step to resolving these land claim issues is to involve the
community in community participatory mapping. Community participatory mapping
occurs when a geographical information system (GIS) specialist works with the
community asking iterative questions regarding community land claims. Next these
30
claims are mapped and then presented to the community to solicit community
engagement. After an iterative process that seeks to resolve land claim conflicts, the
community can then submit land claims for land tenure. By solidifying community rights
to land, the developer seeks to develop solidarity with the local community in a manner
that resolves conflict and provides for successful and effective communication going
forward.
The developer can use the following steps to resolve land conflict claims. First,
the developer can gain commitment by various actors within the organizations and
community involved in the conflict to engage in a land conflict-resolution program. Next,
the developer can establish an independent third party evaluator to monitor community
action plans. This evaluator will want to publish process and education materials in local
languages. Communities fear further intrusion into their local culture. So a developer
needs to respect local customs while seeking community engagement. Explicitly, the
developer should encourage local community participation in the sustainable
management of resources. Land conflict resolution strategies that do not involve local
customary law and procedures will fail. This failure in the future may increase a
developer’s operating expenses since at a future date the developer may be responsible
for engaging local communities a second time in local land conflict resolution. The
second time around the developer may face greater local antagonism based on previous
failures. This is a fear of the irreversibility of economic harm. The local communities
may not be in a place to judge accurately which scenario is in their best interest. If the
local communities have not considered the nature of their property rights previously, such
31
as who owns the biodiversity rights within a forest, the complexity of the situation may
increase.
Local communities need fairness. They need civil society that represents them
effectively, engaging in protecting their interests and understanding the community’s
interests through the lens of sustainability. Engagement with local communities by
developers and NGOs needs to focus on best practices. These best practices must be
framed to include engagement, local cultural and religious sensitivity, nutrition and
healthcare, sustainability, and improving education and economic opportunities. Without
sustainable economic development, local communities will continue to appropriate value
from their forests as opposed to create value from their forests. The developer can
increase its success by approaching interactions with civil society through the lens of
anthropologist. Culture matters, and positioning a project successfully as developing
equity for local institutions and communities within the project area and outside of the
project area by engaging with the local community and its cultural institutions will
increase the possibility of success for the developer. This is the societal portion of triple
bottom line.
Effective Communication with Government
Governments dispense rights through developing and creating international,
national, regional, and municipal legislation. Dispensing of rights refers to how
governments constantly are expanding and contracting private vs. public rights over time.
The current trends are for fractionalization of communal rights into a bundle of private
32
rights. The developer needs to have clear title to the land that is its raw material, and it
must have the legal capacity to sell the carbon rights from the trees on this land.
Of concern to the developer is the process that governments engage in
redistributing property rights. This process generally has three rule developing
processes—constitutional or statutory, collective choice, and operational. These rules can
be proactive or reactive and made in response to exogenous conditions such as
biophysical and material changes. In the case of the nascent carbon markets, rule making
organizations such as municipalities, provinces, nations, and international bodies can be
encouraged to be proactive in dispensing carbon rights for forests through developing
legislation that develops carbon rights as a function of land tenure, title, and deed. Within
the context of the avoided deforestation carbon market, there are two methods that
entities can use when developing their legal statutes. Entities can use the compliance
market, which is being managed by the United Nations under the Kyoto Protocol, and the
voluntary market. The voluntary market allows for the most flexibility; this is critical
since land is infinitely diverse, and consequently LULUCF requires a flexible, iterative,
and adaptive management statutory support. Essentially, the voluntary market will test
out ideas and methodologies that may migrate to the compliance market. The avoided
deforestation voluntary carbon market assisted by governmental interaction and support
can decrease governmental resources needed to combat climate change, can promote
sustainable development, can facilitate technology transfer, and may be less costly to
implement than other mitigation options.

33
Effective Communication with Business
Business leaders need to structure climate change risk, business risk, and
sovereign / political risk so as to be successful when investing in projects. Structuring of
these risks may diversify these risks allowing for risk mitigation. This process has two
important functions. It can either enhance return while maintaining the same aggregate
risk level or it can maintain return while decreasing the aggregate risk level for the
developer. If the developer can lower its risk profile or increase its returns, it should be
able to secure greater equity funding from the capital markets allowing for scalability.
With scalability, the developer may be able to expand the scope of its business by
protecting more land. Hence, the focus of the avoided deforestation business leader is on
risk mitigation.
Successful Negotiations
Effective communication between science, business, government, and civil
society and the developer are required for a successful iterative and adaptively managed
project to develop. The developer may choose to facilitate the discussion between the
four actors focusing on collaboration. In negotiations, the developer needs to be capable
of inventing options after observing each party’s emotional, intellectual, and spiritual
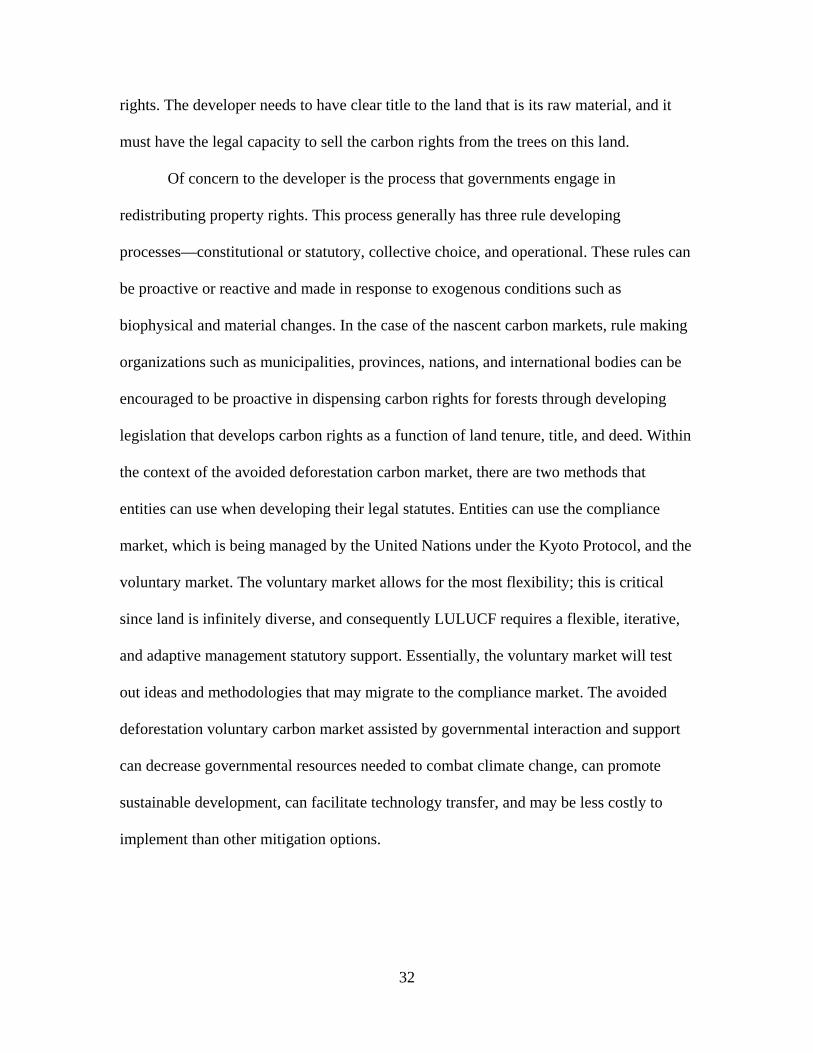
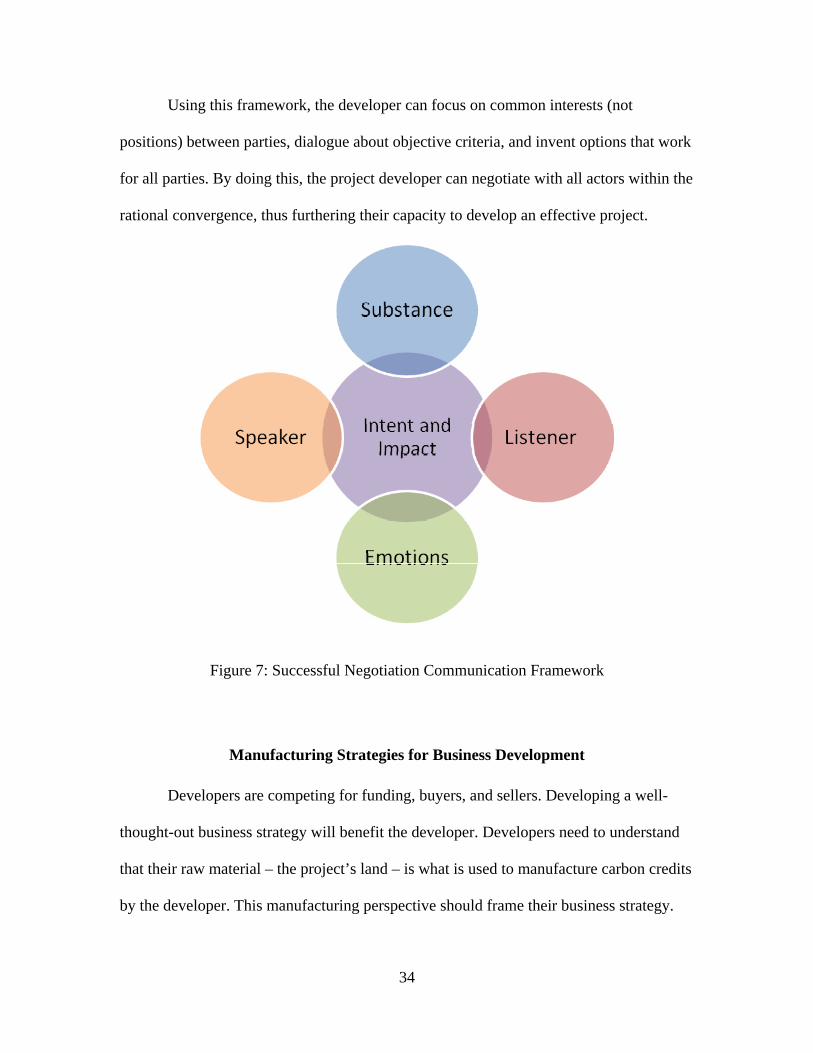
point of view. During a successful negotiation (see Figure 7), a developer beforehand will
need to write up the non-negotiable points with a range of negotiability attached to each,
possible arguments of the other parties, the possible coalitions that could be formed,
various scenarios, and possible creative and innovative solutions.
34
Using this framework, the developer can focus on common interests (not
positions) between parties, dialogue about objective criteria, and invent options that work
for all parties. By doing this, the project developer can negotiate with all actors within the
rational convergence, thus furthering their capacity to develop an effective project.
Figure 7: Successful Negotiation Communication Framework
Manufacturing Strategies for Business Development
Developers are competing for funding, buyers, and sellers. Developing a well-
thought-out business strategy will benefit the developer. Developers need to understand
that their raw material – the project’s land – is what is used to manufacture carbon credits
by the developer. This manufacturing perspective should frame their business strategy.
35
The complementary assets that these developers must have to succeed will
differentiate themselves from one another. Developers, given the nature of starting a new
market, must have strong relationships with their “coopetitors”—the buyers, sellers,
suppliers, and competitors. Yet buyers have no switching costs. Whether a buyer
purchases credits from a developer A or B may make no difference to the buyer. Yet,
getting businesses up and running requires irreversible commitments on the part of the
developer to the seller or project owner. In this regard, branding of the project is critical
to success in this field. Branding will be arrived at by mitigating delivery risk and
performing successfully while managing coopetitor relationships effectively. Developers
may wish to let other developers resolve technological and marketing uncertainty before
entering into the market. Free-riders may follow in a first-mover’s footsteps. In the end,
developers must earn first mover advantage from their investors, sellers, buyers,
scientists, and local communities.
Afuah’s New Game Model for Business Development
The New Game business strategy of Allan Afuah (2007) creates and/or
appropriates values in a different manner than previously enacted. This strategy offers the
opportunity to manufacture new resources and capabilities or translate existing ones. This
creates the opportunity for developers to exploit first-mover advantages while setting
standards that define the new avoided deforestation market. The opportunity for New
Game business models arrives from opportunities and threats within an industry and
macro-environment. Since developers usually have to compete to appropriate or take
36
value from one another, and cooperate to create value, the opportunity for developers
within the framework of global climatic disruption is for cooperation.
An organization can review its current value chain activities and then design and
enact new strategies that affect their value chain creating and appropriating value for their
clients. Customers value products based on values perceived which is an aggregation of
the developer’s abilities and capacities to integrate rational convergence into managing
business risk. Developers need to cooperate with competitors, suppliers, complementary
organizations, and customers to create value. Developers have a choice when developing
a product. They can either create a product that appropriates value, which means taking
value or economic rent from another, or they can create a product that creates value,
which means developing new value or economic rent where economic rent or value
hadn’t previously existed. The developers’ goal is to create value. In other words,
developers will be paid by the market to develop triple bottom-line projects. Developers
can access the carbon markets to secure capital to fund protection of tropical forests.
Developers need to exceed their fixed and variable costs to be sustainable. This
value is split between consumers’ reservation price and developers’ cost. The reservation
price is the price at which the consumers perceive that they have not received enough
value for their purchase (see Figure 8).

37
Figure 8: Calculating Reservation Price, Consumer Surplus, and Producer Surplus
New Game business strategy is a set of activities that are performed in a new
manner. A good example is Henry Ford’s assembly line and mass production. Labor,
goods and services, products, and the quality of the products produced were restructured.
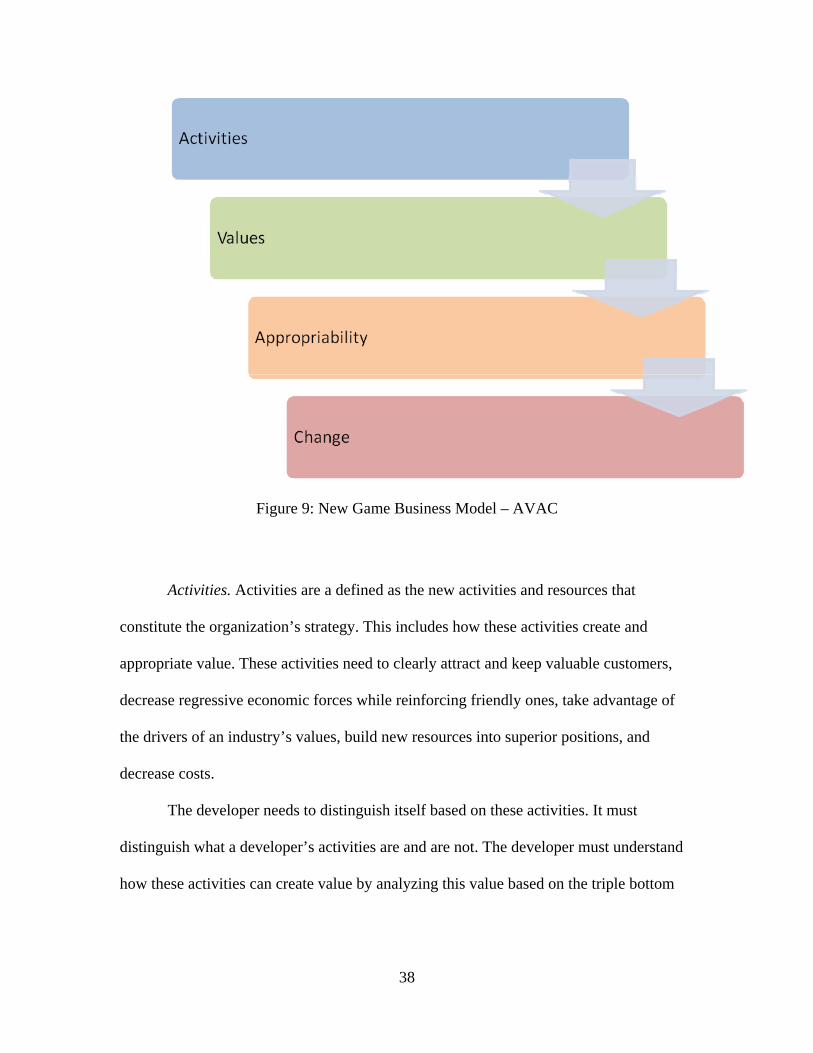
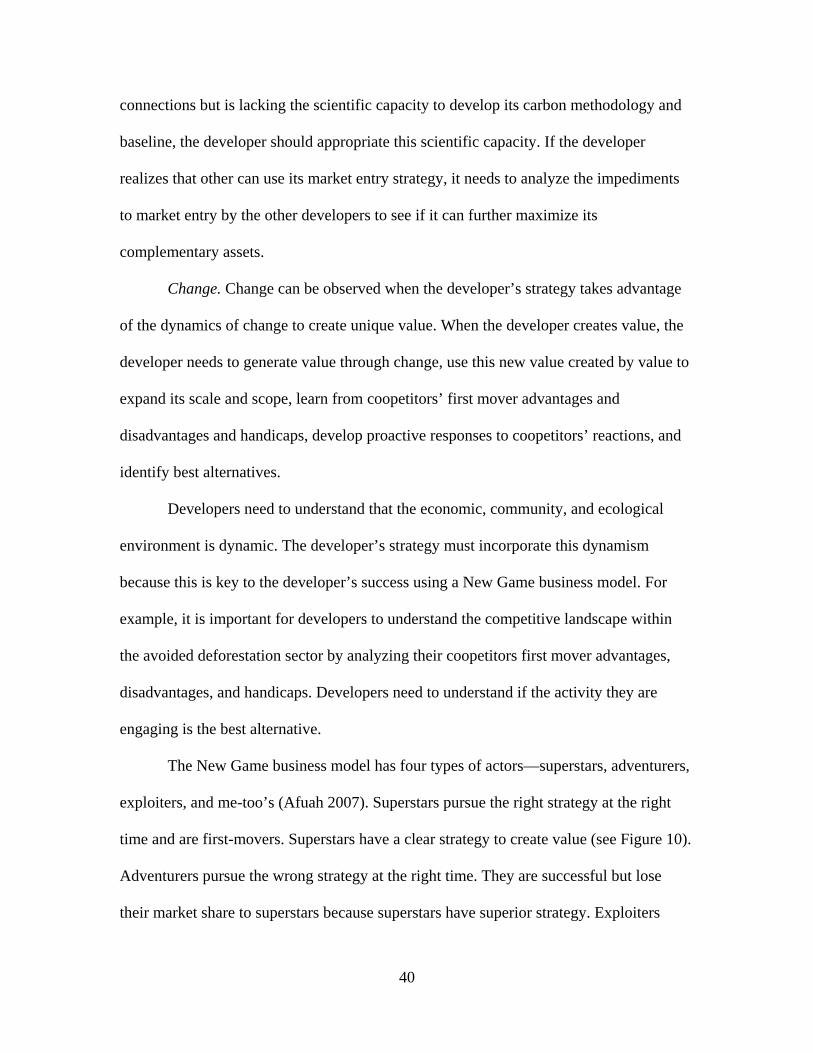
The New Game business model (see Figure 9) has four components—activities,
values, appropriability, and change.
38
Figure 9: New Game Business Model – AVAC
Activities. Activities are a defined as the new activities and resources that
constitute the organization’s strategy. This includes how these activities create and
appropriate value. These activities need to clearly attract and keep valuable customers,
decrease regressive economic forces while reinforcing friendly ones, take advantage of
the drivers of an industry’s values, build new resources into superior positions, and
decrease costs.
The developer needs to distinguish itself based on these activities. It must
distinguish what a developer’s activities are and are not. The developer must understand
how these activities can create value by analyzing this value based on the triple bottom
39
line. A developer must also have an understanding of whether its activities will allow it to
obtain clients, decrease costs, improve resources into superior positions, and take
advantage of an industry’s value drivers.
Values. Values are created by the strategy as understood by competitors and
customers. Values need to explain why a developer is superior to its competitors.
Customers with disposable income need to see this value. Values allow for customers to
understand the product offering. If customers understand the product offering, the
developer can understand if the product is perceived as being of greater, equal, or lesser
value than its competitor’s product offerings. If its customers perceive this value, they
will spend their disposable income on their product.
Appropriability. Appropriability is the strategy allowing the developer to make
money from the value created. The developer needs to have bargaining power over its
coopetitors. The developer needs to understand the market, what the customers’
reservation prices are, and how many customers are there. The developer needs to have
the right complementary assets while understanding if its strategy can be imitated, what
the impediments to its strategy might be, if there are substitutes for the developer’s value,
and if its complementary assets are well used. With appropriability, a developer can
decide if the New Game business model allows the developer to seek economic rent. By
understanding the developer’s bargaining power is over its coopetitors and its
complementary assets, the developer can strategize about how to approach the concession
it has received. Complementary assets are tightly held assets, usually difficult to imitate,
and don’t necessarily offer opportunities to make money easily. For example, if a
developer realizes it has bargaining power over its coopetitors because of political
40
connections but is lacking the scientific capacity to develop its carbon methodology and
baseline, the developer should appropriate this scientific capacity. If the developer
realizes that other can use its market entry strategy, it needs to analyze the impediments
to market entry by the other developers to see if it can further maximize its
complementary assets.
Change. Change can be observed when the developer’s strategy takes advantage
of the dynamics of change to create unique value. When the developer creates value, the
developer needs to generate value through change, use this new value created by value to
expand its scale and scope, learn from coopetitors’ first mover advantages and
disadvantages and handicaps, develop proactive responses to coopetitors’ reactions, and
identify best alternatives.
Developers need to understand that the economic, community, and ecological
environment is dynamic. The developer’s strategy must incorporate this dynamism
because this is key to the developer’s success using a New Game business model. For
example, it is important for developers to understand the competitive landscape within
the avoided deforestation sector by analyzing their coopetitors first mover advantages,
disadvantages, and handicaps. Developers need to understand if the activity they are
engaging is the best alternative.
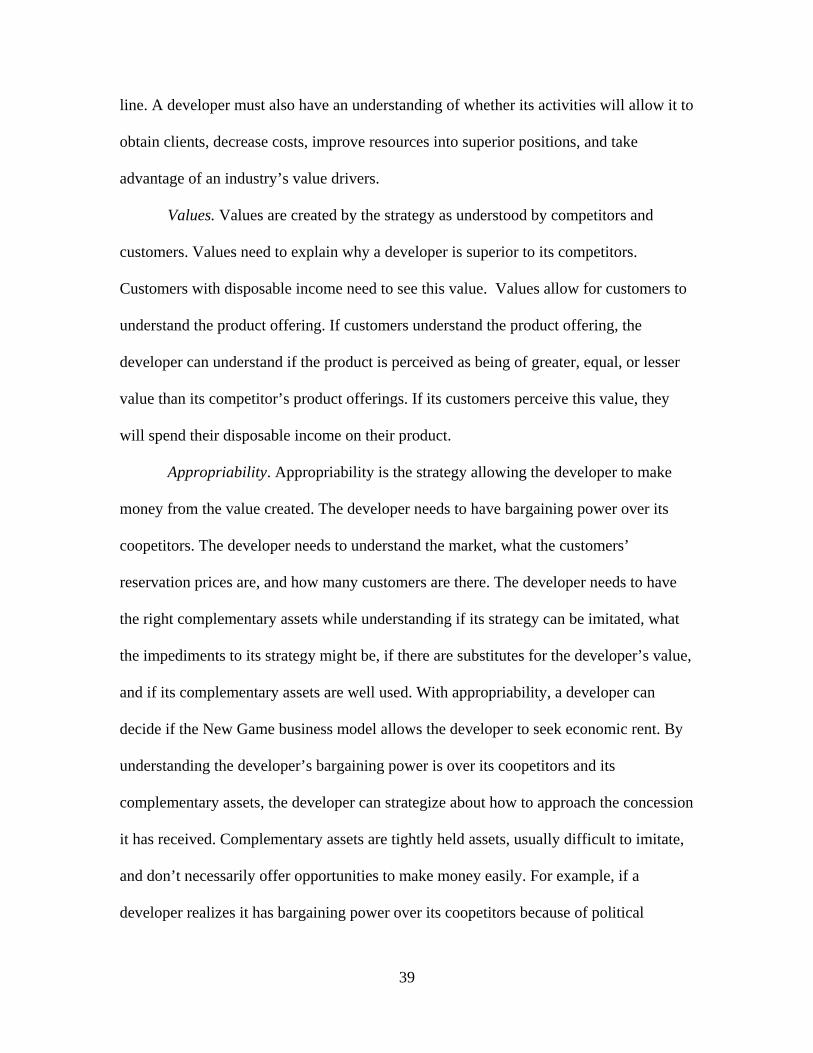
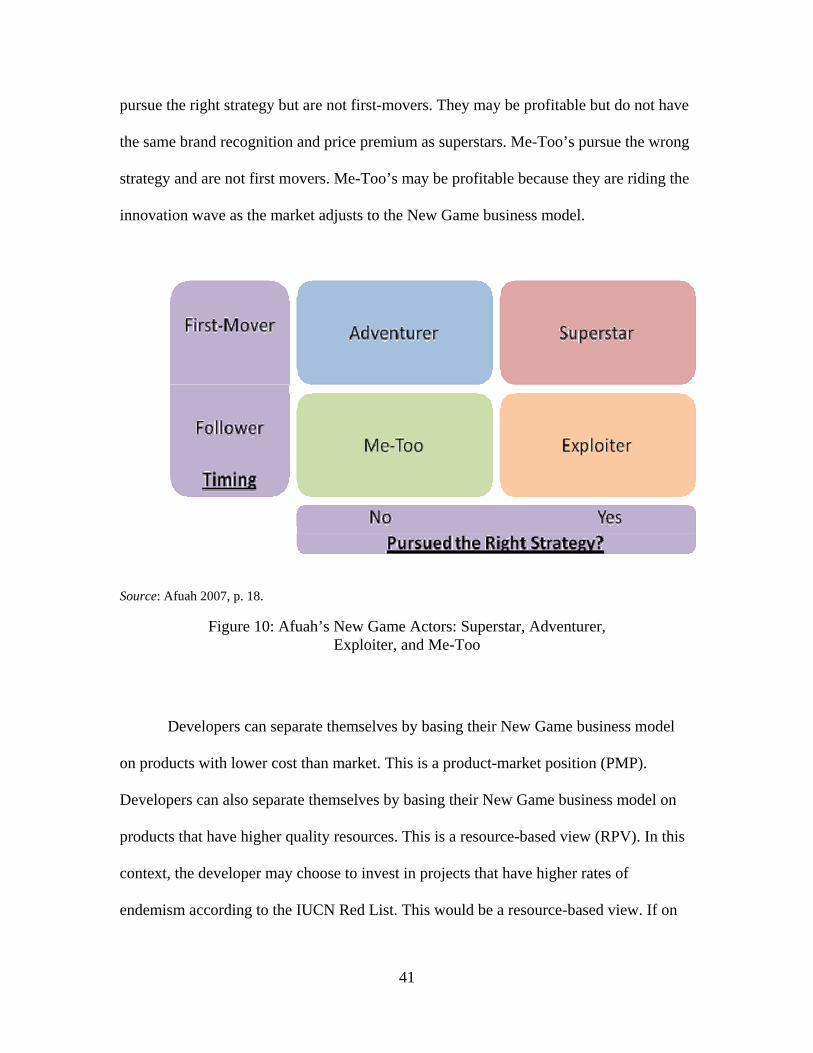
The New Game business model has four types of actors—superstars, adventurers,
exploiters, and me-too’s (Afuah 2007). Superstars pursue the right strategy at the right
time and are first-movers. Superstars have a clear strategy to create value (see Figure 10).
Adventurers pursue the wrong strategy at the right time. They are successful but lose
their market share to superstars because superstars have superior strategy. Exploiters
41
pursue the right strategy but are not first-movers. They may be profitable but do not have
the same brand recognition and price premium as superstars. Me-Too’s pursue the wrong
strategy and are not first movers. Me-Too’s may be profitable because they are riding the
innovation wave as the market adjusts to the New Game business model.
Source: Afuah 2007, p. 18.
Figure 10: Afuah’s New Game Actors: Superstar, Adventurer, Exploiter, and Me-Too
Developers can separate themselves by basing their New Game business model
on products with lower cost than market. This is a product-market position (PMP).
Developers can also separate themselves by basing their New Game business model on
products that have higher quality resources. This is a resource-based view (RPV). In this
context, the developer may choose to invest in projects that have higher rates of
endemism according to the IUCN Red List. This would be a resource-based view. If on
42
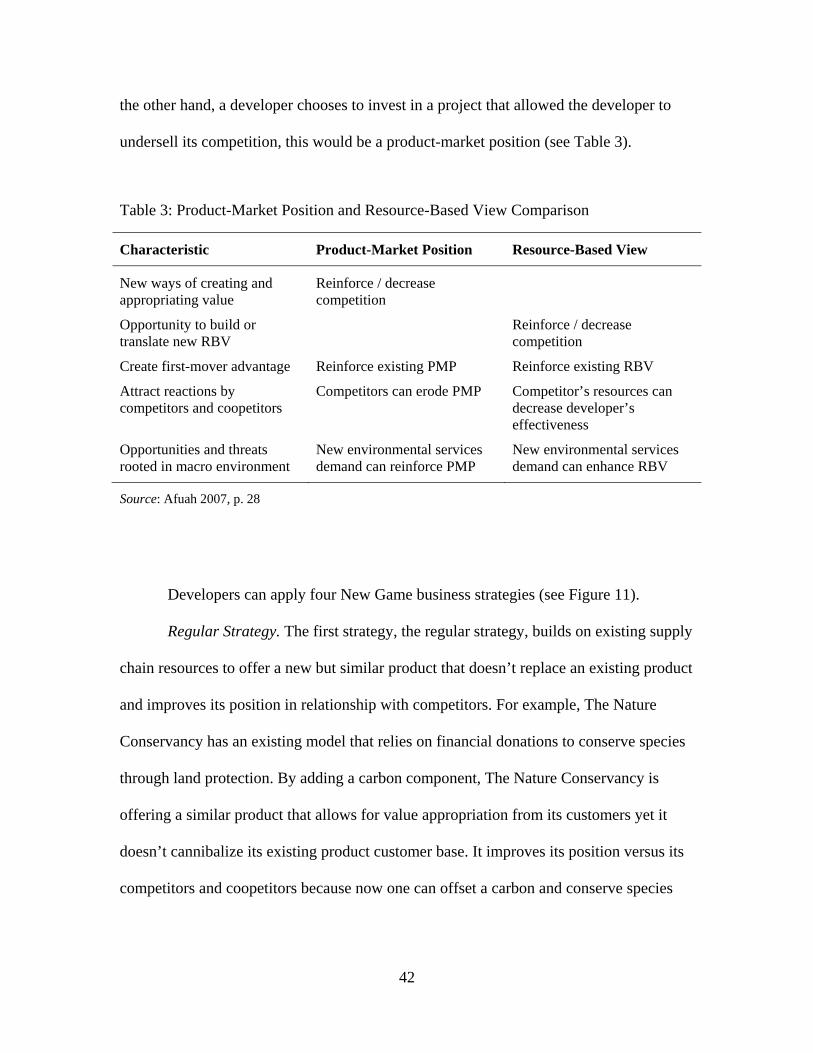
the other hand, a developer chooses to invest in a project that allowed the developer to
undersell its competition, this would be a product-market position (see Table 3).
Table 3: Product-Market Position and Resource-Based View Comparison
Characteristic Product-Market Position Resource-Based View
New ways of creating and appropriating value
Reinforce / decrease competition
Opportunity to build or translate new RBV
Reinforce / decrease competition
Create first-mover advantage Reinforce existing PMP Reinforce existing RBV
Attract reactions by competitors and coopetitors
Competitors can erode PMP Competitor’s resources can decrease developer’s effectiveness
Opportunities and threats rooted in macro environment
New environmental services demand can reinforce PMP
New environmental services demand can enhance RBV
Source: Afuah 2007, p. 28
Developers can apply four New Game business strategies (see Figure 11).
Regular Strategy. The first strategy, the regular strategy, builds on existing supply
chain resources to offer a new but similar product that doesn’t replace an existing product
and improves its position in relationship with competitors. For example, The Nature
Conservancy has an existing model that relies on financial donations to conserve species
through land protection. By adding a carbon component, The Nature Conservancy is
offering a similar product that allows for value appropriation from its customers yet it
doesn’t cannibalize its existing product customer base. It improves its position versus its
competitors and coopetitors because now one can offset a carbon and conserve species
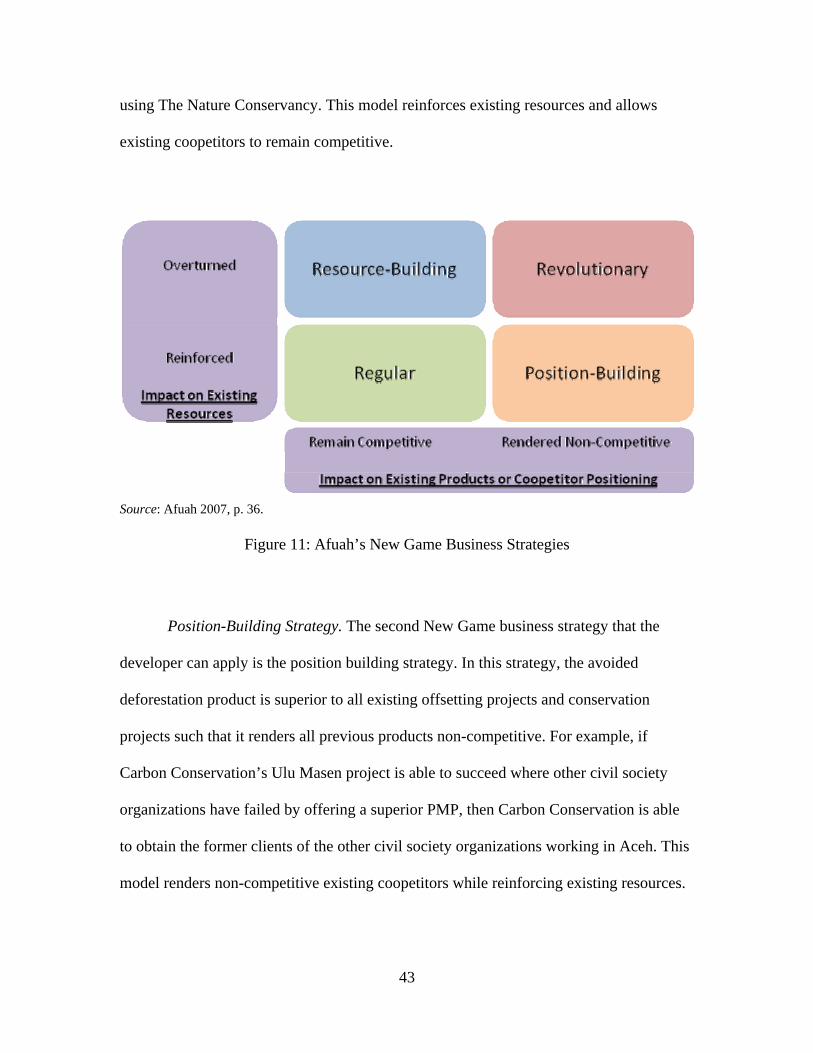
43
using The Nature Conservancy. This model reinforces existing resources and allows
existing coopetitors to remain competitive.
Source: Afuah 2007, p. 36.
Figure 11: Afuah’s New Game Business Strategies
Position-Building Strategy. The second New Game business strategy that the
developer can apply is the position building strategy. In this strategy, the avoided
deforestation product is superior to all existing offsetting projects and conservation
projects such that it renders all previous products non-competitive. For example, if
Carbon Conservation’s Ulu Masen project is able to succeed where other civil society
organizations have failed by offering a superior PMP, then Carbon Conservation is able
to obtain the former clients of the other civil society organizations working in Aceh. This
model renders non-competitive existing coopetitors while reinforcing existing resources.
44
Resource-Building Strategy. The third New Game business strategy that the
developer can apply is the resource-building strategy. In this model, the resources that are
used with the PMP are too different from the resources needed for the resource-building
strategy. This means that the competitive advantage is held by those having the resources;
this model incorporates new resources yet all competitors remain competitive. In this
case, a developer like New Forests launches a completely new product such as its
environmental services portfolio. This product, though, doesn’t detract from existing
competitors’ offerings.
Revolutionary Model. The fourth New Game business strategy that the developer
can apply is the revolutionary model. In this model, the organizational structure of
current PMP developers doesn’t compare to the capabilities of the new offering. All new
products offered by the revolutionary developer render all existing competitor and
coopetitor products non-competitive. Because the revolutionary model makes obsolete all
existing resource based developers and renders non-competitive all existing products, it is
from this strategy that developers can create the greatest value. For example, if Carbon
Conservation and New Forests could offer products that were biodiversity positive,
carbon positive, community positive, and had a high internal rate of return for their
investors, this would be revolutionary.
The avoided deforestation market is developing into the revolutionary stage. It is
fluid with dynamic actors, little cohesion, with the possibility of rewriting how
conservation, overseas development, and institutional investors engage with nature. The
developer’s role is to overlay and stack biodiversity, water, and carbon credits in a
method that yields optimal conservation, community, and climate gains while providing a
45
high internal rate of return. Developers need to focus on which strategy they wish to
employ when deciding to develop a project. The developer can use Afuah’s New Game
business model to provide success.
Emeralds on the Equator –“Zamrud Khatulistiwa”: Thoumi’s Model for Environmental Services
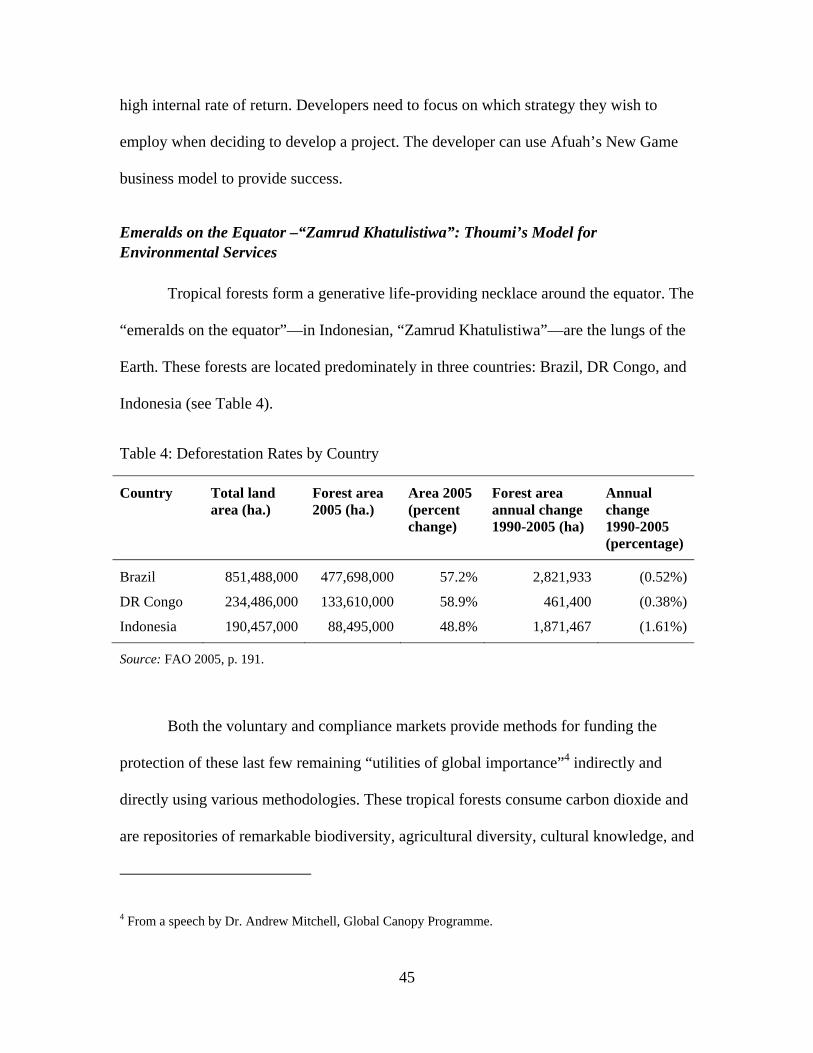
Tropical forests form a generative life-providing necklace around the equator. The
“emeralds on the equator”—in Indonesian, “Zamrud Khatulistiwa”—are the lungs of the
Earth. These forests are located predominately in three countries: Brazil, DR Congo, and
Indonesia (see Table 4).
Table 4: Deforestation Rates by Country
Country Total land area (ha.)
Forest area 2005 (ha.)
Area 2005 (percent change)
Forest area annual change 1990-2005 (ha)
Annual change 1990-2005 (percentage)
Brazil 851,488,000 477,698,000 57.2% 2,821,933 (0.52%)
DR Congo 234,486,000 133,610,000 58.9% 461,400 (0.38%)
Indonesia 190,457,000 88,495,000 48.8% 1,871,467 (1.61%)
Source: FAO 2005, p. 191.
Both the voluntary and compliance markets provide methods for funding the
protection of these last few remaining “utilities of global importance”4 indirectly and
directly using various methodologies. These tropical forests consume carbon dioxide and
are repositories of remarkable biodiversity, agricultural diversity, cultural knowledge, and
4 From a speech by Dr. Andrew Mitchell, Global Canopy Programme.
46
watershed services. These forests are carbon sinks that facilitate change through their
existence because to maintain them sustainably, local communities’ property rights will
need to be supported by democratic rule. This will require an iterative, adaptive
management model that adheres to ecological principles to develop an international
market based on performance.
If tropical forest A outperforms B as a functioning carbon sink, then the local
institutional structures that support A should receive greater remuneration from the
capital markets as long as the basic market criteria of transparency, liquidity, and
assurance of completion are met. Developers can assist with developing governance,
business, and community structures that support local sustainable development through
using carbon sinks. This could spread into a large-scale land use movement.
The developer can do this approaching a defined geographic region and analyzing
it using the Millennium Ecosystem Assessment framework (Reid et al. 2005). This
framework divides ecosystem services into four categories: provisioning, regulating,
cultural, and supporting services. By developing an inventory of services, the developer
can focus on the local opportunities to develop projects in conjunction with other local
sustainable land use patterns.
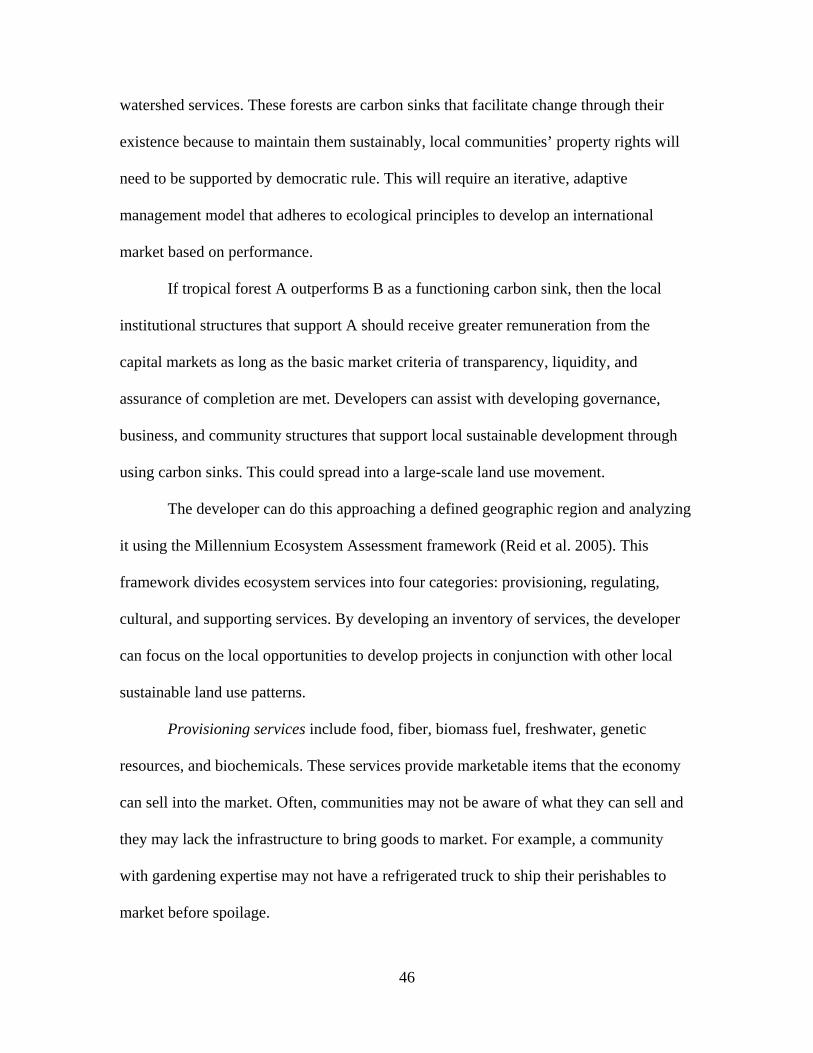
Provisioning services include food, fiber, biomass fuel, freshwater, genetic
resources, and biochemicals. These services provide marketable items that the economy
can sell into the market. Often, communities may not be aware of what they can sell and
they may lack the infrastructure to bring goods to market. For example, a community
with gardening expertise may not have a refrigerated truck to ship their perishables to
market before spoilage.
47
Regulating services include air quality, climate, water, erosion, water purification
and waste, disease, pest, pollination, and natural hazards. These services are treated as
public utilities within a regional land-use planning framework. If not, they are written
into municipal code using a prohibitive legal framework. These laws may have various
and inconsistent levels of local adherence and application.
Cultural services include recreation, ecotourism, and ethical values. Many
communities hope to find economic growth using these services. Often, cultural services
and regulating services are disconnected. If regulating services are not developed, then
marketing and developing cultural services that meet customers’ expectations is
challenging.
Supporting services include nutrient cycling, primary production including carbon
storage, and water cycling. These services generally require international legal contracts,
brokering, divisible and stackable land rights, clean land tenure, and third-party
monitoring, verification, auditing, and certification.
48
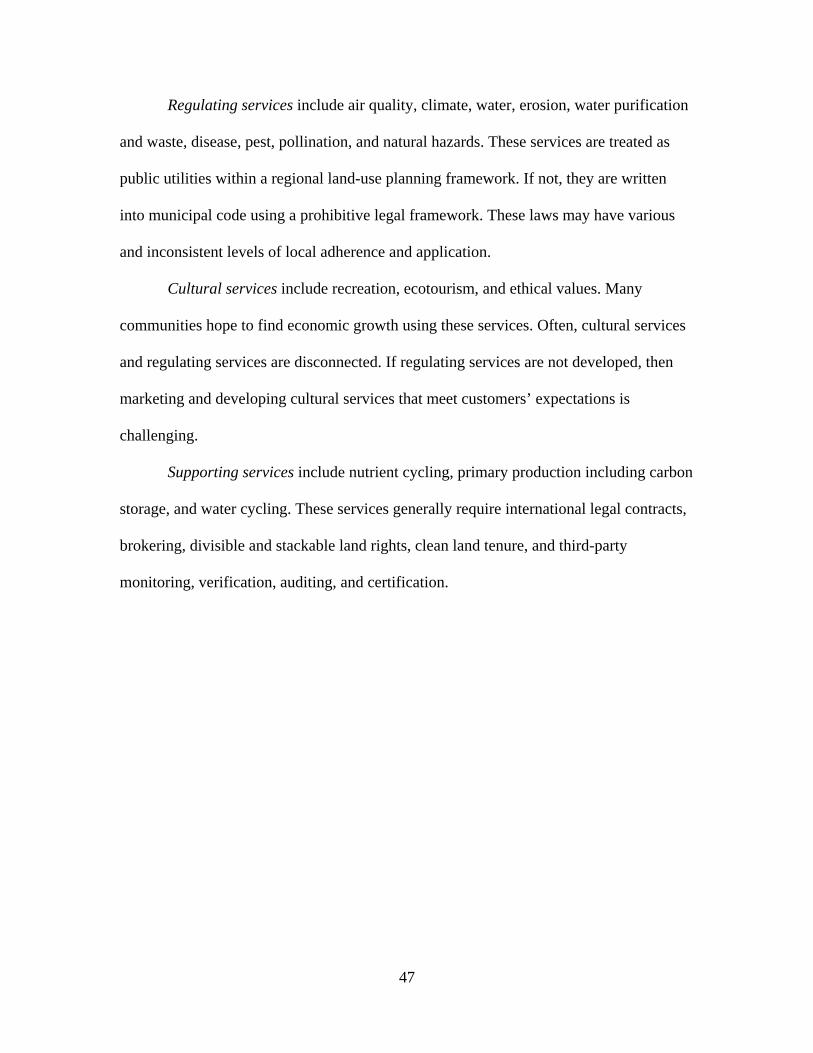
Figure 12: Project Focus for Emeralds on the Equator “Zamrud Khatulistiwa”
These four services are interlinked by the project focus as shown in Figure 12. In
this framework, the developer needs to frame the project’s reference point by focusing on
the intersection between regulating, provisioning, cultural, and supporting services. This
means that local economic stability must be developed. Best practices, using this model,
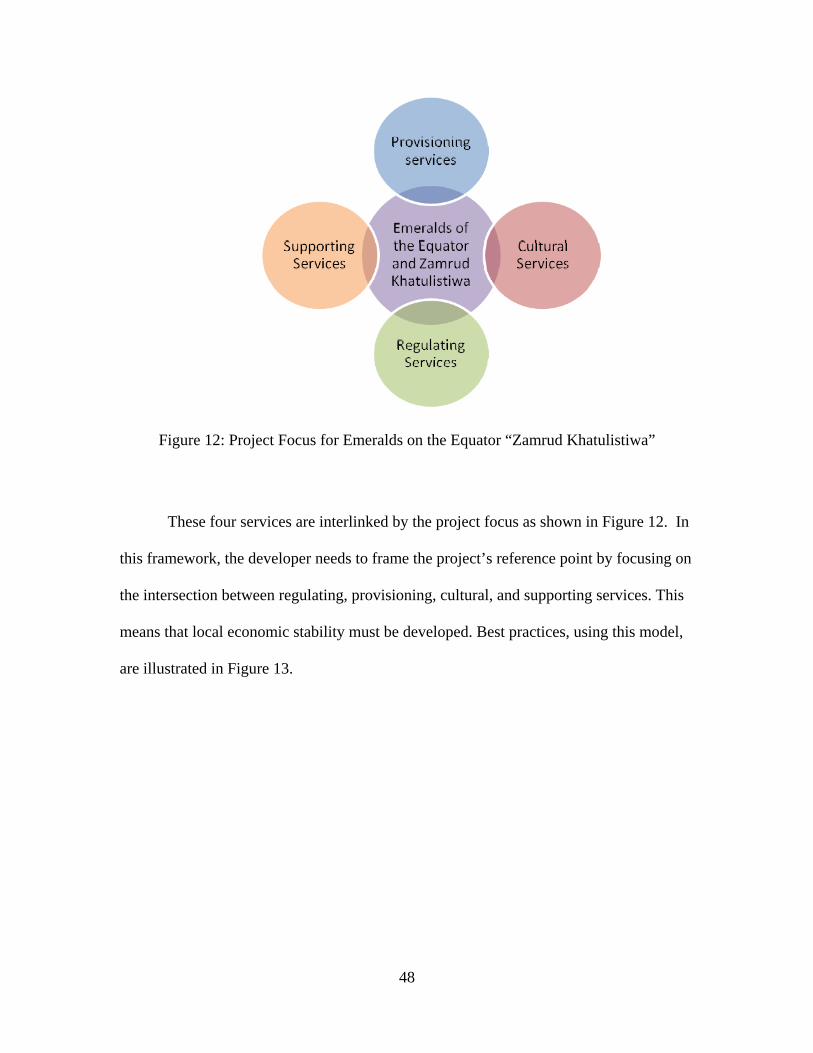
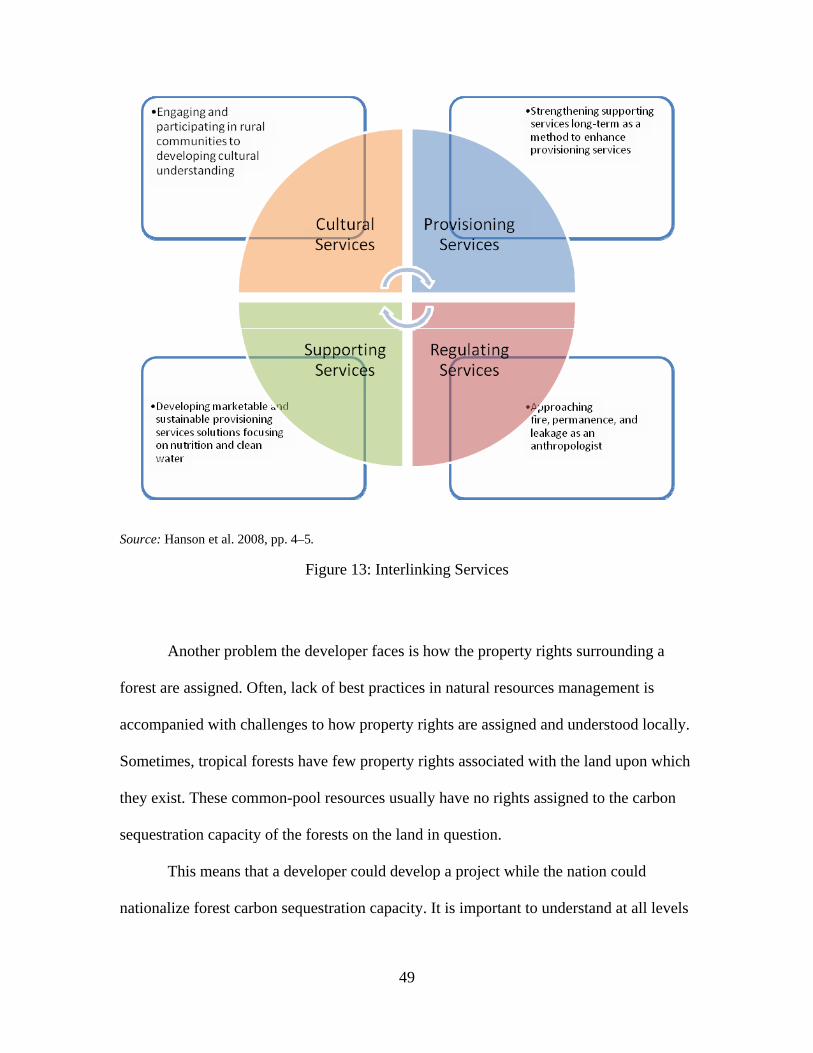
are illustrated in Figure 13.
49
Source: Hanson et al. 2008, pp. 4–5.
Figure 13: Interlinking Services
Another problem the developer faces is how the property rights surrounding a
forest are assigned. Often, lack of best practices in natural resources management is
accompanied with challenges to how property rights are assigned and understood locally.
Sometimes, tropical forests have few property rights associated with the land upon which
they exist. These common-pool resources usually have no rights assigned to the carbon
sequestration capacity of the forests on the land in question.
This means that a developer could develop a project while the nation could
nationalize forest carbon sequestration capacity. It is important to understand at all levels
50
of government who owns the carbon sequestration rights, how they are assigned, and how
they are transferred. Using this model, developers can design iterative and adaptive
management projects that surpass a financial hurdle rate and thereby succeed at stopping
local deforestation.
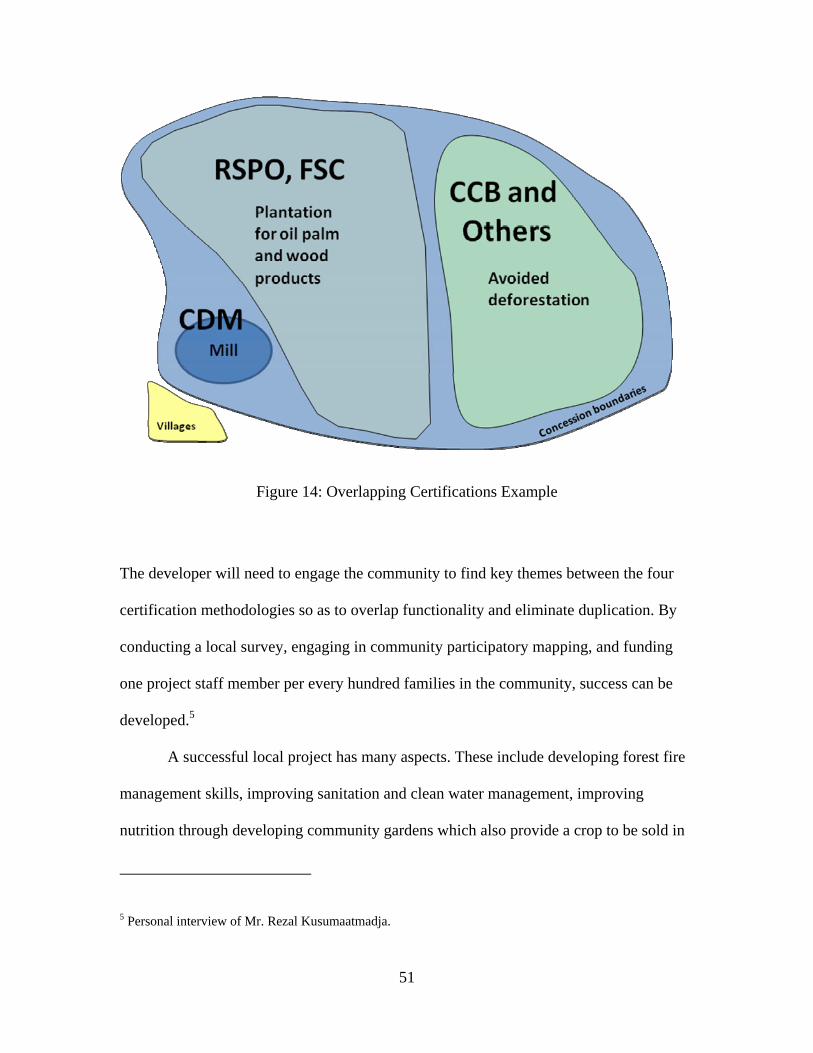
Overlapping Community Rights and Concessions Strategy
A community chooses to develop a project with a developer. The community has
two criteria: maintaining sustainability and developing other forestry and agricultural
industries. The developer is also engaged to develop these other projects if the
community wants to develop the project. Now, the developer is managing a forest, a palm
oil plantation, and biowaste management facility. In this case, the community has decided
part of the business plan for the developer. The developer may need to develop
mechanisms to overlap the following certifications (see Figure 14). Mechanisms could be
using Climate, Community, Biodiversity Alliance (CCB) for forestry carbon, Roundtable
on Sustainable Palm Oil (RSPO) for oil palm, Forest Stewardship Council (FSC) for
forestry products, and Clean Development Mechanism (CDM) for energy from biomass.
51
Figure 14: Overlapping Certifications Example
The developer will need to engage the community to find key themes between the four
certification methodologies so as to overlap functionality and eliminate duplication. By
conducting a local survey, engaging in community participatory mapping, and funding
one project staff member per every hundred families in the community, success can be
developed.5
A successful local project has many aspects. These include developing forest fire
management skills, improving sanitation and clean water management, improving
nutrition through developing community gardens which also provide a crop to be sold in
5 Personal interview of Mr. Rezal Kusumaatmadja.
52
markets, improving Human Development Index (HDI) which is a measure of life
expectancy, per capita GDP, education, and literacy, developing micro-finance and
business credit, improving conservation of biodiversity, improving sustainability of chain
of custody of products, developing value-added products, and improving land tenure
transparency while decreasing local land conflicts. In this example, the community’s
sustainability has improved because of effective communication with the developer,
allowing the project to continue with their project.
Portfolio Management
Once a developer begins to manage a project successfully, it faces a choice. The
developer can manage a single project and market it as a single source of carbon, or else
the developer can expand and begin to develop other projects. If the developer wishes to
develop multiple streams of carbon credits, the benefits are threefold. First, it can begin
to market its carbon credits as a portfolio of assets. Second, it can enhance returns
through scalability of operations, branding, and marketing. Returns may be enhanced by
stacking biodiversity and water quality trading rights on top of carbon credits. Third, by
diversifying the project portfolio, the developer can diversify away sovereign risk,
political risk, baseline risk, and project risk. This could lead to developing a funds
management approach to managing biodiversity, carbon, and water rights.
If the developer wants to expand operations and begin to create a portfolio of
ecosystem services, it may choose to apply the following framework. First, it will want to
clarify its return objective using triple bottom-line metrics—the people, planet, profit
53
strategy—thereby improving people’s livelihoods, enhancing biodiversity, and making
money. Next, the developer will want to describe its risk tolerance by analyzing its ability
and willingness to take risk. From this, it will derive its overall risk tolerance, which
needs to be described in triple bottom-line terms. The developer then will determine the
investment time horizon. Finally, it will analyze a possible portfolio for legal and
regulatory concerns and whether there are any unique circumstances that will affect the
portfolio’s ability to meet these triple bottom-line objectives.
Project Financing
Financing a project can be done by selling carbon credits at different stages of the
carbon credit manufacturing process. The process of calculating forestry carbon
quantities is not the subject of this paper. Carbon credits can be sold forward to finance
implementation and management of the project. Carbon credits can be sold in this fashion
using a success fee percent of index forward pricing contract. This means that the project
aggregator, who may manufacture the carbon credits on behalf of the developer, will
assist with the sale of the carbon credits forward on a pre-sale contract at a percentage of
an index on a future settlement date.
The developer needs to develop a baseline methodology with a financial bottom
line, allowing the developer to focus on implementing actionable projects. The baseline
methodology is an aggregate of current national, regional, local, and ecosystem
deforestation trends averaged with assumptions regarding future business-as-usual
scenarios. The assumptions that support the analysis in the project design document need
54
to be explicit, clear, concise, and supported by scientific analysis and national, regional,
and local trends.
Major Offset Standards. Avoided deforestation carbon credits can be readily
earned under the three major offset standards globally. These standards are
Climate, Community, Biodiversity Alliance (CCB)
Chicago Climate Exchange (CCX)
Voluntary Carbon Standards (VCS)
These three standards are voluntary and are not part of a compliance market. The
available offset categories include growing trees with or without harvest, no cutting of
trees or cutting fewer trees, and using wood for a long time:
1. Growing trees with or without harvest
a. urban forestry (CCX)
b. afforestation (CCX, CCB, VCS)
c. reforestation (CCX, CCB, VCS)
d. managed forest (CCX, CCB, VCS)
2. no cutting of trees or cutting fewer trees
a. avoided deforestation (CCX, CCB, VCS)
b. avoided deforestation mixed use (CCB, VCS)
c. reduction of emissions from deforestation (VCS, CCB)
d. reduction of emission from deforestation and degradation (VCS, CCB)
e. improved forest management and converting logging forests to
conservation forests (VCS, CCB)
3. using wood for a long time
a. long lived wood (CCX)
All three voluntary mechanisms will certify avoided deforestation projects.
55
Selling Credits. Credit can be sold wholesale to institutions or retail to the general
public. Generally, a developer will sell credits sold forward or at a spot price to an
aggregator, broker/dealer, carbon fund, or institution. The carbon fund can be a
multilateral agency, a private fund, or managed by a corporation. Institutions generally
purchase credits for one of three reasons. These reasons are for investment purposes, for
corporate social responsibility, and for speculation. The strategies employed by these
investors are buying and holding credits, investing directly in actual projects, and
investing in funds of diversified carbon assets. In fact, the developer can fund its project
using forward sales and bank guaranteed loans given the developer’s credit and risk
history.
When a developer chooses its certification mechanism from CCB, VCS, and
CCX, it needs to consider many issues such as marketability and price premium;
separation of registry, auditing, verification, and issuance; transparency of accreditation
process; deliverability of biodiversity and community co-benefits; additionality
requirements either using financial or project specific; verification frequency with
preferred verification as frequently as needed by market participants to assure
creditability; ability to manage permanence; registries ability to remove capacity for
double selling; credits removed from the market in an effort to trend towards carbon
positive; and monitoring capacity and carbon pool calculation capacity.6
6This paper does not discuss certification mechanisms. Please refer to Merger and Williams (2008).
56
Project Management
Project Criteria. The developer works within a for-profit overseas development
model that is similar to the Base of the Pyramid (BoP) examples found around the world.7
If developers can develop sustainable local development models that sequester carbon,
funding for project design and operations can come from the carbon markets as long as
the project has additionality, permanence, no leakage, and positive community, climate,
and biodiversity impacts. These are the criteria inherent in any project. The developer
must follow the four rules that dictate rational convergence, which are the land dictates
the rules, the local community is the gatekeeper, governments dispense rights, and
business structures risks. These values can be co-opted by market participants.
Independent, third-party audit is encouraged.
Communication. The developer will want to choose how to strategize how it will
deal with the four actors using rational convergence. This choice will determine how the
developer will market itself to buyers and investors. If it is able to communicate
effectively with the four actors, it will be able to improve market quality. This is critical
to the success of this market since a market requires multiple buyers and sellers and
developers.
Certification. The developer will want to choose which certification it wishes to
pursue. Given how certifications function, the developer may wish to choose to use a
certification mechanism that overlaps with another certification mechanism in an effort to
7 Personal anonymous communication with various developers and interviews of Mr. Rezal Kusumaatmadja.
57
improve marketability. It is recommended that the certification transparently shares
information regarding the project. Also, it is recommended that the developer keep at
arm’s length the interactions between certification, verifier, auditor, and registry. It is also
recommended that all of these actors perform their functions using the utmost
transparency since transparency will provide assurance to market participants.
Audience. The successful developer needs to understand who its audience is,
including civil society, government, science, and business, so as to develop an actionable
transparent project that meets this audience’s needs.
Project Information Note. To start a project, the developer will need the funding
for writing of a project information note (PIN). A PIN describes the facts of a project
such as activities, location, stakeholders, anticipated impacts and anticipated carbon
credits accrued. A PIN can be used to seek development funding. Funding costs for a PIN
can be greater than US$10,000 depending on the project size and complexity. With a
PIN, the developer can demonstrate their anthropological understanding of the
community they are working with including how the community values its forest and the
development process; understands natural hazard risks, leakage, carbon, and biodiversity;
and relates culturally and religiously with its ecosystems. The developer needs to
demonstrate understanding of how the community uses money and bartering, how the
community communicates regarding money, and how the community approaches land
tenure, civil society, and governance.
Letter of No Objection. A host country letter of no objection explicitly supports
the developer seeking funding from institutions, foundations, corporations, development
funds, and private parties. It describes the relationship between these parties, the tenure or
58
length of the proposed agreement, the nature of the possible agreement, and the nature of
the agreement. It will provide a map along with concession data and municipal,
provincial, and national laws that may be applicable. This letter will be part of the
marketing packet that the developer uses to market the development of the project design
document (PDD) to institutional investors. Because of this letter, institutional investors
can have greater assurance that their investment will be respected by national authorities.
Seek Development Funding. With a PIN in hand, the developer can seek
development funding. This funding will be used to implement the project. A developer
needs to budget US$1.50 to US$2.50 per hectare to fund the PDD. To make the project
operational, the developer will need US$9.00 per hectare. This is broken up into eight
categories. These categories are governance and planning at US$2.00 per hectare, science
and research at US$1.00 per hectare, enforcement and zonation at US$0.50 per hectare,
information, education, and communication at US$1.50 per hectare, sustainable
livelihoods at US$2.00 per hectare, marketing at US$0.50 per hectare, finance and
administration at US$1.00 per hectare, and other at US$0.50 per hectare.8 With this
conceptually the target funding amount, the developer can then seek funding from
various interested actors such as investment banks, foundations, civil society
organizations, private individuals, and others.
Project Design Document. The key to writing a successful PDD is to define scale,
scope, and space. Using this framework, the developer can write a functional document
that is iterative and allowing for adaptive management. If bottom-up cost modeling is
8 Personal anonymous communication with various developers and interviews of Mr. Rezal Kusumaatmadja.
59
incorporated into the PDD when implemented, projects can be quite profitable, with
internal rates of return over 15%.
Third-Party Validation. A third-party validation process means an independent
third-party verifier judges the PDD audited against its chosen standard. It is best to
consult the standard to find out about guidelines in choosing a verifier and how to
proceed with this process. The verifier will audit the project implementation process to
confirm that the credits available for sale reflect accurately the process on the described
in the original PDD. The auditor will audit the credit issuance process for double
counting and double selling.
Accounting
As of 15 April 2008, the International Accounting Standards Board (IASB) and
the Financial Accounting Standards Board (FASB) have not issued guidelines on how
developers may account for credits in the voluntary market (IASB 2007c). Guidelines are
needed government in lieu of best practices determines how to account for carbon credits.
Currently, developers either generally use International Accounting Standard 2
Inventories (IAS 2), International Accounting Standard 38 Intangible Assets (IAS 38)
(“Trouble-Entry Accounting” 2007), or account for credits like a manufactured product.
The developer has three choices when choosing how to account for the self-generated
credits. The options are (a) accounting under IAS 2 as “Inventories,” (b) accounting
under IAS 38 as “Intangible Assets,” and (c) accounting as a manufactured product
(IASB 2008). The developer needs to understand that accounting information has
qualitative and quantitative aspects and that its decisions need to reflect accounting’s four
60
conventions—disclosure, materiality, consistency, and conservatism. Accounting
information needs to be relevant, timely, reliable, consistent, and comparable.
The three choices for a developer are to account for credits off-balance sheet as
intangible assets, on balance sheet as inventory, or on balance sheet as manufactured
product. Developers need to choose how to account for their self-generated credits
explicitly as it relates to the following issues. Price Waterhouse Coopers (“Trouble-Entry
Accounting” 2007) considers the following as important issues:
Classification of credits as intangible assets, manufactured product, or inventory;
Recognition of credits on accounting statements previous to third-party audit;
Value ascribed to credits at initial measurement as fair value, nominal value, or inventory;
Value ascribed to credits at subsequent measurement can be lower of cost, net realizable value, or work-in-progress;
Requirements for amortization and impairment of credits depends on if as inventory, then should be valued at the lower of net realizable value or cost; if as an intangible asset, they as no amortization; and if as manufacturing inventory, should use last-in first-out practice;
Presentation of credits on the income statement depends on timeliness associated when the income from the sale of the credits is recognized and both methods suggest that the actual sale of the credits be recognized as ‘other income’; if using the manufacturing accounting paradigm, sales are recognized as income;
Recognition of purchased credits for investment purposes can be recognized as inventory; if as an intangible asset, they must first past the intangible asset test which means all intangible assets must be identifiable, be controlled, and have future economic benefits;
Value of purchased recognized credits at initial measurement should be at cost of purchase and;
Value of purchased recognized credits at subsequent measurement can either be at lower of net realizable value or cost, or at cost less amortization and impairment, or as valued by current inventory.
61
If the developer chooses to use a manufacturing accounting method, it will have
three types of inventory—raw material, work in progress, and finished goods. Accounting
for costs related to project development can be, a priori, assigned to assumed slower
developing portions of the project as method to increase profitability on credits sold
quickly. This can increase income relatively in the short-term. Yet many costs are fixed
such as salaries, depreciation, and rent. Therefore, the developer can increase its income
by adjusting how many credits MtCO2e are “produced.” This means that internally the
developer may want to choose accounting policies based on what different developers in
the avoided deforestation sector use, and if not public at least monitor how reported
income and costs-of-goods sold are impacted by the various accounting assumptions
used.
Developer accounting rules need to be adapted before being applied; otherwise,
law and government will dictate the rules and thus inhibit innovation. While it might be
prudent to acknowledge credits as an asset and inventory on the balance sheet, credits are
a product based on additionality, permanence, and the lack of leakage. Because a credit
represents 1 MtCO2e that is prevented from being emitted into the atmosphere, it is in
effect something that can’t be touched, felt, tasted, and the less of it produced, the more
money earned—in other words, 1 MtCO2e is intangible. Developers need verifiers and
auditors to be able to ensure public assurance of their goods and services related to
1 MtCO2e. Without verification and audit and public information dissemination, the
market may instead demonstrate uncertainty, loss of credibility, and the inability of
accurate comparisons across developers and sectors. Developers need their products to be
fungible and marketable in the marketplace. Given that markets require transparency,
62
liquidity, and assurance of completion to exist, developers must account for credits in a
manner that supports these ideals.
Bottom-Up Cost Accounting. Bottom-up cost accounting separates expected
project costs into eight categories (CCIF 2007). These categories are marketing;
information, education, and communication; science and research; finance and
administration; sustainable livelihoods; enforcement and zonation; governance and
planning; and other. After the developer inputs economic statistics, work-plan strategy,
and sales and marketing assumptions, the model breaks down these costs by these eight
functions as specified by the developer. It is then possible to see how expenses, capital
expenses, and annual net funding needs vary over time. Since projects have dynamic
funding needs over time, it is important for the developer to use a model such as this one
because this model may demonstrate future unplanned cash flows. The developer can
balance its funding needs with required sales needs while maintaining its internal rate of
return.
PDD Adjustment Process
While implementing the project, it is important that the developer also adjust the
PDD to reflect new information. This requires an iterative and adaptive management
process to be clearly defined and implemented. This means new information can adjust
the PDD to improve efficiency and efficacy, increasing the triple bottom line potential of
the project (see Figure 15). The steps in this process are the following:

63
1. begin with a new PDD
2. implement the new PDD
3. monitor results
4. ingest results and discuss feedback
5. adjust operations to reflect feedback
6. rewrite PDD
The PDD then becomes a business plan.
Figure 15: Project Design Document Adjustment Process
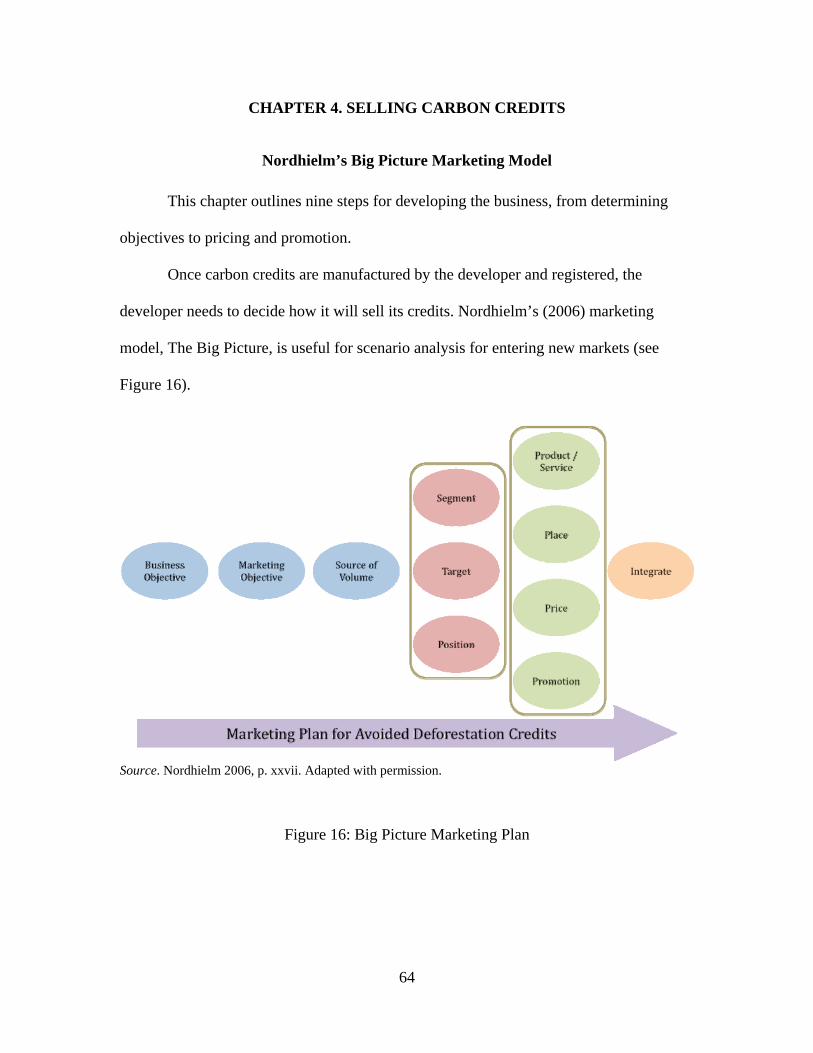
64
CHAPTER 4. SELLING CARBON CREDITS
Nordhielm’s Big Picture Marketing Model
This chapter outlines nine steps for developing the business, from determining
objectives to pricing and promotion.
Once carbon credits are manufactured by the developer and registered, the
developer needs to decide how it will sell its credits. Nordhielm’s (2006) marketing
model, The Big Picture, is useful for scenario analysis for entering new markets (see
Figure 16).
Source. Nordhielm 2006, p. xxvii. Adapted with permission.
Figure 16: Big Picture Marketing Plan
65
A big picture analysis allows the developer to conduct scenario analysis on how to
market its carbon credits while maximizing the triple bottom line of people, planet, profit.
Step 1. Determining the Business Objective
The developer’s first step is to decide its business objective. This is a reference
point for the developer to aid in decision analysis. For example, if the developer is
approached to design a grasslands project and its mission statement is to create carbon
credits from forests, the grassland project should be followed through.
In deciding the business objective, the developer needs to answer three essential
questions.
1. Who are we?— fundamental entity
2. What do we do better than anyone else?— core competence
3. Where should we go from here?— goal
The fundamental entity question, who are we, affects all future marketing
decisions. The fundamental entity needs to be understood from the customer’s
perspective. Is the developer focusing on Asian tropical forest carbon? Is the developer
developing fair-trade carbon with multiple added biodiversity and community benefits?
Does the developer seek to have multiple distinct brands, hybrid/sub-brands, or an
umbrella brand? This customer point of view assists the developer to design a project that
can be easily sold. Umbrella branding versus distinct branding has significant advantages
and disadvantages (Nordhielm 2006). Umbrella branding is more efficient while distinct
branding has higher margins. Because developers are often cash poor and need sales, they
might benefit from using an umbrella brand.
66
The developer determines its core competence by answering what it does better
than anyone else—that is, better than any other competitor or coopetitor.
Once the fundamental entity and the core competence have been decided, the
developer decides on its goal—where to go from here.
When all three questions are answered, business objective is defined within the
framework of the developer’s key strategic asset and key strategic benefit. For example,
if the key asset is location, then the key benefit would be mitigating deforestation at this
location.
Step 2. Defining the Marketing Objective
The developer’s marketing objective is to acquire share. The market is growing
and will not mature for many years, so developers should focus on acquiring rather than
retaining share (see Figure 17). A developer needs to focus its primary investment on
customer acquisition yielding its primary revenues. This makes the developer a startup
company. Ultimately, the developer needs to keep customers, and to do this it needs to
develop customer loyalty.
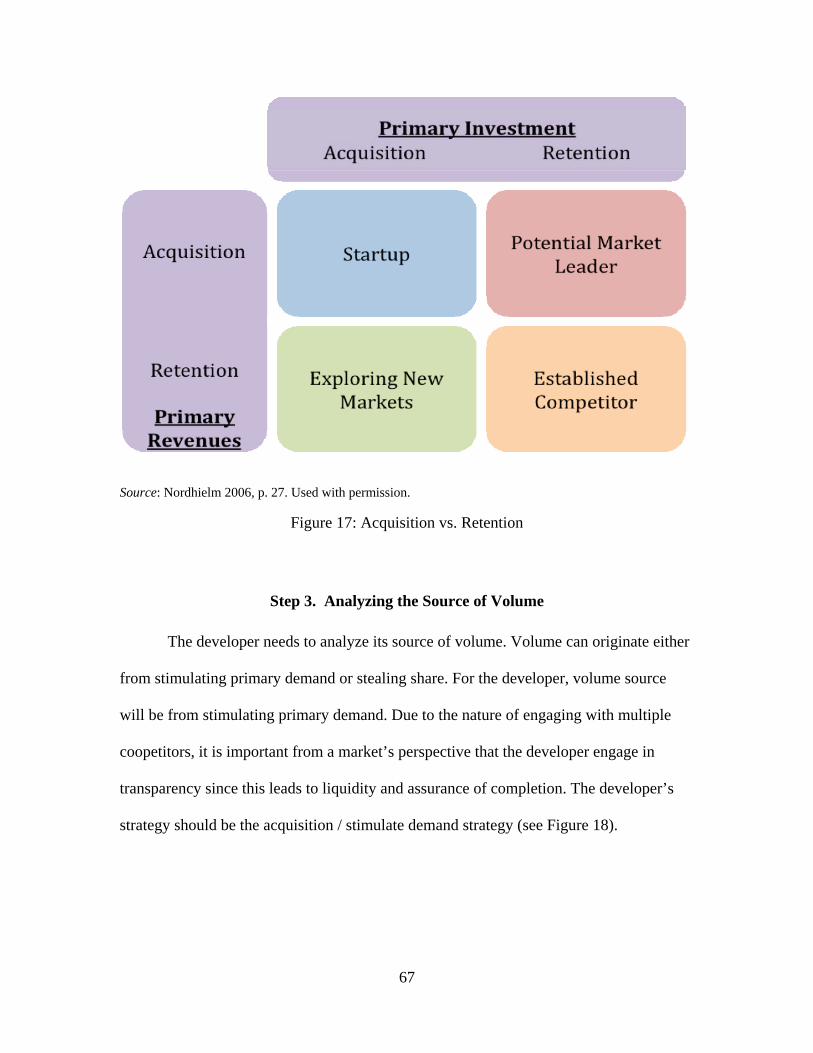
67
Source: Nordhielm 2006, p. 27. Used with permission.
Figure 17: Acquisition vs. Retention
Step 3. Analyzing the Source of Volume
The developer needs to analyze its source of volume. Volume can originate either
from stimulating primary demand or stealing share. For the developer, volume source
will be from stimulating primary demand. Due to the nature of engaging with multiple
coopetitors, it is important from a market’s perspective that the developer engage in
transparency since this leads to liquidity and assurance of completion. The developer’s
strategy should be the acquisition / stimulate demand strategy (see Figure 18).
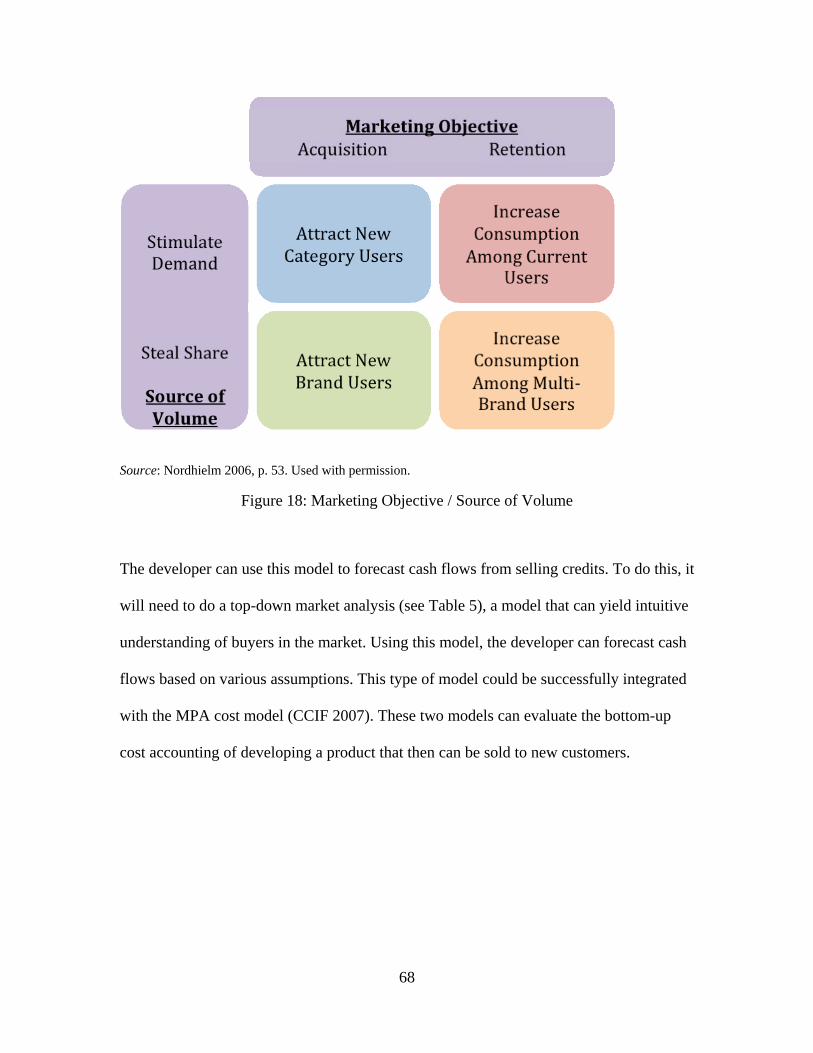
68
Source: Nordhielm 2006, p. 53. Used with permission.
Figure 18: Marketing Objective / Source of Volume
The developer can use this model to forecast cash flows from selling credits. To do this, it
will need to do a top-down market analysis (see Table 5), a model that can yield intuitive
understanding of buyers in the market. Using this model, the developer can forecast cash
flows based on various assumptions. This type of model could be successfully integrated
with the MPA cost model (CCIF 2007). These two models can evaluate the bottom-up
cost accounting of developing a product that then can be sold to new customers.
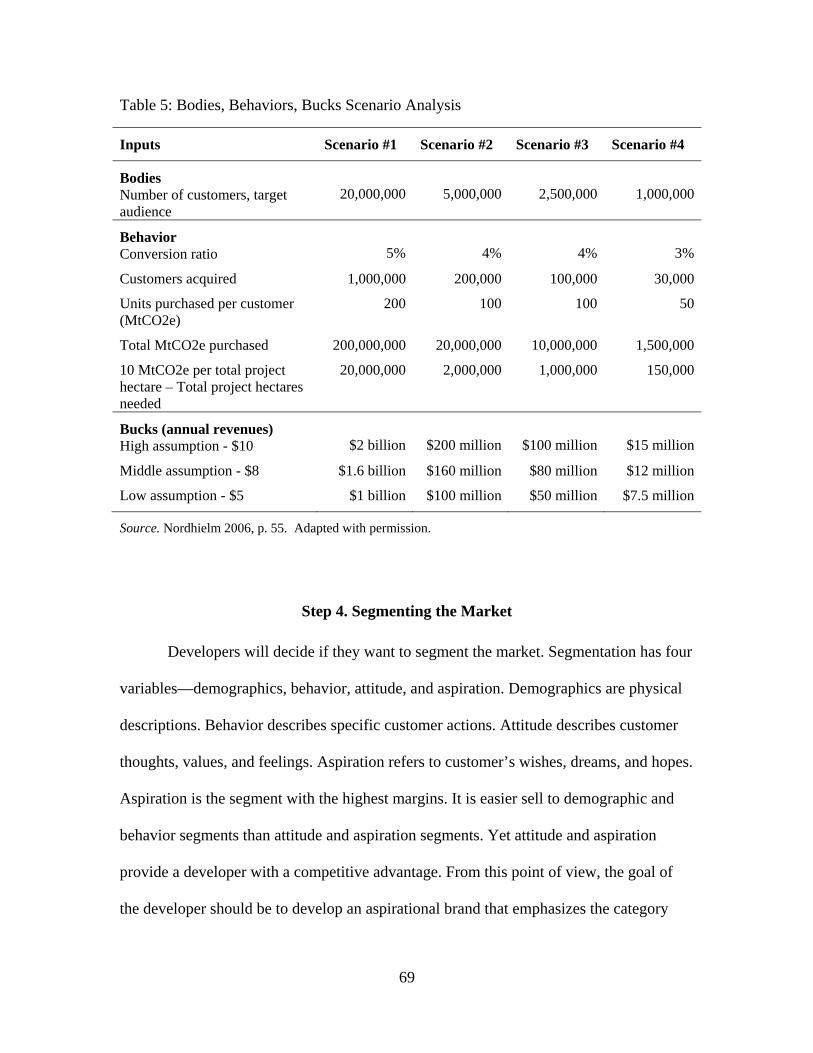
69
Table 5: Bodies, Behaviors, Bucks Scenario Analysis
Inputs Scenario #1 Scenario #2 Scenario #3 Scenario #4
Bodies Number of customers, target audience
20,000,000 5,000,000 2,500,000 1,000,000
Behavior Conversion ratio 5% 4% 4% 3%
Customers acquired 1,000,000 200,000 100,000 30,000
Units purchased per customer (MtCO2e)
200 100 100 50
Total MtCO2e purchased 200,000,000 20,000,000 10,000,000 1,500,000
10 MtCO2e per total project hectare – Total project hectares needed
20,000,000 2,000,000 1,000,000 150,000
Bucks (annual revenues) High assumption - $10 $2 billion $200 million $100 million $15 million
Middle assumption - $8 $1.6 billion $160 million $80 million $12 million
Low assumption - $5 $1 billion $100 million $50 million $7.5 million
Source. Nordhielm 2006, p. 55. Adapted with permission.
Step 4. Segmenting the Market
Developers will decide if they want to segment the market. Segmentation has four
variables—demographics, behavior, attitude, and aspiration. Demographics are physical
descriptions. Behavior describes specific customer actions. Attitude describes customer
thoughts, values, and feelings. Aspiration refers to customer’s wishes, dreams, and hopes.
Aspiration is the segment with the highest margins. It is easier sell to demographic and
behavior segments than attitude and aspiration segments. Yet attitude and aspiration
provide a developer with a competitive advantage. From this point of view, the goal of
the developer should be to develop an aspirational brand that emphasizes the category
70
variable of an avoided deforestation carbon credit’s biodiversity and community co-
benefits within an acquisition / steal share strategy.
Step 5. Targeting Users
The dynamic variable can improve this strategy. This means that the main
variable is greenhouse gas emissions offsets with the dynamic variable being the project’s
co-benefits of biodiversity and community development offered. The developer should
emphasize the co-benefits to segment its product from competitors and coopetitors.
Segmentation variables can include characteristics of the main variable / dynamic
variable such as consumer expectations and company capabilities. As shown in Figure
19, the developer will want to focus its acquisition / stimulate demand strategy on
potential category users. The developer will want to create an imaginary ideal consumer.
This idealized consumer who purchases the developer’s credits needs to be described
including habitat, behaviors, and consumption patterns. This will help design the
developer’s marketing plan.
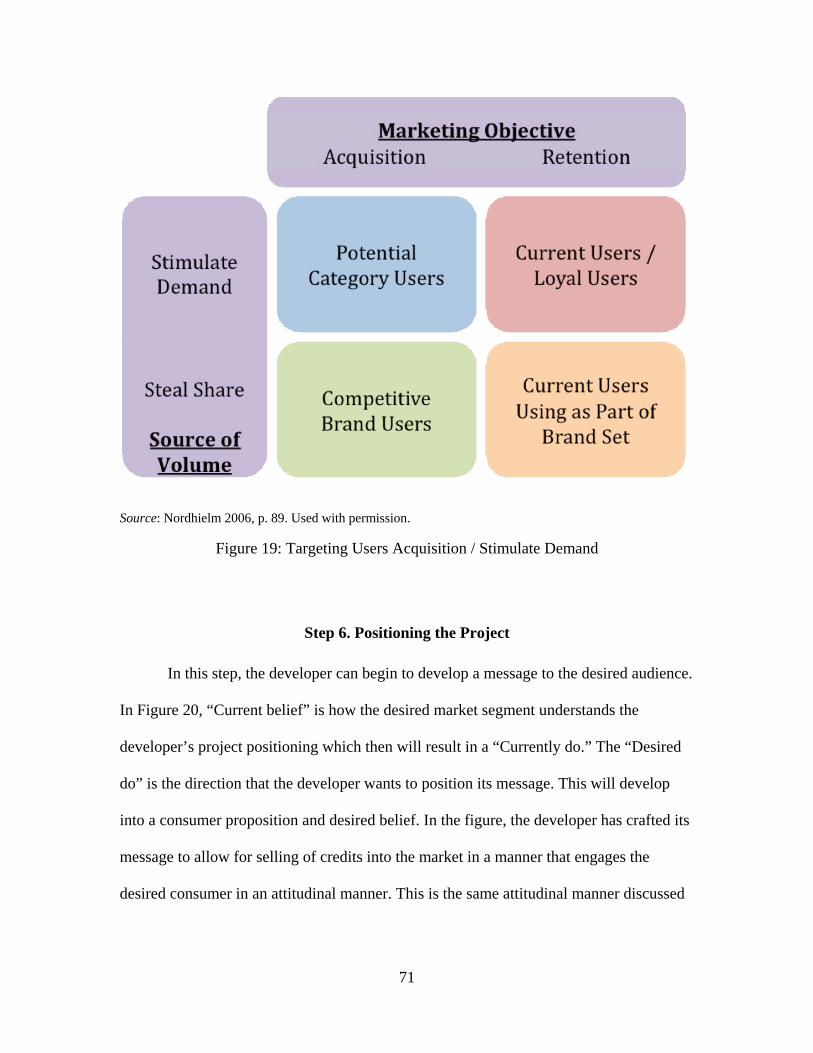
71
Source: Nordhielm 2006, p. 89. Used with permission.
Figure 19: Targeting Users Acquisition / Stimulate Demand
Step 6. Positioning the Project
In this step, the developer can begin to develop a message to the desired audience.
In Figure 20, “Current belief” is how the desired market segment understands the
developer’s project positioning which then will result in a “Currently do.” The “Desired
do” is the direction that the developer wants to position its message. This will develop
into a consumer proposition and desired belief. In the figure, the developer has crafted its
message to allow for selling of credits into the market in a manner that engages the
desired consumer in an attitudinal manner. This is the same attitudinal manner discussed
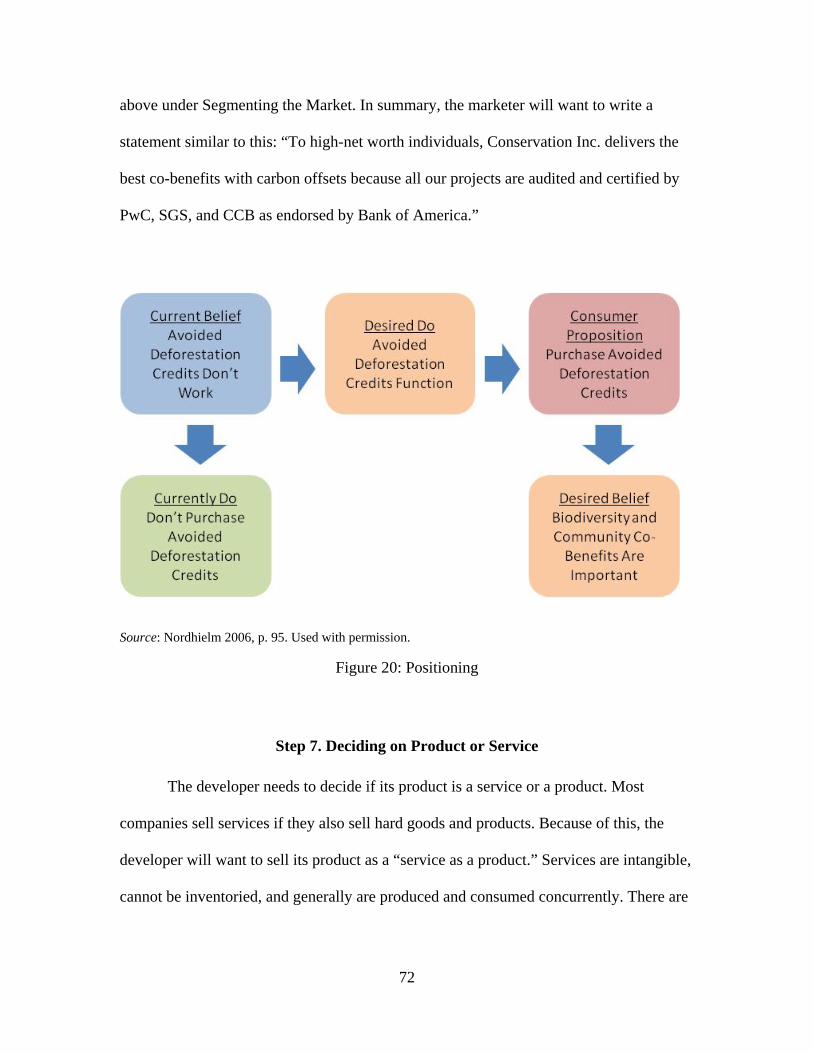
72
above under Segmenting the Market. In summary, the marketer will want to write a
statement similar to this: “To high-net worth individuals, Conservation Inc. delivers the
best co-benefits with carbon offsets because all our projects are audited and certified by
PwC, SGS, and CCB as endorsed by Bank of America.”
Source: Nordhielm 2006, p. 95. Used with permission.
Figure 20: Positioning
Step 7. Deciding on Product or Service
The developer needs to decide if its product is a service or a product. Most
companies sell services if they also sell hard goods and products. Because of this, the
developer will want to sell its product as a “service as a product.” Services are intangible,
cannot be inventoried, and generally are produced and consumed concurrently. There are
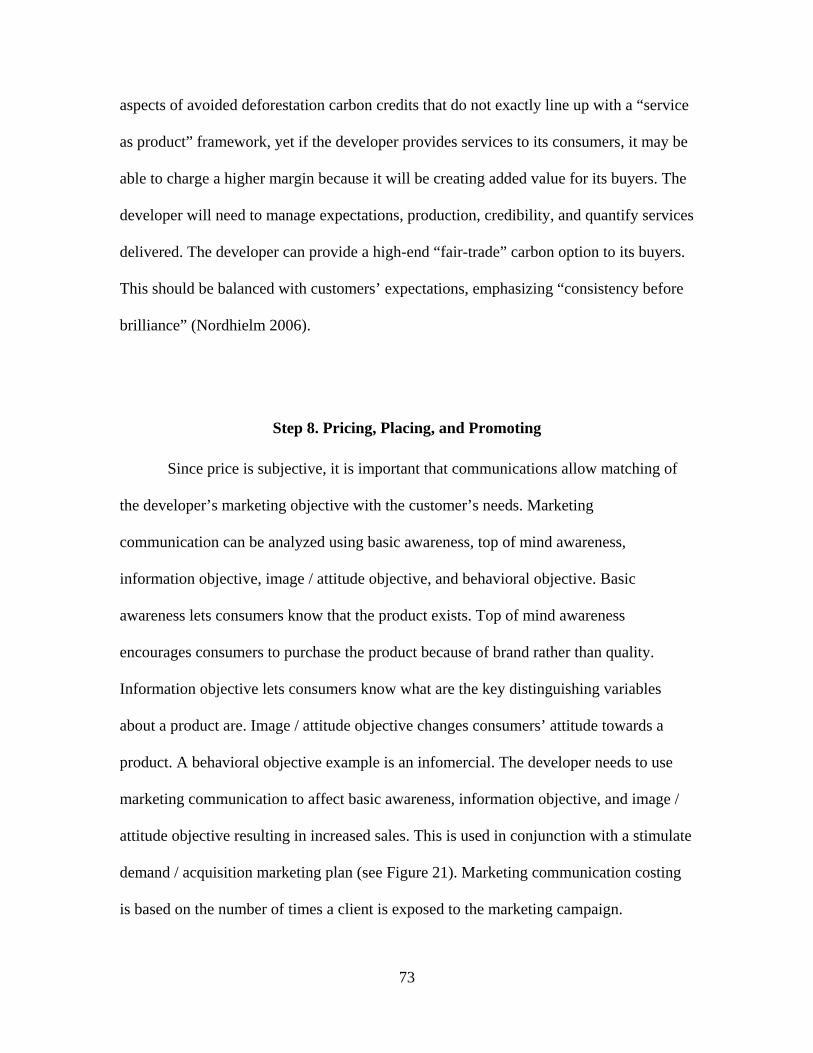
73
aspects of avoided deforestation carbon credits that do not exactly line up with a “service
as product” framework, yet if the developer provides services to its consumers, it may be
able to charge a higher margin because it will be creating added value for its buyers. The
developer will need to manage expectations, production, credibility, and quantify services
delivered. The developer can provide a high-end “fair-trade” carbon option to its buyers.
This should be balanced with customers’ expectations, emphasizing “consistency before
brilliance” (Nordhielm 2006).
Step 8. Pricing, Placing, and Promoting
Since price is subjective, it is important that communications allow matching of
the developer’s marketing objective with the customer’s needs. Marketing
communication can be analyzed using basic awareness, top of mind awareness,
information objective, image / attitude objective, and behavioral objective. Basic
awareness lets consumers know that the product exists. Top of mind awareness
encourages consumers to purchase the product because of brand rather than quality.
Information objective lets consumers know what are the key distinguishing variables
about a product are. Image / attitude objective changes consumers’ attitude towards a
product. A behavioral objective example is an infomercial. The developer needs to use
marketing communication to affect basic awareness, information objective, and image /
attitude objective resulting in increased sales. This is used in conjunction with a stimulate
demand / acquisition marketing plan (see Figure 21). Marketing communication costing
is based on the number of times a client is exposed to the marketing campaign.
74
Source: Nordhielm 2006, p. 146. Used with permission.
Figure 21: Awareness Campaign
It is important for the developer to price discriminate its carbon credits. Avoided
deforestation carbon markets lack transaction transparency. It is difficult to know how
much to pay for which added premiums within the avoided deforestation carbon credit
market spectrum of products. The developer may choose to use penetrating pricing to
enter the market. If it can provide superior customer service, it can then increase its prices
above variable costs. The optimal pricing strategy places the avoided deforestation
carbon credits between the consumer’s reservation price and the developer’s producer
surplus (see Figure 22). This implies that to stimulate demand/acquire share, the
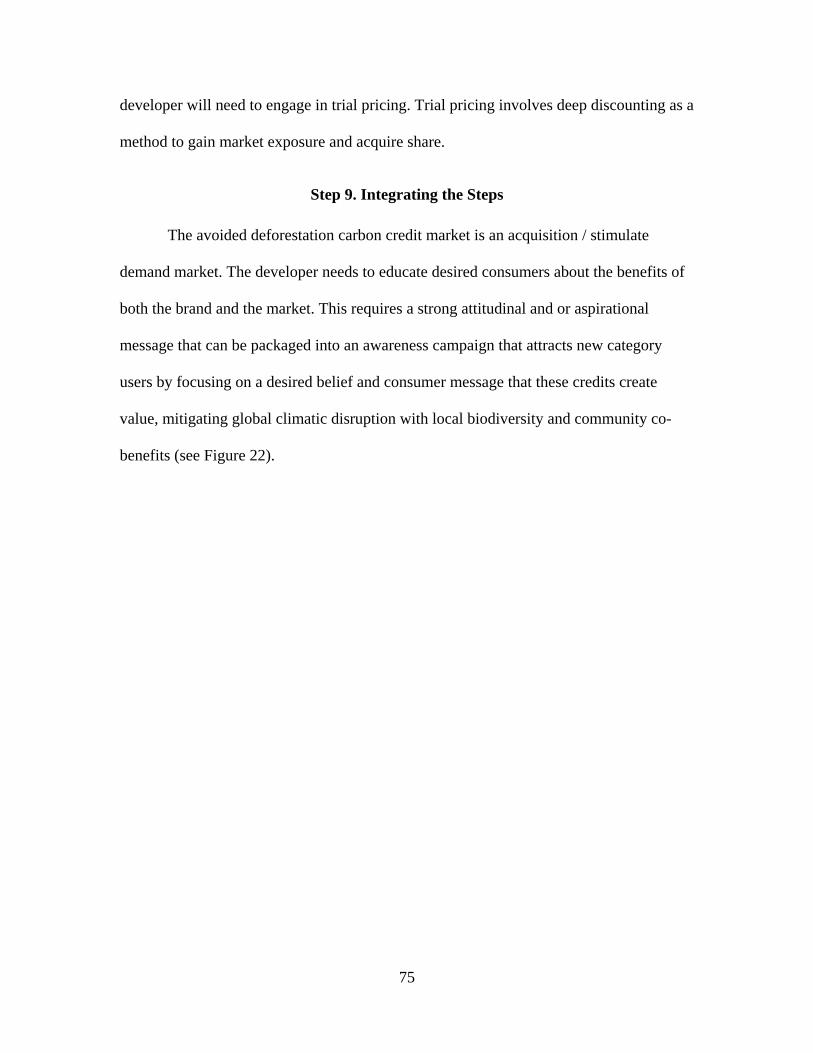
75
developer will need to engage in trial pricing. Trial pricing involves deep discounting as a
method to gain market exposure and acquire share.
Step 9. Integrating the Steps
The avoided deforestation carbon credit market is an acquisition / stimulate
demand market. The developer needs to educate desired consumers about the benefits of
both the brand and the market. This requires a strong attitudinal and or aspirational
message that can be packaged into an awareness campaign that attracts new category
users by focusing on a desired belief and consumer message that these credits create
value, mitigating global climatic disruption with local biodiversity and community co-
benefits (see Figure 22).
76
Source. Nordhielm 2006, p. 166. Adapted with permission.
Figure 22: The Big Picture – Avoided Deforestation Carbon Credit Sales
77
CHAPTER 5. NEXT STEPS:
THE ECOSYSTEM SERVICES CENTURY
The 21st century is the ecosystem services century due to the fact that businesses
and local communities will be able to make money based on conserving and protecting
ecosystem services. Ecosystem services include the services that ecosystems provide
society and the natural ecosystems that societies depend upon. This includes carbon
sequestration, water quality, and biodiversity. In other words, as global climatic
disruption escalates and thousands of hectares of tropical forest are eliminated daily,
destroying their ecosystem services, these services become more valuable to society
because of scarcity and demand by an increasing global population. Therefore, inasmuch
as the 20th century was the century of financial capital, the 21st century is the century of
natural capital.
Project owners and communities and project developers who have read this paper
should now be able to implement the framework of raw materials, manufacturing, and
sales to develop their projects. The project owner manages the land—the raw material
from where carbon credits are created. The project developer develops the avoided
deforestation carbon credit project and then uses the land to manufacture carbon credits.
Both the project owner and project developer sell avoided deforestation carbon credits.
The process is simple.
Thoumi’s Rational Convergence Model for communication clarifies and
simplifies the current avoided deforestation market for the parties involved—scientists,
civil society, government, and business—in order to create the manufacturing base from
which to produce carbon credit offsets. Afuah’s New Game business model allows the
78
project developer to focus the project’s business strategy on action items using the
activities, values, appropriability, and change model. Thoumi’s Emeralds on the Equator
“Zamrud Khatulistiwa” Model allows the project developer to analyze the supporting,
cultural, provisioning, and regulating services to understand and include all aspects of the
ecological services into the project design document. Nordhielm’s Big Picture model
allows the project developer to commercialize and market its projects and avoid issues
that could limit project success.
Sustainable projects require transparency, liquidity, and assurance of completion.
By developing avoided deforestation projects that provide buyers with the capacity to
comparison shop, the avoided deforestation carbon model can develop from its current
infancy into a successful global climatic disruption mitigation mechanism.
79
BIBLIOGRAPHY
Afuah, Allan. 2009. Strategic Innovation. Oxford, UK: Taylor & Francis Group LLC.
Agrawal et al. 2008. Changing governance of the world’s forests. Science, 320: 1460-1462.
Almeida et al. 2007. The costs and benefits of reducing carbon emissions from deforestation and forest degradation in the Brazilian Amazon. Woods Hole, MA: Woods Hole Research Center.
Anderson, Benedict. 1983. Imagined communities. London: Verso.
Ayaz et al. 2003. Conservation and Islam. Islamabad: World Wide Fund for Nature.
Baccini et al. 2007. Reducing CO2 emissions from deforestation and degradation in the Democratic Republic of the Congo: A first look. Woods Hole, MA: Woods Hole Research Center.
Ball, Jeffrey. 2008. Up in smoke: Two carbon-market millionaires take a hit as U.N. clamps down. The Wall Street Journal (April 14). http://online.wsj.com/article_ email/SB120813542203111705-lMyQjAxMDI4MDE4NDExMzQ1Wj.html
Banskota et al. 2007. Reducing carbon emissions through community-managed forests in the Himalaya. Kathmandu: International Centre for Integrated Mountain Development.
Barber, Charles, and James Schweithelm. 2000. Trial by fire: Forest fires and forestry policy in Indonesia’s era of crisis and reform. Washington, DC: World Resources Institute.
Barnes et al. 1998. Forest ecology. New York: Wiley.
Bayon et al. 2007. Voluntary carbon markets: An International business manual to what they are and how they work. London: Earthscan.
Beckerman, Wilfred. 1996. Through green-colored glasses: Environmentalism reconsidered. Washington, DC: Cato Institute.
Benfield et al. 1999. Once there were greenfields: How urban sprawl is undermining America’s environment, economy and social fabric. New York: Natural Resources Defense Council.
Bishop et al. 2008. Building biodiversity business. London: Shell International Limited and the World Conservation Union.
80
Borneo fires. 1997. Photo. NASA Goddard Space Flight Center. September 22, 1997, as viewed by the NOAA-14. Produced by Hal Pierce and Fritz Hasler. http://rsd.gsfc.nasa.gov/rsd/images/Borneo.html (accessed April 12, 2007).
Borrini-Feyerbend et al. 2007. Sharing power: A global manual to collaborative management of natural resources. London: Earthscan.
Botkin, Daniel B. 2007. Forecasting the effects of global warming on biodiversity. Bioscience Magazine 57, no. 3: 227- 236.
Bowden, Marc. 2007. Palm oil, poverty, and conservation in Sabah. Unpublished. http://news.mongabay.com/2007/1023-palm_oil.html (accessed November 3, 2008.
Broekhoff, Derik. 2007. Expanding global emissions trading: Prospects for standardized carbon offset crediting. Washington, DC: International Emissions Trading Association,.
Brown, Lester. 2003. Plan B: Rescuing a planet under stress and a civilization in trouble. New York: Norton.
Brown et al. 2002a. Changes in the use and management of forests for abating carbon emissions: Issues and challenges under the Kyoto Protocol. Philosophical Transactions: Mathematical, Physical and Engineering Sciences, 360, no. 1797, 1593-1605.
Brown et al. 2002b. Measuring, monitoring and verification of carbon benefits for forest-based projects. Philosophical Transactions: Mathematical, Physical and Engineering Sciences, 360, no. 1797, 1669-1683.
Brown et al. 2006. Baselines for land-use change in the tropics: Application to avoided projects. International Energy Studies (October). http://ies.lbl.gov/iespubs/61456.pdf (accessed June 30, 2008).
Building trust in emissions reporting: Global trends in emissions trading schemes. 2007. Price Waterhouse Coopers. www.pwc.com/extweb/pwcpublications.nsf/ docid/8df4237f6b2f7fcf8525728300503b70 (accessed April 15, 2008).
Butler, Rhett A. n.d. Rainforest diversity – Origins and implications. http://rainforests.mongabay.com/0301.htm (accessed April 10, 2007).
Capistrano et al. 2007. Revitalizing the United Nations Forum on Forests: Critical issues and ways forward. Jakarta: Center for International Forestry Research.
Carroll et al. (eds.). 2008. Conservation and biodiversity banking: A manual to setting up and running biodiversity credit trading systems. London: Earthscan.
81
Chimner, R. A. 2004. Soil respiration rates of tropical peatlands in Micronesia and Hawaii. Wetlands 24: 51–56.
Cleary, Daniel F. R. 2005. Vegetation responses to burning of a rain forest in Borneo. Plant Ecology 177: 145- 163.
Coase, R. H. 1931. The nature of the developer. Economica, New Series 4, no. 16 (November): 386-405.
Coase, R. H. 1960. The problem of social cost. The Journal of Law and Economics (October): 1-28.
Conservation and Community Investment Forum (CCIF). 2007. MPA Cost Model 2007. CCIF Publications. http://cciforum.org/ccif_pubs.html
Curran et al. 2004. Lowland forest loss in protected areas of Indonesian Borneo. Science 303: 1000-1003.
Dennis, Rona A. 2006. Impacts on land use and fire on the loss and degradation of lowland forest in 1983-2000 in East Kutai District, East Kalimantan, Indonesia. Singapore Journal of Tropical Geography 27: 30-48.
Dolcemascolo, Glenn Phillip. 2004. Burning issues: Control of fire management in central Kalimantan, Indonesia. Dissertation. Honolulu: University of Hawai’i.
Doyle, Michael, and David Straus. 1976. How to make meetings work. New York: Jove Book.
Ehrlich, Paul R., and Anne H. Ehrlich. 1996. Betrayal of science and reason: How anti-environmental rhetoric threatens our future. Washington, DC: Island Press.
Extent of deforestation in Borneo 1950-2005, and projection towards 2020. 2007. Map. Cartographer, Hugo Ahlenius. New York: UNEP/GRID-Arendal Maps and Graphics Library.
Fisher, Roger, and William Ury. 1981. Getting to yes: Negotiating agreement without giving in. New York: Penguin Books.
Food and Agricultural Organization of the United Nations (FAO). 2005. Global forest resources assessment. Rome: FAO.
Gibbs, Holly, and Martin Herold. 2007. Editorial. Tropical deforestation and greenhouse gas emissions. Environmental Research Letters 2.
Gibbs et al. 2007. Monitoring and estimating tropical forest carbon stocks: Making REDD a reality. Environmental Research Letters 2: 1-13.
82
Gibbs et al. 2008. Carbon payback times for crop-based biofuel expansion in the tropics: the effects of changing yield and technology. Environmental Research Letters, 3 034001. www.stacks.iop.org/ERL/3/034001 (see supplementary data).
Global Forest Watch. n.d. Indonesia: Ongoing initiatives. http://www.globalforestwatch. org/english/indonesia/index.htm (accessed November 3, 2008).
Grafton et al. 2004. The economics of the environment and natural resources. Oxford: Blackwell Publishing.
Greenhalgh et al. 2007. The land use, land-use change, and forestry guidance for GHG project accounting. Washington, DC: World Resources Institute.
Gullison et al. 2007. Tropical forests and climate policy. Science (May 10).
Hadi, Shaummil. 2007. Menjaga Aset, Untuk Keberlangsungan. Ulu Masen (October): 6-11.
Hamilton et al. 2007. State of the voluntary carbon markets 2007: Picking up steam. Washington, D.C.: The Ecosystem Marketplace.
Hamilton et al. 2008. Forging a frontier: State of the voluntary carbon markets 2008. Washington, D.C.: The Ecosystem Marketplace.
Hanson et al. 2008. The corporate ecosystem services review: Guidelines for identifying risks & opportunities arising from ecosystem change. (March 11). http://www.wri.org/publication/corporate-ecosystem-services-review (accessed November 7, 2008).
Hashimoto et al. 2000. Changes in carbon storage in fallow forests in the tropical lowlands of Borneo. Forest Ecology and Management 126: 331-337.
Herawati, Hety, and Daniel Murdiyarso, eds. 2005. Carbon forestry: Who will benefit? Proceedings of Workshops on Carbon Sequestration and Sustainable Livelihoods. Jakarta: Inti Prima Karya.
Hirano et al. 2007. Carbon dioxide balance of a tropical peat swamp forest in Kalimantan, Indonesia. Global Change Biology 13: 412-425.
Hoffman, Andrew J. 2000. Competitive environmental strategy: A manual to the changing business landscape. Washington, DC: Island Press.
Hoffman, Andrew J., and Douglas Glancy. 2007. Carbon strategies: How leading companies are reducing their climate change footprint. Ann Arbor, Michigan: University of Michigan Press.
83
Hokenson, Michael. 2005. The implements of a new empire: Deforestation, community forest management and microfinance in the forests of Cambodia. Thesis, University of Michigan.
Holdren, John. 2008. The science and economics of sustainability: Managing the competing uses of land, water, and forests under a changing climate. PowerPoint presentation. Global Katoomba Meeting 12, Smithsonian's Baird Auditorium, Washington, D.C. (June 9).
Holmgren et al. 2007. Forest monitoring and assessment for climate change reporting: Partnerships, capacity building and delivery. Forest Resources Working Paper, Forest Resources Assessment Programme: Rome.
Hooijer et al. 2006. PEAT-CO2, Assessment of CO2 emissions from drained peatlands in SE Asia. Delft: Delft Hydraulics.
Hopper, Kim, and Ernest Cook. 2004. Conservation finance handbook: How communities are paying for parks and land conservation. San Francisco: The Trust for Public Land.
Houghton, R.A. 2003a. Emissions (and sinks) of carbon from land-use change: Estimates of national sources and sinks of carbon resulting from changes in land use, 1950 to 2000. Woods Hole Research Center. http://cait.wri.org/downloads/DN-LUCF.pdf (accessed April 10, 2007).
Houghton, R.A. 2003b. Revised estimates of the annual net flux of carbon to the atmosphere from changes in land use and land management. Tellus, 55B, 378–390.
Humphreys, David. 2006. Logjam: Deforestation and the crisis of global governance. London: Earthscan.
Intergovernmental Panel on Climate Change (IPPC). 2007: Climate Change 2007: Synthesis Report. Contribution of Working Groups I, II and III to the Fourth Assessment Report of the Intergovernmental Panel on Climate Change [Core Writing Team, Pachauri, R.K and Reisinger, A (eds.)]. IPCC, Geneva, Switzerland.
International Accounting Standards Board. 2005. International Accounting Standards Board withdraws IFRIC 3. (July). http://www.iasplus.com/pressrel/ 0507withdrawifric3.pdf (accessed April 15, 2008).
International Accounting Standards Board. 2007a. IAS 2 inventories. http://www.iasb.org/NR/rdonlyres/C3CB7566-055E-46A7-9282-EADC01FAE351/0/IAS2.pdf (accessed April 15, 2008).
84
International Accounting Standards Board. 2007b. IAS 38 intangible assets. http://www.iasb.org/NR/rdonlyres/ E52C2F1A-DA51-4CFC-A363-9E84920D6EED/0/IAS38.pdf (accessed April 15, 2008).
International Accounting Standards Board. 2007c. Information for observers. http://www.iasb.org/NR/exeres/ DACA1A9C-E2BB-4EB0-AEF5-7C7977A5BE75.htm (accessed April 15, 2008).
International Accounting Standards Board. 2008. Emission trading schemes. http://www.iasb.org/NR/rdonlyres/ D0D0B44A-254A-4112-9FCE-34178B236D07/0/ ProjectUpdateEmission022008.pdf (accessed April 15, 2008).
International Crisis Group. 2005. Weakening Indonesia's Mujahidin networks: Lessons from Maluku and Poso. Crisis Group Asia Report No.103 (October 13). http://www.crisisgroup.org/home/index.cfm?l=1&id=3751 (accessed November 3, 2008)
International Emissions Trading Association. 2007. Expanding global emissions trading: Prospects for standardized carbon offset crediting. www.ieta.org/ieta/www/ pages/getfile.php? DocID=2730 (accessed April 15, 2008).
International Energy Agency (IEA). 2006. IEA energy statistics. http://www.iea.org/Textbase/stats/index.asp (accessed November 3, 2008).
International Tropical Timber Organization. 2002. ITTO manuallines for the restoration, management and rehabilitation of degraded and secondary tropical forests. Yokohama, Japan.
Jauhiainen et al. 2005. Carbon fluxes from a tropical peat swamp forest floor. Global Change Biology 11: 1788 – 1797.
Kanen, Joost. 2006. Carbon trading and pricing. London: Environmental Finance Publications.
Kanninen et al. 2007. Do trees grow on money? The implications of deforestation research for polices to promote REDD. Jakarta: Center for International Forestry Research.
Kenny, Alice. 2007. Putting billions to work for wetlands. Environmental Finance (December-January): 18-19.
Kidder, Tracy. 2003. Mountains beyond mountains: The quest of Dr. Paul Farmer, a man who would cure the world. New York: Random House.
Kollmuss et al. 2008. Making sense of the voluntary carbon market: A comparison of carbon offset standards. Berlin: World Wide Fund for Nature.
85
Kumagai et al. 2004. Carbon and water cycling in a Bornean tropical rainforest under current and future climate scenarios. Advances in Water Resources 27: 1136-1150.
Kusumaatmadja, Rezal, and Gabriel Thoumi. 2007. Land dictates the rules and rural communities are the gatekeepers. The Jakarta Post (December 4), UNFCCC Bali COP edition 4.
LaBatt, Sonia. 2007. Carbon Finance: The financial implications of climate change. Hoboken, NJ: John Wiley and Sons.
Laurance, William and Rhett Butler. 2008. New strategies for conserving tropical forests. Trends in Ecology and Evolution: 974.
Laurance et al. 2008. Does rainforest logging threaten marine turtles? Oryx, 42, no. 2: 1-6.
Manualbook to financing CDM projects. 2007. Den Haag: EcoSecurities.
Mayers, James. 2008. International Institute for Environment and Development (IIED). 2008. Forest Governance Learning Group. Update, June 2008. http://www.iied.org/pubs/display.php?o=G02284 (accessed November 3, 2008).
McCarthy, John F. 2002. Turning in circles: District governance, illegal logging, and environmental decline in Sumatra. Society and Natural Resources 15: 867-886.
Meizlish et al. 2007. Carbon finance for reduced emissions from deforestation and degradation at the forest frontier: Financial analysis of alternate land uses in the Amazon, Congo, and Papau, Indonesia. Paper presented at UNFCCC COP13 and Forest Day, Bali Indonesia: New Forests.
Merger, Eduard, and Alwyn Williams. 2008. A comparison of climate, community and biodiversity standard (CCB), carbonfix standard (CFS), plan vivo systems and standard, and AFOLU voluntary carbon standard (VCS). Paper. Christchurch, New Zealand: University of Canterbury.
Moratorium logging, Keputusan Yang Berdaulat Jalan Terjal Tata Kelola Hutan Aceh. 2007. Ulu Masen (August): 6-11.
Mullins, John W. 2003. The new business road test: What entrepreneurs and executives should do before writing a business plan? London: Prentice Hall.
Murdiyarso, Daniel, and Margaret Skutsch. 2006. Community forestry management as a carbon mitigation option: Case studies. Bogor, Indonesia: Center for International Forestry Research.
86
Murdiyarso et al. 2006. Determination of eligible lands for A/R CDM project activities and of priority districts for project development support in Indonesia. Bogor, Indonesia: Center for International Forestry Research.
Nicholls, Mark, ed. 2007. Carbon funds 2007/08. London: Environmental Finance Publications.
Nordhielm, Christie L. 2006. Marketing management: The big picture. Hoboken, NJ: John Wiley & Sons.
Nordhielm, Christie L. The big picture: Integrating marketing strategy and execution. n.d. www.bigpictureonline.com/index.htm (accessed November 3, 2008).
Norgaard, Richard B. 1994. Development betrayed: The end of progress and a coevolutionary revisioning of the future. London: Routledge.
The new markets for environmental services: A corporate manager’s manual to trading in air, climate, water, and biodiversity assets. 2007. San Francisco: Business for Social Responsibility.
Oreskes, Naomi. 2004. The scientific consensus on climate change, Science 306: 1686.
Ostrom, Elinor. 1990. Governing the commons: The evolution of institutions for collective action. New York: Cambridge University Press.
Padmanaba, Michael. 2007. Finding and promoting a local conservation consensus in a globally important tropical forest landscape. Biodiversity Conservation 16: 137 -151.
Page et al. 1999. Interdependence of peat and vegetation in a tropical peat swamp forest. Philosophical Transactions: Biological Sciences 354: 1885-1897.
Page et al. 2002. The amount of carbon released from peat and forest fires in Indonesia during 1997. Nature 420: 61-65.
Panduan Kegiatan MPB di Indonesia. 2005. Jakarta: Kementerian Lingkungan Hidup Republik Indonesia.
Pelangi Energi Abadi Citra Enviro (PEACE). 2007. Indonesia and climate change: Current status and policies. www.siteresources.worldbank.org/ INTINDONESIA/Resources/Environment/ClimateChange_Full_EN.pdf (accessed November 3, 2008).
Peo, Dorethea. 2005. Borneo’s lost world: Newly discovered species on Borneo. Jakarta: WWF Indonesia.
87
Princen, Thomas. 2005. The logic of sufficiency. Cambridge: Massachusetts Institute of Technology.
Princen et al., eds. 2002. Confronting consumption. Cambridge: Massachusetts Institute of Technology.
Radday, Markus. 2007. Sustainable investments for conservation: The business case for sustainability. Berlin: Price Waterhouse Coopers.
Reducing emissions from deforestation and degradation in developing countries. 2007. Jakarta: Center for International Forestry Research.
Reid et al. 2005. Ecosystems and human well-being synthesis: A report for the millennium ecosystem assessment. Washington, DC: World Resources Institute.
Revised legend of the FAO-Unesco soil map of the world. 1988. World Soil Resources Report 60: 109.
Shocking climate impact of wetland destruction in Indonesia. 2006. Online press release (February 11). Wetlands International. http://www.wetlands.org/news.aspx?ID= 2817de3d-7f6a-4eec-8fc4-7f9eb9d58828 (accessed April 10, 2007).
Silk, J. W. F. 2005. Assessing tropical lowland forest disturbance using plant morphology and ecological attributes. Forest and Ecology Management 205: 241-250.
Singleton, Ian. 2007. Conservation status: Threats and opportunities for the west coast swamp forests of Aceh. Unpublished paper.
Stone et al. 1999. Difficult conversations: How to discuss what matters most. New York: Penguin Books.
Streck et al. 2008. Climate change and forests: Emerging policy and market opportunities. Washington, DC: Brooking Institution Press.
Takai, Y. 1996. Environmental characteristics and management in peat/acid sulfate soils of Southeast Asia. MAB Report, Japan, 1996–1997: 31-49.
Tariq, Ali Arsalam. 2004. Managing financial risks of sukuk structures. Thesis. Leicestershire, United Kingdom: Loughborough University.
Taxation of emissions trading within the EU: From (non)-existing regulation to daily practice and opportunities. 2006. Price Waterhouse Coopers. 2006. www.pwc.com/extweb/pwcpublications.nsf/docid/f2f77c97055f980e85256f3f006808ae (accessed April 15, 2008).
88
Trouble-entry accounting – revisited. 2007. Price Waterhouse Coopers. 2007. www.pwc.com/extweb/pwcpublications.nsf/docid/ 4C113CEA2EA25B99802573520034C3DF (accessed April 15, 2008).
United Nations General Assembly. 1987. Report of the world commission on environment and development. General Assembly Resolution 42/187 (December 11). http://www.un-documents.net/a42r187.htm
United Nations Framework Convention on Climate Change (UNFCCC). 2007. Annual European Community greenhouse gas inventory 1990-2005 and inventory report 2007. Technical report no. 7/2007. Submitted to the UNFCCC Secretariat (May 27).
U.S. Committee on Energy and Commerce. 2007. Climate change legislation design white paper: Scope of cap-and-trade program. (October). Washington, D.C.:
U.S. Committee on Energy and Commerce. 2008a. Climate change legislation design white paper: Appropriate roles for different levels of government. (February). Washington, D.C.
U.S. Committee on Energy and Commerce. 2008b. Climate change legislation design white paper: Competitiveness concerns / engaging developing countries. (January). Washington, D.C.
U.S. Congress. Senate. 2007. Lieberman-Warner Climate Security Act of 2007. S 2191. 110th cong., 1st sess. (October).
U.S. Environmental Protection Agency. 2008. Global anthropogenic non-CO2 GHG emissions: 1990-2020. http://www.epa.gov/climatechange/economics/ international.html (accessed Apr. 15, 2008).
Ury, William. 1991. Getting past no: Negotiating your way from confrontation to cooperation. New York: Bantam Books.
Wackernagel, Mathis, and William Rees. 1996. Our ecological footprint: Reducing human impact on the Earth. Gabriola Island, British Columbia: New Society Publishers.
White et al. 1994. The analysis and use of financial statements. New York: John Wiley and Sons.
Williams, Michael. 2003. Deforesting the Earth: From prehistory to global crisis. Chicago: University of Chicago Press.
The World Bank. 2001. Indonesia: Environment and natural resource management in a time of transition. Washington, DC: The World Bank.

89
Verification: Assuring the credibility of the European Union emissions trading scheme. 2006. Price Waterhouse Coopers. http://www.pwc.com/extweb/pwcpublications. nsf / docid/C90FCB26BFE8AC6380256FF100283A16 (accessed April 15, 2008).