GEOTEKNIKtekniksipil.umy.ac.id/wp-content/uploads/2011/06/JGH-Vol-91-2014.pdf · Dr. lr. Dcdi...
11
VOLUME IIX No 04 1SSN No :0853 4810 ME1 201 GEOTEKN DAFTAR iSI Dari Redaksi Research on Earthquake lnduceO LiqueFadion in Padan9 Ci,and Yo9yakatta Areas …… O eh : Agus Setyo Muntohar Rev si Sud on Mon lored Dired shear T・ ヨ on Unsatumted Sand and Sand Kao n Clay M Oleh: Pumana YM Nikra2.H Bio mediated Sol:A Sustainable GЮ und lmp「 。 vement Technlque 01eh : Lee Min Lee 21 10 R・ laks uu「 oa Geo“ kn k〕 Sek“ al,lH● TI 3asement劇 oNヵ Ocぬ 9on Jl lVnm19 0a1 3a“ iRaF No 75 Jabぬ 12● 0 blp l屹 1 カ81966 Fax 1 021 つ71795 [ma my.● ● la@haI。 ,6ヽ ,mwsat¨ h∞ ∞ m いた bole l h":″ WWⅥ ham o「 d HIMPUNAN AHLITEKNIK TANAH INDONESIAN SOCIETY FOR GEOTECH
Transcript of GEOTEKNIKtekniksipil.umy.ac.id/wp-content/uploads/2011/06/JGH-Vol-91-2014.pdf · Dr. lr. Dcdi...

VOLUME IIX No 041SSN No :0853 4810
ME1 2014
GEOTEKNIK
DAFTAR iSI
Dari Redaksi
Research on Earthquake lnduceO LiqueFadionin Padan9 Ci,and Yo9yakatta Areas _ __ _ ……O eh : Agus Setyo Muntohar
Rev si Sud on Mon lored Dired shear T・ ヨon Unsatumted Sand and Sand Kao n Clay Mixture _ _
Oleh: Pumana YMNikra2.H
Bio mediated Sol:A Sustainable GЮund lmp「。vement Technlque __ _01eh : Lee Min Lee
21
10
R・laks uu「 oa Geo“ kn k〕
Sek“ al,lH●TI3asement劇oNヵ Ocぬ9on Jl lVnm19 0a1 3a“ iRaF No 75 Jabぬ 12●0
blp l屹 1 カ81966
Fax 1 021 つ71795[ma my.●●la@haI。 ,6ヽ,mwsat¨ h∞ ∞mいたbole l h":″ WWⅥ ham o「 d
HIMPUNAN AHLITEKNIK TANAH iNDONESIAINDONESIAN SOCIETY FOR GEOTECHN CAL ENGINEER:NG oSGE)

No1 01 Mei 2014
PEヽANGGUNG JAWAB
Pr● 1:,Ma,yhur:rspm MSE PhDKotu`Umum HATTI
JURNALPEMIMPIヽ REDAKSl GEOTEKNIK
lr Hdbulllh Nr*n, MT . Ph.Drr Nunycor,r, Msct , Ph Dl. rlendn J'!'o, MSCE , Pb.D
Himpunar Ahl Tel,n Ifanah Indonena
DAFTAR ISI
i
ii
L wldjojo A Pokoso, NlscE.. Ph.Dh Rir aA so.nnro, MscE, Pb.D
lr M.F id Nla,rtr|Mr, Pb DDr.lr. Asrs Daonrv Adi,Ms.
fi k. Asus Sdyo Munroh ,M.[rek Endru Susila. MT PhD
Dr rr Ruia kerc wi.*soio. MTDr. lr. Dcdi Apdadi MT
D,,Redaks
Rcscarch on Eanhqurle lnduced Liquefactionin Padan8 Ciry and Yo$alana Areas
AEUS Seryo Munrohar
Sudion'Monitored DirectShe Tc$ on Unsarumred
Sand.nd Sand-Kaolin Clay MixtuF.. Y.M PuNam & H Nikmz
Bio-mcdi.kd Soil : A SNainahle GrouMlmpnivemenlTechnique...... ...... Lc.MinLce
11
PtrNC'RIMAN ]VANUSKRIP!IIOA]\ DAN SIRKUI-ASI
Basnenl Ardev.o odlgoi,1.WrungJariB ar Raya No.75
Emril: h tlumil@)nhoD.co idWcbsitr:htplr**h ti.or.id
21

Agus Setyo Muntohar / Jurnal Geoteknik HATTI IX(1)(2014) 1-9 | ISSN 0853 – 4810
1
Research on Earthquake Induced Liquefaction in
Padang City and Yogyakarta Areas
Agus Setyo Muntohar Department of Civil Engineering, Universitas Muhammadiyah Yogyakarta, D.I.Yogyakarta.
Email: [email protected]
ABSTRACT: Awareness and research on earthquake resistant building design has been intensively carried out after
the fatal earthquakes in Indonesia in recent decades. However, less attention has been given to the phenomena of
liquefaction due to lack of ground motion information and records at the hazard areas. In this paper, seismic ground
response after two deadly earthquakes shocked Java and Sumatera (Indonesia) in 2006 and 2009 was evaluated
based on the CPT data. Based on back-calculation results, the possible ground accelerations were expected to be
about 0.48g and 0.14g in those liquefied areas at Yogyakarta (Southern Java) and Padang (West Sumatera)
respectively. Those accelerations are likely to make 50% of the thickness of sand layer liquefied and induced about
1% ground settlement.
Keywords : liquefaction, peak ground acceleration, silty sand, CPT
ABSTRAK: Kesadaran dan penelitian tentang desain bangunan tahan gempa telah gencar dilakukan setelah gempa
bumi mematikan di Indonesia dalam beberapa dekade terakhir. Namun, lebih sedikit penelitian yang difokuskan
kepada fenomena likuifaksi karena kurangnya informasi gerakan tanah dan catatan di daerah bahaya. Dalam tulisan
ini, respon tanah seismik setelah dua gempa bumi yang mematikan terjadi di Jawa dan Sumatera (Indonesia) pada
tahun 2006 dan 2009 dievaluasi berdasarkan data CPT. Berdasarkan hasil perhitungan kembali, percepatan tanah
mungkin diharapkan sebesar 0.48g dan 0.14g terjadi di daerah ter likuifaksi di Yogyakarta (Jawa Selatan) dan
Padang (Sumatera Barat). Percepatan tersebt cenderung membuat 50% dari ketebalan lapisan pasir terlikufaksi dan
menyebabkan penurunan tanah sebesar 1%.
Kata kunci : likuifaksi, percepatan tanah puncak, lanau berpasir, CPT
1. INTRODUCTION
In recent decade, notable earthquakes that greater than Mw 6 occur frequently in Indonesia. Several
earthquakes caused fatalities, such as the Mw 9.1 earthquake on 26 December 2004 in Aceh, the Mw 6.4
earthquake on 26 May 2006 in Yogyakarta, the Mw 7.7 earthquake on 17 July 2006 in West Java, the Mw
8.5 earthquake on 12 September 2007 in Bengkulu, the Mw 7 earthquake on 2 September 2009 in West
Java and the Mw 7.5 earthquake on 30 September 2009 in West Sumatera, and lastly the Mw 6.5
earthquake in Aceh at early July 2013. Some earthquakes followed by large tsunamis, claimed lives of
hundreds of thousands people and damaging a half million structures in total.
Awareness and research on earthquake resistant building design has been intensively carried out after
those earthquakes. Irsyam et al. (2008) initiated research on the development of spectral hazard maps for
Sumatra and Java islands to propose a revision of the seismic hazard map in Indonesian Seismic Code
SNI 03-1726-2002. Some improvements in seismic hazard map have been implemented in the analysis by
considering the recent seismic activities around Java and Sumatra. But, less attention has been addressed
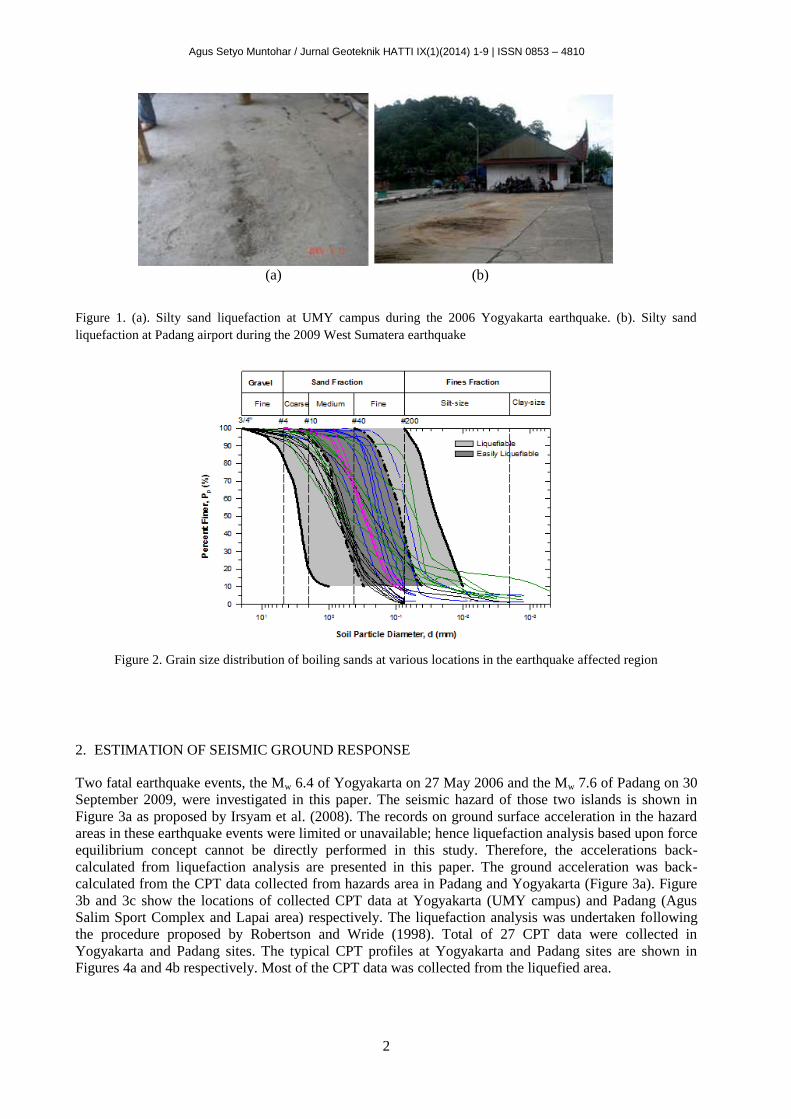
on the phenomena of liquefaction (Figure 1). Post-earthquake study indicated that most liquefaction
occurred in silty sand deposits with fines content as shown in Figure 2. In this paper, some studies aiming
to investigate liquefaction potential of silty sand in Indonesia are presented and discussed.
Agus Setyo Muntohar / Jurnal Geoteknik HATTI IX(1)(2014) 1-9 | ISSN 0853 – 4810
2
(a) (b)
Figure 1. (a). Silty sand liquefaction at UMY campus during the 2006 Yogyakarta earthquake. (b). Silty sand
liquefaction at Padang airport during the 2009 West Sumatera earthquake
Figure 2. Grain size distribution of boiling sands at various locations in the earthquake affected region
2. ESTIMATION OF SEISMIC GROUND RESPONSE
Two fatal earthquake events, the Mw 6.4 of Yogyakarta on 27 May 2006 and the Mw 7.6 of Padang on 30
September 2009, were investigated in this paper. The seismic hazard of those two islands is shown in
Figure 3a as proposed by Irsyam et al. (2008). The records on ground surface acceleration in the hazard
areas in these earthquake events were limited or unavailable; hence liquefaction analysis based upon force
equilibrium concept cannot be directly performed in this study. Therefore, the accelerations back-
calculated from liquefaction analysis are presented in this paper. The ground acceleration was back-
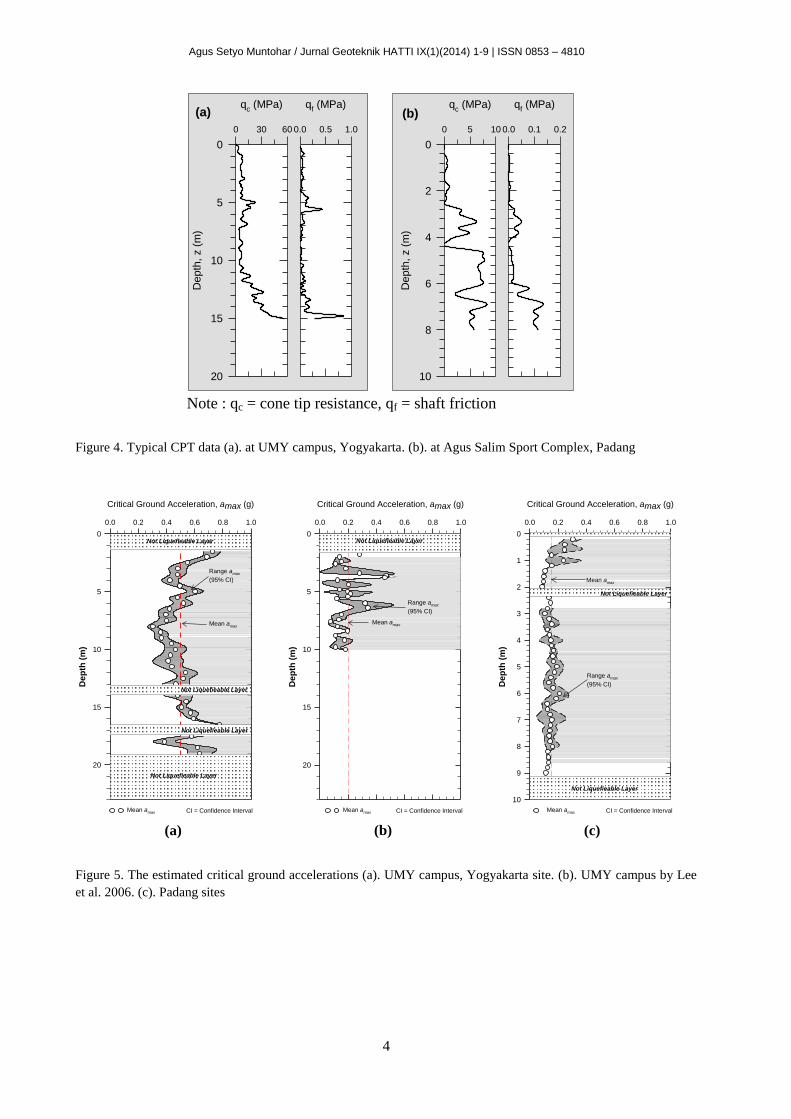
calculated from the CPT data collected from hazards area in Padang and Yogyakarta (Figure 3a). Figure
3b and 3c show the locations of collected CPT data at Yogyakarta (UMY campus) and Padang (Agus
Salim Sport Complex and Lapai area) respectively. The liquefaction analysis was undertaken following
the procedure proposed by Robertson and Wride (1998). Total of 27 CPT data were collected in
Yogyakarta and Padang sites. The typical CPT profiles at Yogyakarta and Padang sites are shown in
Figures 4a and 4b respectively. Most of the CPT data was collected from the liquefied area.

Agus Setyo Muntohar / Jurnal Geoteknik HATTI IX(1)(2014) 1-9 | ISSN 0853 – 4810
3
The factor of safely against liquefaction is defined as:
7.5L
CRRFS MSF
CSR
(1)
where CSR is the cyclic stress ratio, CRR is the cyclic resistance ratio of the ground, and MSF is the
Magnitude Scaling Factor to convert the CRR7.5 for M = 7.5 to the equivalent CRR for the design
earthquake. The recommended MSF is given by Equation (2) based on the NCEER Workshop in 1996
(Youd et al. 2001).
2.56
174
w
MSFM
(2)
Then, acceleration was back-calculated by assuming liquefaction occurs at the observed soil depth which
FSL is less than 1. The variation of ground accelerations (amax) with the depth is shown in Figure 5a and
5c for Yogyakarta and Padang sites respectively. In this study, the amax is defined as critical ground
acceleration that is the minimum acceleration required to cause liquefaction at a given depth.
PADANG
YOGYAKARTA
(a)
(b)
(c)
Investigated
area
Figure 3. Location of the investigated areas (a). Seismic hazard maps of Java and Sumatera. (b). Location of
Yogyakarta site. (c). Location of Padang site
Agus Setyo Muntohar / Jurnal Geoteknik HATTI IX(1)(2014) 1-9 | ISSN 0853 – 4810
4
qc (MPa)
0 30 60
Depth
, z (
m)
0
5
10
15
20
qf (MPa)
0.0 0.5 1.0
(a)
qc (MPa)
0 5 10
Depth
, z (
m)
0
2
4
6
8
10
qf (MPa)
0.0 0.1 0.2
(b)
Note : qc = cone tip resistance, qf = shaft friction
Figure 4. Typical CPT data (a). at UMY campus, Yogyakarta. (b). at Agus Salim Sport Complex, Padang
Critical Ground Acceleration, amax (g)
0.0 0.2 0.4 0.6 0.8 1.0
De
pth
(m
)
0
5
10
15
20
Mean amax CI = Confidence Interval
Range amax
(95% CI)
Mean amax
Not Liquefieable Layer
Not Liquefieable Layer
Not Liquefieable Layer
Not Liquefieable Layer
(a)
Critical Ground Acceleration, amax (g)
0.0 0.2 0.4 0.6 0.8 1.0
Dep
th (
m)
0
5
10
15
20
Mean amax CI = Confidence Interval
Range amax
(95% CI)
Mean amax
Not Liquefieable Layer
(b)
Critical Ground Acceleration, amax (g)
0.0 0.2 0.4 0.6 0.8 1.0
De
pth
(m
)
0
1
2
3
4
5
6
7
8
9
10
Mean amax CI = Confidence Interval
Range amax
(95% CI)
Mean amax
Not Liquefieable Layer
Not Liquefieable Layer
(c)
Figure 5. The estimated critical ground accelerations (a). UMY campus, Yogyakarta site. (b). UMY campus by Lee
et al. 2006. (c). Padang sites

Agus Setyo Muntohar / Jurnal Geoteknik HATTI IX(1)(2014) 1-9 | ISSN 0853 – 4810
5
The mean critical accelerations at Yogyakarta site range from 0.3g to 0.72g. The largest amax 0.72g is
located near ground surface. The values of mean and mode of all critical accelerations are 0.48g and
0.37g respectively. Lee et al. (2006) did analysis of liquefaction by using five CPT dataset of UMY
campus and proposed the critical acceleration as shown in Figure 5b. Comparing the profile in Figure 5a
and 5b, it shows that the estimated amax of Lee et al. (2006) is likely to be increased by the current study.
It implies that an earthquake with amax between 0.11g to 0.48g will generate 50% of sand layer liquefied.
Considering the dispersion in PGA and spectral amplification on soft soil deposit Elnashai et al. (2007)
estimated the peak ground acceleration (PGA) of Mw 6.4 earthquake of Yogyakarta from YOGI station,
which is located about 10 km from the hazard area, that is 0.183g-0.303g and 0.197g-0.336g for
horizontal and vertical components, respectively (Figure 6a). The accelerometer of YOGI station was
located at the base stiff ground; the maximum horizontal ground motion accelerations are estimated to be
0.49g and 0.47g for Yogyakarta area for horizontal and vertical ground motion respectively (Elnashai et
al. (2007). These provide practical available estimates in the absence of more reliable data. Comparing
the calculated amax from the CPT evaluation and the estimated value from Elnashai et al. (2007), it was
shown that the calculated amax from CPT evaluation is in agreement with the result of Elnashai et al.
(2007).
The critical accelerations at observed sites in Padang are between 0.07g to 0.38g. The largest amax
0.38g is located near ground surface. The values of mean and mode of all critical accelerations are 0.14g
and 0.12g respectively. It is observed that loose soil covers the hazard area of Padang. It implies that an
earthquake with a small acceleration will cause the soil layer to liquefy easily. The mean value of
acceleration at Padang sites is smaller than the PGA recorded at the nearest hazard area. There was only
one strong ground motion record for the M7.9 earthquake of Padang region on 30 September 2009 (EERI
2009), which shows about 20 seconds of strong shaking with a peak ground acceleration of 0.3g (Figure
6b). Since the instrument site was located at the base of the hill sides, about 12 km from the coast and on
stiff soil, the ground motions in the center of Padang, on softer deeper soil deposits, are likely to have
been larger. The average shear wave velocity for the upper 30 m of the subsurface here, Vs30, is 1200
m/s (Rusnardi and Kiyono, 2011). Median PGA values from attenuation models for subduction
earthquakes for Mw 7.6 and R of 60 km and H = 80 km, yield PGA of 0.4g to 0.6g for soil sites (Young et
al., 1997; Zhao et al., 2006; Atkinson et al., 2003), which are consistent with the strong motion record.
Figure 6. Acceleration record of Mx 6.4 earthquake on 26 May 2006 in Yogyakarta (b) Acceleration record (NS
component) of Mw 7.6 earthquake on 20 September 2009 in Padang

Agus Setyo Muntohar / Jurnal Geoteknik HATTI IX(1)(2014) 1-9 | ISSN 0853 – 4810
6
The estimated acceleration of Yogyakarta and Padang sites are likely affected by local site conditions.
The recorded acceleration from instruments maybe affected by near-surface conditions of importance
include the thickness of soil layers, the small-strain stiffness and material damping of soil layers, the
variation of stiffness and material damping with shear strain amplitude, and the site topography (Seed et
al. 1986, Youd and Carter 2005, Loye et al. 2013). The acceleration profile shown in Figure 5 indicates
that the acceleration varies nonlinearly with the depth as a function of qc and soil density. This
nonlinearity may be contributed by fines fraction such as silt or clay in the sands deposit (Beresnev and
Wen 1996).
3. LIQUEFACTION INDUCED GROUND SETTLEMENT
Liquefaction potential at Yogyakarta and Padang sites has been previously investigated by Soebowo et al.
(2007) and Tohari et al. (2011) respectively. Soebowo et al. (2007) evaluated liquefaction potential at the
southeast part of Yogyakarta by applying the Mw 6.3 earthquake and amax of 0.25g. The study showed that
liquefaction potentially occurred at all depth sand and silt soil layers for the investigated sites. Tohari et
al. (2011) applied the Mw 7.6 earthquake and amax of 0.4g for liquefaction evaluation and indicated that
liquefaction occurred at the whole depth of sand and silt soil layers at Padang city area. However, it has
been noted in the previous section that the acceleration records varies with local soils conditions.
Therefore, the evaluation of liquefaction potential for those investigated area is local and site specific.
Hence, it is important to look into the effect of varying acceleration on the liquefaction potential and
ground settlement. Estimation of liquefaction induced ground settlements was calculated following the
procedure proposed by Zhang et al. (2002).
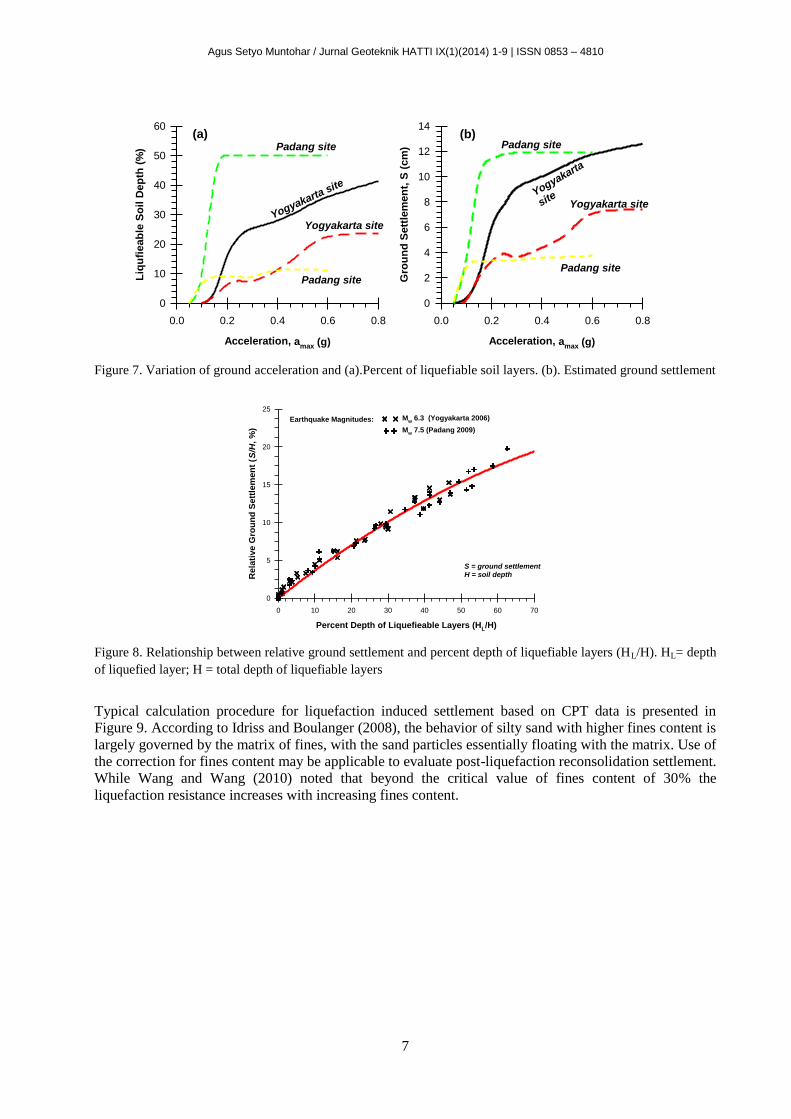
The effect of variation of acceleration on the liquefaction potential and ground settlement is presented
in Figure 7 for selected sites in Yogyakarta and Padang. Figure 7a presents the liquefaction potential in
terms of percent depth of liquefied layers for selected sites in Yogyakarta and Padang (HL/H, where HL =
depth of liquefied layer; H = total depth of liquefiable layers). The sites selected represent the boundaries
of minimum and maximum liquefaction potential and its induced settlement. The relationship clearly
shows that the percent of liquefied layers vary for different sites. The results show that in general the
percent of liquefied layers increases with the increase in acceleration at the selected sites. The Padang
sites were highly susceptible to liquefaction as compared to Yogyakarta sites since the area may liquefy at
small acceleration. In general, there was no liquefaction if the acceleration is smaller than 0.05g.
Typically for Padang sites, the percent of liquefied depth increases drastically at acceleration of 0.15g,
and then there is no additional liquefaction at the rest of the depth for acceleration greater than 0.15g. It
indicates that an acceleration of 0.15g is the upper bound acceleration to make liquefaction at Padang
sites. In contrast with the Yogyakarta sites, the percent of liquefiable depth increases with increases in
acceleration up to 0.6g. It indicates that the upper limit of acceleration is not clearly defined at
Yogyakarta sites. But, it seems that acceleration between 0.3g to 0.6g is possible to cause severe
liquefaction.
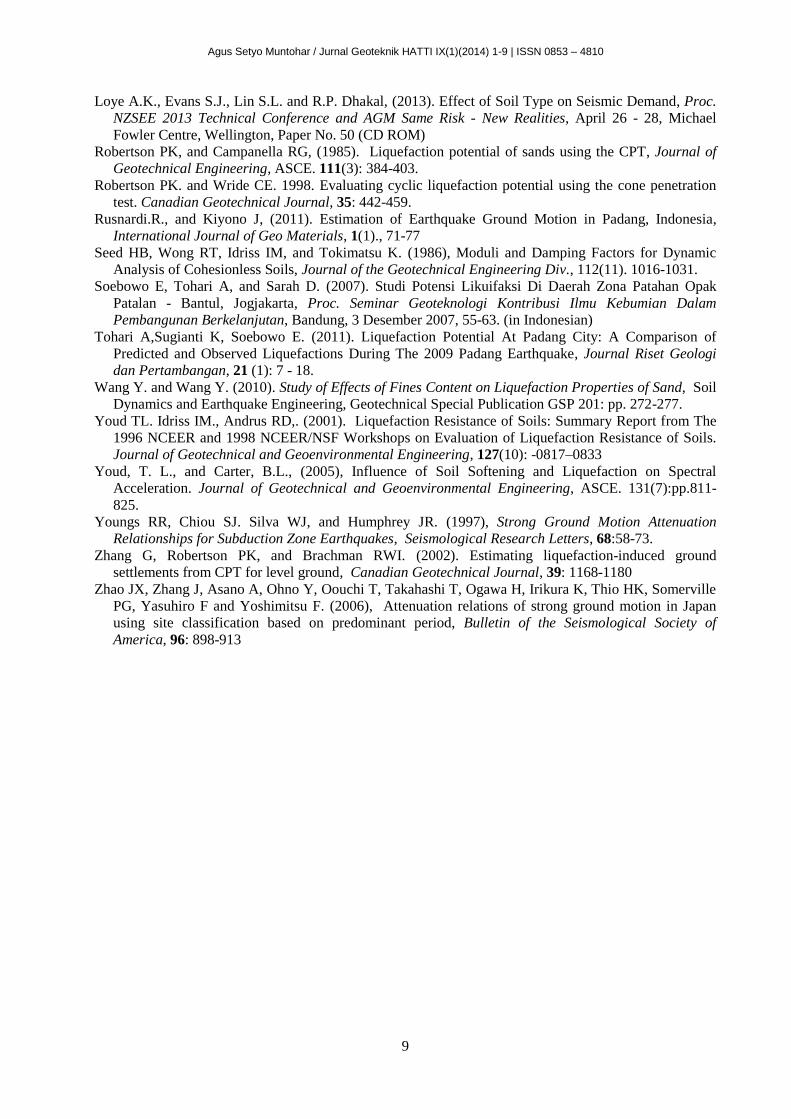
Figure 7b presents the variations of ground settlement with the increasing acceleration. It seems to
have similar characteristic with Figure 7a. Hence a correlation of the percent of liquefiable layers and
relative ground settlement can be presented in Figure 8. It is interesting to note that at Yogyakarta sites
some depth contained fines fraction range of 40 to 70 percent with low plasticity.
Agus Setyo Muntohar / Jurnal Geoteknik HATTI IX(1)(2014) 1-9 | ISSN 0853 – 4810
7
Acceleration, amax (g)
0.0 0.2 0.4 0.6 0.8
Liq
ufi
eab
le S
oil
Dep
th (
%)
0
10
20
30
40
50
60
Acceleration, amax (g)
0.0 0.2 0.4 0.6 0.8
Gro
un
d S
ett
lem
en
t, S
(cm
)
0
2
4
6
8
10
12
14
Yogyakarta
site
(b)(a)
Yogyakarta site
Padang site
Padang site
Padang site
Padang site
Yogyakarta site
Yogyakarta site
Figure 7. Variation of ground acceleration and (a).Percent of liquefiable soil layers. (b). Estimated ground settlement
Percent Depth of Liquefieable Layers (HL/H)
0 10 20 30 40 50 60 70
Rela
tive G
rou
nd
Sett
lem
en
t ( S
/H,
%)
0
5
10
15
20
25
Mw 6.3 (Yogyakarta 2006)
Mw 7.5 (Padang 2009)
S = ground settlementH = soil depth
Earthquake Magnitudes:
Figure 8. Relationship between relative ground settlement and percent depth of liquefiable layers (HL/H). HL= depth
of liquefied layer; H = total depth of liquefiable layers
Typical calculation procedure for liquefaction induced settlement based on CPT data is presented in
Figure 9. According to Idriss and Boulanger (2008), the behavior of silty sand with higher fines content is
largely governed by the matrix of fines, with the sand particles essentially floating with the matrix. Use of
the correction for fines content may be applicable to evaluate post-liquefaction reconsolidation settlement.
While Wang and Wang (2010) noted that beyond the critical value of fines content of 30% the
liquefaction resistance increases with increasing fines content.

Agus Setyo Muntohar / Jurnal Geoteknik HATTI IX(1)(2014) 1-9 | ISSN 0853 – 4810
8
v (%)
0 2 4
qc (MPa)
0 20 40 60
Depth
, z (
m)
0
5
10
15
20
FR (%)
0 2 4
Ic
0 2 4
(qc1N
)cs
0 100 200 300
CRR7.5
/CSR
0.0 0.5 1.0
FS
0 1 2
App.FC (%)
0 40 80
Lab.test
S (cm)
0 5 10 15
LPI = 15.08
NL
NL
NL = NoLiquefaction
NL
App.FC = apparentfines content
Figure 9. Example of calculation procedure of the liquefaction induced ground settlement
4. SUMMARY AND CONCLUSIONS
Generally, seismic response analysis is performed by propagating a suite of rock acceleration-time
histories from the base of a soil column to the ground surface. However, due to lack of recorded ground
motions at the sites under investigation, the seismic ground response in Yogyakarta and Padang area have
been estimated using CPT profiles at the liquefied sites. The estimated acceleration at Yogyakarta and
Padang sites are likely affected by local site conditions. For the investigated area, the values of mean
ground accelerations are 0.48g and 0.14g for Yogyakarta and Padang sites respectively. These ground
acceleration is within the available estimates from the instruments. The back-calculated acceleration from
CPT dataset can be a practical method to estimate ground acceleration profiles in the absence of more
reliable data.
REFERENCES
Atkinson GM, and Boore DM. (2003). Empirical ground motion relations for subduction-zone
earthquakes and their application to Cascadia and other regions, Bulletin of the Seismological
Society of America, 93:1703-1729.
Beresnev IA and Wen K-L. (1996). Nonlinear Soil Response A Reality? Bulletin of the Seismological
Society of America, 86(6): 1964-1978.
EERI. (2009). Learning from Earthquakes the Mw 7.6 Western Sumatra Earthquake of September 30,
2009, EERI Special Earthquake Report — December 2009, 12p.
Elnashai AS, Kim SJ. Yun GJ, and Sidarta D. (2007). The Yogyakarta Earthquake of May 27 2006,
Report No. 07-02, Mid-America Earthquake Center.
Idris IM, and Boulanger RW. (2008). Soil Liquefaction During Earthquakes, Earthquake Engineering
Research Institute, Oakland, CA.
Irsyam M, Dangkua DT, Hendriyawan, Hoedajanto D, Hutapea BM, Kertapati EK, Boen T, Petersen
MD. (2008). Proposed seismic hazard maps of Sumatra and Java islands and micro zonation study of
Jakarta city, Indonesia, Journal of Earth System Science, 117(2) Supplement, 865-878
Lee SH, Hwang CH, and Muntohar AS. (2006). Study on Liquefaction Problem of Yogyakarta Area at
052706 Earthquake. Proc. Earthquake Engineering and Infrastructure & Building Retrofitting
International Seminar & Symposium, Yogyakarta, August 28th 2006 (CD-ROM)
Agus Setyo Muntohar / Jurnal Geoteknik HATTI IX(1)(2014) 1-9 | ISSN 0853 – 4810
9
Loye A.K., Evans S.J., Lin S.L. and R.P. Dhakal, (2013). Effect of Soil Type on Seismic Demand, Proc.
NZSEE 2013 Technical Conference and AGM Same Risk - New Realities, April 26 - 28, Michael
Fowler Centre, Wellington, Paper No. 50 (CD ROM)
Robertson PK, and Campanella RG, (1985). Liquefaction potential of sands using the CPT, Journal of
Geotechnical Engineering, ASCE. 111(3): 384-403.
Robertson PK. and Wride CE. 1998. Evaluating cyclic liquefaction potential using the cone penetration
test. Canadian Geotechnical Journal, 35: 442-459.
Rusnardi.R., and Kiyono J, (2011). Estimation of Earthquake Ground Motion in Padang, Indonesia,
International Journal of Geo Materials, 1(1)., 71-77
Seed HB, Wong RT, Idriss IM, and Tokimatsu K. (1986), Moduli and Damping Factors for Dynamic
Analysis of Cohesionless Soils, Journal of the Geotechnical Engineering Div., 112(11). 1016-1031.
Soebowo E, Tohari A, and Sarah D. (2007). Studi Potensi Likuifaksi Di Daerah Zona Patahan Opak
Patalan - Bantul, Jogjakarta, Proc. Seminar Geoteknologi Kontribusi Ilmu Kebumian Dalam
Pembangunan Berkelanjutan, Bandung, 3 Desember 2007, 55-63. (in Indonesian)
Tohari A,Sugianti K, Soebowo E. (2011). Liquefaction Potential At Padang City: A Comparison of
Predicted and Observed Liquefactions During The 2009 Padang Earthquake, Journal Riset Geologi
dan Pertambangan, 21 (1): 7 - 18.
Wang Y. and Wang Y. (2010). Study of Effects of Fines Content on Liquefaction Properties of Sand, Soil
Dynamics and Earthquake Engineering, Geotechnical Special Publication GSP 201: pp. 272-277.
Youd TL. Idriss IM., Andrus RD,. (2001). Liquefaction Resistance of Soils: Summary Report from The
1996 NCEER and 1998 NCEER/NSF Workshops on Evaluation of Liquefaction Resistance of Soils.
Journal of Geotechnical and Geoenvironmental Engineering, 127(10): -0817–0833
Youd, T. L., and Carter, B.L., (2005), Influence of Soil Softening and Liquefaction on Spectral
Acceleration. Journal of Geotechnical and Geoenvironmental Engineering, ASCE. 131(7):pp.811-
825.
Youngs RR, Chiou SJ. Silva WJ, and Humphrey JR. (1997), Strong Ground Motion Attenuation
Relationships for Subduction Zone Earthquakes, Seismological Research Letters, 68:58-73.
Zhang G, Robertson PK, and Brachman RWI. (2002). Estimating liquefaction-induced ground
settlements from CPT for level ground, Canadian Geotechnical Journal, 39: 1168-1180
Zhao JX, Zhang J, Asano A, Ohno Y, Oouchi T, Takahashi T, Ogawa H, Irikura K, Thio HK, Somerville
PG, Yasuhiro F and Yoshimitsu F. (2006), Attenuation relations of strong ground motion in Japan
using site classification based on predominant period, Bulletin of the Seismological Society of
America, 96: 898-913