, 2021 Entergy Corporation
35
May 11, 2021 Entergy Corporation Investor Meetings
Transcript of , 2021 Entergy Corporation
Ma
y 11
, 2
02
1 Entergy
Corporation
Investor Meetings
1
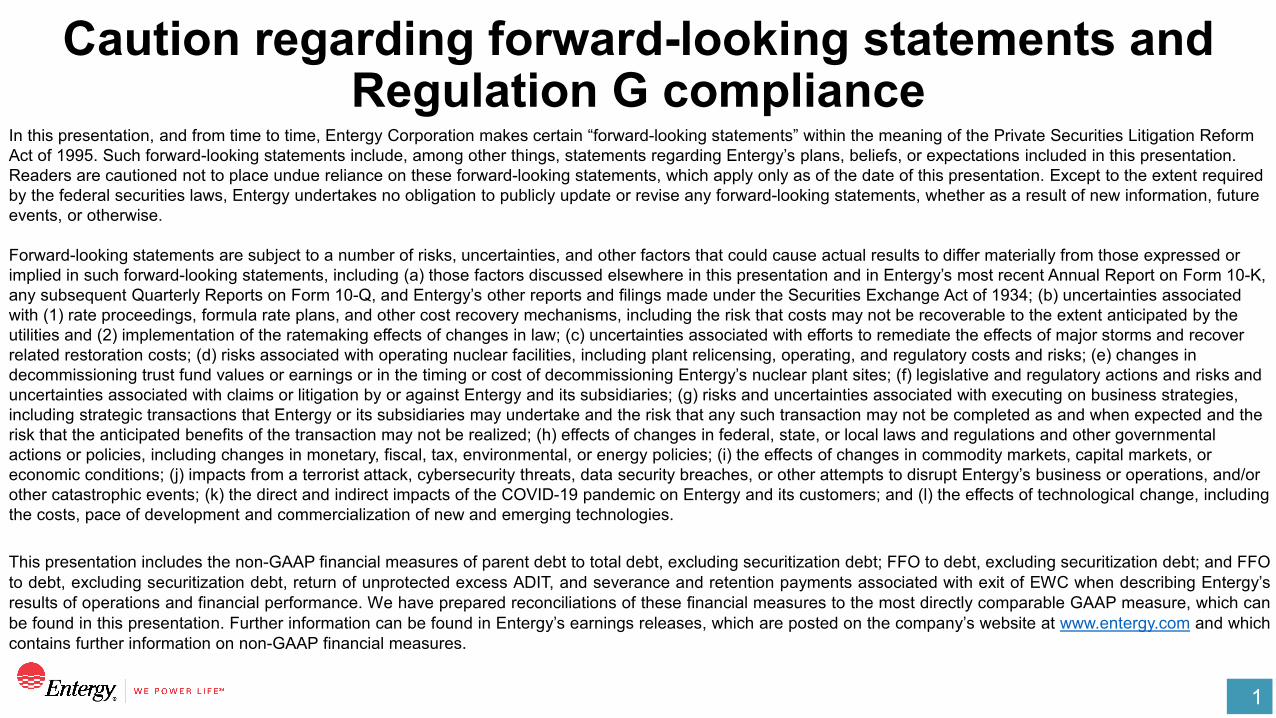
Caution regarding forward-looking statements and Regulation G compliance
In this presentation, and from time to time, Entergy Corporation makes certain “forward-looking statements” within the meaning of the Private Securities Litigation Reform Act of 1995. Such forward-looking statements include, among other things, statements regarding Entergy’s plans, beliefs, or expectations included in this presentation. Readers are cautioned not to place undue reliance on these forward-looking statements, which apply only as of the date of this presentation. Except to the extent required by the federal securities laws, Entergy undertakes no obligation to publicly update or revise any forward-looking statements, whether as a result of new information, future events, or otherwise.
Forward-looking statements are subject to a number of risks, uncertainties, and other factors that could cause actual results to differ materially from those expressed or implied in such forward-looking statements, including (a) those factors discussed elsewhere in this presentation and in Entergy’s most recent Annual Report on Form 10-K, any subsequent Quarterly Reports on Form 10-Q, and Entergy’s other reports and filings made under the Securities Exchange Act of 1934; (b) uncertainties associated with (1) rate proceedings, formula rate plans, and other cost recovery mechanisms, including the risk that costs may not be recoverable to the extent anticipated by the utilities and (2) implementation of the ratemaking effects of changes in law; (c) uncertainties associated with efforts to remediate the effects of major storms and recover related restoration costs; (d) risks associated with operating nuclear facilities, including plant relicensing, operating, and regulatory costs and risks; (e) changes in decommissioning trust fund values or earnings or in the timing or cost of decommissioning Entergy’s nuclear plant sites; (f) legislative and regulatory actions and risks and uncertainties associated with claims or litigation by or against Entergy and its subsidiaries; (g) risks and uncertainties associated with executing on business strategies, including strategic transactions that Entergy or its subsidiaries may undertake and the risk that any such transaction may not be completed as and when expected and the risk that the anticipated benefits of the transaction may not be realized; (h) effects of changes in federal, state, or local laws and regulations and other governmental actions or policies, including changes in monetary, fiscal, tax, environmental, or energy policies; (i) the effects of changes in commodity markets, capital markets, or economic conditions; (j) impacts from a terrorist attack, cybersecurity threats, data security breaches, or other attempts to disrupt Entergy’s business or operations, and/or other catastrophic events; (k) the direct and indirect impacts of the COVID-19 pandemic on Entergy and its customers; and (l) the effects of technological change, including the costs, pace of development and commercialization of new and emerging technologies.
This presentation includes the non-GAAP financial measures of parent debt to total debt, excluding securitization debt; FFO to debt, excluding securitization debt; and FFOto debt, excluding securitization debt, return of unprotected excess ADIT, and severance and retention payments associated with exit of EWC when describing Entergy’sresults of operations and financial performance. We have prepared reconciliations of these financial measures to the most directly comparable GAAP measure, which canbe found in this presentation. Further information can be found in Entergy’s earnings releases, which are posted on the company’s website at www.entergy.com and whichcontains further information on non-GAAP financial measures.
2
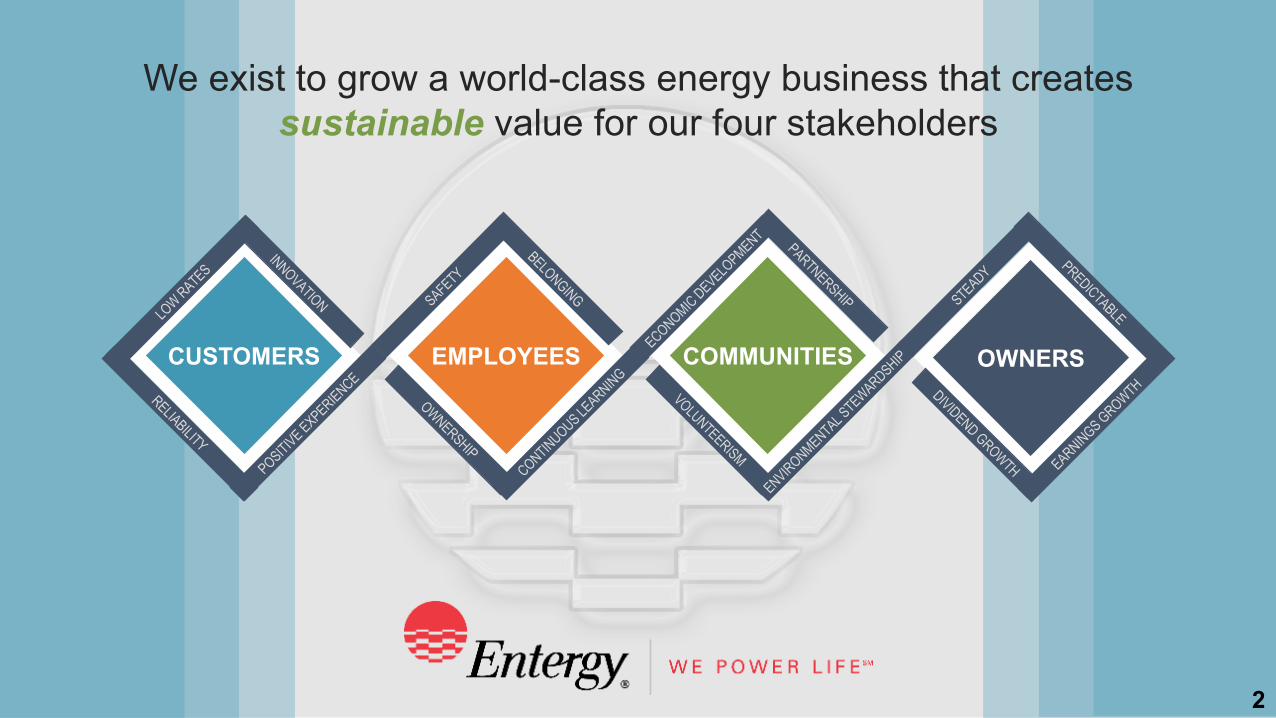
We exist to grow a world-class energy business that creates sustainable value for our four stakeholders
EMPLOYEES COMMUNITIES OWNERSCUSTOMERS
2
3
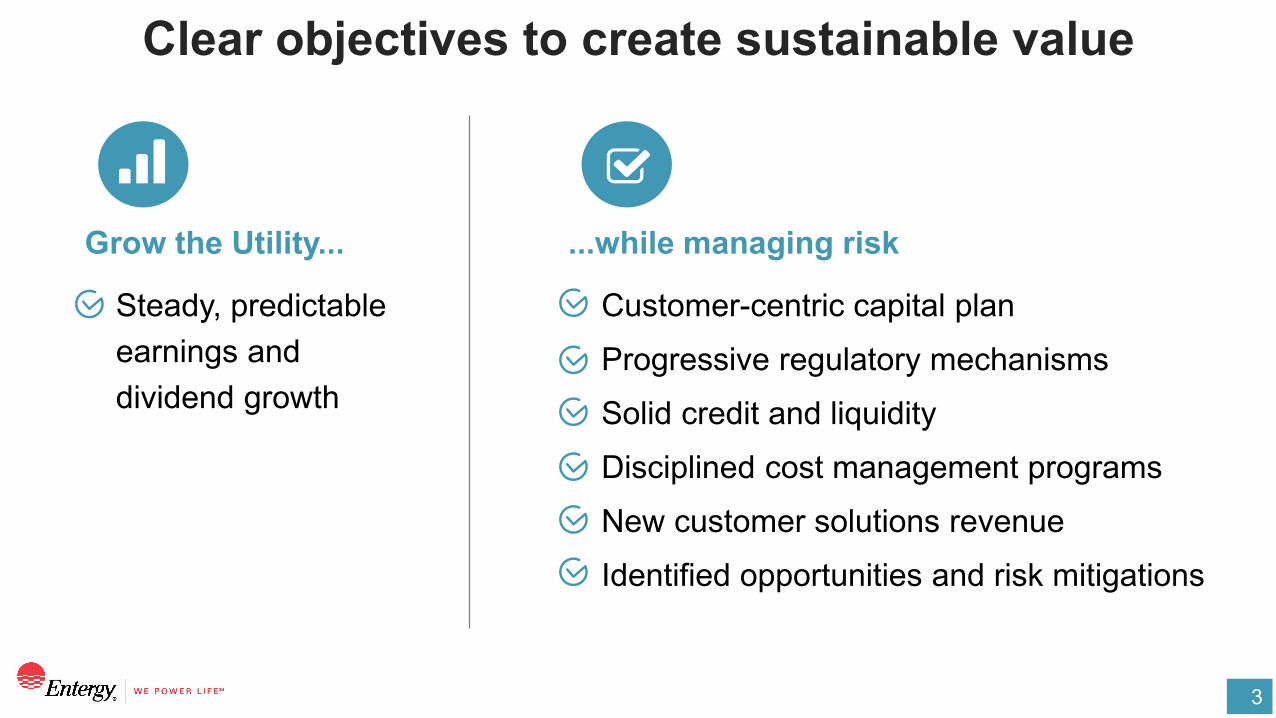
Clear objectives to create sustainable value
Steady, predictable earnings and dividend growth
Customer-centric capital planProgressive regulatory mechanismsSolid credit and liquidityDisciplined cost management programsNew customer solutions revenue Identified opportunities and risk mitigations
Grow the Utility... ...while managing risk
4
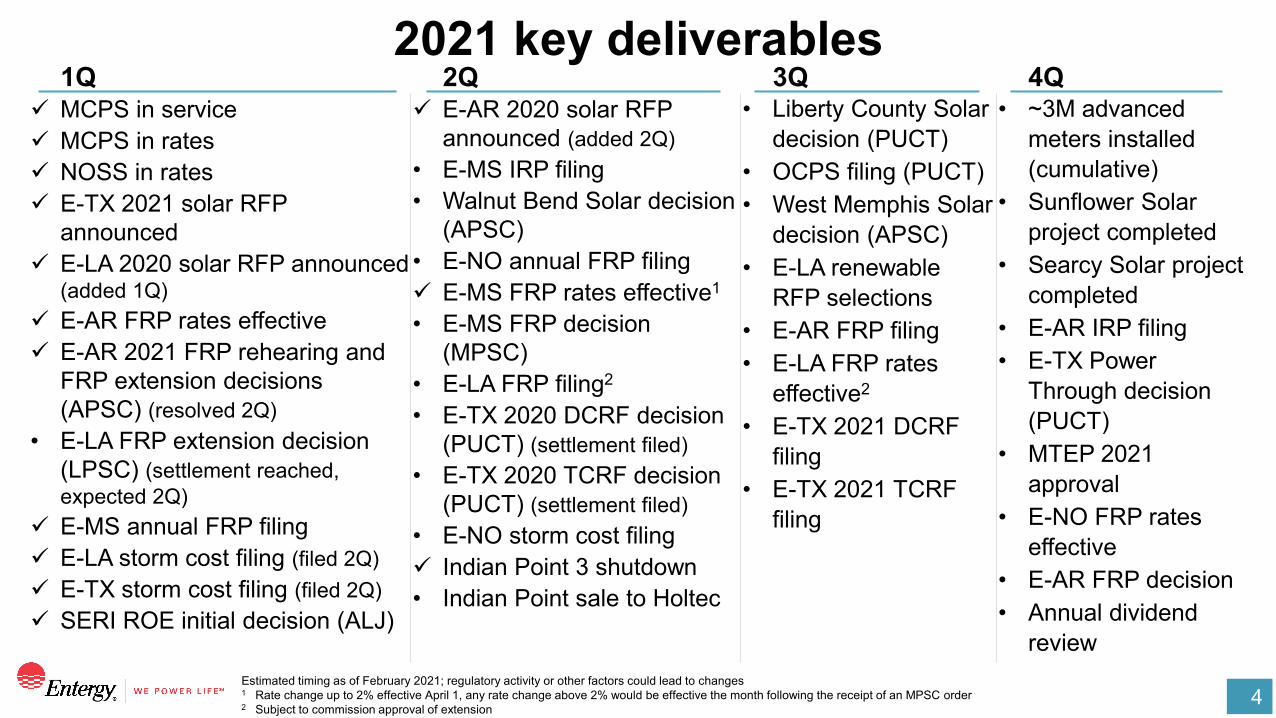
2021 key deliverables
Estimated timing as of February 2021; regulatory activity or other factors could lead to changes1 Rate change up to 2% effective April 1, any rate change above 2% would be effective the month following the receipt of an MPSC order2 Subject to commission approval of extension
1Q 2Q 3Q 4Q MCPS in service MCPS in rates NOSS in rates E-TX 2021 solar RFP
announced E-LA 2020 solar RFP announced
(added 1Q) E-AR FRP rates effective E-AR 2021 FRP rehearing and
FRP extension decisions (APSC) (resolved 2Q)
• E-LA FRP extension decision (LPSC) (settlement reached, expected 2Q)
E-MS annual FRP filing E-LA storm cost filing (filed 2Q) E-TX storm cost filing (filed 2Q) SERI ROE initial decision (ALJ)
E-AR 2020 solar RFP announced (added 2Q)
• E-MS IRP filing• Walnut Bend Solar decision
(APSC)• E-NO annual FRP filing E-MS FRP rates effective1
• E-MS FRP decision (MPSC)
• E-LA FRP filing2
• E-TX 2020 DCRF decision (PUCT) (settlement filed)
• E-TX 2020 TCRF decision (PUCT) (settlement filed)
• E-NO storm cost filing Indian Point 3 shutdown• Indian Point sale to Holtec
• Liberty County Solar decision (PUCT)
• OCPS filing (PUCT)• West Memphis Solar
decision (APSC)• E-LA renewable
RFP selections• E-AR FRP filing • E-LA FRP rates
effective2
• E-TX 2021 DCRF filing
• E-TX 2021 TCRF filing
• ~3M advanced meters installed (cumulative)
• Sunflower Solar project completed
• Searcy Solar project completed
• E-AR IRP filing• E-TX Power
Through decision (PUCT)
• MTEP 2021 approval
• E-NO FRP rates effective
• E-AR FRP decision• Annual dividend
review
5
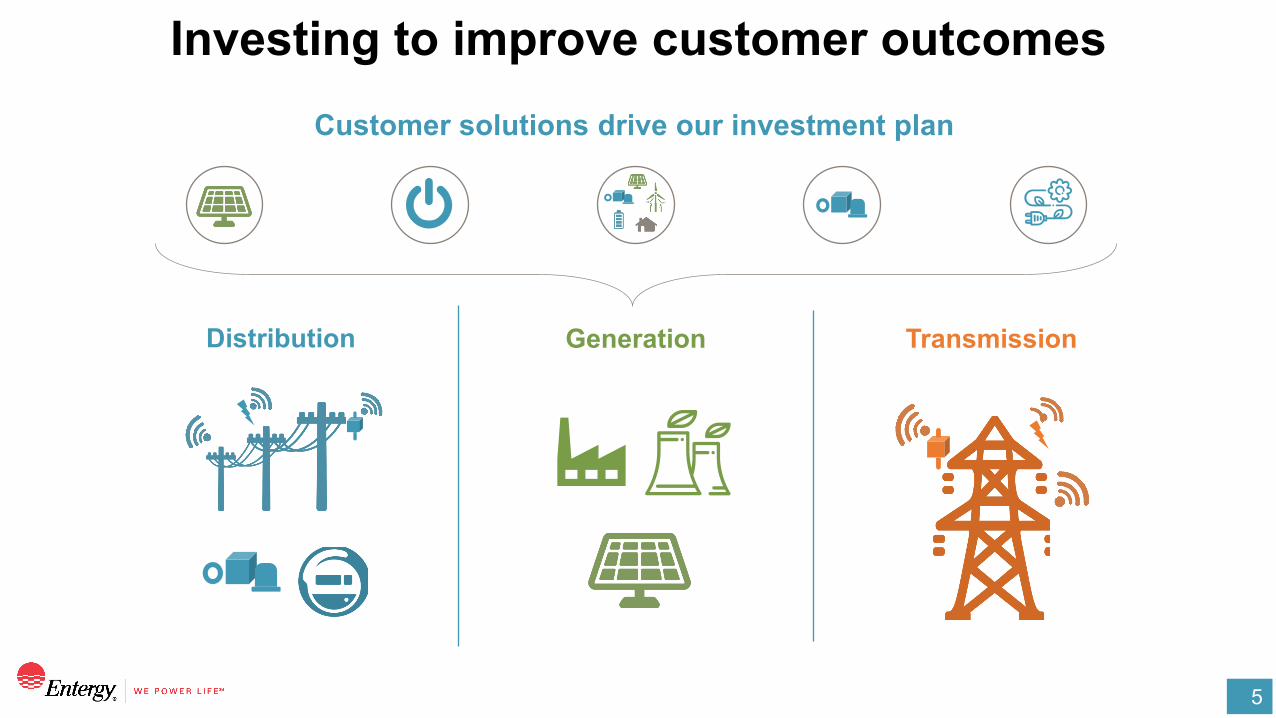
Investing to improve customer outcomes
TransmissionGenerationDistribution
Customer solutions drive our investment plan
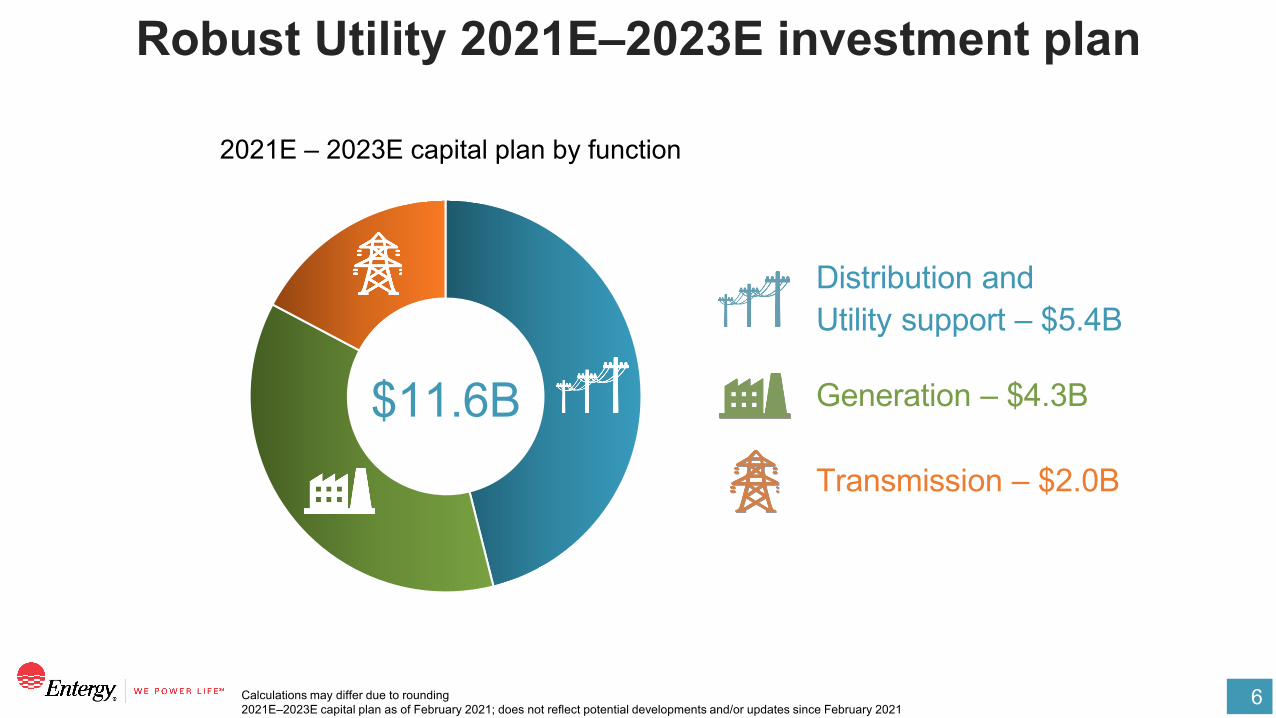
6Calculations may differ due to rounding2021E–2023E capital plan as of February 2021; does not reflect potential developments and/or updates since February 2021
$11.6B
Robust Utility 2021E–2023E investment plan
Generation – $4.3B
Transmission – $2.0B
Distribution and Utility support – $5.4B
2021E – 2023E capital plan by function
7
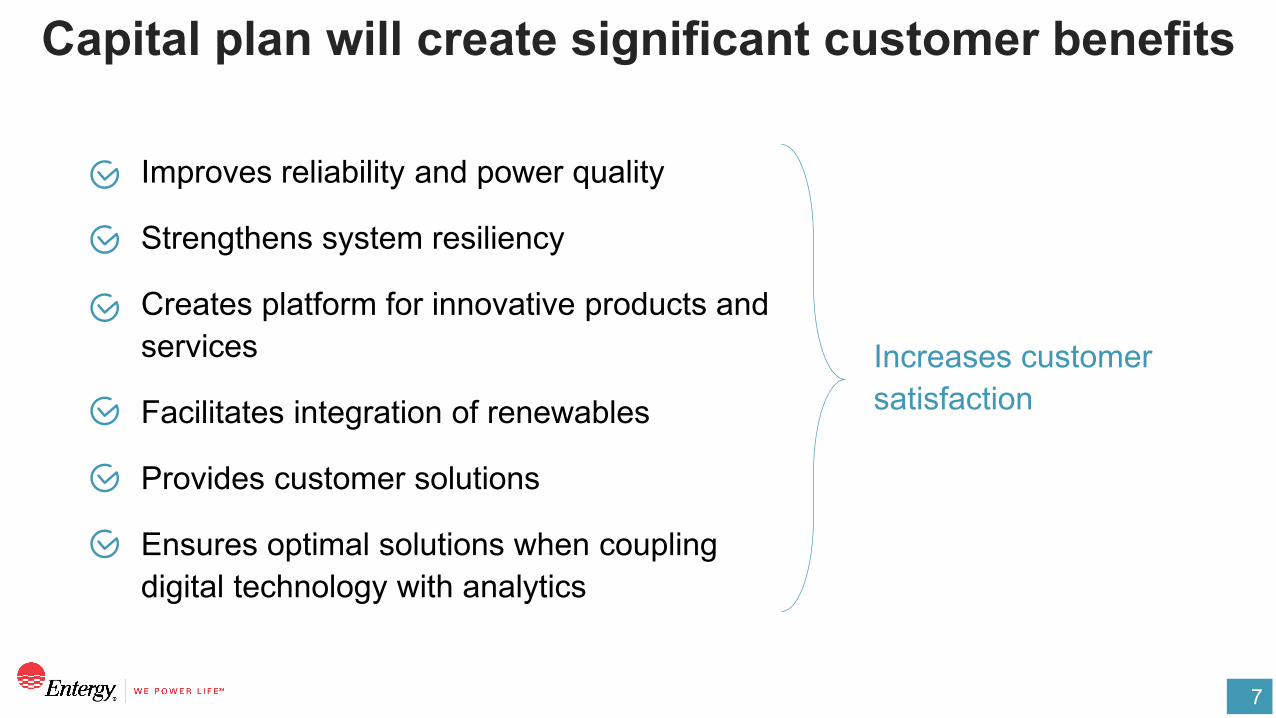
Capital plan will create significant customer benefits
Improves reliability and power quality
Strengthens system resiliency
Creates platform for innovative products and services
Facilitates integration of renewables
Provides customer solutions
Ensures optimal solutions when coupling digital technology with analytics
Increases customer satisfaction
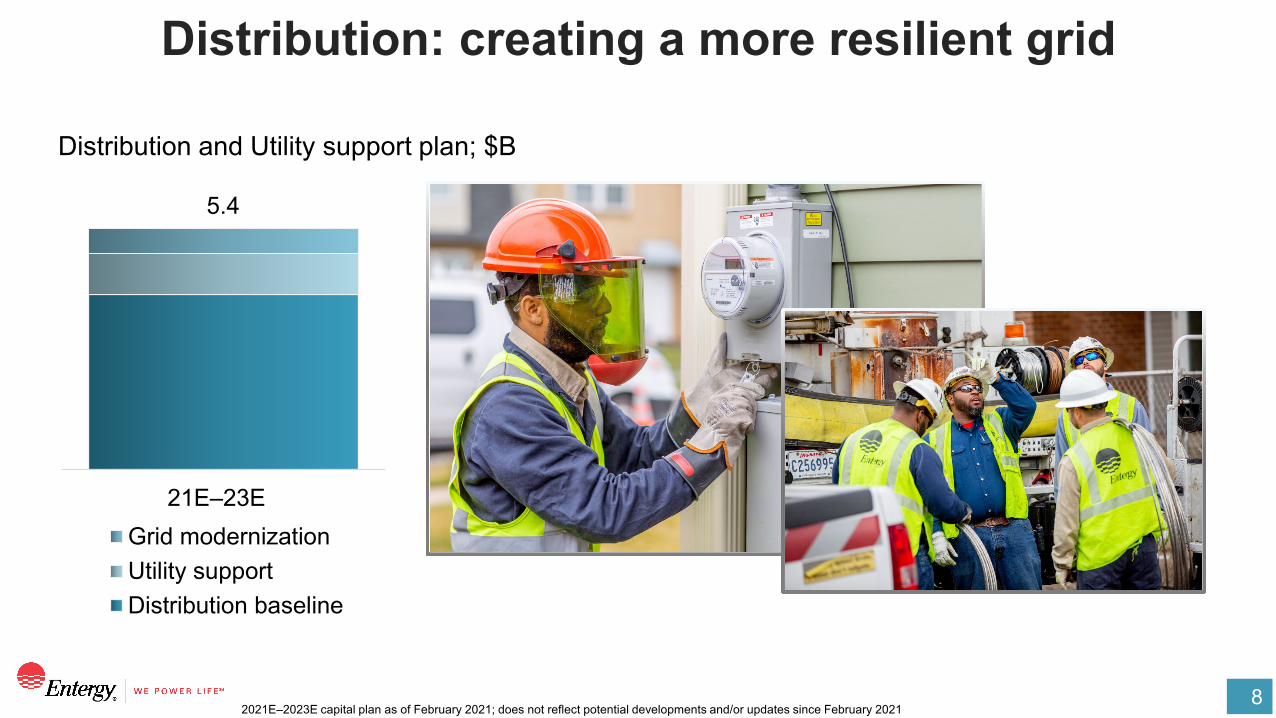
82021E–2023E capital plan as of February 2021; does not reflect potential developments and/or updates since February 2021
Distribution: creating a more resilient grid
5.4
21E–23E Grid modernizationUtility supportDistribution baseline
Distribution and Utility support plan; $B
9
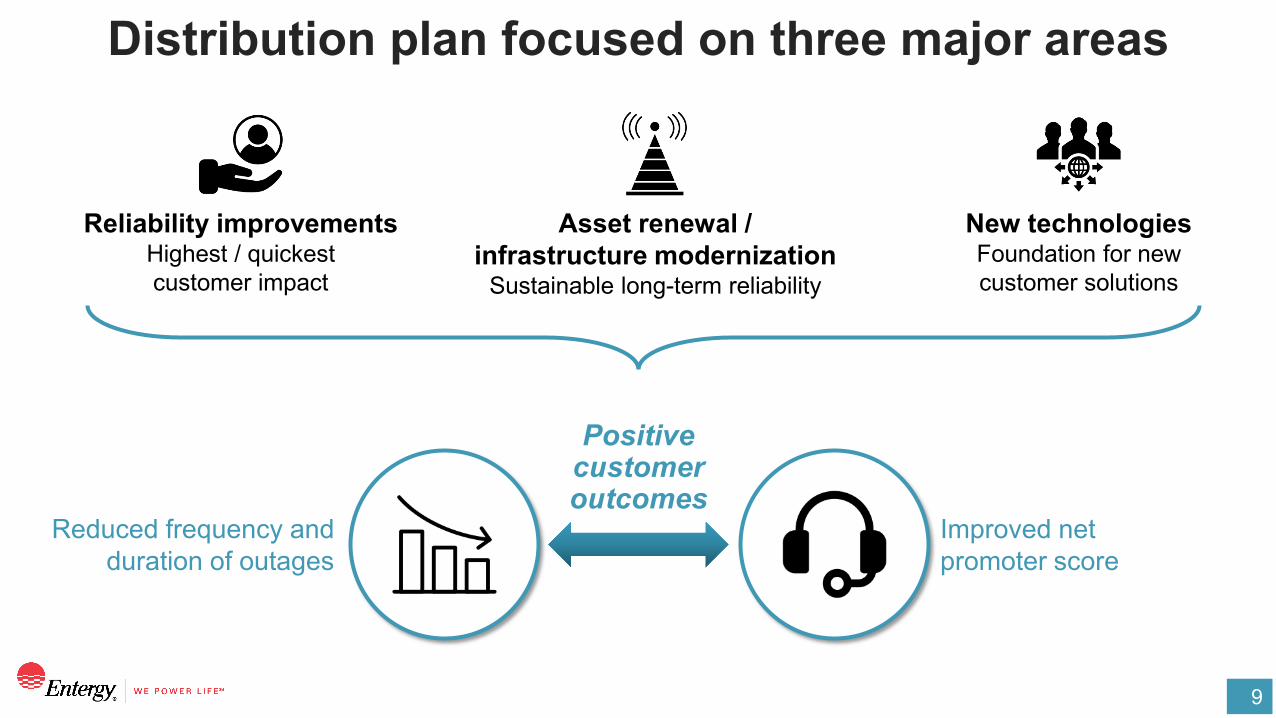
Distribution plan focused on three major areas
Reliability improvementsHighest / quickest customer impact
Asset renewal / infrastructure modernization
Sustainable long-term reliability
New technologies Foundation for new customer solutions
Reduced frequency and duration of outages
Improved net promoter score
Positive customer outcomes
102021E–2023E capital plan as of February 2021; does not reflect potential developments and/or updates since February 2021
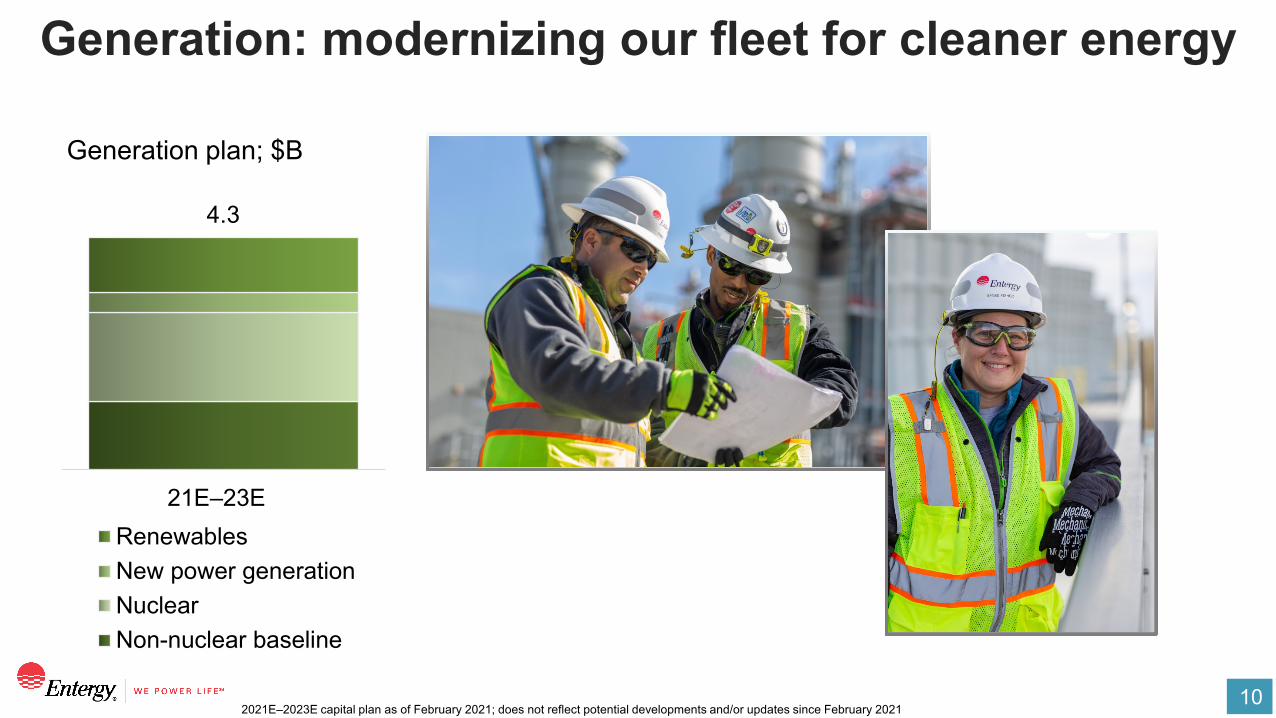
Generation: modernizing our fleet for cleaner energy
Generation plan; $B
4.3
21E–23E RenewablesNew power generationNuclearNon-nuclear baseline
11
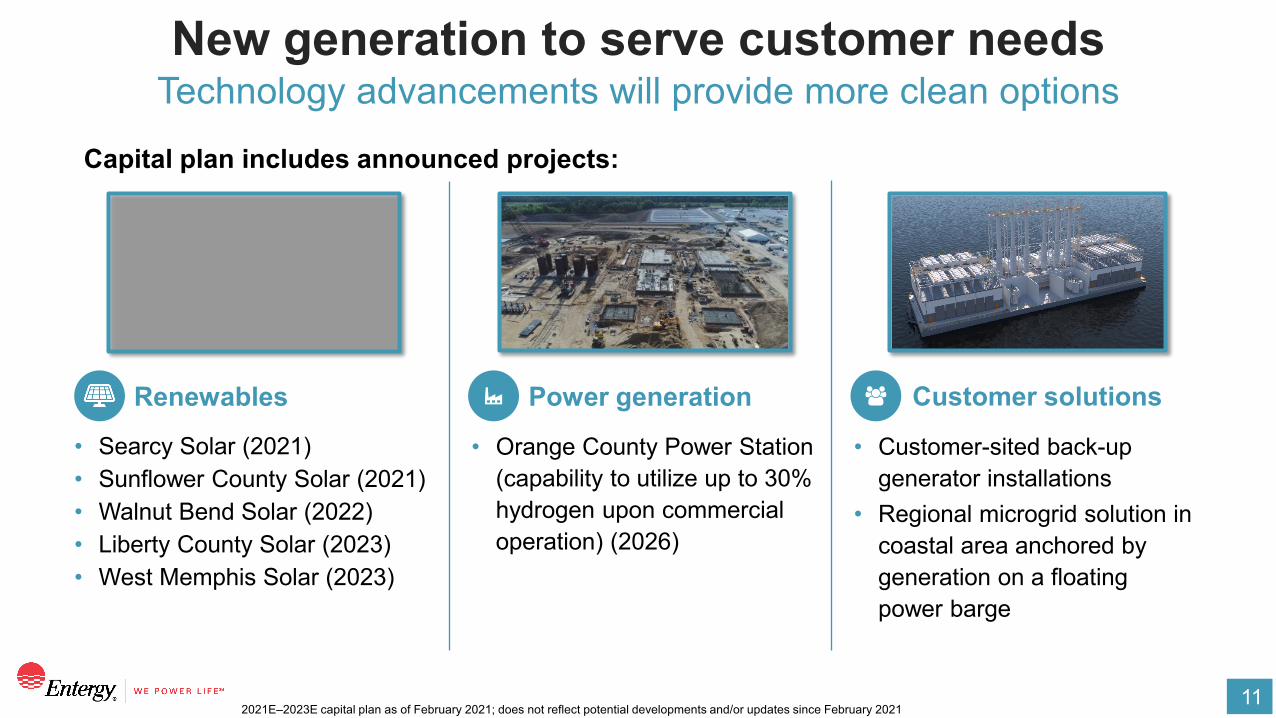
Technology advancements will provide more clean optionsNew generation to serve customer needs
2021E–2023E capital plan as of February 2021; does not reflect potential developments and/or updates since February 2021
• Orange County Power Station (capability to utilize up to 30% hydrogen upon commercial operation) (2026)
Power generationRenewables
• Searcy Solar (2021)• Sunflower County Solar (2021)• Walnut Bend Solar (2022)• Liberty County Solar (2023)• West Memphis Solar (2023)
• Customer-sited back-up generator installations
• Regional microgrid solution in coastal area anchored by generation on a floating power barge
Customer solutions
Capital plan includes announced projects:
122021E–2023E capital plan as of February 2021; does not reflect potential developments and/or updates since February 2021
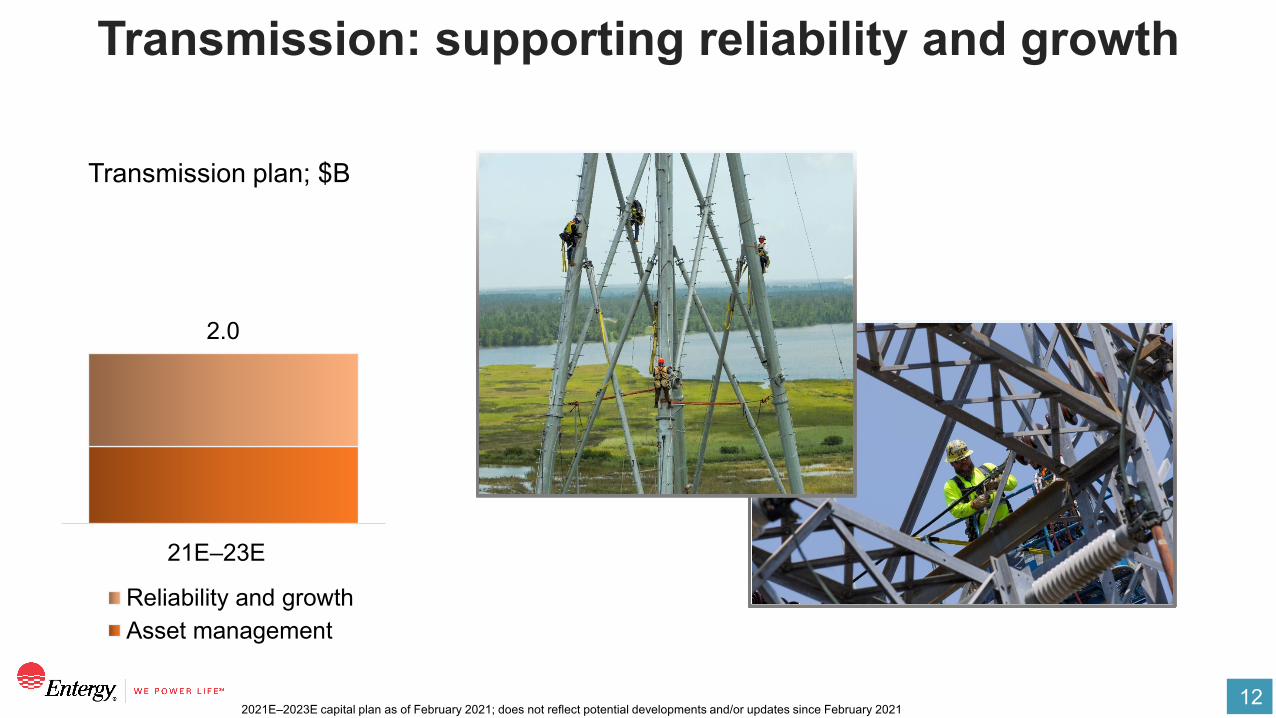
Transmission: supporting reliability and growth
Transmission plan; $B
2.0
21E–23E
Reliability and growthAsset management
13
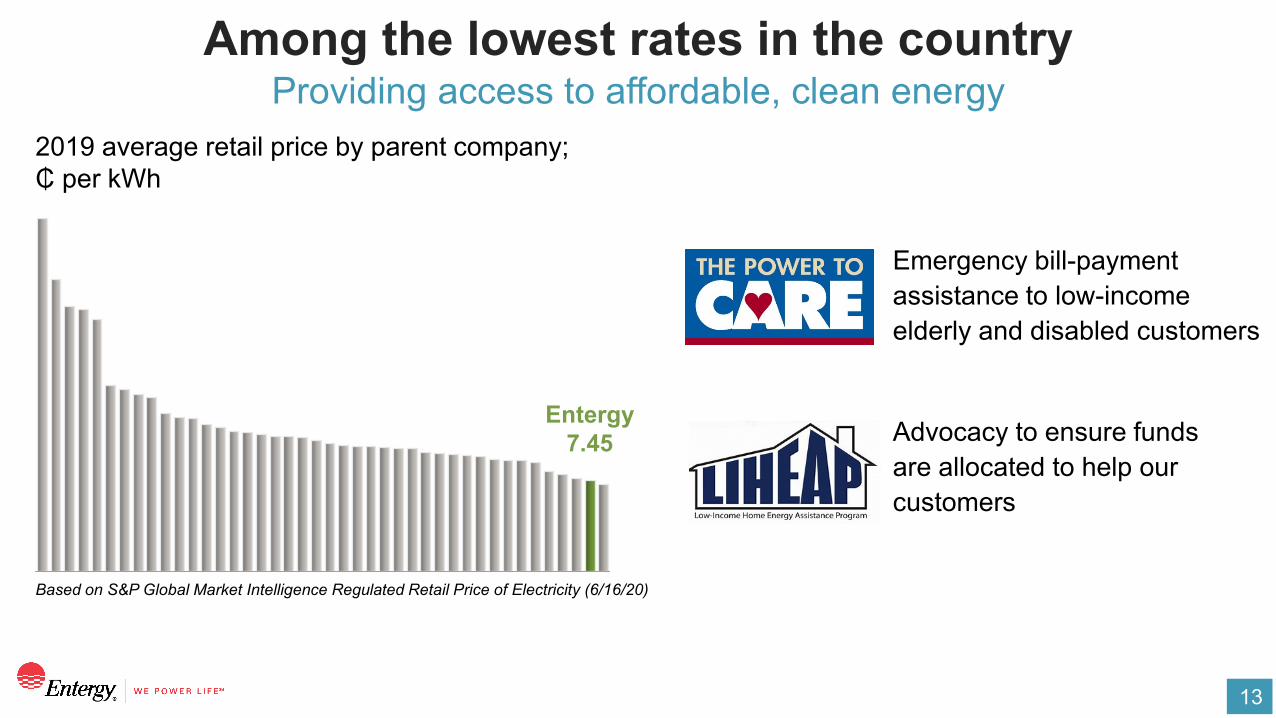
Providing access to affordable, clean energyAmong the lowest rates in the country
Emergency bill-payment assistance to low-income elderly and disabled customers
Advocacy to ensure funds are allocated to help our customers
2019 average retail price by parent company; ₵ per kWh
Entergy7.45
Based on S&P Global Market Intelligence Regulated Retail Price of Electricity (6/16/20)
14
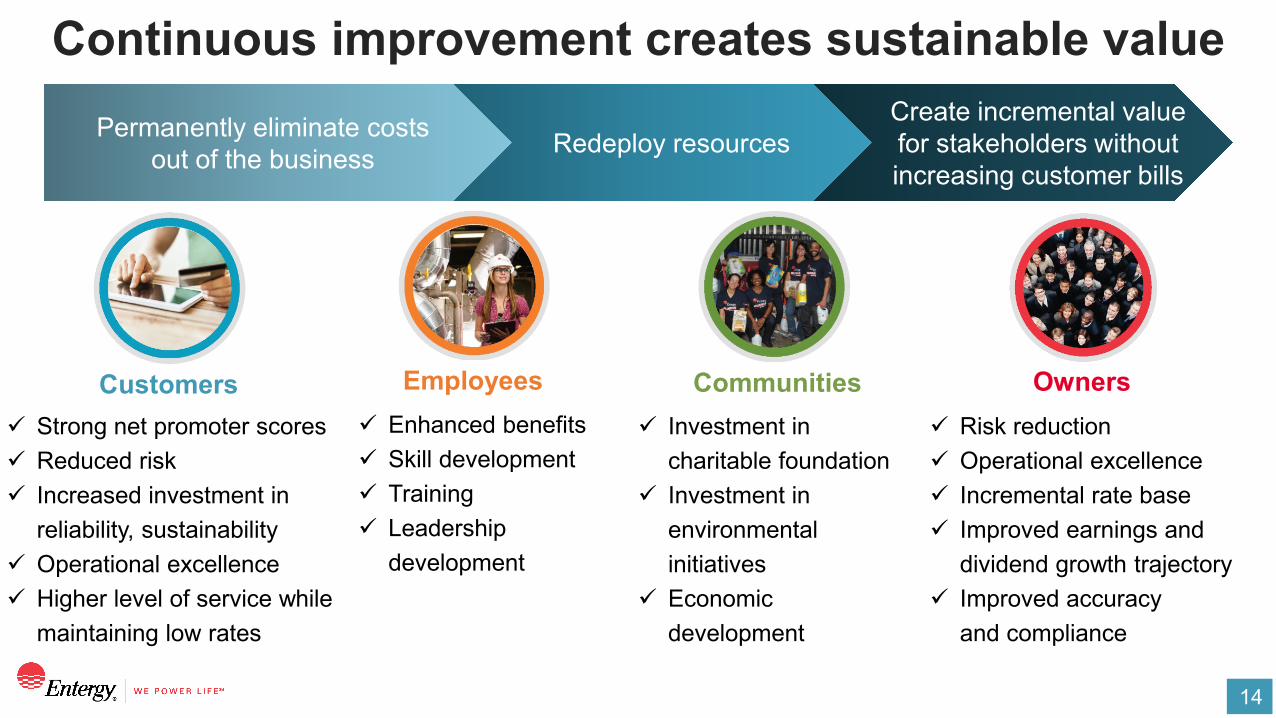
Continuous improvement creates sustainable value
Customers Employees Communities Owners Strong net promoter scores Reduced risk Increased investment in
reliability, sustainability Operational excellence Higher level of service while
maintaining low rates
Enhanced benefits Skill development Training Leadership
development
Investment in charitable foundation
Investment in environmental initiatives
Economic development
Risk reduction Operational excellence Incremental rate base Improved earnings and
dividend growth trajectory Improved accuracy
and compliance
Create incremental value for stakeholders without increasing customer bills
Redeploy resourcesPermanently eliminate costs out of the business
15
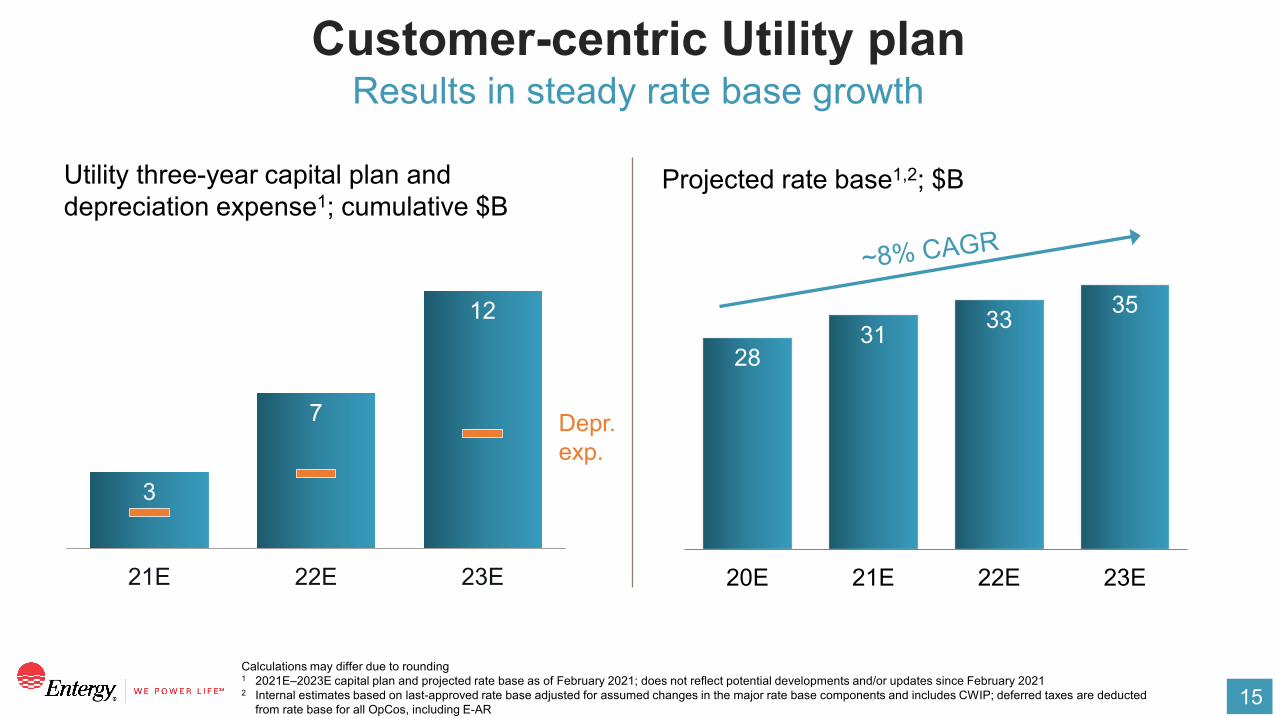
Results in steady rate base growthCustomer-centric Utility plan
Calculations may differ due to rounding1 2021E–2023E capital plan and projected rate base as of February 2021; does not reflect potential developments and/or updates since February 20212 Internal estimates based on last-approved rate base adjusted for assumed changes in the major rate base components and includes CWIP; deferred taxes are deducted
from rate base for all OpCos, including E-AR
3
7
12
21E 22E 23E
Utility three-year capital plan and depreciation expense1; cumulative $B
Depr. exp.
28 31 33 35
20E 21E 22E 23E
Projected rate base1,2; $B
16
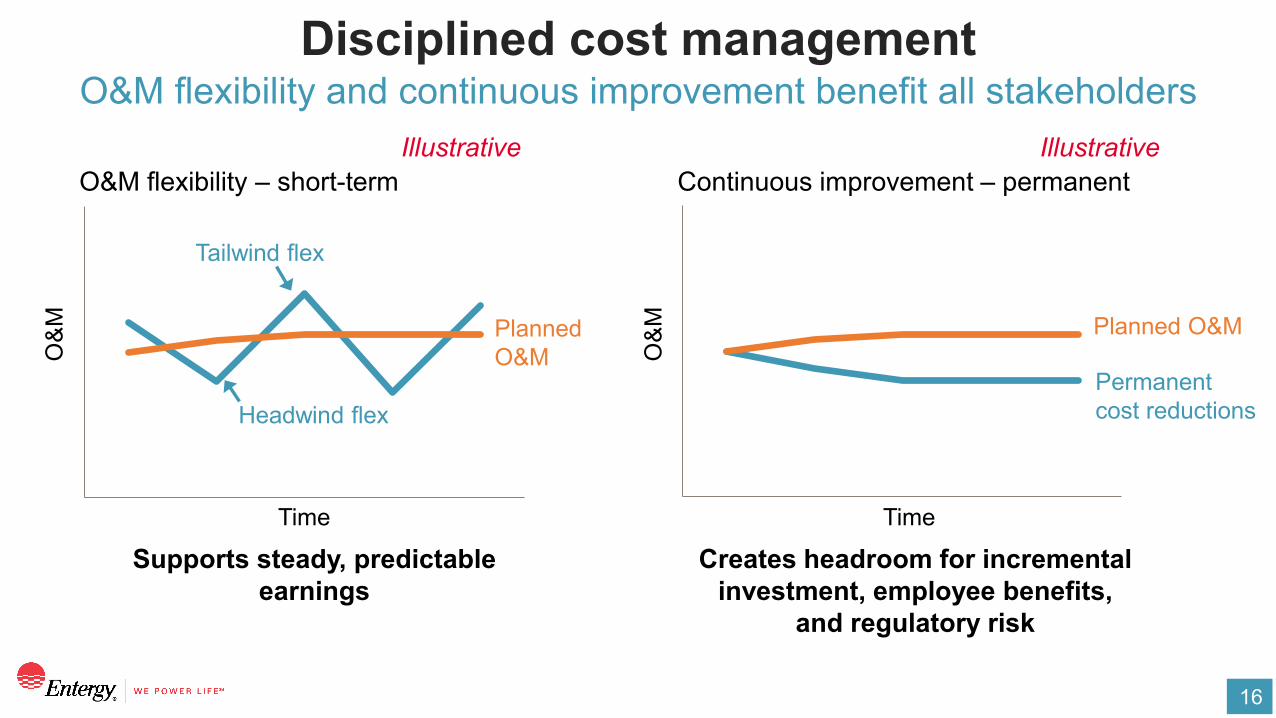
O&M flexibility and continuous improvement benefit all stakeholdersDisciplined cost management
Headwind flex
Supports steady, predictable earnings
Creates headroom for incremental investment, employee benefits,
and regulatory risk
Illustrative IllustrativeO&M flexibility – short-term Continuous improvement – permanent
O&M
O&M Planned O&M
Permanent cost reductions
Tailwind flex
Planned O&M
Time Time
17
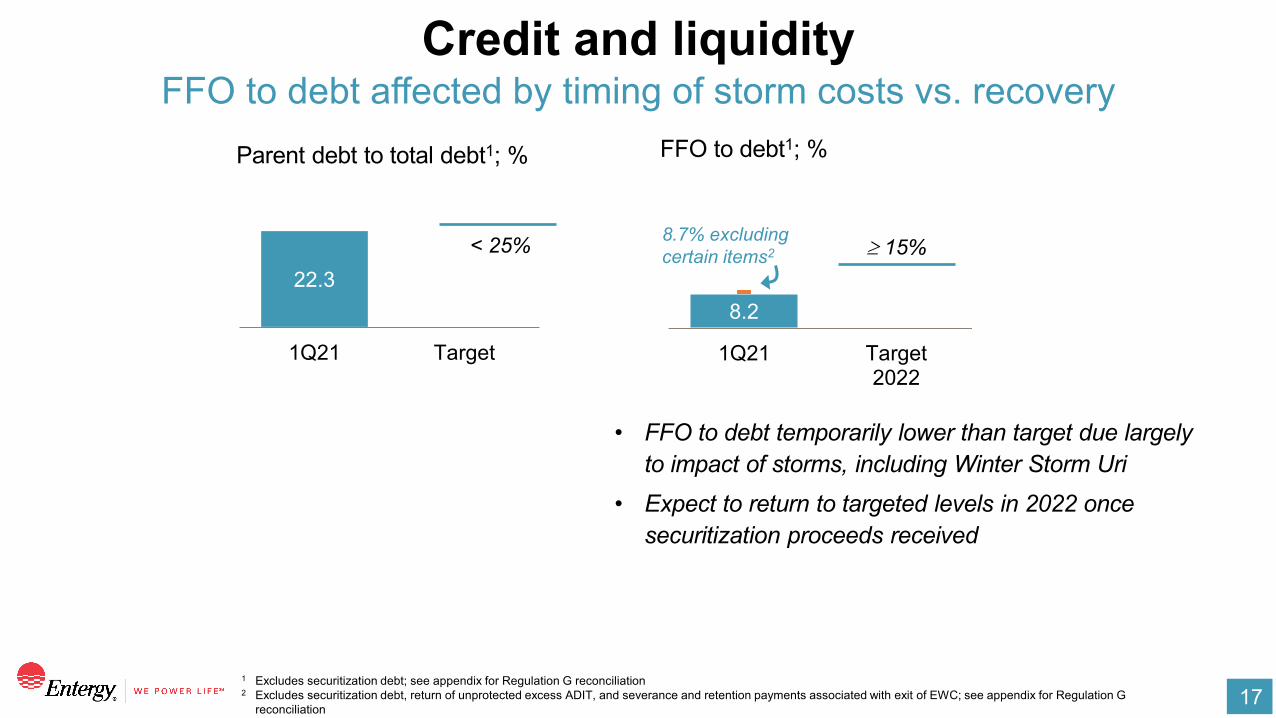
FFO to debt affected by timing of storm costs vs. recoveryCredit and liquidity
1 Excludes securitization debt; see appendix for Regulation G reconciliation2 Excludes securitization debt, return of unprotected excess ADIT, and severance and retention payments associated with exit of EWC; see appendix for Regulation G
reconciliation
22.3
1Q21 Target
Parent debt to total debt1; %
< 25%
8.2
1Q21 Target2022
FFO to debt1; %
≥ 15%8.7% excluding certain items2
• FFO to debt temporarily lower than target due largely to impact of storms, including Winter Storm Uri
• Expect to return to targeted levels in 2022 once securitization proceeds received
18
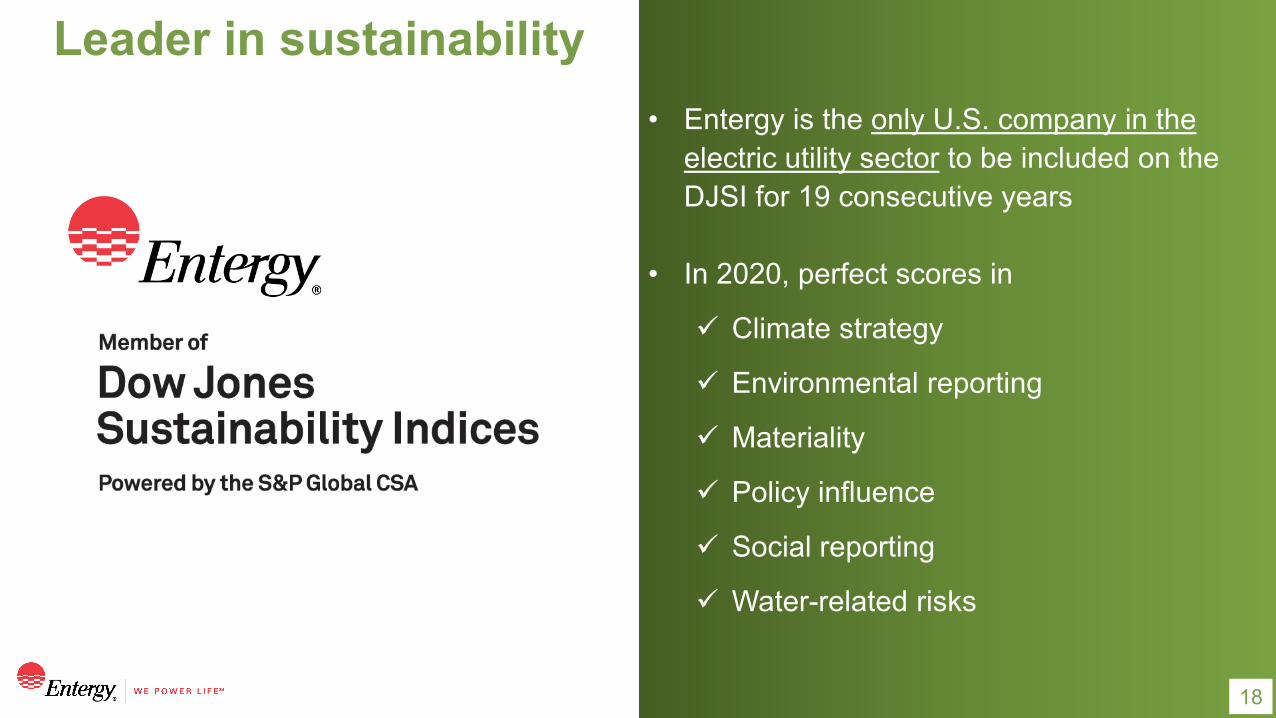
• Entergy is the only U.S. company in the electric utility sector to be included on the DJSI for 19 consecutive years
• In 2020, perfect scores in
Climate strategy
Environmental reporting
Materiality
Policy influence
Social reporting
Water-related risks
Leader in sustainability
18
19
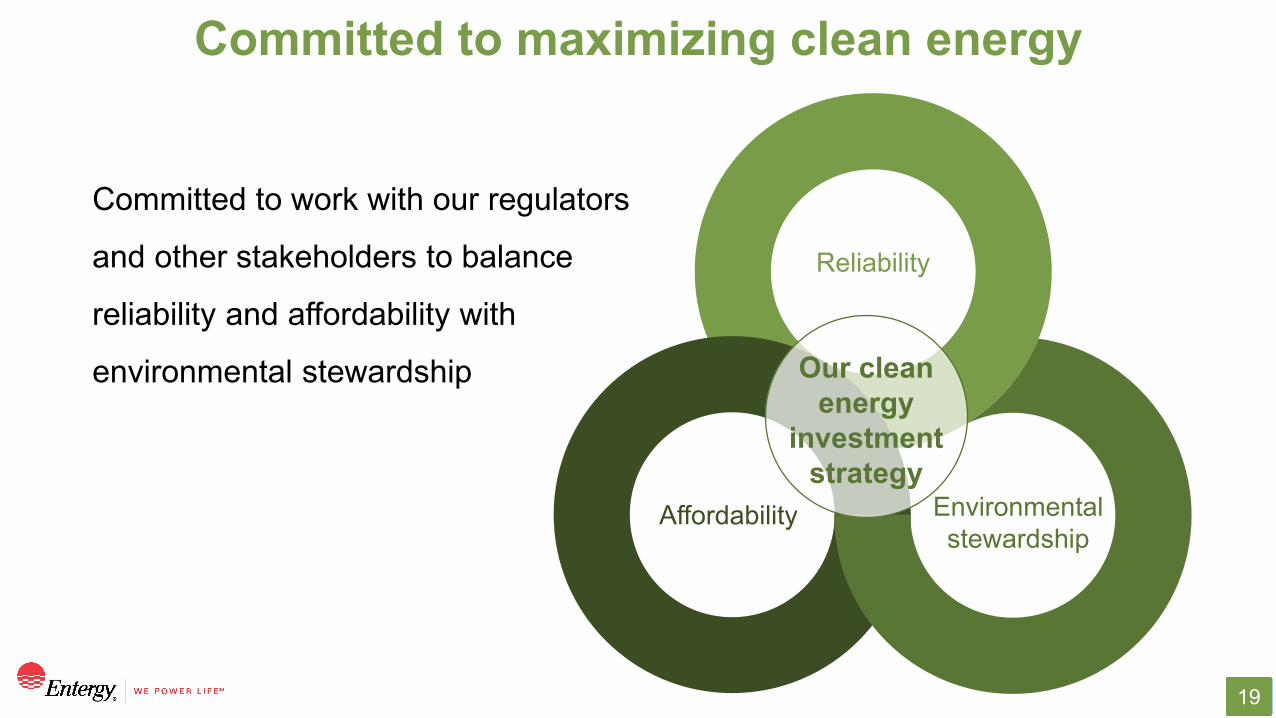
Committed to maximizing clean energy
Committed to work with our regulators
and other stakeholders to balance
reliability and affordability with
environmental stewardship
Reliability
Environmental stewardship
Our clean energy
investment strategy
Affordability
19
20
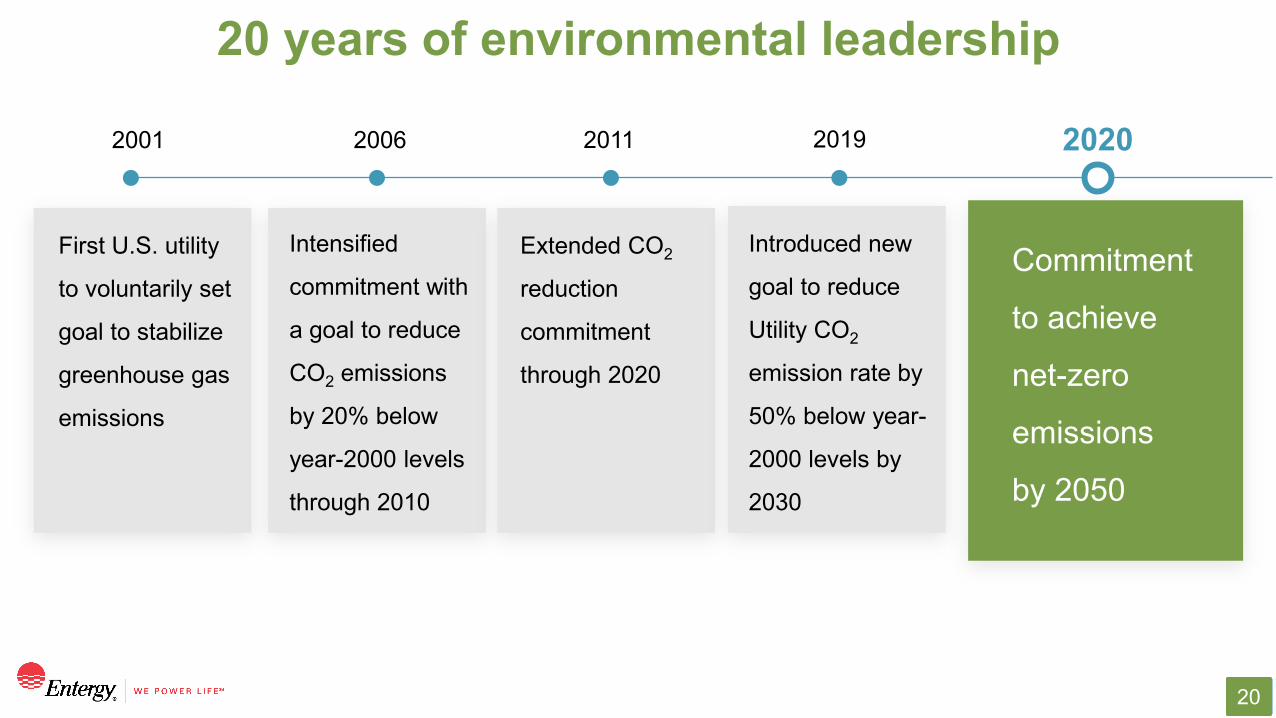
20 years of environmental leadership
20202001 2006 2011 2019
First U.S. utility
to voluntarily set
goal to stabilize
greenhouse gas
emissions
Intensified
commitment with
a goal to reduce
CO2 emissions
by 20% below
year-2000 levels
through 2010
Extended CO2
reduction
commitment
through 2020
Introduced new
goal to reduce
Utility CO2
emission rate by
50% below year-
2000 levels by
2030
Commitment
to achieve
net-zero
emissions
by 2050
20
21
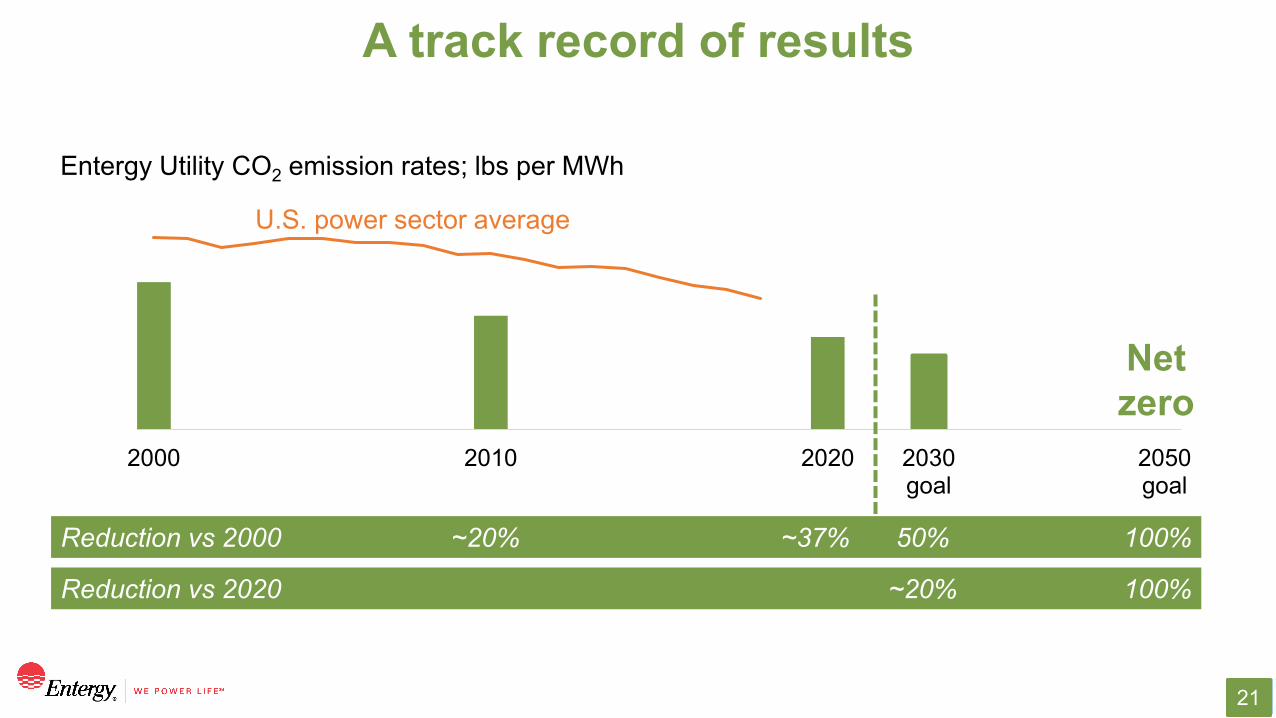
A track record of results
2000 2010 2020 2030goal
2050goal
Entergy Utility CO2 emission rates; lbs per MWh
U.S. power sector average
Netzero
Reduction vs 2000 ~20% ~37% 50% 100%
Reduction vs 2020 ~20% 100%
21
22
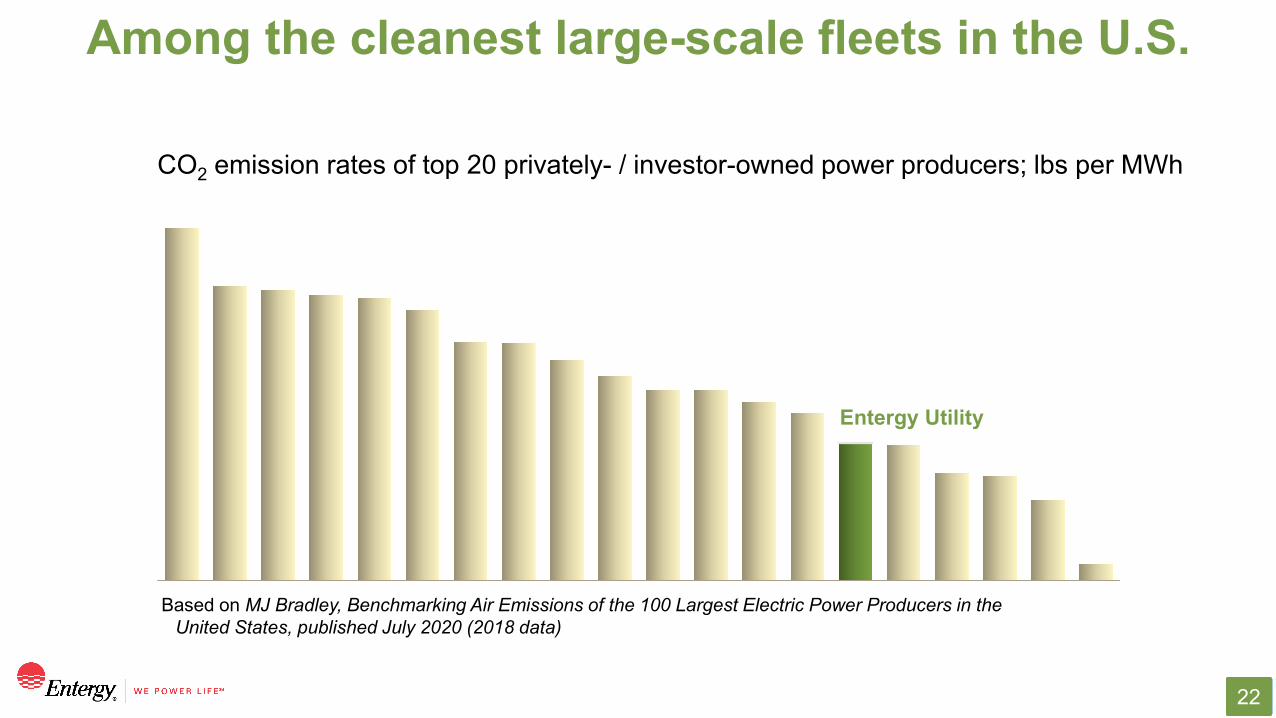
Among the cleanest large-scale fleets in the U.S.
Entergy Utility
CO2 emission rates of top 20 privately- / investor-owned power producers; lbs per MWh
Based on MJ Bradley, Benchmarking Air Emissions of the 100 Largest Electric Power Producers in the United States, published July 2020 (2018 data)
22
23
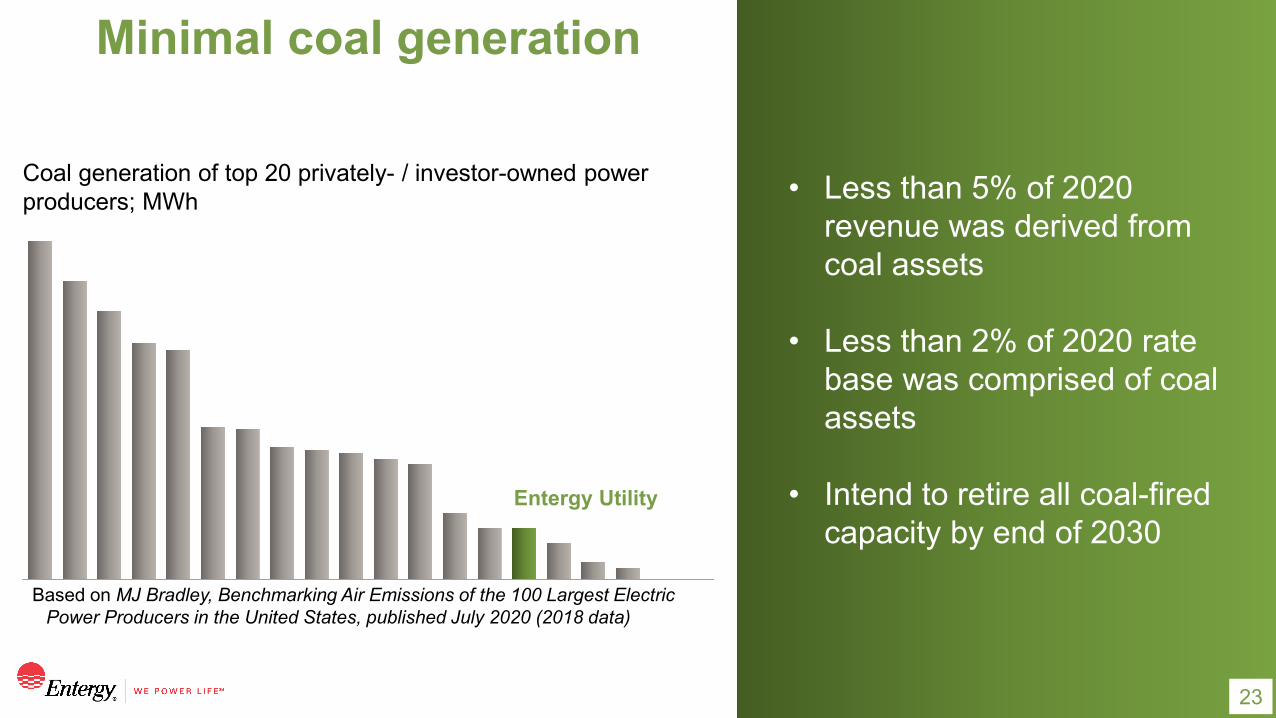
• Less than 5% of 2020 revenue was derived from coal assets
• Less than 2% of 2020 rate base was comprised of coal assets
• Intend to retire all coal-fired capacity by end of 2030
Minimal coal generation
Entergy Utility
Coal generation of top 20 privately- / investor-owned power producers; MWh
Based on MJ Bradley, Benchmarking Air Emissions of the 100 Largest Electric Power Producers in the United States, published July 2020 (2018 data)
23
24
Walnut Bend
St. James
Capital RegionIris
ChicotSunflower
Stuttgart
Searcy
PatersonNew Orleans Solar Station
Montauk
Vidalia
DeSoto
Hinds
Brookhaven
Liberty County
Umbriel
Toledo Bend
Carpenter Remmel
Rain CIIAgrilectric
West Memphis
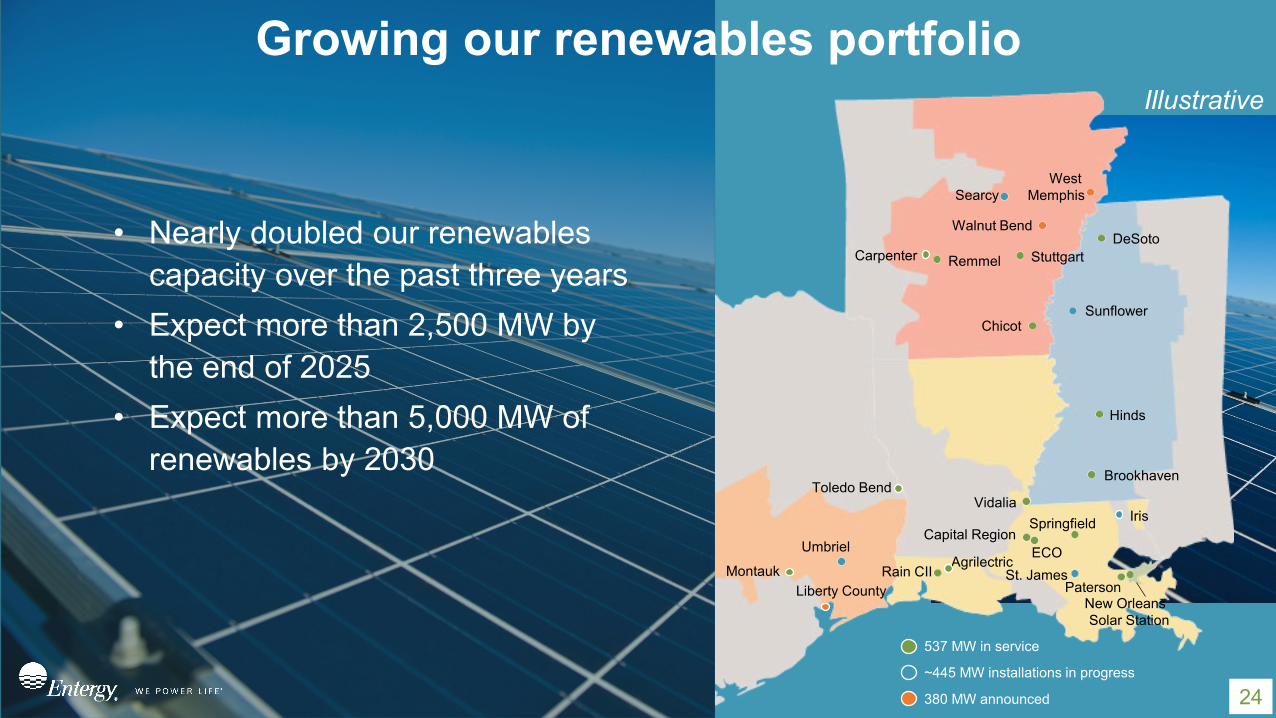
Growing our renewables portfolio
• Nearly doubled our renewables capacity over the past three years
• Expect more than 2,500 MW by the end of 2025
• Expect more than 5,000 MW of renewables by 2030
Illustrative
ECO
Springfield
24
537 MW in service
~445 MW installations in progress
380 MW announced
25
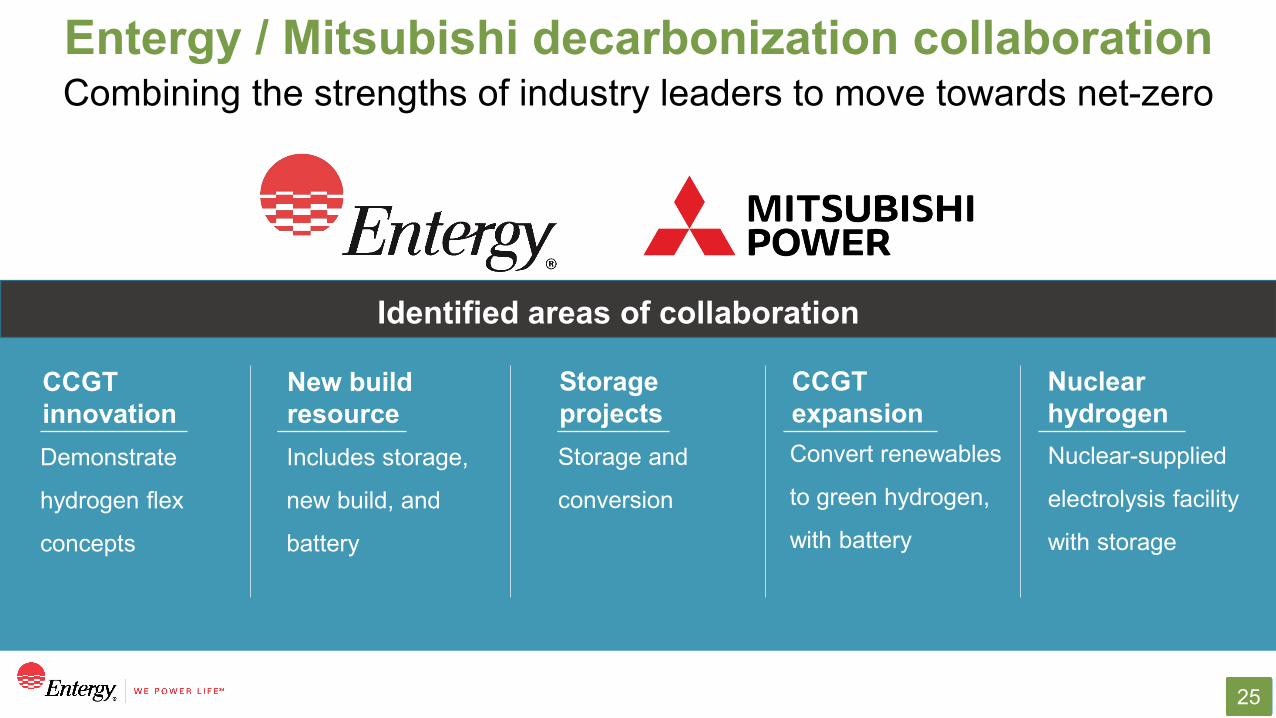
Combining the strengths of industry leaders to move towards net-zeroEntergy / Mitsubishi decarbonization collaboration
Identified areas of collaboration
Demonstrate
hydrogen flex
concepts
CCGT innovation
Includes storage,
new build, and
battery
New build resource
Storage and
conversion
Storage projects
Nuclear-supplied
electrolysis facility
with storage
Nuclear hydrogen
Convert renewables
to green hydrogen,
with battery
CCGT expansion
25
26
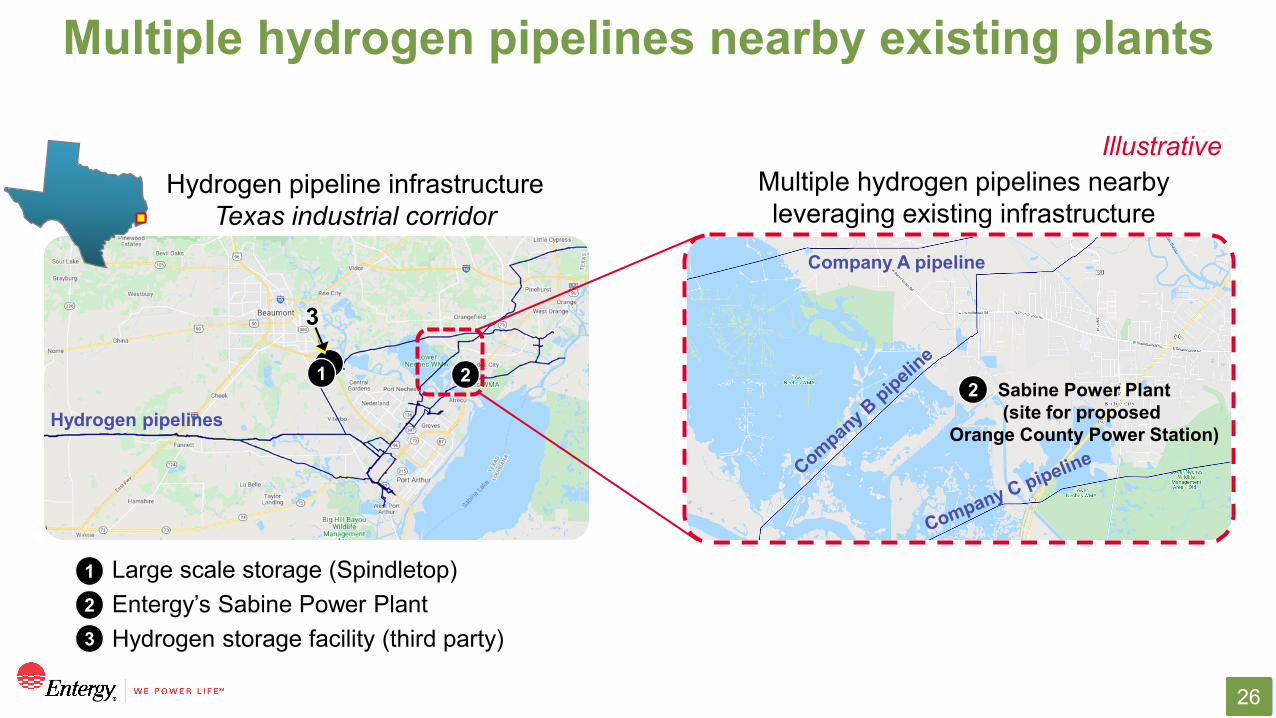
Multiple hydrogen pipelines nearby existing plants
Hydrogen pipeline infrastructureTexas industrial corridor
2
Large scale storage (Spindletop)Entergy’s Sabine Power PlantHydrogen storage facility (third party)
2
Company A pipeline
Sabine Power Plant(site for proposed
Orange County Power Station)
Multiple hydrogen pipelines nearbyleveraging existing infrastructure
1
Hydrogen pipelines
3
Illustrative
1
2
3
26
27
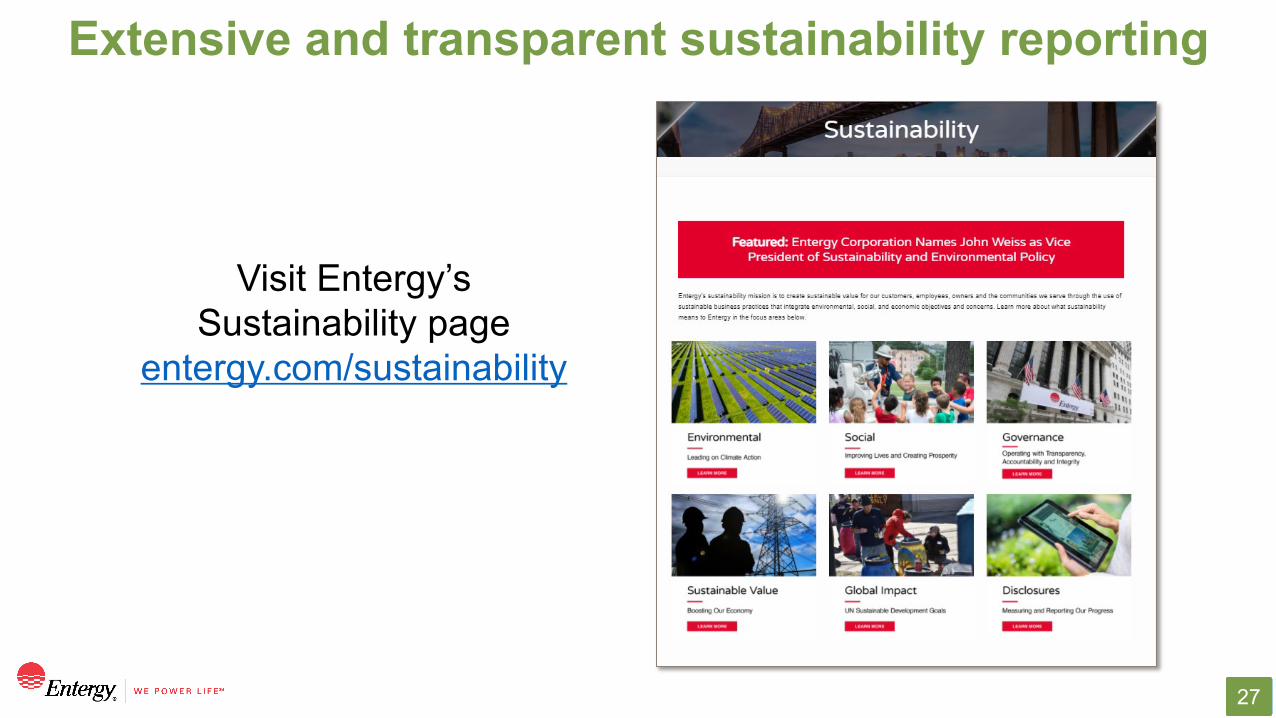
Extensive and transparent sustainability reporting
Visit Entergy’s Sustainability page
entergy.com/sustainability
27
28
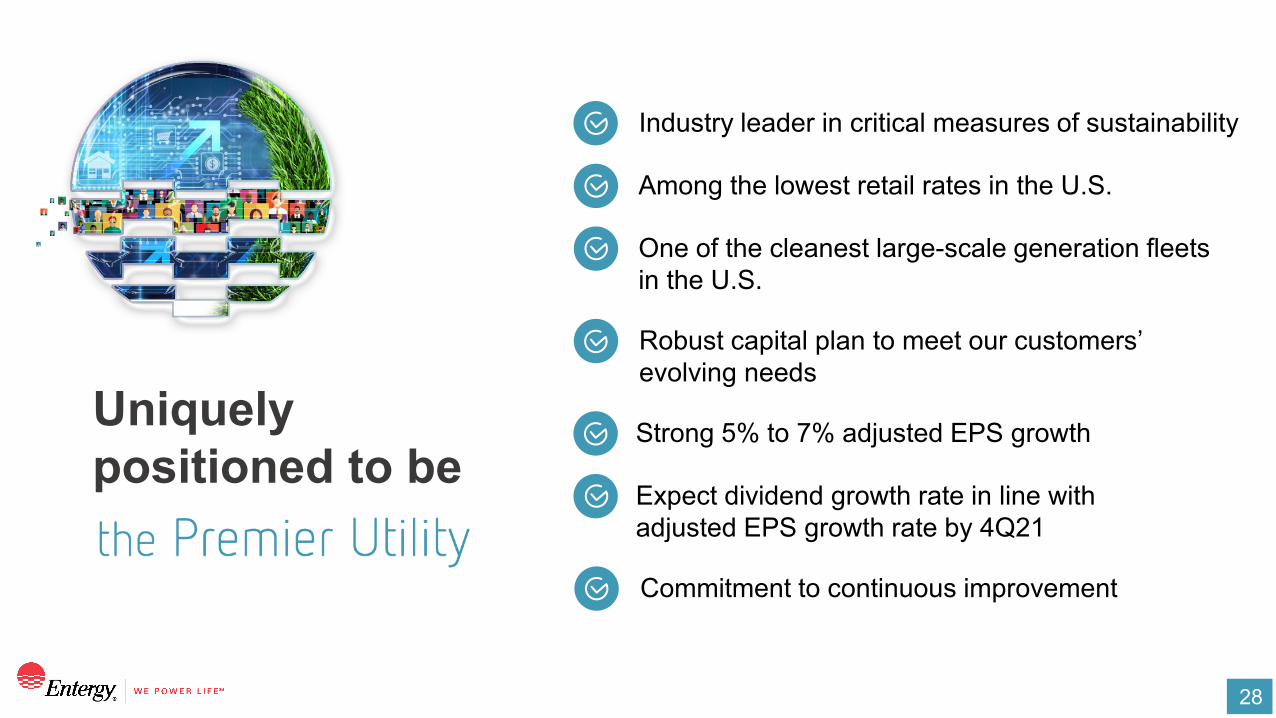
Industry leader in critical measures of sustainability
Among the lowest retail rates in the U.S.
One of the cleanest large-scale generation fleets in the U.S.
Robust capital plan to meet our customers’ evolving needs
Strong 5% to 7% adjusted EPS growth
Expect dividend growth rate in line with adjusted EPS growth rate by 4Q21
Commitment to continuous improvement
Uniquely positioned to be
29
Appendix
30
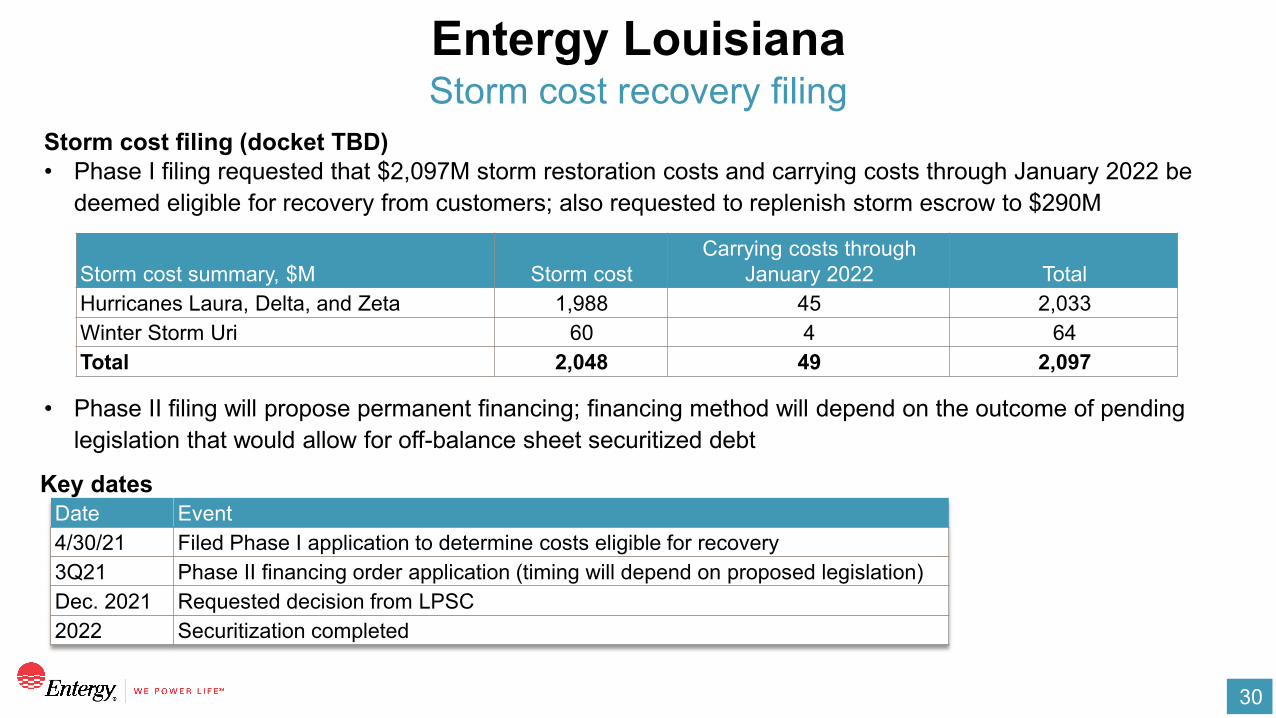
Storm cost recovery filingEntergy Louisiana
Key datesDate Event4/30/21 Filed Phase I application to determine costs eligible for recovery3Q21 Phase II financing order application (timing will depend on proposed legislation)Dec. 2021 Requested decision from LPSC2022 Securitization completed
Storm cost filing (docket TBD)• Phase I filing requested that $2,097M storm restoration costs and carrying costs through January 2022 be
deemed eligible for recovery from customers; also requested to replenish storm escrow to $290M
• Phase II filing will propose permanent financing; financing method will depend on the outcome of pending legislation that would allow for off-balance sheet securitized debt
Storm cost summary, $M Storm costCarrying costs through
January 2022 TotalHurricanes Laura, Delta, and Zeta 1,988 45 2,033Winter Storm Uri 60 4 64Total 2,048 49 2,097
31
Regulation Greconciliations
32
Regulation G reconciliations
Calculations may differ due to rounding
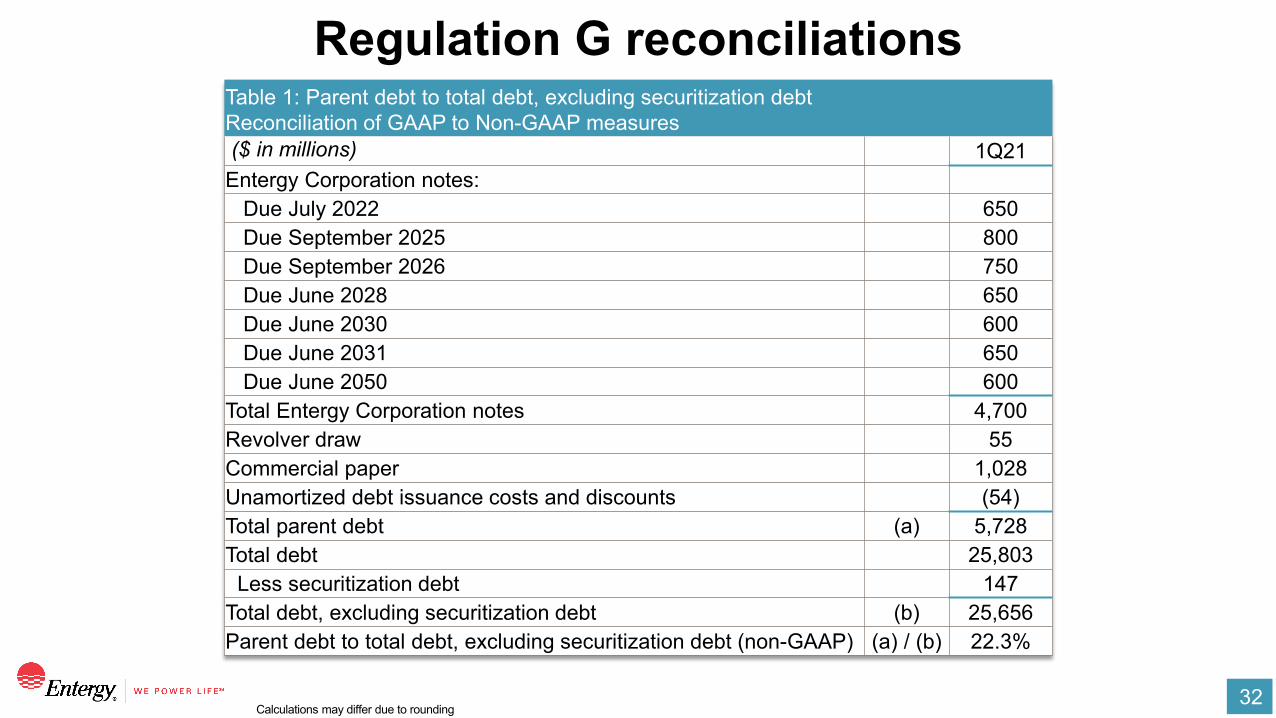
Table 1: Parent debt to total debt, excluding securitization debtReconciliation of GAAP to Non-GAAP measures($ in millions) 1Q21
Entergy Corporation notes:Due July 2022 650Due September 2025 800Due September 2026 750Due June 2028 650Due June 2030 600Due June 2031 650Due June 2050 600
Total Entergy Corporation notes 4,700Revolver draw 55Commercial paper 1,028Unamortized debt issuance costs and discounts (54)Total parent debt (a) 5,728Total debt 25,803
Less securitization debt 147Total debt, excluding securitization debt (b) 25,656Parent debt to total debt, excluding securitization debt (non-GAAP) (a) / (b) 22.3%
33
Regulation G reconciliations
Calculations may differ due to rounding
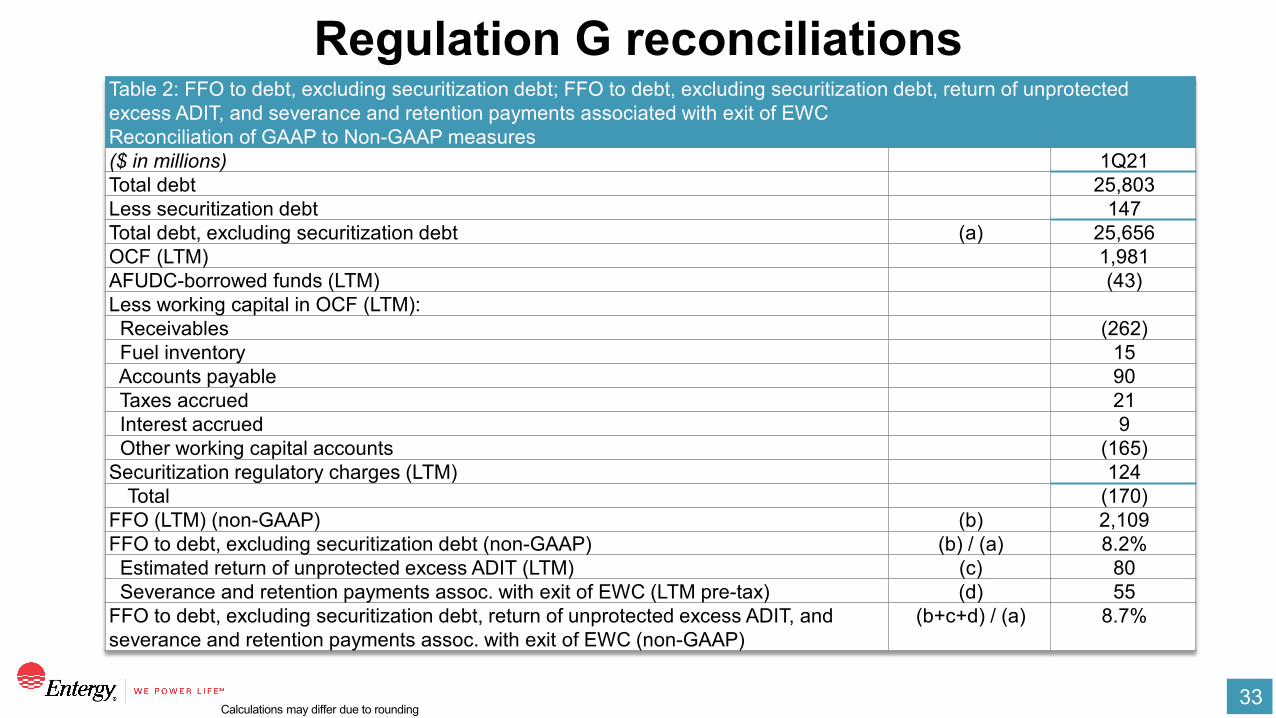
Table 2: FFO to debt, excluding securitization debt; FFO to debt, excluding securitization debt, return of unprotected excess ADIT, and severance and retention payments associated with exit of EWCReconciliation of GAAP to Non-GAAP measures($ in millions) 1Q21Total debt 25,803Less securitization debt 147Total debt, excluding securitization debt (a) 25,656OCF (LTM) 1,981AFUDC-borrowed funds (LTM) (43)Less working capital in OCF (LTM):Receivables (262)Fuel inventory 15Accounts payable 90Taxes accrued 21Interest accrued 9Other working capital accounts (165)
Securitization regulatory charges (LTM) 124Total (170)
FFO (LTM) (non-GAAP) (b) 2,109FFO to debt, excluding securitization debt (non-GAAP) (b) / (a) 8.2%Estimated return of unprotected excess ADIT (LTM) (c) 80Severance and retention payments assoc. with exit of EWC (LTM pre-tax) (d) 55
FFO to debt, excluding securitization debt, return of unprotected excess ADIT, and severance and retention payments assoc. with exit of EWC (non-GAAP)
(b+c+d) / (a) 8.7%
34
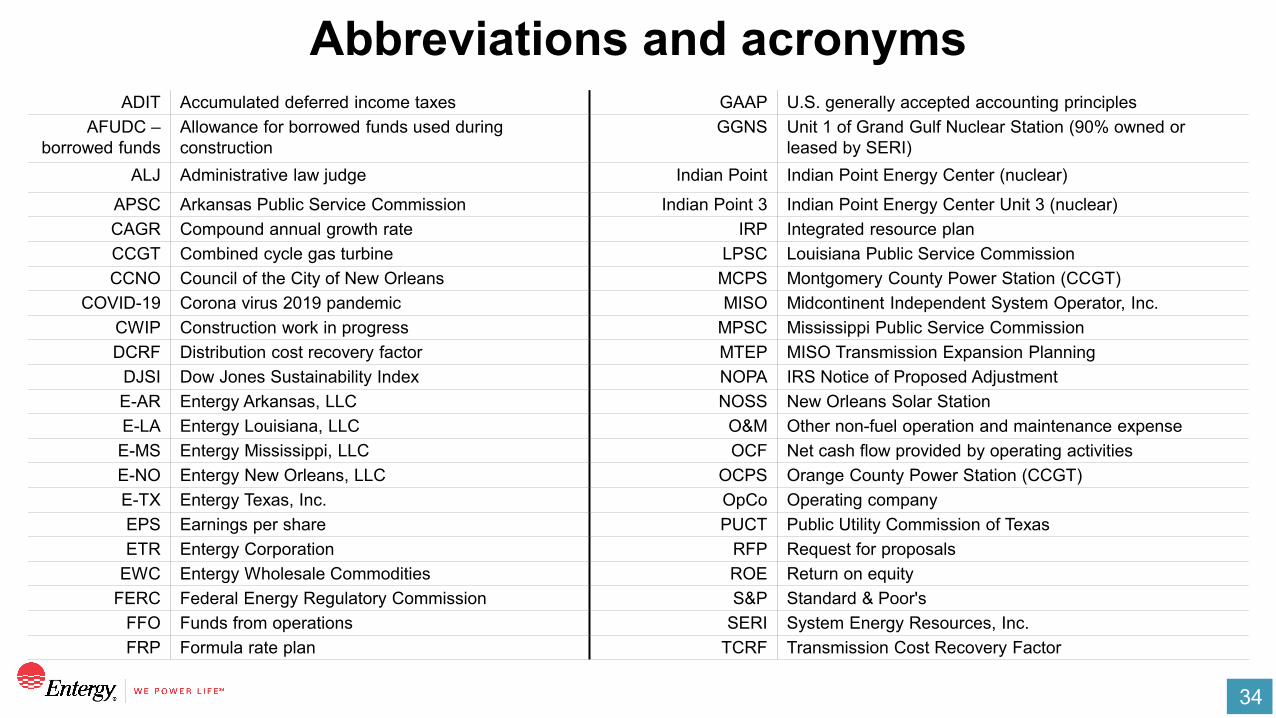
Abbreviations and acronyms ADIT Accumulated deferred income taxes GAAP U.S. generally accepted accounting principles
AFUDC –borrowed funds
Allowance for borrowed funds used during construction
GGNS Unit 1 of Grand Gulf Nuclear Station (90% owned or leased by SERI)
ALJ Administrative law judge Indian Point Indian Point Energy Center (nuclear)
APSC Arkansas Public Service Commission Indian Point 3 Indian Point Energy Center Unit 3 (nuclear)CAGR Compound annual growth rate IRP Integrated resource planCCGT Combined cycle gas turbine LPSC Louisiana Public Service CommissionCCNO Council of the City of New Orleans MCPS Montgomery County Power Station (CCGT)
COVID-19 Corona virus 2019 pandemic MISO Midcontinent Independent System Operator, Inc.CWIP Construction work in progress MPSC Mississippi Public Service CommissionDCRF Distribution cost recovery factor MTEP MISO Transmission Expansion Planning
DJSI Dow Jones Sustainability Index NOPA IRS Notice of Proposed AdjustmentE-AR Entergy Arkansas, LLC NOSS New Orleans Solar StationE-LA Entergy Louisiana, LLC O&M Other non-fuel operation and maintenance expense E-MS Entergy Mississippi, LLC OCF Net cash flow provided by operating activitiesE-NO Entergy New Orleans, LLC OCPS Orange County Power Station (CCGT)E-TX Entergy Texas, Inc. OpCo Operating companyEPS Earnings per share PUCT Public Utility Commission of TexasETR Entergy Corporation RFP Request for proposals
EWC Entergy Wholesale Commodities ROE Return on equityFERC Federal Energy Regulatory Commission S&P Standard & Poor's
FFO Funds from operations SERI System Energy Resources, Inc.FRP Formula rate plan TCRF Transmission Cost Recovery Factor