1 Knowledge Exchange Franz J. Kurfess Cal Poly SLO Computer Science Department.
date post
20-Dec-2015Category
view
217download
0
© 2001-2005 Franz J. Kurfess Knowledge Presentation 1
CPE/CSC 580: Knowledge Management
CPE/CSC 580: Knowledge Management
Dr. Franz J. Kurfess
Computer Science Department
Cal Poly

© 2001-2005 Franz J. Kurfess Knowledge Presentation 2
Course OverviewCourse Overview Introduction Knowledge Processing
Knowledge Acquisition, Representation and Manipulation
Knowledge Organization Classification, Categorization Ontologies, Taxonomies, Thesauri
Knowledge Retrieval Information Retrieval Knowledge Navigation
Knowledge Presentation Knowledge Visualization
Knowledge Exchange Knowledge Capture, Transfer,
and Distribution Usage of Knowledge
Access Patterns, User Feedback
Knowledge Management Techniques Topic Maps, Agents
Knowledge Management Tools
Knowledge Management in Organizations
© 2001-2005 Franz J. Kurfess Knowledge Presentation 3
Overview Knowledge PresentationOverview Knowledge Presentation
Motivation Objectives Evaluation Criteria Chapter Introduction
Cognition and Perception
Visualization Data Visualization Information Visualization Knowledge Visualization
Alternatives to Visualization Sound Tactile Presentation
Virtual Reality Immersion
Important Concepts and Terms
Chapter Summary

© 2001-2005 Franz J. Kurfess Knowledge Presentation 4
LogisticsLogistics Introductions Course Materials
textbook handouts Web page CourseInfo/Blackboard System and Alternatives
Term Project Lab and Homework Assignments Exams Grading

© 2001-2005 Franz J. Kurfess Knowledge Presentation 5
Stories, not Bories!Stories,
not Bories! lengthy explanations
endless bulleted lists allows the discussion of more
or less relevant issues at arbitrary levels of detail
important stuff in unreadably small font sizes
speaker reads from the display reinforces knowledge transfer
by exploiting multiple modalities
audience enjoys a nice nap no nasty/embarrassing
questions refreshed after the talk
[Clemens 1998, http://www.idiagram.com]

© 2001-2005 Franz J. Kurfess Knowledge Presentation 7
MotivationMotivation
reduce the user’s overhead for locating and interpreting knowledge indicate attributes of concepts show relationships between items display results of a search
visual computing utilize the features of computer displays
instead of “paper replication”
make technology conform to people instead of forcing people to adapt to technology

© 2001-2005 Franz J. Kurfess Knowledge Presentation 8
ObjectivesObjectives
be aware of perceptual and cognitive aspects of human information processing main emphasis on visual input
understand presentation methods and techniques for data, information, and knowledge
evaluate the use of visualization techniques for knowledge management purposes

© 2001-2005 Franz J. Kurfess Knowledge Presentation 10
CognitionCognition
cognitive engineering design principles for presentation techniques based on cognitive processes in humans
information processing, attention, memory
main emphasis on the visual system mental depiction can be as important as mental description
[Kowalski 1997]
© 2001-2005 Franz J. Kurfess Knowledge Presentation 11
PerceptionPerception
interface between our mind and the worldsensory information translates physical aspects of
the world into neural encodings in our brain visual and auditory systems are most relevant for
knowledge-related perception many lower-level processing steps are encoded in
“wetware” and happen sub-consciously
[Kowalski 1997]

© 2001-2005 Franz J. Kurfess Knowledge Presentation 12
Information VisualizationInformation Visualization
utilizes the visual system to indicate important aspects of data and information absence/presence quantity features
basis for writing, drawing, art long-distance communication long-term preservation of knowledge
graphical displays offer a much richer visual experience than text-based terminals flexibility, resolution, color
[Kowalski 1997]
© 2001-2005 Franz J. Kurfess Knowledge Presentation 13
Cognitive Aspects of VisionCognitive Aspects of Visionproximity
nearby items are grouped together
similarity similar items are grouped together
continuity smooth continuous patterns vs. separate items
closure automatic filling of gaps in a figure
connectedness interpretation of related items as single units
many of these aspects are performed at low levels of perception
[Kowalski 1997]

© 2001-2005 Franz J. Kurfess Knowledge Presentation 14
Visualization PrimitivesVisualization Primitivesbuilt-in, low level functions of our visual systemorientation of shapes
easy detection of groupings
color preference for primary colors
depth cues to size, distance of objects
arrangement of objects deviation from regular arrangements are easily detected
spatial frequency construction of a coherent visual image is attempted
[Kowalski 1997]

© 2001-2005 Franz J. Kurfess Knowledge Presentation 15
Technology: Visual ComputingTechnology: Visual Computing
computer presentation technology has some advantages over other media modify representations of data and information
e.g. change color, scale
show changes in space and time through animation use interaction with the user to optimize presentation
according to the user’s preferences
show relationships between items e.g. through hyperlinks

© 2001-2005 Franz J. Kurfess Knowledge Presentation 16
Visual Presentation TechniquesVisual Presentation Techniques
text mostly sequential good for details, explanations
diagrams two-dimensional good for structural aspects, relations between items, properties
images two-dimensional (partial) reproduction of real-world objects creation of imaginary objects
e.g. art

© 2001-2005 Franz J. Kurfess Knowledge Presentation 17
Visual Presentation MethodsVisual Presentation Methods
hierarchical structures (trees) appropriate for items with relations such as
is-a, part-of, parent-child, dependencies, etc.
becomes difficult to use for large structuresmap
arranges items according to spatial proximity useful for properties that map into space
with zooming, it can be used for large sets of itemsgrid
visualization of tabular data requires strong regularities in the overall information space
[Kowalski 1997]

© 2001-2005 Franz J. Kurfess Knowledge Presentation 18
Visual Presentation Methods cont.Visual Presentation Methods cont.
network (graph) items are represented as nodes, and relationships as arcs
clusters related items are grouped together
bar chart indicates values of properties
histogram shows the distribution of items
perspective wall main focus on the centerpiece (front), with less relevant items
arranged on the side panels
[Kowalski 1997]
© 2001-2005 Franz J. Kurfess Knowledge Presentation 19
Auditory Presentation TechniquesAuditory Presentation Techniques
language sequential similar to text
sound (partial) reproduction of real-world events creation of new events
e.g. music
© 2001-2005 Franz J. Kurfess Knowledge Presentation 20
Relevance of Knowledge Presentation
Relevance of Knowledge Presentation
better user experience shorter time to locate and identify relevant knowledge knowledge is easier to comprehend and utilize
improved understanding critical examination of existing bodies of knowledge exploration and validation of relationships suitable presentation of abstract concepts
creation of new knowledge integration of existing diverse bodies of knowledge addition of relationships between knowledge items

© 2001-2005 Franz J. Kurfess Knowledge Presentation 21
Data VisualizationData Visualization
visual display of data values
0
5
10
15
20
253-D Column 13-D Column 2050545862667074788286903-D Column 15

© 2001-2005 Franz J. Kurfess Knowledge Presentation 22
Information VisualizationInformation Visualization display of relationships for structured data
e.g. entity-relationship diagrams
document clustering present the user with a visual representation of the document space
constrained by the search criteria group related documents together
requires a similarity measure
search formulation analysis display the relationships between various aspects of the search terms
and the retrieved results effects of expansion, relevance feedback, etc.
used to help the user formulate a better query

© 2001-2005 Franz J. Kurfess Knowledge Presentation 23
Knowledge VisualizationKnowledge Visualization
link display indicates relationships between items color, patterns, thickness, arrows, labels, etc. can be used
to differentiate types of relationships
link analysis correlates multiple documents that share certain aspects helps with the identification of dependencies, trends, etc.

© 2001-2005 Franz J. Kurfess Knowledge Presentation 24
Alternatives to VisualizationAlternatives to Visualization
utilization of other senses for the presentation of knowledge auditory
speech signals
beeps
tactile virtual reality
taste smell

© 2001-2005 Franz J. Kurfess Knowledge Presentation 25
SoundSound
speech somewhat limited due to the sequential nature helpful as alternative or additional method
sounds sometimes used for alerts, or to augment aspects of visual
display
music primarily used for entertainment purposes may be used to evoke emotional responses
© 2001-2005 Franz J. Kurfess Knowledge Presentation 26
Tactile PresentationTactile Presentation
Braille as alternative to text input for visually impaired people
virtual reality mainly augmentation of visual input
special-purpose devices feedback mouse
special mouse/mouse pad combination that delivers some tactile feedback to the user
feedback joysticks, haptic gloves force feedback used for tele-manipulation, VR

© 2001-2005 Franz J. Kurfess Knowledge Presentation 27
Virtual RealityVirtual Reality
tries to provide a computer-based model of an environment
relies mainly on 3D visual inputfeedback between user and system is critical
direct manipulation of virtual objects
mostly used for modeling purposes, not so much for knowledge presentation

© 2001-2005 Franz J. Kurfess Knowledge Presentation 28
ImmersionImmersion
similar to VR, tele-presencethe user has the impression of being in another
environment

© 2001-2005 Franz J. Kurfess Knowledge Presentation 29
Inxight TreeInxight Tree tree displays the
hierarchical structure of a Web site
overview of available contents
quick navigation no details
[Inxight 2001]

© 2001-2005 Franz J. Kurfess Knowledge Presentation 30
Lexis-Nexis TreeLexis-Nexis Tree built with Inxight
Tree Studio

© 2001-2005 Franz J. Kurfess Knowledge Presentation 32
Understanding USA: EnvironmentUnderstanding USA: Environment
[Understanding USA]

© 2001-2005 Franz J. Kurfess Knowledge Presentation 33
ClearForest ClearSight ViewerClearForest ClearSight Viewer
[ClearForest 2001]

© 2001-2005 Franz J. Kurfess Knowledge Presentation 34
OutlineOutline
DefinitionsConstant Information DensityVISAGEBig Issues
[Woodruff 1998]

© 2001-2005 Franz J. Kurfess Knowledge Presentation 35
DefinitionsDefinitions
Scientific visualization Information visualizationDatabase visualization
[Woodruff 1998]

© 2001-2005 Franz J. Kurfess Knowledge Presentation 36
DefinitionsDefinitions
Scientific visualization Physical data, physical processes
Information visualization Abstract representations
Database visualization Mapping data in database
to graphical display
[Woodruff 1998]

© 2001-2005 Franz J. Kurfess Knowledge Presentation 37
OutlineOutline
DefinitionsConstant Information DensityVISAGEBig Issues
[Woodruff 1998]
© 2001-2005 Franz J. Kurfess Knowledge Presentation 38
MotivationMotivation
Clutter can have negative effects Decreased user performance Diminished visual appeal …
VIDEO
[Woodruff 1998]
© 2001-2005 Franz J. Kurfess Knowledge Presentation 39
Comments?Comments?
Do people buy the concept of Constant Information Density?
What tasks might it be appropriate for?Will a new type of graphic replace existing
paradigms? Playfair...
[Woodruff 1998]
© 2001-2005 Franz J. Kurfess Knowledge Presentation 40
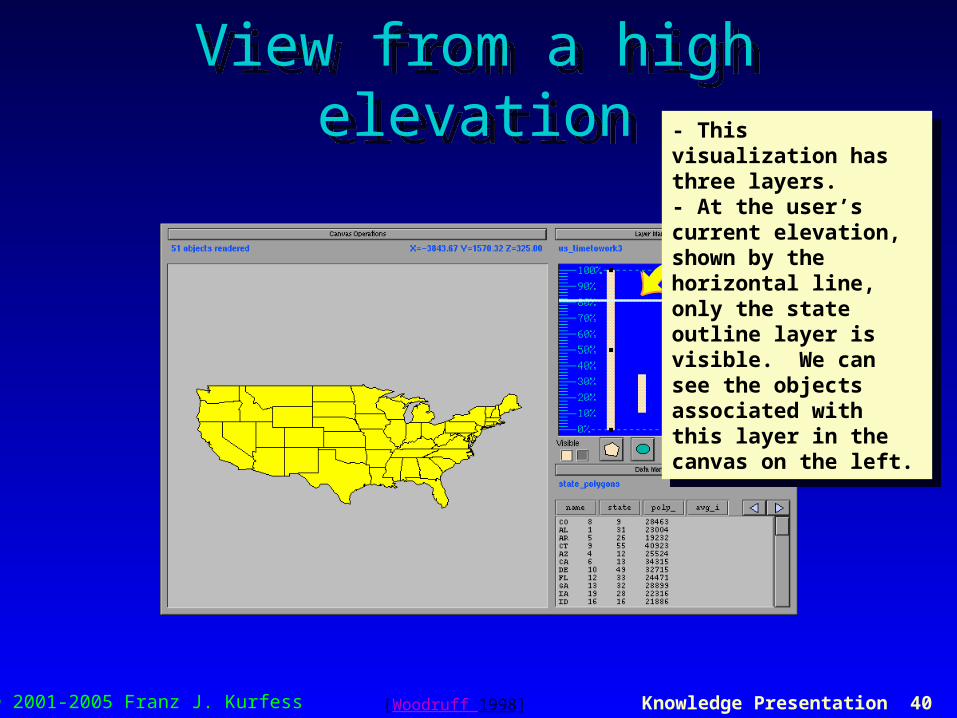
View from a high elevationView from a high elevation
At the user’s current elevation, only the state outline layer is visible
- This visualization has three layers.- At the user’s current elevation, shown by the horizontal line, only the state outline layer is visible. We can see the objects associated with this layer in the canvas on the left.
- This visualization has three layers.- At the user’s current elevation, shown by the horizontal line, only the state outline layer is visible. We can see the objects associated with this layer in the canvas on the left.
[Woodruff 1998]

© 2001-2005 Franz J. Kurfess Knowledge Presentation 41
View from an intermediate elevationView from an intermediate elevation
The cities circles layer becomes visible when the user zooms
States are still visible and a new layer is visible
States are still visible and a new layer is visible
[Woodruff 1998]

© 2001-2005 Franz J. Kurfess Knowledge Presentation 42
View from a low elevationView from a low elevation
The graph layer replaces the circles layer
At this elevation, a new layer is visible, and the circles layer is no longer visible, so a graph of transportation data for each city replaces the circle for each city
At this elevation, a new layer is visible, and the circles layer is no longer visible, so a graph of transportation data for each city replaces the circle for each city
[Woodruff 1998]

© 2001-2005 Franz J. Kurfess Knowledge Presentation 43
Width bars in our exampleWidth bars in our exampleA couple of slides ago we saw a cluttered visualization. This picture shows VIDA’s density feedback on that same visualization, using # objects as the density function.
A couple of slides ago we saw a cluttered visualization. This picture shows VIDA’s density feedback on that same visualization, using # objects as the density function.
We can see that at this particular elevation, this layer on the far right is causing us the trouble. We can also see that other elevations will be cluttered.
We can see that at this particular elevation, this layer on the far right is causing us the trouble. We can also see that other elevations will be cluttered.
The two layers on the left contain political boundaries. The four layers on the right contain cities of different sizes. We can see that there are different numbers of cities in each of these layers.
The two layers on the left contain political boundaries. The four layers on the right contain cities of different sizes. We can see that there are different numbers of cities in each of these layers.
[Woodruff 1998]

© 2001-2005 Franz J. Kurfess Knowledge Presentation 44
After the user has made adjustmentsAfter the user has made adjustments
User can make all the necessary adjustments without zooming back and forth to check each change
User can make all the necessary adjustments without zooming back and forth to check each change
[Woodruff 1998]

© 2001-2005 Franz J. Kurfess Knowledge Presentation 45
Housing cost/Income visualizationHousing cost/Income visualization
Before
After
- This is a visualization of housing cost (shown on the x axis) versus income (shown on the y axis).- States can be represented as either a dot or a state outline.
- This is a visualization of housing cost (shown on the x axis) versus income (shown on the y axis).- States can be represented as either a dot or a state outline.
VIDA chooses between these two representations based on density as measured by the # vertices - in the denser regions, dots are drawn. In less dense regions, the state outlines are drawn. Essentially, the user is shown more detail about outliers.
VIDA chooses between these two representations based on density as measured by the # vertices - in the denser regions, dots are drawn. In less dense regions, the state outlines are drawn. Essentially, the user is shown more detail about outliers.
[Woodruff 1998]

© 2001-2005 Franz J. Kurfess Knowledge Presentation 46
Fortune 500 visualizationFortune 500 visualization Displayed using VIDA’s
technique for non-uniform data Outliers have more detailed
representation
% profit
# em
ploy
ees
I’ve extended VIDA to support this functionality as I’ll illustrate in this example of Fortune 500 data
I’ve extended VIDA to support this functionality as I’ll illustrate in this example of Fortune 500 data
[Woodruff 1998]

© 2001-2005 Franz J. Kurfess Knowledge Presentation 47
Population visualizationPopulation visualization
Before After
Once the user has expressed their constraints, VIDA can choose different combinations of layers to show in different parts of the visualization
Once the user has expressed their constraints, VIDA can choose different combinations of layers to show in different parts of the visualization
Smaller cities are omitted in the more populous areas in which larger cities are drawn. In the less populous areas where no larger cities exist, the smaller cities are drawn.
Smaller cities are omitted in the more populous areas in which larger cities are drawn. In the less populous areas where no larger cities exist, the smaller cities are drawn.
[Woodruff 1998]

© 2001-2005 Franz J. Kurfess Knowledge Presentation 48
Operations to decrease densityOperations to decrease density
Change shape
Reduce size
Remove attribute association
Change color
Original
Select
Aggregate
Reclassify
Comprehensive list of actions that can be performed on the contents of a single layer to decrease data density
Comprehensive list of actions that can be performed on the contents of a single layer to decrease data density
Zoomed-in view of circles showing populations of cities; these are Baltimore and Washington, D.C.
Zoomed-in view of circles showing populations of cities; these are Baltimore and Washington, D.C.
Notice how visually different all these options are
Notice how visually different all these options are
For example, Decreases # objects
For example, Decreases # objects
Aggregate cities by state; Chesapeake Bay; Decreases # objects
Aggregate cities by state; Chesapeake Bay; Decreases # objects
Have only two sizes of cities;Decreases # sizes
Have only two sizes of cities;Decreases # sizes
Decreases amount of ink
Decreases amount of ink
Decreases amount of ink
Decreases amount of ink
Decreases data density
Decreases data density
Decreases # colors once we take other layers into account
Decreases # colors once we take other layers into account
Not every action affects every density functionActions may affect several density functions
Not every action affects every density functionActions may affect several density functions
<<Data operations>><<Data operations>>
<<graphical operations>><<graphical operations>>
[Woodruff 1998]

© 2001-2005 Franz J. Kurfess Knowledge Presentation 49
The transformation canvasThe transformation canvas Transformations presented
to user in a “transformation” canvas Each transformation appears
as a portal
When the user zooms, the visualizations all change
How should user navigate the transformation space?
-- VIDA should give transformations like the one the user selected- After user enters the portal for a transformation, they can edit it- VIDA could then show them transformations that incorporated their changes
-- VIDA should give transformations like the one the user selected- After user enters the portal for a transformation, they can edit it- VIDA could then show them transformations that incorporated their changes
<<This visualization in the upper-right is particularly interesting. The association between city circle size and population has been removed, and an association between state color and population has been added.>>
<<This visualization in the upper-right is particularly interesting. The association between city circle size and population has been removed, and an association between state color and population has been added.>>
Portals’ contents change dynamically
Portals’ contents change dynamically
- Portals are a natural mechanism for presenting a number of visualizations to the user.
- Portals are a natural mechanism for presenting a number of visualizations to the user.
[Woodruff 1998]

© 2001-2005 Franz J. Kurfess Knowledge Presentation 50
OutlineOutline
DefinitionsConstant Information DensityVISAGEBig Issues
[Woodruff 1998]

© 2001-2005 Franz J. Kurfess Knowledge Presentation 51
IssuesIssues
What are some of the good techniques?What are some of the problems with VISAGE from
the user’s perspective?
[Woodruff 1998]

© 2001-2005 Franz J. Kurfess Knowledge Presentation 52
OutlineOutline
DefinitionsConstant Information DensityVISAGEBig Issues
[Woodruff 1998]

© 2001-2005 Franz J. Kurfess Knowledge Presentation 53
Interesting things to visualizeInteresting things to visualize
Graphs The Web!!!
Networks Network administration
Financial data Data mining (very little visual data mining work to date)
etc...
[Woodruff 1998]

© 2001-2005 Franz J. Kurfess Knowledge Presentation 54
Open problems in visualizationOpen problems in visualization
What are the limits of visualization?Multi-dimensional analysisContext, context, context
Users get lost while navigating Users lose linkages in multiple views Users get confused composing Magic Lenses
Creation End-user programming, automated creation
Misrepresentation
[Woodruff 1998]
© 2001-2005 Franz J. Kurfess Knowledge Presentation 55
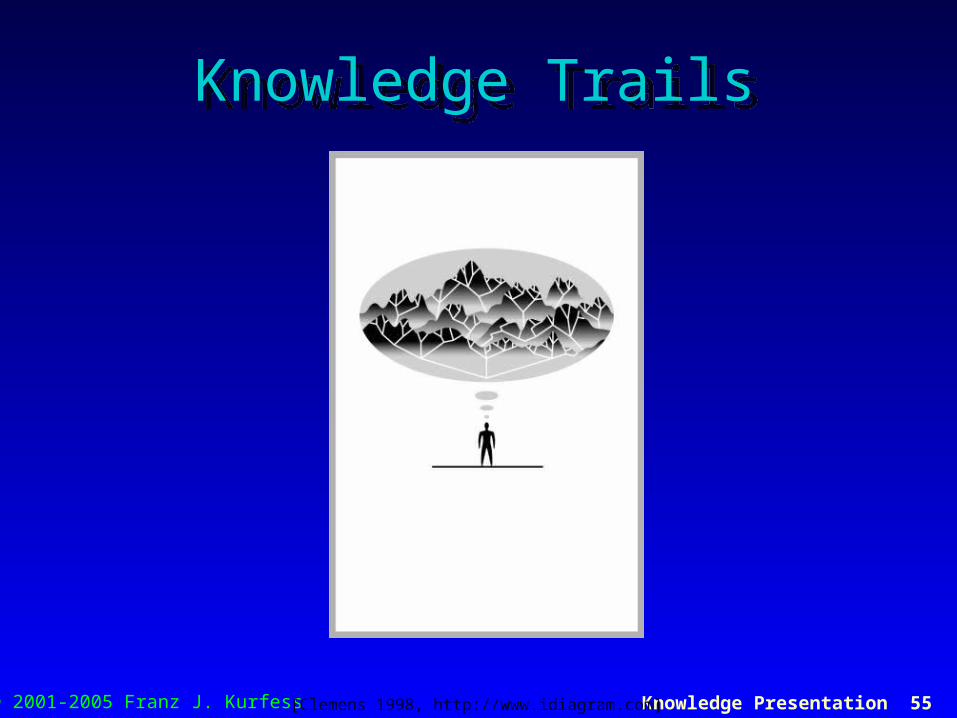
Knowledge TrailsKnowledge Trails
[Clemens 1998, http://www.idiagram.com]

© 2001-2005 Franz J. Kurfess Knowledge Presentation 56
Knowledge Levels in OrganizationsKnowledge Levels in Organizations
[Clemens 1998, http://www.idiagram.com]

© 2001-2005 Franz J. Kurfess Knowledge Presentation 57
Knowledge LandscapesKnowledge Landscapes
[Clemens 1998, http://www.idiagram.com]
© 2001-2005 Franz J. Kurfess Knowledge Presentation 60
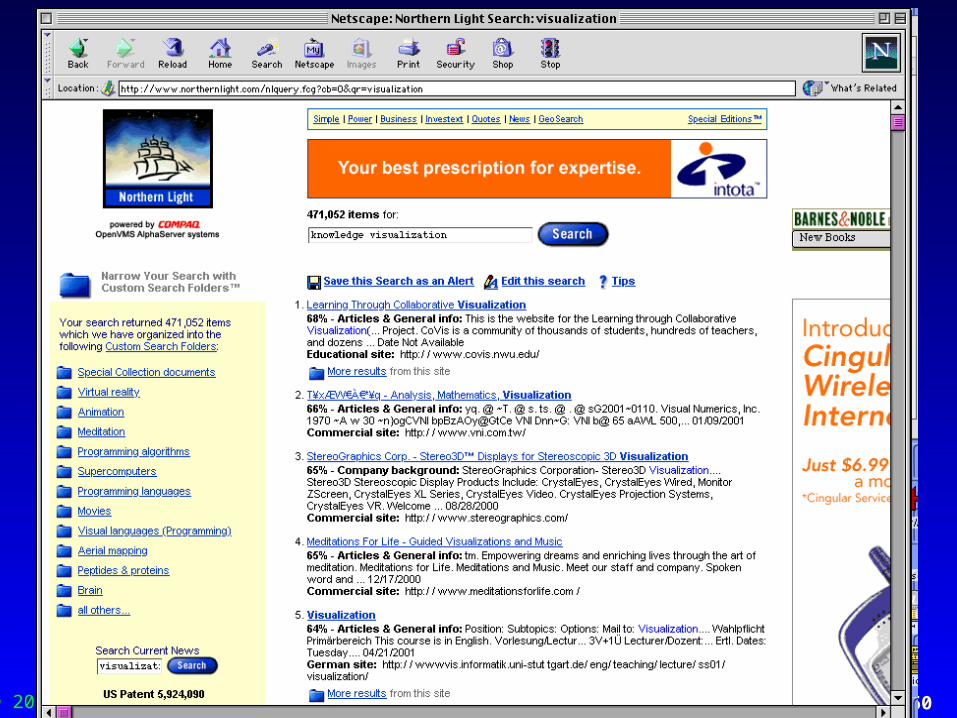
Visualization at NorthernLightVisualization at NorthernLight
© 2001-2005 Franz J. Kurfess Knowledge Presentation 61
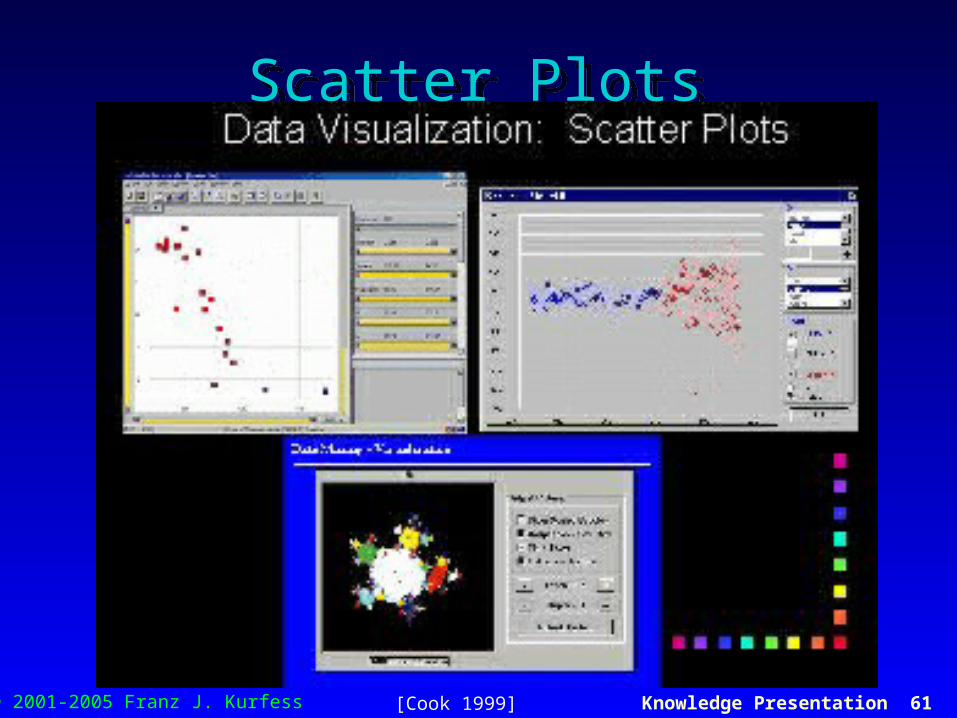
Scatter PlotsScatter Plots
[Cook 1999]

© 2001-2005 Franz J. Kurfess Knowledge Presentation 62
Pie and Bar ChartsPie and Bar Charts
[Cook 1999]

© 2001-2005 Franz J. Kurfess Knowledge Presentation 63
Turkey Box PlotTurkey Box Plot
[Cook 1999]
© 2001-2005 Franz J. Kurfess Knowledge Presentation 64
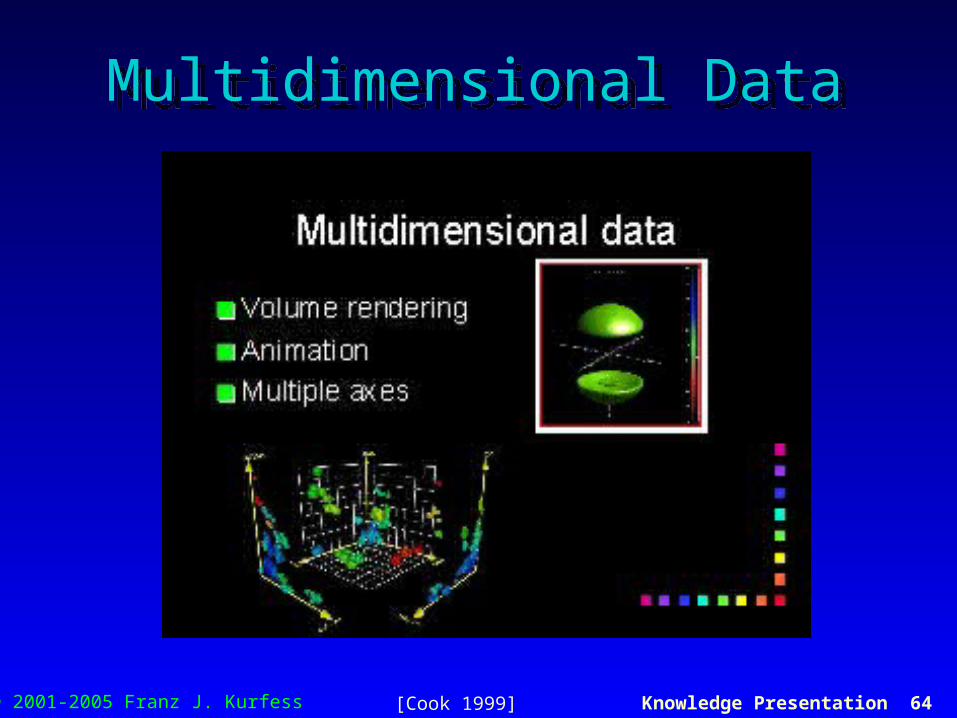
Multidimensional DataMultidimensional Data
[Cook 1999]

© 2001-2005 Franz J. Kurfess Knowledge Presentation 65
DBMinerDBMiner
[Cook 1999]

© 2001-2005 Franz J. Kurfess Knowledge Presentation 66
DBMiner 2DBMiner 2
[Cook 1999]

© 2001-2005 Franz J. Kurfess Knowledge Presentation 67
Daisy ChartDaisy Chart
[Cook 1999]

© 2001-2005 Franz J. Kurfess Knowledge Presentation 68
ClementineClementine
[Cook 1999]

© 2001-2005 Franz J. Kurfess Knowledge Presentation 69
Decision Tree Visualization 1Decision Tree Visualization 1
[Cook 1999]

© 2001-2005 Franz J. Kurfess Knowledge Presentation 70
Decision Tree Visualization 2Decision Tree Visualization 2
[Cook 1999]

© 2001-2005 Franz J. Kurfess Knowledge Presentation 71
Decision Tree Visualization 3Decision Tree Visualization 3
[Cook 1999]

© 2001-2005 Franz J. Kurfess Knowledge Presentation 72
Scientific VisualizationScientific Visualization
[Cook 1999]

© 2001-2005 Franz J. Kurfess Knowledge Presentation 73
Human EffectivenessHuman Effectiveness
[http://www.idiagram.com/]

© 2001-2005 Franz J. Kurfess Knowledge Presentation 74
Semiotic ModelSemiotic Model
[http://www.idiagram.com/]

© 2001-2005 Franz J. Kurfess Knowledge Presentation 75
Semiotic TriangleSemiotic Triangle
[http://www.idiagram.com/]

© 2001-2005 Franz J. Kurfess Knowledge Presentation 76
Knowledge VisualizationKnowledge Visualization
[Clemens 1998, http://www.idiagram.com/kv_venn.html]

© 2001-2005 Franz J. Kurfess Knowledge Presentation 77
Characteristics of Complex SystemsCharacteristics of Complex Systems
[Clemens 1998, http://www.idiagram.com]

© 2001-2005 Franz J. Kurfess Knowledge Presentation 78
System RepresentationSystem Representation
[Clemens 1998, http://www.idiagram.com]

© 2001-2005 Franz J. Kurfess Knowledge Presentation 79
System DynamicsSystem Dynamics
[Clemens 1998, http://www.idiagram.com]

© 2001-2005 Franz J. Kurfess Knowledge Presentation 80
System HierarchiesSystem Hierarchies
[Clemens 1998, http://www.idiagram.com]

© 2001-2005 Franz J. Kurfess Knowledge Presentation 81
Complex Adaptive Systems ModelComplex Adaptive Systems Model
[Clemens 1998, http://www.idiagram.com]
© 2001-2005 Franz J. Kurfess Knowledge Presentation 82
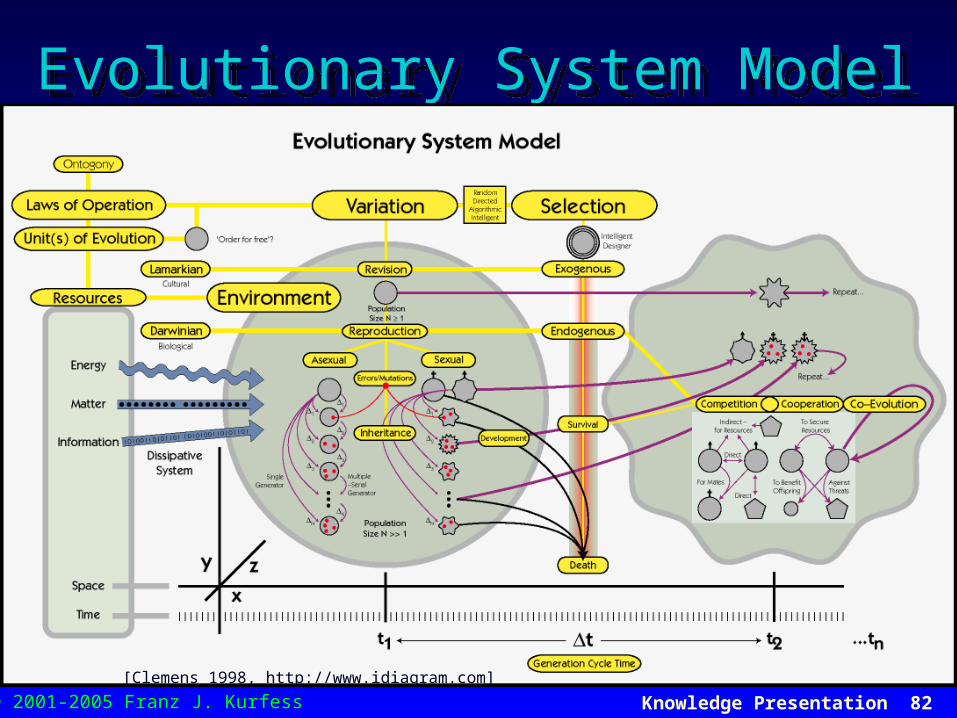
Evolutionary System ModelEvolutionary System Model
[Clemens 1998, http://www.idiagram.com]

© 2001-2005 Franz J. Kurfess Knowledge Presentation 83
Visualizing Complex SystemsVisualizing Complex Systems
[Clemens 1998, http://www.idiagram.com]

© 2001-2005 Franz J. Kurfess Knowledge Presentation 86
Important Concepts and TermsImportant Concepts and Terms visual display cognitive science
knowledge presentation

© 2001-2005 Franz J. Kurfess Knowledge Presentation 87
Summary Knowledge PresentationSummary Knowledge Presentation

© 2001-2005 Franz J. Kurfess Knowledge Presentation 88