shodhganga.inflibnet.ac.inshodhganga.inflibnet.ac.in/bitstream/10603/62530/10/10_chapter 1.p… ·...
82
CHAPTER -1 r\ CONSUMER DURABLE MARKET IN RURAL INDIA AN OVERVIEW
Transcript of shodhganga.inflibnet.ac.inshodhganga.inflibnet.ac.in/bitstream/10603/62530/10/10_chapter 1.p… ·...

CHAPTER -1
r\
CONSUMER DURABLE
MARKET IN RURAL INDIA
AN OVERVIEW

CHAPTER-I
CONSUMER DURABLE MARKET IN RURAL
INDIA: AN OVERVIEW
INTRODUCTION
The study on Indian rural consumer behavior is aimed at helping marketers to
get a better understanding of the Indian market place thus enabling them to embark on
selected strategies to effectively reach the Indian rural consumers. India is a big
country with 28 states, over one billion people and 120 dialects/languages. Three-
fourths of India’s population lives in rural areas, and contribute one-third of the
national income. This rural population is spread all over India.
From the market perspective, people of India comprise different segments of
consumers, based on class, status, and income. An important and recent development
in India’s consumerism is the emergence of the rural market for several basic
consumer goods. India is a lucrative market even though the per capita income is low
and it remains a huge market, even for expensive products. Among the total 164.8
million households in India, 80.7 million households comes under low income group,
followed by 50.4 million lower middle income households, 19.7 million middle
income group, 8.2 million upper middle income group and 5.8 million high income
group.
The behaviour of all consumers is not identical to that of their urban
counterparts. Behaviour is influenced by various factors like their income, social
1

groupings, and place of their origin. For understanding rural consumer counterparts,
enquiries are to be made about the concepts on what is meant by rural, what criteria
are to be considered for rural-urban differentiation, what studies demographic factors
influencing on rural market in India, how the rural consumers are classified, what
studies have been made to indicate rural market potential, what are the rural demand
and buying habits, what is the hierarchy of rural how rural and urban consumer
behaviour can be differentiated and similar issues. A humble attempt has been made
in this chapter to enquire these issues1.
1.1 MEANING OF RURAL
Rural community has some special features. First, as social interactions are
few, individuals cannot remain unknown among the society; second, division of the
labour is minimum; third, range of occupation is very small; fourth homogenous
beliefs at community level and fifth, social class is identified basically on ascribed
and personal attributes. Achieved attributes of individuals are given less prominence.
Most of the people depend on agriculture or agriculture-related activities.
Above criteria are comprehensive in nature, but all of them are not
operationally measurable. Census Authorities of India2 provides an operationally
measurable definition. Census of India3 provides data on rural and urban population in
India. But it is difficult to make an air-tight divide between the two. Rural and urban
worlds are inseparably inter-linked. “Differences between the two are believed to be
reduced due to interchange of people between the two areas through large-scale
migration, influences of urban-centered mass media, greater interdependence of rural•>
and urban economies and other types increased systematic linkage. ” However, the
2

term ‘urban’ is defined as, ‘All places with a municipality, corporation, cantonment,
or a notified town area; and All other places satisfying the following criteria:
1. Minimum Population of 5,000
2. At least 75 per cent of the male working force in non-agricultural pursuits,
3. A density of population of400 per square kilo metre (1,000 per sq. mile).
Where as, dictionary meaning of the term ‘Rural’ is agricultural and pastoral or some
thing opposite to urban. In the context of the study the meaning of the term used by
the social scientists is noteworthy. According to O.F. Larson4, Rural refers
empirically to populations living in areas of low density and to small settlements.
Rural India, during the colonial period, was more or less isolated from the
mainland civilization. The village economy is known for agrarian society. The present
villages are changing fast and no longer exist as self-sufficient republics. In spite of
the criticism against the development attained by the rural societies it must be
admitted that there has been a considerable change in them.
Traditionally, town and cities are the places where the urban population is
inhabited and ‘rural and ‘village’ is synonymously used. The Census of India does not
provide a comprehensive definition for rural areas. It classifies the regions as urban
areas based on an objective classification of the population residing in that area.
Following this, the regions, which do not belong to the urban regions, are classified as
rural areas of the country. The primary economic classification of the population is
divided into workers and non-workers. The workers are subdivided into nine
categories. All other places are considered rural. They are:
3
1. Cultivators
2. Agricultural laborers
3. In mining and quarrying, livestock, forestry, fishing and hunting, plantation,
orchards and allied activities.
4. In household industry
5. In manufacturing other than household Industry
6. In construction
7. In trade and commerce
8. In transport, storage and communication
9. In other services.
1.2 CRITERIA FOR RURAL - URBAN DIFFERENTIATION
Census of India5, inferred that the rural can be understood better by ‘other-
than-those' of urban. Sociologists distinguished rural and urban world through eight
major criteria. They are:
1. Environment
2. Density of population
3. Size of community
4. Occupation
5. Heterogeneity and Homogeneity of the population in racial and psychological traits
6. Social stratification
7. Mobility
8. Interaction system
With the help of these criteria Sorokin and Zimmerman6 have differentiated
the two. Content of their work is tabulated as follows:
4

Tableil.l Criteria for Rural - Urban Differentiation
Criteria Rural World Urban World
Occupation
Totality of cultivators and their families in the community are
usually a few representatives of several non-agricultural pursuits
Totality of people engaged principally in manufacturing mechanical pursuits, trade,
commerce, professions, governing and other non- agricultural occupations
Environment
Predominance of nature over anthropological and social
environment. Direct relationship to nature
Greater isolation from nature. Predominance of man-made
environment over natural
Size of Community
If agriculturism is more, the size of the community will be less
Urbanity and size of community are positively correlated.
Density of population
Density of population in the same country and at the same period is lower in rural area than in urban are. In other words, more is the
density less is the ruraiity.
There is appositive correlation between urbanity of population
Heterogeneity/H omogeneity of
population
Rural community is more homogeneous
More heterogeneous and cosmopolitan communities.
Socialdifferentiation
and stratification
Rural stratification and differentiation is less than urban
stratification
Differentiation and stratification increases with urbanity
Mobility Social mobility less, More emigration from villages to town
Social mobility increases with urbanity
System of Interaction
Less numerous contacts per man. Predominance of personal and
relatively durable relation.
Greater complexity, superficiality, and standardized
formality in relations.
Source: Mithileshwar Jha, “Rural Marketing: Some Conceptual Issues ”, Economic and political Weekly, February 1988.
5

Table: 1.2: India Rural-The Market Size: Distribution of National Population
DistributionPopulation Population in
Persons Males Females percentage
Total 1,027,015,247 531,277,078 495,738,169 100.00
Rural 741,660,293 381,141,184 360,519,109 72.22
Urban 285,354,954 150,135,894 135,219,060 27.78
Source: NCAER, 2001
1.3 ECONOMIC DIMENTIONS OF RURAL WORLD IN INDIA
From economic point of view rural people are less wealthy than urban people.
It is so because of the peculiar nature of rural world rural people suffer from illiteracy,
malnutrition and other health hazards. Major occupations are based on agriculture and
farm activities. Transport and communication systems are inadequate, agricultural
equipments are not easily available. Consequently, per capita income is low. The poor
economic conditions and disposable income in the hands of rural household is small.
During last two decades the differences between the two segments have decreased no
doubt, but the study still helps in pin-pointing the structural differences between rural
and urban7. (Table: 1.3)
6

Table: 1.3
Economic Parameters of Rural and Urban Areas of India
Dimensions Rural Urban
Distribution of total 83.00 % 17.00%income
Distribution of population in GDP:
Population 75.00% 25.00%
GDP 66.60% 33.33%
Average household income
Low 1.8 times of average rural household income
Dominant source of income
Agriculture Salary
Proportion of cultivation and agricultural wage
earnings to total earnings
High (73.20%) Low (6.00%)
Share of income:
Cultivation 61.00% -Salary
- 50.00%
Average household investment
Rs',697.00 Rs. 1722.00
Per capita rural investment in financial
assetsRs.28,00 Rs.213.00
Shares of gross domestic savings Rs.59.00% Rs.40.30%
Source: NCAER, 1980, Household Income and its Disposition New Delhi.
7

1.4 RURAL MARKET
Ten years ago, foreign consumer products were scarce in India and only
available to the affluent section. Import restrictions prevented or severely hindered
foreign consumer goods from entrance to India. With the economic liberalization that
ensued, foreign brands are now prevalent across India. Today, multinational
corporations view emerging markets such as India as prime opportunities for growth.
Rural markets are growing twice as fast as the urban markets. With a rural population
equal to just less than 2.5 times the population of the entire United States as of the
2000 census, the potential consumer base is astounding8.
The success in India's rural markets for multinational corporations has been
mediocre at best. This is an opportunity for the multinational corporations seeking to
enter the rural Indian market and can learn how to do so more wisely.With excess
population of one billion people, India has caught the eye of multinational
corporations across the globe as a place of opportunity for exploring new markets.
While India has portions of their population that would be considered wealthy or
middle class by Western standards, a much greater percentage of India’s population is
still low income. As a result, they spend money, and use products differently than the
countries where most multinational corporations originate. Rural areas, in particular,
exemplify these differences9.
The concept of “Rural Market" is very broad one and it is interpreted in many
ways. In Indian context, the word ‘rural’ is so much associated with agriculture and
farmers that rural marketing tends to be seen as a marketing of inputs or outputs
related to agriculture. As the primary occupation of the rural India is agriculture or its
allied activities10.
8

According to 2001 census11 Almost three fourth of the rural population were
dependent on agriculture and its allied activities for their livelihood. With an average
income equivalent to $42 per month ($504 dollars per year), rural Indians have a very
low disposable income. Most rural homes have minimal storage space and no
refrigeration. Very few people own or have access to refrigeration facility. As a result,
rural Indian purchasing habits tend to be of an "earn today, spend today" mentality.
Rather than buying in bulk, which would mean paying more for a large quantity
upfront, rural Indians tend to buy what they need for short span of time. These factors
result in consumers buying products locally, as well as on a daily basis. In addition to
the fact that income levels are low, rural incomes also vary greatly depending on the
monsoons. When a monsoon hits, this devastates the livelihood of most rural
consumers because they are dependent on agricultural work for income. Corporations
are also directly affected because this makes it difficult to predict demand.
Rural marketing can also be identified by three distinct areas . The rural to
urban transactions deal with a wide range of products, which flow from the rural to
the urban sector. Products like oil seeds, cotton, and sugarcane, etc., and finished
products like handlooms, textiles. The rural to rural transactions limit production and
consumption within the rural area itself. Products like tools, baskets, ropes, etc.,
which are produced by artisans like carpenters, and cobblers who cater to the
professional and household needs of the rural people. The urban to rural flow of
manufactured branded goods namely consumables durables and agricultural inputs
etc. as a domain is the concern of this area. As the rural, population is aspiring to
change their lifestyles, with the increasing disposable incomes, the urban
manufacturing and service sectors have entered the rural scene with their
consumables, durables and services.
9
In a survey conducted in the Management Services Pool Division of the
Hindustan Lever Ltd13, it was observed that agricultural prosperity percolates to the
small farmers and the landless laborers also, the future of any company in the country
lies in rural areas. It has a very large market potential as is evident by the Thomson
Rural Market Index14 of 1972.
The rise in rural income, consumption and expenditure are the indicators for the
changing rural market scenario. It is noticed that the change is in terms of increasing
literacy, awareness to improve living standards and modernization in the attitudes,
outlook and life-styles of the rural folk, both male and female. “The estimates
of consumption and income elasticity available for various types of commodities
reveal that the demand response to a change in income and/or expenditure would be
higher in rural markets than the urban markets.
Indian market offers both enormous opportunities and considerable challenges
to marketing men in India. The opportunities lie in the vastness of the market both in
terms of land and population, increasing levels of income and literacy, rising
consumer aspirations, and favorable marketing conditions, although the complex
social organization and cultural setting and the emergence of assertive consumer
movement with the active support of the government pose great challenge to the
Indian marketers. Nevertheless, the opportunities may be exploited and the challenges
met by developing and understanding of the marketing environment and by
cultivating insights into consumer behavior before making marketing decisions.
10

1.4.1 RURAL MARKETS - IMPORTANCE
Rural India has a population of around 742 million in 200 million households.
Agriculture and allied activities are still the means for livelihood for majority of this
population. Although the institutional reforms and economic development
programmes did not have any significant impact on the green revolution and the rural
sector in many parts of India15. The advent of market oriented farming on commercial
lines with the help of improved and advanced technology and mechanization resulted
in appreciable increase in rural income in these and other regions especially for
middle and large farmers.
It is noticed that the 75 per cent of India’s people live in rural areas, market
size of about 750 million people distributed in 400 districts across 600000 villages.
Though 350 million of these people are desperately poor and survive only at
subsistence level, the remaining 400 million are economically better off due to a
combination of favorable monsoon conditions, increased agricultural yields, and a rise
of mini industries in rural markets. It is also estimated that 200 million people have
enough disposable income to purchase a few modem goods and services such as
TV’s, Refrigerators, and motorbikes. Rural purchasing power is apparent in that rural
India accounts for a sizable percentage of the markets for many consumer goods sold
in India. 20 to 30 per cent markets for colour TV’s and refrigerators16.
11

Table; 1.4: Distribution of Villages in India
Population Number of villages % of Total
Less than 200 114267 18%
200-499 155123 24.30%
500-999 159400 25.00%
1000-1999 125758 19.70%
2000-4999 69135 10.80%
5000-9999 11618 1.80%
10,000 & Above 3064 0.50%
Total: 638365 100%
Source: NCAER
The traditional elements about rural markets are associated with their rural
communities and any breakdown of these relations would be the process of
urbanization. There is no meaningful distinction in rural region, rural family or rural
people. The element in rural societies has to be seen in terms of rural - urban
continuum. A rural urban continuum is visible and makes it difficult to trace where
the village starts and the town ends. Related to these processes are the linkages and
interactions between the rural population and the urban world. The migration of rural
laborers to the urban regions increases the exposure to the urban lifestyles, which also
contributes to the changes in consumption pattern17. Rural market is undergoing a
transformation and is luring Multinational Companies to market their products in this
segment. The key success of any marketer lies in understanding the psyche of the
rural consumer, which is completely different from that of their urban counterparts.
Marketers need to reap the benefits of an untapped rural market increased
12

consumption of durables and non durables, increased income level, low competition,
increased literacy levels, and increased brand awareness. In the urban time, they must
overcome the challenges like lack of proper storage facilities, transport and
communication, infrastructure, proper distribution channels and uneven distribution of
purchasing power18.
Today, rural markets are focused by Indian and MNC’s for various reasons. It
is expected that the current and future potential of the national income comes out from
rural population. The rural markets can be classified on the basis of literacy level,
fragmented income levels, different degrees of penetration and geographic
distance from urban markets. Based on classification market size can be decided and
it is scope for future opportunities and challenges to marketers. Government of India
defines rural as ‘Whatever is not urban are rural'19. The significant changes have been
noticed in the buying and consumption pattern of rural consumers after seventies. It is
due to agricultural revolution, rural development programmes, spread of education,
increasing banking facilities, introduction of electricity and increasing communication
with the urban areas, rural consumers are becoming aware for achieving a new and
better standard of living.
The expenditure on non food items is steadily increasing. These are mill-made
clothing, toilet articles, durable consumer goods like, furniture, sewing machines,
bicycles, two-wheelers. Sale of semi-durables like cutlery, hosieries has increased.
Demand for durables like radios, watches, TVs has increased enormously20.
However, the consumption of luxury goods is still low as compared to urban
areas because of the simple life-style and taste of the rural consumers. It has been
noticed that the consumption of consumer durables and other costly items is more in
13
prosperous agricultural districts and the demand is catching up fast with the urban
71districts .
“Rural Marketing” is a dominant theme emerging over the last few years in
Indian Marketing. The increasing penetration of electronic media and advertising into
rural population is also aspiring for better lifestyles, especially with the increasing
disposable incomes accruing to a significant section of them.
The Indian and Multinational Consumer Durable and FMCG Companies
identified the vast potential of the rural markets and attempted to target these markets.
Although the practical constraints in terms of lack of transportation and
communication facilities along with limited rural understanding acted as constraints in
comprehending the rural scenario. Initially the doors to the rural markets remained
closed and it is difficult to understand the strategies of the rural buyers. Today due to
the improved facilities of transportation and infrastructure competitors are
concentrating on rural markets.
1.4.2 INDEX FOR RURAL MARKET POTENTIAL
Consumers purchasing capacity in a locality depends on their earning abilities
and such abilities in turn depend on various indicators of the locality. These indicators
are: Occupational pattern, agriculture related data, agricultural input data, rural
electrification data and commercial bank data. Better are the indicators, brighter are
the selling potential in the locality. That is why Hindustan Thompson Associates
Limited has developed “Thompson Rural Market Index” with the object of providing
guidance to the marketing people.15 In 1972 the company attempted first factors have
been considered and weights are assigned to each of such factors. The results have not
found satisfactory. Later in 1986, twenty-six factors have been considered for
14
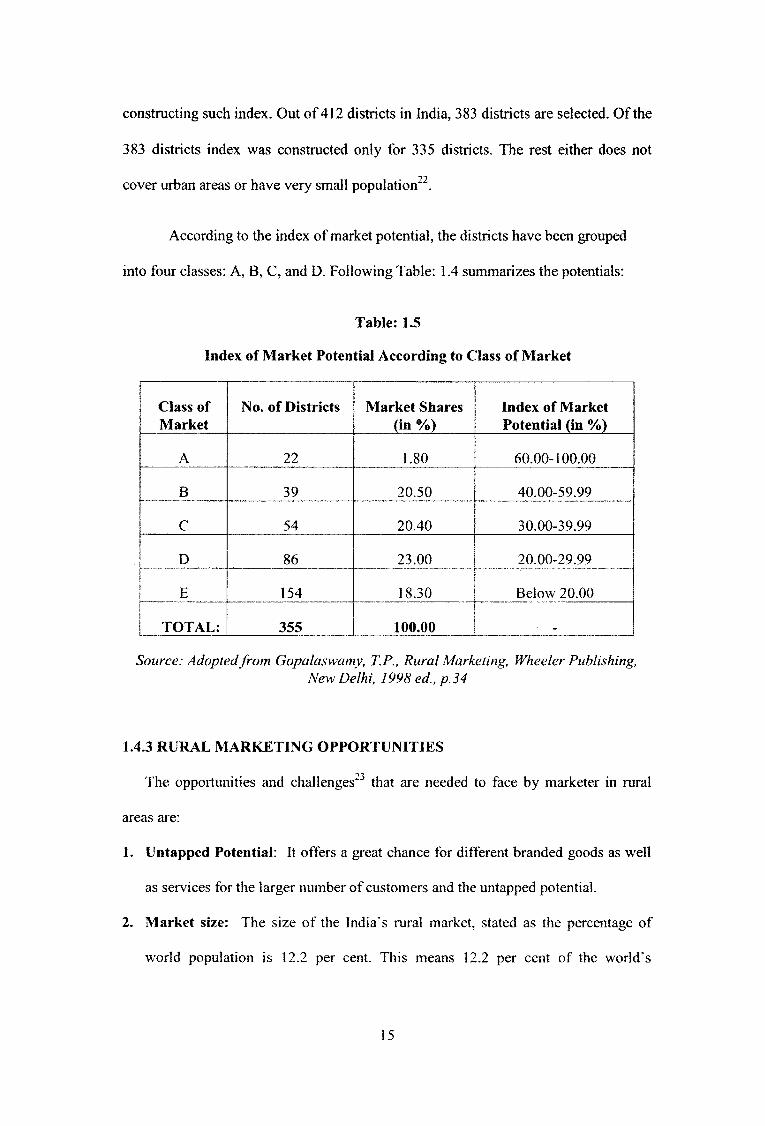
constructing such index. Out of 412 districts in India, 383 districts are selected. Of the
383 districts index was constructed only for 335 districts. The rest either does not
cover urban areas or have very small population22.
According to the index of market potential, the districts have been grouped
into four classes: A, B, C, and D. Following Table: 1.4 summarizes the potentials:
Table: 1.5
Index of Market Potential According to Class of Market
Class of Market
No. of Districts Market Shares (in %)
Index of Market Potential (in %)
A 22 1.80 60.00-100.00
B 39 20.50 40.00-59.99
C 54 20.40 30.00-39.99
D 86 23.00 20.00-29.99
E 154 18.30 Below 20.00
TOTAL: 355 100.00 _
Source: Adopted from Gopalaswamy, T.P., Rural Marketing, Wheeler Publishing,New Delhi, 1998 ed., p.34
1.4.3 RURAL MARKETING OPPORTUNITIES
The opportunities and challenges23 that are needed to face by marketer in rural
areas are:
1. Untapped Potential: It offers a great chance for different branded goods as well
as services for the larger number of customers and the untapped potential.
2. Market size: The size of the India's rural market, stated as the percentage of
world population is 12.2 per cent. This means 12.2 per cent of the world's
15

consumers live in rural India. In India, rural household’s from about 72 per cent of
the total households and this constitutes a huge market by any standard.
3. Current - Growth in Consumption: The purchase and consumption of certain
durables and non-durables by consumes in rural areas is more than that in urban
areas. Some of the products for which the demand is more in rural areas are
wristwatches, bicycles, radios. Etc. It is estimated that for durables the annual
growth has been at a rate of 25 per cent, which is outstanding by any standards.
> According to the National Sample Survey 2000, India22 has witnessed
growth in purchasing power as a consequence of rising rural prosperity. It
is reflected in terms of rising consumption levels of rural masses. The All-
India average per capita household expenditure is Rs.382.
4. Increasing Income: Different programmes undertaken by the government has
helped to improve the economic situation of the rural areas. The increase in
income is seen in both absolute values as well as on the increase in average
number of days of occupation in a year.
5. Accessibility of Markets: Though the road network has not developed to the best
possible extent, a fair amount of development has been made in many regions,
making these regions accessible from the urban region and making it easier for
supplying products to these regions.
6. Competition in Urban Areas: The urban market is getting saturated and thus, is
unable to provide the much needed market to many companies and in search of
greener pastures, many of these companies are now targeting the rural market.
7. Changing Consumer Behaviour: The literacy rate in the villages has increased
considerably, bringing about a shift in the preferences of the people. This change
16

in preference and buying behaviour of the people has led many companies to tap
this new breed of customers.
8. Rising Rural Prosperity: The production index of consumer durables continued
to display impressive year on year growth in April 2004. During the month, index
was up by 17.7 per cent as compared with a negligible 0.4 per cent growth in
April 2003. This impressive production growth of consumer durables in recent
times, has been due to increased demand from rural sector on account of higher
growth in income (Table: 1.5)
Table: 1.6: Rising Rural Prosperity
Income Groups 1994-95 2000-01 2006-07
Above Rs. 1,00000 1.6 3.8 5.6
Rs.77,001 -1,00,000 2.7 4.7 5.8
Rs.50,000-77,000 8.3 13 22.4
Rs.25,000-50,000 2.6 41.1 44.6
25,000-and below 61.4 37.4 20.2
Source: NCEAR, Business world, October 11, 1999 p.28
From the table India is now seeing a dramatic shift towards prosperity in rural
households. The lowest income class (Rs.25, 000 and below) will shrink from more
than 60 per cent in 1994-95 to 20 per cent in 2006-07. The higher income class will be
more than double. The developmental activities were undertaken during 5 year plans
and other special programs such as land reforms, rural electrification, rural
communication network, and rural credit facilities etc.
17

9. Life Cycle Changes:
Many products have achieved near maturity in the urban market, while in rural
markets, they are still the growth phase. The reason for the variations in product
lifecycle stages may be attributed to the different rates of adoption - diffusion process
in urban and rural markets. Popular consumer durable brands in urban areas have
reached maturity stage while in rural markets yet to grow.
1.5.1 CONSUMER BEHAVIOUR
There are two types of resources in nature, namely, human resources, and
physical resource, of the two, the human resources is active. This active resource
(human resource) exploits all the material resources for it survival. For this survival,
there are three fundamental components, viz. Food, clothing and shelter. The urge for
these three components arises in human mind. This urge is the mother of all human
effort. Behaviour gives an answer to “how human beings act as they do”? In the
marketing context, this explanation may be an answer to “why people, behave as they
do as buyers”24.
Consumer behaviour is a subsection of the large fields of human behaviour. It
is the process whereby individuals decide whether, what, when, where how and from
whom to purchase goods and services”25
The comprehensive idea about consumer behaviour as “The act of individuals
directly involved in obtaining and using economic goods and services, including the
decision processes that precede and determine these acts”.26
18

Consumer behaviour involves the purchasing and other consumption related
activities of people in the exchange process. The human mind gets expression through
body and thus consumer behaviour relates to the inner man, i.e. this covert behaviour.
1.5.2 STUDY OF CONSUMER BEHAVIOUR - ITS SIGNIFICANCE
The study of consumer behaviour has assumed growing importance under the
present customer oriented marketing system. Consumer behaviour is a dynamic
concept. Hence, study of consumer behaviour is important for marketers in response
to the question. “How do consumers buy and how will this change, if the marketing
■ynprogram is changed”?
The study of consumer behaviour is useful in the development of more
efficient use of marketing resources and in arriving at solutions to the problems of
marketing management. Now-a-days, greater attention is being paid to consumer
protection. The knowledge and understanding of consumer behaviour can lead to both
consumer protection efforts and to better understanding of consumer behaviour can
lead to both consumer protection efforts and to better understanding of the impact
these efforts have on consumers. An important reason for studying consumer
behaviour is the need for evaluation of consumer groups with unsatisfied needs or
desires28.
The success of any business enterprise depends not only on the ability to
recognize unmet needs, but also to understand whether those needs will be expressed
as economically feasible markets and what organizational response is required for
success in catering to those needs.
19
The study of consumer behaviour is essential for the development of market
strategies and to segment the markets. Individuals significantly vary in terms of
income, occupations, education, ages, tastes, attitudes, interest, residence and so forth.
It would not be possible for the marketer to design an appropriate marketing mix to
appeal and influence all the customers. One of the major contributions of consumer
behaviour to marketers is the identification of meaningful variables upon which to
segment markets29.
The marketing concept envisages a proper and adequate understanding of the
buyer and his behaviour. The buyer behaviour is the one which manifested overtly in
the consumption of a product. A prudent marketer is supposed to learn more what a
buyer is than who the buyer is. The critical understanding of the buyer with this
information should become the essential ingredients of a marketing policy decision.
For the success of business, all the marketing plans and policies should be customer-
oriented. Knowledge of consumer behaviour is, therefore, important for effective
product planning and for efficient execution of a firm's advertising and sales
promotion policies30.
It has been said that change is the life blood of all the marketing activities. The
marketer studies the change continuously and adapts to the change. Further, tries to
create change at the root of all this change is human mind. The marketing concept is a
bye-product of the study of ever changing human mind consistent with the
contemporary marketing thought; consumers are the focal point of all the marketing
activities.
Marketing starts with consumers and ends with consumers. Satisfaction of the
consumer is the ultimate aim of any business activity”.31
20

Behaviour is a mirror in which everyone shows his or her image. Behaviour is
the process of responding to stimuli. Consumer behaviour is to do with the activities
of individuals in obtaining and using the goods and services; it encompasses the
decision making process that precedes and determines purchases. “It is the process
where by individuals decide, whether what, when, where, how and from whom to
purchase goods and services”. Consumer behaviour is all the psychological, social
and physical behaviour of potential customers as they become aware of, evaluate,
purchase, consumer and tell others about the products or services . The consumer is
the focus of marketing efforts. The modem marketing concept spells out the real
significance of buyer behaviour. In the course of operating the concept, the modem
marketing management tries to solve the basic problems of consumers in the area of
consumption.
For Defining of such problems; there is a need for constant effort to
understand the buying process and all the factors influencing consumer behaviour.
Further, consumer’s behaviour is dynamic. The dynamic nature of consumer makes it
more important making the marketing manager to study, analyze and interpret the
ever changing consumer behaviour. It helps in making sound decision in respect of
the Four P’s of the marketing mix.
The study of consumer behaviour has become more complicated in the light of
increasing role of government in consumer movement in all the developing countries.
Comprehending consumer needs, expectations and aspirations coupled with problems
is a must to exploit marketing opportunities and meeting the challenges best along
with the opportunities. Consumer behaviour comprises of individuals in obtaining and
using goods and services. Knowledge of the factors that influence consumer
21
behaviour can help organizations predict how consumers will respond to their
products. Behaviour is determined by both socio-cultural and psychological factors.
Culture encompasses the values, arts, customs, and skills of people in a given
society cultural trends reflect the social values of the population and as much have
important implications for market segmentation, product development, advertising,
and other aspects of marketing strategy. Social-class categories can be identified by
income, education level and occupation. Social class and purchasing patterns are
indicators for marketers in strategy planning.
The family has considerable impact on the formation of values and attitudes
that influence purchasing patterns. Many people favor the same products as their
parents do. Purchase decision tends to be influenced by the family members who use
the product most. The relative influence of husbands and wives in purchasing
decisions varies according to product class and buying stage33.
Reference groups play an important role in purchasing patterns by providing
the individual with a sense of identity. Consumers are more likely to buy a product if
it is used by someone they share common interest with or by someone they admire or
trust. Consumers also look to opinion leaders to set trends by word-of-mouth
communication. Opinion leadership is usually related to a specific product or interest.
The more conspicuous the product, that the consumer more likely will be influenced
by other people in making the purchase decision.
It is important for marketers to understand the motives that lead consumers to
make purchases. Maslow’s theory of motivation is based on five needs; survival,
safety, belongingness and love, esteem, and self-actualization. Motivational analysis
is a highly speculative field which sometimes probes the symbolic realm of the
22

unconscious34. Perception is the process by which the mind takes in and orders
stimuli.
It is important for the marketers to know the impact of stimulus on consumers
behaviour in perceiving a product in terms of brand images, benefits and risks that
might result from its purchase. Marketers view learning primarily as a stimulus -
response mechanism. The components of the stimulus - response have been
formulated in terms of drive, cue, response, and reinforcement.
Marketers are interested in attitudes because they often precede actions. The
cognitive component of attitude is what the individual thinks about the object; the
affective component is what the individual feels about the object, and the co-native
component is how the individual responds to the object.Marketing success is partly
determined by how well a company is able to understand, predict and influence
consumer attitudes. Depending on how a product is doing, the marketer may want to
confirm existing attitudes, change existing attitudes, or create new attitudes35.
Personality is a reflection of individual differences in behaviour. Trait-factor
theories of personality emphasize the personal characteristics that distinguish
consumers from one another and the external situations that cause consumers to
exhibit predictable behaviour patterns. Generalizations about the effects of personality
on consumer behaviour may be over simplifications, but the field of psychographics
can provide a valuable basis for market segmentation.
1,6.1 RURAL CONSUMER
About three quarters of the Indian population are in the rural areas and with
the growing middle class, especially in the Indian cities; the spill over effect of the
23

growing urban middle class is also felt in the rural areas. The Indian rural market has
been growing at 3-4% per annum, adding more than 1 million new consumers every
year and now accounts for close to 50% of the volume consumption of fast-moving
consumer goods (FMCG) in India.
The market size of the fast moving consumer goods sector is projected to more
than double to US$ 23.25 billion by 2010 from the present US$ 11.16 billion. As a
result, it is becoming an important market place for fast moving consumer goods as
well as consumer durables.
Rural market consists of diverse population spread across a vast country,
speaking different languages, with different levels of literacy and composed of big
landlords, traders, small farmers, marginal farmer’s laborers and communities of
different profession. The rural consumer always prefers to live in simple way.
Everyone has his/her own typical standard of living. The rural consumers are less
aware of westernization than urban people. The expectation of self sustaining
economic growth is more important than urban choices. When a rural consumer
intends to buy a product, the product type depends on consumer’s needs, purchasing
capacity, his attitude towards the product and the cost benefit analysis of the product.
Based on this, the manufactures were more focused on price of product and paid less
attention to quality or durability. But the rural consumer has the potential to buy
expensive premium consumer durables like, watches, TVs, mobiles, gas-stove, and
two-wheelers for acquiring social status in a rural society. In rural areas, the decision
making processes is collective. So marketers should address the brand message at
different levels. In this process, the educated rural people act as opinion leaders. Their
decisions matter a lot at the purchasing level.
24

Besides that, some major attitudes of rural consumers are:
• Resistant to change
• Price sensitive
• High brand loyalty
• Influenced by traditions
• Moderate aspirational levels
• Quality conscious
• Low to moderate risk-taking ability
“Trust” is a major factor in rural marketing, which is nothing but a mechanism to
solidify the belief in the product. Once the marketer creates a positive attitude of the
brand/service, then it is very difficult to divert the rural consumers. They not only
seek comfort in their brand but also from the person who is selling them the brand.
The person may be the primary source (the company), the secondary source (the
wholesaler) or the territory source (the retailer). This is applicable for all the brands,
products, services, etc. The seasonal fluctuation also affects the behavior of the rural
consumer up to some extent. But the growing literacy rate and the high penetration of
conventional media changed the perception and attitude of the rural consumer. At the
same time, the consumption habits of rural consumers are also becoming more
modem in an urban sense36.
1.6.2 CHARACTERISTICS OF RURAL CONSUMER BEHAVIOUR
The rural consumers are noted for the high degree of value orientation. Such
orientation to value has labeled Indians as one of the most discerning consumers in
the world. Even, luxury brands have to design a unique pricing strategy in order to get
a foothold in the Indian market.
25

Rural consumers have a high degree of family orientation. This orientation in
fact, extends to the extended family and friends as well. Brands with identities that
support family values tend to be popular and accepted easily in the rural market.
Rural consumers are also associated with values of nurturing, care and
affection. These values are far more dominant than values of ambition and
achievement. Product which communicate feelings and emotions gel with the rural
consumers.
Apart from psychology and economics, the role of history and tradition in
shaping the Indian consumer behavior is quite unique. Perhaps, only in India, one
sees traditional products along side modem products. For example, hair oils and tooth
powder existing with shampoos and toothpaste.
1.6.3 INCREASING AWARENESS OF INDIAN CONSUMER
Over the years, as a result of the increasing literacy in the country, exposure to
the west, satellite television, foreign magazines and newspapers, there is a significant
increase of consumer awareness among the Indians. Today more and more consumers
are selective on the quality of the products/services.
This awareness has made the Indian consumers seek more and more reliable
sources for purchases such as organized retail chains that have a corporate
background and where the accountability is more pronounced. The consumer also
seeks to purchase from a place where his/her feedback is more valued.
Indian consumers are now more aware and discerning, and are knowledgeable
about technology, products and the market and are beginning to demand benefits
beyond just availability of a range of products that came from ‘trusted' manufacturers.
The Indian consumers are price sensitive and prefer to buy value for money products.
26

1.6.4 CHANGING CONSUMER BEHAVIOUR
The study of consumer behaviour is an attempt to understand and predict
human actions in the buying role. It has assumed growing importance under market-
orientated or customer oriented marketing planning and management. Buyers market
for many products and the growth of consumerism and consumer legislation since
1960 have created special interest in buyer behaviour and the formulation of
marketing mixes to respond favorably buyer behaviour in the market place. Buyer
behaviour is defined as “all psychological, social and physical behaviour” of potential
customers as they become aware of, evaluate purchase, consumer, and tell others
about products and services.
Consumer behaviour is not only the study of what people consume but also
“where”, “How often”, and “under what conditions”, the product is consumed. In
view of the dynamic and complex nature of the consumer behaviour many social
scientists of different disciplines have attempted to formulate theories drawn from
peculiarities of their fields. They viewed the consumer behaviour and explained from
different angles. Each observer seemed to view the behaviour, while there is some
justification in all, by itself none is a totally adequate explanation of behaviour.
Decision process approach in understanding consumer behaviour provides that
purchase is an ultimate activity in a course of action taken by the consumer. To
understand that stage, it is necessary to understand what precedes and what follows
that state37.The literacy rates in the villages have increased considerably, bringing
about a shift in the preferences of the people. This change in preference and buying
behaviour of the people has led many companies to tap the new breed of customers.
27

From an overall market size point of view, rural markets look very attractive.
The rural market offers its own set of problems, which include a scant density of
target population, posing a challenge for continuous and effective physical
distribution. The set of intermediaries in rural markets are different from urban
intermediaries, posing challenges of channel management.
Promotion and marketing communications in rural market also poses another
uphill task as target consumers are illiterate and there is hardly any conventional
media available for communication. Problems of physical distribution and channel
management have adverse impact on the quality of services and cost of serving
customers in the markets. The market network has a large set of multipurpose tail
outlets and a large chunk of primary consumers. Marketers need to develop a
distribution structure by developing stock points in feeder towns and serving the small
retailers in village markets. The marketer does not have control over delivery and
-*o
quality of services at the retailer point" .
Companies with relatively fewer resources can come together through
syndicated distribution through co-partnering with non-competitive marketers for the
same market. Companies follow a strategy called “eo-opetition”, in which they come
together to synergize their resources in rural markets for benefit of both the partners
and yet, can compete in the urban markets for market share.
Rural marketing also involves more intensive personal selling compared to
urban marketing. Unavailability of persuasive media and poor level of literacy
demands personal selling to convince consumers to buy a product in the market.
There is need to understand the consumer behaviour and “reason why" of Indian
market and then, design marketing programs in which they need to associate the brand
28

with the life style of rural people. Marketers should try to understand the media habits
of people and use rural folk media for communication39.
They need to be addressed in their own language, by their own hero, and
associate the brand with myriad rituals, celebrations, festivals, melas, and other
activities for enhancing brand’s market presence. Thus, looking at the challenges and
the opportunities that rural markets offer to the marketers, it can be said that the future
is very promising for those who can understand the dynamics of rural markets and
exploit them to their best advantage.
1.6.5 CHANGING RURAL CONSUMER
The increasing disposable income and the per capita consumption of rural
consumer improving their standard of living. Rural consumers prefer to buy the
products with hygienic and reasonably high quality products and simultaneously get
rid of the spurious and sub-standard products being supplied to them. They deserve
quality products, correct information about the product and a door step delivery40.
The rural consumer from one homogeneous group with similar needs, values
and aspirations has similar kind of expectations. With the increasing spread of rural
income, personal care products are expected to make substantial penetration into the
lower income strata by the normal “Percolation effect”41.
The factors contributing to increasing purchasing capacity of rural consumers
are marketable agricultural surplus, remittances, Government expenditure, and
disposal of industry.
Now, the rural market is undergoing a sea change resulting from the multi
pronged activities undertaken for overall development of villages-agricultural
29
revolution, spread of education, increasing banking facilities, introduction of
electricity and increasing communication with the urban areas, etc. All these have led
to the creation of general awareness for achieving a new and a better standard of
living.
This is an indication that the demand for personal care products will be on the
increase. Significant changes have been noticed in the changing buying and
consumption patterns of the rural consumers, imbibing new ideas, attitudes and way
of life. The National Sample Survey42, 17th round has revealed the increase in demand
for non-food consumer products for household consumption. It has been observed
that the consumption of consumer durables and other costly items are more in
prosperous agricultural districts and the demand is catching up fast with that in the
urban districts.
Prosperity in the rural areas has opened up new opportunities and it is seen
that quite a few business houses are on their way for capitalizing this marketing
opportunity. Rural consumer of today is different from the rural consumer of
yesterday. He is very dynamic. He is an enlightened person with new expectations. He
needs a lot of convincing before buying durable products.
1.6.6 SOCIAL AND BEHAVIORAL INFLUENCES ON THE RURAL
CONSUMER OF INDIA
The rural consumer is influenced by the environment and by his wants and
perceptions. Understanding the social and attitudinal influences on rural consumer
behaviour is important to the marketer, as these serve as a guide to decide on product
offering, pricing, distribution, media and its impact, and message in effect. The
following are some of the rural marketing strategies.
30

Cultural Social Practices and Consumer Behaviour The cultural and social
practices have a major influence on the behaviour of rural consumer. The widely
dispersed villages and limited communication helped preserve traditions in rural
markets. Increasing access to urban areas and information dissemination possibly
reduces the influence of traditions. Till such a time, those cultural influences would
persist. Hence, the marketer has to develop products that suit cultural practices.
Identify a suitable target audience and design media and message that reflect social
behaviour. Design the distribution to reach the places where the consumer
traditionally makes his purchase43.
Influence of Perception: The marketer seeks to modify the behaviour of the rural
consumer needs to first influence perception and attitude. It is here that the marketer
has to be careful in designing the product and message for the rural market. The
decision variables of a product and message are critical to marketing effectiveness in
rural markets as the color, shape and action hold meaning for rural consumers that are
different from those held by urban consumers.
1. Attitude to Quality and Price: The marketer who seeks to modify the behaviour
of the rural consumer needs to first influence perception and attitude. It is here
that the marketer has to be careful in designing the product and message for the
rural market. The decision variables of a product and message are critical to
marketing effectiveness in rural markets as the color, shape and action hold
meaning for rural consumers that are different from those held by urban
consumers.
31

2. Attitude to quality and price: Small-pack sizes get acceptance in markets, which
can have only a small price because of the nature of income receipts. A landless
laborer may get a small amount to spend.
3. Brand Preference and Loyalty: There is a need to have a good understanding of
the purchase behaviour of the consumer in order to adopt right marketing strategy.
The attitude of the rural consumer favors quality products and brands, but
brand pricing has to take into account both the income level and the income flow of
the consumers. The rural consumers are not homogenous. There are consumers that
can afford high priced brands. There is a group of consumers who can not only afford,
but are also willing to buy, high priced brands.
1.5.7 Rural demand and buying habits
Demand depends on need and major portion of need is based on income of the
buyers. Earning of most of the rural buyers are seasonal in nature as they are engaged
in agriculture or agriculture based activities, and agricultural products grow
seasonally44.
Needs of the rural buyers may be broadly classified into two groups:
agricultural inputs and consumer goods. Again both the group of goods may be
classified into non-durable and durable agricultural inputs, while pump sets, power
tillers, tractors etc. are durable agricultural inputs. Foods, cosmetics, clothes,
toothpaste are non-durables, while refrigerators, TV sets, two wheelers, Automobiles,
washing machines are durable consumables.
32

Volume of demands, timing of demands and the prices at which demands are
to be made depend on various factors related to the concerned consumer. Some
important factors are: buyer’s income flow, his need perception, and his level of
education, social connection and similar matters45. Enquires on such issues on rural
buyers are very limited. Hence, comparison between rural and urban buyers in these
respects may throw some light on these issues. Such a comparison is as given below:
1.7: RURAL AND URBAN CONSUMERS’ CHARACTERISTICS
Comparison between the demands of the two types of consumers help in
understanding how the rural consumers differ from the urban consumers. Demands of
rural consumers are applicable to all places irrespective of their country or place of
origin. But behaviour of a consumer is greatly influence by the social and economic
environment in which he lives in. That has been shown in the following (Table: 1.7).
Table: 1.7: Comparison between Rural and Urban Demand Factors
Factors Urban RuralPer capita income High Low
Expenditure pattern Minimum proportion of income is for necessities
Mostly of bare necessities
Literacy level High LowNeed awareness High LowProduct concept Clear idea Unclear idea
Consciousness about product features High Low
Source of information Various media Mostly oral word of mouth
Demand pattern Uniform SeasonalSpread of buyer Concentrated Widely scattered
Physical communication Very good PoorSources of suppliers Adequate InadequateTimeliness of supply Timely UntimelyGuidance on usages Rarely needed Mostly neededAfter sale services Adequate Inadequate
Product as status symbol Mostly yes Mostly noConsumer protection Easily available Rarely available
Source: Gopalswamy, T.P., 1997, Rural Marketing, Wheeler Publications, p. 28.
33

1.7.1 CHANGING TRENDS IN INDIAN CONSUMER BEHAVIOUR
Bulk Purchasing
Urbanization is taking place in India at a dramatic pace and is influencing the
life style and buying behaviour of the consumers. The working urbanites are
depending more on fast and ready-to-serve food, they take less pain in traditional
method of cooking and cleaning.
Bulk purchases from hyper stores seems to be the trend these days with
purchasing becoming more of a once-a-week affair, rather than frequent visits to the
neighbourhood market/store/vendor. The popular growing shopping trend among
urbanities is purchasing from super markets to hyper stores.
Trendy Life Styles
The current urban middle and upper class Indian consumer buying behaviour
to a large extent has western influence. There is an increase in positive attitude
towards western trends. The Indian consumer has become much more open-minded
and experimental in his/her perspective. There is now an exponential growth of
western trend reaching the Indian consumer by way of the media and Indians working
abroad.
Foreign brands vie increasingly with domestic brands for the growing market
in India. Foreign made furniture is well accepted by the Indian consumers.
Malaysian, Chinese, Italian furniture are growing in popularity in India. Indian
consumers have also developed lifestyles which have emerged from changing
attitudes and mind sets; exposure to western influences and a need for self-
34

gratification. Beauty parlours in cities, eateries, designer wear, watches, hi-tech
products are a few instances which reflect these changes.
The sellers’ market is slowly moving towards becoming the buyers’ market.
Since, India’s economic liberalization policies were initiated in 1991, many new
product offerings have entered the Indian market and product variety has also
increased manifold. Import licensing restrictions are being eliminated and tariffs
significantly reduced and this has led to large range of consumer goods made
available in India. Indian consumers have always preferred foreign goods and with the
liberalization, they now have a choice of foreign products vis-a-vis the local products.
1.7.2 PROBLEMS IN REACHING RURAL CONSUMERS
There are several problems in establishing market in rural areas, though they have
potential to grow46. The problems are:
1. Lack of Retail Infrastructure: Around 60,000 of the approximately 0.6 million
villages in India did not have a retail outlet of any kind.
2. Vast unevenly distributed Purchasing Power: Rural India accounts for a
significant share of the total consumption in a number of categories, the
consumption trends to be geographically dispersed because of the sparse
distribution of populations and unevenness of purchasing power.
In fact, 145,098 villages or 23 per cent of the total number of villages in India
have a population less than 200. Another 21 per cent have population between 200
and 500. Thus for a Route Schedule (RS) type distribution system to work, the RS
would have to cover large geographical areas to achieve break-even volumes.
35

Covering large geographical areas, in turn, would raise the inventory and
transportation costs, thus affecting the viability of the RS operations.
3. Difficulty in Logistics Planning: Determining sales potential of an area in rural
India is a challenging task, considering the sparse population distribution, uneven
distribution of purchasing power, and the relative lack of data availability.
4. Seasonal Demand: Agriculture is the primary source of income in rural India.
Agriculture being a seasonal activity, the demand pattern also tends to be
seasonal. The demand is typically high during the peak crop harvesting and
marketing season. The seasonality of demand implies low sales in the lull months,
which again affects the viability of operations of the members of the distribution
channel.
5. Need for large-scale marketing organization and staff: Large geographical
areas with underdeveloped transportation and communication infrastructure call
for more intensive marketing efforts for direct coverage. This, in turn, raises the
cost of servicing these markets.
Growth Rates of Rural - Urban for Consumer Durables: The growth rates
of durable market are higher in rural areas for many products. The durable market
offers an excellent proposition47 (Table: 1.7). The durables are classified as under for
analysis:
Group - I Less than Rs. 1,000 in value. Items like transistors, pressure cookers,
wristwatches and bicycles.
Group - II Rs. 1,001 to Rs. 6,000 in value. Items like black and white TV’s sewing
machines, mixers and cassette recorders.
Group-Ill More than Rs. 6,000 in value. Items like color TV’s, refrigerators, two-
wheelers and washing machines.
36
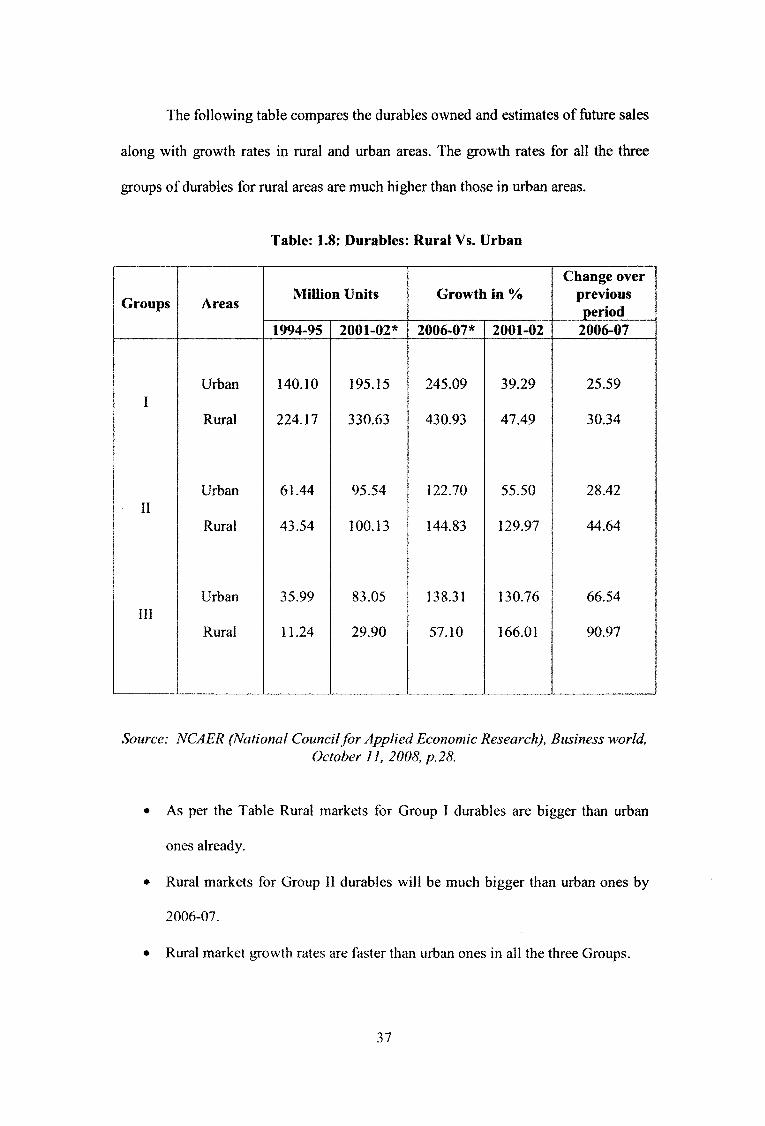
The following table compares the durables owned and estimates of ftiture sales
along with growth rates in rural and urban areas. The growth rates for all the three
groups of durables for rural areas are much higher than those in urban areas.
Table: 1.8: Durables: Rural Vs. Urban
Groups AreasMillion Units Growth in %
Change over previous period
1994-95 2001-02* 2006-07* 2001-02 2006-07
IUrban 140.10 195.15 245.09 39.29 25.59
Rural 224.17 330.63 430.93 47.49 30.34
Urban 61.44 95.54 122.70 55.50 28.42II
Rural 43.54 100.13 144.83 129.97 44.64
Urban 35.99 83.05 138.31 130.76 66.54III
Rural 11.24 29.90 57.10 166.01 90.97
Source: NCAER (National Council for Applied Economic Research), Business world,October 11, 2008, p.28.
• As per the Table Rural markets for Group I durables are bigger than urban
ones already.
• Rural markets for Group II durables will be much bigger than urban ones by
2006-07.
• Rural market growth rates are faster than urban ones in all the three Groups.
37

Based on economic studies that show middle and high income households in
rural India will grow to 111 million in the next five year from 80 million in the
previous year48.
Table: 1.9: The annual size of the Indian rural Market
FMCG Rs. 50,000 cr
Durables Rs. 5,000 cr
Agri-inputs (incl. tractors) Rs. 45,000 cr
Two wheeler Rs. 8,000 cr
Total Rs. 1,08,000 cr
Source: Francis Kanoi, 2002
1.8.1 MARKETING STRATEGIES FOR RURAL CONSUMERS:
Celebrity Influence
This is an important tool which is able to influence Indian consumer buying
behaviour. In India, celebrities are being increasingly used in marketing
communication by marketers to lend personality to their products. With the visual
media becoming more popular the use of celebrities in the TV media has increased.
Celebrities create headlines. Their activities and movements are being closely
watched and imitated. What they endorse sell like hot cakes. It is not surprising
therefore that using celebrities in advertisements has become common practice.
In India especially, it is not difficult to look for the reasons as to why
companies are increasingly using celebrities. Indians always love their heroes and
heroines.
38

Consumers like advertisements more if they are admirers of the celebrities in
the advertisements. When a consumer likes the celebrity in the advertisement, he or
she is more likely to accept what the celebrity says about the advertised product and
therefore will develop more positive feelings toward the advertisement and the brand
itself. Famous celebrities are able to attract attention and retain attention by their mere
presence in the advertisements. In the midst of the advertisement clutter, the
advertisements that celebrities endorse also achieve high recall rates. When people see
their favoured reference group members or celebrities in the advertisements, they pay
more attention to them. Celebrities may also help reposition products. Products with
sagging sales needs some boosting and in these Indian celebrities can help by way of
they endorsing the product concerned.
Quality Oriented Outlets
Indian consumers looking for quality choose expensive brands as they feel that
price is an indicator of quality. However, in the absence of well known brands in
selected product range, consumers are likely to take cues from well established retail
outlets hoping that these outlets carry quality products. Businessmen who prefer not
to go for high-visibility, costly campaigns may embark on the strategy to engage well
known retail outlets to capture the segment of rural consumers looking for quality
products.
Freebies
Indian consumer buying behaviour is influenced by freebies. Freebies are
consumer products given free of charge as gifts to purchases of selected products
above a certain value. TVs, washing machines, refrigerators, and ready made clothes
39
are some of the product categories in which freebies are given to Indian consumers.
Freebies generally comprise tooth paste, soaps, detergent, cooking oil etc.
Indian companies intending to penetrate the Indian market, perhaps should
consider giving freebies for the purchases made by the Indian consumers. Malaysians
can work with the local business partners to attract the consumers by way of such
promotion campaigns.
Eco-friendly Products
The environmental awareness in India has started affecting marketing of
products based upon their eco-friendliness. In general, Indian consumers are likely to
buy environmentally responsible products and packs. The future key for marketing
could be to select more ethical and ecological responsible products and packaging,
which is also convenient for consumers, thus, balancing environmental concerns with
commercial considerations. Consumers in India are taking lead in prompting
manufacturers to adopt technologies to produce eco-friendly products.
40

1.10.1CONSUMER DURABLE INDUSTRY
The study of Consumer Durable market will be helpful in understanding the
key aspects of the consumer behaviour with respect to consumer durables in rural
areas. To take a deep insight of consumer behaviour with regard to consumer
durables, the study has been taken up to know the status of durable market in recent
times.
Indian economy is one of the fastest growing economy in the world with the
GDP rate of 9.2 per cent (177000 crore) which is fourth largest in the world. In terms
of foreign exchange, India stands at 12th largest economy with foreign reserve of USD
177.00 billion 49. During post liberalization Indian government encouraging industries
like consumer electronics, automobile, textiles, transportation etc. For a long period
rural markets were not concentrated either by government or organization. Rural
markets were most unexplored markets of the country50.
In India, 70 per cent of the population lives in villages. As the urban market is
reaching to saturation, rural market is giving wide scope for durables, as rural
people’s purchasing power parity is increasing substantially. Their penetration level is
at two percent to 0.5 per cent for durables. The rural market is growing faster than the
urban market. Where as urban market has more of product replacement market.
However, rural market is still unexplored for consumer durables51.
The pre liberalization era saw foreign direct investment being discouraged
with the enactment of FERA in 1974. The Act proved to be a major obstacle to the
growth of the durable industry. As a result, the economies of the scale could not be
achieved through the mass production.S.K.U.L IBRARYAcc.Gall.No

by any foreign company in Indian companies. It is regulated only up to 40 per cent
equity is allowed by FDI in Indian companies. Some other hurdles are like, imports
discouraged by heavy import duties, licensing policies, Government policies, etc.
Before the liberalization in Indian economy only a few companies like
Kelvinator, Godrej, Allwyn, and Voltas were the major players, accounting for not
less than 90 per cent of the market. Post liberalization is the period for foreign players
like LG, Sony, Samsung, Daewoo, and Aiwa to enter in Indian market. Today these
players are holding major market share. Durable market is one of the fastest growing
sectors in the country. It is due to the rise in living standards, easy access to consumer
finance and wide range of choice and increased number of foreign players. Durables
like watches, TVs, mobile phones, refrigerators, washing machines and air coolers,
gas-stove and two-wheelers are no longer considered luxury items. Exchange offers,
discounts, and intense competition are also increasing the growth of consumer durable
market in India. The Indian market is prospecting for durables due to increase in
income levels.
42

Consumer durables
Table: 1.10: Growth of Consumer Durables in 2006-08
Consumer Durables Growth
Air Conditioner 20-25%
Refrigerator 5-10%
Microwave Ovens 25%
Washing Machines 5-10%
Color Televisions (CTVs) 15-20%
Black & White Televisions -20%
Clock 10%
Watch 10%
VCDs 30%
Consumer Electronics (Overall) 9%
Source: FICCI, October 2008
The consumer durables market in India is valued at US $ 4.5 billions
currently. In 2006, durables which have always seen poor growth have seen
reasonable growth in 2006. More and more Indians are now buying electrical
appliances due to change in electricity scenario. The penetration level of color
televisions (CTVs) is expected to increase 3 times by 2007. ( With easy availability of
finance, emergence of double-income families, fall in prices due to increased
competition, government support, growth of media, availability of disposable
incomes, improvements in technology, reduction in customs duty, rise in
temperatures, growth in consumer base of rural sector, the consumer durables industry
43
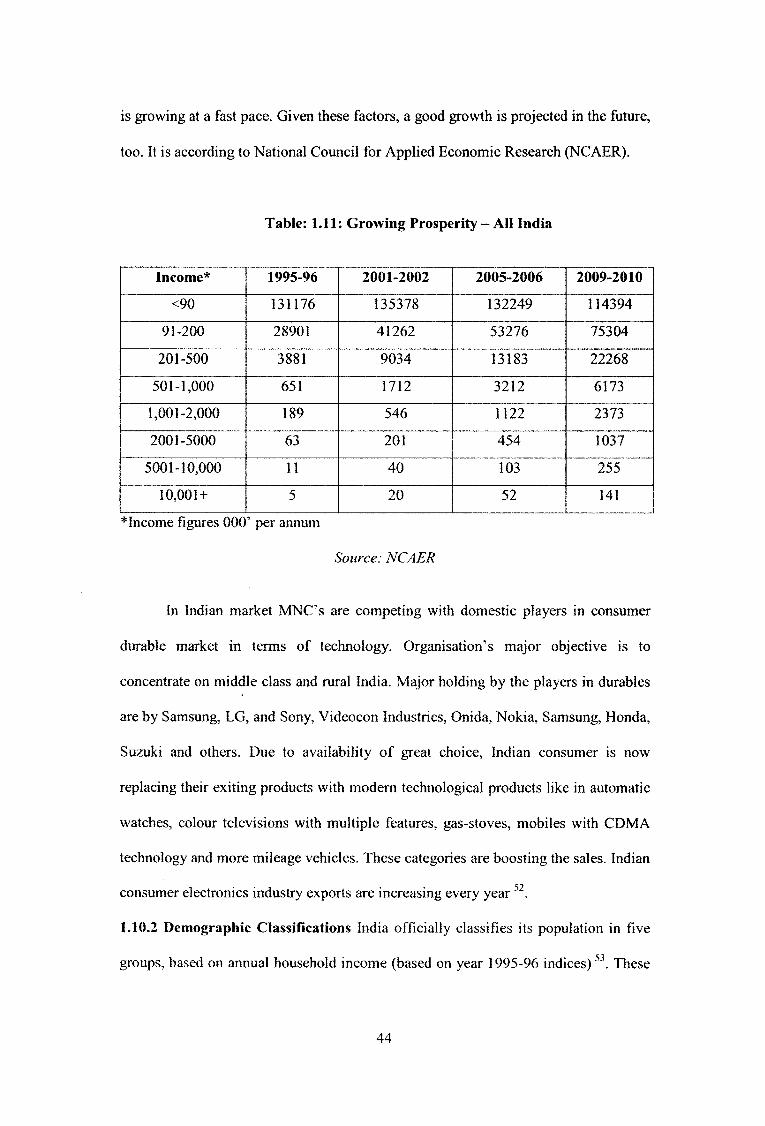
is growing at a fast pace. Given these factors, a good growth is projected in the future,
too. It is according to National Council for Applied Economic Research (NCAER).
Table: 1.11: Growing Prosperity - AH India
Income* 1995-96 2001-2002 2005-2006 2009-2010
<90 131176 135378 132249 114394
91-200 28901 41262 53276 75304
201-500 3881 9034 13183 22268
501-1,000 651 1712 3212 6173
1,001-2,000 189 546 1122 2373
2001-5000 63 201 454 1037
5001-10,000 11 40 103 255
10,001+ 5 20 52 141
* Income figures 000’ per annum
Source: NCAER
In Indian market MNC’s are competing with domestic players in consumer
durable market in terms of technology. Organisation’s major objective is to
concentrate on middle class and rural India. Major holding by the players in durables
are by Samsung, LG, and Sony, Videocon Industries, Onida, Nokia, Samsung, Honda,
Suzuki and others. Due to availability of great choice, Indian consumer is now
replacing their exiting products with modem technological products like in automatic
watches, colour televisions with multiple features, gas-stoves, mobiles with CDMA
technology and more mileage vehicles. These categories are boosting the sales. Indian
consumer electronics industry exports are increasing every year 52.
1.10.2 Demographic Classifications India officially classifies its population in five
groups, based on annual household income (based on year 1995-96 indices)53. These
44

groups are: Lower Income; three subgroups of Middle Income; and Higher Income.
However, the rupee income classifications by themselves do not present a realistic
picture of market potential for a foreign business enterprise, because of significant
differences in purchase power from the parities of various groups. In fact, the Indian
rupee has a very high purchase power parity compared to its international exchange
value. For instance, value for the money, the domestic purchasing power of a rural
consumer is low, where as the consumption for equivalent needs and services. As a
result, India ranks fifth in the world, on purchase power parity terms, despite having
low per capita national income (US$ 340 per capita).
1.10.3Consumer Classes
Even discounting the purchase power parity factor, income classifications do not
serve as an effective indicator of ownership and consumption trends in the economy.
NCAER, has released an alternative classification system based on consumption
indicators, which is more relevant for ascertaining consumption patterns of various
classes of goods in rural markets.
There are five classes of consumer households, ranging from the destitute to the
highly affluent, which differ considerably in their consumption behavior and
ownership patterns across various categories of goods. These classes exist in urban as
well as rural households both, and consumption trends may differ significantly
between similar income households in urban and rural areas.
45

Table: 1.12: Structure of the Indian Consumer Market
(in millions of households)
Consumer Classes (Annual income Rs) 1996 2001 2007 Change
The rich (Rs.215, 000 and more)1 1.2 2 6.2 416%
The Consuming Class (Rs. 45-215,000) 32.5 54.6 90.9 179%
The Climbers (Rs. 22-45, 000) 54.1 71.6 74.1 37%
The Aspirants (Rs. 16-22, 000) 44 28.1 15.3 -65%
The Destitute (below Rs. 16,000) 33.2 3.4 12.8 -61%
Total: 164.8 180.7 199.2 21%
Source: NCAER
The target market segments considered for aspiration and lifestyle goods
are the 35 million homes representing the consuming classes and the rich, or some
150 million people. It is about 80 million households that comprise the upper aspiring
to lower consuming that so excited the global market when they decided to enter the
Indian market in the early 1990's 54.
It was not until 1992, when the Indian market first began to open up post
liberalization, that the MNCs started taking a closer look at the purchasing power of
the country’s middle class. Inevitably, the first thing they saw was the massive
volume of potential market, rather than its cultural idiosyncrasies.
Though money was short, they make this purchase eyeing future savings on
domestic help wages. Infrastructure in India has an inherent variability in areas such
as water shortages, power cuts, fluctuations in load and voltage that influence product
choices and purchase decisions 55. Due to several infrastructural and social conditions
differentiate rural urban spending habits. Priorities will change according to their
income and need base.
46

Table: 1.13: Urban-Rural divide in Spending (%)
Category | Rural Urban
Entertainment ............r 33......1 ...... 67.....
Consumer Services j 44 j... . 56....
Durables 50 50
Consumer goods ........... |........57....... .........43....
Clothing and Footwear ............[...... 61 ...... ] '.... ....39....
Food ... T.....64.. ... ] ....“"36”
Source: KPMG/Research
Market growth rate has been noticed in terms of quality. It has been noticed
that consumers become quality conscious. Improved quality has become an essential
factor for every industry to attract new consumer and to retain existing consumer.
Prices are falling down over the years it is because of the entry of major
players, aggressive marketing strategies and declining import tariffs. As a result,
production in organized sector is increasing and availability of branded products are
increasing due to the lowering of import duties and liberalization of other measures.
Unorganized sector share is coming down drastically to only 8 to 10 per cent from 40
to 50 per cent. Due to the entry of MNC’s and other major Indian players the price
differences between branded and unbranded products becomes much narrowed.
Further, branded players are providing better before and after sales service 56
Consumer durable industry is dominated by MNCs and domestic players.
MNCs are dominating market with their superior technology and quality of the
products. Domestic players compete with MNCs with well-acknowledge brands,
47

extensive distribution network by understanding local market conditions. Both the
players are formulating different marketing strategies with differentiating prices.
1.10.4 Opportunities and Potentialities for Future Growth
The growth of GDP, rising purchasing power of people with higher propensity
to consume with preference for sophisticated brands would provide constant impetus
to growth of white goods industry. Penetration of consumer durables would be deeper
in rural India due to the promotional strategies by the organizations. Organizations are
providing better schemes for rural poor in terms of financial assistance and incentive
schemes to attract towards white goods industry 57.
Consumer durable industry is facing lower growth due to the saturation in the
urban markets. This leads wide scope for rural markets. Rural consumers can be
attracted by providing easy payable consumer finance schemes and basic services,
after sales service to suit the infrastructure and existing amenities. Generally, rural
consumers buy durables form nearest towns.
1.11.1 INDUSTRY SIZE, GROWTH, AND TRENDS
The consumer market in India is around US$ 4.5 billion in 2008.-09. More
than 7 million units of consumer durable appliances were sold in 2008-09 with colour
televisions (CTV) forming the bulk of the sales with 30 per cent share of volumes.
CTV, Watches and Gas stoves together constitute more than 60 per cent of the
sales in terms of the number of units sold. Since the penetration in the urban areas for
these products is already quite high, the markets for both CTVs and refrigerators are
shifting to the semi-urban and rural areas 5X.
48
1.11.2 Reasons for Industry Growth
a. Increased income levels: In rural India. 70 per cent of the rural households
are offering plenty of scope and opportunities for white goods industry. In
consumer durable industry including TV is growing 25 per cent annually.
Apart from steady growth in income levels Attractive schemes and financial
assistance by the organizations and banks are encouraging rural consumers to
change their life style. In this context, consumer financing facility has become
the major driving force in the consumer durable industry. In the case of more
expensive items like, TVs and two wheelers retailers are marketing their goods
more aggressively by providing easy financing options to the consumers by
partnering with banks.
b. The facility is being introduced with an aim to tap the lower and middle
income group of consumers. Even higher income group of consumers are
being attracted by an opportunity.
c. The advanced technology and increasing competition by domestic and
multinational companies are narrowing the price gap between products in
consumer durable industry, which has driven demand and enabled high
growth. Products that were once beyond the reach of the middle class Indian
are now affordable to rural consumers also. Growth in demand and sales for
products , once considered luxuries, such as mobiles, two wheelers and high
end CTVs, is a reflection of this phenomenon.
d. Due to the advent of technology there are many sources to communicate with
the consumers. The phenomenal growth of media in India and the flurry of
television channels and the rising penetration of cinemas have spread
awareness of products in remote markets also. The root cause for growing
49

demand and preference for new models have added to the consumer durable
industry is because of role played by Media.
e. Rupee Appreciation: Raw material cost constitutes more than 75 per cent of
expenditure incurred by consumer durable manufacturers in India. The rapid
appreciation of rupee vis-a-vis the US dollar in 2007 is expected to ease raw
materials costs for Indian manufacturers and benefit those addressing the
domestic market.
f. Distribution and Service Network As the market spreads out from saturated
urban regions to low penetration rural areas and tier II/III towns, distribution
network and brand recognition will continue to play ever more significant
roles in determining market share and profitability. The market for consumer
durables is moving towards a stage where it could soon be defined “as broad
as it can be reached”.
g. The Central Government plans of making electricity available for all by
2012 will also open up immense opportunities for the consumer durables
segment.
h. Product Technology While the market is continuously expanding, there are
several concerns that will have to be addressed while moving the focus
towards tier III towns and rural areas. Total cost of ownership would be a key
factor that would drive purchase in these regions. From an organized
industry’s perspective, success would be determined by superiority of product
technology, which could provide added benefits to the customer, for example;
low power consumption, low service requirement and low cost of operation.
i. Increasing Share of Organized Retail The urban and rural markets in India
are growing at an annual rate of 7 to 10 per cent and 25 per cent respectively.
50

One of the key enablers of this growth has been the increasing penetration of
organized retail. While there are established distribution networks in both rural
and urban India, the presence of well-known brands and organized sector is
increasing.
j. At present around 96 per cent of the more than 5 million retail premises of all
types in India are smaller than 50 sq mtrs. This situation is, however,
transforming. Shopping malls are becoming increasingly common in Indian
cities, and based on plans announced by key developers, a proliferation of new
malls is expected over the next three years.
Although many of the new malls would be much smaller than their western
counterparts, Indian consumers will have a far larger number of attractive,
comfortable, brand-conscious outlets to shop around. As a result, the organized
retail industry is expected to cover a market share of 15 to 18 per cent by the end
of 2010, from just 3 per cent at present. This will have a positive impact on the
consumer durables industry, as organized retailing would not only streamline the
supply chain, but also facilitate increased demand, especially for high-end and
branded products S9.
51

1.11.3 Trends Favoring Growth of Durable Industry:
The key trends that impact the Indian Consumer Durable Industry are:
Fig. 1.1: Key trends of Indian consumer durable industry
1.11.4 Consumer Electronics
The consumer durable goods sector is all set to witness 12 per cent growth in
2008. The rural market is growing faster than the urban markets, although the
penetration level in rural area is much lower. The rural Indian market60, which
accounts for nearly 70 per cent of the total number of households, witnessed a 25 per
cent annual growth while the urban consumer durables market reflected an annual rate
of 7 to 10 per cent. Many leading companies are now increasing their presence in
rural India. LG has set up 45 area offices and 59 rural and remote-area offices.
Samsung rolled out its 'Dream Home' road show which was to visit 48 small towns in
100 days in an effort to increase brand awareness of its products.
52

Table: 1.14: Sector Financials for Consumer Durables
Sector Financials In Rs
31/03/2004 31/03/2006 31/03/2008
Sales 37,331m 30,100m 43,096m
Sales Growth - -19.4% 43.2%
Gross Profit Margin 10.7% 6.6% 4.3%
Profit After Tax (PAT) 1,019m 940m -1,202m
PAT Growth - -4.3% -209.5%
Market Capitalization 1,787m 2,392m 2,359m
P/E Ratio 7.0 7.6 -7.9
Return on CapitalEmployed (ROCE)
13.9% 23.1% 6.9%
Source: kothari’s Industry directory of India 2008.
Table: 1.15: Growth of Consumer Durables
Consumer Durables Growth
Air Conditioner 20-25%
Refrigerator 5-10%
Microwave Ovens • 25%
Washing Machines 5-10%
Color Televisions (CTVs) 15-20%
Black & White Televisions -20%
Clock 10%
Watch 10%
VCDs 30%
Consumer Electronics (Overall) 9%
Source: kothari's Industry directory of India 2008.
53

Several global players are well established in the consumer durable sector in
India with competition from strong Indian players.
Table: 1.16: Major Players In Consumer Durables Sector
AIWA
Akai India
BenQ Corporation
Blue Star Ltd.
Bose Corporation
BPL
Canon India
Carrier Aircon Ltd.
Daewoo India
Electrolux-Kelvinator
Philips
Whirlpool
Sony
Godrej
Haier India
Hitachi Ltd.
Khaitan India Ltd.
LG Electronics India Ltd.
MIRC Electronics Ltd.
Mitsubishi Electronic
Corporation
Nokia India
Onida
Pace Micro
Panasonic
Philips India
Samsung India
Samtel
Sansui India
Siemens
Sony India
Thomson Ltd.
Titan Industries
Toshiba Corporation
Videocon Industries
Whirlpool Appliances
54

Fig:1.2: Consumer durable industry analysis model
Source: Day, G S, 1990, Market-Driven Strategy: Process for creating Value, Free Press: NY
1.11.5 The Indian Watch Market:
Indian watches market was for long dominated by public sector organizations
like Hindustan Machine Tools Ltd61 (HMT) and Allwyn, which are now left far
behind or nowhere in market by private sector enterprises like Titan, Sonata, Ajanta
and Timex.
Before the entry of HMT, the Indian Market is solely dependent on imports to
meet the internal demand. By the entry of HMT in Wrist watch segment in 1960’s the
scenario has changed. In post liberalization India, the market stood to witness
intensive competition between foreign and Indian manufacturers like Timex, Titan,
Movado, Longines, Rado, Rolex, Frederique Constant, Mont Blanc, Swatch, and
55

many others. Many watch makers have made significant inroads in the industry and
others are in the process of establishing themselves, currently.
Besides this, buyers are extremely choosy about the brand and type of wrist
watches they wear. Being extremely brand conscious, their tastes have evolved over
the years and have gone beyond the realms of durability to choose in terms of
aesthetics and elegance. Thus, it is a buyers market with multitude of designs that
have entered and flooded the market place62.
The size of the watch market currently is estimated to be around 40 to 45
million pieces annually. The organized sector alone contributes up to 30 percent of
this figure, and the rest of the demand is being met by the unorganised grey sector.
This data is significant indeed in view of the socio economic distribution of the Indian
populace. More than 58 percent of the population is under twenty five and more than
80 percent of the population is below 45 years of age.
In dollar terms, the estimated annual market size is around USD 195 million,
despite the fact that the penetration of watches is the lowest, compared to global.
Looking into this fact and the long standing Indian tradition of comparing watches
with jewellery and other traditional items, many watch companies are interested in
setting up base in India. The average growth in the size of the market is slated to be
around 10-35 percent per year including rural India.
A study of the watch market reveals that it is segmented on basis of multiple
variables such as price, benefits and types of watches. The price of the watches is a
major motive in the minds of the customer. Accordingly, three segments can be
identified here, namely, low priced, medium priced, and high priced watches. The
lower priced segment consists of watches priced less than Rs. 500; the medium price
56

range consists of watches in the Rs. 500-1500 range and the high priced watches
come in the Rs. 1500 upwards range. There are other higher categories as well such as
the premium and luxury range, but they appeal to only a small category of the watch
market in India.
More than 90 percent of the watches are from the lower price ranges with
international costs being less than 20 euros. Moreover, around 20 to 25 watches are
being sold for every 1000 citizens. Thus, there is enormous potential for growth of the
industry in this untapped segment. Urban customers look for features like fashion
appeal, technology, sophistication and status. Rural customers go for durability,
economy and precision.
Many customers prefer mechanical and automatic watches, while others prefer
quartz watches. Newer segments are also on rise such as ladies watches, children’s
watches and gent’s watches. Customers usually base their preferences and buying
decisions on a variety of factors like price, durability, utility, aesthetic appeal and
brand name. A combination of all these points ultimately forms the customer’s buying
decision that translates into the purchase of a watch.
Though, rural India is still considered to be a difficult market to penetrate, due
to reasons like price sensitiveness and its largely unorganized sector. However, with
the right planning and the right partners and experienced collaborators, it is expected
that both international and domestic watch manufacturers will do well in the Indian
markets.
57

1.11.6 Colour Televisions Industry
In the last few years colour television industry (CTV) has witnessed drastic
changes in the intensity of competition. Exchange schemes, free gifts, price offs,
prizes, deferred payment schemes and other incentives as promotional tools have been
deployed by the players, which certainly have made the market, vibrant and pulsating.
A major factor contributing to the growth has been availability of consumer financing
schemes. Concomitantly, the industry has been witnessing a new scenario with a new
market profile. The entrenched position of the Indian market leaders in CTVs’ like
Videocon, BPL and Onida have been challenged by MNCs such as LG, Samsung,
Sony, Philips, AIWA, Akai, Panasonic, Sansui and Sharp; some in a perceptible way,
others threatening to do so. The industry is going through turbulent transformation.
Companies are reformulating at their strategies and are desperate for growth.
Growth
The industry has been witnessing robust demand; fuelled by revival in
economy, increase in individual disposable income and liberal incentive schemes by
banks and financial institutions. The demand for CTV grew at 15% during 1985-89
but witnessed a slump from 1990-94. With the entry of MNCs and thereby aggressive
marketing, the period 1995-96 to 1999-00 (Table: 1) saw a surge in growth rate to
29%. Thereafter the market has been growing but at a decreasing rate due to
increasing penetration and near saturation in urban households (Table:2.I), This is in
spite of the fact that CTV penetration in India is as low as 23%, more so in rural
markets and hence has potential for growth. According to the Francis Kanoi report
“CTV in India in 2010", the possible demand for CTVs in India in 2010 is likely to be
at least 18.2 mn or 12 mn in the worst scenario. It has been predicted that if power
58

ceases to be an impediment in the growth of CTV market, especially in the rural
sectors, a GDP growth of 7% could take the CTV demand in 2010 to 20 million. The
report also assumes that economic expansion will lead to increase in prosperity levels
down the income strata and the technological advances in transmission; reception etc.
will compel replacement (Financial Express, 2001). The entry of Star TV, Zee TV,
BBC, CNN among a host of other private channels has given choice to the consumer.
Proliferation of niche as well as mass entertainment channels has led to the purchase
of multiple television sets per household. World cup and cricket tournaments and IPL
are key drivers in the increase of CTV sales. Host of cricket tournaments like Series
with Australia and Pakistan, Mini World Cup, World Cup and 20-20 matches are a
major attraction for cricket crazy India and companies are tapping this opportunity by
sponsoring cricket related events and running promotions around them.
Table: 1.17: CTV Industry demand over the years
Period Growth Rate (%)
1985-89 15.0
1990-94 3.0
1995-96 to 1999-00 29.0
2001-02 to 2004-05 11.0
2005-06 to 2008 7.1
Source: CRIS INFAC Colour Television Annual Review, 2006.
CRISIL Product & Services
59

Table: 1.18: Penetration of Urban - Rural for colour TVs (Per Thousand
Households)
Year Urban Rural
1992-93 16.0 1.6
1995-96 21.2 2.6
1997-2000 23.5 2.9
2003-04 Composite - 110
2005-08 Composite - 225
Source: Economic Times 28 April 2001: NCAER for first two rows, ORG-MARG for
third row and ISI Emerging Markets for last two rows; figures not strictly comparable
The manufacturing of electronic items relate mainly to assembly line
operations. Since this is a technology driven industry , companies need to constantly
improvise, innovate and customize their products. Coloured cabinets, headphones, 3-
D 360 degree sound technology and e-mail TV, plasma TV and golden eye
technology are just a few examples. Till now, TV makers have played with one or
more of the three elements of a TV picture, sound, and features- on an analog signal.
Sharper picture with Philips7 Powerchip, flatter screens in plasma TV, increased
channels in hyperband, programme summary on screen, cordless headphones, top
dome speakers and Nicam stereo sound inputs. Digital technology provided marketers
a fresh platform to play with all of these features64.
The promotion strategies and product features of a majority of the players
have emphasized more and more on the latest technology factors. All the players
60

whether domestic or multinational are introducing technologically advanced and
feature rich products.
Salora International launched high-end televisions under brand name
“Promax” which had 250-programme memory, 250 personal preference channels and
a video lock to block undesirable content. Sony (Wega series) enjoys good brand
equity, mainly because of its Trinitron picture tube. Samsung flat TV models are
equipped with the 100 Hz scan, which reduces flickering of the screen and visibility
of scanning lines. These are also equipped with game mode, a child lock and a sleep
timer. LG Flatron models have features like PIP-2 tuner and woofer with 350 watts
and 3 graphic games. Another model that the company is launching has swing
speakers, advanced multi window PIP, a digital virtual Dolby, a PC and teletext. BPL
has also launched flat TV models under sub brand name “matrix” which have all the
features that come with systems of this range. Philips India has launched 29 inch TV
incorporating its pioneering digital natural motion technology and priced it higher
than industry levels following the strategy65 of low market share but high revenues.
Hence, the market players are investing in R&D and improving technology on a
constant basis to offer innovative products.
In the fiscal 2004-05, the market for high-end televisions witnessed a
phenomenal growth over 2003-04, though the market base still remains very small.
The market for projection TVs is reached at 13, 500 units followed by plasma TVs
and LCD TVs at 6, 700 and 2, 850 units respectively. The projection TV market is
highly competitive. At present, Sony leads the projection TV segment with sales of
4,000 units in 2007-08. LG occupies the second position with sales of 3000 units.
Samsung and Philips closely follow with sales of 2,500 and 2,200 units respectively.
61

Onida and Toshiba are then other major players in this segment. LG is the leader in
plasma TV segment with a market share of 30 per cent, followed by Samsung at 22
per cent. LG and Samsung have been engaged in competition for LCD TV, which has
also been growing significantly. In view of the higher technical nature of television
and rising expectations of consumers in general, marketers now need to strengthen the
service network since there is a paucity of service facilities and consumer dissonance
is built around service facilities. Most Indian consumers are techno phobic and are
uncomfortable with instruction manuals. Thus, assurance of comprehensive service to
these consumers is a strategy that a number of the marketers use effectively to sell.
The increase in disposable incomes, more number of households above the
threshold income, declining prices, shortened replacement cycle and the demand for
multiple TV, all these factors are expected to sustain the growth momentum at 10-12
per cent during 2006-07 to 2010-11. The demand for 21-inch and 29-inch CTVs is
likely to be robust. Average realisation is likely to go down as prices of 21-inch and
29-inch Flat CTV should decline in future (Table:2.3). There is a likelihood of the 21-
inch FCTVs being cannibalised by the 29-inch FCTVs by 2009-10 when the price
differential between the two segments is expected to reach Rs 5000-6000. Market
leaders like LG, Samsung, Mire and Videocon would be future beneficiaries since
their current product prices are lower than industry average. The demand for FCTV
will rise as has been the trend since 2001. The share of 21 -inch and 29-inch FCTV is
likely to increase to 75-80percent of total CTV sales by 2010-11 (Table: 2.4). Players
like, Samsung, LG, Sony and Mire who are focusing on these categories and pricing
them competitively are expected to gain in the long term. The reducing price
differential, the prime reason for the shift to FCTVs is expected to narrow further,
almost wiping out the market for the 20-inch and 21-inch conventional CTVs by
62

2010-11. Regional and small players like Crown, Salora, Texla, Oscar and Beltek who
sell primarily conventional and small sized CTVs are expected to lose further. If LG
continues with its aggressive marketing and distribution, it is likely to retain the top
slot with market share of 25-30 per cent. Although LG commands a clear lead, further
fast paced growth in market share would be restricted as the industry players like
Samsung, Onida, Videocon, Philips and Sony would probably move towards similar
pricing and product mixes. Lead players like Samsung and Onida differ on market
shares by mere 350-400 basis points; hence the situation between the two is likely to
remain competitive. Entry of new players like TCL, Haier, and Hyundai etc will
intensify competition but such players’ will have to establish their presence through a
robust distribution network, which can only be built over a period of time.
Table: 1.19: Size Variation
Type Share (%)14”
2120”
3321”
4225”
229”
2
Source: Centre for Industrial and Economic Research (CIER) and INTECOS (2002), Market Forecast and Indicators: emerging market in India 2002-2012
63

Table: 1.20: CTVs Size Vs Demand
Year Nominal Price * (Rs.)
Demand (Million Units)
2000-01 12,200 5.1
2001-02 10,000 5.4
2002-03 9,000 7.3
2003-04 8,500 6.7
2004-05 8000 7.8
2005-06 7,500 8.4
2006-07
2007-08
^Nominal Price is the street price of 21” CTVs
Source: CRIS INF AC Colour Television Annual Review, 2006, CRJSIL Product &
Services
1.11.7 MOBILE PHONES
India has earned the distinction of being the fastest growing telecom market in
the world. With over 130 million mobile subscribers as of October 2006. The huge
appetite is reflective of the socio-economic impact of mobility that has transformed
mobile telephony from a luxury to a utility. In India, even the neighbourhood tea
vendor, launderer and vegetable seller are using it to derive greater efficiency and
productivity for themselves and their businesses. With a 400 million strong middle
class driving demand, competition and productivity, and with disposable income
multiplying over five times between 1995 and 2000, consumption has increased three
fold. There is a huge and an unprecedented demand for hand sets in India. Mobile
64

phone is no longer a life style product in India. It is a functional necessity. A
common man cannot imagine his life without mobile. Life in all walks of life can be
paralyzed without mobile phone. It can hardly be over emphasized the key role a
mobile is playing in Indian economy. There is a lot of Indian and foreign companies
making mobile handset. Indian mobile manufacturers include BPL and Onida. The
foreign companies include Sony, Nokia, LG, Samsung, Motorola etc. The
mobility market is 14 years old in India but has had a dramatic impact in every area.
India is one of the fastest growing mobility markets in the world at eight million
subscriber additions every month. It is expected to contribute significantly to the next
billion subscribers globally. India will contribute 25 per cent of the next billion
subscribers.
Innovative business models
Innovative business models from operators such as Bharti, Reliance,
Vodafone, Idea, BSNL and the TATA. Indian operators invented a business model
that has increased minutes of usage at a low call rate and also ensured high EBITA
(earnings before interest, taxes, depreciation and amortization)
Durable convergence in a cell phone is a notable feature. Today more Indians
listen to the radio on a cell phone, take pictures on a cell phone and set their alarms on
a cell phone. Cell phone brands have given consumers more value rather than just
voice and SMS.
Nokia sold more camera handset than Kodak cameras did. The mobile phone
has affected almost everyone in the Indian society. To women and children it is a
safety device; to carpenters, plumbers and electricians it is a productivity device; to
young people, it is a personality statement. It has relevant meaning to everyone. More
and more entertainment is delivered through mobility. Indians click through the Net
65

more on mobiles and less on laptops. Governments, departments will increasingly use
the digited route to superior governance. Mobility will give marketers the ability to
target one consumer at a time, while also targeting millions as a media vehicle.
The mobile installed base has crossed the 250 million mark. This phenomenal
growth has brought about numerous Indian ‘solutions’. The low cost mobile device
has redefined price points elsewhere in the world. Usage continues to grow as mobile
penetration increases in B and C class cities.
Table: 1.21-.List of mobile handset making companies in India
SLNo. Name of the Company
1 Nokia
2 Motorola
3 Sony Ericson
4 LG
5 Samsung
6 Aircel
7 Spice
8 BPL
9 Onida
Table: 1.22:The growing mobile play
Global India
Population 6.6 bn 1.2 bn
Mobile phone users 2.3 bn 205 mn
TV households 1.25bn 108 mn
Cable TV subscribers 350 mn 80 mn
Source: ZDNET Researc
66

Table: 1.23.Mobile earnings
India Global
Total mobile subscribers 201mn 2.6 bn
Mobile Net subscribers 31 mn 450 mn
Total mobile data earning Rs.6,300 cr $110 bn (Rs.4.4 lakh cr)
Entertainment earnings Rs. 1,500 cr $23 bn(Rs.92,000 cr)
Source: ZDNET Research
Mobile has emerged as the alternative to cinema, TV and the computer screens
- all put together. Now, it promises to change the way an average Indian entertains68
himself and conducts business. Get set to download music, check bank statement,
transfer money, book air tickets, listen to internet radio, view live cricket scores or
play games while hooked to the internet. Add to the location-based services that help
pin-point a restaurant or guide one through traffic.
Soon enough, one could watch live television, retrieve content stored on the
Web and see condensed episodes of TV serials. Also on the cards is the mobile wallet
that could replace credit and debit cards, allowing one to pay via the mobile and be
charged on the monthly bill. All this is over and above the regular value-added
services like downloading ring tones, wallpapers and news alerts.
67

Table: 1.24:Mobile has the following services
Commerce Entertainment Search Mail
> Banks > Music > Location-based > E-mail
> Credit cards > Movies services > Chat
> Money transfer > Mobile TV > GPS > Video
> Rail, air tickets > Sport > Navigation conferencing
> Movie tickets > Cricket
> Radio
MOBILE HANDSET
The following table illustrates the market share of major mobile handset market
players in India.
Table: 1.2 5: Market share of major mobile handsets
Company Market Share (%)
Nokia 64
Samsung 10
Sony Erickson 6
ZTE 5.6
LG 4.5
Motorola 3.5
Huvai 1.5
Haier 1.5
Others 3.6
Source: Compiled from websites
68
The Indian handset market continued its growth trajectory till 2008 with the
market increasing from 71.8 mn units. In FY 2008-09, recording a 33% growth has
been recorded. Of this, GSM technology continued to dominate the market with 50.6
mn in 2007-08 to 68.3 mn in 2008-09, recording 34% growth. In comparison, CDMA
managed to increase the market share from 21.2 mn in 2007-08 to 27.3 mn in 2008-
09, recording a 28% growth 66.
Increasing geographies, the replacement market, and innovative features
offered in the handsets fueled the growth in this market. This trend is likely to
continue in the coming two to three years with handset manufacturers coming out
with new and innovative features to add further impetus to the market.
The market size increased from Rs 21,434 crore in 2006-07 to Rs 24,003 crore
in 2007-08, recording a growth of 12%. The Indian handset market is witnessing
adoption from both ends of the customer spectrum-from a value conscious mass
market user to a customer demanding the best features and innovative products. With
most urban areas already covered by mobile operators, 40% of new subscribers are
coming from rural areas67. By 2010, the rural population is likely to touch 800 mn.
According to V&D estimates, of the next 250 mn users as many as 100 mn
will be from the rural parts of the country . The next big growth is expected to come
from the hinterland, where two-thirds of the country's 1.17 bn population still living in
rural areas. As of now, rural subscribers account for close to 25% of the total mobile
user base in the country. With most service providers targeting the rural segment, this
percentage is likely to see a steep rise in the current year.
69

1.11.8 Trends in Mobile phone Industry:
Handsets are no longer used just for receiving and making calls. There is a
definite movement toward more features and technologies being introduced in
phones. Advanced technologies related to music, imaging, business needs, and
functionalities like GPS are being incorporated at increasingly affordable price points.
In terms of usage patterns, music emerged as a key driver across youth and young
adults. In 2008 market is dominated by music-radio handsets. Taking a cue from
market leader Nokia, most handset companies offered music handsets in 2008. Mobile
navigation is another emerging trend in the market. In the days to come, more people
will use mobile phones to search addresses. According to experts, this year will see a
movement toward stylish and personalized handsets. Multimedia features will become
a norm in the coming times with more and more players offering multimedia features
on mobile phones. Multimedia will further fuel the growth of widescreen handsets 69.
Another growth driver emerging in the country is the replacement market in
urban market. Global as well as Indian handset manufacturers are planning to focus
on the more lucrative replacement market in the country. This has resulted in an
increased sale of middle- and high-end phones. A few years ago, the sale of middle-
and high-end phones was in the range of 8-10% of the mobile handset market. This
figure has now increased to around 20%.
Companies are targeting younger clients for the replacement market since they
change handsets very frequently. The replacement market is likely to emerge as a
substantial revenue contributor to companies.
70

1.11.8 Domestic appliances
Domestic appliances are the indicators for changing scenario in consumer
markets after liberalization in economic environment. Having reached high
penetration in urban markets, most appliances manufacturers are now looking to focus
on addressing the low household penetration of household appliances in rural markets
that are seeing growing incomes and increasing awareness due to the rapid rise of TV
and other media. The home appliances industry, which had been focused on the urban
market, is now reaching out of semi-urban and rural markets as well, because of the
shift in living style of the population, increasing demand for these products in villages
and relatively higher purchasing power of consumers. As the market penetrates into
the core middle class segment in both urban and rural areas, it is expected to expand
phenomenally, offering large volumes to the industry 70.
The most essential product in durable segment in domestic appliances is gas-
stove. The branded gas-stove market expanded at a significant pace and is expected to
retain the momentum into the future as well. The market has been transformed by the
entry of over a dozen new brands, more over competition has intensified. While focus
on price competency remains a key priority, players have also started focusing on
other product features such as safety and the total cost of ownership of the brand. Gas-
stove has been seen continuous growth over the period of time.
1.11.9 TWO WHEELERS INDUSTRY
The Indian two-wheeler industry is the second largest in the world. It sold 7.6
million vehicles in 2005-06 and 8.4 million in 2006-07, recording a growth of 11 per
cent. The two-wheeler population too has gone up to over 60 million. But this
reflects a very low penetration level. There is a big potential to be tapped. India has
500 million middle class populations waiting to buy two-wheelers. The industry is in
71

an advanced stage of double digit growth which is expected to come down to 8-9 per
cent by 2011-12.
The market is vibrant, modem and upbeat. New technology, materials, styles
features and colours are coming in. The focus is on ride quality, maneuverability and
comfort. The two-wheeler is also a status symbol and a fashion statement.
Electronics is coming in a big way in engine management system for improved fuel
efficiency, reducing emission levels and improving performance parameters. New
safety features are being added. The new order is replacing the old.
A two-wheeler is really a common man’s vehicle offering an affordable
solution for personal mobility. The inadequate public transportation, its inefficient
operation and miserable road infrastructure leave him with little choice. As a fallout
of that, India has become world No. 1 in two-wheeler manufacturer.
The demand for two-wheelers is closely linked to the growth of GDP. It had
grown at almost twice the rate of growth of GDP in earlier decades. Later, as the
GDP growth went up to 9% levels and financing started becoming a problem, the
linkage lost its meaning. But it does reflect the underlying potential of two-wheelers
in a growing economy. India still remains the second fastest growing economy in the
world. Even at 6 to 7 per cent GDP growth levels, there will be a substantial
improvement in disposable incomes of the target two-wheeler customers.
Women are going to play a far more active role in the growth of the two
wheeler market. As more and more women start going to work and as public
transport struggles to keep pace, the two-wheeler will increasingly become a reliable
source of personal transport for many of them. Scooters, therefore will continue to
sustain the growth trend that they have built over last several years.
72
Currently, the motor cycle segment dominates the marketwise an 85 per cent
share. With the opening up of rural markets, improved road connectivity and higher
disposable incomes one can expect excellent prospect is for two-wheelers in rural
areas.
Low cost bikes
There is a distinct possibility of some of the market leaders developing a low
cost bike on the lines of the low cost Rs. 1 lakh car. A fuel efficient low cost bike has
the potential of revolutionizing the low end of the personal transport segment and is
capable of taking the penetration build-up to a much higher trajectory.
India, with nine million bikes, is the world’s second largest two-wheeler
market. The two-wheeler industry sold 7.6 million vehicles in 2005-06 and 8.4
million units in 2006-07, recording a growth of 11 per cent. But, in 2007-08, the sales
declined to 7,248,600 units. Motorcycle sales fell by 12 per cent from 6,547,195 units
in 2006-07 to 5,768,941 units in 2007-08. But, a revival is evident in 2008-09.
Scooters and motorcycles collectively recorded a gain of 10.75 per cent in the
period April-August 2008, selling more than 3.08 million units. All the major two
wheeler manufacturers are now busy producing a variety of vehicles, ranging from
gearless scooters to executive segment and premium segment of motorcycles. Higher
disposable incomes and competitive lending rates offered by manufacturers has
boosted sales in recent months.
Inspired by Tata’s small car project, Hero Honda is also planning to build a
motorcycle that will sell for Rs. 12,500 - Rs. 15,000, and create an all-new class of
buyers. At present, the cheapest motorcycle costs Rs.30,000.
73
Scooters back in favour
There are distinct signs of scooters staging a comeback. There is noticeable
preference for scooters with advanced technology, higher engine capacity and light
weight. Automatic (non-geared) scooters are in demand. They offer more
conveniences apart from giving a comfortable ride.
Electric vehicles
Electric two-wheelers also have made an entry in the Indian market. But the
numbers are small. These were introduced in 2006-07 and sales for the year totaled
22,000.
Innovations matter
Sea changes are taking place in the two-wheeler segment. Competition from
foreign companies is also growing. For instance, Japanese bike manufacturers like
Yamaha, Honda, Suzuki and Kawasaki will launch scaled-down Indian versions of
their international super bike models with 800 cc engines and cost upwards of Rs.10
lakh in India. They plan to offer re-engineered versions with much smaller engines
and fewer trimmings at prices ranging from Rs.50,000 to Rs.One lakh. The change is
in favour of the fuel-efficient engine.
Automatic geared scooters are selling in large numbers amongst the women
buyers. Major manufacturers are ready to launch power packed scooters with muscle
looks to attract the male class as well. Bologna, Italy-based Ducati, is busy launching
five super bikes in India. The bikes will be imported into India as completely built
units. India imposes 60 per cent as import duties on fully built bikes imported into
India. Super bikes are motorcycles with engines of more than 800 cc.
74

Table: 1.26: Domestic Sales of Two-Wheelers
(in number)
2003-04 2004-05 2005-06 2006-07 2007-08
Scooters 886,295 922,428 908,159 NA NA
Motorcycles 4,170,445 4,964,753 5,815,417 6,547,195 5,768,341
Mopeds 307,509 322,584 332,741 NA NA
Total: 5,364,249 6,209,765 7,056,317 7,872,334 7,248,600
Table: 1.27: Export of Two-Wheelers
(in number)
2001-02 2002-03 2003-04 2004-05 2005-06
Scooters 28,332 32,566 53,687 60,699 83,873
Motorcycles 56,880 123,725 187,287 277,123 386,202
Mopeds 18,971 23,391 24,078 28,585 43,181
Total: 104,183 179,682 265,052 366,407 513,256
Table:l. 28:List of Two Wheeler Companies in India
S.No. Name of the Company
1 Bajaj Auto Ltd.
2 Hero Honda Motors Ltd.
3 HMS1L
4 Kinetic Motor Co. Ltd.
5 LML India Ltd.
6 TVS Motor Co.
7 Yamaha Motor India
8 Suzuki Motor Corporation
9 Royal Enfield Motors Ltd.
10 Monto Motors
75

The liberalization policies have led to continuous increase in competition
which has ultimately resulted in modernization in line with the global standards as
well as in substantial cut in prices. Aggressive marketing by the auto finance
companies have also played a significant role in boosting automobile demand,
especially from the population in the middle income group.
Table 1.29 suggests two important dimensions for the two-wheeler industry. The
region-wise numbers of motorcycle and scooter suggest the future market for these
segments. At the all India level, the demand for motorcycles will be almost 10 times
of that of the scooters. The same in the western region will be almost 20 times. It is
also evident from the table that motorcycle will find its major market in the western
region of the country, which will account for more than 40 per cent of its total
demand. The south and the north-central region will follow this. The demand for
scooters will be the maximum in the northern region, which will account for more
than 50 per cent of the demand for scooters in 2011-12.
Table 1.29: Demand Forecast for Motorcycles and Scooters for 2011-12
Two-wheeler Regions
SegmentSouth West
North- East & North- All
Central East India
Motorcycle2835 4327 2624 883 10669
(12.9) (16.8) (12.5) (11.1) (14.0)
203 219 602 99 1124Scooter
(2.6) (3.5) (2-8) (2.0) (2.08)
Note: Compound Annual Rate of Growth during 2002-03 and 2011-12 is presented in parenthesis
Source: Indian Automobile Industry: Optimism in the Air, Industry Insight, NCAER
76
There is a large untapped market in semi-urban and rural areas of the country.
Any strategic planning for the two-’-wheeler industry needs to identify these markets
with the help of available statistical techniques. Potential markets can be identified as
well as prioritized using these techniques with the help of secondary data on socio
economic parameters. For the two-wheeler industry, it is also important to identify the
target groups for various categories of motorcycles and scooters. With the formal
introduction of secondhand car market by the reputed car manufacturers and easy loan
availability for new as well as used cars, the two-wheeler industry needs to upgrade
its market information system to capture the new market and to maintain its already
existing markets. Availability of easy credit for two-wheelers in rural and smaller
urban areas also requires more focused attention. It is also imperative to initiate
measures to make the presence of Indian two-wheeler industry felt in the global
market. Adequate incentives for promoting exports and setting up of institutional
mechanism such as Automobile Export Promotion Council would be of great help for
further surge in demand for the Indian two-wheeler industry.
1.3.10.2
Scooterettes/Mopeds
Automobile Products of India was the only company in India that started
manufacturing mopeds from 1955. TVS Motors launched India's first 50cc, 2 seater
moped: TVS Moped 50. TVS also launched India's first indigenous scooterette:
Scooty in 1994.
77
This segment has about one-fourth share in the Indian two wheeler industry.
The moped exports account for about 8.4% of the total two wheeler exports from
India.
Sales Two- wheeler sales in the country have sky rocketed in the recent years, and
the annual sales of motorcycles in India expected to cross the 10 million mark by
2010. The low penetration of two-wheelers in the country 31 two-wheelers per 1000
citizens (2004) leaves immense scope for the growth of the market. Overall the
industry sales of two-wheelers have grown by 15% from 6.57 million in 2004/2005 to
7.57 million in 2005/2006. The buoyant Indian economy with a growth rate of around
8% per annum is further expected to fuel the growth of two wheelers in the country.
1.11.10 THE ROAD AHEAD
The rural revolution is fuelled by rising purchasing power, changing consumer
habits, increased access to information and communication technology, better
infrastructure and increased government programmes to boost the rural economy.
The recent study by Associated Chambers of Commerce and Industry of India
(ASSOCHAM), disclosed that around 200 million out of 700 million rural population
in India are engaged in agricultural and non-agricultural activities, and have a decent
per capita income. A large section of the rural population is choosing dairy, food
processing and packaging as professions, beyond traditional farming. Furthermore,
large retail players like Reliance, Spencer’s and Subhiksha are procuring farm
commodities in bulk directly from farmers, giving them better money for their
produce. The rural population is now looking at better options beyond post offices and
78
commercial banks for higher returns on their surplus earnings. However, Rural India
lacks a good distribution system. Most rural homes have restricted storage space and
no refrigeration so villagers tend to only buy their immediate requirements. To
succeed, corporations need to understand the psyche of the rural family along with the
rural distribution network. For example, Hindustan Lever used a strategy of volume
driven growth in rural markets, which is highly successful.
References:
1. Dipak Y. Chacharkar (2008), “Rural Marketing: An inquiry into policies, practices and Buying habits with special reference to Amaravati District”,Finance India, March 2008, Vol.22, No.l, p. 210-215
2. Census of India, 1991.3. ells, David, L., 1968, International Encyclopedia of the Social Science,
Vol.l3,Ed., The Macmillan Co., and The Free Press, p.586.4. Larson, O.F., “Rural Society, 1968, International encyclopedia of the Social
Science, Ed. By D.L. Sells, Macmillan and the Free Press, p. 582.5. Census of India 2001.6. Sorokin, P. and Zimmerman, C., 1929, Principles of rural urban Sociology,
New York, Holt.7. NCAER, 1980, Household Income and its Disposition, New Delhi.8. Balakrishnan, M., 1978, “Rural MarketingrMyth and Reality”, Economic and
Political Weekly, august.. pp-75-80.9. Sontakki, C.N.,, 1992, ed., Maketing Management, Kalyani Publishers,
Ludhiana, p. 209.10. Ganguli, A.K., 1999, “Rural Marketing Strategy: Attempts to Explore New
ares”, in Marketing in India, cases and readings by S. Neelmegham, Vikas Publishing House Pvt. Ltd., p. 170
11. Census of India, 2001.12. Mithileshwar Jha, “Understanding Rural Markets” 1998.p. 42.13. HLL, Know Us Business Supports, Distribution Network htm.14. Hindustan Thompson Associates Ltd., 1986, Thompson Rural Market Index,
Bombay.15. Census of India, 200116. NCAER, 1980, Household Income and its Disposition, New Delhi.17. NCAER, 1980, Household Income and its Disposition, New Delhi.18. Balakrishnan, M., ‘Rural Marketing: Myth and Realty’, Economic and
Political Weekly, Aug. 1978, pp. M-75-80.19. Das, V.M. and Ghosh, S.R., 1999, “Perspectives in Rural Marketing”,
Marketing in India: cases and Readings, ed., by S. Neelamegham, Vikas Publishing House Pvt. Ltd., p. 164.
20. Government of India, Planning commission, report of the Expert Group on Estimation of the Poportion and Number of Poor, as reported by Misa and Puri, Indian Economics, p. 234.
79
21. NS SO, 1999, House Consumer Expenditure and Employment Situation in India, 54th round, Report No.448 (54/1. 0/1).
22. Hindustan Thompson Associates Ltd., 1986, Thompson Rural Market Index, Bombay.
23. NSSO, Household Consumer Expenditure and Employment Situation in India, 54,h Round, Report No.448 (54/1.0/1).
24. Neelamangalam, Marketing in India, p.238.25. Brown, Milton, Wilbur B. England John B. Mathews, Jr; Problems in
Marketing”, Newyork, Me Graw-hill Book company, INC 1961, p.31.26. Phillip Kotler, “Marketing Management: Analysis Planning and control”
Prentice Hall of India Pvt. Ltd; New Delhi, 1974, p. 17.27. James E. Engel, D.T. Kollat, Roger Blackwell “Consumer Behaviour 11th
Edition, p.528. Subhash C. Metha “Marketing Environment Concepts and cases”, Tata Me
Graw-Hill Publishing Co, Ltd; New Delhi; 1973; p.78.29. Peter f. Drucker, “Marketing for results”, allies Publishers Bombay, 1975,
p.91.30. Webster’s New collegiate Dictionary, G & C Merian co., Cambridge Mars,
USA, 1961, p. 179.31. Wroe Alderson, “Marketing Behaviour and Executive Action”.32. Ramaswamy V.S. and Nanamkumari S, “Marketing Management, Planning
Implementation and Contro”, Macmillan India Ltd, p. 265, New Delhi 1995.33. Sanal Kumar Velayaudhan, “Rural Marketing, Targeting the Non-Urban
Consumer”, Response Books, a Division of Sage Publications, p. 49, Delhi, 2002.
34. Hiren K. Patel, MD, Nirma Consumer Care India Infoline sector Reports, 2001.
35. Sanal Kumar Velayaudhan, “Rural Marketing, Targeting the Non-Urban Consumer”, Response Books, a Division of Sage Publications, p.36, Delhi,2002.
36. Hiren K. Patel, MD, Nirma Consumer Care India Infoline Sector Reports. 2001.
37. Indiainfoline.com, Rural Marketing challenges and Opportunities, Dec 2002.38. 38. MICA, Rural Market Ratings.39. Francis Xavier, MD, Francis Kanoi, Business Line, Catalyst, Oct 2001.40. Mina Colliara, Indiainfoline.com, October 2008.41. Sussan Mayhew, Dictionary of Geography, Oxford University Press.42. NSSO, Household Consumer Expenditure and Employment Situation in India,
54!h Round, Report No.448 (54/1.0/1).43. Singer M., 1956, “Cultural Values in India’s Economic Development”, Annals
of the American Academy of Political and Social Science, p.81-91, as reported in EPW, Feb., 27, 1988.
44. Balakrishnan, M., 1978, “Rual Marketing: Myth and Reality”, Economic and Political Weekly, Aug. p.M-75-80.
45. Sontakki, C.N, 1992, ed., Marketing Management, Kalyani Publishers, Ludhiana, p.209.
46. Indian Market Research Bureau (IMRB), 2008.47. Kacher, M.R., 1975, Planning the Distribution Function, Indian Management,
Aug. a reproduced in Marketing in India: Case and Reading, Ed., by S. Neelamegham, 1999, ed., p.626-638.
80
48. Wall Street Journal, 30th ed., 2008.49. National Council of Applied Economic Research, Household Income and its
Disposition, New Delhi, 2008.50. Consumer Electronics Industry Insight; 2004-09, p.50.51. Susan Mayhew, Dictionary of Geography, Orford University Press.52. NCAER (2007)53. Murali, D. and M.S. Kulkami, (1996), “Study of purchasing practices of
consumers of parashani town”, Indian Journal of Marketing, Vol.XXV, No.2- 3, February- March, 1996, p.3-7.
54. www.Projectshub.com55. NSSO, 1997, Use of Durable Goods by Indian Households 1993-94, New
Delhi., p.14-15.56. Ajit Chakraborthy, Understanding Rural Markets, Part-IL57. Kothari’s Year Book: on Business and Industry, 1988, p.9158. The Hindu survey of Indian Industry, 2006, p. 102.59. Ashok Saxena: The Television “T.V. Technology 1990”, Department of
Electronics Corporation, New Delhi, p.l60. www.ibef.com61. NSSO, 1998, Household Consumer Expenditure and Employment Situation in
India, 54th Round, ReportNo. 448.62. John G. Udell, “Pre-Purchase behaviour of Buyers of Small Electrical
Appliances”, Journal of Marketing, Vol.30, No.4, October, 1986.63. Business Line, 2008.64. Financial Express 20th June, 2007.65. Dogra, B.S. and J. Chauhan, (1979), “Consumer Behaviour in Television - a
case Study of Simla Market”, Indian Journal of Marketing, Vol.7, March 1979.
66. CRIS INFAC, 200667. Hari Govind Mishra and Chetna Mahajan, “Determination of potential for
customer satisfaction and dissatisfaction in Mobile Handsets using Kano Model”, Indian Journal of Marketing, November 2008, p.8-13
68. Gagandeep Kaur, “Increasing Mobile Phone Reach in Rural India”, Business World, 8th August, 2007
69. Sinha and Ajay Wagh, “Analyzing Growth of Cellular Telecom Sector and Understanding Consumer’s Preferences and choices on the use of cell phone”, Indian Journal of marketing, September,2008, p.26-35.
70. Voice & Data, June 200871. Sarwade, “Emerging Dimensions of Buyers Behaviours in Rural Area”, Indian
Journal of Marketing, February 2002, pp.13
81