
UNCLASSIFIED AD NUMBER - dtic.mil · UNCLASSIFIED AD NUMBER AD810277 ... Typhoid Fever:...
123
UNCLASSIFIED AD NUMBER AD810277 NEW LIMITATION CHANGE TO Approved for public release, distribution unlimited FROM Distribution authorized to DoD only; Administrative/Operational Use; MAR 1967. Other requests shall be referred to Department of the Army, Attn: Public Affairs Office, Washington, DC 20310. AUTHORITY USAMRIID ltr, 9 Jul 1971 THIS PAGE IS UNCLASSIFIED
Transcript of UNCLASSIFIED AD NUMBER - dtic.mil · UNCLASSIFIED AD NUMBER AD810277 ... Typhoid Fever:...
UNCLASSIFIED
AD NUMBER
AD810277
NEW LIMITATION CHANGE
TOApproved for public release, distributionunlimited
FROMDistribution authorized to DoD only;Administrative/Operational Use; MAR 1967.Other requests shall be referred toDepartment of the Army, Attn: PublicAffairs Office, Washington, DC 20310.
AUTHORITY
USAMRIID ltr, 9 Jul 1971
THIS PAGE IS UNCLASSIFIED
AD
COMMISSION ON EPIDEMIOLOGICAL SURVEY
ANNUAL REPORT TO THE ARMED FORCES EPIDEMIOLOGZCAL BOARD
C6 FISCAL YEAR 1966
b5
DDC AVAILABILITY STATEMENT
Each transmittal of this document outside the Department ofDefense must have prior approval of the Commanding General,U. S. Army Medical Research and Development Command.
NOT FOR PUBLICATION
The information contained herein may not be released to otherthan Department of Defense agencies except as authorized bythe Commanding General, U. S. Army Medical Research andDevelopment Command in accordance with the DDC AvailabilityStatement shown above. Information in this report may not bequoted or extracted for publication without permission of theresponsible investigator or the commission director.
MARCH 1967
COMMISSION ON EPIDEMIOLOGICAL SURVEY
ANNUAL REPORT TO THE ARMED FORCES EPIDEMIOLOGICAL BOARD
FISCAL YLAR 1966
..he findings in this report are not t- be construed as anofficial Department of the Army position unless so designatedby other authorized documents.
DDC AVAILABILITY STATEMENT
Each transmittal of this document outside the Denartment ofDefense must have prior approval of the Commanding General,U. S. Army Medical Research and Development Command.
NOT FOR PUBLICATION
The informaticn contained herein may not be released to otherthan Departmernt of Defense agencips except as autborized by theCommanding Genero', U, S. Army Medical Research and DevelopmentCortuand in accc dance with the DDC Availability Statement shownabove. Iniformation in this report may not be quot'.d or extractedfor publication without permission of the responsible investigatoror the commission director.
MARCH [967
ii
SUMMARY
Progrese is reported in selected areas of research in medical defenseaipects of biological ageuts by the U. S. Army Medical Unit and one con-tractor.
iii
TABLE OF CONTENTS
PAGE
Commission on Epidemiological Survey v
The Director's Sumamary Report vii.
Clinical Studies of Venezuelan Equine Encephalomyelitis VaccineStudies in ManAristides C. Alevizatcs, Captain, MC 1
Venezuelan Equine Encephalomyelitis Vaccine Viremia Studies in ManRobert W. McKinney, Lt Colonel MSC 7
Changes in Whole Blood Amino Acids during InfectionRalph D. Feiin, Captain, MC 15
Serological Studies on Staphylococcal Enterotoxin BVirginia G. McGann, Ph.D. 33
Mechanisms of Pyrogenicity of Staphylococcal Enterotoxin BFrank A. Carozza, Jr., Captain, MC 43
Recent Studies on Anthrax ToxinMartha K. Ward, Captain, USPHS, Mary H. Wilkie, M.S., andAnne Buzzell, Ph.D. 57
Influence of Pneumococcal Infection on a Host Enzyme SystemMorton I. Rapoport, Major, MC 65
Alteratinns of Host Cellular Ribonucleic Acid Metabolism duringInfectionGeorge Lust, Ph.D. 79
Mechanisms of Enditoxin ToleranceSheldon E. Greisman, M.D., Edward J. Young, M.D., andWilliam E. Woodward, M.D. 95
Typhoid Fever: Pathogenesis and PreventionRichard B. Hornick, M.D. 99
Studies on Rocky Mountain Spotted Fever- Serologic Response in Man toVaccinat.ion with Combined Epidemic Typhus, Rocky Mountain SpottedFever and Q Fever VaccineCharles L. Wisseman, Jr., M.D., and Theodore E. Woodward, M.D. 105
Influence of Tularemia on Insulin SecretionGeorge E. Shambaugh, Major. MC 109

iv
Publications of the U. S. Army Medical Unit, Fiscal Year .9966 119
Distribution List 121
DD Form 1473 123
COMMISSION ON EPIDEMIOLOGICAL SURVEY
ME14ERS
Cluff, Leighton E., Jr., M.D.
Crozier, Dan, M.D.
Dingle, Jchn H., M.D.
Fiancis, Thomas, Jr., .D.
14rsch, James G., M.D.
Knight, Vernon, M.D.
Tigertt, William D., M.D.
Woodward, Theodore E., M.D., Director
ASSOCIATE MEMBERS
Greisman, Sheldon E., M.D.
Hornick, Richard B., M.D.
McCrumb, Fred R., Jr., M.D.
Wisseman, Charles L., Jr., M.D.
vii
THE DIRECTOR'S SUMMARY REPORT
The Commissio, w, epidemiological Survey held its annual meeting atthe Walter Reed Army Institute of Research on 9 September 1966. SeniorrepresenLatives of the Department of Army, Navy and Air Force and theU. S. Army Medical Unit and other personnel at Fort Detrick who attendedwere:
U. S. Arm Medical Unit
Colonel W. R. Beisel, MCCaptain M. K. Ward, USPHSLt Colonel K. R. Dirks, MCLL Colonel R. W. McKinney, MSCMajor M. I. Rapoport, MCMajor G. E. Shambaugh, III. MCCaptain A. C. Alevizatos, MCCaptain C. P. Craig, MCCaptain R. D. Feigin, MCCaptain E. V. Staab, MCDr. G. Lust
Dr. V. G. McGann
U.S. Amm
Colonel J. W. Cooch, MC, Walter Reed Army Institute of TesearchColonel L. P. Frick, MSC, Medical Research & Development CommandColonel G. W. Johnston, MSC, Medical Research & Development CommandColonel R. M. Nims, VC, Fort 5etrickLt Colonel R. T. Cutting, MC, Medical Research & Development CommandLt Coloiel J. Einarson, MC, Office of The Surgeon GeneralLt Colonel J. C. Fitzpatrick, MC, Medical Research & Development
Command
U. S. Navy
Captain J. W. Miilar, Bureau Medicine and SurgeryCommander L. W. hiller, Bureau Midicine and Surgery
J. S. Air Force
Colonel S. Lutz, .r., MC, HQ, USAF, Office of the Surgeon General
Guests
Dr. Frank A. Ca-czza, Jr., Union Meu.m'rial Hospital, Baltimore, MarylandDr Harold N. G:assman, Frt DetrickDr. Riley D. Housew-ight, Fort Detrick
viii
Dr. Gustave Dammin, President of the Armed Forces Epidemiological Board,attended and mqde many helpful suggestions in connection with our mission.The Director expressed grateful appreciation to Captain Sidney A. Britten,USN, Executive Secretary of the Board, and to Miss Betty Gilbert, Adminis-trative Assistant, for their continued assistance in conducting the Commission'sactivities.
The agenda of the one day's meeting was devoted to reviewing work com-pleted or in progress by investigators of the U. S. Army Medical Unit andone of its contractors.
VENEZUELAN EQUINE ENCEPHALOMYELITIS VACCINE
Clinical studies of 40 persons given attenuated Venezuelan equineencephalomyelitis (VEE) vaccine revealed demonstrable viremia in 13 subjectsand clinical symptomatology in 15 subjects. The clinical findings did notcorrelate with the presence of viremia. Transient electrocardiographicabnormalities were noted in 47.5% and transient leukopenia in 407 of thevaccinees. Eight individuals followed with daily electroencephalogramsdemonstrated no significant change subsequent to vaccination. There wasno statistically significant correlation between any of these responsesor combinati-'n of responses. The virologic studies demonstrated the presenceof iow grade viremia up to day 12 postinoculation. In view of the low levelof viremia it appeared unlikely that vaccinees would infect Aedes aegyptimosquitoes. Members of the Commission on Viral Infections kindly studiedthe data and reached the same conclusion. Further studies are in progress.
METABOLIC CHANGES IN INFECTIOUS DISEASES
Intensive studies of metabolic and biochemical changes occurring inman during the incubation period and clinical course of various infectiousdiseases have been conducted. The objective of such appraisals has beento develop a better understanding of the fundamental nature of infectiousprocesses and to search for objective clues which might lead to earlydiagnosis. In tularemic infection caused by aerosolization of virulentPasteurella tularensis (SCHU-S strain) levels of certain blood atiaino acidsare decreased from 12-36 hr before the onset of fever, The changes aregreater in those persons with more severe illness. The loss does notresult from excess urinary loss but perhaps from excess utilization by theliver and spleen. Amino acids are used for new protein synthesis.
There i6 a diurnal change in the concentration of blood amino acidsin normp! individuals Following VEE vaccine administration at 0800 hr,there occurred an obliteration of the normal diurnal amino acid rhythmthat began within I day and persisted for 4 days. When the same vaccinewas ,rninistered to 20 other volunteers at 2000 hr, there was an earlyrise in blood amino acids of 2 days duration followed in turn by a fallto below normal concentrations for a total of 6 additional days. Thechanges in this latter group also included a loss of the diurnal rhythm,
ix
but in addition several patients showed up to an 80-fold increase in proline,a marked increase in glutamic acid, and a depression in glutamine. Thus,the exposure at 2000 hr was accompanied by a di-tinct pattern of metabolicchanges, some of which might involve an inhibitionof the enzyme glutaminesynthethase.
Changes in anoLher enzyme, tryptophan pyrrolase were studied in thelivers of mice infected with a small number of pneumococci. This infectionwas associated with a stimulation in the activity of this enzyme within 2 hr,but late in the infection the enzyme activity showed depression as it doesduring endocoxemia. The early induction of tryptophan pyrrolase was dependentupon the presence of an intact adrenal gland, an observation compatible withthe known ability of cottisol to induce this enzyme. ! te in infection, how-ever, when plasma steroid levels were high, the enzyme activity fell andcould not be stimulated by additional cortisol, an observation compatiblewith toxic inhibition of enzyme synthesis in a dying animal. Incidental tothis. study was the first description of a circadian change in this enzyme.
The infection-relateA stimulation of synthesis of new protein moleculeswithin host cells is initiated by early sequential changes in deoxyribo-nucleic acid and ribonucleic acid (RNA) function within the cell. Thesewere •cudied in several tissues of the intact mouse after infection witheither Diplococcus pneumoniae or the Trinidad strain of VEE; similar studieswith VEE were conducted in cultured tissue cells. It was possible to showdifferences in the direction of change in RNA and protein metabolism due toeither the bacterial or viral infection. In addition, VEE infection ofcultured cells was shown for the first time to be associated with induccionof a new viral RNA synthetase; present techniques have not permitted identi-fication of this enzyme in the intact animal host.
Studies of staohylococcal enterotoxin reveal that it is highly anti-genic although the rate of antibody formation is slow. There appears tobe a relatioaship between the level of circulating antibody and degree ofresistance to enterotoxin in primates. Staphylococcal enterotoxin diffarsfrom bacterial endocoxins since pyrogenic Lolerance as measured by reti,:ulo-endothelial system reactivity is transient. Whcn animals are pyrogenicdllyrefractory they react much less to intradermal injection of enterotoxinThese studies have broad implications nrid suggest that antibody inhibit,skin reactivity.
The Commission, through the University of Maryland contract, hasextended the studies relating to the protective efficacy of typhoid vaccineand pathogenesis of the disease. Typhoid vaccine K (acetone preserved) andL (phenol iiactivated,, protected volunteers against a 'ow infectious chal-lenge of IO,OCO bacilli '-pected to produce illness in 25% - 1D 2 5 ).Aerosol exposure to ;in !D25 of Salmonella t. hoa failed to induce illness.This saggests ' u the respiraro-v tract is not a site of invasion. Pene-tration thr,,g! plla-yngeai or tonsillar tissue aprears to be an unlikelymode of entry. >vpboid bacilli survive for 45 mim or more in the stomach.
Organisms apparently multiply in the intestinal lumen and penetrate themucosa. The lamina propria of the small intestine shows mild inflammatorychanges during the incubation period after large oral inocula. Minimalchanges occur after an ID2 5 dose. Bacterial interference as a human hostdefense mechanism has been shown by studies with antibiotics given befoieinfectious challenge. Nonabsorbable antibiotics reduce the numbers ofintestinal bacteria altering the pH. Under these circumstances smallernumbers of bacilli cause clinical illness. Further interference studiesare in progress.
The extensive studies of the effect of bacterial endotoxin in animalsand human subjects show that during active infection with S. typhosa w.anacquires increasing hypersensitivity to the endotoxic component of themicrobe. Intradermal testing with purified S. typhosa during illnessreveals intensified 24-hr inflammatory lesions wý-n compared to controlpreinfection responses and intravenous injection of the endotoxin elicitsmarkedly hyperreactive pyrogenic responses and subjective toxic responseq.The endotoxin tolerance mechanisms possessed by normal man remain intact.The repeated administration of endotoxin intermittently or by continuousintravenous infusion causes tolerance to develop rapidly within the frame.work of the hyperreactive state. In spite of marked activation of thesetolerance mechanisms, the febrile and toxic course of the disease remainsunchanged indicating that endotoxemia does not account for the sustainedillness. Although endotoxemia may not account for sustained illness, therelease of a relatively small bolus of endotoxin into the circulationduring typhoid fever (or upon institution of appropriate antibiotic therapy),could readily induce an abrupt intensification of the febrile and toxicstate in the hypersensitive host.
The vaccine trials ind.i!cate that the conventional typhoid vaccinesare effective in protecting man against low infecting doses which mightbe expected in a water-borne exposure but would provide no protectionfrom an exposure resulting from the consumption of heavily contaminatedfood containing more ti.an 10,000,000 viable typhoid bacilli. Apparentlythe Vi antigen per se is not responsible for stimulating the protectiveantibody. Mechanisms involved in vaccine-inuuced resistance are notunderstood.
In conducting the research described in this report, the investigatorsadhered to the "Guide for Laboratory Animal Facilities and Care," as promul-gated by the Committee on the Guide for Laboratory Resources, NationalAcademy of Sciences-National Research 'ouncil.
In these studies the strictest standards which apply to human subjectsas volunteers were adhered to.
xi
The Executive Meeting was devoted to henring of the progress in thestaphylococal enterotoxin B program and the need for evaluating severalvaccines; VF.E, EV plague, and Rocky Mountain spotted fever. The spottedfever vaccine studies will be conducted in collaboration with theCommi1ssion on Rickettsial Diseases.
Colonel Dan Crozier presented a paper describing the program of thisCommission to the Association of Military Surgeons on 9 November 1966. The1967 meeting of the Commission, Efcheduled for 7 and 8 September, will focuson a discussion of metabol!, changes in infectious ciseases,
Theodore E. Woodward, M.D.DirectorCommission on Epidemiological Survey
CLINICAL STUDIES OF VENEZUELAN EQUINEENCEPHALOMYELITIS VACCINE STUDIES IN MAN
Aristides C. Alevizatos, Captain, MC*
This project was designed primarily for the purpose of investigating thepossible secondary transmissibility of attenuated Venezuelan equine encephalo-myelitis (VEE) virus. While carrying this objective there was opportunityalso to study in detail for the first time the clinical effects of thisatten-ated strain of VEE virus in man. Although it has been used routinelyfor immunization of at-risk personnel, the clinical syndrome it causes hadheretofore not been studied in a carefully documented fashion.
Forty young healthy male volunteers without prior VF? virus experiencewere inoculated on day 0 with 5,000 guinea pig median ii. rsp;ritoneal infec-tious doses (GPIPID5 o) of live attenuated VEE virus vaccine (Lot TC 83/3-2 L3)YClinical evaluation of the patients was accomplished et least twice dailythroughout hospitalization. Appropriate laboratory studics including electro-cardiograms (EKG) were performed daily on all subjects, Dai:i electro-encephalograms (EEG) were obtained on 8 of the 40. HeparinizeL- hlood forvirus assay was drawn from each man at 12-hr intervals and frozen. Bloodfor hemagglutination inhibiting (HI) antibody titer against VEE virus wasdrawn from each man daily as well as on days 28 and 45, and frozen fortesting at a later date. Results of the viral and serologic studies arediscussed in the next paper.
Incubation time of reaction was measured from time of vaccination totime of onset of clinical response as determined by a sustained temperaturerise to > 100 F rectally. There were two distinct incubation periods, oneearly, ranging from 12-64 hr postvaccination, the other late, averaging 8days.
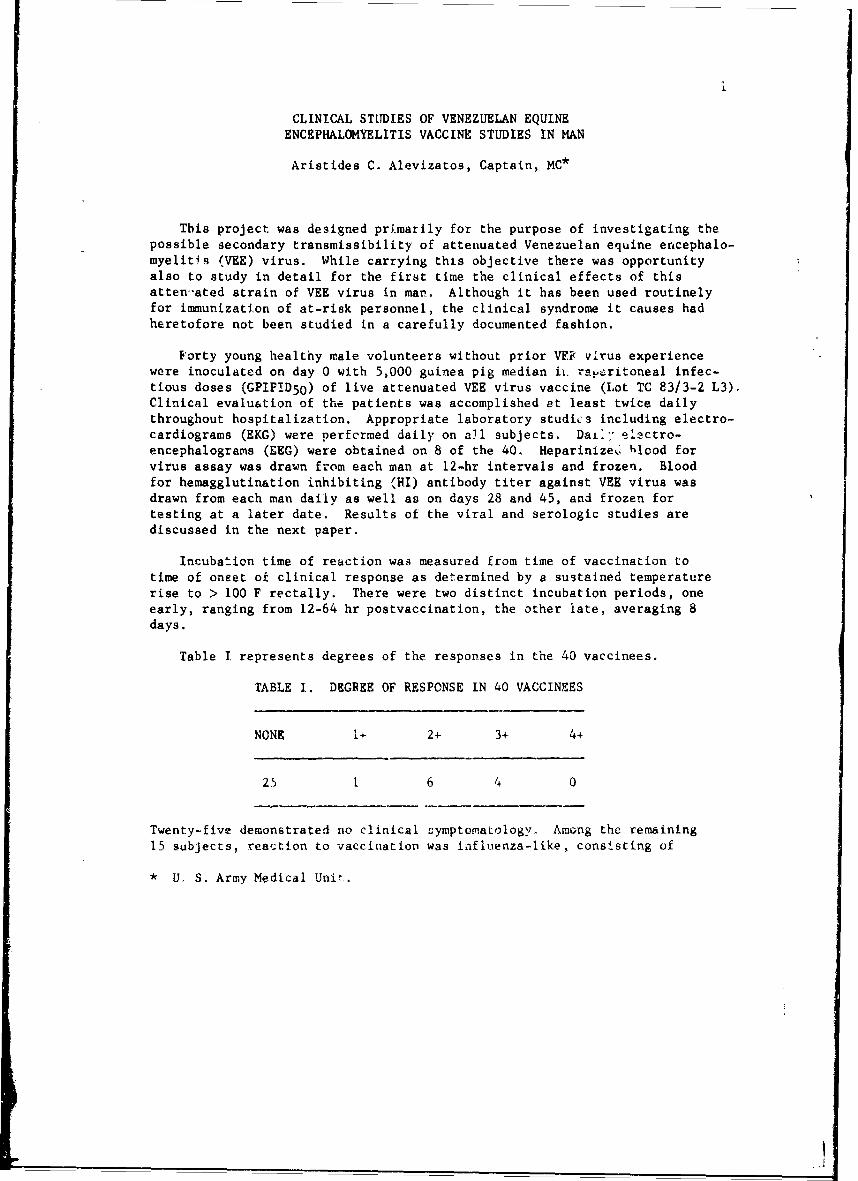
Table I represents degrees of the responses in the 40 vaccinees.
TABLE I. DEGREE OF RESPONSE IN 40 VACCINEES
NONE 1+ 2+ 3+ 4+
25 1 6 4 0
Twenty-five demonstrated no clinical SymptonaLology. Among the remaining15 subjects, reaction to vaccination was tifluenza-like, consisting of
* U, S. Army Medical Unit.
2
headache, myalgia, and malaise aj well as 3poradlc complaints of sorethroat, nausea, and anorexia. There was a paucity of significant physicaltindings. The symptomatic response to vaccination it, these is was arbi-trarily graded on a scale of 1+ to 4+. None warranted a 4+ rating. Fourwarranted a 3+ rating. Though these 4 men preferred to remain in bed andwere quite uncomfortable, their picture was not one of toxicity such as isseen in volunteers ill with tularemia. The duration of their symptoms wasapproximately 36 hr; recovery was characterized by a rapid rebound to usualstates of health. Six received a 2+ rating and 5 rated 1+. Those with 1+continued their usual activities without difficulty.
The rectal temperature exceedel 101 F in 14 vaccinees and usuallycorrelated in time with the subjective symptomatology. Duration oftemperature elevation ranged from 4-72 hr with an average of 22k. Onlysymptomatic treatment was given, Recovery was spontaneous and withoutcomplication in all subjects. Of interest is the finding that 5 subjectsexperienced a diphasic type of reaction, with clinical response occurringin the early postvaccination period and again during the later peak periodof onset of response. The second of these two responses was usually themore marked.
Ancillary laboratory studies are shown in Table II and were performeddaily on all subjects. The EEG data revealed no significant abnormalities.One person who had an abnormal baseline had transient changes which returnedto his own baseline pattern. The amino acid findings are discussed in alater paper by Dr. Feigin.
TABLE II. ANCILLARY LABORATORY STUDIES
Hemoglobin Alkaline phosphataseHematocrit Serum glutamic oxalacetic transaminaseSedimentation rate Serum lactic dehydrogenaseC-reactive protein Serum bilirubinWBC and differential Creatinine
Amino acid analysisElectrocardiogramChest x-ray (days 2 and 7)Electroence;phalograms (daily on 8 subjects)
With the exception of the white blood cell counts and EKGs, all laboratorystudies were normal.
A transient leukopenia (defined as less than 4,000 WBC/cmm) was demon-strated in 16 vaccineeF, This was predominately a neutropenia whichspontaneously iturned '.o normal within several days in all cases. Therewas no correlation between clinical reaction, fever or viremia, and theleukopenia. That is, some subjects who were febrile, clinically symptomatic,
1?
3
with or without demonstrable viremia and manifebted leukopenia, while otherswere as ill with or without demonstrable viramia and did not manifest leuko-penia. Others without clinical response, fever or demonstrable viremia, didmanifest leukopenia.
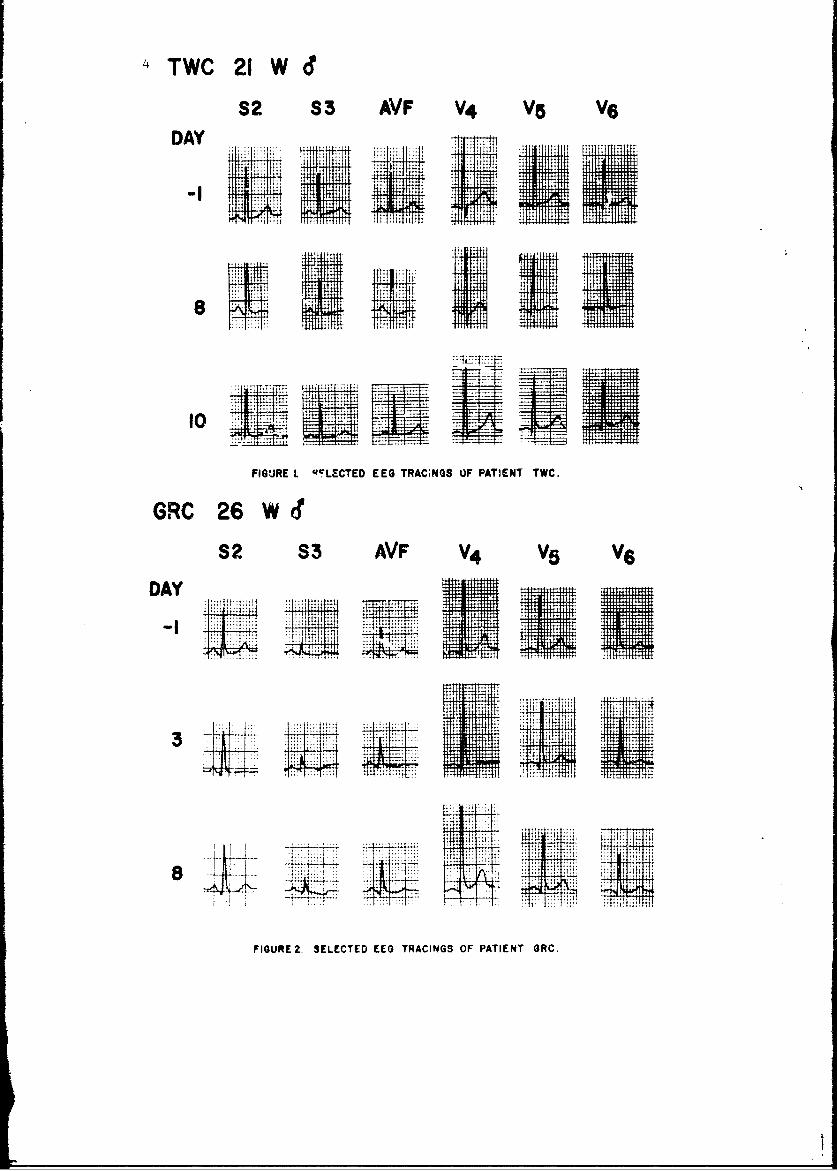
Transient EKG changes were noted in 19 of 40 vaccinees. These changeswere diminution or inversion of the T wave of the complex, and interestinglyenough were invariably found in standard leads 2 and 3, lead AVF, and occas-ionally in the lateral precordial leads. In Figure I are shown selectedtracing of the EKG of TWC, a patient whose response clinically rated 2-4- andwho had fever up to 102.6 F but did not manifest demonstrable viremia. Day -1represents the preinoculation tracing. The second tracing demonstrates themaximum alteration of his EKG pattern, with an eventual return to the originalpattern as shown in the third tracing.
Figure 2 presents selected EKG tracing of another patient, GRC, who waswithout clinical symptomatology or fever, but who had demonstrable viremia.Again we note changes in the T waves in the inferior and lateral leads, withreturn to the original pattern. In all cases these changes were transientand were usually of 3-5 days duration. Again there was no positive ornegative correlation to clinical symptoms, fever or demonstrable viremia.Eight of these 19 subjects with EKG changes were never clinically symptomaticor febrile.
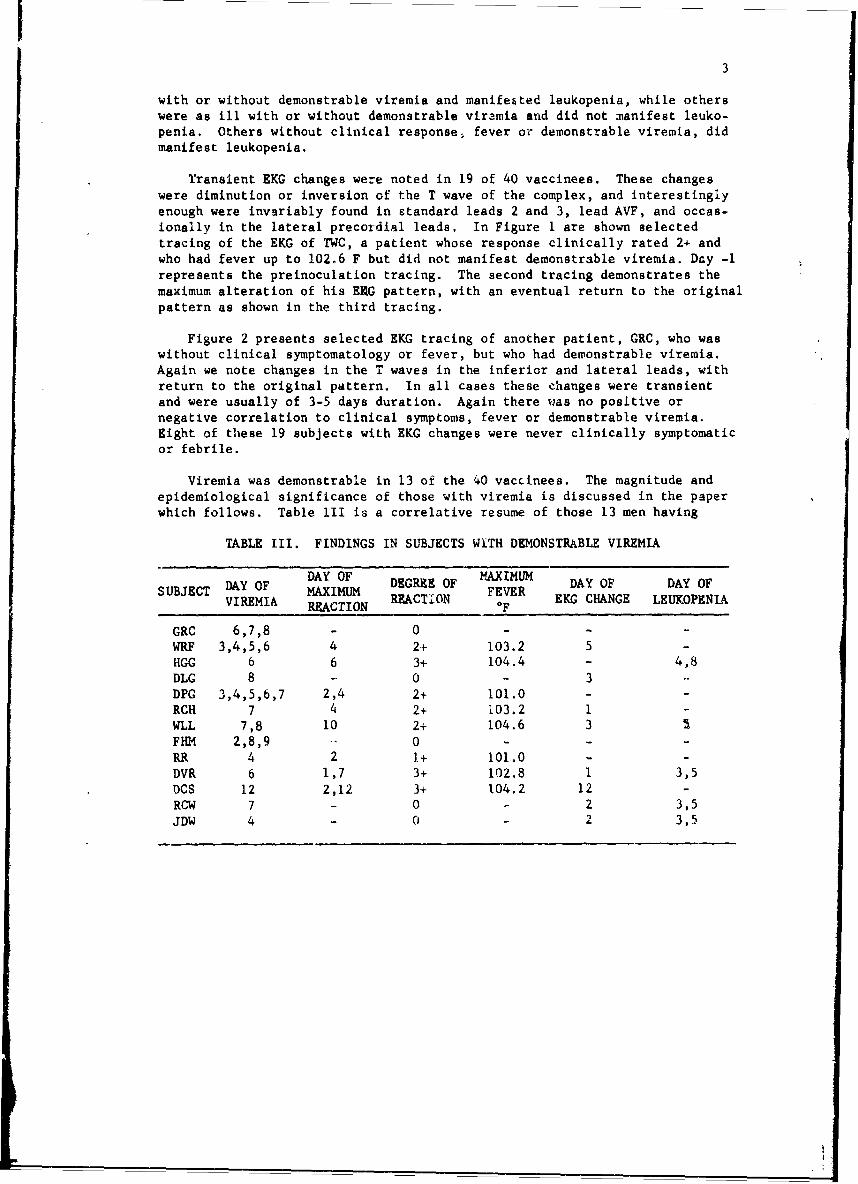
Viremia was demonstrable in 13 of the 40 vaccinees. The magnitude andepidemiological significance of those with viremia is discussed in the paperwhich follows. Table III is a correlative resume of those 13 men having
TABLE III. FINDINGS IN SUBJECTS WITH DEMONSTRABLE VIREMIA
DAY OF DAY OF MAXIMUM DAY OF DAY OFSUBJECT MAXIMUM DEGREE OF FEVER EKG CHANUOFVIREMIA REACTION REACTION F EKG CHANGE LEUKOPNIA
GRC 6,7,8 - 0 - - -
WRF 3,4,5,6 4 2+ 103.2 5 -HGG 6 6 3+ 104.4 - 4,8DLG 8 - 0 - 3 -
DPG 3,4,5,6,7 2,4 2+ 101.0 - -
RCH 7 4 2+ 103.2 1 -
WLL 7,8 10 2+ 104.6 3FHM 2,8,9 - 0 - - -
RR 4 2 1+ 101.0 - -DVR 6 1,7 3+ 102.8 1 3,5DCS 12 2,12 3+ 104.2 12 -RCW 7 - 0 - 2 3,5
JDW 4 - 0 - 2 3,5
S2 S3 OVF V4 V5 V6DAY
ININ0iFIUELydTDEG RCNSO PTETTC
FIGURE. L SELECTED EEG TRAC;NOS OF PATIENT GRC.
5
demonstrable viremia. Note that 5 of these 13 with demonstrable viremia hadno significant symptoms or fever, and only 8 of those 13 subjects with sympto-matic rasponses to vaccination had demonstrable viremio. The earliest demon-strable viremia was at 60 hr, while the most distant in time was 12 dayspostvaccination. Several aubjects had viremia demonstrable on multipleoccasions and the total number of positive blood specimens from these 13 sub-jects was 28. Again as can be seen here, there was no correlation betweensymptomatology or fever and demonstrable viremia, For example, GRC has 4positive blood specimens for viremia (2 on day 7) but manifested no symptomsor fever, and likewise had no EKG changes or leukopenia. HGG had symptomsand fever at the time of his demonstrable viremia, but his leukopenia didnot correiate in time with his viremia. DPG had symptoms during his viremiabut continued to manifest viremia after his clinical symptomatology hadresolved. WLL however had no symptoms until 2 days after his demonstrableviremiao DCS is of interest in that his viremia was the most distant intime of thcse demonstrated. Also he was the only one of those who experienceda diphasic reaction whose first episode was more marked in symptomatology thanthe second.
Thus again there was no correlation batwee•i clinical rtspoalse or fever,and demonstrable viremia.
SUMMARY
Forty volunteers were immunized with live attenuated VEE viruc and evalu-ated closely from clinical, taboratory, virologic, and serologic standpoints.Some degree of reaction was noted in 37.5% of these individuals with 107 ol.them having 3+ reaction. Viremia was demonstrable in 32.5%; 47.57 had trans-inet EKG abnormalities; 40% had transient leukopenia. There was no consistcntpositive or negative correlation between any of these responses or combinationof responses.
• I
7
VENEZUELAN EQUINE ENCEPHALOMYELITIS VACCINEVIREMIA STUDIES IN MAN
Robert W. McKinney, Lt Colonel, MSC*
As has been indicated in previous reports to this Commission,l_2/ use ofthe live attenuated Venezuelan equine encephalomyelitis (VEE) vaccine forimmunization of man has been restricted to periods when mosquitoes are absentfrom the environment. This restriction was established because of the demon-strated capacity of the virus to regain virulence on serial intracerebralpassage in mice and because if evidence that viremia occurred in man followinginoculation of the vaccine.
Before presenting the results of a recent study designed to determinethe duration and level of viremia in persons inoculated with the vaccineresults of earlier studies bearing on this question are reviewed.
In the initial study-/ two species of mosquitoes, Aedes triseriatus andAtdes aegypti, were employed to study infection and tranismission of attenu-ated VEE by mosquitoes. A. triseriatus was selected because of its highdegree of susceptibility to infection with the virulent Trinidad strain ofVEE virus as well as its capacity to transmit this agent.
Two techniques for feeding of the mosquitoes were employed- (1) directfeeding on guinea pigs infectcd with attenuated virus and (2) feeding by"hanging drop" utilizing a suspension containing the virus, and guinea pigerythrocytes in I M sucrose.
In attempts to infect A. triseriatus on guinea pigs inoculated with theattenuated virus, none of the mosquitos became infected. Mosquitoes weretested immediately after feeding and after a period of incubation. Theguinea pigs employed had viremia levels of 1.7 logs. Subsequent studiesshowed the peak viremia obtained in all guinea pigs infected with theattenuated virus to be less than 102 guinea pig intraperitoneal immunizingdose 50 (GPIPID5 0 )/ml of blood regardless of the quantity of virus inoculated.Because the observed levels of viremia were significantly below the thresholdvalue for Trinidad strain VEE virus in A. triseriatus this method was aban-doned and the"hanging drop" uechnique employed.
Attempts to infect A. triseriatus by the "hanging drop" method utilizeda I M surcrose solution containing nornml guinea pig erythrocytes andattenuated virus. The virus titer of th:s suspension was 6.8 logs. Resultsare presented in Table I.
* U. S. Army Medical Unit.
8
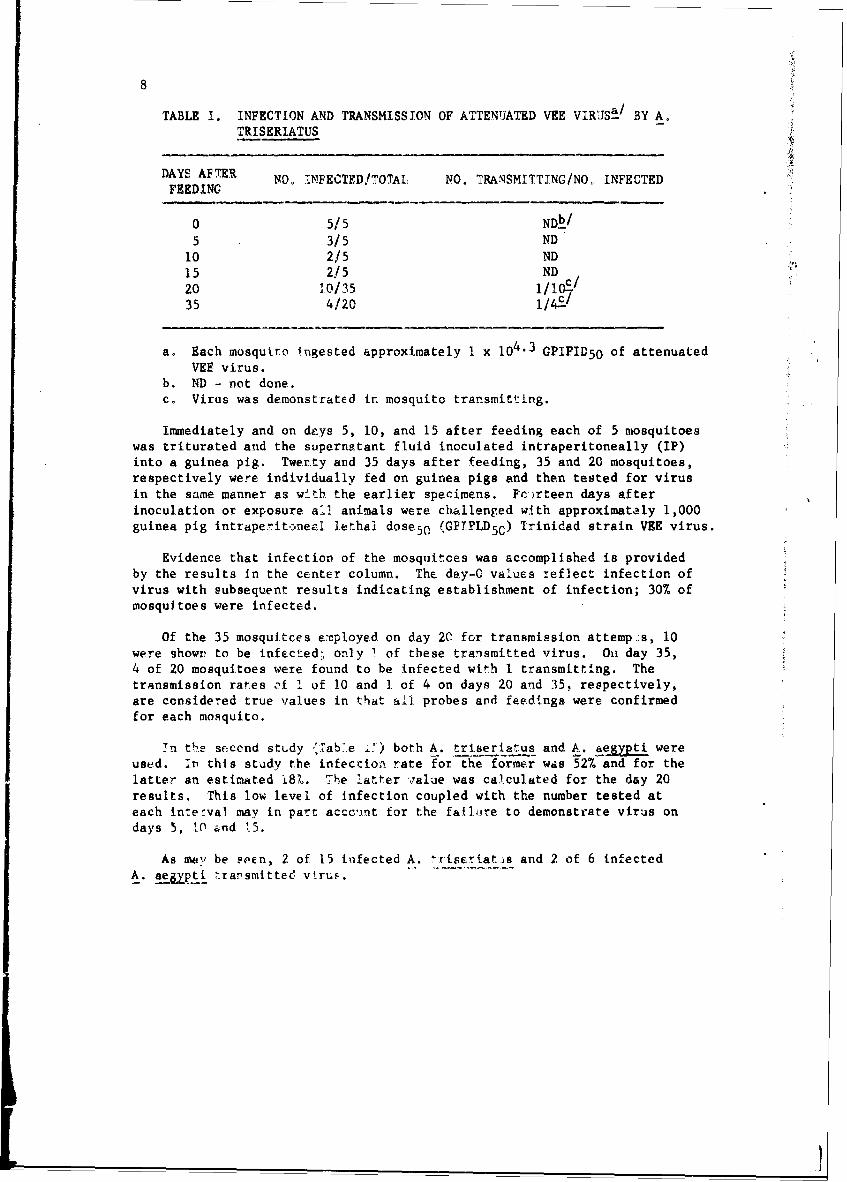
TABLE I. INFECTION AND TRANSMISSION OF ATTENUATED VEE VIRUSý/ BY A.TRISERIATUS
DAYS AFTER NO, INFECTED!TOTAL NO. TRANSMITTING/NO, INFECTEDFEEDING
0 5/5 ND/5 3/5 ND
10 2/5 ND15 2/5 ND20 01/35 1/1O:.'
35 4/20
a. Each mosqutto ingested approximately I x 104. 3 GPIPID5 0 of attenuatedVEE virus.
b. ND - not done.c. Virus was demonstrated in mosquito transmitt:ing.
Immediately and on deys 5, 10, and 15 after feeding each of 5 mosquitoeswas triturated and the supernatant fluid inoculated intraperitoneally (IP)into a guinea pig. Twenty and 35 days after feeding, 35 and 20 mosquitoes,respectively were individually fed on guinea pigs and then tested for virusin the same manner as w-th. the earlier specimens. Foxrteen days afterinoculation or exposure all animals were challenged with approximately 1,000guinea pig intraperitoneal lethal dose 5 0 (GFIPLD5 0 ) Trinidad strain VEE virus.
Evidence that infection of the mosquitoes was accomplished is providedby the results in the center column. The day-O values reflect infection ofvirus with subsequent results indicating establishment of infection; 30% ofmosquitoes were infected.
Of the 35 mosquitces employed on day 20 for transmission attemp-s, 10were shown to be infected-, only 1 of these transmitted virus. Oi day 35,4 of 20 mosquitoes were found to be infected with I transmitting. Thetransmission rates of I of 10 and 1. of 4 on days 20 and 35, respectively,are considered true values in that all. probes and feedings were confirmedfor each mosquito.
in the second study {."ab.e ',) both A. triseriatus and A. ae.x.t wereused. :n this study the infectioA rate for the former was 52% and for thelatter an estimated 181. The latter value was calculated for the day 20results. This low level of infection coupled with the number tested ateach inte~val may in part acco-int for the faf]ore to demonstrate virus ondays 5, 10 ind 15.
As mev be seen, 2 of 15 infected A. rtiseriatis and 2 of 6 infectedA. aeU2ypt trarsmittee virus.
.1
9
TABLE II. INFECTION AND TRANSMISSION OF ATTENUATED VEE ViRUS2/ BY A.TRISERIATUS AND A, AEGYPTI (ROCKEFELLER STRAIN)
DAYS NO. INFECTED/TOTAL NO, TRANSMITTING/NO. INFECTEDAFTER
FEEDING A. triseriatus A. at• iL A. triseriatuN A. aegpti
0 5/5 5/5 NDt/ ND
5 2/5 0/5 ND NDI0 4/5 0/5 ND ND15 2/5 0/5 ND ND20 15/29 6/33 2 11 55/ 2/6
a. Each mosquito ingested approximately I x IC4 ' 3 GPIPID5 0 of attenuatedVEE virus.
b. ND - not done.c. Virus was demonstrated in mosquitoes tranimittir.g.
It 6hould be noted at this point that none of the animals inoculated withmosquito materials or which were infected following mosquito feeding exhibitedany overt signs of illness. Based on these limited observatLions there was noevidence of a change in virulence of the attenuated virus as the rLsult ofpassage in the mosquito.
The observed infection and transmission rates are low in comparison tovalues obtained by Corristan employing A. triseriatus and the Trinidad strainof VEE virus.i/ Under conditions comparable to thopa emi' yed in these studies;with attenuated virus, including concentrations ot virus, Corristan found 100%became infected with 95% transmitting.
A more direct approach to the 9estion of transmission of the virus bymosquitoes was employed in a study-- conducted at the Ccinmunicable DiseaseCenter by Dr. Telford Work and his staff.
Twelve laboratory personnel scheduled for immunization with the attenu-ated 'JEE vaccine generously volunteered for this study. Each psrson wasadministered 0.5 ml of vaccine which contained approximately 10 GPIPTD 5 0 ofvirus.
Beginning 2 hr postinoc.ation and at 24-hr intervals thernfter for 13days, 35-40 A. triseriatus were allowed to feed on each subject. Feedingswere carried out immediately following collection of a blood sample. Themosquitoes were maintained at a temperatu.re of 80 F and humidity of 75% for18-20 days. During this period the daily blood samples as undiluted and asa 1.:10 dilution of serim were assayed in suckling mice. The results of theseassays were utilized as the basýs fo- ýelectirg the groups of mosquitoeswhich were most ]ikely to be inrected.
.2
10
Mosquitoes which had fed during periods of apparent viremia were per-mitted to feed on guinea pigs and were then frozen for aubsequent testingfor presence of virus. The guinea pigs were held for 30 days at whichtime they were bled for serum and then challenged via the IP route with103.2 median mouse intracerebral lethal doses (MICLD50) of Trinidad strainVEE virus.
A total of 611 mosquitoes were assayed in suckling mice and 344 fed onguinea pigs. Although the mosquitoes fed on the subjects during periodsof apparent viremia, none transmiLted virus, and more importantly, nonewere found to be infected.
The results indicated that vaccinees did not serve as a source of virusfor mosquitoes. However, it was deemed desirable to perform quantitativeviremia assay in order to obtain a better estimate of the potential forvaccinees to serve as a virus source.
In the Medical Unit 2 study groups of 20 volunteers each were estab-lished. Both groups were managed in the same manner with the exceptionthat inoculation of vaccine was accomplished with one group at 0800 hr andwith the second group at 2000 hr, The reason for the difference in timeof inoculation was to permit study of the effect of time of inoculation onchanges in blood amino acids. As will be shown later this difference ininoculation time had no effect on incidence, magnitude or duration ofviremia. The effect on blood aminc acid changes is presented in the nextpaper.
Following collection of appropriate preinocuilation serum specimenseach volunteer was administered 0.5 ml of vaccine containing approximately5,000 GPTPID5 0 of virus via the subcutaneous route.
Beginning 12 hr after inoculation and every 12 hr thereafter for atotal of 7 to 9 days a heparinized blood sample was obtained from eachvolunteer. One ml of the sample was diluted 1:10 in Hank ' s balanced saltsolution and the remainder was placed in a sterile vial. Both sampleswere placed in a freezer at -65 C within 30 min of collection. Additionalsamples were collected as deemed appropriate by the attending physician.Results of serologic studies showed that all 40 persons were infectedas evidenced by a sfigniflcant increase in hemagglutination-inhibitingantibodies.
The diluted sample was employed for qualitative assay. It wasplanned that quantitative assays would be performed on all samples inwhich virus was demonstrable in the 1:10 dilution. The procedure ofdiluting the sample prior to freezing limited each sample to a singlefreeze-thaw cycle.
The q Ctative assays were pericrmed as follows. The sample wasrapidly thawed and each of 4 guiknea pigs weighing 250-350 gm was
I-
11,
inoculated IP with 2.0 ml of the sample. Fourteen days after inoculationeach animal was challenged with approximately 1,000 GPIPLD5 o of Trinidadstrain VIE virus. All survivors wcze rechallenged in a like mannerfollowing a 14-day observation period, The double challenge procedurewas employed since other studies in our laboratory have shown that anoccasional normal guinea pig will survive challenge. No explanation forthis is apparent.
Viremia was demonstrated in 13 of the 40 volunteers. Six of thesewere from the group inoculated at 0800 hr with 7 in the 2000 hr group.In 8 of the 13 persons virus was demonstrated in only one sample; in oneperson in 2 samples and in the remaining 4 in 3, 4, 5 and 6 samples.
Quantitative assay were performed as follows. The whole blood samplewas rapidly thawed and serial 10-fold dilutions made beginning at 10-1through 10-3. Each of 4 guinea pigs was inoculated IP with 2.0 ml of theappropriate dilution. Fourteen days after inoculation each animal waschallenged with approximately 1,000 GPIPLD5 0 of Trinidad strain VEE virus.As in the qualitative assay all survivors were rechallenged. After com-pleting several assays it appeared that the maximum dilution of 10-3 wasadequate. However. as will be seen in the results this was marginal for1 sample.
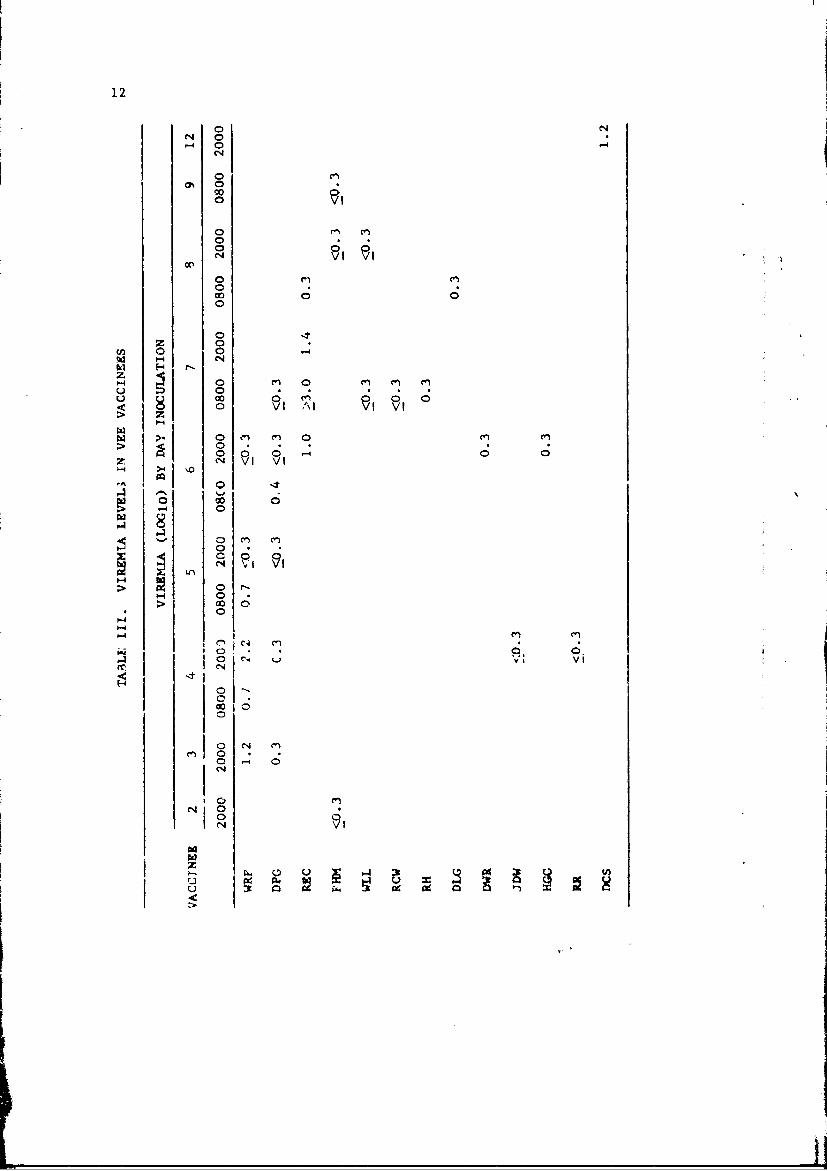
The results of the quantitative assays performed with samples obtainedfrom the 13 persons with demonstrable viremia 3re presented in Table III.The viremia levels are expressed as loglo of virus/ml of blood.
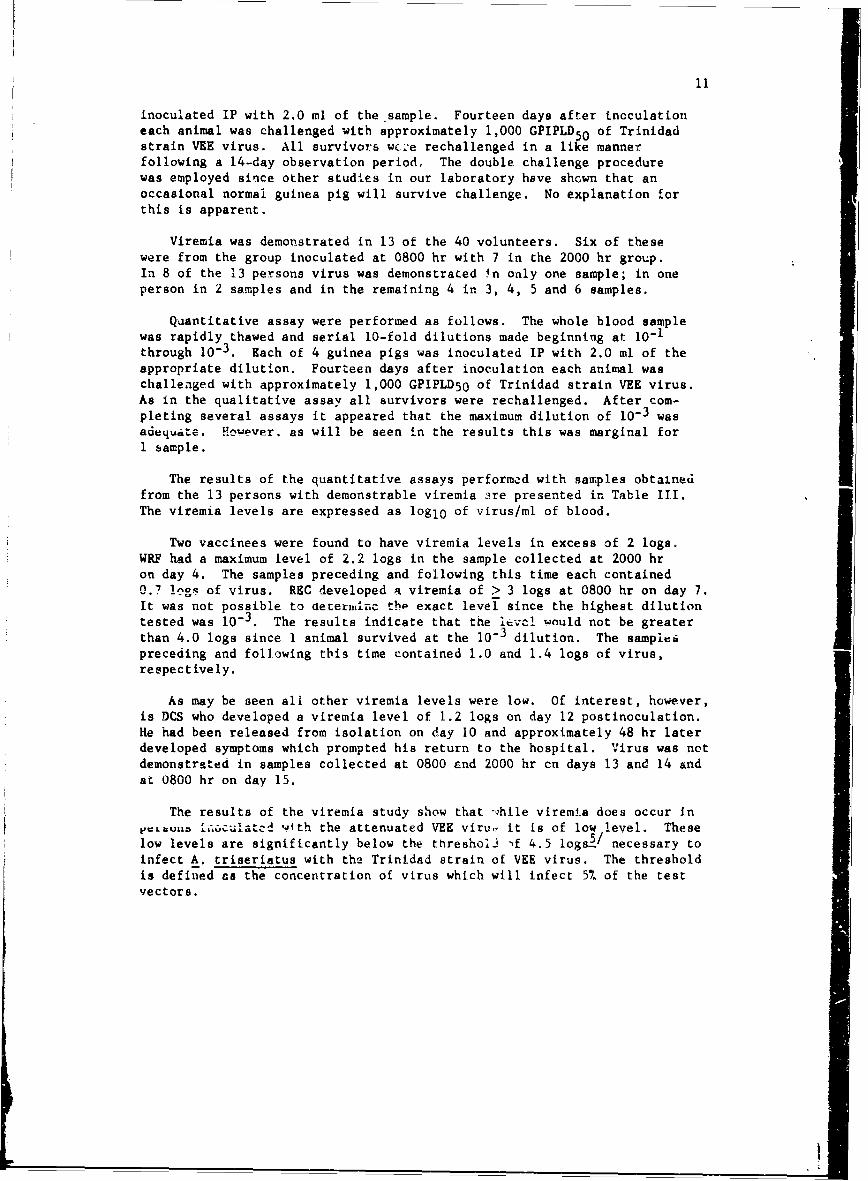
Two vaccinees were found to have viremia levels in excess of 2 logs.WRF had a maximum level of 2.2 logs in the sample collected at 2000 hron day 4. The samples preceding and following this time each contained0.7 logs of virus. REC developed a viremia of > 3 logs at 0800 hr on day 7.It was not possible to aeteeruinc thp exact level since the highest dilutiontested was 10-3. The results indicate that the itvc! would not be greaterthan 4.0 logs since 1 animal survived at the 10-3 dilution. The sampifpreceding and following this time contained 1.0 and 1.4 logs of virus,respectively.
As may be seen all other viremia levels were low. Of interest, however,is DCS who developed a viremia level of 1.2 logs on day 12 postinoculation.He had been released from isolation on day 10 and approximately 48 hr laterdeveloped symptoms which prompted his return to the hospital. Virus was notdemonstrated in samples collected at 0800 and 2000 hr cn days 13 and 14 andat 0800 hr on day 15.
The results of the viremia study show that -.7hile viremia does occur inpcLbvio 1ia culatcd aith the attenuated VEE viru, it is of low level. Theselow levels are significantly below the thresholi if 4.5 logsi/ necessary toinfect A. triseriatus with the Trinidad strain of VEE virus. The thresholdis defined as the concentration of virus which will infect 5% of the testvectors.
12
N 0C-4 0 -
00
co
Go
0 00
00u~0 0I %I-V
> zO
W >4 0 ?n en 0 0n> 0 Vi Avi V
-4.
00
0
1-4
00 C)'0
0 C140.
-C4
-p4
w.
CzL)V
0ulo
13
Further evidence which indicates that the viremi" levels found are inade-quate to infect A. triseriatis was obtained in the study at the CommunicableDisease Center. Two subjects developed viremia of > 2.7 logs in one caseand > 3.0 logs in the other. In neither case were A. triseriptus infectedwhen fed on these persons.
SUMMARY
The data from the artificial feeding study, those froin the direct feedingstudy and those from the viremia study indicate that the pocanvial formosquitoes to be infected by feeding on persons vaccinated with the attenu-ated VEE virus is extremely limited if indeed nonexistent. If any potentialexists it is for only very limited periods as indicated by the peak levelsof viremia found in Lhe 2 vaccinees. Thus, it is proposed that the restric-tion against use of the vaccine during periods when mosquitoes are presentin the environment be lifted.
LITERATURE CITED
1. McKinney, R. W. December 1964. Venezuelan equine encephalomyelitisvaccine. Stitus report. p. 89 to 95. In Commission on EpidemiologicalSurvey, Aanual Report to the Armed Forces Epidemiological Board, FiscalYear 1964. U. S. Army Medical Unit, Fort Detrick, Maryland.
2. McKinney, R. W. February 1966. Review of Virology Division program.p. 115 to 123. in Commission on Epidemiological Survey, Annual Reportto the Armed Forct.s Epidemiological Board, Fiscal Year i965, U. S.Army Medical Unit, Fort Detrick, Maryland.
3. Blair, W. 0., R. W. McKinney, E. C. Corristan. and J. Gilford. I July1963. Hfost-parasite relationships in Venezuelan equine encephalomyelitis1. Afthropod transmis3ion study. p. III to 113. In Annual ProgressReport, FY 1953, U. S. Army Medical Unit, Fort DeErFick, Maryland.
4. Corriatan, E. C. 1966. Personal communication.
5. McKinney, R. W., To H. Work, R. W. Chamberlain, and E. C. Corristan.I July 1964. Host-parasite re.!ationships in Venezuelan equine encephalo-myalitis. IV. Arthiopod transmission. p. 115 to 121. In Annual ProgessReport, FY 1964. U. S. Army Medical Unit, Fort Detrick, Maryland.
i ,
15
CHANGES IN WHOLE BLOOD AMINO ACIDS DURING INFECTION
Ralph 0. Feigin, Captain, MC*
The importance of amino acids in nutrition and their role in the inter-mediaty metabolism of biological systems has been studied extensively. Incontrast, few studies have been performed to evaluate amino acid changes interms of the host's response to infection and/or intoxication. The firstreport of whole blood amino acid chan es during infection in adults appearedin 1940 when Farr and his colleaguest repo-ted a fall in plasma amino acid.nitrogen during pneumococcal pneumonia. The only other study appeared 3years later when Emerson et al- observed that similar changes did not occurwith primary atypical pneumonia.
The results are presented of carefully controlled studies illustratingcha&iges in whole blood amino acid of volunteers infected with respiratoryacquired tularemia and following immunization with live attenuated Venezuelanequine encephalomyelitis (VEE) vaccine. Blood amino acid changes in micefol'owing staphylococcal enterotoxin B (SEB) administration are also presented.
The work to be reported here has employed the chromatographic techniqueof Efron and her co-workers,1/ permitting the analysis of amino acids on 6 pLof whole blood. The proceduie was modified as followsz Ninhydrin stainedchromatograms were dried and developed in a chromatography oven at 110 C for8 min. Each chromatogram was quantitated by densitometric analysis employingan Analytrol RB denditometer to obtain an integrated tracing.
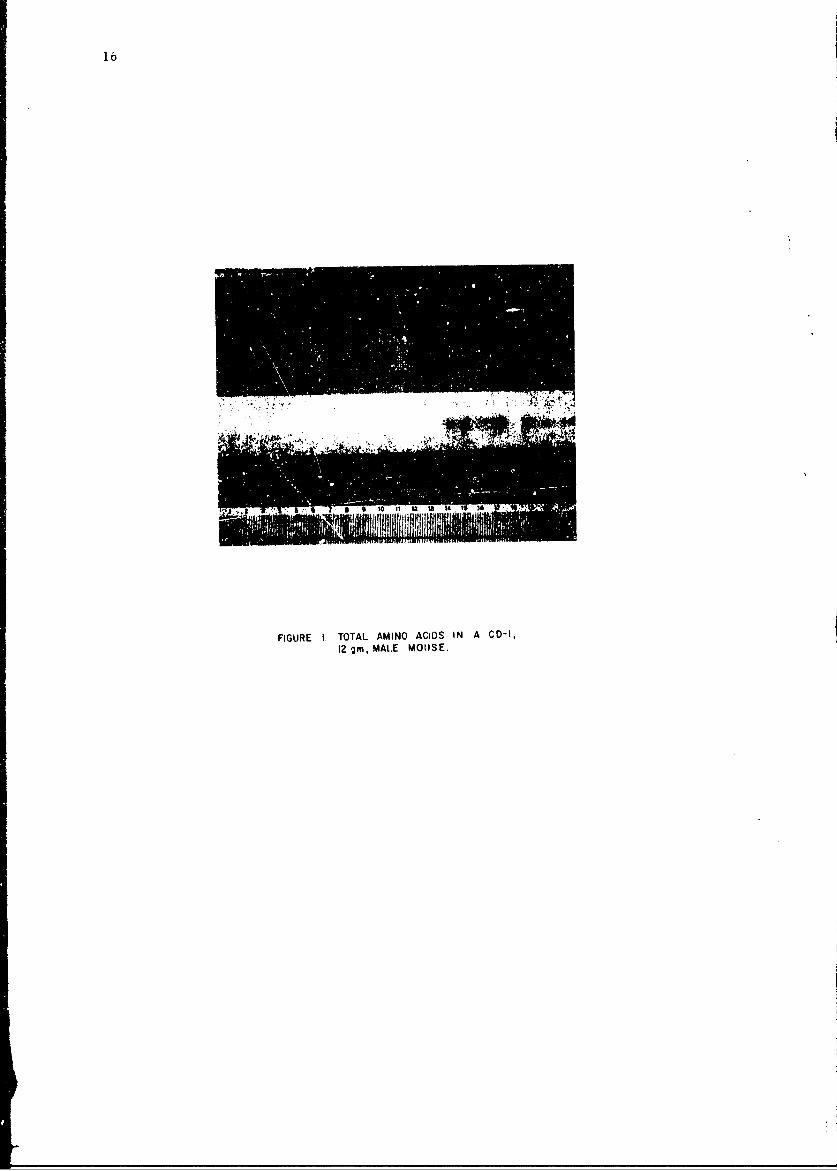
Figure I shows a typical result following chromatography and densito-metry in a CD-I, 12-gm male mouse. The integrated value of each amino aciddetectable as a single spot was converted to 4g/0.006 ml by comparison to astandard curve. Standard curves were prepared by analysis of increasingconcentrations of each amino acid in a similar manner. The summation o'the integrated values of each singly identified amino acid, as well asvalues obtained for amino acid groups, gave a total value that has beenequated with the term total amino acids, The technique permits concurrentanalysis of as many as 60 samples per chromatography tank minimizing changesattributable to methodological variables.
During the course of these investigations it became apparent that whuleblood amino acids in man are not maintained at a constant level throughoutthe day but that a pattern exists such tnat levels at 2000 hr are consistentlyhigher than those obtiined at 080C hr p < 0.05. These conclusions have beenreached on the basis of amino acid analysis of blood obtained from 56 menat 0800, 1400 and 2000 hr on one day and at 0800 hr the following day. Inaddition, specimens from 7 mei. have been obtained at the same time intervalsfor 8 consecutive days and from Z men for 21 consecutive days. These findingshave been confirmed by performing aipha amino nitrogen determinations accordiing
u16
FIGURE 1. TOTAL AMINO ACIDS IN A CD-I,12 gin, MAL.E MOUSE.
17
to the method of Moore and Stein- as well as by amino acid analysis performedby Dr. Mary Efron of the Massachusetts General Hospital, Boston, Massachusetts,utilizing a Technicon amino acid analyzer. Thus, to interpret amino acidchanges during the course of infection, cognizance must be taken of thosechanges which can be attributed to amino acid periodicity.
The effects of respiratory-acquired Pasteurella tularensis infection uponwhole blood amino acids has been studied in volunteers. Sixteen men wereexposed to an average of 25,000 viable SCHU-S4 cells. Two individuals weresham-exposed but not infected. On tL.e day prior to exposure, blood waEobtained by venipuncture from each individual at 0800, 1400 and 2000 hr.Thereafter, blood was obtained at 0800 and 2000 hr daily. Rectal temperatureswere taken every 6 hr from the time of admission until the time of discharge.Following exposure, signs and symptoms of each subject were evaluated andillness categorized as mild or severe.
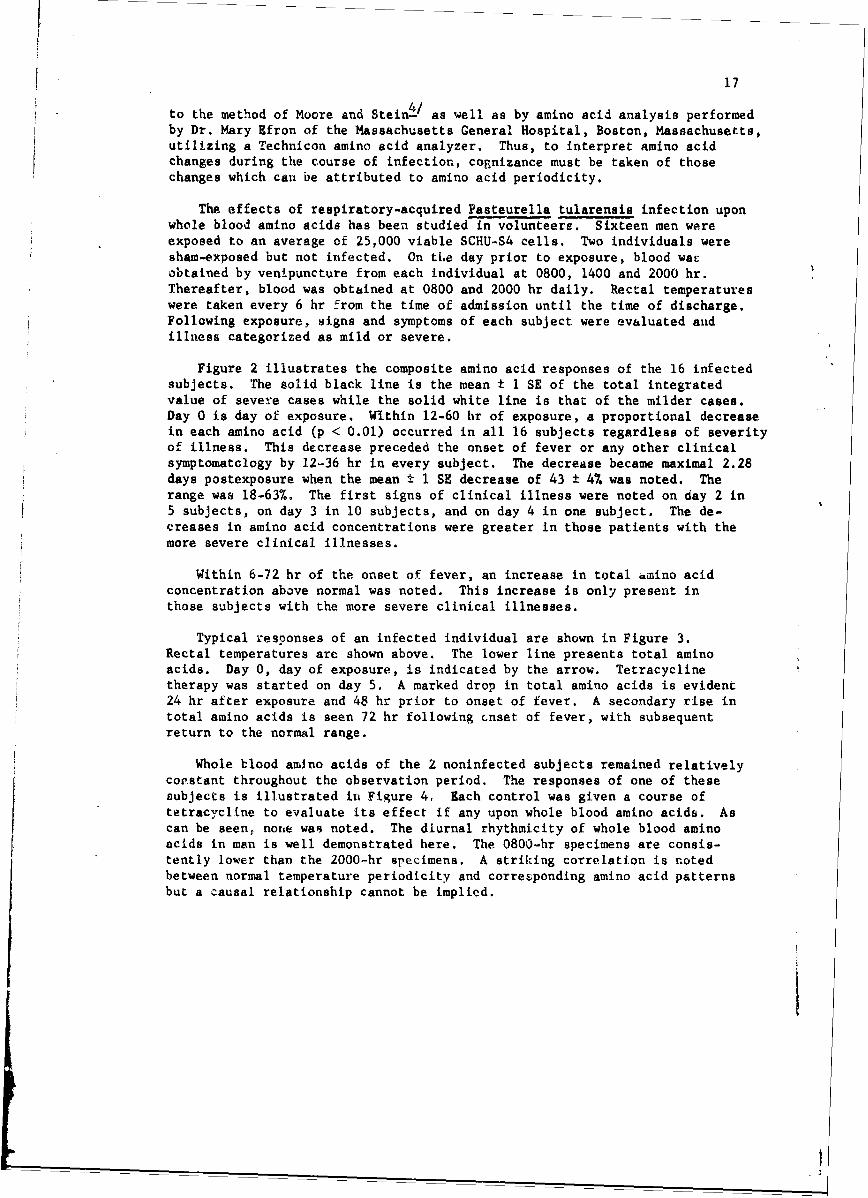
Figure 2 illustrates the composite amino acid responses of the 16 infectedsubjects. The solid black line is the mean ± I SE of the total integratedvalue of severe cases while the solid white line is that of the milder cases.Day 0 is day of exposure. Within 12-60 hr of exposure, a proportional decreasein each amino acid (p < 0.01) occurred in all 16 subjects regardless of severityof illness. This decrease preceded the onset of fever or any other clinicalsymptomatology by 12-36 hr in every subject. The decrease became maximal 2.28days postexposure when the mean ± 1 SE decrease of 43 ± 47. was noted. Therange was 18-63%. The first signs of clinical illness were noted on day 2 in5 subjects, on day 3 in 10 subjects, and on day 4 in one subject. The de-creases in amino acid concentrations were greater in those patients with themore severe clinical illnesses.
Within 6-72 hr of the onset of fever, an increase in total milno acidconcentration above normal was noted. This increase is only present inthose subjects with the more severe clinical illnesses.
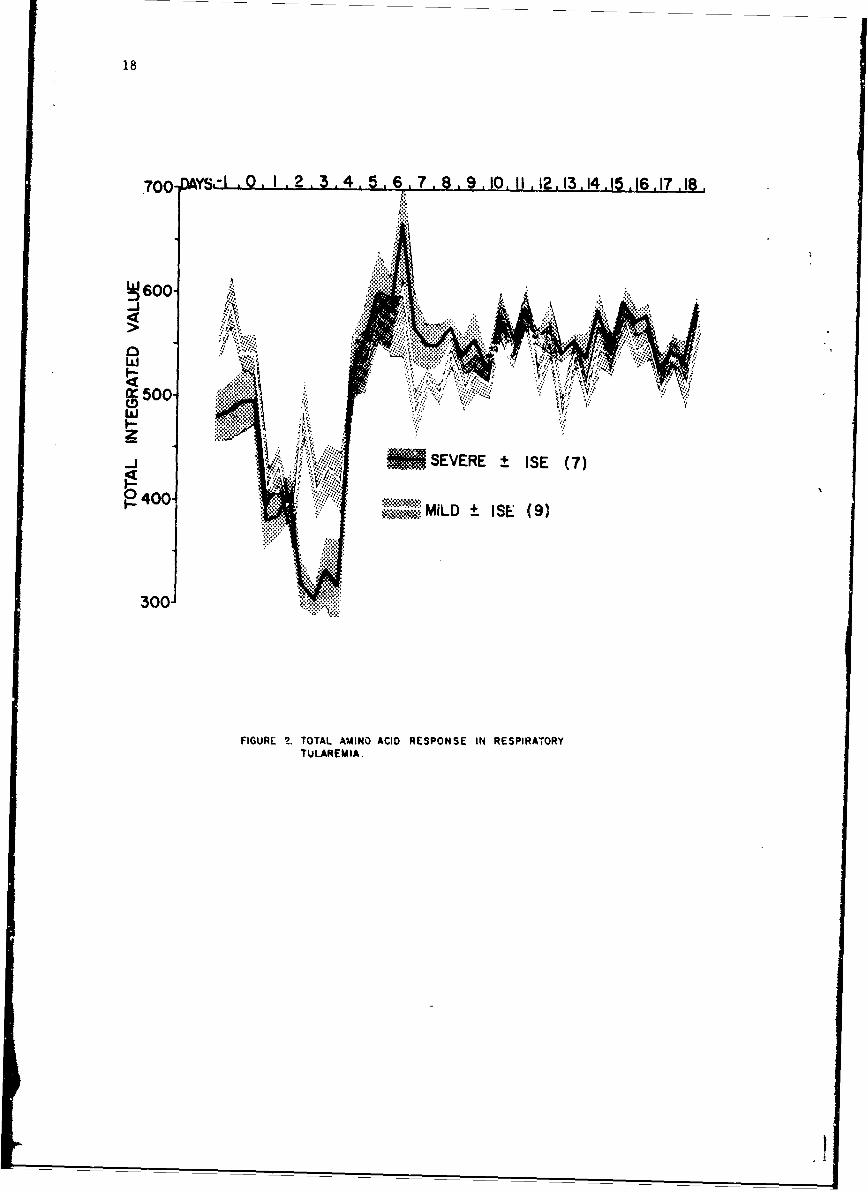
Typical responses of an infected individual are shown in Figure 3.Rectal temperatures are shown above. The lower line presents total aminoacids. Day 0, day of exposure, is indicated by the arrow. Tetracyclinetherapy was started on day 5. A marked drop in total amino acids is evident24 hr after exposure and 48 hr prior to onset of fever. A secondary rise intotal amino acids is seen 72 hr following cnset of fever, with subsequentreturn to the normal range.
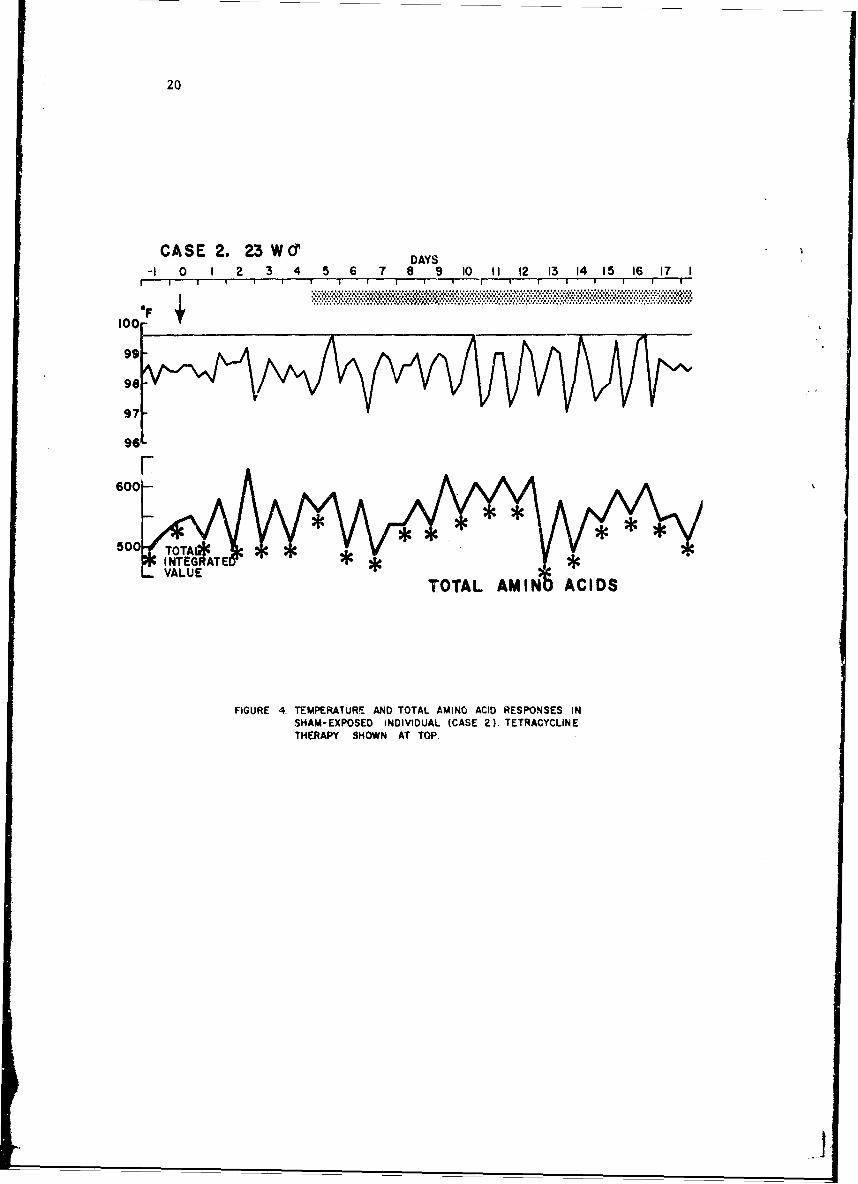
Whole blood amino acids of the 2 noninfected subjects remained relativelycor.stant throughout the observation period. The responses of one of thesesubjects is illustrated in Figure 4, Each control was given a course oftetracycline to evaluate its effect if any upon whole blood amino acids. Ascan be seen, none was noted. The diurnal rhythmicity of whole blood aminoacids in man is well demonstrated here. The 0800-hr specimens are consis-tently lower than the 2000-hr specimens. A striking correlation is notedbetween normal temperature periodicity and corresponding amino acid patternsbut a causal relationship cannot be implied.
I
18
700 ye- 0., 1 .2. 3. 4. 5. 6.7. 8, 910. 1.12,13.14.51.7.8
~600-
500
SEVERE +ISE (7)
300iFIGURL ?.TOTAL AMINO ACID RESPONSE IN RESPIRATORY
TUJLAREM IA.
19
CASE II. 23W06DAYF
-I 0 I 2 3 4 5 6 7 8 AV 10 II 12 13 14 15 16 17 1! I I ! ! | - - I I ! I ! I I
104
103-
102-
101
100
99
98
97
96700-
600
500
400-
TOTA LI NTEGRATED
30 0 L VALUE TOTAL AMINO ACIDS
FGURE 3. TEMPERATURE AND TOTAL AMINO ACID RESPONSTSIN RESPIRATORY TULAREMIA (CASE II). TETRACYCLINETHERAPY SHOWN AT TOP. *AT 0800 HRSAMPJING TIME.
20
CASE 2. 23 Wd DAY
-1 0 1 2 3 4 5 6 7' 8 9 10 11 12 13 14 I5 16 17 I
1001
The factors reponsible for the decrease in amino acid concentrationare not readily apparent. Beisel's work.5/ as well as our own revealed adiminished urinary excretion of amino acids during the period of time thatblood amino acid concentrations were lowest, therefore, low b~ 9 od levelcould not be accounted for by urinary losses. Woodward et al8 observedthat cystine, an essential metabolite for P. tularensis, disappeared fromt~ie blood of rats infected with highly virulent strains of the organism,He also noted lesser decreases in the concentrations of other amino acids.In contrast, killed or living avirulent organisms did not induce similarchanges. Woodward hypothesized that localization of this organism withinthe liver and spleen might result in utilization of free amino acidsdirectly from the blood as it filtered through these organs. Whether thereduction in whole blood amino acids in man infected with tularemia couldbe explained by this hypothesis is speculative. However, our findings ofa proportional rather than selective decrease in cystine suggest thatother factors might be operative.
Sigxificant increases in beta and gamma globulins as well as associateddecreases in blood ure8 nitrogen, nonprotein nitrogen, and serum albuminhave been described by Sbarra et a1. within 24 hr of tularemia infectionin rats. Cognizant of these early changes in animals, it is attractive tospeculate that P. tularensis in man has initiated similar metabolic changesresulting in utilization of whole blood amino acids for new protein syn-thesis. Confirmation of this hypothesis will require additional study.
Increased excretion of glucocorticoids during human tularemia infectionwas demonstrated by Beisel- to occur with the onset of fever and to abateconcomitantly with clinical improvement. Furthermore, during infection,adrenal over activity was roughly proportional to the clinical severityof the disease process. The catabolic effect of glucocorticoids on bodyprotein is well known. Amino acid increases were seen following fever inour subjects with the moie severe clinical illnesses. This rise in aminoacids following fever might be the result of a steroid catabolic effect.
A second study was undertaken to evaluate what effect, if any, a viralinfection might have upon blood amino acids.
The existence of diurnal periodicity of whole blood amino acid concen-tration coupled witb observations in the literature that animals exposedto the same dose of a toxin at different times during the day showed widelydifferent mortality rates, prompted us to study the effect of immunizationupon blood amino acids in volunteers at 2 time periods. This was incor-porated into the study described in the previous two papers.
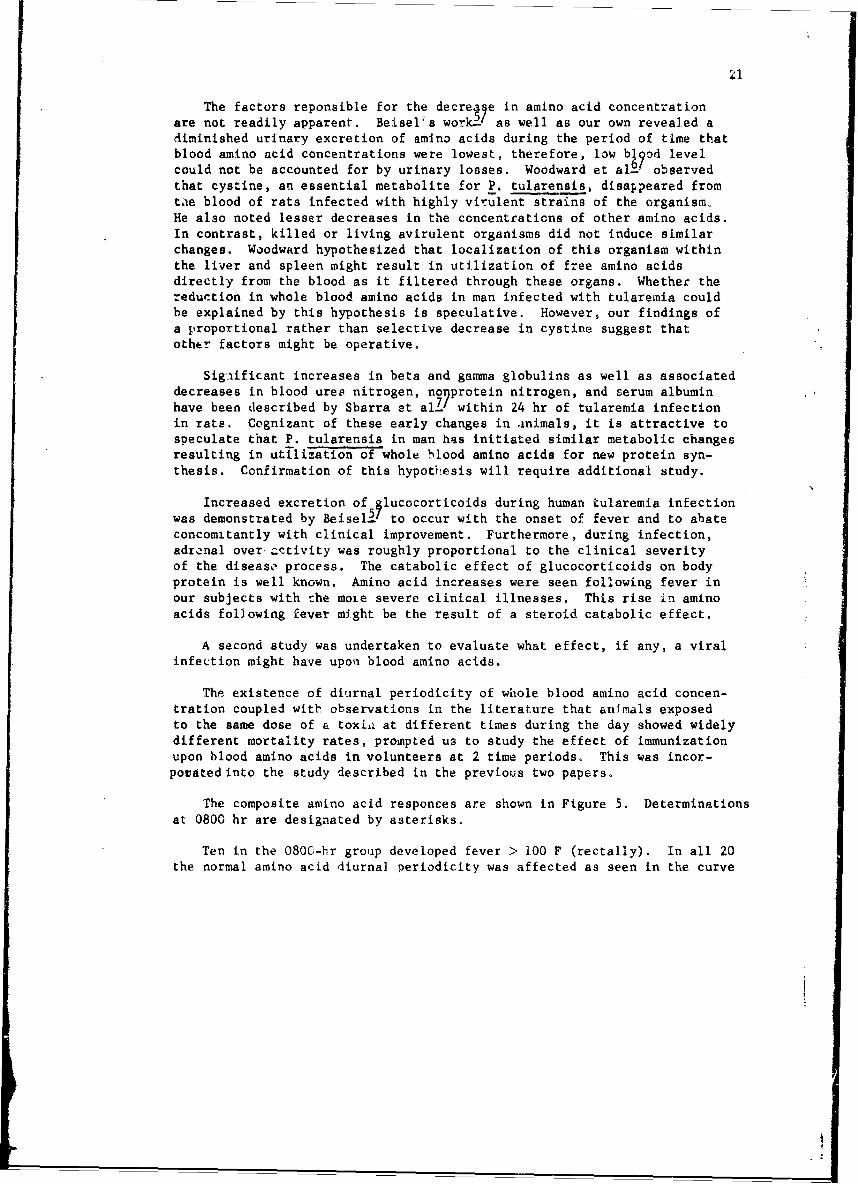
The composite amino acid responses are shown in Figure 5. Determinationsat 0800 hr are designated by asterisks.
Ten in the 080C-hr group developed fever > 100 F (rectally). In all 20the normal amino acid diurnal periodicity was affected as seen in the curve
22
DAYS,-' O 1 2.3 .4 5 .6 .7, 8 9 10,i
T 700 *. INOCULATED AT 0800 HR(20)
INOCULATED AT 2000 HR(20)
0: 600-
FIGURE 5. TOTAL AMINO ACID RESPONSE TO VEE IMMUNIZATIONAT 0800 AND 2UO0 HR.* SHOWS 0$OOHR.
SAMPLING TIMES FOR 2000= HR GROUP.
23
with the solid black line. Note the normal rhythmicity preinoculation, withloss of rhythm on day 1, reversal on day 2, normal periodicity on day 3 anda second reversal of rhythm on day 4 prior to resumption of the normalperiodicity.
The curve with the white line shows the composite results of the 20 meninoculated at 2000 hr. Eleven of these subjects developed fever or othersymptomatology at some time during the observation period, All 20 volunteersdeveloped a reversal of their circadian periodicity lasting a minimum of 2days to as long as 8 days. In addition, all manifested elevated amino acidlevels on day 1 and 2 postimmunization and depressed amino acid levels ondays 3-7. The presence of proline was detected in many specimens for thefirst time, its normal concentration being at or below the levels detectableby this system of analysis even when specific isatin stains are utilized.
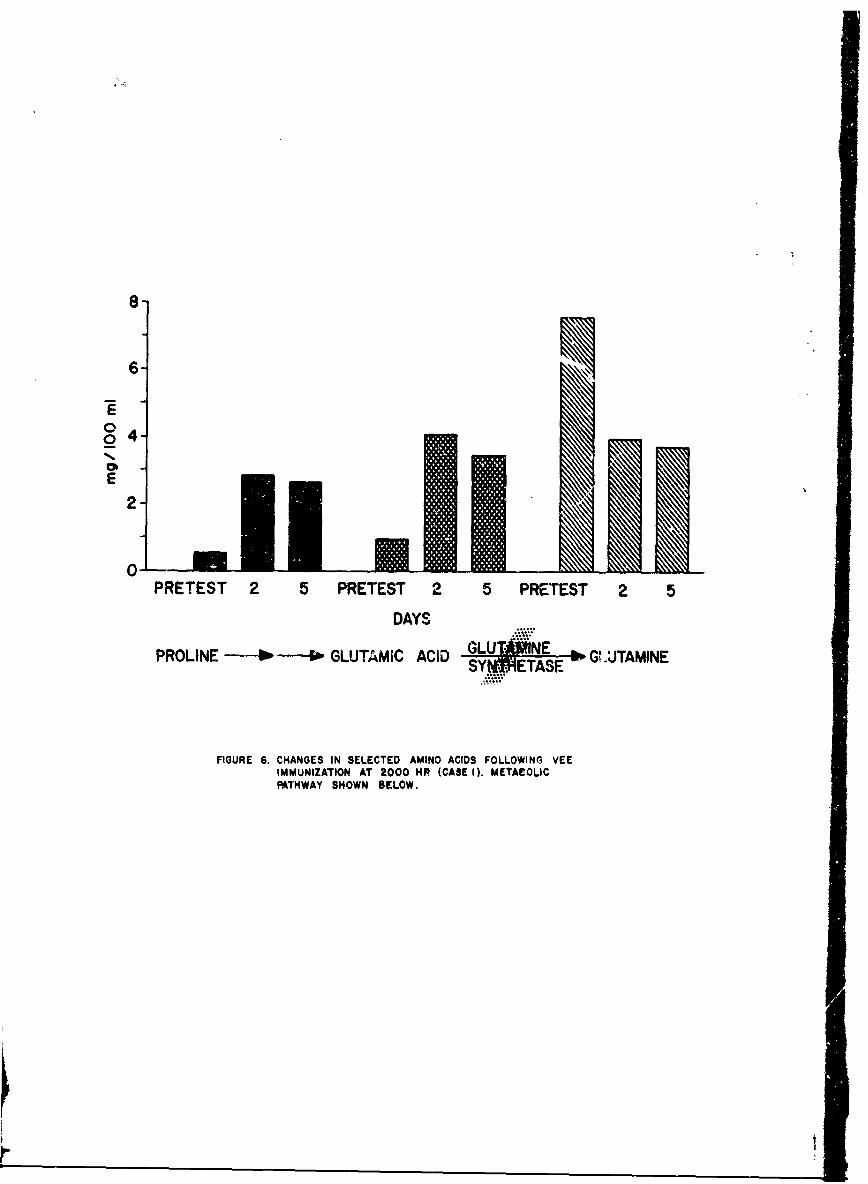
Serum specimens obtained from the 2 individuals whose amino acid changesrepresented the minimal and maximal serum proline increases as determinedin our system, wt~ere subjected to precise quantitation in a Technicon aminoacid analyzer. Large increases in proline and glutamic acid with lesserincreases in citrulline, ornithine and arginine were found. In addition,a striking decrease in glutamine was apparent.
Figure 6 shows the results from the patient with the smallest increasein blood proline. The metabolic pathway is summarized on the bottom of thefigure. Pruline is metabolized to glutamic acid which in the presence ofglutamine synthecase goes to glutamine. A 7-fold increase in proline con-centration is seen from the very low pretest values. Similarly a 4-foldincrease in glutamic acid is apparent. In contrast, glutamine decreasedto 507 of its pretest concentration.
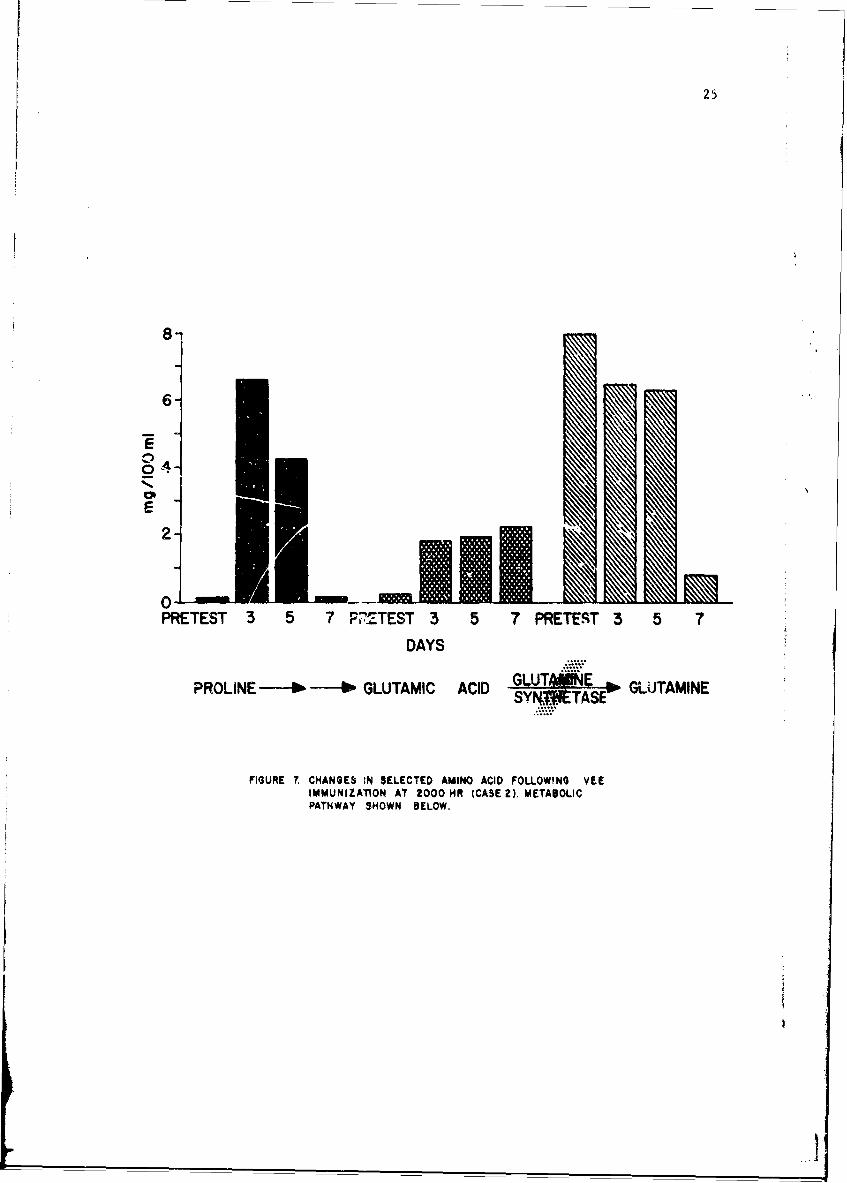
Figure 7 shows the results in the subject with maximal proline changes.An 83-fold proline increase is noted with a subsequent fall to pretest values.This increase is in the order of magnitude of that seen in children withhyperprolinemia. Similarly, glitamic acid increased 17-fold. In this case,glutamine decreased to 10% of its pretest value. Because both proline andglutamic acid increases were seen we cannot postulate a block similar tothat which has been described in either type of hyperprolinemia. Rather,we feel that a block or inhibition of glutamine synthetase could accountfor the metabolic changes noted. Such a block has not to our knowledgebeen previously demonstrated Jr any inborn error of amino acid metabolism.The blockage of glutamine synthetase may also account for the smaller butstill significant increases seen in ornithine, arginine and citrullinebecause of the intimate relationship of the proline and urea cycles.
The more prorounced changes mani fested by the group inoculated at2000 nr deserves comment. HalbergV showed that susceptibility of miceto Rscherichia roli lipopolysacharide injected Intraperitoneally (IP) asmeasured by death differed with the time of inoculation. The death rateof mice injected at 16C0 hr was 80C greater than that observed at 2400 hr
i
8-
6-q
0
0 4
PRETEST ~ ~ Mo 2 PETS 25 RTET
E RLN -- *im -uGUvý AI Y4TSE G.TMN
FIGURE ~ ~ ~ ~ ~ 1m 6CHNEINSLCE AMNAIDFOLLOWIG EIMMUIZAIONAT 000NvvCSm I.MTAOI
PATWA SHWNBEOW
Fana
25
8-
6-
E
PRETEST 3 5 7 P'ZTEST 3 5 7 PRETEST 3 5 7
DAYS
PROLINE - - GLUTAMIC ACID GLUTS ANE " GLUITAMINESY4WCTASE
FIGURE 7. CHANGES lN SELECTED AMINO ACID FOLLOWING VEEIMMUNIZATION AT 2000 HR (CASE2). METABOLICPATHWAY SHOWN BELOW.
i
26
when the same dose was utilized. In a similar way, it is apparent thatinfCction of man with VEE at 2000 hr results in biochemical changes whichare more pronounced than iL men inoculated at 0800 hr.
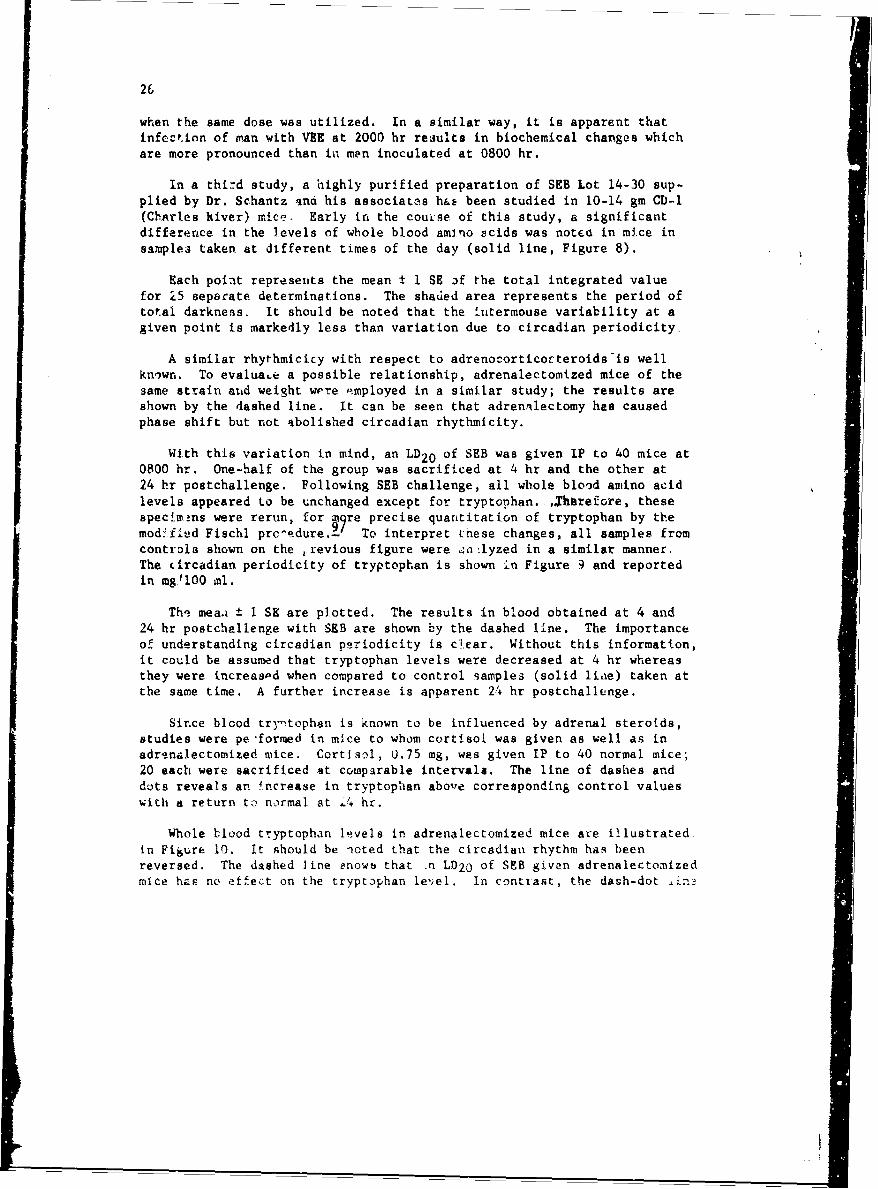
In a third study, a highly purified preparation of SEB Lot 14-30 sup-plied by Dr. Schantz and his associates ha& been studied in 10-14 gm CD-I(Charles kiver) mice. Early in the course of this study, a significantdifference in the levels of whole blood amino acids was notec in mice insamplea taken at different times of the day (solid line, Figure 8).
Each point represents the mean t 1 SE if the total integrated valuefor 15 separate determinations. The shaded area represents the period oftotal darkness, It should be noted that the ilLtermouse variability at agiven point is markedly less than variation due to circadian periodicity.
A similar rhythmicicy with respect to adrenocorticocteroids is wellknown. To evaluaLe a possible relationship, adrenalectomized mice of thesame strain atid weight were employed in a similar study; the results areshown by the dashed line. It can be seen that adrenilectomy has causedphase shift but not abolished circadian rhythmicity.
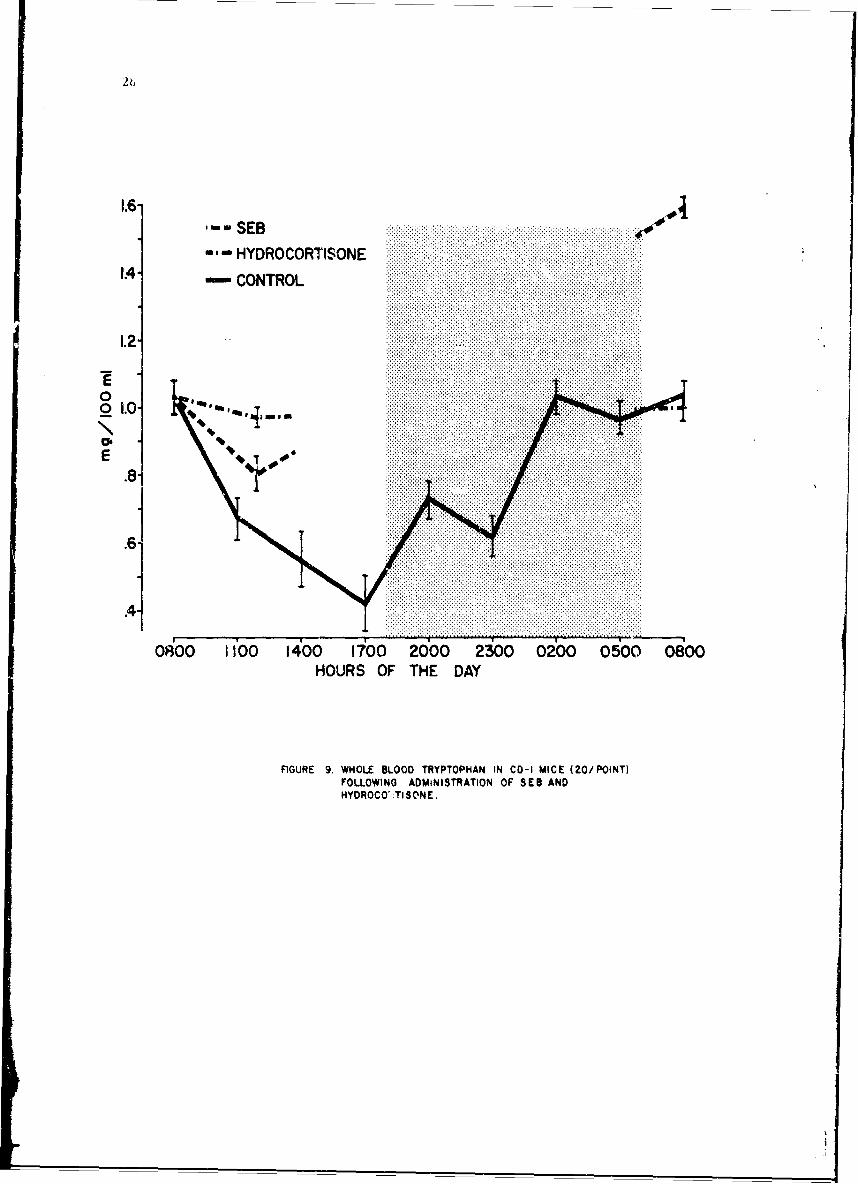
With this variation in mind, an LD2 0 of SEB was given IP to 40 mice at0800 hr. One-half of the group was sacrificed at 4 hr and the other at24 hr postchallenge. Following SEB challenge, all whole blood amino acidlevels appeared to be unchanged except for tryptophan. , 4 Tharefore, thesespecimens were rerun, for qre precise quantitation of tryptophan by themodified Fischl prc"edure2.' To interpret these changes, all samples fromcontrols shown on the •revious figure were 4a:lyzed in a similar manner,The Lircadian periodicity of tryptophan is shown in Figure 9 and reportedin mg100 ml.
The mea~a ± I SE are plotted. The results in blood obtained at 4 and24 hr postchellenge with SEB are shown by the dashed line. The importanceof understanding circadian periodicity is clcar. Without this information,it could be assumed that tryptophan levels were decreased at 4 hr whereasthey were Increaspd when compared to control samples (solid lihe) taken atthe same time. A further increase is apparent 24 hr postchallenge.
Sirce blood try-tophan is known to be influenced by adrenal steroids,studies were pe-formed in mice to whom cortisol was given as well as inadrenalectomized mice. Cortisol, 0.75 mg, was given IP to 40 normal mice;20 each were sacrificed at comparable intervals. The line of dashes anddots reveals an !ncrease in tryptophan above corresponding control valueswith a return to normal at &4 hr.
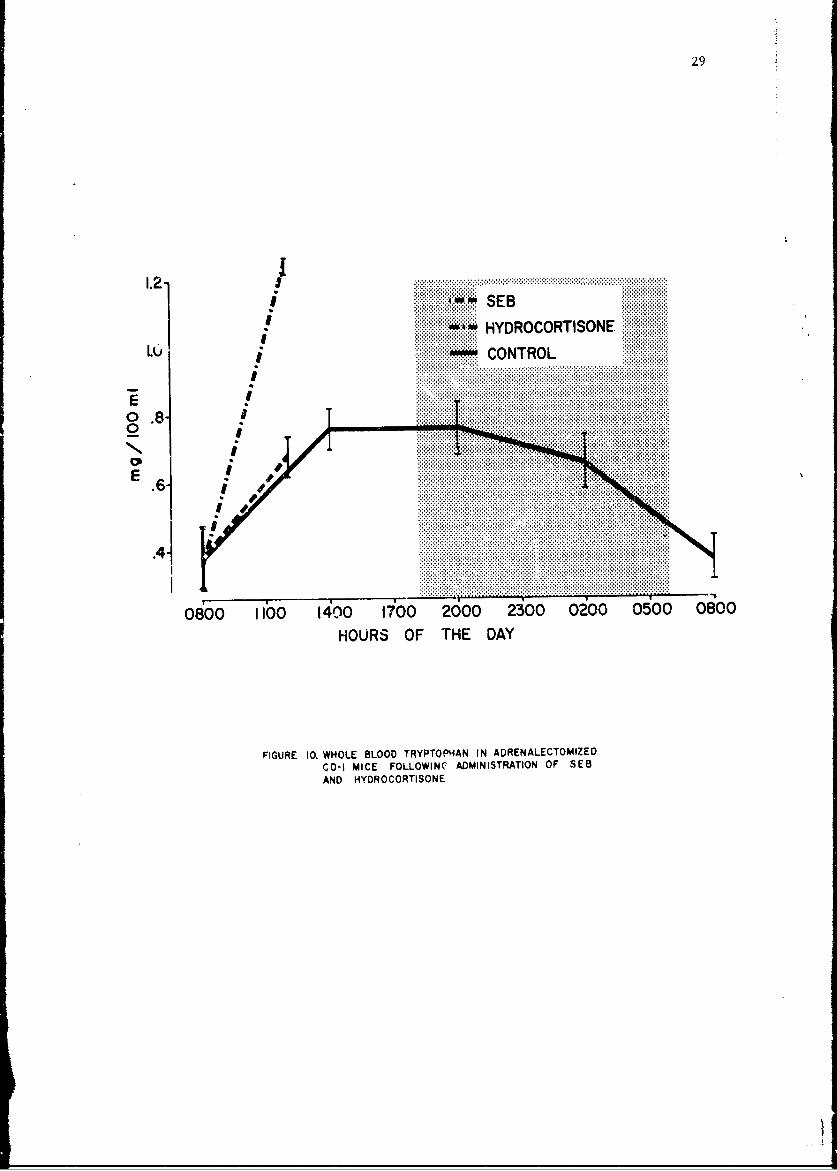
Whole blood tryptophan levels in adrenalectomized mice are illustrated.in Figure 10. It should be ioted that the circadian rhythm has beenreversed. The dashed line enows that .n LD 2 0 of SEB given adrenalectonizedmice has no etfect on the tryptophan le-el. In contrast, the dash-dot `Ln2
27
CONTROL MICE ADRENALECTOMIZED MICE
... ..... ...... .... . ..
> 600-
....... ...
*~ ~ ~~ ~~. ..........~&:;:: : .: .: ...... .
400-~
o ~*...:~.:: . ... . .. .
30010800 1100 1400 1700 2-000 '.3cO 0200 0500 0800
HOURS OF THE DAY
FIGURE 6. TOrTAL AMINO ACIDS IN ADRENAILECTOMIZED ANDCONTROL. CD-I MICE (20O/ POiNT).
1.6-..............................1 1 -...... .......SEB
.... .......................... ......................... ............................................. .................................................I ................: .......
............................................ ........HYDROCORTISONE ........ .................................I ..................................I ..........................................................I .......................................I ...................................................14- CONTROL ...... ..............................................................................................I ......................................' ......................... ...................I ..........I ... ................. .............I .. ....I ... ....................... ..................................... .............. ............................................................................................. .......................I I ................ý I .............................................. .................. .................- .....................................
........................... ....... ........................... ..... ..... .... ............... ..................... ..... ... .................................. ...... .............. ....... ..... ........... ............................... ..... ............................I .... ...... .0 1.0- ........ .... ........ ..... ........... ....... ..... ...... ...... .. .... .. I ... ...... .. .. .. .. .. .. .. ...... ... ... ... .... ..... ...... ..................................................................... ...... ... ........ ...... ....... ............. ..................... ..... ....... .... ............................... ....... -.................... .... ...... ... ... ..... ............................ .. .. .... .... .. .............. .......... ..... ..............
.E ................... ....................... ....... ........... . ........................... ... ........ .... ..... ....... . ..... ... .... .... ..... ....... ..... .. .... I ..... ...... .. .. .. . ...... I .... .. .1, ... ...... ... ....... ..... ........ . ..... .. ... .1 .. ... ...... ..... .I ... ...... .I ... ............... ............. .................... .......................... ............... I .... ... - I .......... - .., .......................... ................. . .... ............................................ ......... ........ ............................ ............... ...... ..............I ............................................................... ... ......................................................... .. ............ .I .......... ................. .... ........... ...... ....................... ........................ ..... ....... ................................ ..... ...... ......I .......... ..... ...............................................................I ....................I ............I ...I ..........I .................. .......................................... ..............................................................6 - ..... .. ... ............... I ................................. ....................... ....................... ........................ ..................................................................................................... ..................... ........ ... ........I ................ ....................I ................................................................................................. .. ...... ...I ... ..... I ................ ...... ......................... - ............. ................................................................................................. ...... ...... ..... ....... . ........................................................................................... .................................................... ...............................................................I ....................I ....................I .......................................................................I - I .... .. ... I ..... ....... .... I I ...... ...... ..... .. .... ...... ..... ............................................................................................................................I ........................................................................................................... I ... I ..... ..' ..................... --.- .... ....... ..... .......................... ...... ........... ..............................I ý .....I ............A j ............. I .... I .............................................I I ...........................................................................................................................................................................................I ................... ......................................................... - I ... ...... ....ý ..I ........ ......................... ..................... ............ ...............................................................................I ......................................................................................................I ..............I ............' ........................................................................I ... I ..................I .........I ....I .............I .............................................................................
..... .... ..... ..... i ................. f -.. ........ - ''''0800 1100 1400 1700 P-600 2300 02-00 0600 0'800
HOURS OF THE DAY
FlGURE 9. WHOLE 13LOOD TRYPTOPHAN IN CO-1 MICE (20/ POINT)FOLLOWING ADMINISTRATION OF SEB ANDHYDROCO',TISCNE.
29
1.21 ~SEB
I ~ HYDROCORTISONELU i -CONTROL
0 ........... .. ..... ..... ..... ... ......
o~~~~oo~.. ..............0.. 000.0.0 00 80HOR F H A
FIGURE ~ ~ ~ ~ ~ ~ ...... .0.HOE.LO.R....NINARNAETO IECD MIEFLO.8-DINSRTONO E
AND ...DR.C.R.T..ONE
30
shows that 0.75 mg cf cortisol results in a marked increase in circulatingtryptophan. All other whole blood amino acids remained within the normalrange following SEB or cortisol in both normal and adrenalectomized mice.
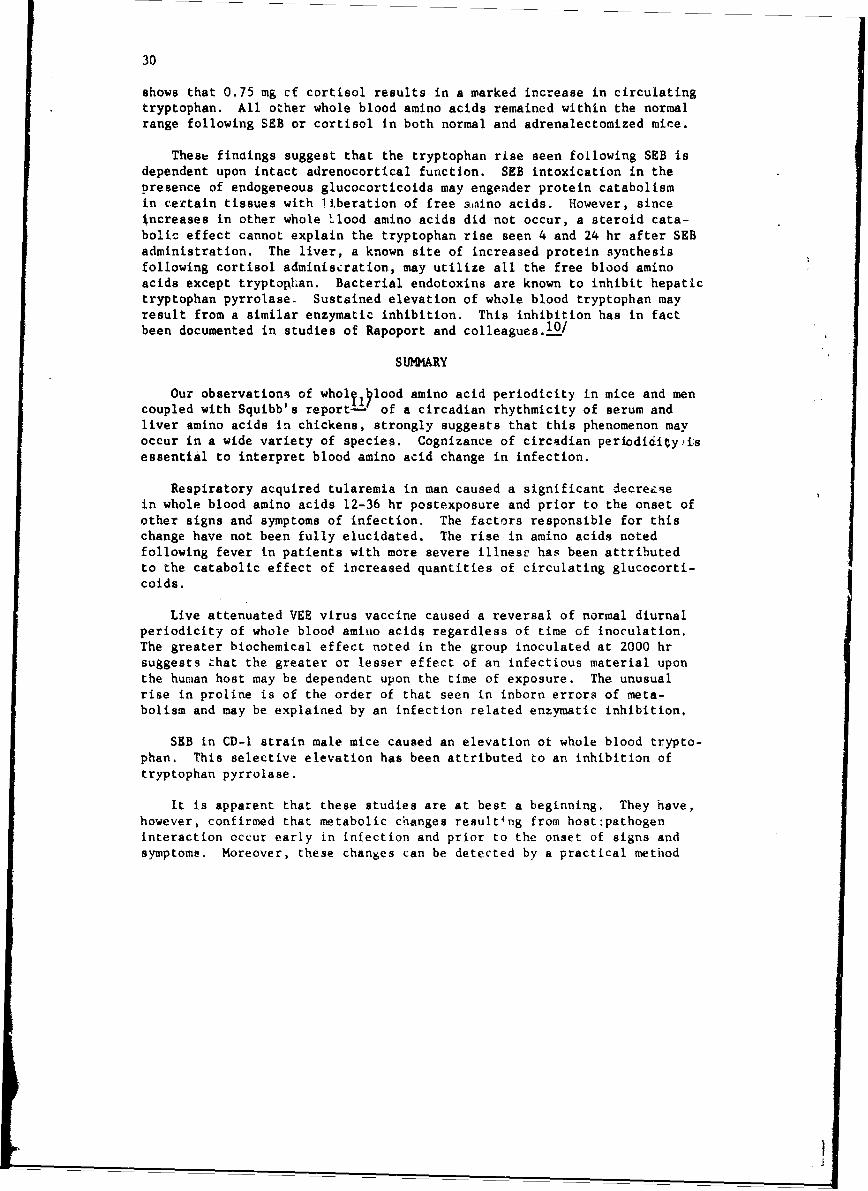
These finaings suggest that the tryptophan rise seen following SEB isdependent upon intact adrenocortical function. SEB intoxication in thepresence of endogereous glucocorticoids may engender protein catabolismin certain tissues with liberation of free aoino acids. However, since4ncreases in other whole 'Lood amino acids did not occur, a steroid cata-bolic effect cannot explain the tryptophan rise seen 4 and 24 hr after SEBadministration. The liver, a known site of increased protein synthesisfollowing cortisol adminiscration, may utilize all the free blood aminoacids except tryptophan. Bacterial endotoxins are known to inhibit hepatictryptophan pyrrolase. Sustained elevation of whole blood tryptophan mayresult from a similar enzymatic inhibition. This inhibition has in factbeen documented in studies of Rapoport and colleagues.I0/
SUMMARY
Our observations of whol 0 lood amino acid periodicity in mice and mencoupled with Squibb's report- of a circadian rhythmicity of serum andliver amino acids in chickens, strongly suggests that this phenomenon mayoccur in a wide variety of species. Cognizance of circadian periodidity~i~sessential to interpret blood amino acid change in infection.
Respiratory acquired tularemia in man caused a significant decreasein whole blood amino acids 12-36 hr postexposure and prior to the onset ofother signs and symptoms of infection. The factors responsible for thischange have not been fully elucidated. The rise in amino acids notedfollowing fever in patients with more severe illnese has been attributedto the catabolic effect of increased quantities of circulating glucocorti-coids.
Live attenuated VEE virus vaccine caused a reversal of normal diurnalperiodicity of whole blood amino acids regardless of time of inoculation.The greater biochemical effect noted in the group inoculated at 2000 hrsuggests Lhat the greater or lesser effect of an infectious material uponthe human host may be dependent upon the time of exposure. The unusualrise in proline is of the order of that seen in inborn errors of meta-bolism and may be explained by an infection related enzymatic inhibition.
SEB in CD-I strain male mice caused an elevation ot whole blood trypto-phan. This selective elevation has been attributed to an inhibition oftryptophan pyrrolase.
It is apparent that these studies are at best a beginning. They have,however, confirmed that metabolic changes result 4 ng from host:pathogeninteraction occur early in infection and prior to the onset of signs andsymptoms. Moreover, these changes can be detected by a practical method
31
utilizing small quantities of blood. The practicalty of the method forthe early diagnosis of infectious disease depends upon the specificity ofthe change for a given disease entity. This can only be determined byadditional studies of amino acid changes in other infections.
LITERATURE CITED
11 Farr, L. E.. C. M. MacLeod, P. H. Futcher, K. Emerson, G. S. Mirick,and E. C. Curnen. 1940. Hypoaminoacidemia in patient- with pneumo-coccal pneumonia. Proc. Soc. Exp. Biol, Med. 44:290-292.
2. Emerson, Jr., K., E. C. Curnen, G. S. Mirick, and J. E. Ziegler, Jr.1943. Chloride metabolism and plasma amino acid levels in primaryatypical pneumonia. J. Clin. invest. 22:695-697.
3. Efron, M. L., D. Young, H. W. Moser, and R. A. MacCready. 1964. Asimple chromatographic screening test for ti" detection of disordersof amino acid metaboiism. New Engl. J. Med. 470:1378-1383.
4. Moore, S., and W. H. Stein. 1954. A modified ninhydrin reagent forthe photometric determination of amino acids and related compounds.J. Biol. Chem. 211:907-913.
5. Beisel, W. R. 1966. Effect of infection on human proteir: metabolism.Fed. Proc. 25:1682-1687.
6. Woodward, J. M., A. J. Sbarra, and F. D. Holtman. 1954. The host-parasite relationship in tularemia. I. A study of the influence ofBacterium tularense in the amino acid metabolism of white rats. J.Bact. 67:58-61.
7. Sbarra, A. J., and J. M. Woodward. 1955. The host-parasite relation-ship in tularemia. II. A clinical study of the blood and urine-ofwhite rats infected with Pasteurella tularense. J. Bact. 69:363-366.
8. Halberg, F. 1960. The 24-hour scale. A time dimension of adaptivefunctional organization. Perspect. Biol. Med. 3.491-527.
9. Ingiis, A. S., and I. H. Leaver. 1964. Studies in the determinationof tryptophan. Modified Fischl procedure. h..al. Biochem. 7:10-17.
10. Rapoport, M. !., R. D. Feigin, J. Bruton, and W. R. Beisel. 1966.Circadian rhythm for tryptophan pyrrolase and its circulkting substrate.Science 153:1642-1644.
11. Squibb, R. L. 1964. Nutrition and biochemistry of survival duringNewcastle disease virus infection. 7I. Relation of clinical symptomsand starvation to nucleic acids and free amino acids of avian liver.J. Nutr. 82:422-426.
.1
33
SEROLOGICAL STUDIES ON STAPHYLOCOCCAL ENTEROTOXIN B
Virginia G. McGann, Ph.D.*
Investigations or the immunologic response to staphylococcal enterotoxinB (SEB), have been confined to examination of the role of circulating antibody.Serologic methods used for detection and measurement of antibody were; (1)hemagglutination with bis-diazotized benzidine-treated erythrocytes (BDB-HA),(2) precipitation in agar gel (PPT), and (3) enterotoxin-combining activity,as detected .ith agar gel techniques (ECA). When we reported to the Commissionlast year,!/ we had problems with poor reproducibility of HA titers and lowsensitivity i•f precipitin and toxin-combining techniques. By certain modifi-cations in procedure, these problems were resolved. This has made possiblevalid comparison of the 3 techniques for measuring antibody, investigationson the fesibility of using antibody measurement as an estimate of resistanceto challenge, and studies on antibody response after exposure to enterotoxin.
The procedure for titrating toxin-combining activity was essentially thesame as previouRly described. Increasing concentrations of toxin were incu-bated with constant amounts of test serum, and the mixtures were tested forexcess of either component by observing their reactions with referencE toxinand antitoxin in agar gel plates. If a mixture contained excess antibody, aline of precipitate formed between the mixture reservoir and the referencetoxin, if excess toxin, between the mixture reservoir and reference antitoxin.The midpoint of the zone with no visible reaction was taken as a measure oftoxin-cml~ining activity, previously called equivalence value, and reportedin teims of pig toxin/ml serum.
Relationship of BDB-HA, PPT and ECA. Data available at the time of theprevious report indicated that there was good correlation between precipitinand combining activity but poor correlation between these measures andhemagglutinin. After modifications in technique, it became necessary toreevaluate these conclusions.
Concurrent titrations of sera from susceptible animals before and afterexposure to enterotoxin indicated that HA and combining activity were almostequally sensitive methods for detecting antibody. Incidence and median tLtercof antibody, as measured by the three methods, in nonexperienced men andmonkeys are summarized in Table I. Approximately 65% of the human and 20%of the monkey populations were antibody-positive by HA and ECA. In popu-lations such as these, with no known prior experience, the number of indi-viduals with precipitins was consistently lower than the number withhemagglutinins. Sera containing precipitins usually had hemaggiutinintiters of > 1:640. Median titers Appeared to be higher in the monkey thanin the human population, but after conditioning for 2 or 3 months, titers,f positive moni, ys decreased to approxim-aely the level of the human titers.
* U. S. Army Medical Unit.
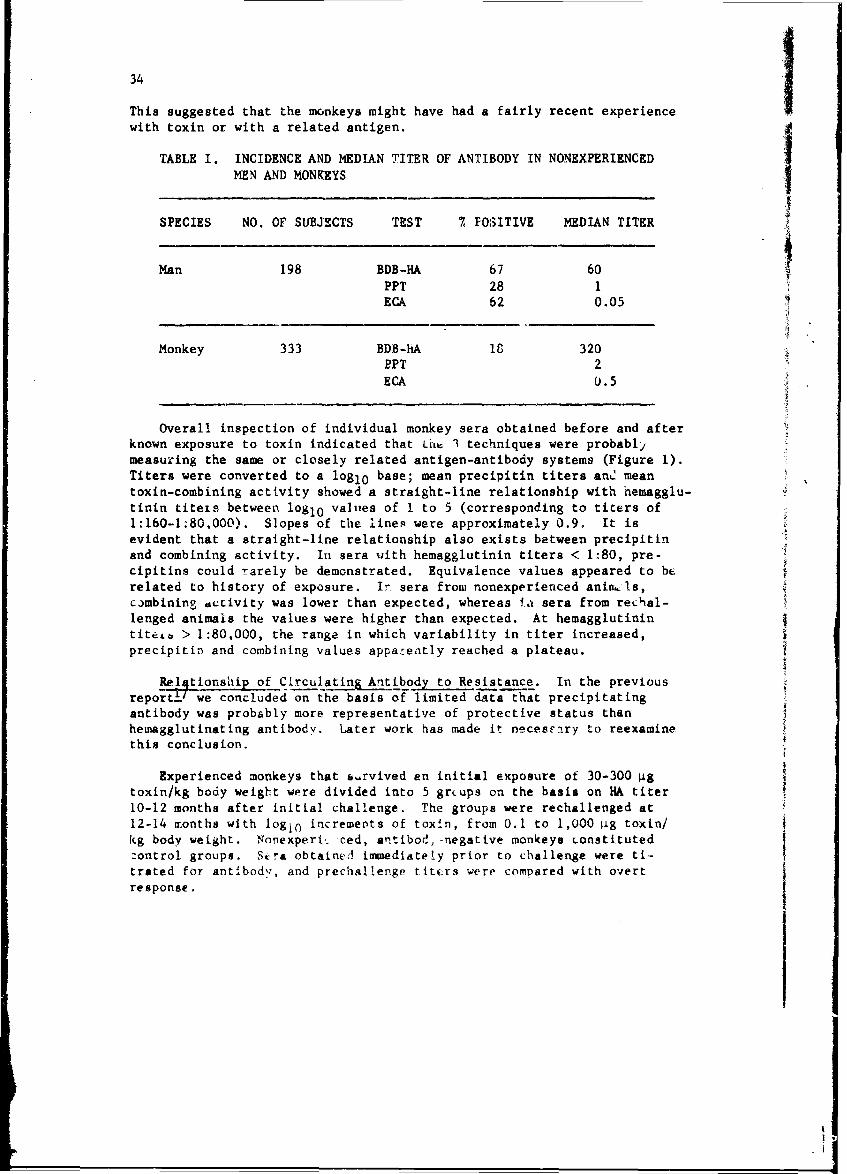
34 IThis suggested that the monkeys might have had a fairly recent experiencewith toxin or with a related antigen.
TABLE I. INCIDENCE AND MEDIAN TITER OF ANTIBODY IN NONEXPERIENCEDMEN AND MONKEYS
SPECIES NO. OF SUBJECTS TEST % POSITIVE MEDIAN TITER
Man 198 BDB-HA 67 60PPT 28 1ECA 62 0.05
Monkey 333 BDB-hA I8 320PPT 2ECA 0.5
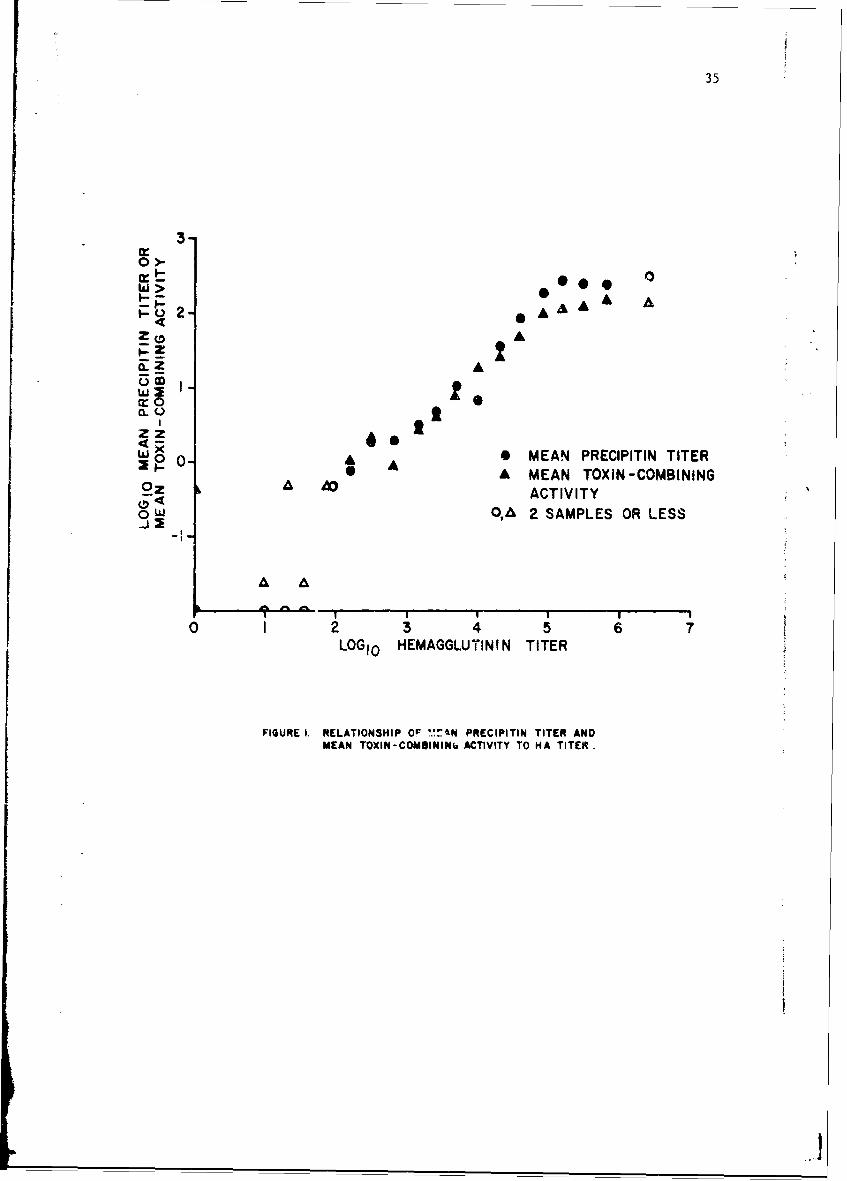
Overall inspection of individual monkey sera obtained before and afterknown exposure to toxin indicated that LfLs I techniques were probablymeasuring the same or closely related antigen-antibody systems (Figure 1).Titers were converted to a loglo base; mean precipitin titers anL meantoxin-combining activity showed a straight-line relationship with hemagglu-tinin titets between logl 0 values of I to 5 (corresponding to titers of1:160-1:80,000). Slopes of the lines were approximately 0.9. It isevident that a straight-line relationship also exists between precipitinand combining activity. In sera with hemagglutinin titers < 1:80, pre-cipitins could rarely be demonstrated. Equivalence values appeared to berelated to history of exposure. Ir sera from nonexperienced anim. Is,combining dctivity was lower than expected, whereas la sera from rechal-lenged animals the values were higher than expected. At hemagglutinintite~b > 1:80,000, the range in which variability in titer increased,precipitin and combining values appartently reached a plateau.
Rel~tionship of Circulating Antibody to Resistance. In the previousreport-- we concluded on the basis of limited data that precipitatingantibody was probably more representative of protective status thanhemagglutinating antibody. Later work has made it necessary to reexaminethis conclusion.
Experienced monkeys that 6.rvived an initial exposure of 30-300 4gtoxin/kg body weight were divided into 5 grcups on the basis on HA titer10-12 months after initial challenge. The groups were rechallenged at12-14 months with logio increments of toxin, from 0.1 to 1,OO0 pg toxin/kg body weight. Nonexperi, ced, antibod,-negative monkeys Lonstitutedzontrol groups. Sera obtained immediately prior to challenge were ti-trated for antibodv, and prechallenge titcrs were compared with overtresponse.
35
3-
0)o 0
AA2- ,A
* A
zz
ozA ACTIVITY•., O,A 2 SAMPLES OR LESS
A A
! I I I
0 I 2 3 4 5 6 7LOG10 HEMAGGLUTININ TITER
FIGURE i. RELATIONSHIP O ME PRECIPITIN TITER ANDMEAN TOXIN-COMBINING ACTIVITY TO HA TITER.
2T
04!
36
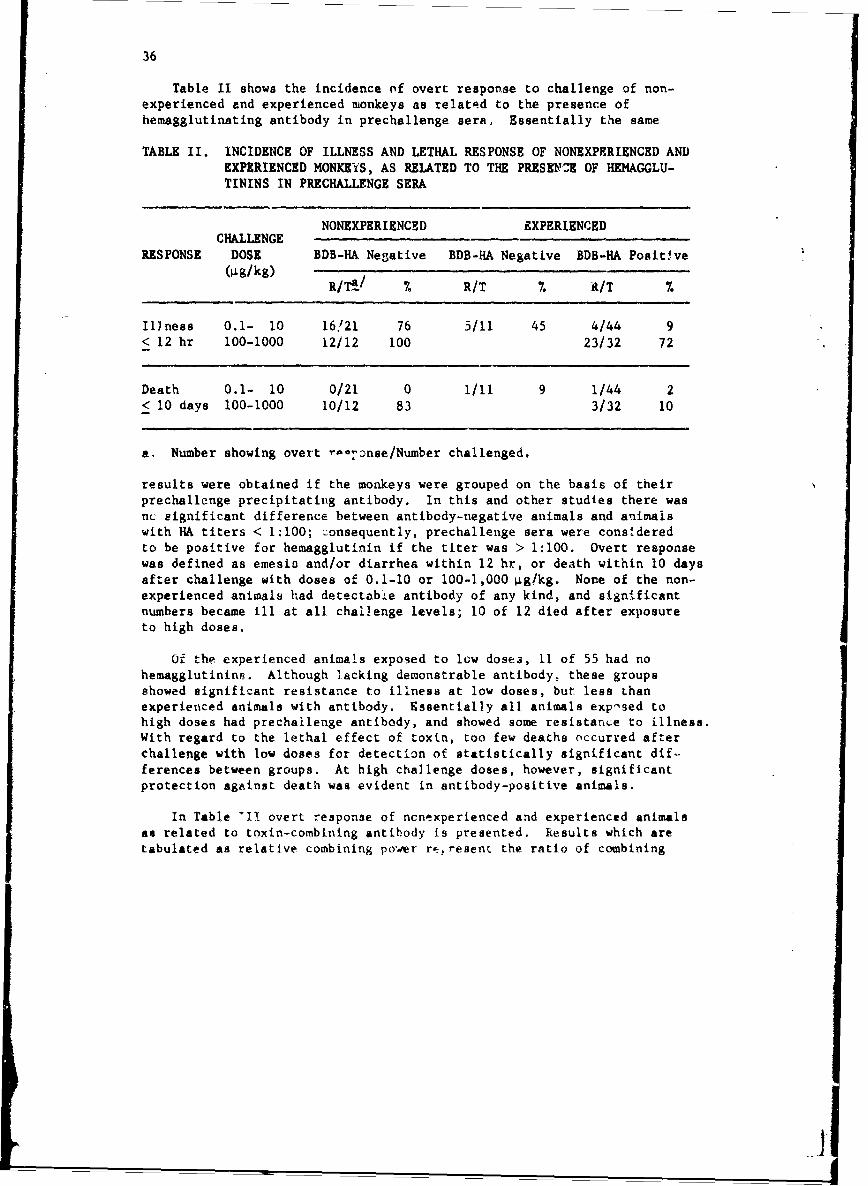
Table II shows the incidence of overt response to challenge of non-experienced and experienced monkeys as related to the presence ofhemagglutinating antibody in prechallenge sera. Essentially the same
TABLE II. INCIDENCE OF ILLNESS AND LETHAL RESPONSE OF NONEXPERIENCED ANDEXPERIENCED MONKEYS, AS RELATED TO THE PRESKNZCE OF HEMAGGLU-TININS IN PRECHALLENGE SERA
NONEXPERIENCED EXPERIENCEDCHALLENGE
RESPONSE DOSE BDB-HA Negative BDB-HA Negative BDB-HA Positive(rig/kg) R/Ta-/ % R/T % R/T %
Illness 0.1- 10 16,121 76 5/11 45 4/44 9< 12 hr 100-1000 12/12 100 23/32 72
Death 0.1- 10 0/21 0 1/11 9 1/44 2< 10 days 100-1000 10/12 83 3/32 10
a. Number showing overt oa--nse/Number challenged.
results were obtained if the monkeys were grouped on the basis of theirprechallenge precipitating antibody. In this and other studies there wasnc significant difference between antibody-negative animals and animalswith HA titers < 1:100; Zonsequently, prechallenge sera were consideredto be positive for hemagglutinin if the titer was > 1:100. Overt responsewas defined as emesio and/or diarrhea within 12 hr, or death within 10 daysafter challenge with doses of 0.1-10 or 100-],000 ýig!kg. None of the non-experienced animals had detectabie antibody of any kind, and significantnumbers became ill at all challenge levels; 10 of 12 died after exposureto high doses.
Of the experienced animals exposed to low doses, 11 of 55 had nohemagglutinins. Although lacking demonstrable antibody, these groupsshowed significant resistance to illness at low doses, but less thanexperienced animals with antibody. Essentially all animals exposed tohigh doses had prechallenge antibody, and showed some resistance to illness.With regard to the lethal effect of toxin, too few deaths occurred afterchallenge with low doses for detection of statistically significant dif-ferences between groups. At high challenge doses, however, significantprotection against death was evident in antibody-positive animals.
In Table 711 overt response of ncnexperienced and experienced animalsas related to toxin-combining antibody is presented. Results which aretabulated as relative combining power raý,resent the ratio of combining
II
37
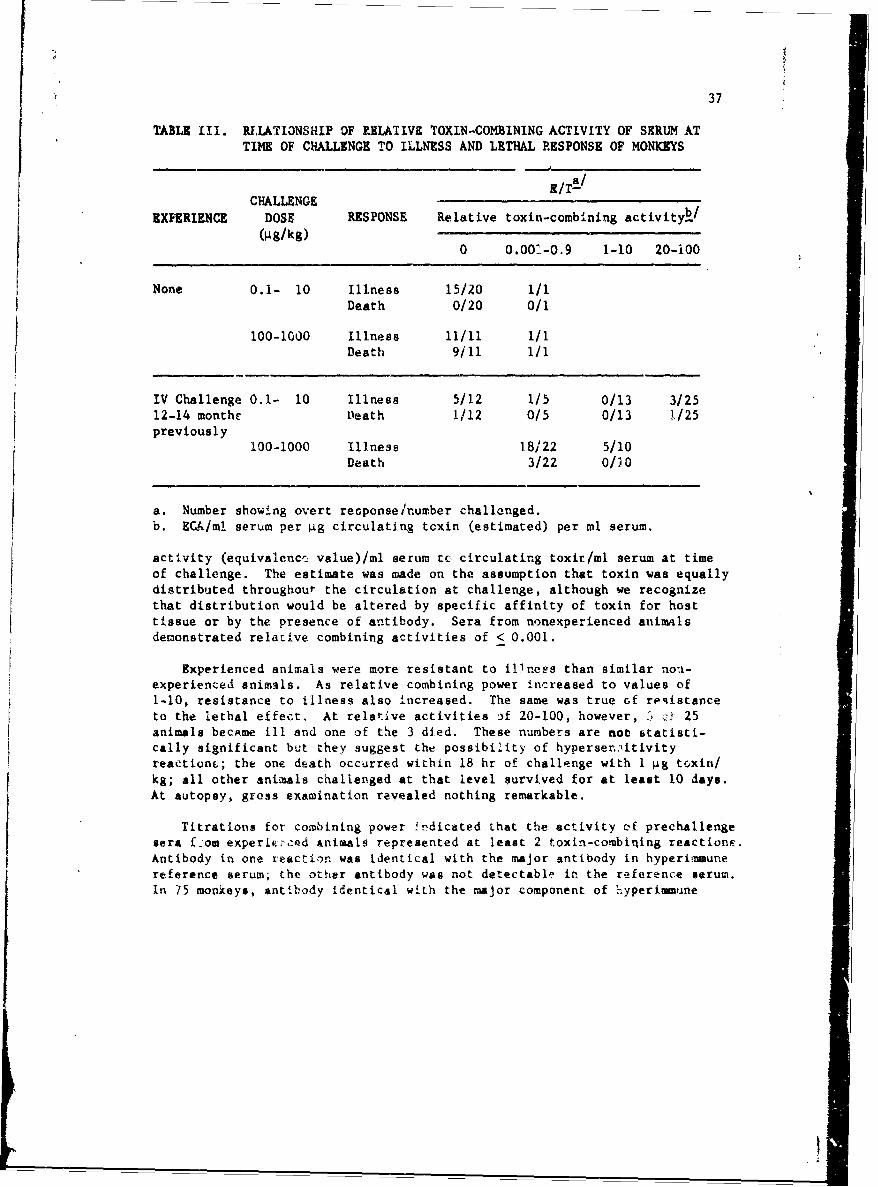
TABLE III. RILATI3NSHIP OF RELATIVE TOXIN-COMBINING ACTIVITY OF SERUM ATTIME OF CHALLENGE TO ILLNESS AND LETHAL RESPONSE OF MONKEYS
CHALLENGE i
EXPERIENCE DOSE RESPONSE Relative toxin-combining activityý/
(4g/kg)0 0.001-O.9 1-10 20-i00
None 0.1- 10 Illness 15/20 1/1Death 0/20 0/1
100-1000 Illness 11/11 1/1Death 9/11 1/1
IV Challenge 0.1- 10 Illness 5/12 1/5 0/13 3/2512-14 monthe Death 1/12 0/5 0/13 1/25previously
100-1000 Illness 18/22 5/10Death 3/22 0/10
a. Number showing overt reGponse/number challenged.b. ECA/ml serum per 4g circulating toxin (estimated) per ml serum.
activity (equivalenci value)/ml serum to circulating toxir/ml serum at timeof challenge. The estimate was made on the assumption that toxin was equallydistributed throughout the circulation at challenge, although we recognizethat distribution would be altered by specific affinity of toxin for hosttissue or by the presence of antibody. Sera from nonexperienced animalsdemonstrated relative combining activities of < 0.001.
Experienced animals were more resistant to illnees than similar non-experienced animals. As relative combining power increased to values of1-10, resistance to illness also increased. The same was true of reiistanceto the lethal effect. At relative activities 3f 20-100, however, -; zi• 25animals becAme ill and one of the 3 died. These numbers are not statisti-cally significant but they suggest the possibility of hyperser.:nitivityreaetionL; the one death occurred within 18 hr of challenge with 1 &g toxin/kg; all other animals challenged at that level survived for at least 10 days.At autopsy, gross examination revealed nothing remarkable.
Titrations for combining power !rdicated that the activity of prechallenge"sera f:om experivc>ed animals represented at least 2 toxin-combhning reactionE.Antibody in one reaction was identical with the major antibody in hyperimmunereference serum; the other antibody was not detectable in the reference serum.In 75 monkeys, antibody identical with the major component of hyperimmune
38
serum was the only detectable antibody in 44%, the major component in 11%,and a minor component, or lacking, in 45% of the animals. Since similarresults were observed in surveys of human sera, an effort was made toevaluate the relative importance of total antibody content and of thehyperimmune-like fraction.
X2 values were used to estimate probability of relationship betweenprechallenge antibody and resistance. Antibody measures were testedindependently. For illness at lcw doses and death at high doses, X2 valuesbased on total antibody, regardless of type, were highiy significant(p < 0.001), indicating relationship between totfl antibody and resistance.For illness at high doses, the significance of X values for total antibodywas considerably lower (p < 0.05) and hyperimmune-type antibody appearedto be a better measure of resistar.-e.
Scattered data suggest that antibody in nonexperienced monkeys has thesame relationship to protection as antibody in experienced animals. Twogroups of 4 nonexperienced, antibody-positive monkeys were challenged with10 or 100 pg/kg. Relative combining power of sera from all animals chal-lenged with the low dose was > 10, and the monkeys showed no overt response.One of 4 monkeys challenged with the higher dose survived. Relative com-bining activity of prechallenge serum of the survivor was 0.01, and of the3 that died, < 0.001. Moreover, in skin-test experiments with nonexpei-ienced monkeys, antibody-negative animals became ill, while antibody-positive responded like experienced, positive animals.
Antibody.Response to Enterotoxin. In previous studies most monkeysthat had no prechallenge antibody showed no antibody response to toxindoses of 30 to 300 ýig/kg within the standard observation period of 10 to14 days, suggesting that purified toxin might have low antigenicity, orthat antibody response might be delayed. In the past year serial bleed-ings were obtained from groups of antitoxin-treated monkeys and fromcorresponding untreated controls that survived doses of 30 to 300 pg/kg.
In Figure 2 incidence of antibody response i- monkeys treated at onsetof illness with monkey, human or horse antitoxin i8 compared with theincidence of response in untreate, surviving control animals. All animalsunder consideration had no detectable prrz:hallenge antibody. Sera obtainedat vai jus times after challenge were tested for hemagglutinins and forprecipitins. There were 10 survivors in the untreated control group, 13in a group treated with a'pha-glL'in ftom human convalescent serum, 32in a group treated with pepsin-digested globv'ins from hyperimmune horseserum, and 23 in a group treated with convalescent monkey serum.
The challenge doses were sufficient to evoke illness within 12 hr inall animals and to be lethal for 50 to 100% of control animals. Only 60%of surviving controls developed hemagglu'inins and 40%, precipitins.After 1 month there was no signific.nt Thange in the number of controlsthat were antibody-positive. 'n anima.s treated with slpha-globulin from
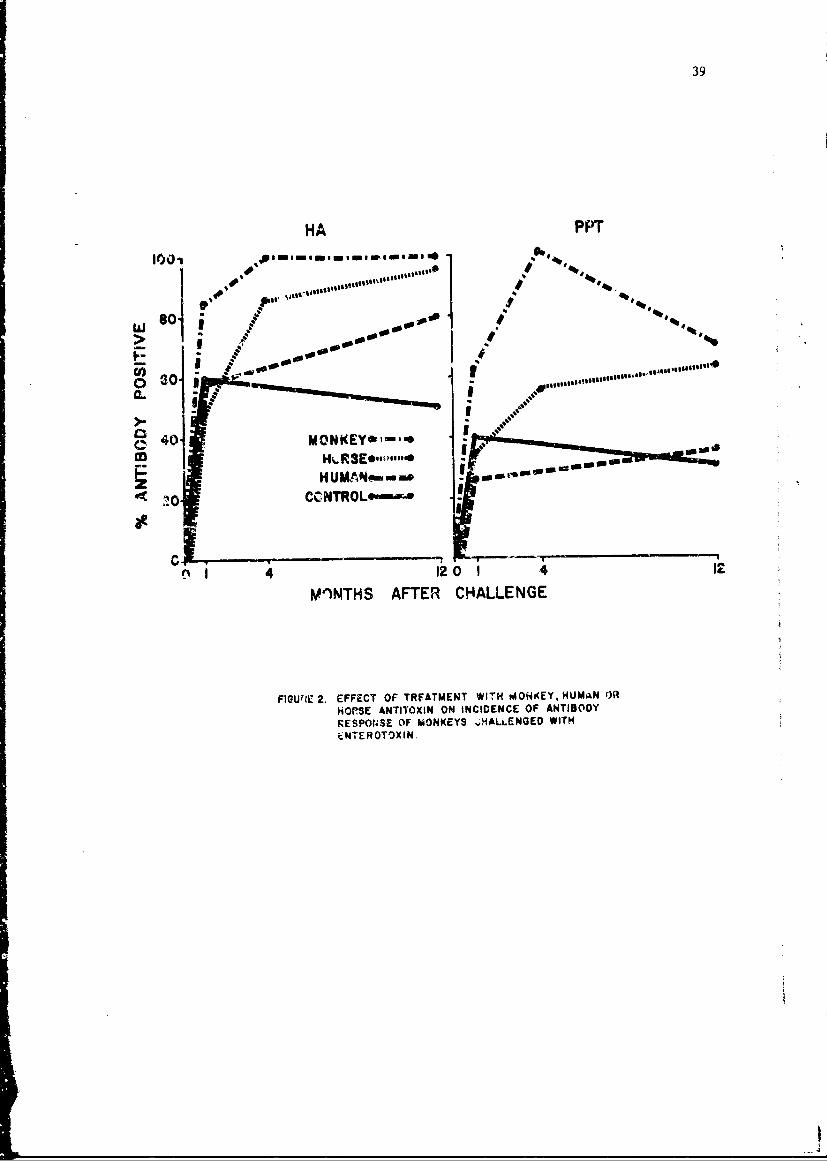
39
HA PFP"
w so ''0 06
ot0 A
1 'N CCNTROLo---•I
40 I4120 0 I 1I
MINTHS AFTER CHALLENGE
FIGUriE 2. EFFECT OF TRFATMENT WITH MONKEY, HUMAN OR
HOPSE ANTITOXIN ON INCIDENCE OF ANTIBODYRESPOrUSE OF MONKEYS ,HALLENGED WITH
ENTEROTOXIN.
40
convalescent human serum at onset of illness, the percent with hemagglu--tinins was the same as that of the controls at I month, but appeared toincrease somewhat during the year; the percent with precipitins increasedmore slowly than the controls. Incidence of responders in monkeys treatedwith pepsin-digested globulins from byperimmune horse serum increasedsignificantly throughout the year, and 100% of the animals treated withconvalescent monkey serum developed antibody within 3 to 4 months; afterthis time the number with hemagglutlnin response remained the same andthe number with precipitin response decreased. All animals that had pre-challenge antibody responded within 2 weeks after challenge, regardlessof treatment.
Serum therapy apparently delayed development of maximum titer. Essen-tially all of the control animals that developed antibody had maximumtiters within 1 month after challenge. In contrast, only 50% of thosethat received monkey serum and considerably fewer of those that receivedsera from other species had maximum titers at this time. Although titerdeveloped more slowly in serum-treated animals, maximum titer was usuallyhigher than that of controls. In general, prectpitin titers developedmore slowly and decreased more rapidly than hemagglutinin tiLers.
These data suggested that under proper conditions enterotoxin washighly antigenic but that antibody developed slowly. It is possible thatin vivo formation of large aggregates of toxin by immune precipitationand7ohprotection of the integrity of the toxin molecule in immune aggre-gates resulted in increased antigenicity. Slow rate of rejection ofhomologous antitoxin, thereby prolonging the presence of immune aggregates,may have been a factor in the greater effectiveness of monkey antitoxin.
The number of animals responding to enterotoxln and the degree ofantibody response were also related to challenge dose and to previousexperience of the animals. In Table IV the percent of animals developinga significanat hemagglutinin or precipitin response within 2 weeks afterchallenge with increasing doses of toxin is summarized. Dosage rangedfrom < 0.1 to 1,000 4g/kg. Animals are grouped on the basis of prechal-lense experience and of prechailenge antibody ie-I'ls. Results for com-bining activity were essentially the same as those for hemagglutinins.
In general, a challenge dose of 10 4g/kg was requiredkto-Pvokpa.Loigni-ftc&aL hemagglutinin response, and 100 pg/kg, a significan• precipitinresponse, in 50% of the nonexperienced, antibody-negative monkeys, whereas0.1 ýg/kg waa sufficient for experienced animals. In nonexperienced animalsantibody appeared only after overt illness, but in experienced monkeys theresponce %.-as somewhat better in the absence of illness. Essentially allmonkeys challenged with 100 pg/kg or more showed an increase in antibody.At lower challenge doeis the antibody response depended on challenge doseexperience and amount -f prechailenge antibody. Percent reactors increasedwith dose; at the same' ..C3e, vi.Lih experience; and the higher the prechal-lenge titer, the greater the dose required to evoke a significant response.
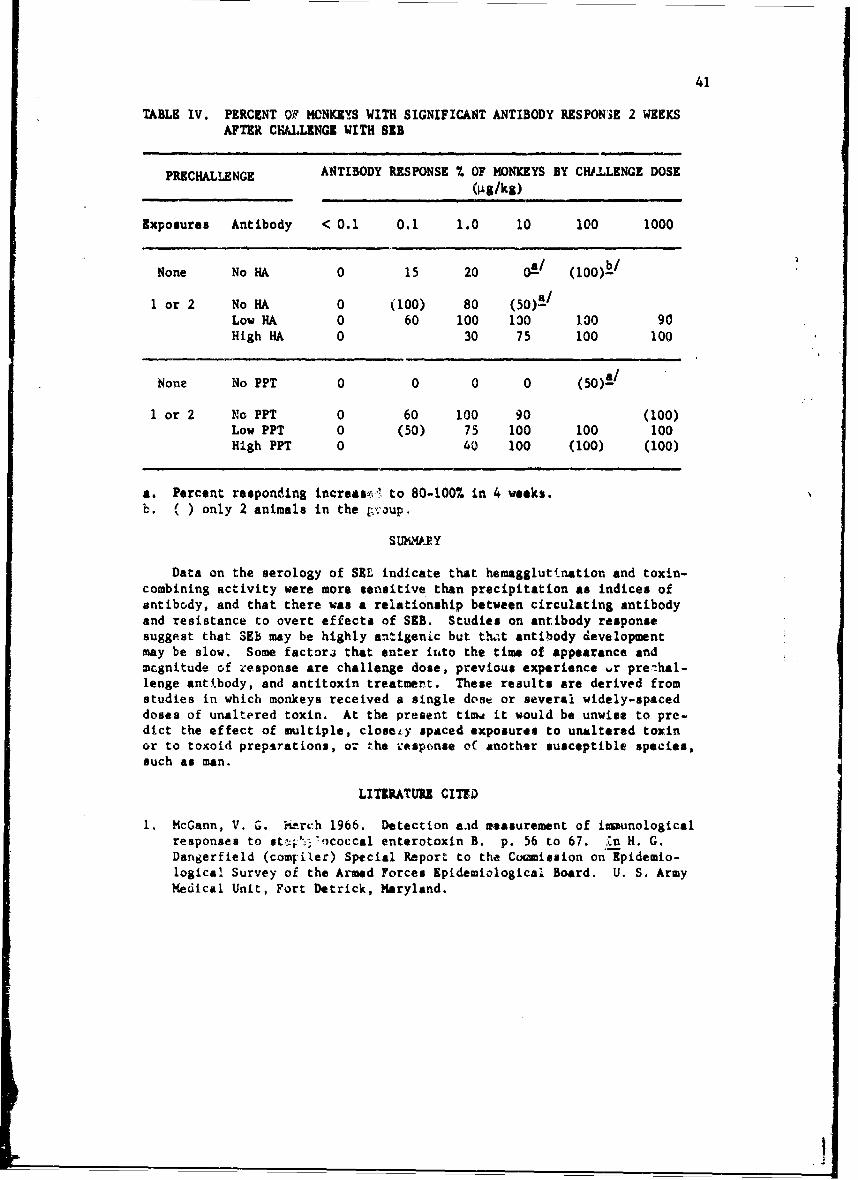
41
TABLE IV. PERCENT OF MONKEYS WITH SIGNIFICANT ANTIBODY RESPONSE 2 WEEKSAFTER CYALLENGI WITH SIB
PRECHALLENGE ANTIBODY RESPONSE . OF MONKEYS BY CHILLENGE DOSE(jsg/kg)
Exposures Antibody < 0.1 0.1 1.0 10 100 1000
None No HA 0 15 20 0!/ (l0O)W/
1 or 2 No HA 0 (100) 80 (50)1/Low HA 0 60 100 100 130 90High HA 0 30 75 100 100
None No PPT 0 0 0 0 (50)!/
1 or 2 No PPT 0 60 100 90 (100)Low PPT 0 (50) 75 100 100 100High PPT 0 40 100 (100) (100)
a. Percent responding increasz-. to 80-100% in 4 weeks.
b. ( ) only 2 animals in the Cv'oup.
Data on the serology of SEL indicate that hemagglutination and toxin-combining activity were more sensitive than precipitation as indices ofantibody, and that there was a relationship between circulating antibodyand resistance to overt effects of SEB. Studies on antibody responsesuggest that SEB may be highly antigenic but thit antibody developmentmay be slow. Some factora that enter iuto the time of appearance andmcgnitude of zesponse are challenge dose, previous experience ur preihal-lenge antibody, and antitoxin treatment. These reaults are derived fromstudies in which monkeys received a single dose or several widely-spaceddoses of unaltered toxin. At the present timd it would be unwise to pre-dict the effect of multiple, closaky spaced exposures to unaltered toxinor to toxoid preparations, or the response oC another susceptible species,such as man.
LITERATURE CITED
1. McCann, V. G. ?L-rch 1966. Detection and uasurement of immunologicalresponses to st.-i' coccal enterotoxin B. p. 56 to 67. Jn H. G.Dangerfield (comf'iler) Special Report to the Coamission on Epidemio-logical Survey of the Armed Forces Epidemiological Board. U. S. ArmyMedical Unit, Fort Detrick, Maryland.
____ ___ ___ ___ ___ ____ ___ ___ ___ ___ ____ ___ ___ ___ ___ ____ ___ ___ ___ ___.1
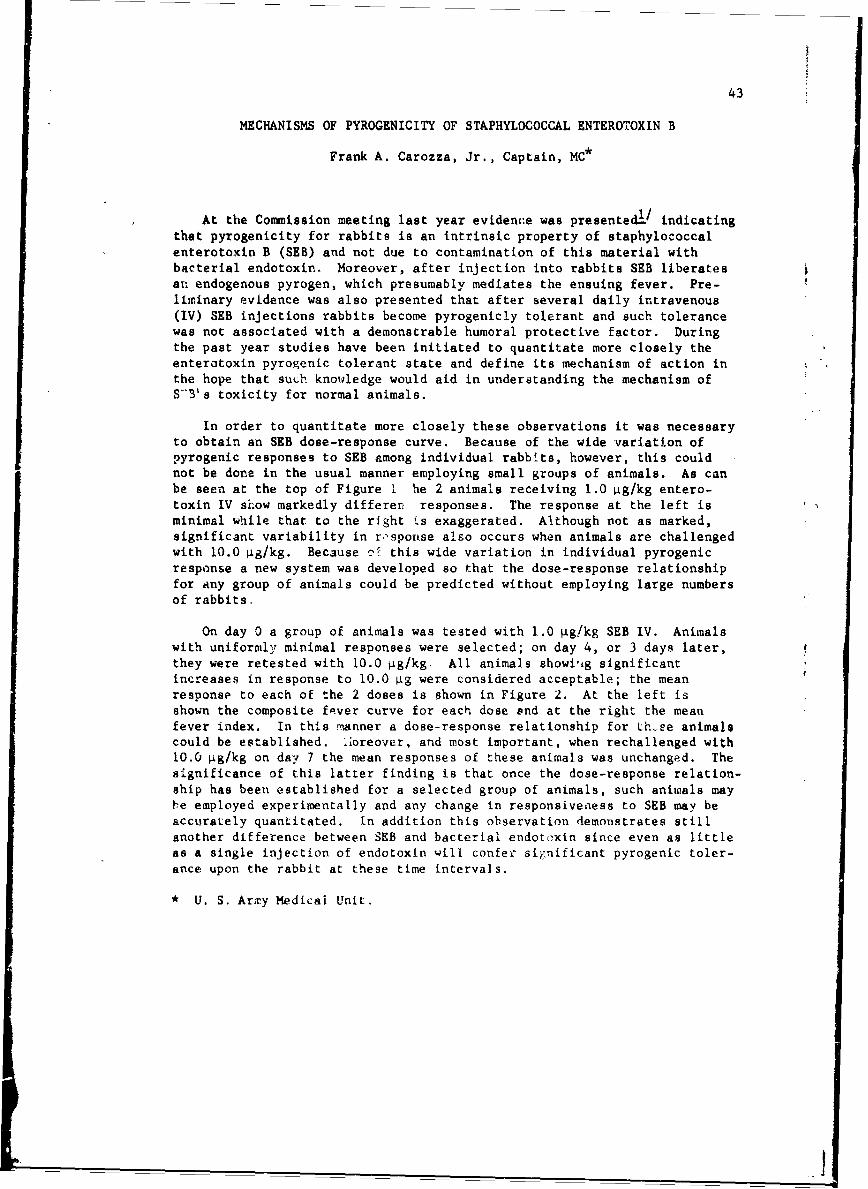
43
MECHANISMS OF PYROGENICITY OF STAPHYLOCOCCAL ENTEROTOXIN B
Frank A. Carozza, Jr., Captain, MC*
At the Commission meeting last year evidence was presented.I/ indicatingthat pyrogenicity for rabbits is an intrinsic property of staphylococcalenterotoxin B (SEB) and not due to contamination of this material withbacterial endotoxin. Moreover, after injection into rabbits SEB liberatesan endogenous pyrogen, which presumably mediates the ensuing fever. Pre-liminary evidence was also presented that after several daily intravenous(IV) SEB injections rabbits become pyrogenicly tolerant and such tolerancewas not associated with a demonstrable humoral protective factor. Duringthe past year studies have been initiated to quantitate more closely theenterotoxin pyrogenic tolerant state and define its mechanism of action inthe hope that such knowledge would aid in understanding the mechanism ofS-3'3s toxicity for normal animals.
In order to quantitate more closely these observations it was necessaryto obtain an SEB dose-response curve. Because of the wide variation ofpyrogenic responses to SEB among individual rabbits, however, this couldnot be done in the usual manner employing small groups of animals. As canbe seen at the top of Figure 1 he 2 animals receiving 1.0 4g/kg entero-toxin IV sLow markedly differern responses. The response at the left isminimal while that to the right ts exaggerated. Although not as marked,significant variability in rnsponse also occurs when animals are challengedwith 10.0 ig/kg. Because KE this wide variation in individual pyrogenicresponse a new system was developed so that the dose-response relationshipfor any group of animals could be predicted without employing large numbersof rabbits.
On day 0 a group of animals was tested with 1.0 4g!kg SEB IV. Animalswith uniformly minimal responses were selected; on day 4, or 3 days later,they were retested with 10.0 4g/kg. All animals showiig significantincreases in response to 10.0 4g were considered acceptable; the meanresponse to each of the 2 doses is shown in Figure 2. At the left isshown the composite fever curve for each dose and at the right the meanfever index. In this manner a dose-response relationship for th-se animalscould be established. lioreover, and most important, when rechallenged with10.0 kg/kg on day 7 the mean responses of these animals was unchanged. Thesignificance of this latter finding is that once the dose-response relation-ship has been established for a selected group of animals, such animals maybe employed experimentally and any change in responsiveness to SEB may beaccurately quantitated. In addition this observation demonstrates stillanother difference between SEB and bacterial endotoxin since even as littleas a single injection of endotoxin will confer significant pyrogenic toler-ance upon the rabbit at these time intervals.
* U. S. Arxy Medical Unit,
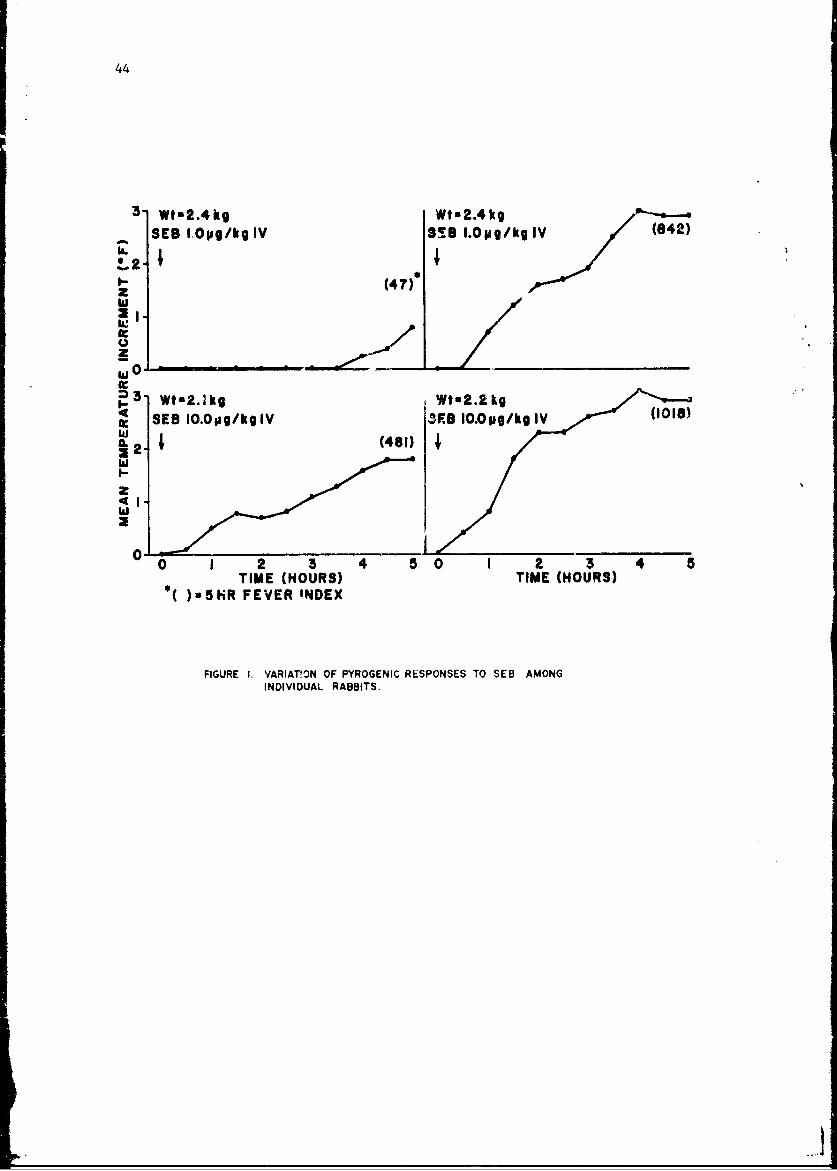
44
3" Wtn2.4kg Wt-2.4kg
SEB 10 ji/kg IV !8B l.opg/kg IV(82
S-(47)zI&IZIL
,3- Wtt2.kg2.kg
SEB IO.O0ag/kg IV ZES I0.Opg/kgIVIL2 (481)
I-I
z4 1.
•0 1 2 3 4 5 0 1 4 5
TIME (HOURS) TIME (HOURS)*( )-iHR FEVER INDEX
FIGURE I. VARIAT!ON OF PYROGENIC RESPONSES TO SEB AMONGINDIVIDUAL RABBITS.
...i "
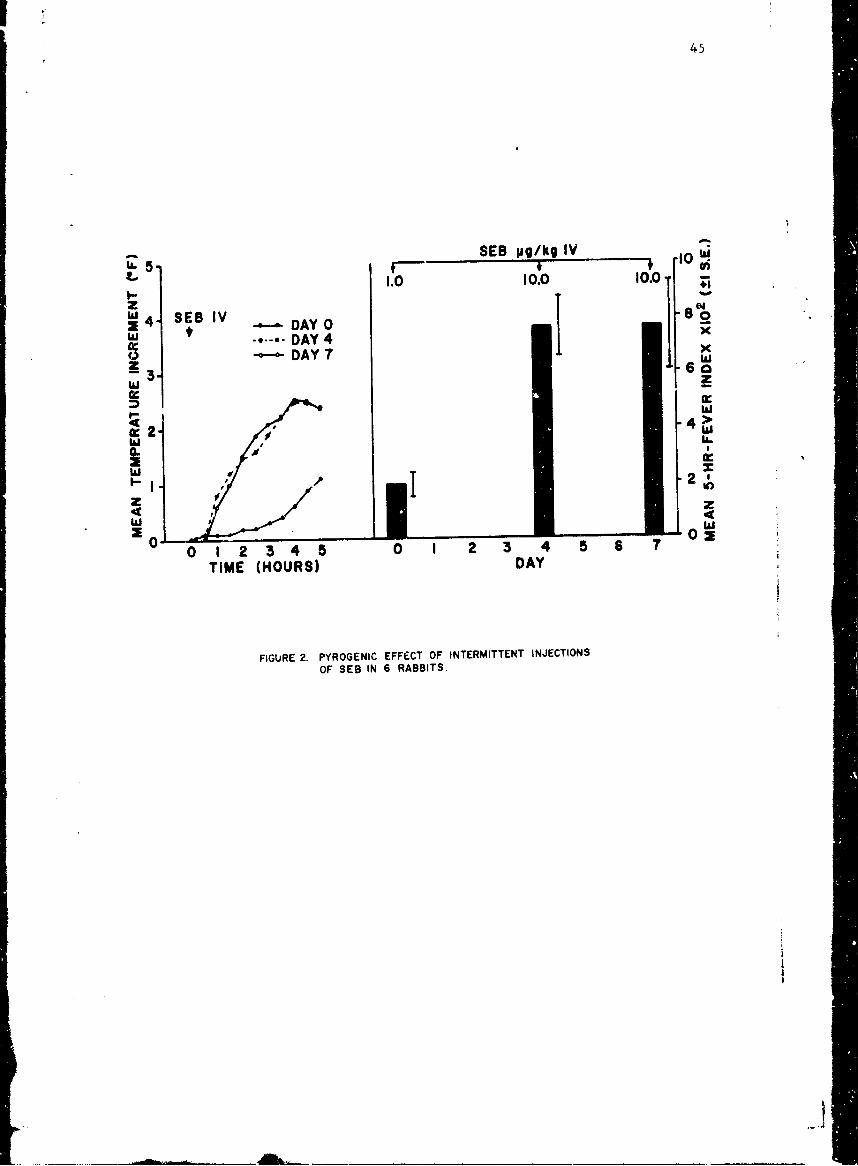
45
5 ~SEB pg/kg IV
1.0 10.0 10.0
SDAY 01
w -. DAY 4 I0 -o-o-DAY 7 xz ±6
-3a
w zww
4~ 4>
w I ,
00.2 3 I 2 S
IL
z4t
z
w <
FIGURE 2. PYROGENIC EFFECT OF INTERMITTENT INJECTIONSOF SEB IN 6 RABBITS.
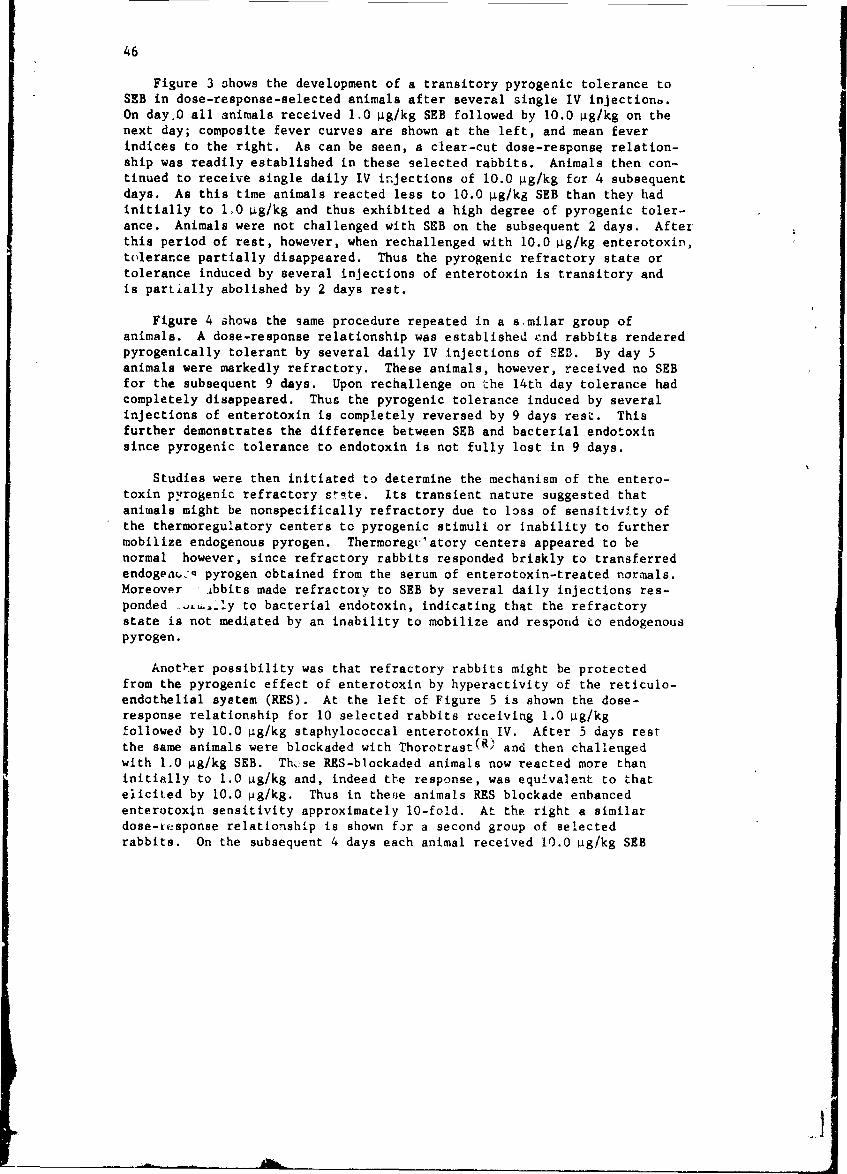
46
Figure 3 shows the development of a transitory pyrogenic tolerance toSEB in dose-response-selected animals after several single IV injectionb.On dayO all animals received 1.0 4g/kg SEB followed by 10.0 .g/kg on thenext day; composite fever curves are shown at the left, and mean feverindices to the right. As can be seen, a clear-cut dose-response relation-ship was readily established in these selected rabbits. Animals then con-tinued to receive single daily IV injections of 10.0 ýg/kg for 4 subsequentdays. As this time animals reacted less to 10.0 4g/kg SEB than they hadinitially to 1.0 4g/kg and thus exhibited a high degree of pyrogenic toler-ance. Animals were not challenged with SEB on the subsequent 2 days. Afterthis period of rest, however, when rechallenged with 10.0 ýig/kg enterotoxin,tolerance partially disappeared. Thus the pyrogenic refractory state ortolerance induced by several injections of enterotoxin is transitory andis partially abolished by 2 days rest.
Figure 4 shows the same procedure repeated in a slmilar group ofanimals. A dose-response relationship was established end rabbits renderedpyrogenically tolerant by several daily IV injections of SEE. By day 5animals were markedly refractory. These animals, however, received no SEBfor the subsequent 9 days. Upon rechallenge on the 14th day tolerance hadcompletely disappeared. Thus the pyrogenic tolerance induced by severalinjections of enterotoxin is completely reversed by 9 days rest. Thisfurther demonstrates the difference between SEB and bacterial endotoxinsince pyrogenic tolerance to endotoxin is not fully lost in 9 days.
Studies were then initiated to determine the mechanism of the entero-toxin pyrogenic refractory stte. Its transient nature suggested thatanimals might be nonspecifically refractory due to loss of sensitivity ofthe thermoregulatory centers to pyrogenic stimuli or inability to furthermobilize endogenous pyrogen. Thermoregt'atory centers appeared to benormal however, since refractory rabbits responded briskly to transferredendogenu-. pyrogen obtained from the serum of enterotoxin-treated normals.Moreover -. ibbits made refractozy to SEB by several daily injections res-ponded .L .ly to bacterial endotoxin, indicating that the refractorystate is not mediated by an inability to mobilize and respond to endogenouspyrogen.
Anotker possibility was that refractory rabbits might be protectedfrom the pyrogenic effect of enterotoxin by hyperactivity of the reticulo-endothelial system (RES). At the left of Figure 5 is shown the dose-response relationship for 10 selected rabbits receiving 1.0 pg/kgfollowed by 10.0 pg/kg staphylococcal enterotoxin IV. After 5 days restthe same animals were blockaded with Thorotrast(R) and then challengedwith 1.0 4g/kg SEB. Th:se RES-blockaded animals now reacted more thaninitially to 1.0 4g/kg and, indeed t1-e response, was equivalent to thatelicited by 10.0 pg/kg. Thus in theaie animals RES blockade enhancedenterotoxin sensitivity approximately 10-fold. At the right a similardose-response relationship is shown fir a second group of selectedrabbits. On the subsequent 4 days each animal received 10.0 ýig/kg SEB
.,.1'
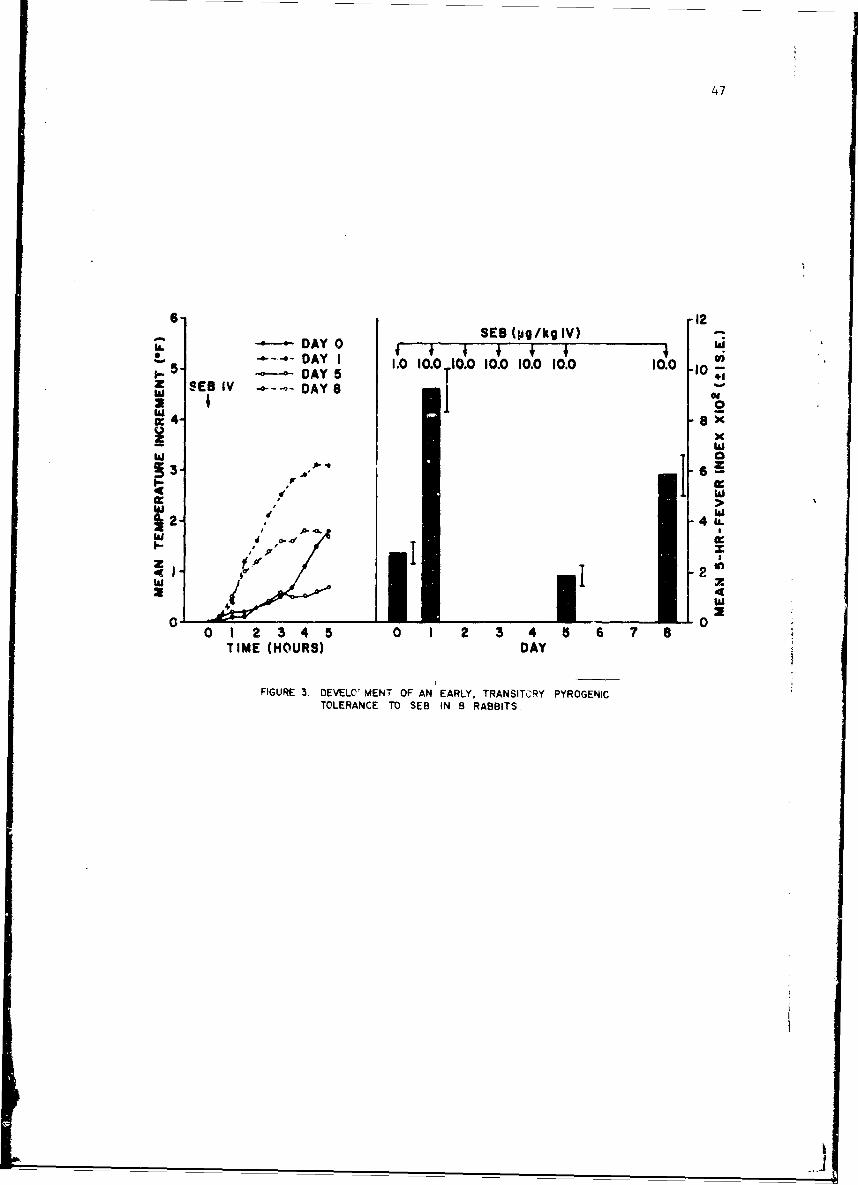
47
6 -12SEB (pg/kg IV) .L DAY 0 w-i l 1
-.---- DAY I 1.0 10.0 . 0 I0.0 I0.0 10.0 10.0
w" SEB IV - DAYS Iw, -,0*- -o- DAa: 4- ! x,
xw
% 3- .010-" q .6 zO-
Ir I
w
02
0 00 1 2 3 4 50 2 3 4 5 6 7 8
TIME (HOURS) DAY
FIGURE 3. DEVELOP MENT OF AN EARLY, TRANSITRY PYROGENICTOLERANCE TO SEB IN 9 RABBITS.
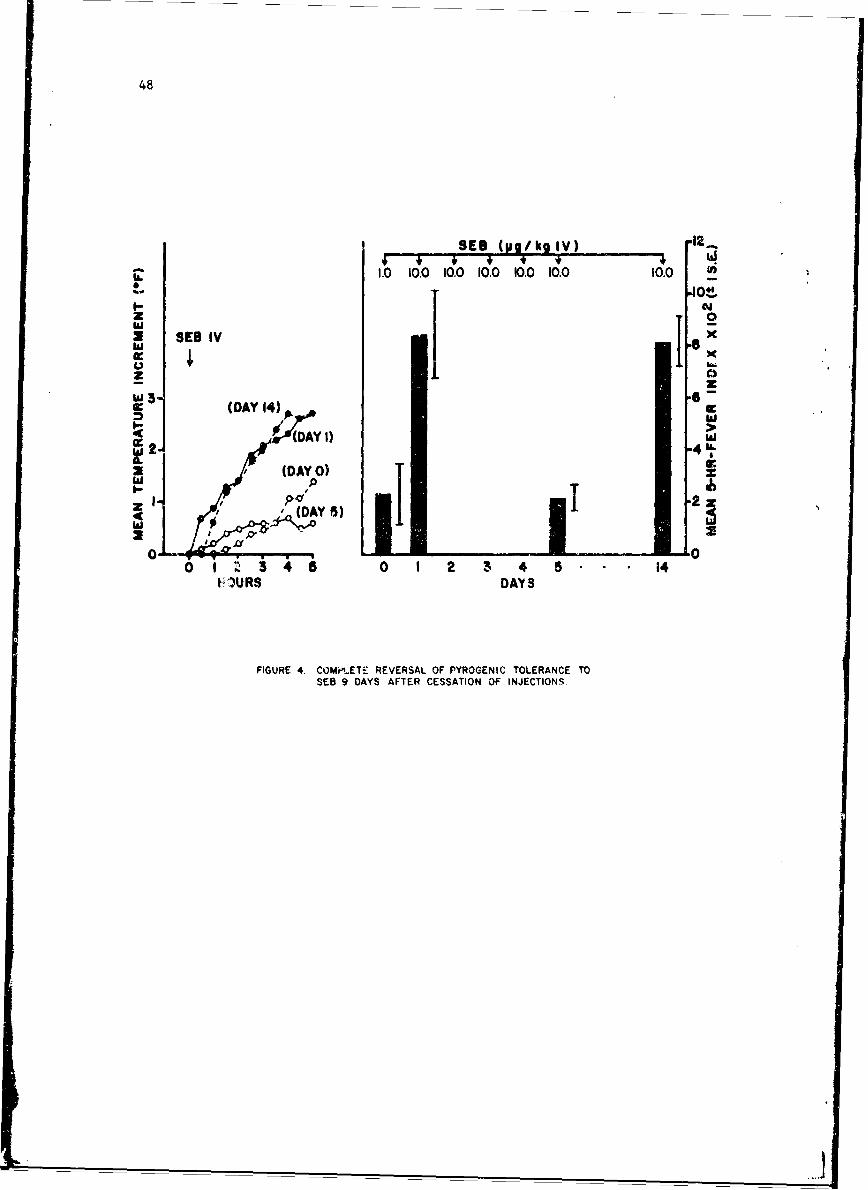
48
SEB (pg/kg IV) I2,Sl•~ ~ .i .0 * ,. ,.1.I001. 0.0 I0.0 10.0 10•.0
00.0
$E8 IV O
z I_ N
0IaI
2j .4.M.
DA jiC)z oa 2
(DA (DAY 1$
w 1 w
o 1 34, 0 1 2 3 4 5 14W)URS DAY S
FIGURE 4. COMO-ETE REVERSAL OF PYROGENIC TOLERANCE TOSES 9 DAYS AFTER CESSATION OF INJECTIONS.
49
CONTROL 1 10 REFRACTORY u 5SEB
S10. (pg/kg IV) THORO- SEB (pg/kg IV) THORO-TRAST f t f"ITRI IT
1.0 10.0 + 1.0 10.0 10.0 10.0 10.0 10.0 +SEB T SEB0 8-
xTw
z
a:
w
> 4
wl'.
0 1 2 3 4 5 6 0 I 2 3 4 5 6
DAY DAYTHOROTRAST 3 ml/kg IV + SEB Ipg/kg IV
FIGURE 5 EFFECT OF RES BLOCKADE ON SEB PYROGENICREFRACTORY STATE IN RABBI'lS.
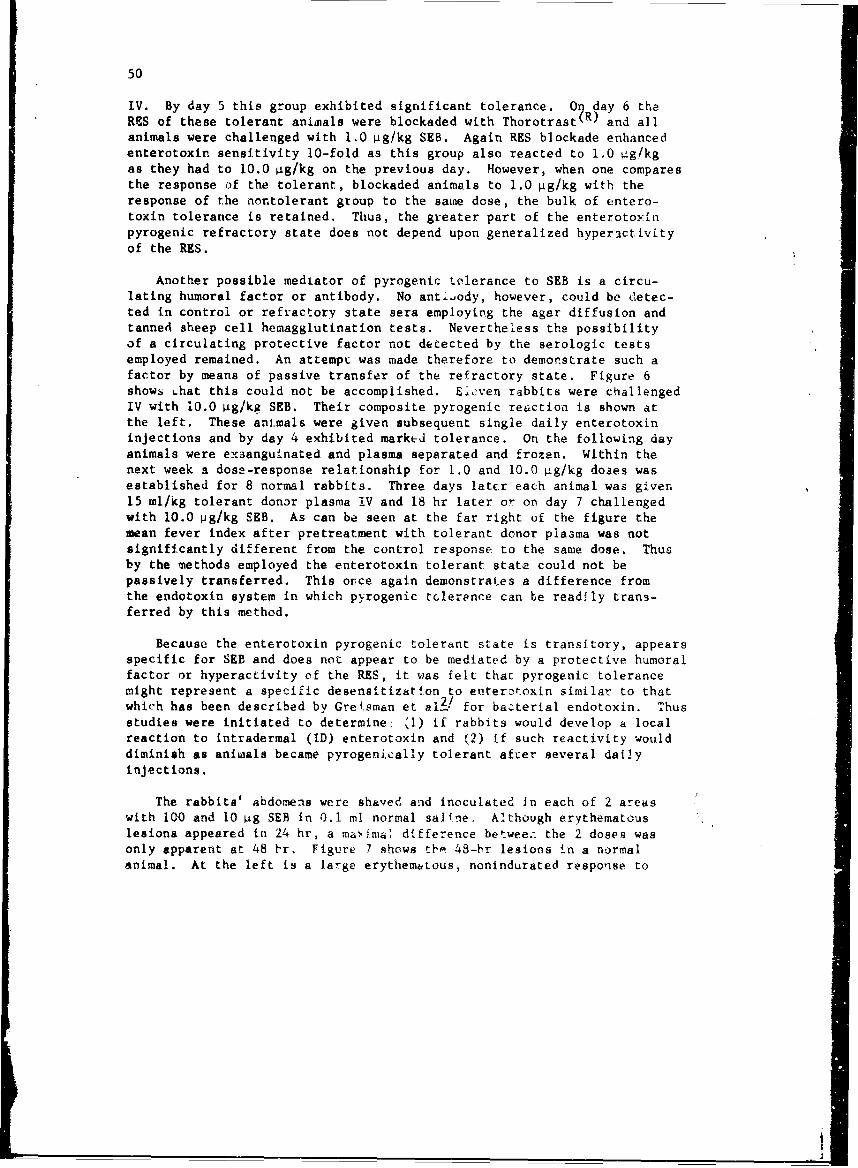
50
IV. By day 5 this group exhibited significant tolerance. Ol day 6 theRES of these tolerant animals were blockaded with Thorotrast(R) and allanimals were challenged with 1.0 4glkg SEB. Again RES blockade enhancedenterotoxin sensitivity 10-fold as this group also reacted to 1.0 ýtg!kgas they had to 10.0 4g/kg on the previous day. However, when one comparesthe response of the tolerant, blockaded animals to 1.0 4g/kg with theresponse of the nontolerant group to the sawe dose, the bulk of entero-toxin tolerance is retained. Thus, the greater part of the enterotoxinpyrogenic refractory state does not depend upon generalized hyperactivityof the RES.
Another possible mediator of pyrogenic tolerance to SEB is a circu-lating humoral factor or antibody. No antibody, however, could be detec-ted in control or refractory state sera employing the agar diffusion andtanned sheep cell hemagglutination tests. Nevertheless the possibilityof a circulating protective factor not detected by the serologic testsemployed remained. An attempt was made therefore to demonstrate such afactor by means of passive transfer of the refractory state. Figure 6shows Lhat this could not be accomplished. Eleven rabbits were challengedIV with 10.0 4g/kg SEB. Their composite pyrogenic reaction is shown atthe left. These animals were given subsequent single daily enterotoxininjections and by day 4 exhibited marked tolerance. On the following dayanimals were exaanguinated and plasma separated and frozen. Within thenext week a dose-response relationship for 1.0 and 10.0 ýig/kg doaes wasestablished for 8 normal rabbits. Three days later each animal was given15 ml/kg tolerant donor plasma IV and 18 hr later or on day 7 challengedwith 10.0 pg/kg SEB. As can be seen at the far right of the figure themean fever index after pretreatment with tolerant donor plasma was notsignificantly differenc from the control response to the same dose. Thusby the methods employed the enterotoxin tolerant state could not bepassively transferred. This orce again demonstrates a difference fromthe endotoxin system in which pyrogenic tclerance can be readily trans-ferred by this method.
Because the enterotoxin pyrogenic tolerant state is transitory, appearsspecific for SEB and does not appear to be mediated by a protective humoralfactor or hyperactivity of the RES, it was felt that pyrogenic tolerancemight represent a specific desensitization to epterotoxin similar to thatwhich has been described by Grelsman et al-/ for bacterial endotoxin. Thusstudies were initiated to determine: Jl) if rabbits would develop a localreaction to intradermal (ID) enterotoxin and (2) if such reactivity woulddiminish as animals became pyrogenically tolerant after several dailyinjections.
The rabbits' abdomens were shaved and inoculated in each of 2 areaswith 100 and 10 4g SEB in 0.1 ml normal saline. Although erythematouslesions appeared in 24 hr, a ma.ima' difference betwee.. the 2 doses wasonly apparent at 48 Fr. Figure 7 shows thm 48-br lesions in a normalanimal. At the left is a large erythembtous, nonindurated response to
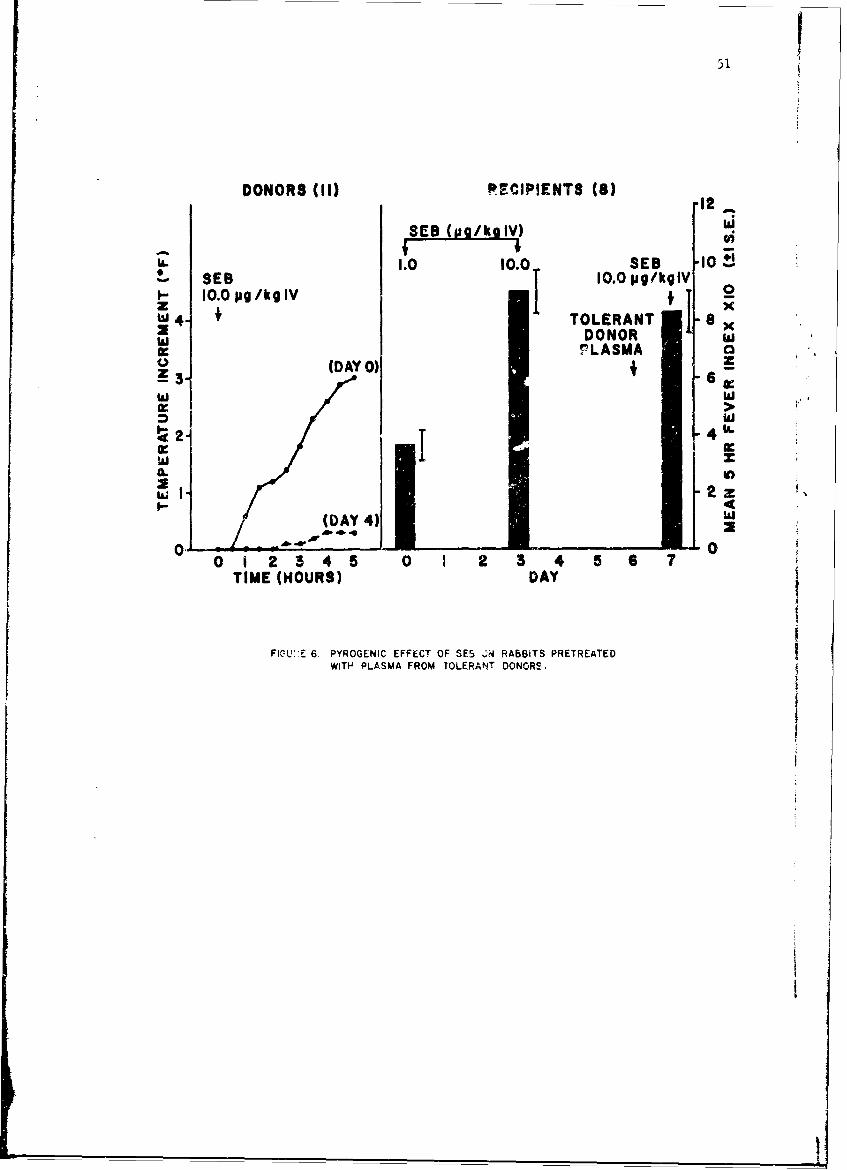
DONORS (11) PSCIPIENTS (6) ,12
I0I1.0 10.0 SEB 10SEB 1000.0 pgtkglV
10.0 O.O/kg IV 0w 4" TOLERANT .8
DONOR wo (DAY O) 4z
3. - cc
I.- 4
(DAY 4)01.. 0
0 1 2 3 4 5 0 2 3 4 5 6 7TIME (HOURS) DAY
FIC-UL- 6. PYROGENIC EFFECT OF SE5 •N RABBITS PRETREATEDWITH PLASMA FROM TOLERANT DONORS.
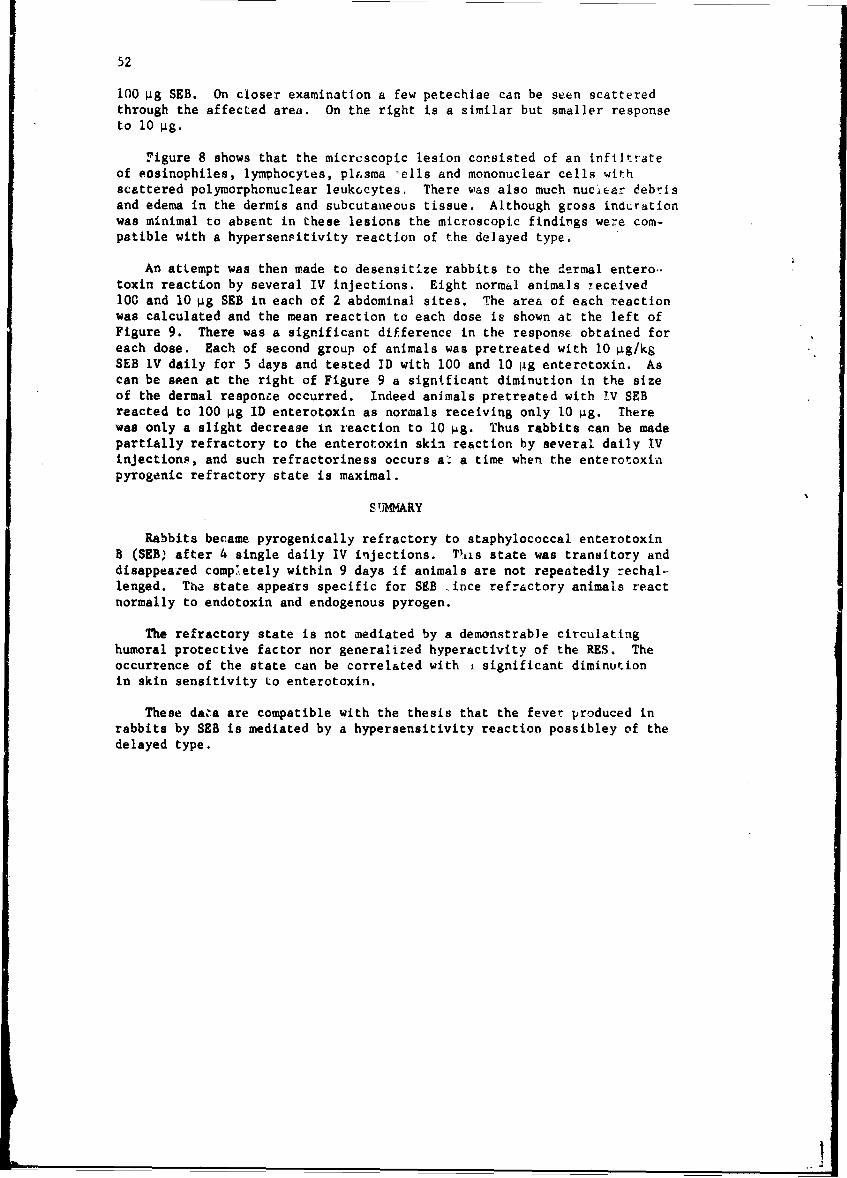
52
100 pg SEB. On closer examination a few petechiae can be seen scatteredthrough the affected area. On the right is a similar but smaller responseto 10 pg.
Figure 8 shows that the micrescopic lesion consisted of an infiltrateof eosinophiles, lymphocytes, pl&sma -ells and mononuclear cells withscattered polymorphonuclear leukocytes, There was also much nuclear debrisand edema in the dermis and subcutaneous tissue. Although gross indurationwas minimal to absent in these lesions the microscopic findings were com-patible with a hypersensitivity reaction of the delayed type.
An atLempt was then made to desensitize rabbits to the dermal entero..toxin reaction by several IV injections. Eight normal animals received100 and 10 pg SEB in each of 2 abdominal sites. The area of each reactionwas calculated and the mean reaction to each dose is shown at the left ofFigure 9. There was a significant difference in the response obtained foreach dose. Each of second group of animals was pretreated with 10 4g/kgSEB lV daily for 5 days and tested ID with 100 and 10 pig enterotoxin. Ascan be seen at the right of Figure 9 a significant diminution in the sizeof the dermal responce occurred. Indeed animals pretreated with !V SEBreacted to 100 pg ID enterotoxin as normals receiving only 10 pg. Therewas only a slight decrease in reaction to 10 jg. Thus rabbits can be madepartially refractory to the enterotoxin skin reaction by several daily IVinjections, and such refractoriness occurs a* a time when the enterotoxinpyrogenic refractory state is maximal.
SUMMARY
Rabbits became pyrogenically refractory to staphylococcal enterotoxinB (SEB. after 4 single daily IV injections. Týk1s state was transitory anddisappeared comp'tetely within 9 days if animals are not repeatedly rechal.-lenged. Tha state appears specific for SEB ince refractory animals reactnormally to endotoxin and endogenous pyrogen.
The refractory state is not mediated by a demonstrable circulatinghumoral protective factor nor generalized hyperactivity of the RES. Theoccurrence of the state can be correlated with i significant diminutionin skin sensitivity Lo enterotoxin.
These data are compatible with the thesis that the fever produced inrabbits by SEB is mediated by a hypersensitivity reaction possibley of thedelayed type.
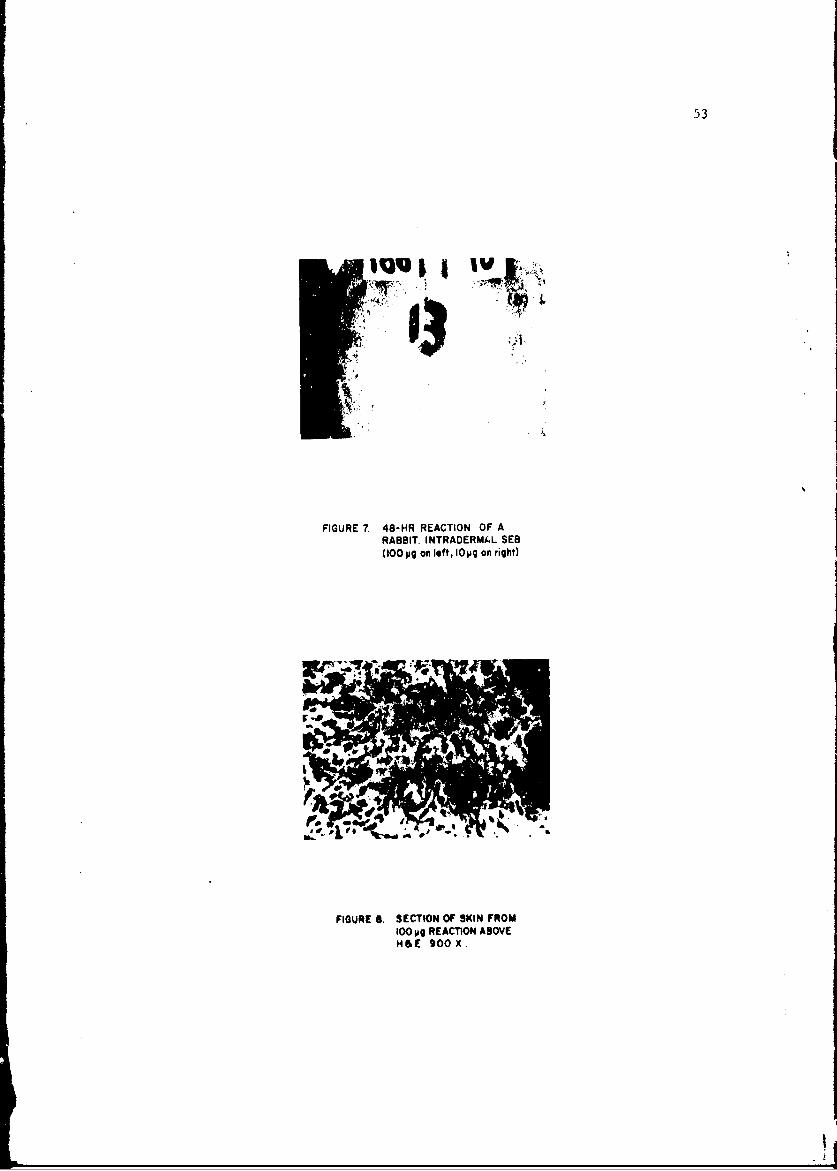
53
11
FIGURE 7 48-HR REACTION OF A
RABBIT. INTRADERMAL SEB(100 pg on left, 10 g on right)
FIGURE 8. SECTION OF SKIN FROM
iOOmg REACTION ABOVEHIE 900X
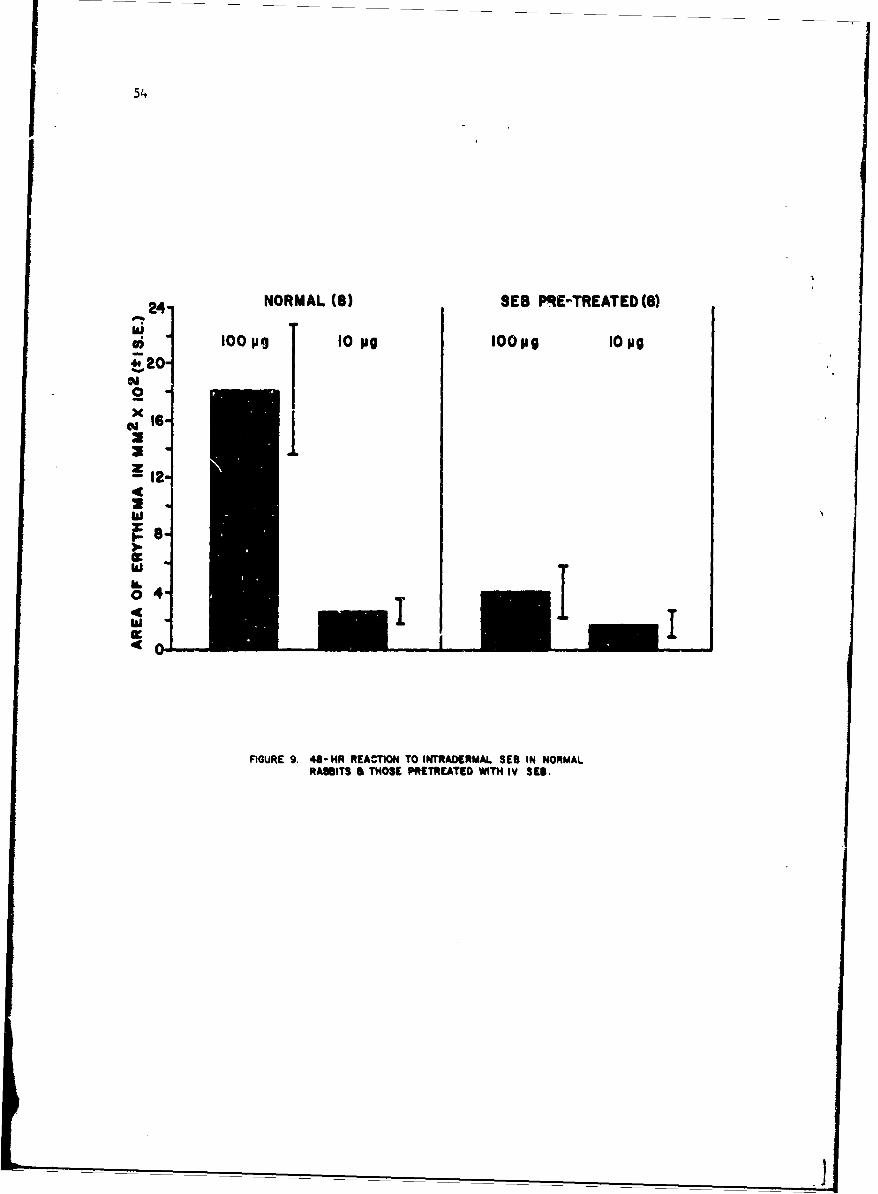
54
24- NORMAL(S SEB PRE-TREATED(8)
100 pag 10 pg lOOpg 10 pg
to20
x
@12
IIL0 42
of
FIUE9 0 H ECINTOITAEML E NNRARA IS& HS lERAIE IH VSS
55
LITERATURZ CITED
1. Carozza, F. A. 1966. Pyrogenic effects of staphylococcal enterotoxin B.p. 1 to 13. In H. G. Dangerfield (compiler) Special Report to the Com-mission on Ep-idemiological Survey of the Armed Forces EpidemiclogicalBoard. U. S. Army Medical Unit, Fort Detrick, Maryland.
2. Greisman, S. E., E. J. Young, and W. E. Woodward. 1966. Mechanisms ofendotoxin tolerance. IV. Specificity of the pyrogenic refractory stateduring continuous intravenous infusions of endotoxin. J. Exp. .4ed. 124:983-1000.
57
RECENT STUDIES ON ANTHRAX TOXIN
Martha K. Ward, Captain, USPHS, Mary H. Wilkie, MS.,and Anne Buzzell, Ph.D.*
Work on anthrax toxin in other laboratories has been concerned largelywith studies on its three recognized components, separately isolated andpurified. Each of these fractions is nontoxic when injected alone, butactive in appropriate recombinations. One component, which appears to beidentical with the immunizing, protective antigen (PA) is essential fordemonstration of activity in all recombinations. The component which incombination with PA produced edematous lesions in the skin of guinea pigsor rabbits after intradermal inoculation, is called edema factor (EF).The other, which when combined with PA causes death in certain speciesafter intravenous (IV) challenge, is called lethal factor (LF).
For several reasons, it seemed desirable to attempt to concentrateculture filtrates d,:4 purify that portion responsible for toxic activitywithout prior fractionation into its 6eparate components. We have beenworking toward this goal over the last several years. In a previousreporti/ we described a simple ultrafiltration method for concentrationof whole crude toxin. Small diameter dialysis tubing is used as thefiltering membrane, in a continous flow system under negative pressure.All detectable biological and antigenic activity remains in the dialysissac after processing. This ultrafiltrate residue, harvested by "back-washing" with Tris buffer, has been designated UFR. In 1964 we reported./the results of initial studies, designed to characterize the biologicalactivity, storage stability and immunogenicity of this material. At lastyear' s meeting, one of us (A.B.) presented workl/ on some of the biophysicalcharcteristics of UFR.
hvitial studies on purification and biochemical characterization of theconcentrated toxin had to be interrupted at an early stage. This work hasbeen resumed only recently, but it now appears that it will be entirelyphased oul. -f our research program within the next few months. For thisreason I shouid like not only to describe current studies on the toxin butalso to review briefly other work that seems pertinent to our presentinterpretation ot available data on the nature of this material,
Results of scudies on UFR employing electrophoresis on paper, celluloseand gel discs all indicate greatest resolution under conditions best forstudy of peptides and small proteins. On disc electrophoresis, at least16 proteins staining baruds were obaerved in freshly prepared or freshlythawed frozen preparations. Upon heating at 35 C for 30 min to 1 hr thenumber of bands increased initially, but there was no immediate decreaseof rat lethal activity. After 4-6 hr at this temperature, the number ofproteiti staining bands decreased and the amount of ninhydrin staining
* U. S. Army Medical Unit.
58
material increased. Biological activity rapidly decreased upon heatingfor > 6 hr and was entirely lost after 24 hr. Similar charges in discpattern and biological activity occurred upon storage at 4 C, but muchmore slowly.
Immunodiffusion of longitudinal sections of the acrylamide discsagainst antiserum prepared by hyperimmunization of a burro, with sporeva:cine, showed that many of the 16 banc; seen in the stained disc sharedcommon antigenic determinants. At least 3 components, of which one wasprotective antigen, formed continuous lines of immune precipitate downthe length of the disc. The presence of 3 o: 4 antigenic componentsidentifying throughout the disc pattern was confirmed by reacting trans-verse sections of the column against burro antiserum in identity plates.These findings suggested that at least 3 components in UFR were in variousstates of polymerization, were complexing with other substances, or wereextensively fragmented.
The UFR was examined by the standard agar gel immunoelectrophoresis4/method; test samples were reacted against the standard burro antiserumand also against antisera prepared in rabbits by immunization withrepeated doses of UFR, combined with Freund's complete adjuvant. Only 5or 6 antigens, of which 2 were major, were demonstrated in studies withthe burro antiserum. With the rabbit antiserum about 12 lines of equalintensity developed. All antigens detected by burro antiserum were alsodemonstrated with rabbit, but 5 or 6 other antigens in UFR, reacting withrabbtt antisera, were not detected by the serum of the burro immunizedwith the spore vaccine. A comparison with partially purified protectiveantigen showed that the PA fra~tion of UFR migrated in agar gel in aposition comparable to serum /2 globulins and that other componentsmigrated in positions anodic to PA.
In preliminary experiments with ion exchange columns, it was foundthat the UFR proteins were bound in varying degrees to DEAE-cellulose inthe hydroxyl, chloride, bicarbonate, or acetate forms but not in thephosphate form. The proteins were eluted by increasing concentrationsof phosphate, acetate, or bicarbonate buffers in a neutral pH range. Theconcentration of buffer at which each toxin .:omponent was eluted was thesame for all buffers used.
A column equilibrated and eluted with ammonium acetate buffers waschosen as the refe-ence preparative column because of better yields,higher activity of products and the convenience of use of a volatilebuffer.
TIn Ftgure I, a chromatogram of rFR on such a column is shown. Thecomponents eluted in the peeks were identified by reactions with antibodyand biolo8ical activity on recombination. IF was located in peaks I andIII; some PA also appeared in T'! but was found mainly in peak IV, LF wasidentified in peaks V7 and VI!. ThL proteins in peaks !I, V, and VIII
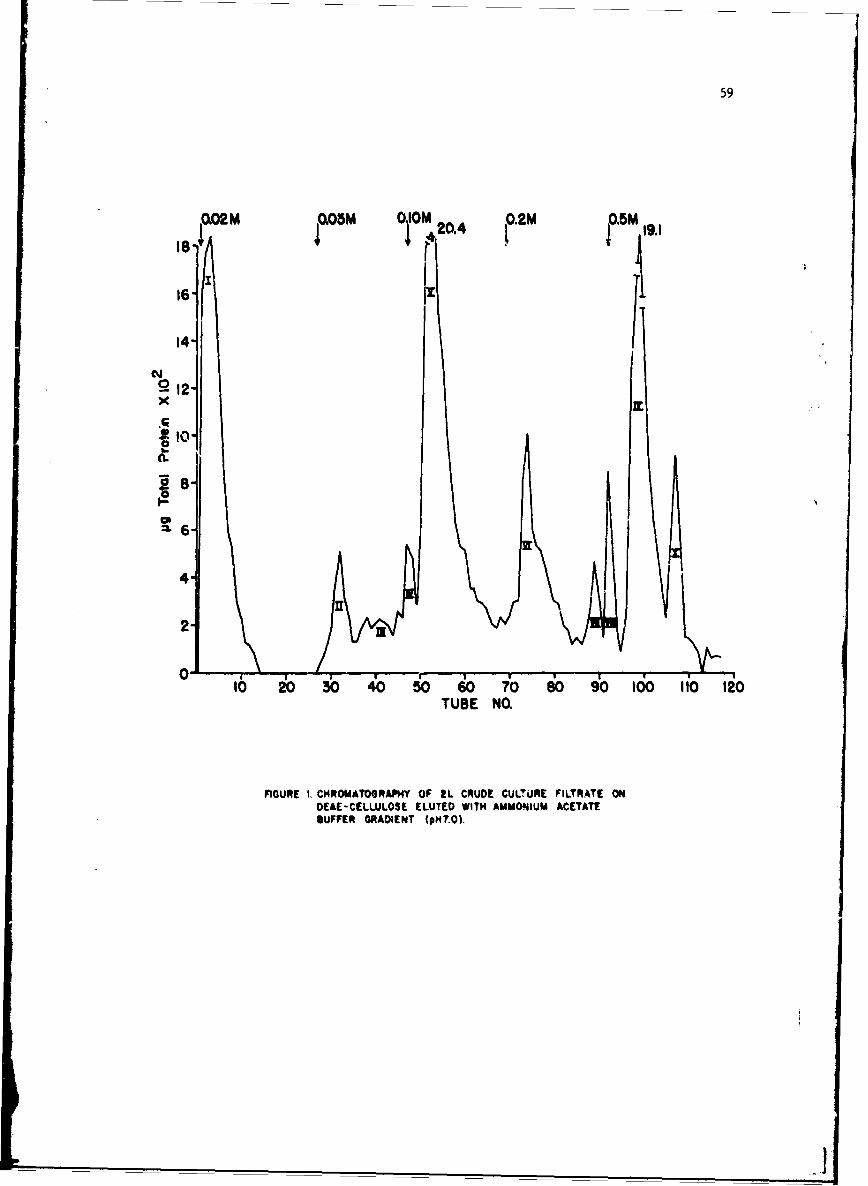
59
OQ02M O.0m QIOM 0.2M 0.5m2 0 .4 19.1
14 [2o_12-
0ix .
90-
6-
4
2
0o 16 p '. Io Io I o• ' c ,1O 20 30 40 50 60 70 80 90 100 16O 12'0
TUBE NO
FIGURE I, CHROMATOGRAPHY OF IL CRUDE CULTURE FILTRATE ONDEAE-CELLULOSE ELUTED WITH AMMONIUM ACETATESUFFER GRAODENT (pH?.O).
II
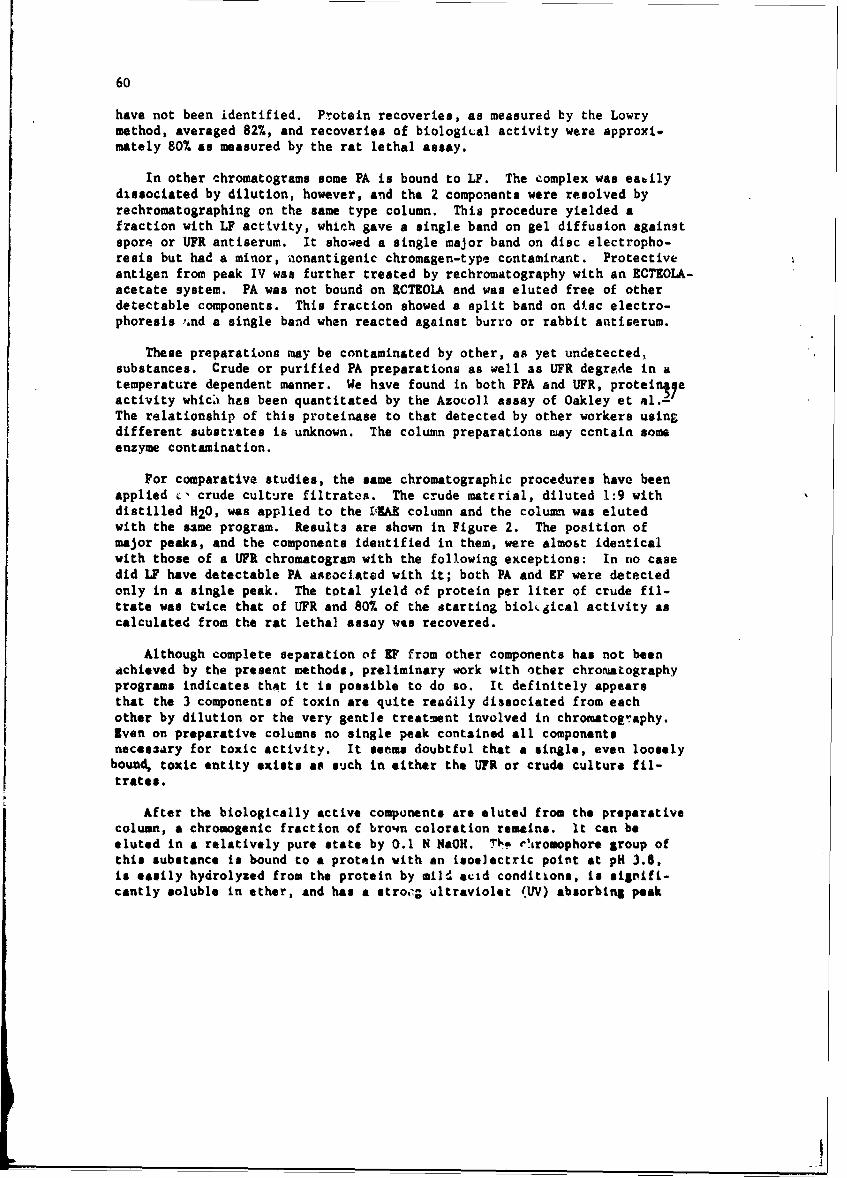
60
have not been identified. Protein recoveries, as measured by the Lowrymethod, averaged 82%, and recoveries of biological activity were approxi.mately 80% as measured by the rat lethal assay.
In other chromatograms some PA is bound to LF. The complex was eabilydissociated by dilution, however, and the 2 components were resolved byrechromatographing on the same type column. This procedure yielded afraction with LF activity, which gave a single band on gel diffusion againstspore or UFR antiserum. It showed a single major band on disc electropho-resis but had a minor, aonantigenic chromagen-type contaminant. Protectiveantigen from peak IV was further treated by rechromatography with an RCTEOLA-acetate system. PA was not bound on RCTKOIA and was eluted free of otherdetectable components. This fraction showed a split band on disc electro-phoresis ind a single band when reacted against burro or rabbit antiserum.
These preparations may be contaminated by other, as yet undetected,substances. Crude or purified PA preparations as well as UFR degrade in atemperature dependent manner. We hsve found in both PPA and UFR, proteinteactivity whic4 has been quantitated by the Azocoll assay of Oakley et J1l.-The relationship of this proteinase to that detected by other workers usingdifferent substrates is unknown. The column preparations may contain someenzyme contamination.
For comparative studies, the same chromatographic procedures have beenapplied c- crude culture filtrates. The crude material, diluted 1:9 withdistilled H20, was applied to the DW column and the column was elutedwith the same program. Results are shown in Figure 2. The position ofmajor peaks, and the components identified in them, were almost identicalwith those of a UFR chromatogram with the following exceptions: In nio casedid LF have detectable PA aseociated with it; both PA and EF were detectedonly in a single peak. The total yield of protein per liter of crude fil-trate was twice that of UFR and 80% of the starting biolh&ical activity ascalculated from the rat lethal assay was recovered.
Although complete separation of EF from other components has not beendchieved by the present methods, preliminary work with other chromatographyprograms indicates that it is possible to do so. It definitely appearsthat the 3 components of toxin are quite readily dissociated from eachother by dilution or the very gentle treatment involved in chromuatography.Sven on preparative columns no single peak contained all componentsneces*ary for toxic activity. It seems doubtful that a single, even loosely
bound, toxic entity exists as such in either the UFR or crude culture fil-trates.
After the biologically active components are esuted from the preparativecolumn, a chromogenic fraction of brown coloration remains. It can beeluted in a relatively pure state by 0.1 N NaOH. T)! "'iromophore group ofthis substance is bound to a protein with an isoelectric point at pH 3.8,is easily hydrolyzed from the protein by mild acid conditions, is signifi-cantly soluble in ether, and has a stro.p; ultraviolet (UV) absorbing peak
.1
Sil
0.02M 0.05M OIOM 0.20M 0.5M
6-
4.
0
10*
cL -
o -! ..........
10 20 30 40 50 60 70 80TUBE NO.
ef1G4A 2Z CHROMATOGRAPHY OF I il U1R (?itX) ONe DEAE-CELLULOSE FLUTED W"Th AMWONIUM ACETATE*UFFfrR GRAO4ENT (pNH O).
-__ ____" ___ ____"____.. .. ... __ ___ __ __"___ ___"_ _,___ ___ __ ___ _I.1!
62
at 260 aii. The substance is nonantigenic; its spectrum is unaffected byferric ions; and the pigmentation is increased by reduction with cysteine.This substance is of interest because, although it varies from batch tobatch, it can represent as much as 40% of the total protein recovered; itis a ,.biquitous contaminant in earlier protein fractions; its high UVabsorption at 260 Wt may be responsible for the peak at this wave lengthof whole UFR; and it may be related to the material absorbing at 260 qLin EF preparations described by the British workers.A/ It appears to bedifferent from the red-pink pigment described by other investigators.
Other acid-hydrolyzable, ether-soluble compounds, as yet unidentified,are present in UFR and in isolated fractions. OxLe compound whose spectrumshifts on addition of Ca ion has been observed. Another compound in peakII of a crude culture filtrate chromatogram is inactive when protein bound,but zeduces strongly when hydrolyzed. The significance of these materialsis as yet unknown.
One of the considerations stimulating attempts to concentrate activematerial in crude toxic filtrates without prior separation into recognizedcomponents, was the question of whether or not toxic activity could beisolated as a single entity. It seemed possible that if the organismproduced toxin as a single molecule composed of several components whichwere weakly bound, the filtration through sintered glass might contributeto its fragmentation. The work reported h&re appears to support the viewthat "toxid' does not exist as a distinct chemical entity per se. Further-more, whether or not this material should be called "a toxin" or even"toxins," ig the sense of the word as generally used, is open to debate.LCDR Gaspar!/ in our laboratory first demonstrated that injections of PAfollowed by LF within 1 hr still caused death in the rat. When LF wasinjected first, followed by PA, the time oJ/the 2nd injection could beextended for > 4 hr. Molnar and Altenbern- who confirmed and extendedthese studies, also demonstrated that the lethal effect of fully toxicmixture of PA and LF could be prevented by prior injection of PA but notof LF. The results of i single experiment in our labor-tory using PAtagged in vitro wich Il3l indicates that this material after IV injectionis rapi*ly •leared from the blood stream of mice. The work of Molnar andAltenbern,l/ indicates that this is also true in the rat, and that LF canbe detected in the circulation for a much longer period of time. Theseotudiea suggest that the components necessary for de;no•|stration of toxicitymay be acting in sequence (at least in the rat) rather than in true combi-nation.
Our work indicates considerAble heterogeneity of components in the UFR.It seams likely that there is significant protein-protein interaction ofmaterials in Lhe preparations concentrated by the method us.ee There isevidence to suggest that active components of UFR polymeri-e in what nowappears to be a quite regu er f~shion. The work of one of us (A.B.) isconsistent with the hypothesis that the protective antigen component ofUPI forms relatively stable, even numbered aggregates by a process of
I]63
successive dimerization. Lethal factor saems to be of dimensions closelysimilar to PA, although chromatographic studies indicate that it ischemically distinct. Single molecules of LF appear to attach to dimersand tetramers of PA but not to single particles. However, as noted earlier,results of work with chromatography suggest that the attachment to LF and PAis readily reversed and probably plays little part p s!e in the mechanismof toxic action.
Some preliminary experiments indicate that treatment with UFR with 2 Murea, results in complete destruction of lethal activity for rats and most ofthe antigenic uctivity of the sample. Disc electrophoresis of urea-treatedUFR showed an entirely new pattern of bands; chromatography resulced in a newelution pattern. These results suggest that very weak (or few) hydrogenbonds may be involved in the integrity of one or more components or in thestructure of polymers.
UFR is a highly complex and dynamic mixture. In all honesty we mustadmit that our work has provided more questions than answers. About th3only thing we can say with complete certainty is that this is an extremelyinteresting and challenging material with which to wozk, albeit at times achemist's and biologist's nightmare.
SUMMARY
Literature on the nature of the three components of anthrax toxin andconditions affecting toxigenesis was reviewed. Recent studies on the bio-chemical and bicphysical properties of toxic filtrates concentrated by anultrafiltration wk.tbod were presented. Available evidence suggest that:(1) "toxin' is not & single chemical entity per se but that its threerecognized components exist separately and in the uncombined state in cul-ture filtrates; (2) toxic filtrates are highly complex and dynamic mixturesin which considerable protein-protein interaction, proteinase activity andpolymerization of antigenic components occurs; (3) previously unrecognizedoxidation-reduction systema and materials of high chelating activity arepresent in the preparations studied. The biological significance of thesecomponents is not known.
LITERATURE CITED
1. Ward, M. K. February 1964. Recent progress in anthrax studies. p. Ito 6. In Annual Report - 1963, Commission on Epidemiological Survey,Armed Forces Epidemiological Board. U. S. Army Medical Unit, FortDetrick, Maryland.
2. Ward, V., K. December 1964. Studies on anthrax toxin. p. 49 to 55. InAnnual .keport - 1964, Commission on Epidemiological Survey, Armed Forceshpidimiological Board, U. S. Army Medical Unit, Fort Detrick, Maryland.
64
3, Buzzell. A. February 1966. Possible polymer configurations of anthraxtoxin components. p. 39 to 45. In Commission on Epidemiological Survey,Annual Report to the Armed Forces Ipidemiological Board, Fiscal Year1965. U. S. Army Medical Unit, Fort Detrick, Maryland.
4. Scheidegger, J. J. 1955. Urze micro-methode de l'immuno-electrophorese.Int. Arcn. Allerg. 7:103-110.
5. Oakley, C. L., G. H. Warrack, and W. E. van Heyningen. 1946. Thecollagenase (k-toxin) of Clostridium welchii type A. J. PatW, Bact. 58:229-235.
6. Smith, H., J. Keppie, and J. L. Stanley. 1955. The chemical basis ofthe virulence of Bacillus anthracis. V. The specific toxin producedby B. anthracis in vivo. Brit. J. Exp. Path. 36:460-472.
7. Gaspar, A. J. Unpublished data.
8. Molnar, D. H., and R. A. Altenbern. 1963. Alterations in the biologicalactivity of protective antigen of Bacillus anthracis toxin. Proc. Soc.Exp. Biol. Med. 114:294-297.
65
INFLUENCE OF PNELMOCOCCAL INFECTION ON A HOST ENZYME SYSTEM
Morton I. Rapoport, Major, MC*
For over 60 years it has been known that certain enzymes in microorganismsare formed only in the presence of their specific substrates. Knox et alitreported that Karstrom named this phenomenon enzymatic adaptation; it has beenthe subject of a great deal of eyperimentation, speculation and a recent Nobelprize. With the advent of more refined methods of tissue enzyme analysis hascome the knowledge that numerous animal tissue enzymes are also subject toadaptive responses similar to those observed in microorganisms. Alterationsof enzymes or other specific proteins within tissues have been observed as amanifestation of a number of host adaptive responses. These alteratiqns havebeen correlated with changes in diet, aging,- and even time of day.!/ Like-wise various disease processes have also been studied and shown to induLemetabolic adaptations. However host enzymatic changes secondary to the infec-tious process have not been extensively studied. It therefore seemed appropri-ate to investigate changes in tissue enzymes in infected animals to learn moreregarding early biochemical or metabolic alterations within the host duringthe infectioLs process.
The hepatic enzyme, tryptophan pyrrolase, was selected by us for specificdetailed study for a number of reasons: (1) changes in the activity of thisenzyme have been observed by several groups after induiced infection or endo-.toxemia in laboratory animals, (2) the enzyme has an extremely rapid turnoverrate, and (3) it appears to be the rate-limiting requirement for a vitalmetabolic pathway, (4) its activity is partially related to adrenal hormoneconcentrations.
The half-life of this enzyme has been estimated t be less than 2 hr, asopposed to average tntal hepatic protpin -ynthertb which varies from 2 to 3days. The enzyme is rate-limiting for the conversion of tryptophan to formyl-kynurenine which leads in turn to the eventual biosynthesis of nicotinamide.
Knox and Auerbach.3/ in 1954 showed that adrene.l steroids were capable ofinducing marked increases in hepatic tryptophan pyrrolase activity in ratswithin 2 to 3 hr. They also showed that the adrenalectomized state wasassociated with reJuce! cn~yna acti~ity. In cther studies, tryptophan, thesubstrate, was shown to increase enzyme activity within 2 hr of administration.However, corticoid ant the substrate induced changes in enzyme activiappeared to reaulL 'roiL diff:rent mechanisms. Schimke and co-workeres...reported that adrenal steroids incre&sed tryptophan pyrrolase activity byincreasing thLe rate of m-kMN s)nthesis. In contrast, the increased enzymeactivity attribuuttc t: trypt•phar. aduiristatlon resulted not from newenzyme synthesis but rather from a stabilization of previously formed enzyme;
* U. S. Army Medical Unit.
66
this stabilization resulted in a reduction in the degradation rate.Various cofactors and metal ions such as hematin, Cu and Mn have beenshown to increase tryptophan pyrrolase activity. In addition to theprotein synthetic inhibitors such as actlnomycin and puromycin that arjassociated with reduced tryptophan pyrrolase activity, Rivlin and Knox.&observed that bovine growth hormone given to mice markedly reduced enzymeactivity within several hours of its administration. Therefore adrenalsteroids and growth hormone have antagonistic actions relative to trypto-phan pyrrolase activity.
Infection-produced alterations in tryptophan pyrrolase activity havebean observed by several groups. Berry and Smythe2j-/ have reported theinfluence of bacterial endotoxin on mouse tryptophan pyrrolase activity.Early stimulation followed by a variable period of inhibition of enzymesynthesis was observed. Pretreatment of mice with cortisone seemed tocounteract the inhibitory influeice of endotoxin on the enzyme. Thesedata prompted Berry to speculate that the glucocorticoids were beneficialin endotnxemia because of their ability to increase tryptophan pyrrolaseactivity and thereby maintain a very vital biosynthetic pathway.
Kong and Smithi8/ reported an inhibition of tryptophan pyrrolaseactivity within 1 hr of massive infection with Staphylococcus aureus.However, experiments testing the influence of adrenal steroids were notdone by these workers.
In a previous presentation to this group Lusti/ reported that general-ized infection with type IA-5 pneumococcus in mice was associated withearly increases in hepatic protein synthesis as evidenced by increasedincorporation of C14 leucine into microsomal protein. It therefore seemeddesirable to study the influence of generalized pneumococcal infection ontryptophan pyrrolase activity in an attempt to determine if this particularsingle hepatic protein with known rapid kinetic changes, might serve as anappropriate model system to study mechanisms of altered protein synthesisduring acute infection.
Male CD-1 mice weighing 12-16 gm were used in all experiments. Infec-tion with a virulent type IA-5 pneumococcus was accomplished ..ubcutaneouslyand two different dose levels were used. Control animals received anequivalent volume of culture media and were handled in a similar Lanner toinfected mice. A small inoculum of pneumococcus -antaining 50-100 organismsgiven subcutaneously in the back was generally lethal within 30-40 hr.Clinical illness characterized by ruffled fur, anorexia, and reducedphysical activity was apparent within 16-24 hr. A large inoculum of5,000,000 to 10,000,000 organisms administered subcutaneously was alsoused in selected experiments. With the large inoculum, clinical illnesswas apparent within 8-12 hr and death occurred within 16-26 hr. A tran-sient bacteremia was present within 30 min in both infections. A septi-cemtc pattern became prominent shortly prior to the onset of clinicalsymptoms.
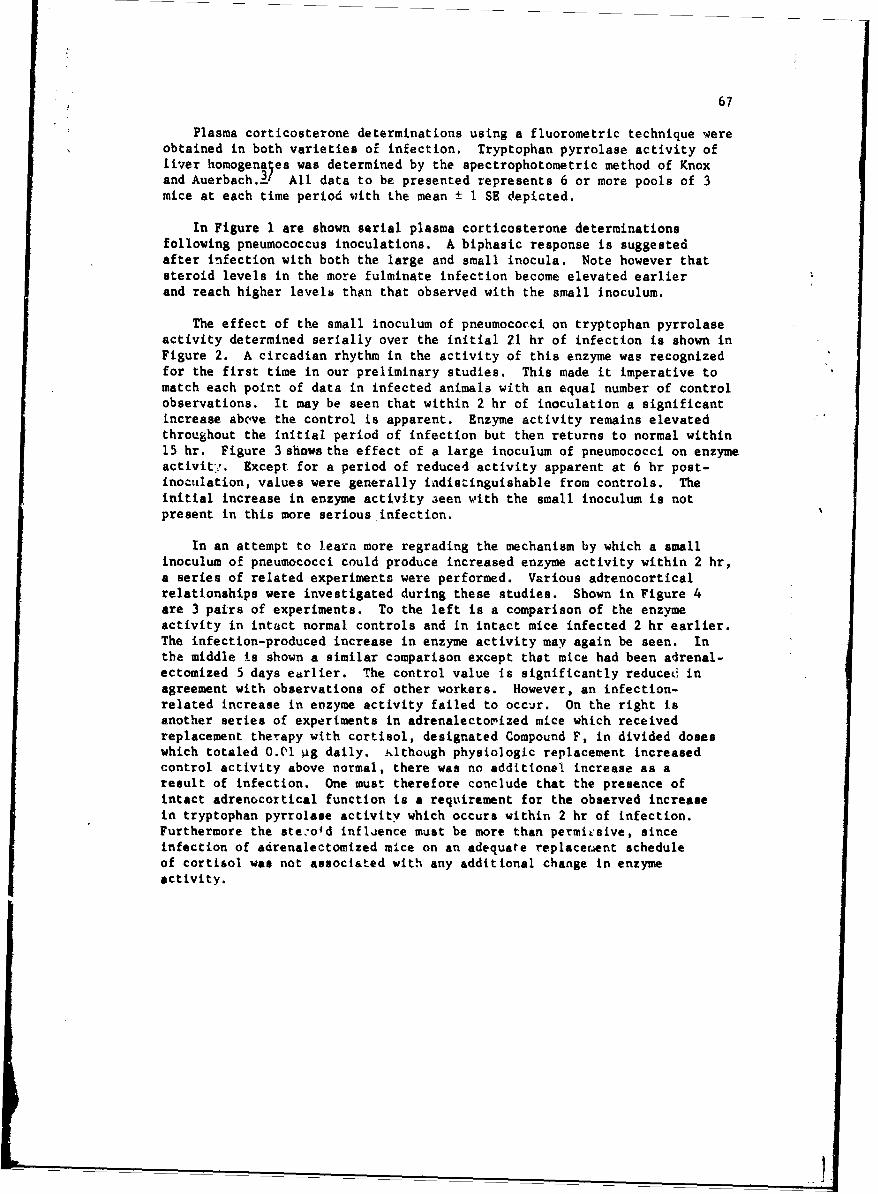
67
Plasma corticosterone determinations using a fluorometric technique wereobtained in both varieties of infection. Tryptophan pyrrolase activity ofliver homogena es was determined by the spectrophotometric method of Knoxand Auerbach.2/ All data to be presented represents 6 or more pools of 3mice at each time period with the mean ± 1 SE depicted.
In Figure 1 are shown serial plasma corticosterone determinationsfollowing pneumococcus inoculations. A biphasic response is suggestedafter infection with both the large and small inocula. Note however thatsteroid levels in the more fulminate infection become elevated earlierand reach higher levels than that observed with the small inoculum.
The effect of the small inoculum of pneumococci on tryptophan pyrrolaseactivity determined serially over the initial 21 hr of infection is shown inFigure 2. A circadian rhythm in the activity of this enzyme was recognizedfor the first time in our preliminary studies. This made it imperative tomatch each point of data in infected animals with an equal number of controlobservations. It may be seen that within 2 hr of inoculation a significantincrease above the control is apparent. Enzyme activity remains elevatedthroughout the initial period of infection but then returns to normal within15 hr. Figure 3 shows the effect of a large inoculum of pneumococci on enzymeactivitt. Except for a period of reduced activity apparent at 6 hr post-inoculation, values were generally indistinguishable from controls. Theinitial increase in enzyme activity aeen with the small inoculum is notpresent in this more serious infection.
In an attempt to learn more regrading the mechanism by which a smallinoculum of pneumococci could produce increased enzyme activity within 2 hr,a series of related experimerts were performed. Various adrenocorticalrelationships were investigated during these studies. Shown in Figure 4are 3 pairs of experiments. To the left is a comparison of the enzymeactivity in intact normal controls and in intact mice infected 2 hr earlier.The infection-produced increase in enzyme activity may again be seen. Inthe middle is shown a similar comparison except that mice had been adrenal-ectomized 5 days earlier. The control value is significantly reduced inagreement with observations of other workers. However, an infection-related increase in enzyme activity failed to occjr. On the right isanother series of experiments in adrenalectomized mice which receivedreplacement therapy with cortisol, designated Compound F, in divided doseswhich totaled O.Cl 4g daily. .klthough physiologic replacement increasedcontrol activity above normal, there was no additional increase as aresult of infection. One must therefore conclude that the presence ofintact adrenocortical function is a requirement for the observed increasein tryptophan pyrrolase activity which occurs within 2 hr of infection.Furthermore the ste:ofd inflUence must be more than permiisive, sinceinfection of adrenalectomtzed mice on an adequate replacerent scheduleof cortisol was not associated with any additional change in enzymeactivity.
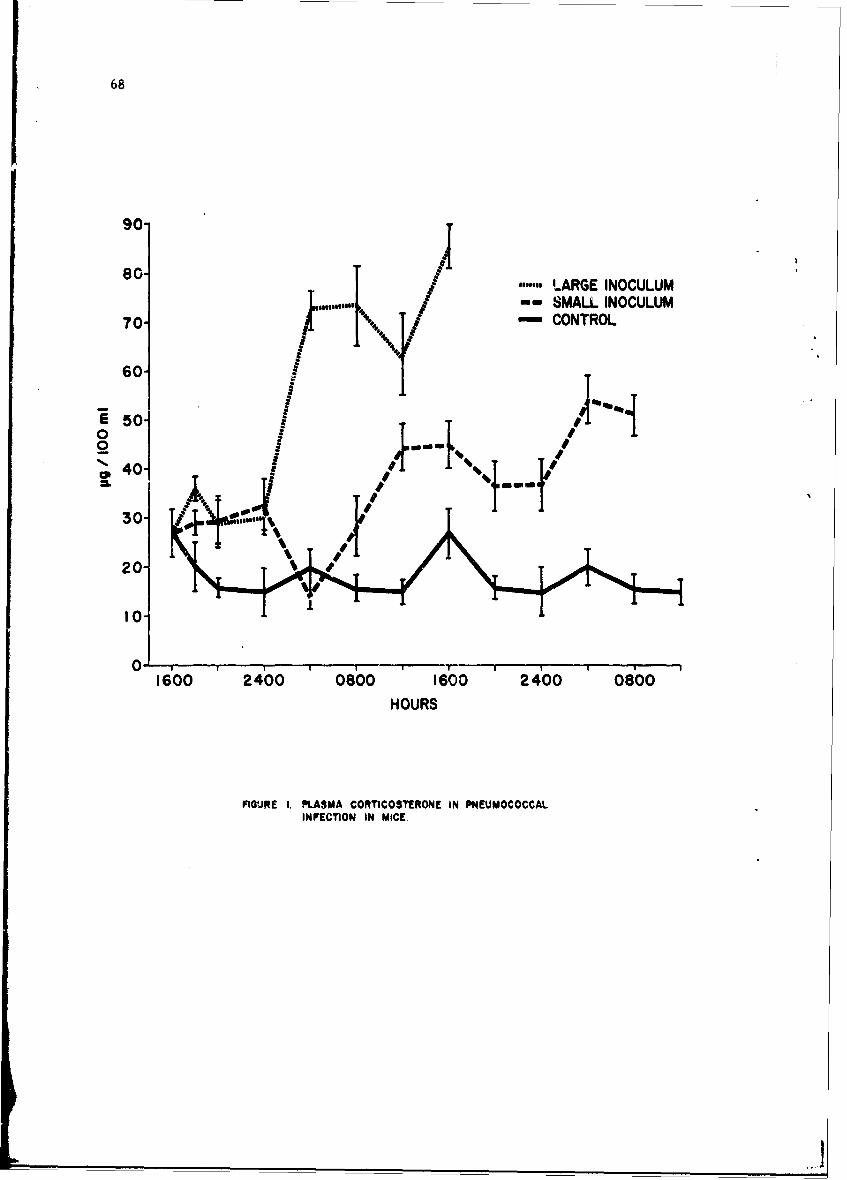
68
90-80. T ,...o
...... LARGE INOCULUMT5 -- SMALL INOCULUM
70" - CONTROL
60-/
S50-
303 0-%fla
20"
I0.
0 I01600 2400 080o 16o 2400 o08o
HOURS
FIGURE I. PLASMA CORTIC03TERONE IN PNEUMOCOCCALINFECTION IN MICE.
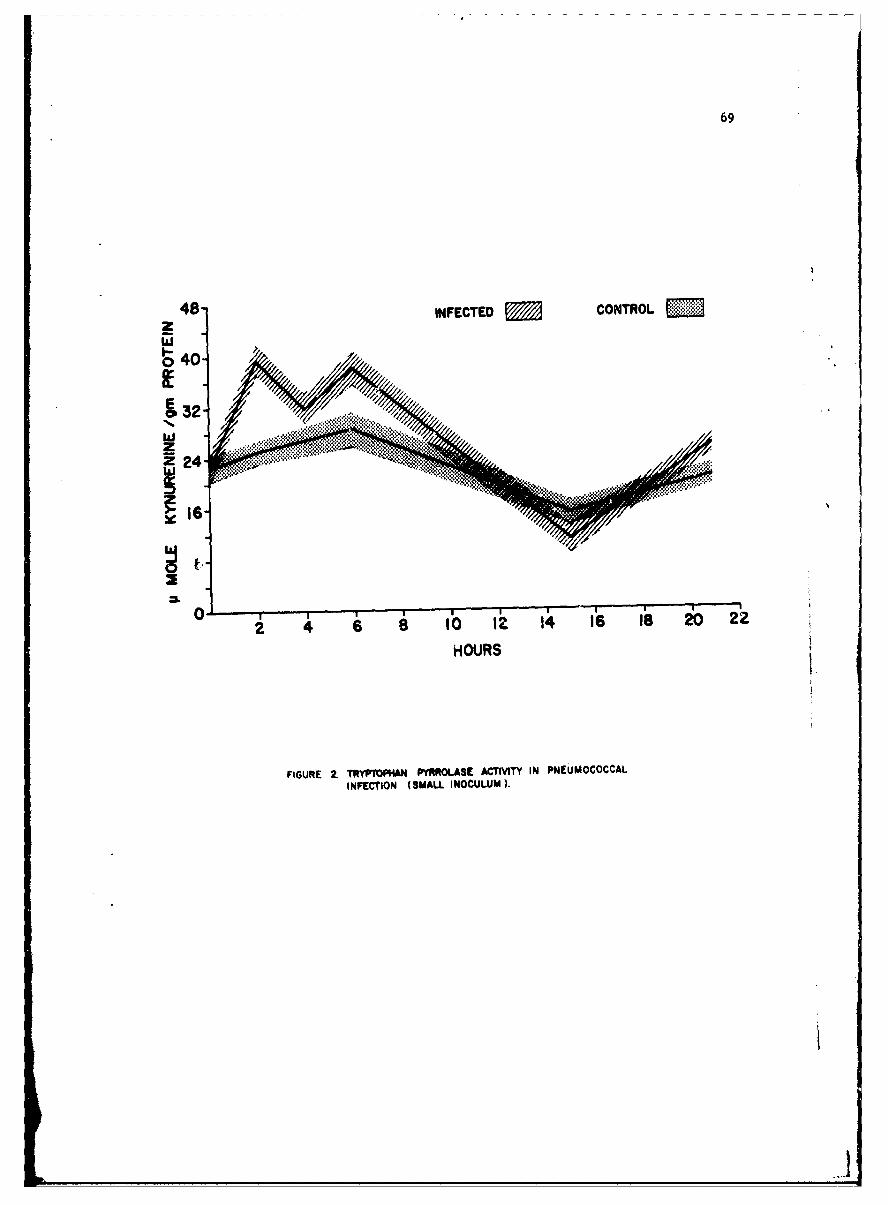
69
48- INFECTED CONTROLz
640-
c~b32-
z24 ::
0 4 0 I1 16 is 2.0
HOURS
FIGURE 2- TRYPTOP4AN pfflOLASE ACTIATY IN PINEUMOCOCCALINFECTION (SMALL INOCULUM).
70
INFECTED CONTROL i
16-~
2 4 6 8 10 12 14 16 is 20 22HOURS
FIGURE 3.TRYPTOPIIAN PYRROLASE ACTIVITY IN PIIEUMOCOCCALINFECTION (LARGE INOCULUM).
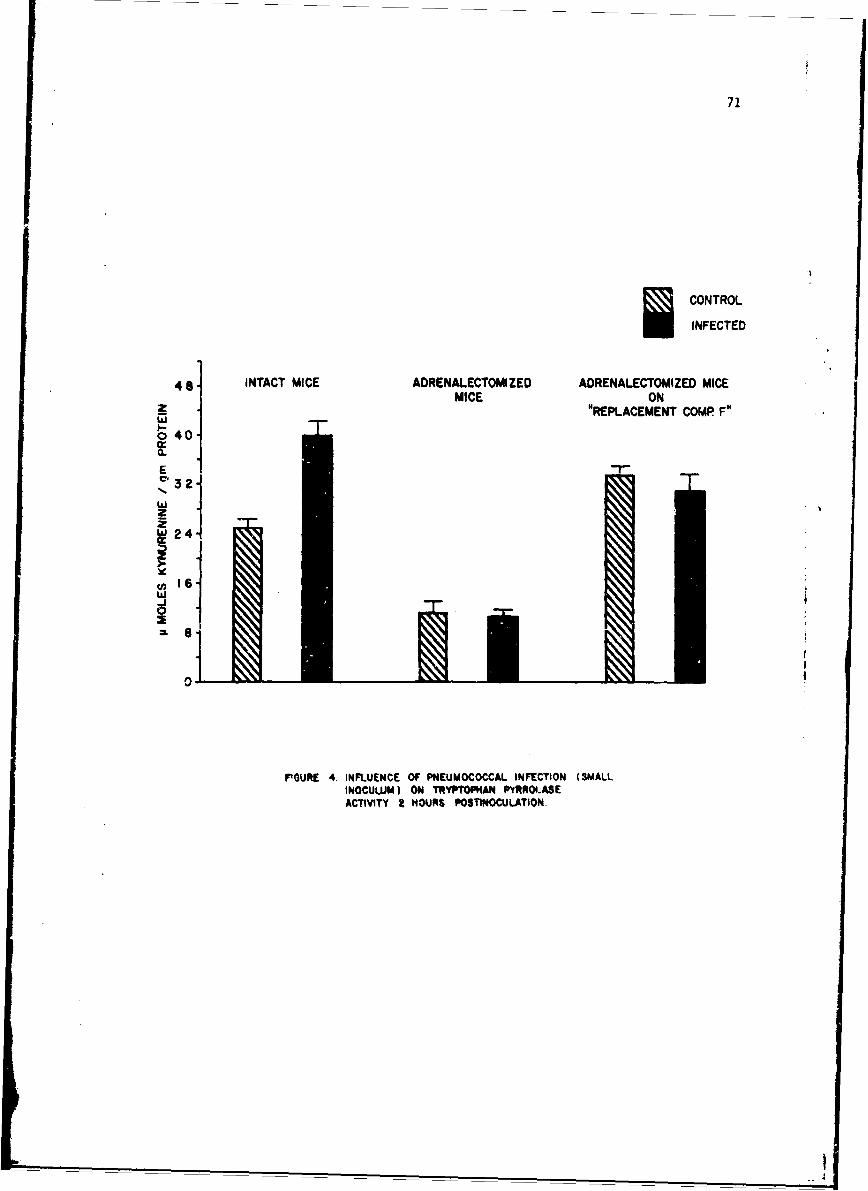
71
SCONTROL
INFECTED
48- INTACT MICE ADRENALECTOMIZED ADRENALECTOMIZED MICEMICE ON
Z "REPLACEMENT COMP F"
o 40-
w0
a
0,
FIGURE 4 INFLUENCE Of PNEUMOCOCCAL INFECTION (SMALLINOCULUM) ON TRYPTOPWAN PYRRO.ASEACTIVITY 2 "OURS POSTINOCULATION.
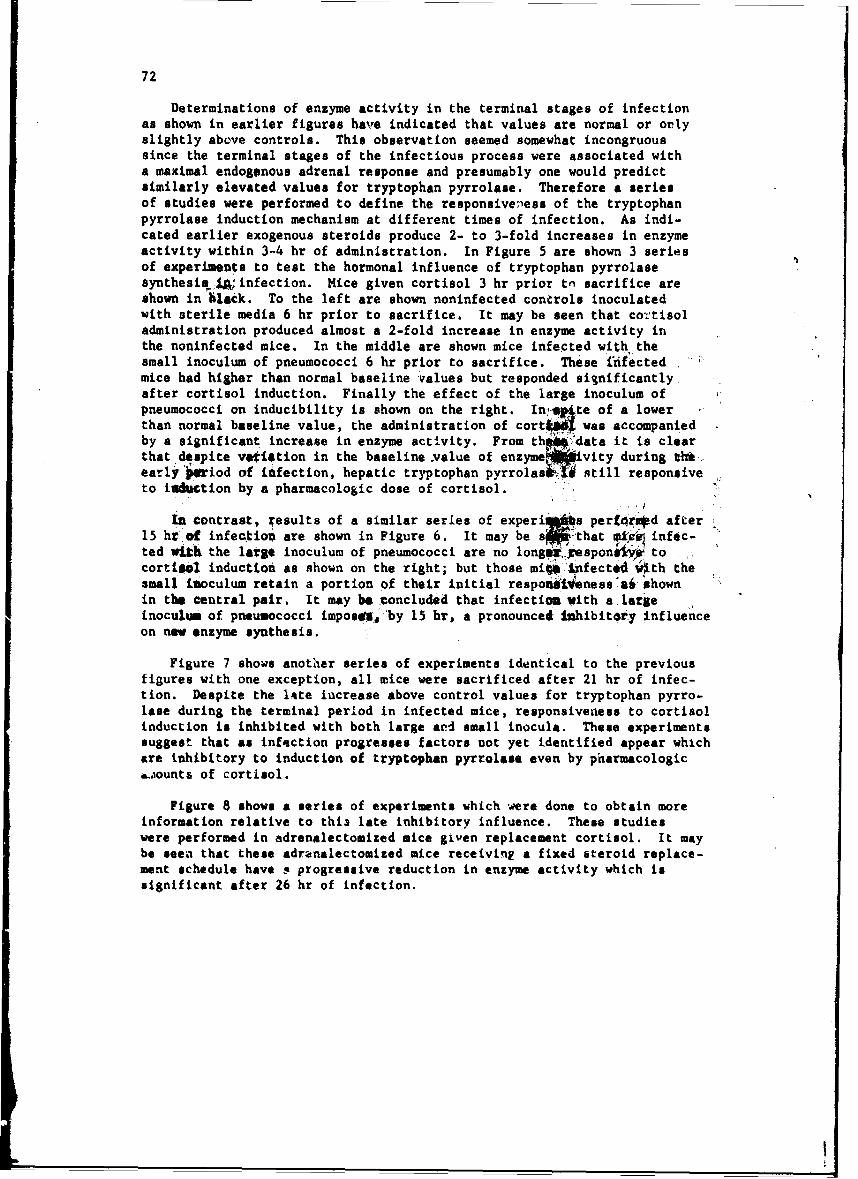
72
Determinations of enzyme activity in the terminal stages of infectionas shown in earlier figures have indicated that values are normal or orlyslightly abeve controls. This observation seemed somewhat incongruoussince the terminal stages of the infectious process were associated witha maximal endogenous adrenal response and presumably one would predictsimilarly elevated values for tryptophan pyrrolase. Therefore a seriesof studies were performed to define the responsive "ess of the tryptophanpyrrolase induction mechanism at different times of infection. As indi-cated earlier exogenous steroids produce 2- to 3-fold increases in enzymeactivity within 3-4 hr of administration. In Figure 5 are shown 3 seriesof experiments to test the hormonal influence of tryptophan pyrrolasesynthesis ±~tnfection. Mice given cortisol 3 hr prior tn sacrifice areshown in hiack. To the left are shown noninfected controls inoculatedwith sterile media 6 hr prior to sacrifice. It may be seen that co•/tisoladministration produced almost a 2-fold increase in enzyme activity inthe noninfected mice. In the middle are shown mice infected with thesmall inoculum of pneumococci 6 hr prior to sacrifice. These infectedmice had higher than normal baseline values but responded significantly !after cortisol induction. Finally the effect of the large inoculum ofpneumococci on inducibility is shown on the right. Ini•,•te of a lowerthan normal baseline value, the administration of cort• was accompaniedby a significant increase in enzyme activity. From th•.: data it is clearthat despite vetietion in the baseline yalue of enzyme~~vity during th'early jriod of inifection, hepatic tryptophan pyrrolas~ i• still responiiveto iad~tion by a pharmacologic dose of cortisol. ":"
InContrast, results of a similar series of experi~fis perf•.rnd after15 hr of infection are shown in Figure 6. It may be sj that Ip• infec-ted with the large inoculum of pneumococci are no longa.:respon '• to .cortisol induction as shown on the right; but those mi• Jinfectsd •!th thesmall inoculum retain a portion of their initial respouii4eness~a4 shown :in thu central pair. It may be concluded that infection with a, Largeinocultm of pneuuococci impos•s, by 15 hr, a pronounced •!•hibit@ty influence
on new enzyme synthesis.
Figure 7 shows another series of experiments identical to the previous
figures with one exception, all, mice were sacrificed after 21 hr of infec-tion. Despite the late increase above control values for tryptophan pyrro-lass during the terminal period in infected mice, responsiveness to cortisolinduction is inhibited with both large arnd small inocula. These experimentssuggest that as infection progresses factors not yet identified appear whichare inhibitory to induction of tryptophan pyrrolase even by pharmacologic•.aounts of cortisol.
Figure 8 shows a series of experiments which "#ere done to obtain moreinformation relative to thi•a late inhibitory influence. These studieswere performed in adrenalectomized mice given replacement cortisol. It maybe seen that these adranalectomized mice receiving a fixed steroid replace-ment schedule have . progressive reduction in enzyme activity which issignificant after 26 hr of infection.
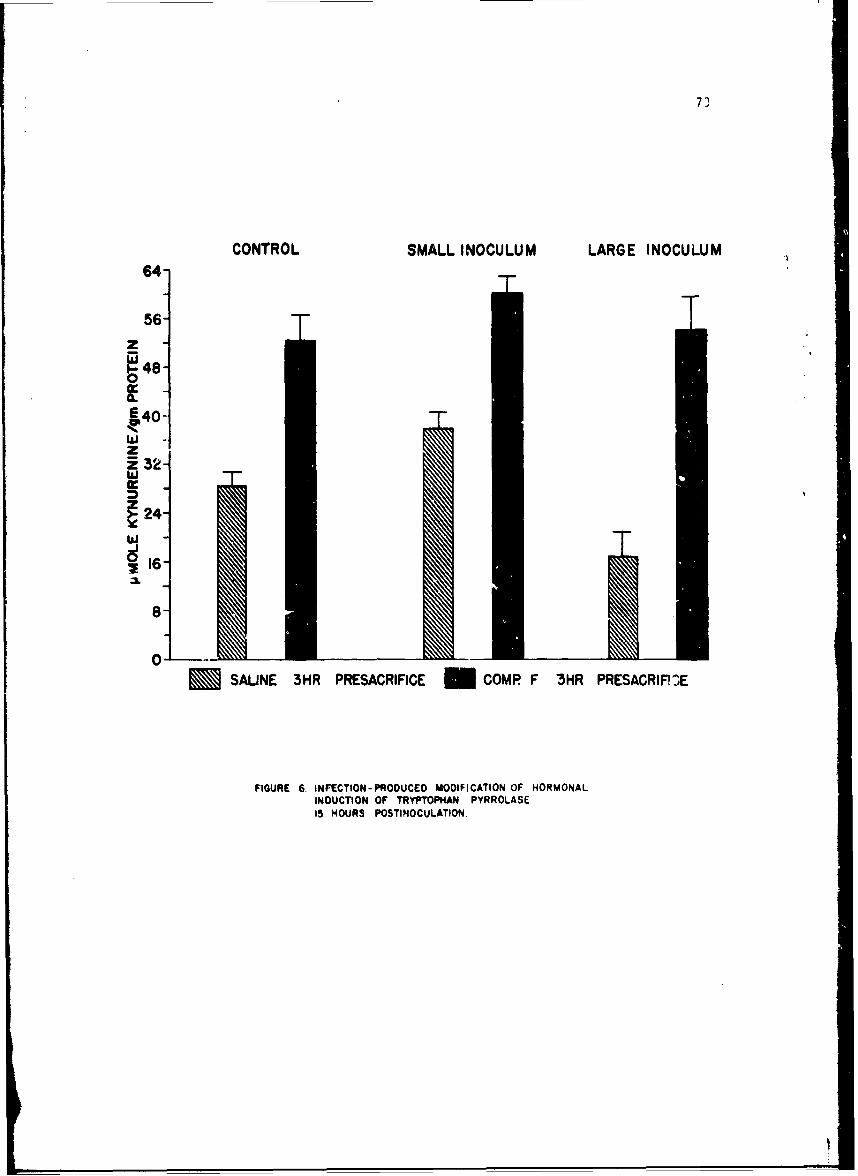
73
CONTROL SMALL INOCULUM LARGE INOCULUM
64
56
z.48'
E40]
zE 32-
•24-
I6
8-
0--SALINE 3HR PRESACRIFICE COMP F 3HR PRESACRIFJ3E
FIGURE 6. INFECTION-PRODUCED MODIFICATION OF HORMONALINDUCTION OF TRYPTOPHAN PYRROLASE15 HOURS POSTINOCULATION.
74
,8 CONTROL SMALL INOCULUM LARGE INOCULUM
m -040-C.
*c32-wz124
z.16
IaJ
o 8
SSALINE 3HR PRESACRIFICE COMP F 3HR PRESACRIFICEj
FIGURE 7 INFECTION-PRODUCED MODIFICATION OF hORMONALINDUCTION OF TRYPTOPHAN PYRROLASE21 HOURS POSTINOCULATION.
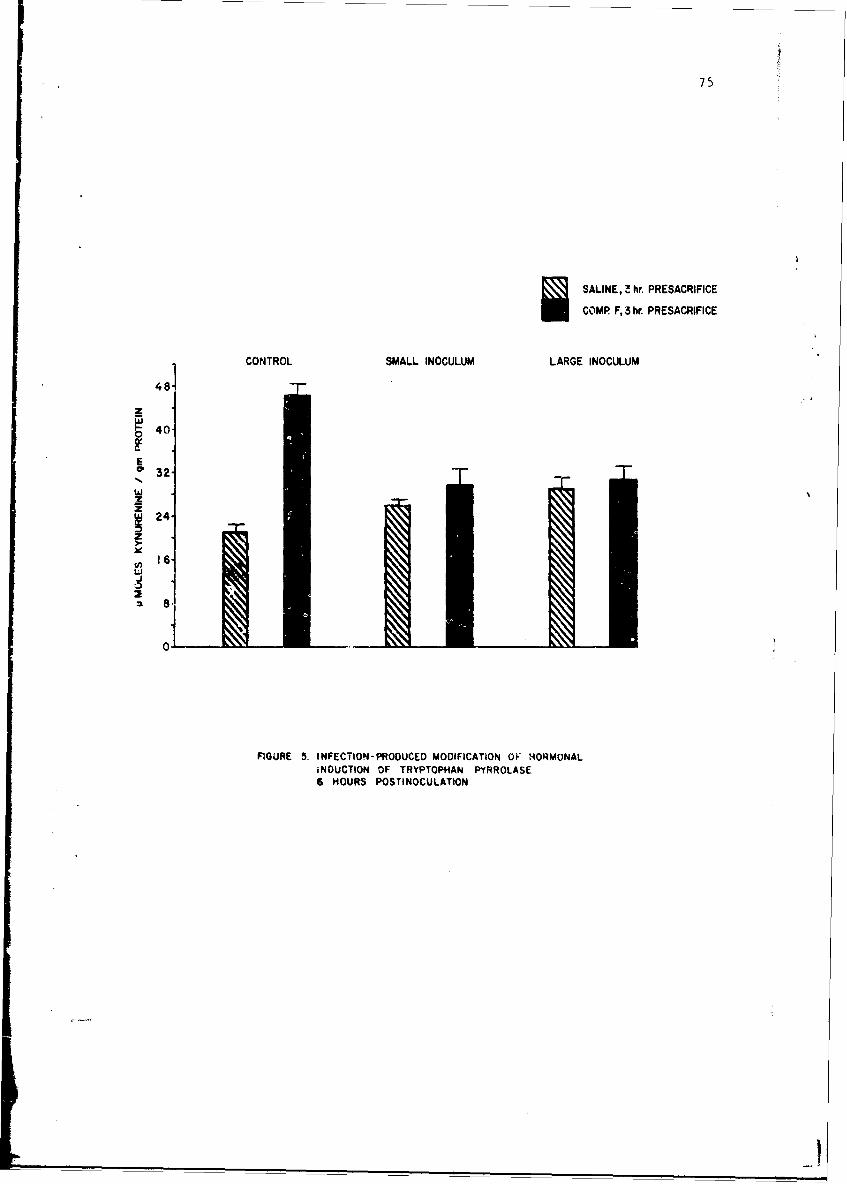
75
I SALINE, Z hr. PRESACRIFICE
COMP F, 35 hr. PRESACRIFICE
CONTROL SMALL INOCULUM LARGE INOCULUM
w8 40-
c 32
"w 24
16
FIGURE 5. INFECTION-PRODUCED MODIFICATION OF HORMONALiNDUCTION OF TRYPTOPHAN PYRROLASE6 HOURS POSTINOCULATtON.
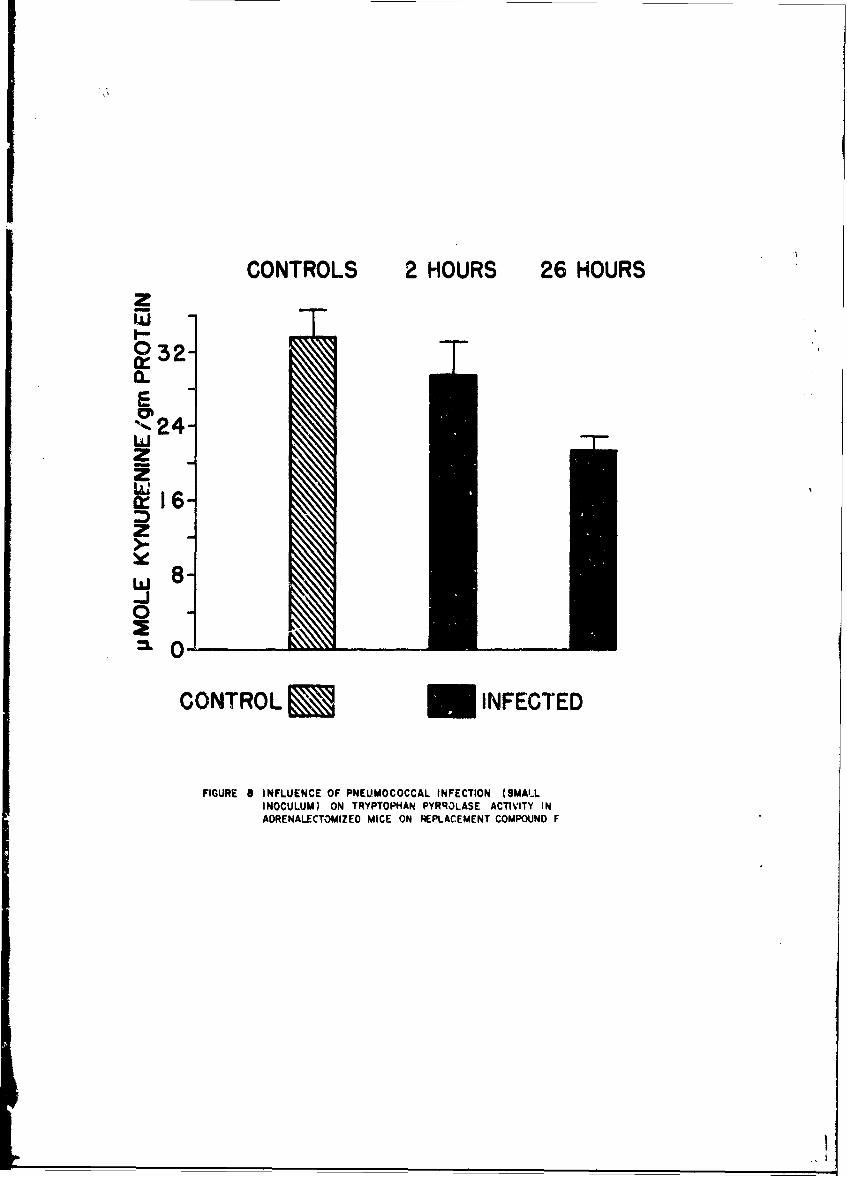
CONTROLS 2 HOURS 26 HOURSz
I-
032-a-Ewz
It16-z
w 8-i030
CONTROL N INFECTED
FIGURE 8 INFLUENCE OF PNEUMOCOCCAL INFECTION (SMALLINOCULUM) ON TRYPTOPHAN PYRROLASE ACTIVITY INADRENALECTOMIZED MICE ON REPLACEMENT COMPOUND F
77
The data presented herein Lillow us several conclusious. First, serialdeterminations of tryptophan pyrrolase and perhaps other enzymes must beinterpreted wkth consideration given to circadian variation. Second, itis apparent that during acute infection there are both stimulatory andinhibitory influences on tryptophan pyrrolase activity. The nature of theseinfluences and for that matter the number that exist are not at all clear.For this reason simple static measurements of the enzyme tryptophan pyrro-lase must be interpreted as a summation of a variety of simultaneous andpossibly divergent influences. Increases and decreases in activity mayreflect changes in rate of enzyme synthesis and/or degradation, both ofwhich alter actual enzyme pcpulation. Changes in cofactors and coenzymeswould be expected to alter enzyme activity without actually changing enzymeamount. The third conclusion that appeari warranted is that the earlyincrease in enzyme activity noted after inoculation with a small number oforganisms requires an intact adrenocortical function. Data is insufficientto state whether this increase reflects new enzyme synthesis, reduction indegradation rate, .emoval of an inhibitor, or a combination of these orother factors. This aspect is being studied in more detail at this time.The fourth conclusion that appears warranted from our data is that wellestablished inhibitory influences to cortisol induction of tryptophanpyrrolase appear somewhat later in infection. It is apparent that pharma-cologic doses of steroid are not effective in overcoming this inhibitoryinfluence. The fact that enzyme activity in the terminal stages of infec-tion is normal or slightly above normal must be interpreted in the contextof a maximal adrenal response, a state that would be expected to producemarked elevations in tryptophan pyrrolase activity. The nature of theinhibitory process or processes is not clear from our data. The existenceof a repressor factor has been postulated by Garren et al0/ and it isconceivable that generalized pneumococcal infection activates a repressorsystem. Growth hormone which also blocks tryptophan pyrrolase synthesiscould play an inhibitory role in infection, Unfortunately nothing is knownregarding the secretion of growth hormone and its activity in infection.Also to be considered is the mere presence of proliferating microorganismswithin the hepatic tissue. However the inhibition of tryptophan pyrrolaseinduction occurs prior to the appearance of large numbers of microorganismswithin the liver.
SUMMARY
Both stimulatory and inhibitory influences have been observed to be atwork on the tryptophan pyrrolase induction system. Adrenal steroids playa me.Jor role in the stimulatory aspects which we have noted. Data are notavailable as yet to state categorically whether changes in tryptophan pyrro-lase activity in pneu.imococcus infection actuall represent changes in enzymesynthesis or indirecý changes in cofactor or substrate concentrations. Itis apparent that additional studies will be required to define better thenature of the factors that mediate early host adaptive changes in infection.
L ....I
78
LITERATURE CITED
1. Knox, W. .,V. H. Auerbach, and E. C. Lin. 1956. Enzymatic and meta-bolic adaptions in animals. Physiol. Rev. 36:164-254.
2. Halberg, F. 1960. The 24-hour scale: A time dimension of adaptivefunctional organization. Perspect. Biol. Med. 3:491-527.
3. Knox, W. E., and V. H. Auerbach. 1955. The hormonal control oftryptophan pyrrolase in the rat. J. Biol. Chem. 214:307-313.
4. Schimke, R. T., E. W. Sweeney, and C. M. Berlin. The roles of synthesisand degradation in the control of rat liver tryptophan pyrrolase. J.Biol. Chem. 240:322-331.
5. Rivlin, R. S., and W. E. Knox. 1959. Efects of age, body size andgrowth hormone on level of tryptophan peroxidase-oxidase in rat liver.Amer. J. Physiol. 197:65-67.
6. Berry, L. J., and D. S. Smythe. 1963. Effects of bacterial endotoxinson metabolism. VI. The role of tryptophan pyrrolese in response ofmice to endotoxin. J. Exp. Med. 118:587-603.
7. Berry, L. J., and D. S. Smythe. 1964. Effects of bacterial endotoxinson metabolism. VII. Enzyme induction and cortisone protection. J.Exp. Med. 120:721-732.
8. Kong, Y. L., and I. H. Smith. 1966. Nicotinamide and tryptophan pyrro-lase in Staphylococcus aureus infected mice. Bact. Proc. p. 70.
9. Lust, G. February 1966. Influence of viral infection on host proteinand ribonucleic acid biosynthesis. p. 74 to 85. IT Commission onEpidemiological Survey, Annual Report to the Armed Forces Epidemio-logical Board, Fiscal Year 1965. U. S. Army MedicAl Unit, Fort Detrick,Maryland.
10. Garren, L. D., R. R. Howell, G. M. Tomkins, and R. M. Crocco. 1964.A paradoxical effect of actinomycin D: The mechanism of regulation ofenzyme synthesis by hydrocortisone. Proc. Nat. Acad. Sci. 52:1121-1129.
_______________________________________________________ -
79
ALTERATIONS OF HOST CELLULAR RIBONUCLEICACID METABOLISM DURING INFECTION
George Lust, Ph.D.*
The experimental results to be described are an extension of our previouswork concerning alterations in host protein metabolism. Our previous experi-ments were primarily concerned with investigating overall host protein syn-thesis during infection. The principle findings in this area were that duringan arbovirus infection the rate of protein biosynthesis in mouse liver wasmarkedly decreased early during the infection, but had returned to normalvalues before clinical symptoms could be observed.1-31 Under somewhat morecontrolled conditions, the same trend was observed in mouse fibroblast cells(strain L) in tissue culture.A/ Protein synthesis was depressed very rapidlyin these cells, but appeared near normal at the time mature virus was pro-duced in the cells. In infected L-cells, we also demonstrated the presenceof a new ribonucleic acid (RNA) polymerase, not present in normal cells,which is involved in the synthesis of new viral RNA.
A somewhat different pattern or protein synthesis was observed duringbacterial infection. During Diplococcus pneumoniae infection the reversesituation was actually found, in that the rate of protein synthesis in liver"2 3/was elevated over control levels.2,'
From this brief summary of earlier work, it is apparent that overallhost protein synthesis is indeed altered during infection. Therefore, sinceinfection influences protein synthesis, it may be hypothasized that one ormore of the specific reaction sequences required for synthesis may be affected.
Since RNA species are known to play a central role in protein biosynthesis,it was of interest to study these cellular constituents more intensively duringthe stress of infection. The results and thoughts presented have been derivedmainly from work utilizing the mouse liver system. We have also investigatedother tissues such as brain, intestine and muscle, but liver always exhiLitedthe most noticeable effects.
There are basically 4 different groups of RNA involved in the proteinsynthesis: messenger, transfer, a large ribosomal subunit, and a smallerribosomal subunit. The messenger is transcribed in the nucleus of cellsand then passes into the cytoplasm, where it functions in assembling theribosomes into a functional polyribosome needed for protein synthesis. Thetransfer, or soluble, RNA brings the activated amino acids to the polyribo-some to be incorporated into proteins. Also required are transfer andreleasing factors, as well as enzymes to assemble the polypeptlde chain.From the literature, it is known that ribosomal RNA is more stable (slower
* U. S. Army Medical Unit.
80
turnover time) than messenger RNA.X As we shall see, the changes thatwe have observed are in large part attributable to alterations in messengerRNA. This report is concerned with studies on the factors which may alterhost RNA 3pecies quantitatively.
Male white mice (CD-1) were infected by injecting subcutaneously in theback approximately 10 organisms of D. pei-umoniae, type 1A5 suspended intryptose-phosphate broth. The mice died vithin 72 hr. Suspending mediumwithout organisms was injected into controls.
The mice used in the experiments weighed between 25-35 gm. Livers of10-12 mice were pooled, minced and homogenized, and the desired subcellularcomponents were obtained by differential centrifugation. Microsomes andpH 5 enzymes (soluble enzymes' were obtained from livers of both controland infected animals and frozen at -20 C until all samples had beencollected. Incubations were performed, protein and radioactivity quanti-tated, and the results were expressed as counts/min per mg protein.
In vitro microsomal protein synthesis e7:eriluents were conducted usingsuitable, standard incubation cond.tions with C].4-leucine as the tracer,a-d the microsomes and soluble enzyme systems of livers. The solubieenzymes (pH 5) contained both activating enzymes and soluble LMIA. Twokinds of experiments were performed: (1) microsomes, obtained from "nfec-ted livers and uninfected control livers, were incubated with theirrespective soluble enzyme systems (pH 5 enzymes), (2) the microsomes,isolated from control livers and from livers of pneumoniat-infected mice,were incubated with the pH 5 enzymes from uninfected control livers only.The data of these experiments are presented in Figure 1.
Part A represents the microsomes incubated with their own respectivecellular pH 5 enzymes. In Part B all microsomes were incubated withcontrol, uninfected pH 5 enzymes only. The data are shown with the rangsof the individual determinations. In both experiments an increase ofin vitro C1'-leucine incorporation into protein was observed. When themicrosomes were incubated with their respective pH 5 enzymes, proteinsynthesis increased about 35. during the infection. When pH 5 e-izymesfrom uninfected livers were used with microsomes from infected livers,protein synthesis was elevated about 40% (Part B, Figure 1) above controllevels. In both experiments the rate of incorporation dropped rathersharply as the mice became m*VVMM1and were close to death. From theseexperiments, it was apparent that the increase in protein synthesis in themicrosomal fraction seen at 16 and 40 hr postinjection of the pathogencould be accounted for by sn increased activity in the microsomal fractionitaelf, since the soluble cellular fraction apparently exerted no unusualinfluence. This indicated that the transfer RNA was not altered duringthis infection.
In order to try to accoupt for the microsomal increase, sucrosedensity gradients were employed. The sucrose density gradients indicatedthat during the bacterial infection the quantity of liver polyribosomes
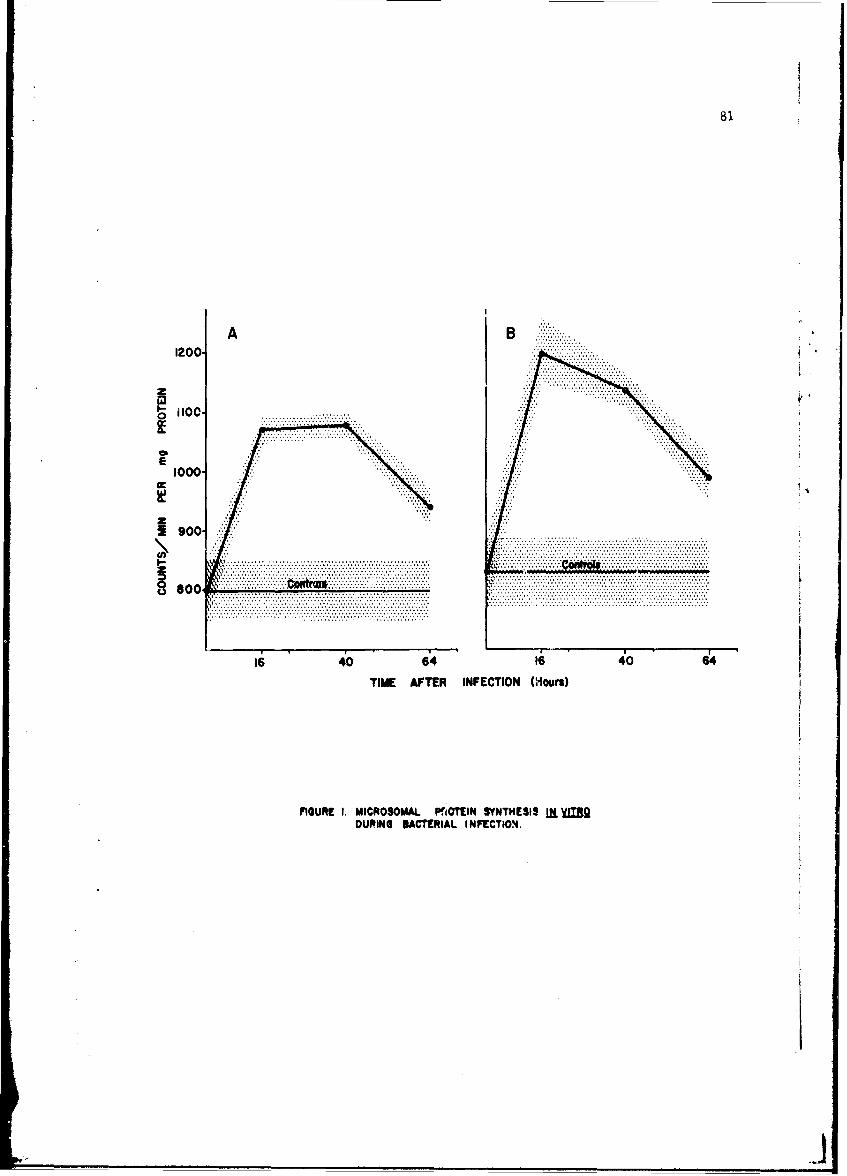
AB1200- . .....
.. ....
... ... ...6 ... .. .. .. .. .
TIME ...T... ....T......uru
FIGURE~~~ ....C...........NSYN hESS . ......DUP.NG.BACTERIAL....E......
_ _ _ _ _ _ _ _ _ _ _.................
82
may be greater than in uninfected livers (Figure 2). This figure presentsresults from 15-34% linear sucrose gradients. Linearity was checked bymeasuring the index of refraction of each fraction (dashed line). Readingsof ribosome distribution were made at 260 np in a spectrophotometer. Theline representing the control ribosome pattern (circles) has a large peakbetween fractions 10 and 16 and a smaller peak in fractions 17 to 21. Thelatter peak represents monosomes and disomes. This was ascertained bytreating the control sample with a definite quantity of ribonuclease at0 C for 30 min (dotted line). This procedure destroys messenger RNAdispersing the polymer into monosomes-disomes. The line with trianglesrepresents the pattern seen in a preparation from infected animals. Itcan be seen that in livers of mice infected 18 hr monosomes and disomesare no longer to be found. Under these conditions, it was characteristicthat a monosome-disome peak was present in uninfected control livers andabsent during the early phase of infection. Intraperitoneal (IP) admin-istration of hydrocortisone (3 mg) to uninfected mice also caused thedisappearance of the monosome peak in liver preparations. These changesmay be attributed to increased messenger RNA synthesis.
In support of this hypothesis, we have found an increased rate ofuridine-2-C14 incorporation into RNA in liver during this bacterial infec-tion (Figure 3). In this case uridine-2-C14 was injected into the tailveins of mice; the radioactivity in microsomal RNA of liver was quantitated.It is readily apparent that the infected animals exhibited an increased rateof RNA synthesis.
All these data indicated that increased messenger RNA synthesis may bezesponsible for the increased liver protein synthesis. It is well knownthat hormones influence protein and RNA synthesis. Cortisone and cortisolhave been shown to stimulate messenger RNA and protein synthesis veryrapidly. For this reason, the correlation of the response to infectionand hormone administration was investigated. Adrenalectomized mice wereused for this study. Adrenalectomized mice were treated IF every 12 hrwith saline or 0.1 mg or 3 mg cortisol/mouse (Figure 4). C14-leucine wasinjected into groups of control animals and infected animals, and themicrosomes isolated as before. First, it is evident that with increasingconcentrations of cortisol, protein synthesis also increases. It is alsoclear that adrenalectomized mice do not respond to this bacterial infec-tion by increasing liver protein synthesis. The control values remainedunchanged in infected animals. Therefore, it appeared that adrenal hor-mones play an important role in liver RNA synthesis during infection. Theprimary host response which activates the pituitary-adrenal axis is atpresent not well defined.
The factors influencing host cellular metabolism during a virus infec-tion are apparently more complex. A generalized stress response to theinfection may limited, as in the case of the bacterial infection; however,the infecting agent also interferes directly with cell metabolism at avery basic level.
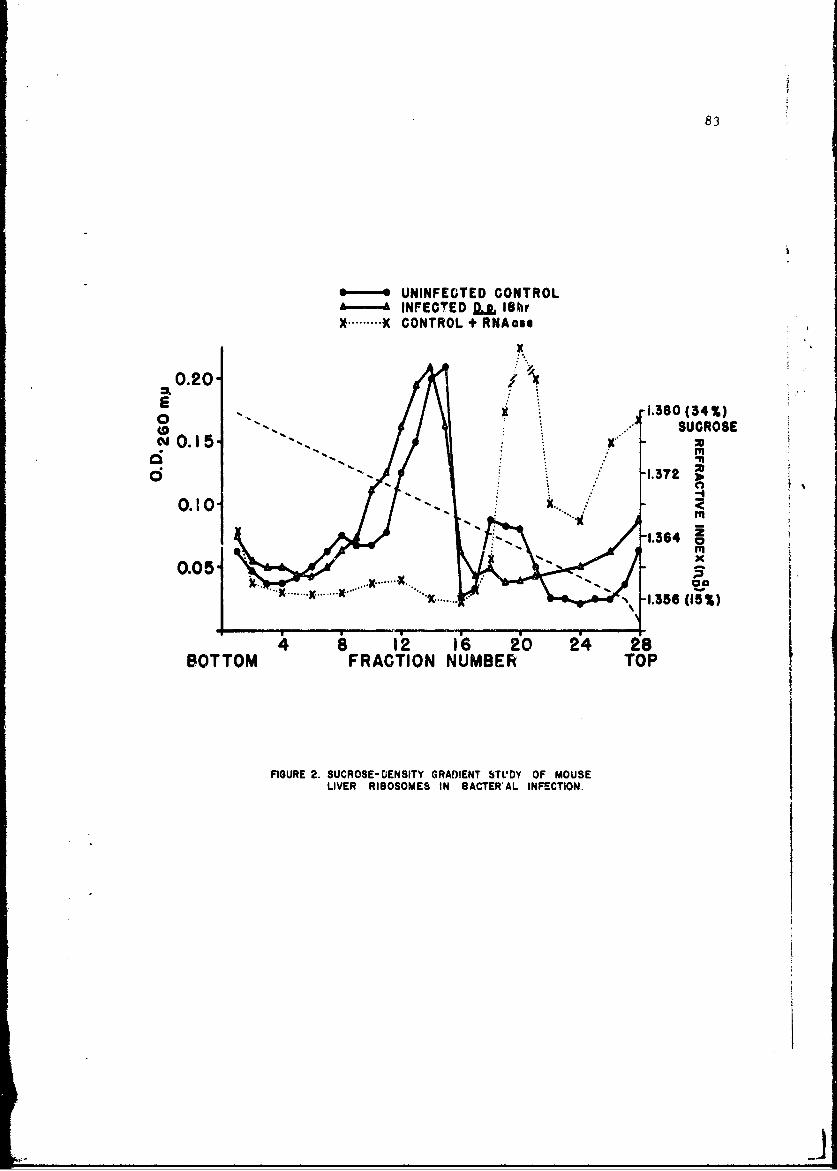
83
: :UNINFECTED CONTROL- INFECTED " Ihr
X ......... X CONTROL + RNAoss
x
0.20-Eo - = SUCROSE
0O.15-
d ljo0 oI'
0.10 .0.10" -~.... ... ; x....
S-1.364 ! z
0.05.
• "x......1.356 (115% )
4 12 16 0 24 28BOTTOM FRACTION NUMBER TOP
FIGURE 2. SUCROSE-DENSITY GRADIENT STL'DY OF MOUSELIVER RIBOSOMES IN BACTER'AL INFECTION.
j
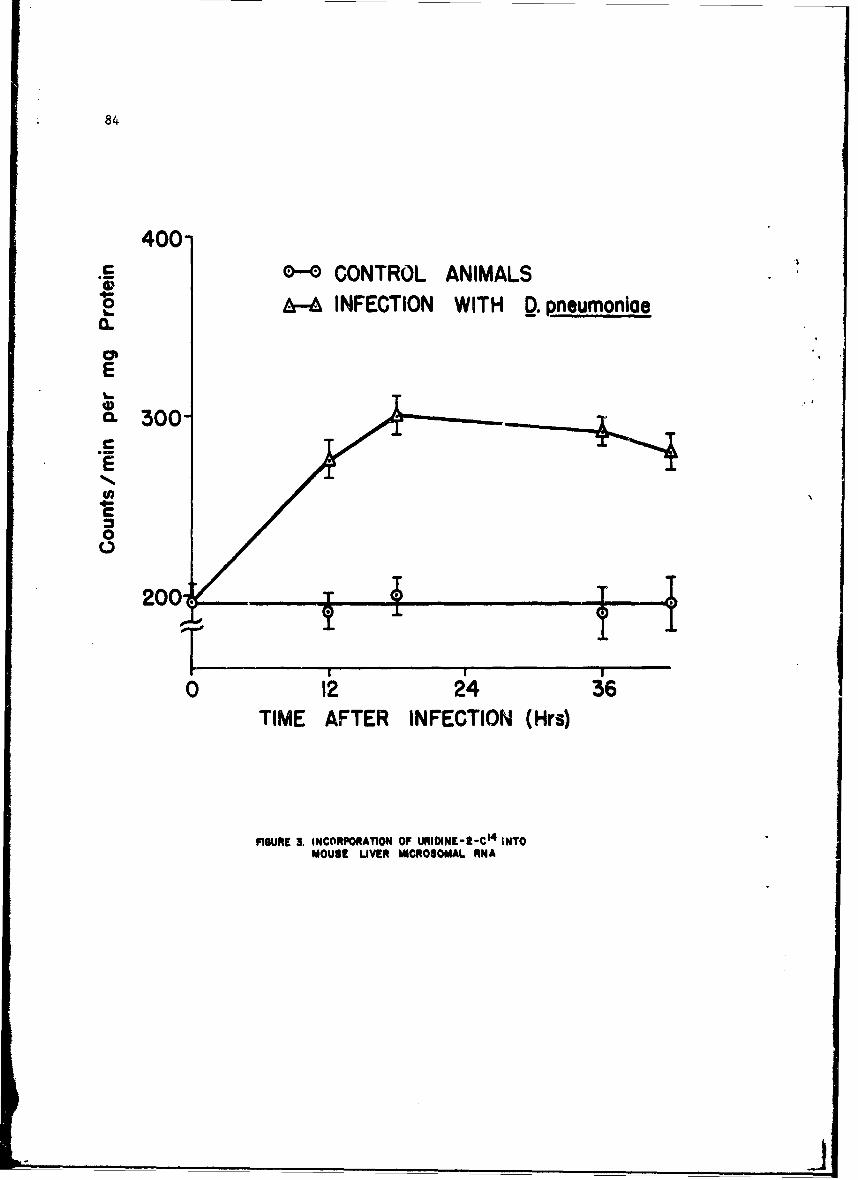
84
400".C 0-o CONTROL ANIMALS
&--a INFECTION WITH D. pneumonioe
0.0' '
E
"a 3 0 0
E.N..
0
0 12 24 36TIME AFTER INFECTION (Hrs)
FIGURE 3. INCORPORATION OF URIDINE-2-C14 INTOMOUSE LIVER MICROSOMAL RNA
_ _ _ _ _ _ _ _ _ _ _ _ _ _ _ _ _
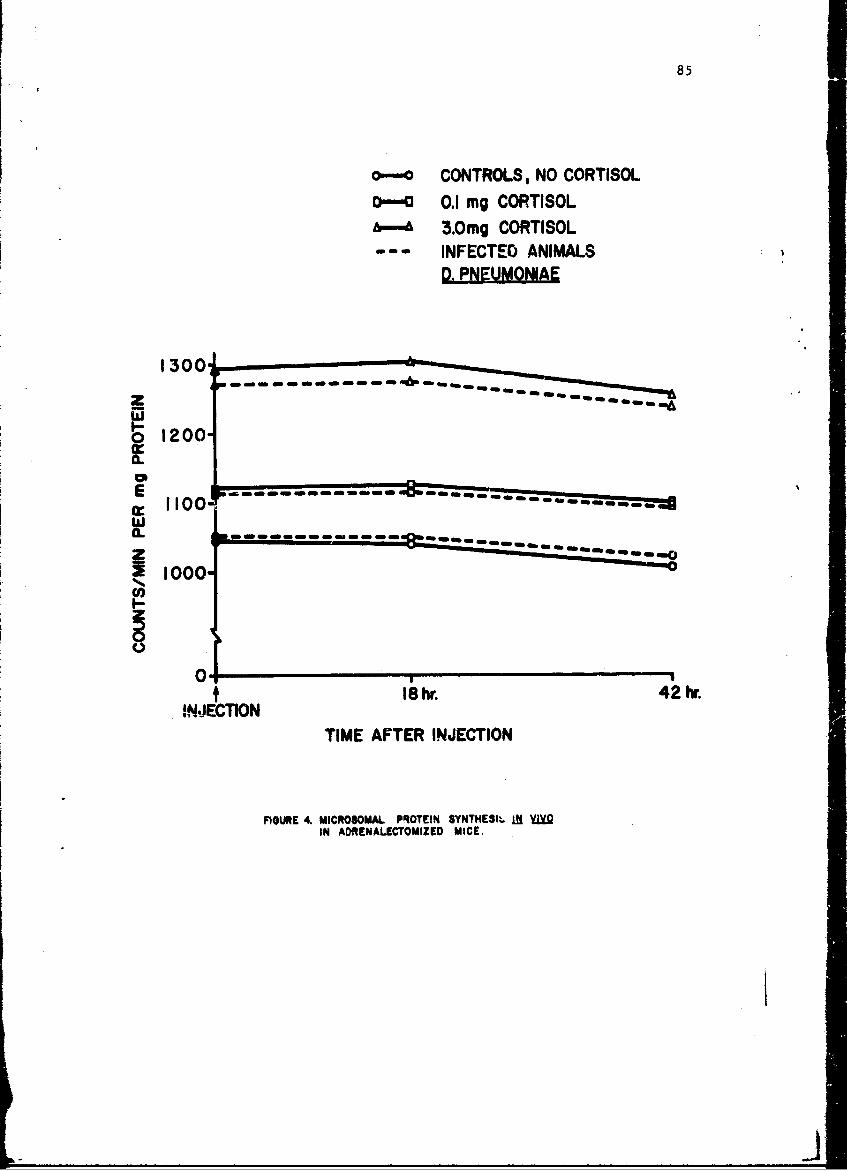
85
on-moCONTROLS, NO CORTISOLD-cI 0.1 mg CORTISOLbh-A 3.0mg CORTISOL
--- INFECTEO ANIMALSD. PNgUMONIAE
w
0 200
18h. 2rINECIO
TIEATRENETO
FIUR 4.0 PIRSML RTI SNHS~ ~~~INARNLCTMZDMC
a. m o M m M 40j
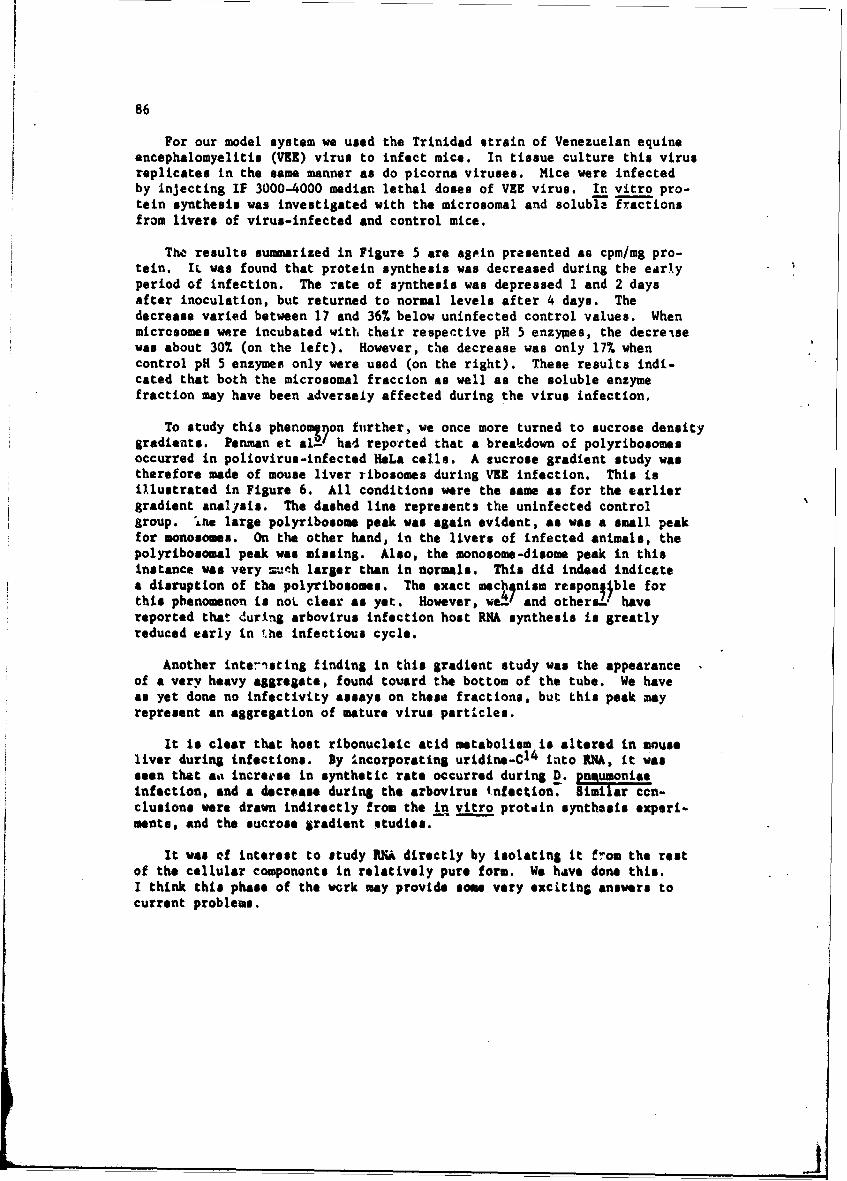
86
For our model system we used the Trinidad strain of Venezuelan equineencephalomyelitis (VIE) virus to infect mice. In tissue culture this virusreplicates in the same manner as do picorna viruses. Mice were infectedby injecting IF 3000-4000 median lethal doses of VIE virus. In vitro pro-tein synthesis was investigated with the microsomal and solubla fractionsfrom livers of virus-infected and control mice.
The results summarized in Figure 5 are agpin presented as cpm/mg pro-tein. IL was found that protein synthesis was decreased during the earlyperiod of infection. The rate of synthesis was depressed 1 and 2 daysafter inoculation, but returned to normal levels after 4 days. Thedecrease varied between 17 and 36% below uninfected control values. Whenmicrosomes were incubated with their respective pH 5 enzymes, the decreisewas about 30% (on the left). However, the decrease was only 17% whencontrol pH 5 enzymes only were used (on the right). These results indi-cated that both the microsomal fraccion as well as the soluble enzymefraction may have been Adversely affected during the virus infection.
To study this phenomfnon further, we once more turned to sucrose densitygradients. Penman et alVY had reported that a breakdown of polyribosomesoccurred in poliovirus-infected HeLa cells. A sucrose gradient study wastherefore made of mouse liver ribosomes during VIE infection. This isillustrated in Figure 6. All conditions were the same as for the earliergradient anaijeis. The dashed line represents the uninfected controlgroup. !he large polyribosome peak was again evident, as was a small peakfor monosomes. On the other hand, in the livers of infected animals, thepolyribosomal peak was missing. Also, the monosome-disome peak in thisinstance was very =fh larger than in normals. This did indeed indicatea disruption of the polyribosomes. The exact mechqnism responj•ble forthis phenomenon is noL clear as yet. However, weV1 and othersw. havereported that during arbovirus infection host RNA synthesis is greatlyreduced early in the infectious cycle.
Another interisting finding in this gradient study was the appearanceof a very heavy aggregate, found toward the bottom of the tube. We haveas yet done no infectivity assays on these fractions, but this peak mayrepresent an aggregation of mature virus particles.
It Is clear that host ribonuclaic acid metabolism is altered in mouseliver during infections. By Incorporating uridine-C1 4 iato RNA, it wasseen that al increese in synthetic rate occurred during D. onsumoniaeinfection, and a decrease during the arbovirut infection. Similar ccn-clusions were drawn indirectly from the in vitro protein synthesis experi-ments, and the sucrose gradient studies.
It was of interest to study RNA directly by isolating it from the restof the cellular components in relatively pure form. We have dons this.I think this phase of the work may provide some very excitin; answers tocurrent problems,
• .. . .. .J
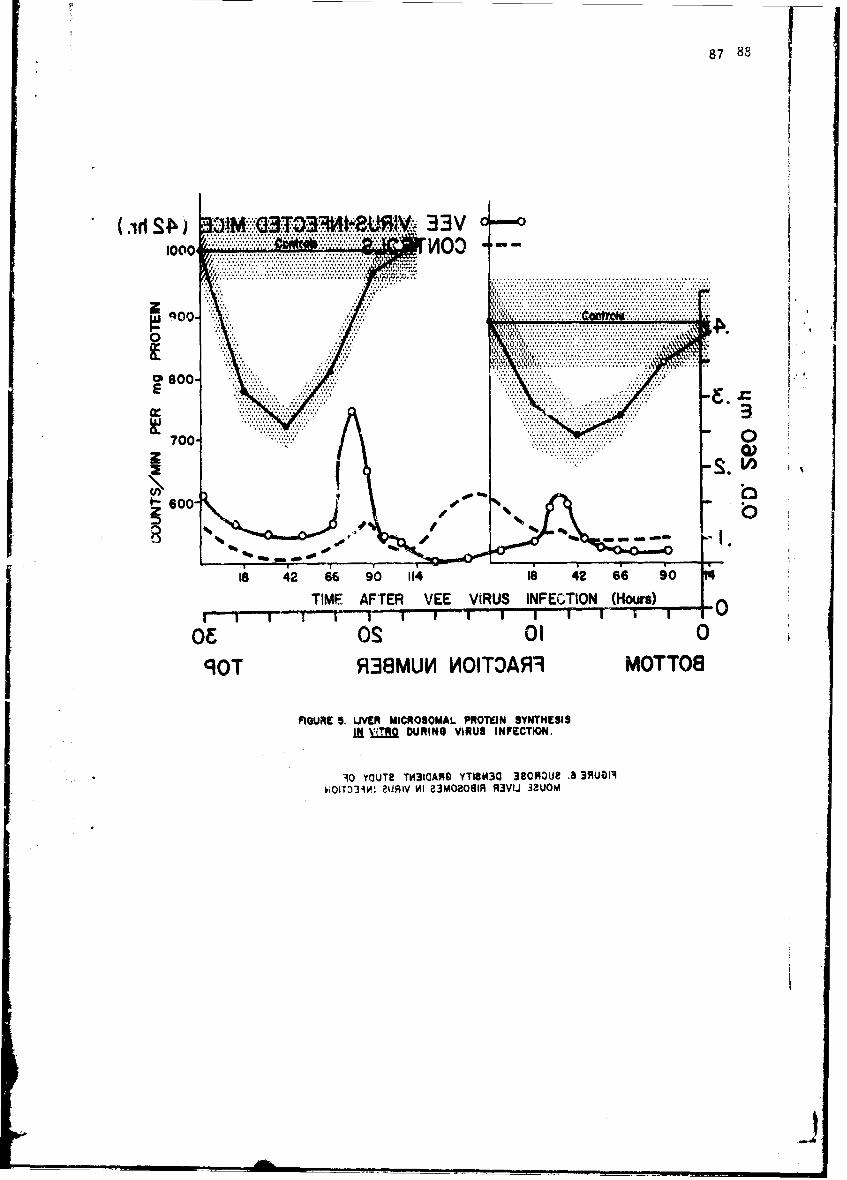
87 88
(.d S-P tM 33V 0-1000...... ... ...........
.. . ... . .... .. . 0 .. .. ..
r.. ........OS 0al0
.............................T T...FiG U R E 5. .......................YN T..SI~ DURIN............T...
q~ YOU2 TI4ICAHBYTISM3 ...........UOIi~oiT~J*~:~ iJ.......................UO
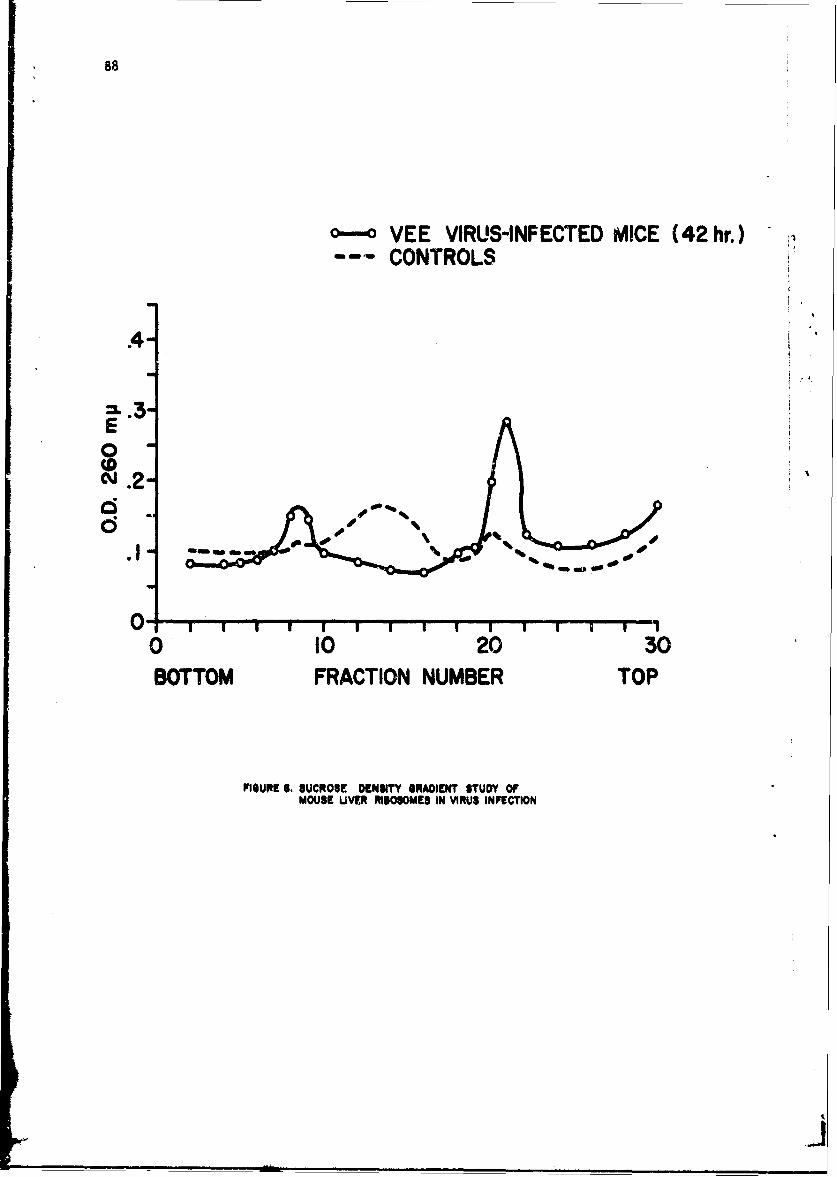
88
.- o VEE VIRUS-INFECTED MICE (42 hr.)-- 'CONTROLS
to, do.
E
0
0 - I I i I I I I I I "' I I
0 10 20 30
BOTTOM FRACTION NUMBER TOP
FIGURE 6. SUCROSE DENSITY IRAWIENT STUDY OFMOUSE UVER RIBO•OMES IN VIRUS INFECTION
bI.
.2
89
Infection may elicit an adrenal hormone response. The hormone interactsat the gene level with deoxyribonucleic acid (DNA), causing increasedmessenger RNA synthesis, and suboequently increased protein formation. Thisis the pattern seen in liver. It is not a universal phenomenon; contrary tothis, in muscle, cortisol is known to decrease protein synthesis. We havealso obtained data to support this concept.==" The RNA-virus also altersmetabolism more specifically. First, it is known to inhibit DNA directedRNA synthesis. This means it is preventing host messenger RNA formation.Secondly, since the viral RNA is the template for new viral RNA formationa~id new enzymes are induced, the viral RNA may also serve as messenger RNA.At any rate, it becomes clear that host messenger RN should appear inlesser amounts in the polyribosomes during virus replication. We would liketo be able to measure these alterations qunta-tativel, it is this veryproblem that will be described.
The methods in general use for fractionating RNA are the sucrose densitygradient and also the methylated albumin or Kieselguhr column. These methodsare used extensively, do not have a very high degree of resolution, arelaborious, and take relatively long periods of time to perform.
Recently I had the opportunity to spend some time in the physiologicalchemistry laboratory of H. 0. Munroe at the Massachusetts Institute ofTechnology, Cambridge. Dr. Munroi/ allowed me to become acquainted withhis very promising and as yet unpublished method for separating RNA's.Basically the method iuvolves electrophoresis of the isolated RNA on agarosegels at pH 7.9. The RNA components are rapidly and discretely separatedfrom one another with a high degree of resolution. RNA's are seen inaddition to those usually observed in a sucrose gradient. RNA can beisolated very satisfactorily by the phenol method from: whole homogenate,nuclei, microsomes, ribosomes, ribosomal subunits and from the solublecellular fraction. This isolation was done; the isolgte were then charac-terized further by both sucrose gradients and agarose gel electrophoresis.
Figure 7 illustrates the pattern of RNA distribution on a 5-20%sucrose gradient. When purified soluble ERA was layered on the gradienta peak appeared in this area with a sedimentation value of 4S; when ribo-somal RNA was used 3 peaks were generally seen; a 28S and 18S peak corres-ponding to the 2 ribosomal subunits and a smaller RNA peak which isassociated with the ribosomes; the material in the small peak is somewhatheavier than '-luble RNA and is designated 6S in this case. We now knowthat this small peak in the gradient alwayb contains impurities of 4S(soluble ENA) under our conditions. The peak under the dotted line,designated 36S, is the peak we expect to find for purified arbovirus RNA.We have a small stock of purified VIE RNA and Sindbis virus RNA. Basedon the work of others,*Sindbis virus RNA should give a peak in the samearea.
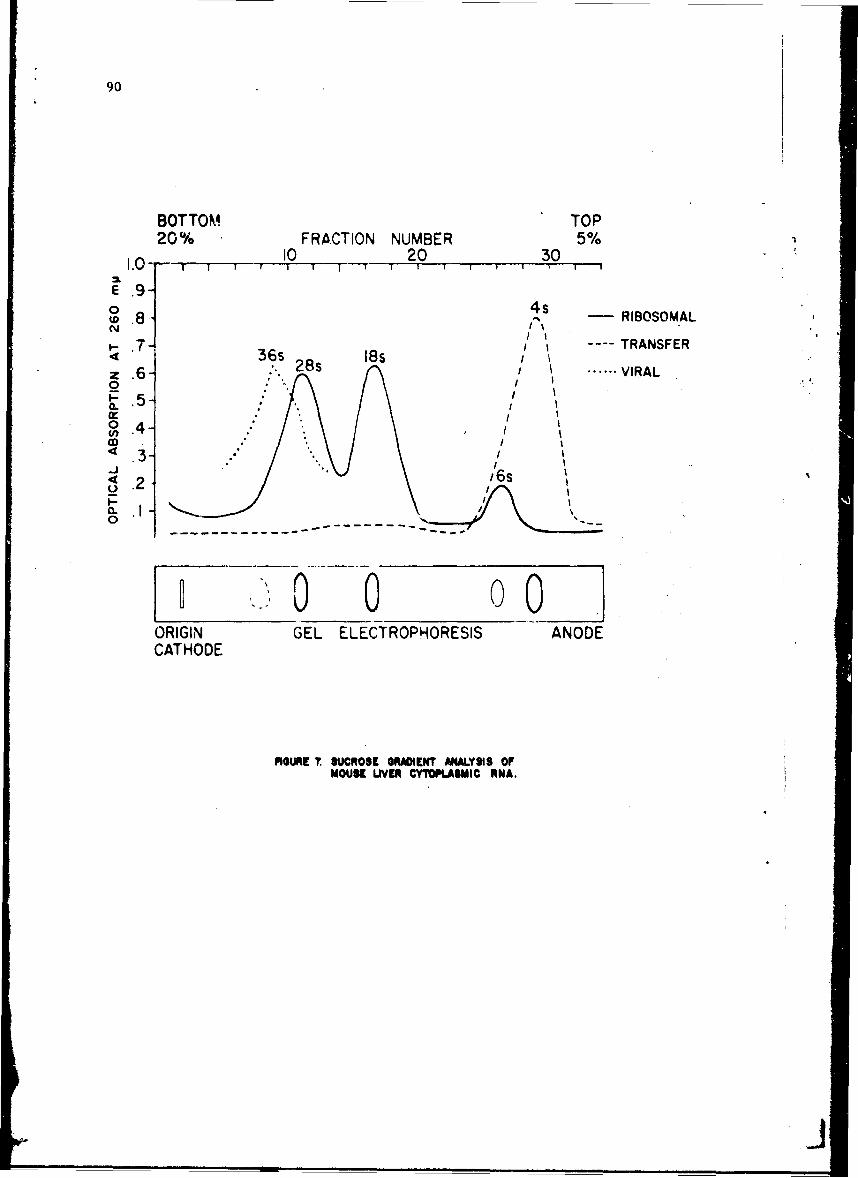
90
BOTTOM TOP20% FRACTION NUMBER 5%
10 20 30
E .9-0 4s8 J-- RIBOSOMAL
.7 TRANSFER4 36s 18sz .6- 28s I ...... VIRAL0
.5-
0U) .4- I
0 .2
I- I
0_- 0 0 0ORIGIN GEL ELECTROPHORESIS ANODECATHODE
iGURE 7. SUCROSE ORADIENT AXALYS1I OFMOUSE UVER CYTOPLASMIC RNA.
.- • J
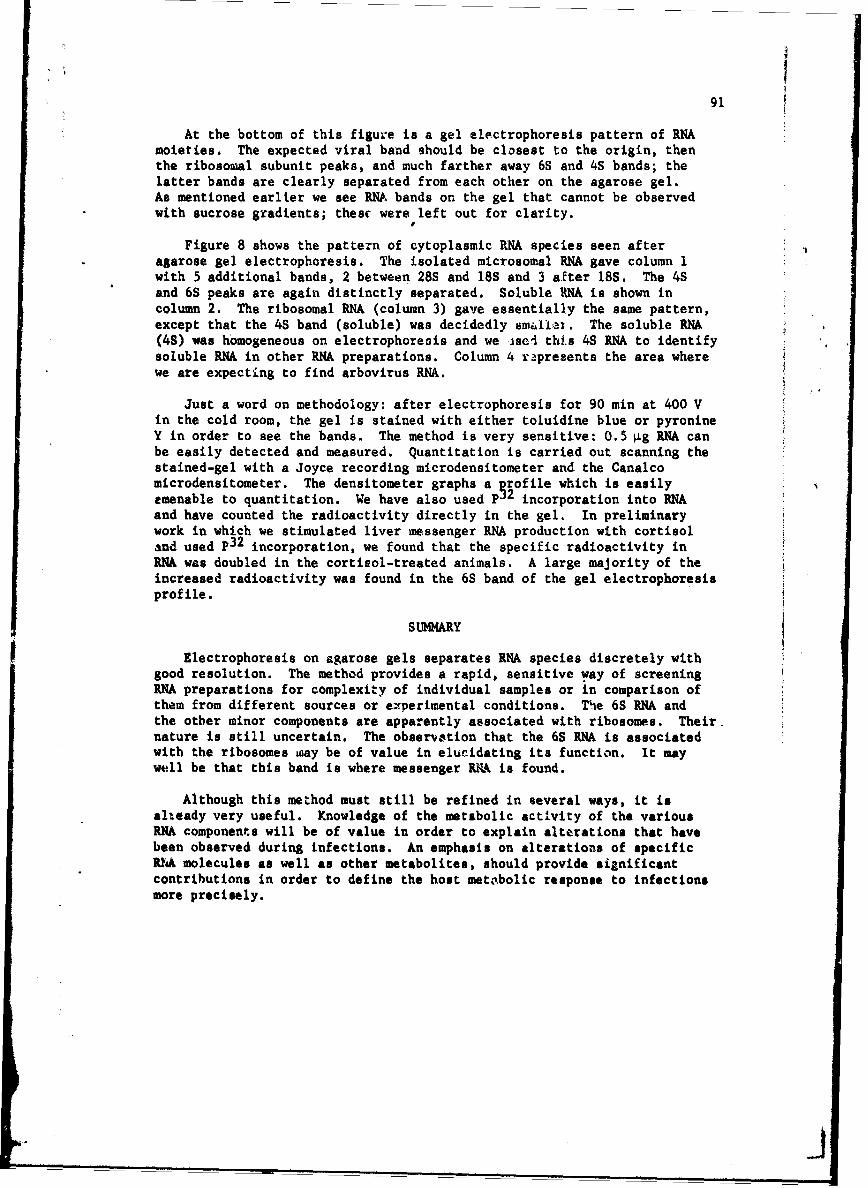
91
At the bottom of this figure is a gel electrophoresis pattern of RNAmoieties. The expected viral band should be closest to the origin, thenthe ribosomal subunit peaks, and much farther away 6S and 4S bands; thelatter bands are clearly separated from each other on the agarose gel.As mentioned earlier we see RNA bands on the gel that cannot be observedwith sucrose gradients; these were left out for clarity.
Figure 8 shows the pattern of cytoplasmic RNA species seen afteragarose gel electrophoresis. The isolated microsomal RNA gave column 1with 5 additional bands, 2 between 28S and 188 and 3 after 18S. The 4Sand 6S peaks are again distinctly separated. Soluble RNA is shown incolumn 2. The ribosomal RNA (column 3) gave essentially the same pattern,except that the 4S band (soluble) was decidedly smallez. The soluble RNA(4S) was homogeneous on electrophoresis and we ise-1 this 4S RNA to identifysoluble RNA in other RNA preparations. Column 4 rapresents the area wherewe are expecting to find arbovirus RNA.
Just a word on methodology: after electrophoresis for 90 min at 400 Vin the cold room, the gel is stained with either toluidine blue or pyronineY in order to see the bands. The method is very sensitive: 0.5 pLg RNA canbe easily detected and measured. Quantitation is carried out scanning thestained-gel with a Joyce recording microdensitometer and the Canalcomicrodensitometer. The densitometer graphs a profile which is easilyemenable to quantitation. We have also used p3 2 incorporation into RNAand have counted the radioactivity directly in the gel. In preliminarywork in which we stimulated liver messenger RNA production with cortisoland used p3 2 incorporation, we found that the specific radioactivity inRNA was doubled in the cortisol-treated animals. A large majority of theincreased radioactivity was found in the 6S band of the gel electrophoresisprofile.
SUMMARY
Electrophoresis on agarose gels separates RNA species discretely withgood resolution. The method provides a rapid, sensitive way of screeningRNA preparations for complexity of individual samples or in comparison ofthem from different sources or experimental conditions. The 6S RNA andthe other minor components are apparently associated with ribosomes. Their.nature is still uncertain. The observation that the 6S iRA is associatedwith the ribosomes way be of value in elucidating its function. It maywell be that this band is where messenger RNA is found.
Although this method must still be refined in several ways, it isaheady very useful. Knowledge of the metabolic activity of the variousRNA components will be of value in order to explain alterations that havebeen observed during infections. An emphasis on alterations of specificRIt molecules as well as other metabolites, should provide si~nificantcontributions in order to define the host metabolic response to infectionsmore precisely.
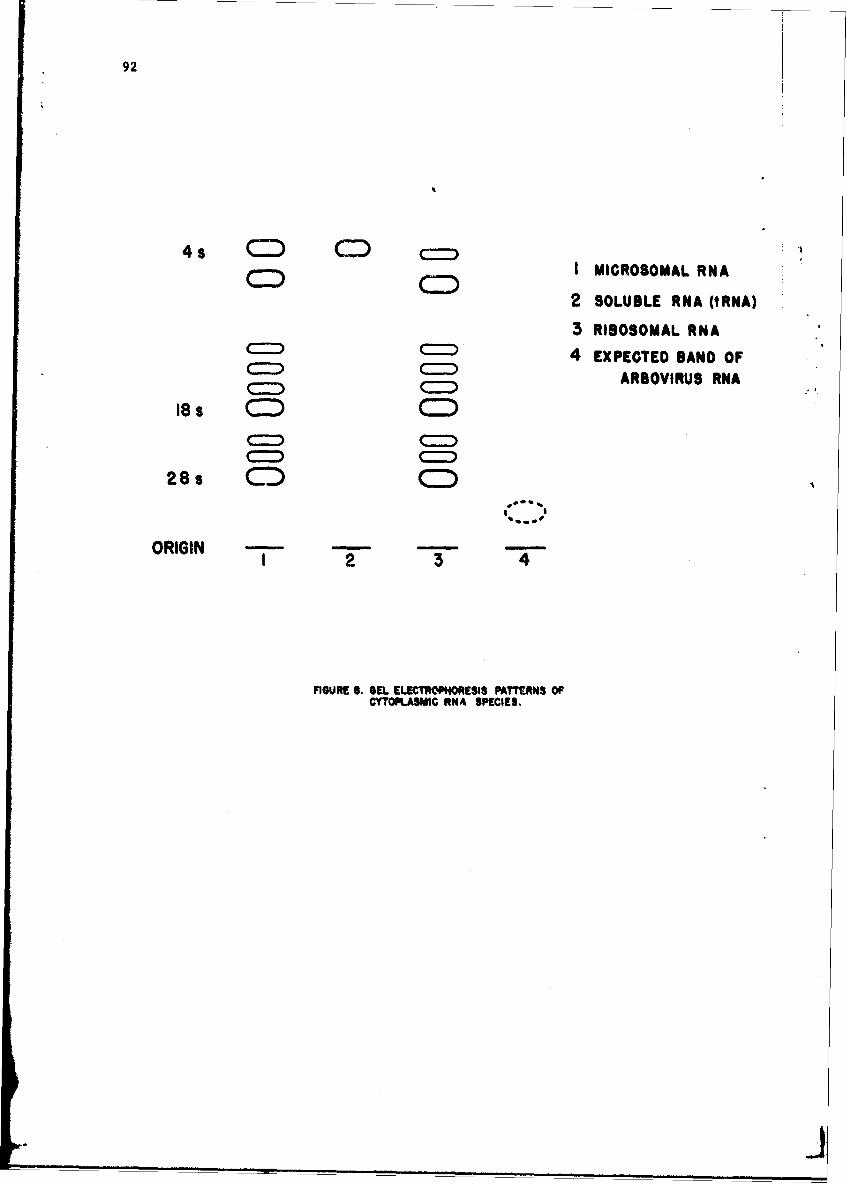
92
I MIGROSOMAL RNA2 SOLUBLE RNA (tRNA)
3 RIBOSOMAL RNAC (Z4 EXPECTED BAND OF
C:) • ARSOVIRUS RNAlas CD CD
28s c
ORIGIN
FIGURE S. GEL ELECTROPHORESIS PATTI"RNS OfCYTOPLASMIC RNA SPECIES.
___ ____
; '• 93
ACKNOWT2DGEMENT
The excellent technical assistance of W. L. Thompson, D. G. Ostergren,and R. D. O'Dell is acknowledged.
LITERATURE CIT"'
1. Lust, G. 1966. The influence of an arbovirus infection on host-cellribonucleic acid and protein synthesis. Army Science ConferenceProceedings 11:41r59.
2. Lust, G., and D. G. Van Ormer. 1966. Protein synthesis in mouse tissuesduring acute infection. Proc. Rutgers Symposium Stress and ProteinMetabolism. Monograph, in press.
3. Lust, G. 1966. Effect of infection on protein and nucleic acid synthesisin mammalian organs and tissues. Fed, Proc. 25:1688-1694.
4. Lust, G. 1966. Alterations of protein synthesis in arbovirus-infectedL-cells. J. Bact. 91:1612-1617.
5. Elson, D. 1965. Metabolism of nucleic acids. Ann. Rev. Biochem. 34:449-486.
6. Penman, S., K. Scherrer, J. Becker, and J. 9. Darnell. 1963. Polyribo-somes in normal and poliovirus infected HeLa cells and their relationshipto messenger RNA. Proc. Nat. Acad. Sci. 49:654-662.
7. Levy, H. B., L. F. Snellbaker, and S. Baron. 1966. Effect of Interferonon IRN synthesis in Sindbis virus infected cells. Proc. Soc. Exp. Biol.Med. 121;630-632.
8. Munro, Ii. N. Personal communication.
J J
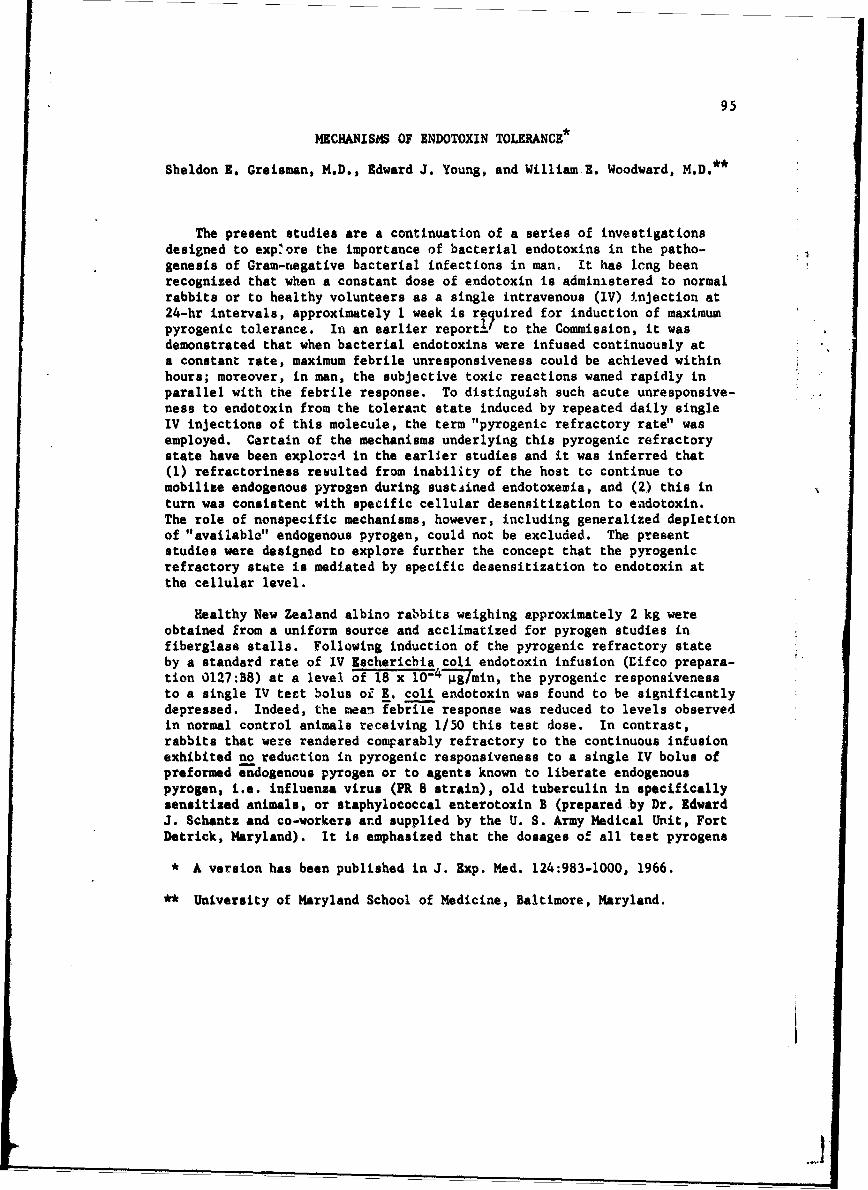
95
MECHANISMS OF ENDOTOXIN TOLERANCE
Sheldon R. Greisman, M.D., Edward J. Young, and William X. Woodward, M.D.**
The present studies are a continuation of a series of investigationsdesigned to exp ore the importance of bacterial endotoxins in the patho-genesis of Gram-negative bacterial infections in man. It has cong beenrecognized that when a constant dose of endotoxin is administered to normalrabbits or to healthy volunteers as a single intravenous (IV) injection at24-hr intervals, approximately 1 week is required for induction of maximumpyrogenic tolerance. In an earlier report! to the Commission, it wasdemonstrated that when bacterial endotoxins were infused continuously ata constant rate, maximum febrile unresponsiveness could be achieved withinhours; moreover, in man, the subjective toxic reactions waned rapidly inparallel with the febrile response. To distinguish such acute unresponsive-ness to endotoxin from the tolerant state induced by repeated daily singleIV injections of this molecule, the term "pyrogenic refractory rate" wasemployed. Certain of the mechanisms underlying this pyrogenic refractorystate have been explor-4 in the earlier studies and it was inferred that(1) refractoriness resulted from inability of the host to continue tomobilize endogenous pyrogen during sustAined endotoxemia, and (2) this inturn was consistent with specific cellular desensitization to eadotoxin.The role of nonspecific mechanisms, however, including generalized depletionof "available" endogenous pyrogen, could not be excluded. The presentstudies were designed to explore further the concept that the pyrogenicrefractory state is mediated by specific desensitization to endotoxin atthe cellular level.
Healthy New Zealand albino rabbits weighing approximately 2 kg wereobtained from a uniform source and acclimatized for pyrogen studies infiberglass stalls. Following induction of the pyrogenic refractory stateby a standard rate of IV Eschericbia coli endotoxin infusion (Difco prepara-tion 0127:B8) at a level of 18 x lO4-g/min, the pyrogenic responsivenessto a single IV teet bolus of E. coli endotoxin was found to be significantlydepressed. Indeed, the mean febrile response was reduced to levels observedin normal control animals receiving 1/50 this test dose. In contrast,rabbits that were rendered comparably refractory to the continuous infusionexhibited no reduction in pyrogenic responsiveness to a single IV bolus ofpreformed endogenous pyrogen or to agents known to liberate endogenouspyrogen, i.e. influenza virus (PR 8 strain), old tuberculin in specificallysensitized animals, or staphylococcal enterotoxin B (prepared by Dr. EdwardJ. Schantz and co-workers ard supplied by the U. S. Army Medical Unit, FortDetrick, Maryland). It is emphasized that the dosages of all test pyrogens
* A version has been published in J. Exp. Med. 124:983-1000, 1966.
** University of Maryland School of Medicine, Baltimore, Maryland.
96
were carefully selected to evoke febrile responses within the sensitiveportions of their respective dome-response regions. In addition, con-tinuous IV infusions of heat-killed pneumococcal suspensions resulted inmaintained febrile responses, observations comparable to those of Atkinsand Freedman•2 employing autoclaved staphylococci. Such responses pre-sumably are mediated by sustained mobilization of endogenous pyrogen.F.Iially, it was observed that: (1) a continuous infusion of old tuberculininto specifically sensitized rabbits reslted in a pyrogenic refractoryresponse pattern ganezaiiy similar to that evoked by endntoxin; (2) endo-toxin refractory phase plasma and liver homogenates exhibited no enhancedcapacity to inactivate E. coli endotoxin pyrogenicity; (3) splenectomizedrabbits .eail1 y developed the endotoxin pyrogenic refractory stata andexhibited diminished inflammatory responses to intradernal testing withendotoxin; and (4) administration of fresh whole blood from normal donorscontaining an average of 1.6 x 10 granulocytes failed to restore febrileresponsiveness to the continving E. coli endotoxin infusion.
The present observations, considered to-ethe: with those of otherinvestigators, support the hypothesis that pyrogenic unresponsiveness tcendotoxin inrolvej 2 distinct immunologic mechanisms. In terms of thishypothesis, the rapid reduction in febrile unrespoi•siveness to endotoxinis mediated by desencitizLtion at the cellular level. With small dosesof endotoxin such as those employed in the present studies (< 1 gg) thisdesensitization is primkr1iy specifi,; wi~h larger doses, nonspecificmechanisms are superimposed. SG long as the subsequent doses of endotoxinare closely spaced or continuously infused, optimal conditions are providedfor cellular desensitization and pyrogeniL unresponsiveness to a givenquantity of endotoxin can be induced raplily and maintained without therequirement for antibody. However, as the interval between endotoxinchallenge is lengthened, cellular desensitization wanes and toler-inccbecomes increasingly dependent upon tlose antibodies directed against thecommon toxophore groupings responsible for endotoxin pyrogenicity Aichassist the reticuloendothelial system in the clearance ane destructionof this molecule.
SIARY
The present observatiotLs, considered together with those of otherinvestigators, support the hypothesis that pyragenic unresponsiv'uess toendotoxin involves two distinct 4mmunologic mechanisms. In terms of thishypothesis, the rapid reduction in febrila responsiveness to endetoxin ismediated by desensititation at the cellular level. With small doses ofendotoxin, such as those employed in the preient studieis, this desensiti-zation is primarily specific; with larger doses, nopipecific mechanism;are superimposed. So long as the subsequent d4cses of endotxxia are closelyspaced or continuously infused, optimal conditions are provided for cellulardesensitization and pyrogenic unresponsiveness to a given quantizy of ende.toxin can be induced rapidly and maintained without the requirement forantibody. However, as the interval between endotoxin challenge is lengthened,
S... ..
V97
cellular desensitization wanes and tolerance becomes i-areasingly dependentupon those antibodies directed against the common toxophors groups respon-sible for endotoxin pyrogenicity which assist the reticuloendothelialsystem in the clearance and destruction of this molecule.
LITERATUPRE CITED
1. Greisman, S. E., W. Z. Woodward, R. B. Hornick, and T. H. Woodward.February 1966. Role of endotoxin during typhoid fever and tularemia.p. 29 to 38. In Commission on Epidemiological Survey, Annual Reportto the Armed Forces Epidemiological Board, Fiscal Year 1965. U. S.Army Medical Unit Fort Detrick, Maryland.
2. Atkina, E., and L. R. Freedman. 1963. Studies in staphylococcal fever.I. kespot.rses to bacterial cells. Yale J. Biol. Med. 35:451-471.
_ _ _ _ _ _ _ _ _ _ _ __
99
THYPHOID FEVER: PATHOGENESIS AND PREVENTION
Richard B. Hornick, M.D.
The study of typhoid fever induced in inmate volunteers has entered anew phase as one major goal has been achieved. Quanitative prophylacticefficacy of several vaccine preparations has been determined by utilizingvarying challenge doses of the Vi antigen-containing strain of Salmonellatyphosa, Quailes strain. Th..se results are reviewed in Table I. Theincidence of disease appeared to be almost identical in those men vaccinatedwith L •phenolized vaccine) or K (acetonized vaccine) following challengewith 10 organisms. No evidence of vaccine-induced resistance demonstrablein the groups challenged with an ID50 (107) or greater doses of typhoidbacilli. Analysis of 0, H, and Vi antibody titers at time of challenge ofthe controls and vaccinees failed to demonstrate any c-rrelation betweenlevel of antibody and resistance to infection. This is especially true inthe controls challenged with the ID50 dose (Table II). In fact more ofthose volunteers who had no demonstrable 0, H, or Vi antibody titers failedto become ill suggesting that in the absence of circulating antibodiesdisease does not necessarily follow the challenge. Obviously other circu-lating antibodies may be present which are important in resistance and havenot yet beea. measured. However, in these controls with negative 0, H, andVi titers such an antibody (or antibodies) must be nonspecific and certainlyunrelated to vaccine administration. If the ingested organisms were unableto multiply in the gut and invade the mucosa because of bacterial inter-ference or other local factors, this would appear to be a much superiordefense mechanism than reliance on humoral antibodies.
We think it necessary to emphasize the lack of differentiation invaccine immunity in the volunteer scudy because these results imply thatantigenic makeup of the individual products may not be as important asother investigators have suggested. In the World Health Organization fieldtrials-± vaccine K was found to be superior to vaccine L in protectingadults. In children both vaccines were effective. This superiority wasattributed to the preservation of Vi antigen by acetone in contrast to thedegradation of this antigen by heat and phenol in vaccine L.
Evidence accumulated in recent volunteer studies tends to discreditthe importance of Vi antigen in immunizing man or indeed as an essentialoffensive weapon of S. typhosa. First, volunteers immunized with purifiedVi antisen have not showu enhanced protection at any of the challengelevels. Protection following the ID2 5 challenge was similar to thatobtained with vaccines K and L (Table I). Furthermore, the titers of Viantibodies were very similar whether K or L vaccine was administered tovolunteers suggesting that ample Vi antigen survived the phenol treatment.
* University of Maryland School of Medicine, Baltimore, Maryland.
4
-J
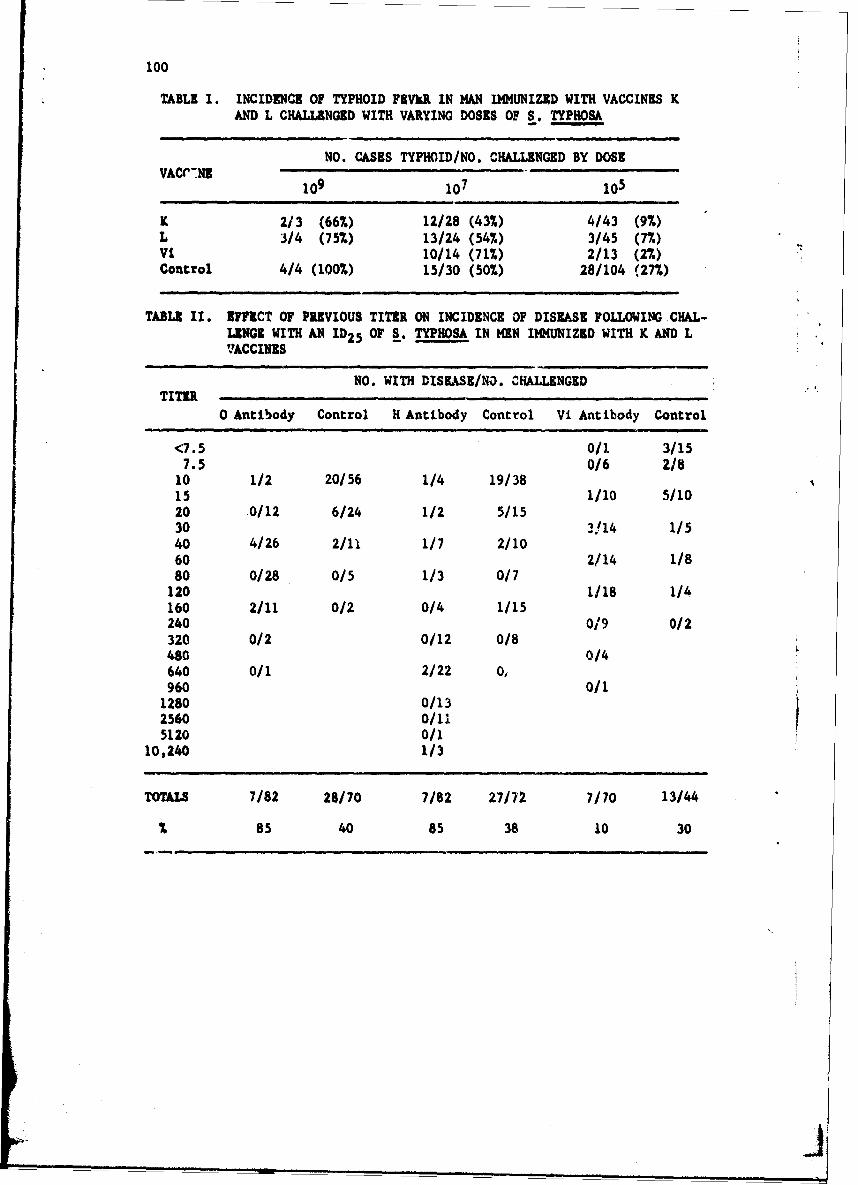
100
TABLE I. INCIDENCE OF TYPHOID FEVER IN MAN IMMUNIZED WITH VACCINES KAND L CHALLENGED WITH VARYING DOSES OF S. TYPIOSA
NO. CASES TYPHOID/NO. CHALLENGED BY DOSEVACC'.NE ... .109 107 105
K 2/3 (66%) 12/28 (43%) 4/43 (9%)L 3/4 (75%) 13/24 (54%) 3/45 (7%)Vi 10/14 (71%) 2/13 (2%)Control 4/4 (100%) 15/30 (50%) 28/104 (27%)
TABLE II. EFFECT OF PREVIOUS TITER ON INCIDENCE OF DISEASE FOLLOWING CHAL-LINGE WITH AN ID2 5 OF S. TYPHOSA IN MEN IMMUNIZED WITH K AND LVJACCINES
NO. WITH DISEASE/NO. CHALLENGEDTITER
0 Antibody Control H Antibody Control Vi Antibody Control
<7.5 0/1 3/157.5 0/6 2/8
10 1/2 20/56 1/4 19/3815 1/10 5/1020 0/12 6/24 112 5/1530 3V14 1/540 4/26 2/11 1/7 2/1060 2/14 1/880 0/28 0/5 113 0/7
120 1/18 1/4160 2/11 0/2 0/4 1/15240 0/9 0/2320 0/2 0/12 0/8480 0/4640 0/1 2/22 0O960 0/1
1280 0/132560 0/115120 0/1
10,240 1/3
TOTALS 7/82 28/70 7/82 27/72 7/70 13/44
% 85 40 85 38 10 30
"_ _ _ _ _ _ _ _ _ _ _ _ _ _ _ _ _
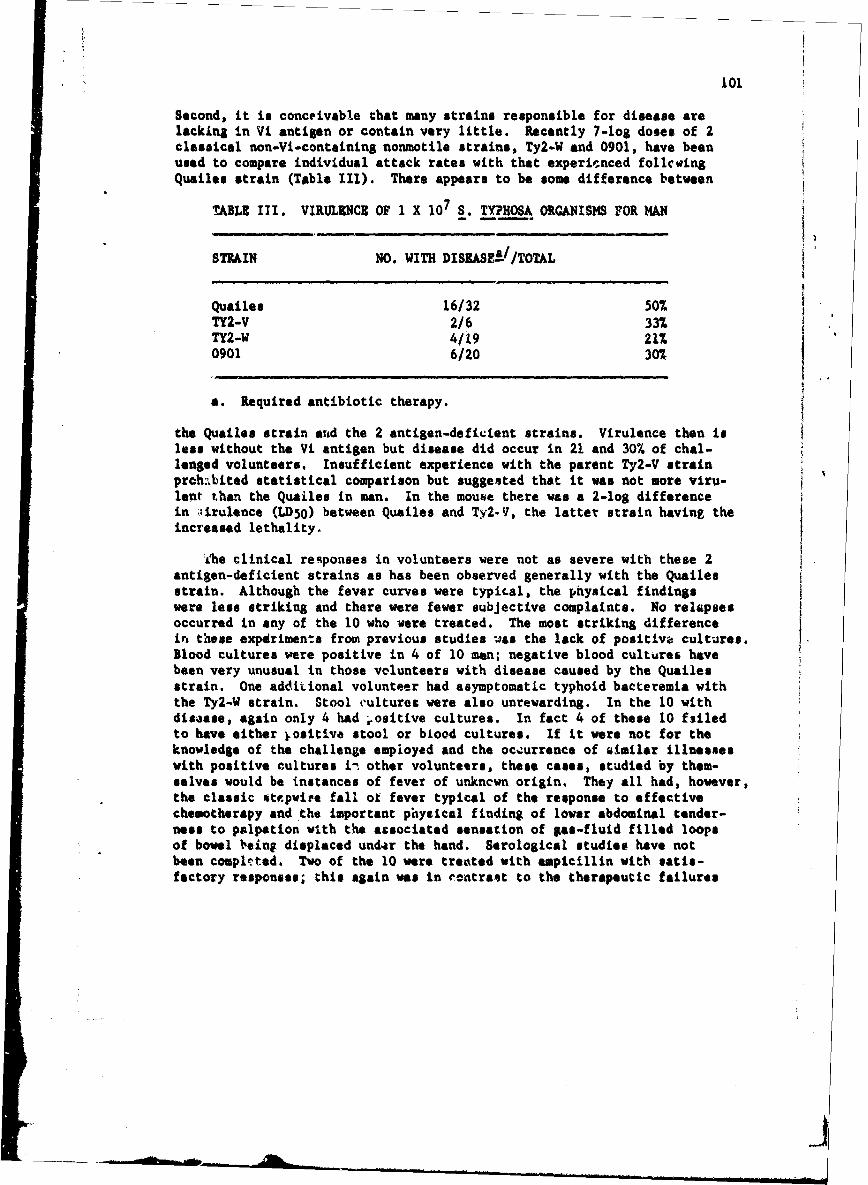
101
Second, it is conceivable that many strains responsible for disease arelacking in Vi antigen or contain very little. Recently 7-log doses of 2classical non-Vi-containing nonmotile strains, Ty2-W and 0901, have beenused to compare individual attack rates with that expericnced follcwingQuailes strain (Table III). There appears to be some difference between
TABLE III. VIRULiNCE OF 1 X 10⁷ S. TYPHOSA ORGANISMS FOR MAN
STRAIN NO. WITH DISEASEI//TOTAL
Quailes 16/32 50%TY2-V 2/6 33%..TY2-W 4/19 21%70901 6/20 30%
a. Required antibiotic therapy.
the Quailes strain and the 2 antigen-deficient strains. Virulence then isless without the Vi antigen but disease did occur in 21 and 30% of chal-lenged volunteers, Insufficient experience with the parent Ty2-V strainproh:Lbited statistical comparison but suggested that it was not more viru-lent than the Quailes in man. In the mouhe there was a 2-log differencein ,rulence (LD5O) between Quailes and Ty2-', the latter strain having theincreased lethality.
Ahe clinical responses in volunteers were not as severe with these 2antigen-deficient strains as has been observed generally with the Quailesstrain. Although the fever curves were typical, the physical findingswere less striking and there were fewer subjective complaints. No relapsesoccurred in any of the 10 who were treated. The most striking differencein these expdriments from previous studies was the lack of positiva cultures.Blood cultures were positive in 4 of 10 men; negative blood cultures havebeen very unusual in those volunteers with disease caused by the Quailesstrain. One additional volunteer had asymptomatic typhoid bacteremia withthe Ty2-W strain. Stool eultures were also unrewarding. In the 10 withdisaase, again only 4 had -ositive cultures. In fact 4 of these 10 failedto have either .ositive stool or blood cultures. If it were not for theknowledge of the challenge employed and the oczurrence of similar illnesseswith positive cultures in other volunteers, these cases, studied by them-selves would be instances of fever of unkncwn origin. They all had, however,the classic otepwite fall of fever typical of the response to effectivechemotherapy and the important physical finding of lower abdominal tender-ness to palpation with the associated sensation of gas-fluid filled loopsof bowel being displaced und4r the hand. Serological studies have notbeen compltted. Two of the 10 were treated with ampicillin with satis-factory responses; this again was in contrast to the therapeutic failures
102
with this drug in patients ill with Quaileg strain. This suggested thatcertain stra-L'ns of S. typhosa are more susceptibile to ampicillin'thanothers and this fact may account for the contradictory reports on affect.:iveness of this drug. It should be emphasized that one could not predict..rom it vitro tests that ampicillin would be more useful against the 0901 vstrain than the Quailes; tube dilution studies gave similar results forboth strains.
Antigenic analyses of the strains isolated frcm these patients areincomplete. However, Tully et ail have reported studies in chimpanzeesutilizing the same strains and could not demonstrate in vivo acqutsitionof Vi antigen. However, this was not true for H antigen. Some ',2-Wisolates from blood and stools did become motile in these studies. Wehave noted that several isolates from men challenged with strain 0901were motile.
Mr. Howard Semins, a second year medical student, conducted amino acidand sugar utilizations of iso1ates from the stools of these patients. Hewas able to find 4 strains that had acquired or lost the ability to fermentcertain sugars. This appears to involve at least 2 enzyme systems in eachinstance. These alterations were attributes of a strain of E. coli (14948)used for compadison studies and suggested the transference of geneticmaterial between the Quailes strain and nosocomial E. coli. These hybridshave stimulated our interest for use as possible oral vaccine strains. Therationale for this approach is the convincing animal studies of Formal andcolleaguesŽ/ using 1. coli - Shigella hybrids as successful oral vaccinesto prevent shigellosis in monkeys.
SUMMARY
Although the volunteer studies have shown typhoid vacrines to be effect-ive against low dose challenge, the exact mechanism or mechanisms of thisaction are not apparent. Vi antigen did not appear to be as necessary forthe virulince of typhoid bacilli in man as in mice and probably was notimportant for the immunization of man. Hybrid strains of Salmonella typhosahave been isolated from the stools of volunteers.
LITERATURE CITED
1. Yugoslav Typhoid Commission. 1962. A controlled field trial of theeffectiveness of phenol and alcohol typhoid vaccines. Bull. W.H.O.26:357-369.
2. Tully, J. G., S. Gaines, and W. D. Tigertt. 1962. Attempts to inducetyphoid fever in chimpanzees with non-Vi strains of Salmonella typhota.J. Inf. Dis. 110:41-54.
Ir V* !103
3. Formal, S. B., T. H. Unto H. C. Mtay, A. Palmer, S. Falkow, and ., H.LaBre%. 1966. Protection of minkeys against experimental shigellosiswith a living attenuated oral polyvalent dysentery vaccine. J. Bact.92:17-22.
I
A•
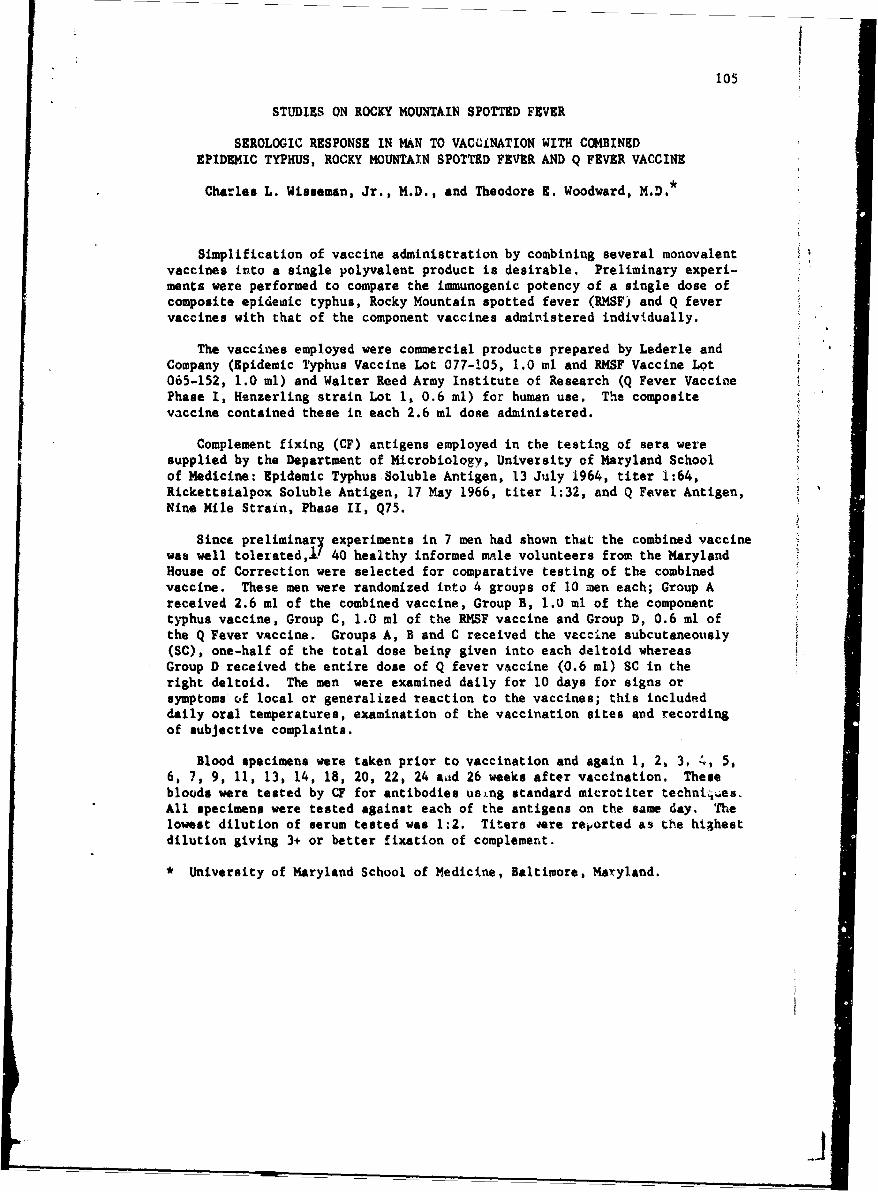
105
STUDIES ON ROCKY MOUNTAIN SPOTTED FEVER
SEROLOGIC RESPONSE IN MAN TO VACCiNATION WITH COMBINEDEPIDEMIC TYPHUS, ROCKY MOUNTAIN SPOTTED FEVER AND Q FEVER VACCINE
Charles L. Wisseman, Jr., M.D., and Theodore E. Woodward, M.D.*
Simplification of vaccine administration by combining several monovalentvaccines into a single polyvalent product is desirable. Preliminary experi-ments were performed to compare the immunogenic potency of a single dose ofcomposite epidemic typhus, Rocky Mountain spotted fever (RMSF) and Q fevervaccines with that of the component vaccines administered individually.
The vaccines employed were commercial products prepared by Lederle andCompany (Epidemic Typhus Vaccine Lot 077-105, 1.0 ml and RMSF Vaccine Lot065-152, 1.0 ml) and Walter Reed Army Institute of Research (Q Fever VaccinePhase I, Henzerling strain Lot 1, 0.6 ml) for human use. The compositevaccine contained these in each 2.6 ml dose administered.
Complement fixing (CF) antigens employed in the testing of sera weresupplied by the Department of Microbiology, University of Maryland Schoolof Medicine: Epidemic Typhus Soluble Antigen, 13 July 1964, titer 1:64,Rickettsialpox Soluble Antigen, 17 May 1966, titer 1:32, and Q Fever Antigen,Nine Mile Strain, Phaae II, Q75.
Since preliminary experiments in 7 men had shown that the combined vaccinewas well tolerated,i1 40 healthy informed mnle volunteers from the MarylandHouse of Correction were selected for comparative testing of the combinedvaccine. These men were randomized into 4 groups of 10 men each; Group Areceived 2.6 ml of the combined vaccine, Group B, 1.0 ml of the componentt)phus vaccine, Group C, 1.0 ml of the RMSF vaccine and Group D, 0.6 ml ofthe Q Fever vaccine. Groups A, B and C received the vaccine subcutaneously(SC), one-half of the total dose being given into each deltoid whereasGroup D received the entire dose of Q fever vaccine (0.6 ml) SC in theright deltoid. The men were examined daily for 10 days for signs orsymptoms of local or generalized reaction to the vaccines; this includeddaily oral temperatures, examination of the vaccination sites and recordingof subjective complaints.
Blood specimens were taken prior to vaccination and again 1, 2, 3, 4, 5,6, 7, 9, 11, 13, 14, 18, 20, 22, 24 aild 26 weeks after vaccination, Thesebloods were tested by CF for antibodies using standard microtiter techniý4es,All specimens were tested against each of the antigens on the same day. Thelowest dilution of serum tested was 1:2. Titer #ere reiorted as the highestdilution giving 3+ or better fixation of complement.
* University of Maryland School of Medicine, Baltimore, Maryland.
__ _ _ _ _ __ _ _ _
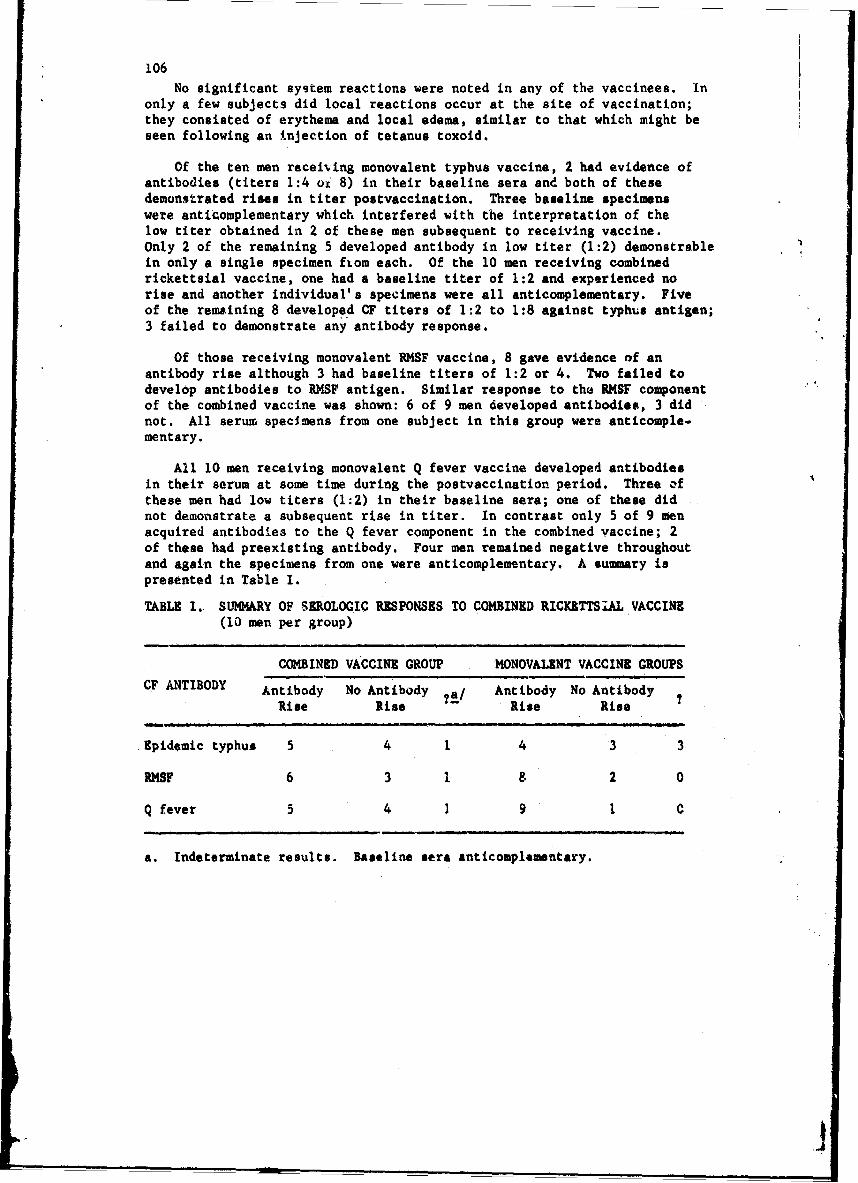
106No significant system reactions were noted in any of the vaccinees. In
only a few subjects did local reactions occur at the site of vaccination;they consisted of erythema and local edema, similar to that which might beseen following an injection of tetanus toxoid.
Of the ten men receiving monovalent typhus vaccine, 2 had evidence ofantibodies (titers 1:4 oi 8) in their baseline sera and both of thesedemonstrated rises in titer postvaccination. Three baseline specimenswere anticomplementary which interfered with the interpretation of thelow titer obtained in 2 of these men subsequent to receiving vaccine.Only 2 of the remaining 5 developed antibody in low titer (1:2) demonstrablein only a single specimen fiom each. Of the 10 men receiving combinedrickettsial vaccine, one had a baseline titer of 1:2 and experienced norise and another individual's specimens were all anticomplementary. Fiveof the remaining 8 developed CF titers of 1:2 to 1:8 against typhus antigen;3 failed to demonstrate any antibody response.
Of those receiving monovalent RPSF vaccine, 8 gave evidence of anantibody rise although 3 had baseline titers of 1:2 or 4. Two failed todevelop antibodies to RMSF antigen. Similar response to the RMSF componentof the combined vaccine was shown: 6 of 9 men developed antibodies, 3 didnot. All serum specimens from one subject in this group were anticomple-mentary.
All 10 men receiving monovalent Q fever vaccine developed antibodiesin their serum at some time during the postvaccination period. Three ofthese men had low titers (1:2) in their baseline sera; one of these didnot demonstrate a subsequent rise in titer. In contrast only 5 of 9 menacquired antibodies to the Q fever component in the combined vaccine; 2of these had preexisting antibody. Four men remained negative throughoutand again the specimens from one were anticomplementary. A summary ispresented in Table I.
TABLE I. SUMMARY OF SEROLOGIC RESPONSES TO COMBINED RICKETTSIAL VACCINE(10 men per group)
CCMBINED VACCINE GROUP MONOVALENT VACCINE GROUPS
CF ANTIBODY Antibody No Antibody ?a/ Antibody No Antibody
Rise Rise Rise Rise ?
.Epidemic typhus 5 4 1 4 3 3
RMSF 6 3 1 8 2 0
Q fever 5 4 1 9 1 C
a. Indeterminate results. Baseline sera anticomplementary.
S. . .. 2 2 . . . . 2 . .. ,
107
Antibodies were demonstrated where preseut 1 to 4 weeks after vaccineadministration; in many their presence persisted for only a short time.Anamnestic response in those few men with preexisting antibody generallydeveloped sooner and to higher titer. No remarkable differences were notedbetween response to combined vaccine as compared with monovalent vaccine,but the numbers are too small to detect subtle differences between groups.The volunteers still available for study have been given a booster dose ofthe respective vaccines and serologic testing is in progress. The antibodyresponse to this second inoculation should be greater than that reportedhere after a single dose.
SUMMARY
A total of 17 men have now been given a combined epidemic typhus, RMSFand Q fever vaccine without untoward local or systemic effects. Preliminaryserologic testing has revaaled little if any difference in response to thecomponents of this vaccine as compared with response to monovalent vaccineafter a single inoculation. Additional studies are in progress to extendthese observations and to measure the immunogenic effect of multiple dosevaccination.
LITERATURE CITED
1. Woodward, T. E. March 1966. Combined rickettsial vaccine. Presentedto the Commission on Rickettsial Diseases, Washington, D. C.
7"j
109
INFLUENCE OF TULAREMIA ON HUMAN INSULIN SECRETION*
George K. Shambaugh, III, Major, MC**
Carbohydrate metabolism is adversely influenced by infection. Thisobservation first made o-er a hundred years ago in cholera patients ha! f7enreported many times during a variety of different infectious diseases.=...The need for increased doses o' insulin in the olbetic patient with super-imposed infection is well recognized, but the mechanism underlying the pro-gressive deterioration of previously odequate diabetic control which maybegin before the onset of clinical illness remains obscure. Even the non-diabetic patient during a generalized infection has an increased fastingblood sugar and a deterioration of glucose tolerance. Because the reactionof the diabetic patient and the nondiabetic patient to infection appear tobe similar, an investigation of the mechanism of carbohydrate intolerancein the normal P:tient during infection was instituted. Circumstantialevidence obtained through the years suggests that a number of factors mightbe responsible for abnormalities in carbohydrate metabolism during infection.These factors may be divided into two groups: those involving insulin directlyand those involving peripheral pathways of carbohydrate metabolism. Factorsinvolving insulin might be: damage to pancreatic beta cells with a decreasedinsulin output,3/ enzymatic destruction of insulin,i/ binding of insulin byan antibody,i/ and insulin antagonism at peripheral sites by growth hormone.Factors involving peripheral pathways of carbohydrate metabolism might beglucocorticoid induced gluconeogenesis, increased nonesterified fatty acids,depression of glycogen synthesizing enzymes or other enzyme pathways ofcarbohydrate metabolism. None of these concepts have been supported byactual measurements of circulating insulin concentrations during infectionin the hian. Utilizing the radioimmunoassay of serum insulin concen-trations!' as well as the intravenous (IV) glucose tolerance curve, weinvestigated the impact of acute respiratory tularemia upon carbohydratemetabolism in 7 nondiabetic subjects during a preinfection control period,during maximum allowable infection before institution of therapy and inconvalescence 2 weeks later. The magnitude of maximum allowable infectionwas quantitated by the fever index defined as the degree hours of rectaltemperature > 100 F.
The IV glucose tolerance test was used to avoid problems of gastro-inte.tinal absorption, to give a known load of glucose within a brief timelimit, and to obtain a well defined initial onset of insulin response.Serial blood samples were analyzed for glucose by a glucose oxidase method.After rapid III loading, concentrations of glucose decline in a linearfashion when plotted on semilogarithmic paper (Figure 1). Such a straight
* A version has been cleared for publication in Diabetes.
SU. S. Army Medical Unit.
i.I

CONTROL FEVER CONVALESCENT 2 WEEKS300-
200-
E
0 30 60 90 0 30 60 90 0 30 60 90
MINUTES
FIGURE L DISAPPEARANCE RATES OF IV WGLUOSE IN 7 MEN.
111
line measures glucose disappearance in a dynamic manner; a distinct advantagein detecting suble changes from normal. The semilogarithmic presentation ofglucose tolerance was used to calculate the rate of disappearance which wasexpressed as a value k.
Serum glucose concentrations declined in a linear manner between 15 and60 min following the infusion. During maximum infection, the descendinglimb of the glucose tolerance curve became less steep, indicating a delay inglucose disappearance. Although the disappearance rates calculated for thepreinfection controls were significantly higher than those obtained duringmaximum illness all fell within a nondiabetic range. These data suggest thatsubtle changes in glucose tolerance may occur within 8 hr after the onset ofclinical symptoms. Two weeks postinfection, these changes began to returntcward normal.
Figure 2 shows values for k ± 1 SE during a control period, during maxi-mum fever and in convalescence. Notice the significant depression duringmaximum fever, and the return toward normal in convalescence. The bar onthe right depicts the k values reported in diabetes. Note that the rate ofglucose disappearance in the uninfected diabetic is far less than the normalpatient during maximum fever.
Fasting serum glucose concentrations during maximum fever were signifi-cantly higher than the values obtained during the preinfection control period.Although the observation of hyperglycemia during acute illness was made nearlya century ago our findings suggest that as early as 8 hr following the onsetof clinical symptoms a significant alteration in carbohydrate metabolism hasoccurred. Two weeks after maximum fever the fasting concentration of glucosehad fallen to preinfection control levels suggesting that those factors causingthe initial rise were not sustained. In contrast to fasting blood glucoseconcentrations, the increase of fasting serum insulin concentrations duringmaximum fever was not significantly higher than the preinfection control.
Following IV glucose administration, serial blood samples were analyzedfor insulin by a radioimmunoassay. Insulin concentrations in mU/ml wereplotted, a curve drawn and the area defined by this curve used to measurethe 3-hr insulin response of the pancreas to the glucose load. This valuewas expressed in milliunits/ml x minutes (Figure 3).
The insulin response curves during the preinfection control periodrevealed a rapid onset reaching a peak in 15-30 min, then faj~ing to con-trol values over 2-3 hr, a pattern described by Karam et al.-' Duringmaximum fever, however, the pattern of insulin output changed. The initialresponse to the glucose load was followed by a marked delay in the returnof elevated serum insulin concentrations to normal. Such a pattern has baendescribed following growth hormone or glucocorticoid administration. Incontrast, the pattern of insulin response to a glucose load in obese andmaturity onset diabetes is characterized by a delayed initial response whichis then followed by a delayed return to normal.
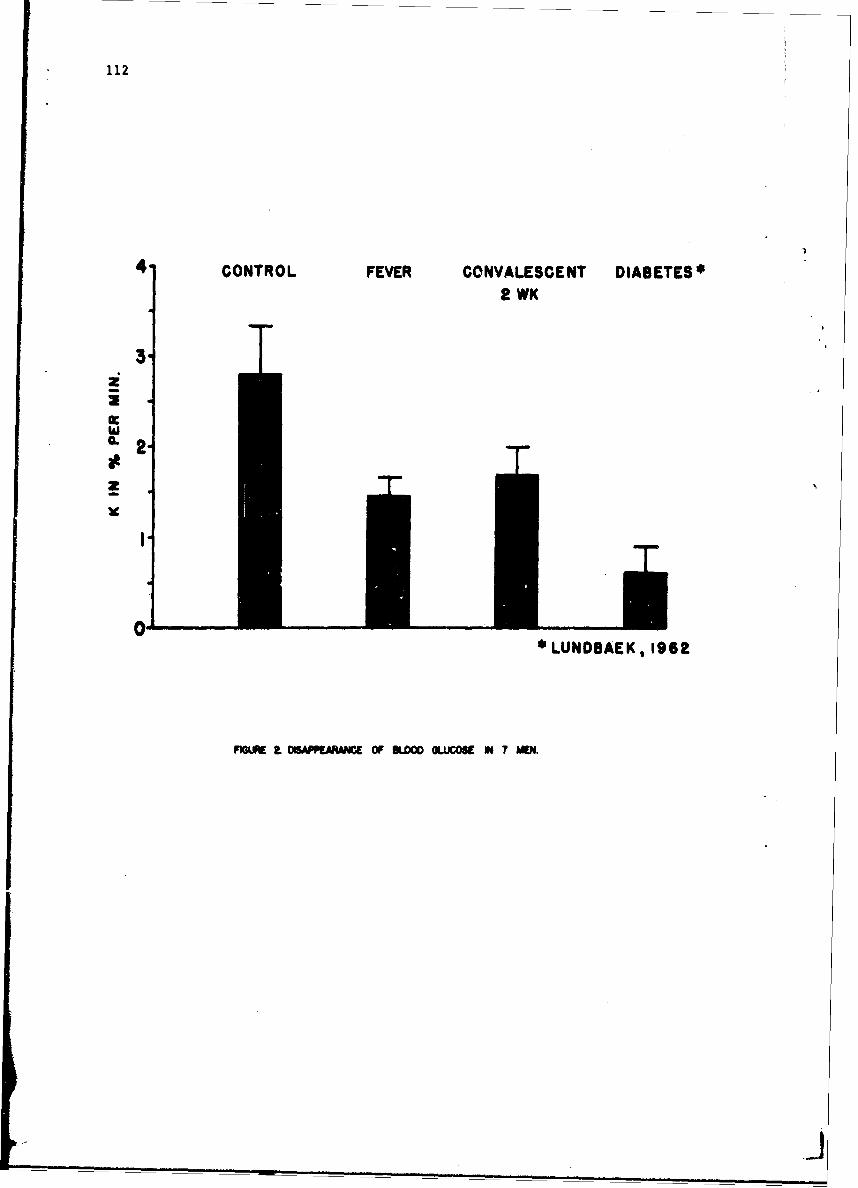
112
4 CONTROL FEVER CONVALESCENT DIABETES*2 WK
3
w"at
a
I
* LUNDBAEK, 1962
FIGUM t D"PMMr OF M00= GLUJOE W 7 MIN.
_ _ _ _ _ _ _ _j
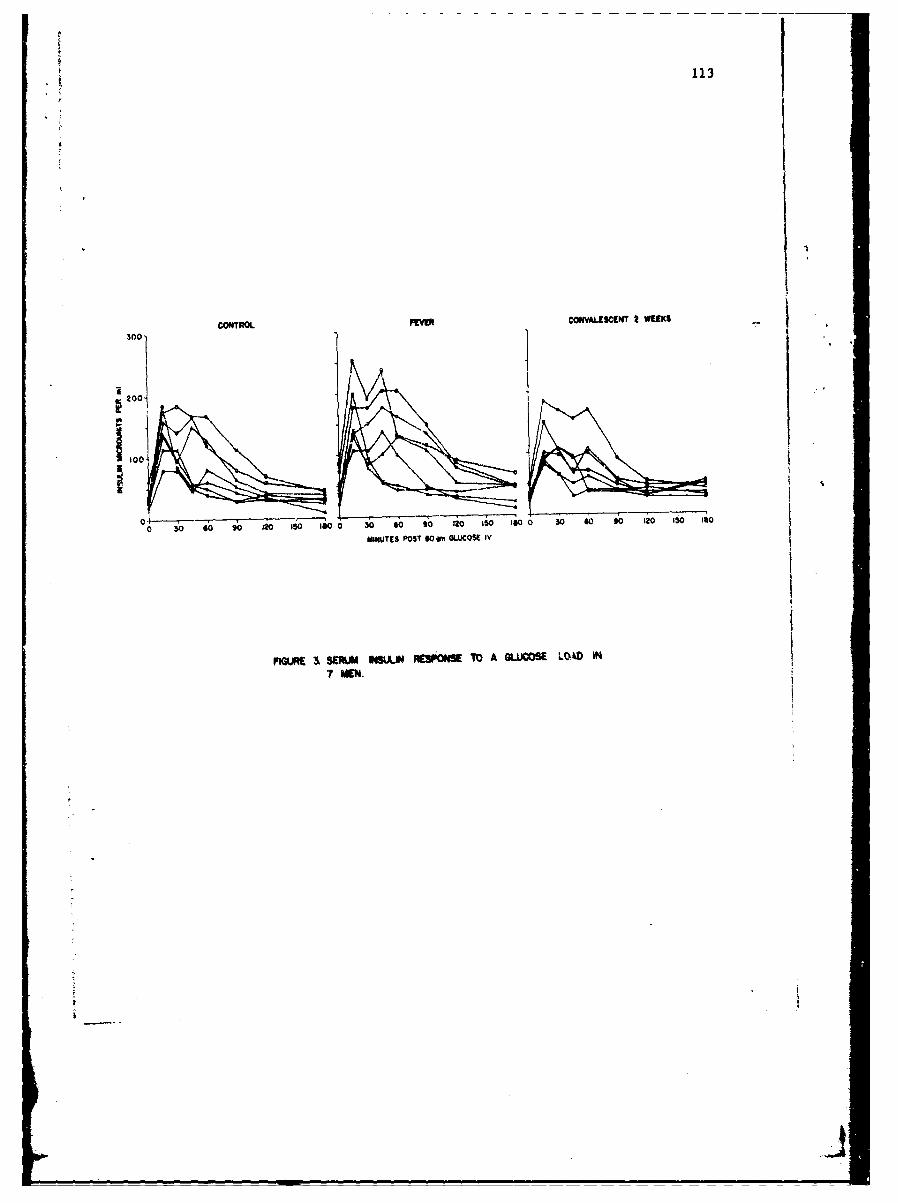
113
11
CONTMO FEWE CONVALESCENT 2 WteES
foo,200 • -•"3 0 S 2 S I
0o SOo so '2 So , so 0• 30 so to In IS so , 0 Go 9 101o 6MNUTES POST $Own GLUCOSE iv
FuRE SERM L W RSPOS TO A GL*M LOAD IN7 MEN.
114
The magnitude of the insulin output varied with each individual but theincrease in this respanse during infection remaiaed relatively constant foreach individual. The difference was significant at the 2% level. Thissuggested that the stimulus to increased insulin output during infectionhad affected all individuals to the same degree.
Because the insulin response during infection appeared to increasewhile the rate of serum glucose disappea-ance decreased, we attempted tofind some relationship between the fever index, insulin response, andglucose tolerance abnormalities. Of the many correlations made, cnly 3were significant (Figure 4).
The fever index on the day of maximum allowable illness correlateddirectly with the relatiye increasc in insulin output shown to the left.At the same time the rate of disappearance of serum glucose correlatedinversely with the fever index. Finally, the rate of glucose disappearancewas inversely related to the insulin response following the glucose loadon the day of maximum allowable illness. These findings may be interpretedin several ways. Fever was associated with an increased insulin output anda depression of glucose tolerance; therefore, the relationship betweeninsulin and glucose may be the result of fever alone. Secondly changesin fever, glucose, and insulin may be related to a common alteration inthe host during infection, and the relationship among the 3 is fortuitous.Finally, s.nce elevations in blood glucose concentrations are known tostimulate insulin output, the increased insulin response may be secondaryto a primary abnormality in carbohydrate metabolism that is somehow relatedto fever. In one asymptomatic patient a persistence of increased insulinoutput and a flattened glucose tolerance curve was seen 2 weeks postinfec-tion. This suggests that other factors besides fever may play a role.
Many factors affecting peripheral pathways of carbohydrate metabolismduring a generalized infection have been investigated concurrently duringprevious studies of acute respiratory tularemia in man. Such factors canbe classified as hormonal and nonhormonal.
Beisel and his workers&8/ investigated adrenocorticoid alterationsduring a generalized infection and found an increase in urinary cortisolexcretion. Although cortisol administration has been shown by otherinvestigators to increase insulin output, the dosages required were 4-5times those used by Beisel to duplicate the cortisol excretion duringmaximum infection. Cortisol has also been shown to increase whole bloodpyruvate levels following glucose loading. Alterations in thyroid hormoneconcentrations in the human during acute respiratory tularemia have beenstudied by myself. Briefly, thyroid hormone output decreases, the proteinbound iodine falls and the unbound physiologically active portion decreases.As these changes were barely significant, their effect upon carbohydratemetabolism would probably be of little importance.
_ _. . .._ _ A
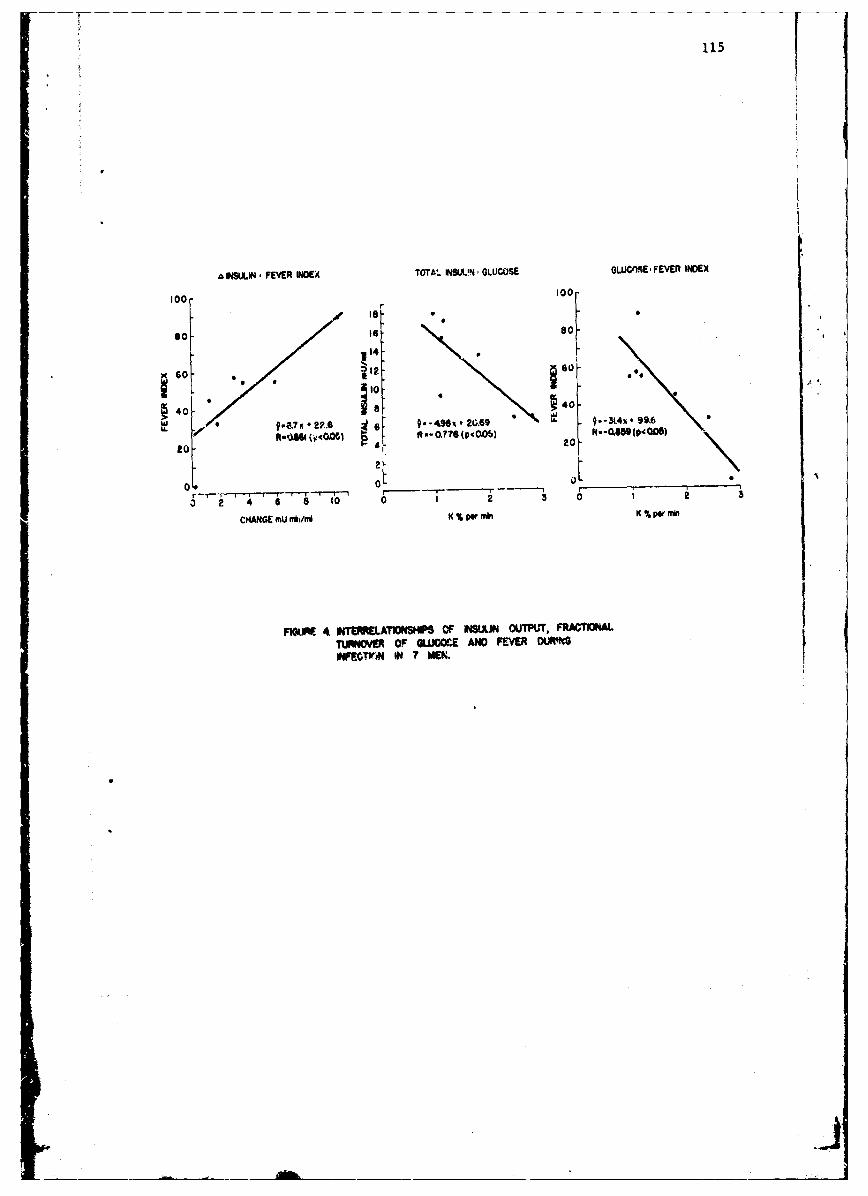
115
SINSULIN FEVER INOEX TOTtAL INSUL!N GLUCOSE oLUWrOE FEVER INDEX
100 o00o
Is.I
so so-5
x 60 1I0
to- 40404OS40 i s 40
* ~ ~ " 9.-~.P. e 9-5i..6- 9.31.4x 99.6LR-.OM4( .OG, "a-0.1760(pOOb) go R-5(pco.0)
2 4 6 t o0 0 I 2 3 0 2 3
CHANGE mU nMh/ml K % per min K %pr
F*OW 4 T[RRLATMONSHPS OF ISULIN OUTPUT, FRACTiONALTUNVE OF GLIE AND FEVER OUR•NGINFECTjrs IN 7 MEN.
,. _A
116
In order to study nonhormonal alterations in carbohydrate metabolism,the human red cell was chosen. This model has the advantage of insulininsensitivity and two well defined paths of carbohydrate metabolism: thepentosl shunt and the Embden Myerhoff pf~hway. During maximum fever,Beisel! demonstrated a depression of C 4 -labeled glucose metabolism bythe pentose shunt. These studies were extended by myself to 2 enzymes ofthis pathway glucose-6-phosphate dehydrogenase and 6-phospho-gluco-dehydro-Senase. These were also depressed slightly during maximum fever.
Finally, whole blood pyruvate concentrations were studied and foundto increase during maximum infection. This finding suggests that metabo-lism of pyruvate may be depressed as well.
The peripheral changes seen during tularemia are minimal but whentaken together, a combination of increased adrenal hormone output super-imposed upon suppression of various enzyme systems could result in hyper-glycemia and an abnormal glucose tolerance curve. Under these circum-stances, the increased insulin output seen during infection may well bea secondary phenomenon related to the increased blood sugar concentration.Other factors such as the role of growth hormone and nonesterified fattyacids remain to be investigated.
The deterioration of glucose tolerance during !nfection in man isaccompanied by an increased insulin response to glucose loading. Thesefindings are cowpatible with a transient peripheral inhibition of insulinactivity during the period of maximum fever.
SUMMARY
Serum insulin concentrations were measured serially in 7 nondiabeticsubjects following a rapid intravenous (IV) glucose load during a pre-infection :ontrol perio!, early clinical respiratory tularemia, and againin convalescence follswing therapy. Within 24 hr of onset of clinicalillness the rate of glucose disappearance from the blood had diminishedsignificantly. In contra3t, there was a brisk onset of insulin responsewhich reached higher peak concentrations and fell more slowly than theresponse observed during the preinfection control period. The patternduring clinical illness was different from that descriued after IV glucoseloading in maturity onset diabetes or obesity, and may have been influencedby glucocorticoid excess. The magnitude of insulin response during clinicalillness was significaatly increased and was directly related tc height offever. In contrast, the rate of glucose disappearance was inversely relatedto fever. The inverse relationship of the magnitude of insulin output tothe rate of glucose disappearance suggested a peripheral inhibition ofinsulin action during infection. Although fever may have played a roleduring acute Illness, the pz-irsistence of an abnormal insulin response inone odtient during convalesLence suggested that this change was notdependent u•cn fever alone.
1 ! 117
LITERATURE CITED
1. Hamnan, L., and I. I. Hirschman. 1917. Studies on blood sugar. I.Alimentary hyperglycemia and glycosuria aa a test of sugar tolerance.Arch. Intern. Med. 20:761-808.
2. Williams, J. L., and G. F. Dick. 1932. Decreased dextrose tolerancein acute infectious diseases. Arch. Intern. Med. 50:801-818.
3. Graham, G. 1925. The relation of infection to diabetic coma. Quart.I.. Med. 18:294-299.
4. Mirsky, I. A. 1952, The etiology of diabetes mellitus in man. RecentProgr. Hormone Res. 7:437-467.
5. Berson, S. A., R 1 . Yalow, A. Buman, M. A. Rochschild, and K. Newerly.i956. Insulin--I metabolism in human subjects: Demonstration ofinsulin binding globulin in the circulation of insulin treated subjects.J. Clin. Invest. 35;170-190.
6. Hales, C. N., and P. J. Randle. 1963. Immunoassay of insulin withinsulin-antibody precipitate, Biochem. J. 88:137-146.
7. Karam, J. H., C. M. Grodsky, and P. H. Foreham. 1963. Excessiveinsulin response to glucose in obese subjects as measured by immuno-chemical assay. Diabetes 12)97-204.
8. Beisel,.W. R., J. Bruton, K. D Auderson, and W. D. Sawyer. 1967.Adrenocortical responses dutiAi tularemia in human subjects. J. Clin.Endocr. 27:61-69.
9. Beisel, W. R. December 1964. Metabolic studies. p. 1 to 42. InComission on Epidemiological Survey Annual 1eport, Fiscal Year 1964,Armed Forces Epi&.iological Board. U. S. Army Medical Unit, FortDetrick, Maryland.
_ _ _ _ _ _ _
119
PUBLICATIONS OF THE U. S. ARMY MEDICAL UNIT
FISCAL YEAR 1966
1. Crawley G. J., J. N. Black, I. Gray, and J. W. Blanchard. 1966.Clinical chemistry of staphylococcal enterotoxin poisoning inmonkeys. Appl. Microbiol. 14:3:445-450.
2. Crawley, G. J., I. Gray, W. A. LeBlang, and J. W. Blanchard. 1966.
Blood binding, distribution and excretion of staphylococcal entero-toxLn in monkeys. J. Infect. Dis. 116:1:48-56.
3. Currie, J. A., J. D. Marshall, Jr., and D. Crozier. 1966. Thedetection of Pasteurella pseudotuberculosis antibodies by themicrohemagglutination test. J. Infect. Dis. 116:2:117-122.
4. Davis, M. H., A. L. Hogge, Jr., E. C. Corristan, and J. F. Ferrell.1966. Mosquito transmission of Venezuelan equine encephalomyelitisvirus from experimentally infected dogs. Amer. J. Trop. Med. & Hyg.15:2:227-234.
5. DePaoli, A. 1965. Schistosoma haematobium in the chimpanzee -- Anatural infection. Amer. J. Trop. Med. & Hyg. 14:4:561-565.
6. Dirks, K. R. 1966. Q fever, p. 39-40. In H. F. Conn (ed.),Current Therapy, 1966. W. B. Saunders Co., Philadelphia.
7. Feigin, R. D., and M. I. Rapoport. 1966. Influence of a bacterialtoxin on whole blood amino acids. Clin. Res. XIV:2:339 (abstract).
8. Gaines, S., J. A. Currie, and J. G. Tully. 1965. Factors affecting.ormation of incomplete Vi antibody in mice. J. Bact. 90:3:635-642.
9. Gilbert, C. F. 1966. Giant condyloma acuminatum (Butchke-Lowensteintumor). Arch. Derm. 93:6:714-717.
12. Larrabee, A. R., J. D. Marshall, and D. Crozier. 1965, Isolation ofantigens of Pasteurella pestis. I. L9oopolysaccharide-protein com-plex.and R and S Antigens. J. Bact. 90:1:116-119.
11. Lust, G. 196o. Alterations of protein synthesis in arbovirus-infected L-cells. J. Bact, 91:4:1612-1617. Effects of an arbovirusinfection on host-cell protein biosynthesis. Fed. Proc. 25:Z:312(abstract).
12. MacNair, D. S. 1966. Automatic color film processing in the pathologylaboratory. Amer. J. Clin. Path. 45:4:517-519.
_ _ _ -
120
13. Marshall, J. D., and P. A. Hansen. 1966. Histobacteriology of thegenlus Pasteurella. II. Specificity and stability of the variousspecies of Pasteurella. Proc. Soc. Exp. Biol. & Med. 122:1:275-278.
14. Rapoport, M. I., L. P. Hodoval, and W. ft. Beisel. 1965. An impliedmode of action for a bacterial toxin. Clin. Res. KIII:4:545 (abstract).
15. Aapoport, M. I., J. J. Murphy, D. G. Van Ormer, and W. R. Beisel.1966. Modification of cortisol-induced enzyme synthesis by a bacterialtoxin. Clin. Res. XIV:2:342 (abstract).
16. Sawyer, W. D., J. V. Jemski, A. L. Hogge, Jr., H. T. Eigeisbach,E. K. Wolfe, H. G. Dangerfield, W. S. Gochenour, Jr., and D. Crozier.1966. Effect of aerosol age on the infectivity of airtarne Pasteurellatularensis for Macaca, mulatta. and mian. J. Bact. 91:6:2180-2184.
1',. Shambaugh, G. E., III, and W. ft. Bexia31. 1965. Failure of TSHresponse to thyroidal depression duIn ng in2ection. Clin. Res. XIII:4:534 (abstract).
18. Shambaugh. G. 3., III, and~ W. ft. Beisel 1966. Thyroid physiologydurine generalized infectioni. Ann. Int. Med. 64:5:1160-1161 (abstract).
19. Shambaugh, G. E., III, D. S. MacNair, G. Lust, and W. ft. Beisel.1966. Early alterations in gut mucosal wetabolism during a nonentericinfection. Clin. Res. XIV:2:344 (abstract).
20. Taber, L. E., A. L. Hogge, Jr., and Rt. W. M~cKinney. 1965. Experimentalinfection of dogs with two strains of Venezuelan equine encephalo-myelitis virus. Amer. J. Trop. Med. & Hyg. 14:4:647-651.
21. Tully, J. G., S. Gaines, and U. D. Tigertt. 1965. Studies on infec-tion and inmmunity in experimental typhoid fever. VI. Response ofchimpanzees to endotoxin and the effect of tolerance on resistance to
oral challenge. J. Infect. Dis. 115:5-.445-455.
r DOCUMENT CONTROL DATA. F- R DoI. 0111ATINO ACTIVITY (*"fal" .016111SEUIYCLASOIPICATION
t Cosmmission on EieilgclSre fteAmd UCASFI!Forces Epidemiological Board and U. S. Army Medical so. smoupUnit, Fort Detrick, Frederick, Maryland 21701 NA
10.910911T TITLE
COMMISS ION ON EPIDMIZOLOGICAL SURVEY ANNUAL REPORT TO THE ARMED FORCES EPIDEMIOLOGICA
M. 1. RAPOPORT, S. K. GREISM&N, S. J. YOUNG, W. E. WOARCL.WISSEMAN, JR.,
6,CON4TRACT 00 ONAIS? NO. DA-49-193-MD-2867 96* ORIGINATOWB 019@N0CT HuW~M86018
ajo 169ff )
10. DSTRIUTION STAT,%MNT
Each transmittal of this document outside the Department of Defense must have priorapproval of Commnding General, U. S. Army Medical Research and Development Command,Washington, D. C. 20315
It. 8UPOLCUEPITARY MOT98 TIs PPONSO RINO MILITARY ACTIVITY
U. S. Army Medical Research and DevelopmentCommand, Office of The Surgeon General,
~. ABTRACTDepartment of the Army, Washington, D. C.Pror.s isrprtdiIslce aesofrsachiRedcldfes spcso
biological agents by the U. S. Army Medical Unit and one contractor.
14. KEYWORDS
Venezuela-n equine encephalomyelitisRocky Mountain spotted feverQ feverEpidemic typhusTqlaremiaTyphoid feverAnthrax toxinMosquitoesMetabolismStaphylococce! mnterotoxin BIndotoxin
Vacie
wasi II =NIs47