TEACHER MANUAL - Six FlagsTEACHER MANUAL . Page | ii ©2019 Six Flags Theme Parks authorizes...
90
TEACHER MANUAL
Transcript of TEACHER MANUAL - Six FlagsTEACHER MANUAL . Page | ii ©2019 Six Flags Theme Parks authorizes...
TEACHER MANUAL
Page | ii
©2019 Six Flags Theme Parks authorizes individual teachers who use this book permission
to make enough copies of material in it to satisfy the needs of their own students and classes.
Copying of this book or parts for resale is expressly prohibited. We would appreciate being
noted as the source, “Six Flags Great America, Chicago” in all materials used based on this
publication.
is a registered trademark of Achieve. Neither Achieve nor the lead states and partners that
developed the Next Generation Science Standards was involved in the production of, and does not
endorse, this product.
Six Flags Great America
542 North Route 21
Gurnee, Illinois 60031
(847)249-1952
https://www.sixflags.com/greatamerica Compiled by Nathan A. Unterman
Page | 1
Contents Why Take a Field Trip to an Amusement Park? .............................................................................................................. 1
Learning Goals and Objectives (not NGSS) ..................................................................................................................... 2
Cognitive Goals ........................................................................................................................................................... 2
Attitude Goal .............................................................................................................................................................. 3
Appreciation Goals ..................................................................................................................................................... 3
Curricular Design Considerations Using NGSS .............................................................................................................. 4
Primary Cultural Tenets in Science ............................................................................................................................ 4
Technology Skills ........................................................................................................................................................ 4
Thinking Skills ............................................................................................................................................................. 5
Primary Tenets in Science .......................................................................................................................................... 6
Amusement Park Physics and NGSS Standards ............................................................................................................ 7
RIDE GROUPINGS ........................................................................................................................................................... 8
Amusement Park Ride Design Activities ....................................................................................................................... 9
Amusement Park Ride Design Task (Novice students) .............................................................................................. 9
Amusement Park Ride Design Challenge (Advanced students) ................................................................................ 9
Amusement Park Ride Design Task ......................................................................................................................... 11
Amusement Park Ride Design Challenge ................................................................................................................ 12
Amusement Park Ride Design Challenge (continued) ............................................................................................. 13
Site-Visit Predictions and Measurements of Amusement Park Rides .......................................................................... 14
Teacher Notes ........................................................................................................................................................... 14
Site-Visit Predictions and Measurements of Amusement Park Rides ................................................................... 15
Site-Visit Predictions and Measurements of Amusement Park Rides Pre-Visit…………………………………………………. 16
Exemplar Site-Visit Predictions and Measurements of Amusement Park Rides ................................................... 22
Pre-Trip Class Activities ................................................................................................................................................ 23
Tips to the Teacher ....................................................................................................................................................... 25
How to Use the Historical Question Bank..................................................................................................................... 26
Electronic Data Collection ............................................................................................................................................. 27
Electronic Data Analysis – Vertical Circular Rides ......................................................................................................... 32
Suggestions for Taking Measurements ......................................................................................................................... 37
TIME .......................................................................................................................................................................... 37
DISTANCE .................................................................................................................................................................. 37
UNDERSTANDING A SPRING ACCELEROMETER (FORCE-METER) ............................................................................. 39
ACCELERATION ......................................................................................................................................................... 41
Page | 2
LATERAL ACCELERATION ........................................................................................................................................... 42
CENTRIPETAL ACCELERATION .................................................................................................................................. 42
RADIUS – ROLLER COASTER DIP............................................................................................................................... 42
Ride Information ........................................................................................................................................................ 43
AMUSEMENT PARK PHYSICS RESOURCE LIST ............................................................................................................... 84
ARTICLES FROM PERIODICALS .................................................................................................................................. 84
BOUND MATERIALS .................................................................................................................................................. 85
VIDEOS ...................................................................................................................................................................... 86
SUPPLIERS ................................................................................................................................................................. 86
Page | 1
Why Take a Field Trip to an Amusement Park? If physics teachers could design the ultimate teaching laboratory, what would it be like? The laboratory
would certainly contain devices for illustrating Newton's Laws of motion, energy transfers, momentum
conservation, and the dynamics of rotation. It would consist of large-scale apparatus so the phenomena
could be easily observed and analyzed. Oh, and of course, the dream laboratory would allow the students
an opportunity to not only witness the laws of physics in operation, but also feel them!
Well, this dream laboratory does exist and is as close as Six Flags Great America! At Six Flags Great
America, virtually all the topics included in the study of mechanics can be observed operating on a grand
scale. Furthermore, phenomena, such as weightlessness, which can only be talked about in the classroom,
may be experienced by anyone with sufficient courage.
Students must quantify what they see and feel when doing amusement park physics. Unlike textbook
problems, no data is given. Therefore, students must start from scratch. Heights of rides, periods of rotation,
and lengths of roller coaster trains must be obtained before substituting data into equations learned in the
classroom. Fortunately, only simple equipment is required to obtain data that will allow the calculation of such
diverse quantities as a person's potential energy at the top of the American Eagle . . . the centripetal
acceleration of the Columbia Carousel . . . or the speed of a passenger on Batman? Diagrammatic
representations are more meaningful when you actually feel the forces in a system.
The Next Generation Science Standards (NGSS) has shifted the emphasis of science education from only
pure sciences to pure and applied sciences. This poses new challenges for incorporating appropriate
learning tasks in outdoor education, and specifically, physics of the amusement park. We present both old
and new standards in this manual during this transition period in science education.
Over the years, many schools have become involved with amusement park physics. This past May,
"Physics Days" at Six Flags Great America attracted thousands of physics students from four states. These
students would probably agree that Six Flags Great America provides the ultimate vehicles for learning
physics!
Page | 2
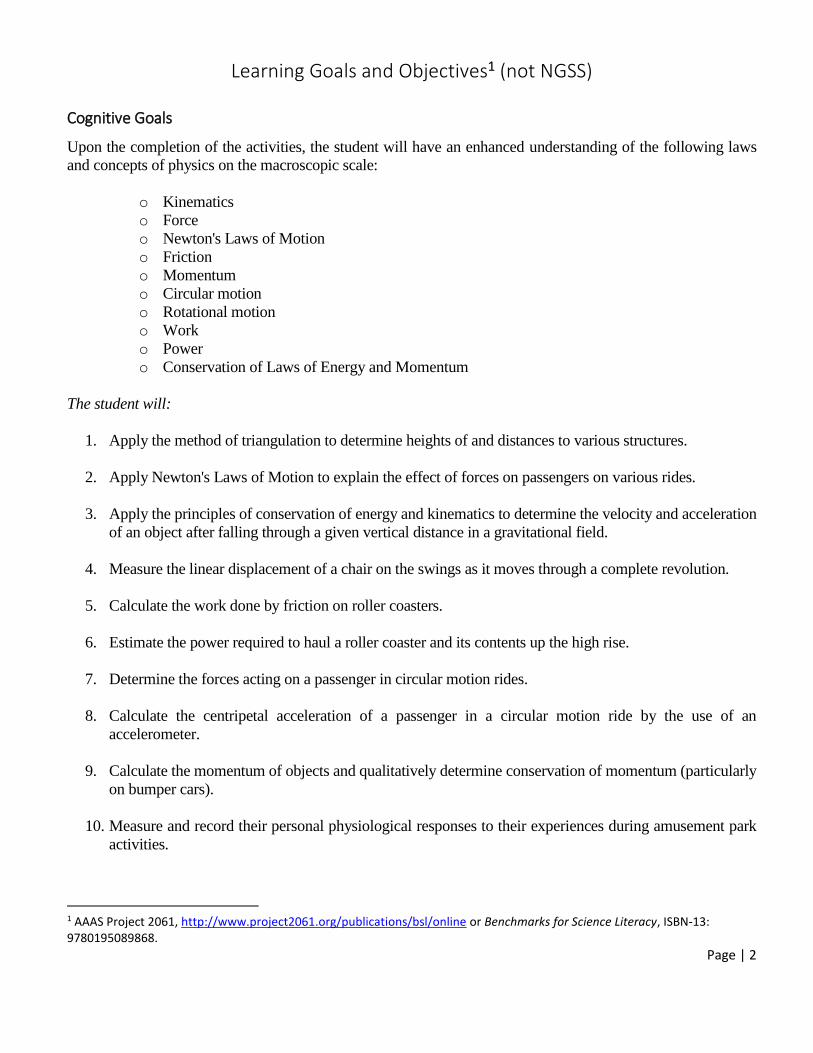
Learning Goals and Objectives1 (not NGSS) Cognitive Goals
Upon the completion of the activities, the student will have an enhanced understanding of the following laws
and concepts of physics on the macroscopic scale:
o Kinematics
o Force
o Newton's Laws of Motion
o Friction
o Momentum
o Circular motion
o Rotational motion
o Work
o Power
o Conservation of Laws of Energy and Momentum
The student will:
1. Apply the method of triangulation to determine heights of and distances to various structures.
2. Apply Newton's Laws of Motion to explain the effect of forces on passengers on various rides.
3. Apply the principles of conservation of energy and kinematics to determine the velocity and acceleration
of an object after falling through a given vertical distance in a gravitational field.
4. Measure the linear displacement of a chair on the swings as it moves through a complete revolution.
5. Calculate the work done by friction on roller coasters.
6. Estimate the power required to haul a roller coaster and its contents up the high rise.
7. Determine the forces acting on a passenger in circular motion rides.
8. Calculate the centripetal acceleration of a passenger in a circular motion ride by the use of an
accelerometer.
9. Calculate the momentum of objects and qualitatively determine conservation of momentum (particularly
on bumper cars).
10. Measure and record their personal physiological responses to their experiences during amusement park
activities.
1 AAAS Project 2061, http://www.project2061.org/publications/bsl/online or Benchmarks for Science Literacy, ISBN-13: 9780195089868.
Page | 3
Attitude Goal
Upon completion of the activities, the student will develop a positive attitude toward the physical sciences and
engineering by being challenged with a meaningful task that allows them to accurately predict personal
experience.
Appreciation Goals
Upon completion of the activities, the student will bridge the gap between school work and life education by
seeing them as not isolated from one another.
The student will gain an appreciation of:
1. The safety devices built into the rides and controls.
2. The applicability of physical principles studied in the classroom to large scale phenomena.
3. The value of working in teams to accomplish measuring and analysis tasks.
4. The physics involved in the design and engineering of the rides.

Page | 4
Curricular Design Considerations2 Using NGSS3
Primary Cultural Tenets in Science
Safety.
Science is practiced by a community that includes collaboration and peer review.
Science is an ever-changing process where questions are answered by interpreting repeated measurements
in a systematic investigation.
The scientific community extends to resources and contacts in the digital realm.
Science is the search for the fundamental properties of nature; engineering is the application of these
properties to structure, processing, and performance.
Research and applications of knowledge have ethical implications.
Technology Skills
Use computational devices such as calculators and computers.
Use spreadsheets to manipulate data and graph relationships.
Use appropriate data acquisition equipment for collection and analysis of measurements.
Use Internet search engines to locate valid course information.
Locate, interact, and participate with course information utilizing various Internet-Based applications.
Use changes in technology for observation and measurement to increase the range and types of questions
that can be investigated.
2 Science Department, Glenbrook North High School, Northfield Township District 225 Schools, Northbrook, IL. 3 http://www.nextgenscience.org/next-generation-science-standards
Page | 5
Thinking Skills4
Critical thinking and skepticism – puzzling away at something and taking account of all possible objections
to find an explanation that works.
Deep understanding – looking for deeper and deeper explanations, not being satisfied with a superficial
description, looking for the most fundamental answer that has predictive power across many domains.
Seeking consistency – testing that answers are consistent with experience and all other areas of the
discipline.
Using experiments to test ideas – refining models through the iterative sequence of:
experiment → model → prediction → test.
Models – developing representations to create models (often mathematical) of systems to make predictions
of their behavior in a variety of circumstances.
Correspondence Principle – If a new model is valid, it must account for the verified results of the old
model in the region where both models apply.
Reason and logic – striving for logical consistency within arguments.
Quantitative understanding – realizing that quantitative analysis is necessary for proper understanding.
Simplification – simplifying physical situations (components or aspects) to their core elements to enable the
use of quantitative models to explain or predict phenomena.
Isolating – isolating physical phenomena to test ideas experimentally.
Approximation and other techniques – making back-of-the-envelope calculations to test the plausibility of
ideas, using techniques that consider limiting or extreme cases.
Excising prejudice – being able to step outside immediate experience and accept explanations.
Correlation does not require causation.
Risk Assessment – to make a decision about a particular risk, we need to take into account both its risks
and benefits, to all constituencies involved.
4 Adapted from: Science Community Representing Education (SCORE), Guidelines for the Content of Key Stage 4 Qualifications, 17.June.2013. Hunt, Andrew, Ideas and Evidence in Science: Lessons from Assessment, SCORE, 2010.
Page | 6
Primary Tenets in Science5
Reductionism – Science describes natural phenomena in terms of a small number of laws, which allow
predictions to be made on whether and how things will happen.
Universality – The laws of science are universal – they work everywhere.
Unification –There is a drive to reduce the number of laws to as small a number as possible, each one
expressed in as economical a way as possible.
Synoptic nature – Physics is an interlinked totality of ideas that must be consistent with each other.
Problems can be approached from many different directions.
Cause and effect – Events can be discussed and understood in terms of causes and effects: what makes
things happen the way they do.
Mathematical techniques – Physical laws can be expressed in a mathematical form. Scientists develop
mathematical representations to describe and predict behavior.
Conservation – Some quantities (charge, mass-energy, matter and momentum) are conserved. These
conservation laws lead to powerful restrictions on behavior.
Equilibrium – Equilibrium occurs when two or more external influences are in balance – balanced forces,
balanced moments, balanced pressures, and equal flows in and out.
Differences cause change – For example, temperature difference, pressure difference, potential difference,
differences in concentration and unbalanced forces.
Inertia – Things will tend to stay as they are unless something causes them to change.
Dissipation – Many processes have an element that is resistive and dissipative. Dissipation is a result of the
tendency of a system to become more disordered.
Irreversibility – Dissipative processes are irreversible. For example, they limit the usefulness and the
lifetime of a resource and determine the arrow of time.
Fields – Action at a distance is explained using the construct of fields.
Energy – There is a useful accounting tool – energy – that allows us to do calculations to find out, for
example, how long sources will last, or whether some events can happen.
Multiple Representations of Models – Scientific models have multiple representations, including graphs,
diagrams, equations, various charts (histograms, pie, etc.), and narrative descriptions.
5 Main, Peter, Thinking Like a Physicist: Design Criteria for a Physics Curriculum, School Science Review, Number 352, pp 46-52, March 2014.
Page | 7
Amusement Park Physics and NGSS6 Standards
The traditional outdoor education activities involved in a trip to the amusement park have centered on
making measurements, reporting results, and making some interpretations. Those activities remain part of
the educational materials provided by Six Flags. As an extension, new pedagogical resources are included
to address the new science education standards. The NGSS has three dimensions: disciplinary core ideas
(content), science and engineering practices, and cross cutting concepts, integrating content with
application. This is more reflective of how science and engineering are currently practiced.
The specific Performance Expectations being addressed are:
HS-PS3-1 Create a computational model to calculate the change in the energy of one component in
a system when the change in energy of the other component(s) and energy flows in and out of the
system are known.
HS-PS3-2 Develop and use models to illustrate that energy at the macroscopic scale can be
accounted for as a combination of energy associated with the motion of particles (objects) and
energy associated with the relative positions of particles.
HS-ETS1-2 Design a solution to a complex real-world problem by breaking it down into smaller,
more manageable problems that can be solved through engineering.
HS-ESTS 1-3 When evaluating solutions, it is important to take into account a range of constraints,
including cost, safety, reliability, and aesthetics, and to consider social, cultural, and environmental
impacts.
Two NGSS aligned activities are presented here. These activities can be scaled up or down to meet the
appropriate capability of your students. For an advanced group, mathematical representations with error
analysis coupled with a design proposal might be required. For a novice group, basic measurement and a
possible solution to the ill structured problem may be more appropriate.
6 Next Generation Science Standards, Volume 1: The Standards – Arranged by Disciplinary Core Ideas and by Topics; The National Academies Press, Washington, D.C., ©2013. ISBN-13: 978030927227-8
Page | 8
RIDE GROUPINGS
NOTE: Only the rides that are data collection friendly are footnoted.
Roller Coasters o Non-inverting7
o Inverting8
o Shuttle9
o Water10
Spinning Rides o Single axis11
o Dual axis12
o Complex multiple axes13
Pendulum Rides o Single axis14
o Dual axis15
Tower Rides o Drop16
o Powered17
Miscellaneous Rides o Bumper cars18
o Chaotic rides19
Games
7 Viper, Whizzer, Raging Bull, American Eagle, Little Dipper, Roaring Rapids, and Dark Knight. 8 Superman, Batman, X Flight, Demon, Maxx Force, and Goliath. 9 Vertical Velocity 10 Logger’s Run 11 Columbia Carousel, Hangover, and Whirligig 12 Hometown Fun Machine, and Condor 13 Fiddler’s Fling, Chubasco, Ricochet, The Lobster, and Triple Play 14 River Rocker 15 Revolution 16 Giant Drop 17 Sky Trek Tower 18 Rue Le Dodge 19 Joker
Page | 9
Amusement Park Ride Design Activities
This activity is an open ended activity. For a more convergent activity, please see Site-Visit Prediction and
Measurement of Amusement Park Rides (below). The general idea of this activity is to select a grouping of
ride (you may need to restrict it to a subset of the grouping) and ask the students to design a ride that would
fit into the given grouping. This new ride may fill a range of forces or accelerations that are not currently
represented at the park. This may be between the current ranges of forces and accelerations, or outside the
existing ride design. For novice students, making measurements, comparisons, and a reasoned proposal for
a new ride is appropriate. For a more advanced class, the proposal should embrace a design comprising
appropriate heights, radii, etc., and a justification for the new ride. A partial exemplar of the problem
statement follows.
Amusement Park Ride Design Task (Novice students)
Six Flags Great America has decided to build a new circular ride near the Buccaneer Battle area of the
park. Determine the placement, kind of ride, age appeal (young, teenage, adult, etc.), theme, capacity, and
other considerations important for this ride. The ride may be a duplicate of another in the park, if there are
long lines at those rides, or it may be a new ride for the park. Compare the forces and accelerations of
existing rides in the same grouping of ride to support the specifications for your proposed ride. Be sure to
show multiple representations of your work. This might include pictures, diagrams, graphs, narrative and
other portrayals of your work.
Amusement Park Ride Design Challenge (Advanced students)
Six Flags Great America has decided to build a new circular ride near the Buccaneer Battle area of the
park. Determine the placement, footprint, cost, type of ride, stress levels, age appeal (young, teenage, adult,
etc.), theme, capacity, energy transfers, and other considerations deemed important for this ride. The ride
may be a duplicate of another in the park if there are long lines at those rides necessitating a duplicate
attraction, or it may be a new ride for the park. A needs assessment, an engineering overview of the
proposed ride, and engineering comparisons of existing rides must be included in your final proposal. Be
sure to include pictorial, graphical, mathematical, diagrammatic, and narrative depictions for your
measurements, calculations, etc. of existing rides to support your final proposal.
Page | 10
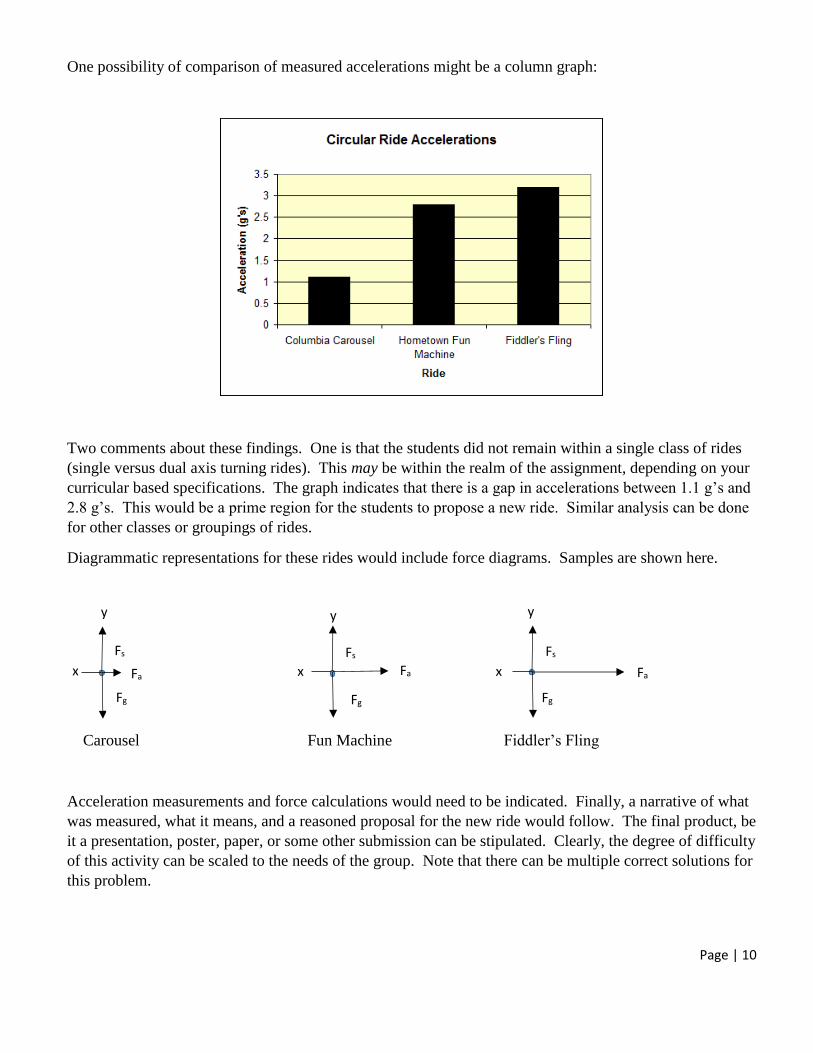
One possibility of comparison of measured accelerations might be a column graph:
Two comments about these findings. One is that the students did not remain within a single class of rides
(single versus dual axis turning rides). This may be within the realm of the assignment, depending on your
curricular based specifications. The graph indicates that there is a gap in accelerations between 1.1 g’s and
2.8 g’s. This would be a prime region for the students to propose a new ride. Similar analysis can be done
for other classes or groupings of rides.
Diagrammatic representations for these rides would include force diagrams. Samples are shown here.
Carousel Fun Machine Fiddler’s Fling
Acceleration measurements and force calculations would need to be indicated. Finally, a narrative of what
was measured, what it means, and a reasoned proposal for the new ride would follow. The final product, be
it a presentation, poster, paper, or some other submission can be stipulated. Clearly, the degree of difficulty
of this activity can be scaled to the needs of the group. Note that there can be multiple correct solutions for
this problem.
Fg
Fs
Fa
y
x
Fg
Fs
Fa
y
x
y
Fg
Fs
Fa x
Page | 11
Amusement Park Ride Design Task
Decide, with your teacher, what grouping of ride is to be chosen for this assignment. Your teacher may
have different requirements of what you need to turn in. It is very important that you have a plan for data
collection well in advance of your trip. Considerations are the timing of rides, seating capacity, velocities,
accelerations, forces, physical size, etc.
Six Flags Great America has decided to build a new __________ ride near the Buccaneer Battle area of the
park. Determine the placement, kind of ride, age appeal (young, teenage, adult, etc.), theme, capacity, and
other considerations important for this ride. The ride may be a duplicate of another in the park, if there are
long lines at those rides, or it may be a new ride for the park. Compare the forces and accelerations of
existing rides in the same grouping of ride to support the specifications for your proposed ride. Be sure to
show multiple representations of your work. This might include pictures, diagrams, graphs, narrative and
other portrayals of your work.
State your predictions, hypotheses, and testable crazy ideas for this design task.
Pre-trip data tables to be filled in at the park:
Equations or other information that might be needed:
Needed equipment (stop watches, string, calculators, etc.):
Specific responsibilities for each member:
Criteria for new ride:
Final report requirements (this may include data, calculations, pictures, diagrams, graphs, design
sketch, discussion of predictions and hypotheses, . . . ):
Page | 12
Amusement Park Ride Design Challenge
Decide, with your teacher, what grouping of ride is to be chosen for this assignment. Your teacher may
have different requirements of what you need to turn in. It is very important that you have a plan for data
collection well in advance of your trip. Considerations are the timing of rides, seating capacity, velocities,
accelerations, forces, energy and energy transfers, momentum, motor size, physical size, etc.
Six Flags Great America has decided to build a new _________ ride near the Buccaneer Battle area of the
park. Determine the placement, footprint, cost, kind of ride, stress levels, age appeal (young, teenage, adult,
etc.), theme, capacity, energy transfers, and other considerations deemed important for this ride. The ride
may be a duplicate of another in the park if there are long lines at those rides necessitating a duplicate
attraction, or it may be a new ride for the park. A needs assessment, an engineering overview of the
proposed ride, and engineering comparisons of existing rides must be included in your final proposal. Be
sure to include pictorial, graphical, mathematical, diagrammatic, and narrative depictions for your
measurements, calculations, etc. of existing rides to support your final proposal.
Page | 13
Amusement Park Ride Design Challenge (continued)
State your predictions, hypotheses, and testable crazy ideas for this design task.
Ride design resources (URL’s, print material, periodicals, etc.):
Pre-trip data tables and proposed measurements to be filled in at the park:
Equations or other information that might be desired:
Needed equipment (stop watches, string, calculators, accelerometers, etc.):
Specific responsibilities for each member:
Criteria for new ride:
Final report elements (this may include abstract, purpose, data, calculations, pictures, diagrams,
graphs, design sketch(es) and specifications of proposed ride, discussion of predictions and
hypotheses, error analysis, . . . ):
Page | 14
Site-Visit Predictions and Measurements of Amusement Park Rides
Teacher Notes
This activity is more convergent than the Amusement Park Ride Design activities. In this activity, students
are asked to make hypotheses and predictions of different aspects of the science and engineering of a
selected ride. A variety of ride groupings can be selected or assigned across the class. Categories include,
but are not limited to height, radius, velocity, acceleration, force, energy, momentum, and engineering
(capacity and queue length). Hypotheses and predictions are made pre-trip, measurements are made during
the trip, and analysis to support or refute the hypotheses and predictions are made post-trip. The final
product might be a class presentation, paper, or poster. Typically, three to five categories would be
selected. There can be interactions among the categories, such as velocity and momentum, or acceleration
and net force.
The degree of difficulty can be tailored to the ability level of the students. Simple predictions comparing
the heights of the first and second hills of two roller coasters can be made. (Lift hill heights are usually
available on the Internet, but the second and later hill heights are rarely found.) A more robust set of
predictions might be predicting the energy losses of a roller coaster due to friction at the bottom of the
initial drop, the top of the second hill, and at the second valley. Students express anxiety about their
predictions being correct. Stress that they are making an educated guess. The analysis from their data will
support or refute the guess. Stress that scientists and engineers do not know the outcomes of their
experiments in advance.
The pre-trip activity requires the students to structure their trip experience. Not only do they need to make
one or two hypotheses/predictions per grouping, but also plan the method of measurement, equipment
needs, specific equations, data tables, and number of trials. You may require two different ways of making
the measurements: electronic accelerometers and hand-held mechanical accelerometers. This document
should be evaluated and returned to the students before the trip. Major omissions, inconsistencies,
misconceptions, and other issues can be caught before the trip to make the excursion to the park more
meaningful and productive.
The required student product might include a computer presentation of their findings, a paper submission, a
poster, a video presentation, or some combination of these. The elements of the final product should be
determined at the beginning of the unit.
Page | 15
Site-Visit Predictions and Measurements of Amusement Park Rides
Please complete the Pre-Lab assignment according the directions below. This must be
turned in for approval before you go to the amusement park, and attached to your final
laboratory report.
1. Complete the cover sheet information. Your teacher may assign categories and give other
requirements.
2. Select a category and make one well-reasoned prediction. The prediction should be numeric and
something that will be measured or calculated from measurements made at the park. Predicting that
the roller coaster is going the fastest at the bottom of the first hill or that the outer horse on the
merry-go-round will be the fastest, are not a good predictions. A good prediction might be that the
roller coaster will be going 20 m/s at the bottom of the first hill and 18 m/s at the bottom of the
second hill will be more acceptable. Please note that these are predictions. Your predictions do not
need to match the final measured values.
3. How will you collect data? Will you use mechanical or electronic equipment (or both)? Will you
need a timing device? How will lengths or radii be measured? Is a protractor needed? Please be
specific.
4. List the equations necessary for addressing your predictions. Identify all variables. Determine
which variables need to be directly measured and which will be calculated based on your
measurements. These measurements must be quantities that are measured at the park. Simply
listing concepts is not acceptable.
5. Create data tables for the measured and calculated quantities needed in your investigation. Be sure
to leave space for multiple trials. If you are relying on electronic data acquisition, indicate which
graphs you will need for your data analysis. Leave room for sketches and diagrams.
6. Refer to the grading rubric to make sure you have met all requirements.
7. Repeat for each category.
Page | 16
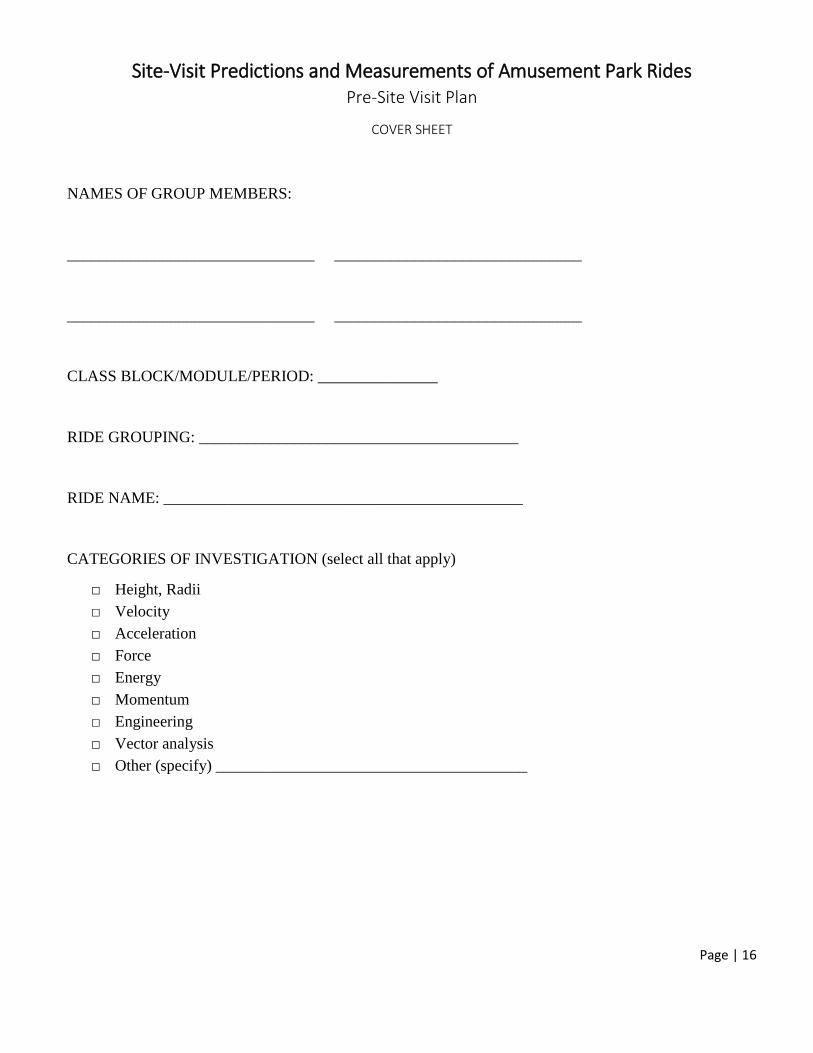
Site-Visit Predictions and Measurements of Amusement Park Rides Pre-Site Visit Plan
COVER SHEET
NAMES OF GROUP MEMBERS:
_______________________________ _______________________________
_______________________________ _______________________________
CLASS BLOCK/MODULE/PERIOD: _______________
RIDE GROUPING: ________________________________________
RIDE NAME: _____________________________________________
CATEGORIES OF INVESTIGATION (select all that apply)
□ Height, Radii
□ Velocity
□ Acceleration
□ Force
□ Energy
□ Momentum
□ Engineering
□ Vector analysis
□ Other (specify) _______________________________________
Page | 17
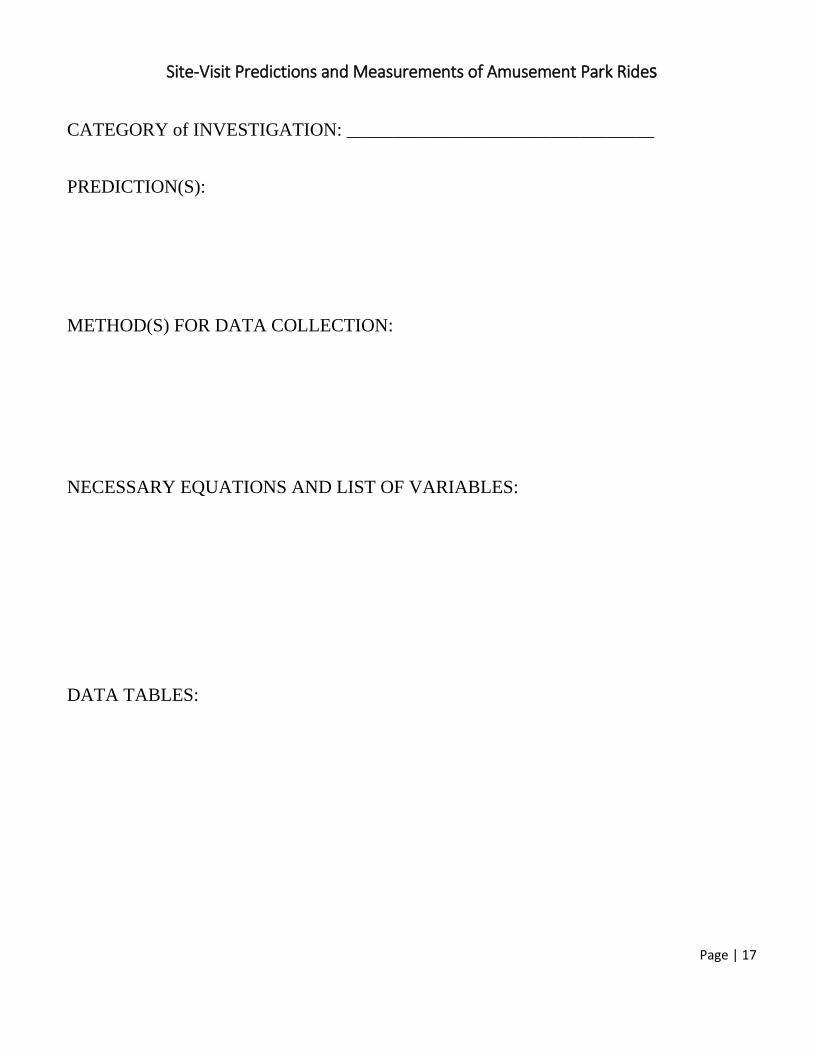
Site-Visit Predictions and Measurements of Amusement Park Rides
CATEGORY of INVESTIGATION: _________________________________
PREDICTION(S):
METHOD(S) FOR DATA COLLECTION:
NECESSARY EQUATIONS AND LIST OF VARIABLES:
DATA TABLES:
Page | 18
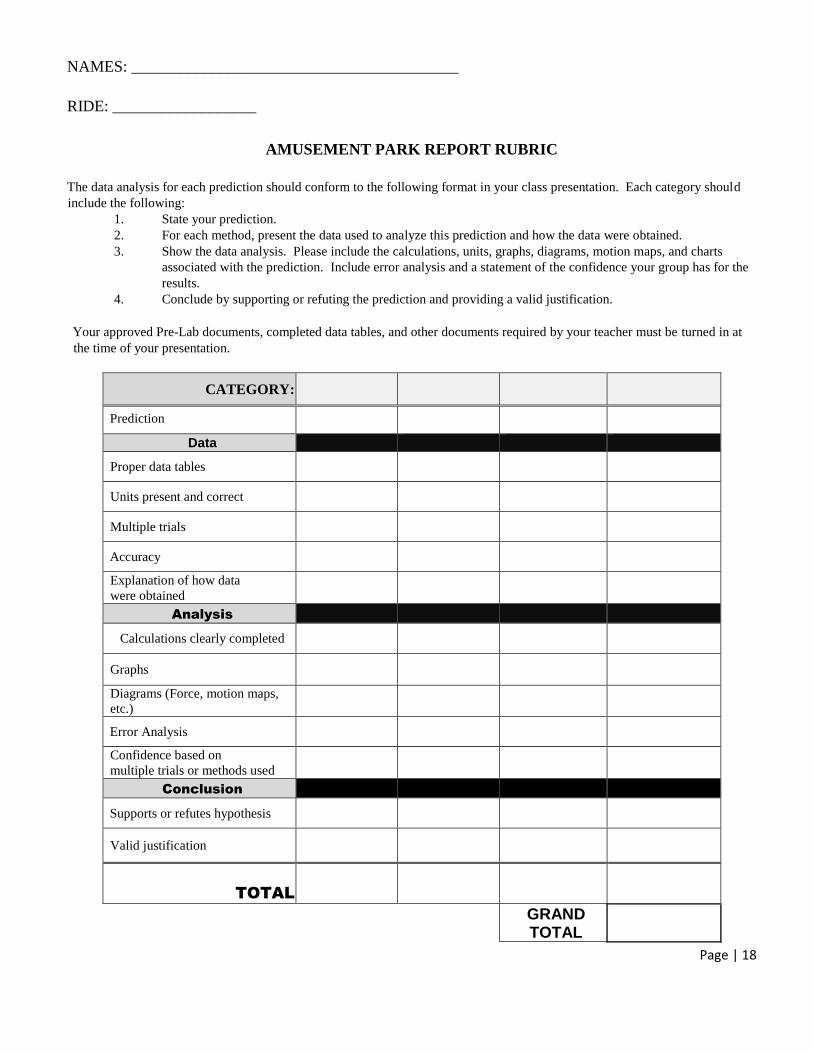
NAMES: _________________________________________
RIDE: __________________
AMUSEMENT PARK REPORT RUBRIC
The data analysis for each prediction should conform to the following format in your class presentation. Each category should
include the following:
1. State your prediction.
2. For each method, present the data used to analyze this prediction and how the data were obtained.
3. Show the data analysis. Please include the calculations, units, graphs, diagrams, motion maps, and charts
associated with the prediction. Include error analysis and a statement of the confidence your group has for the
results.
4. Conclude by supporting or refuting the prediction and providing a valid justification.
Your approved Pre-Lab documents, completed data tables, and other documents required by your teacher must be turned in at
the time of your presentation.
CATEGORY:
Prediction
Data
Proper data tables
Units present and correct
Multiple trials
Accuracy
Explanation of how data
were obtained
Analysis
Calculations clearly completed
Graphs
Diagrams (Force, motion maps,
etc.)
Error Analysis
Confidence based on
multiple trials or methods used
Conclusion
Supports or refutes hypothesis
Valid justification
TOTAL
GRAND TOTAL
Page | 19
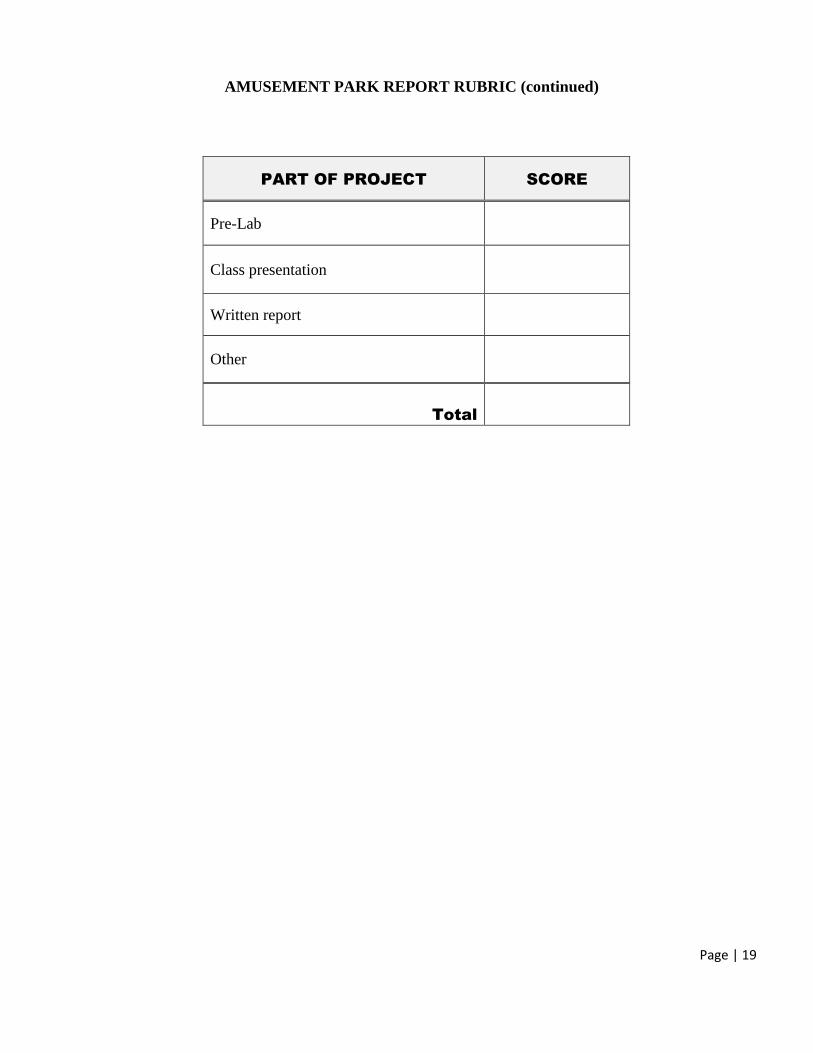
AMUSEMENT PARK REPORT RUBRIC (continued)
PART OF PROJECT SCORE
Pre-Lab
Class presentation
Written report
Other
Total
Page | 20
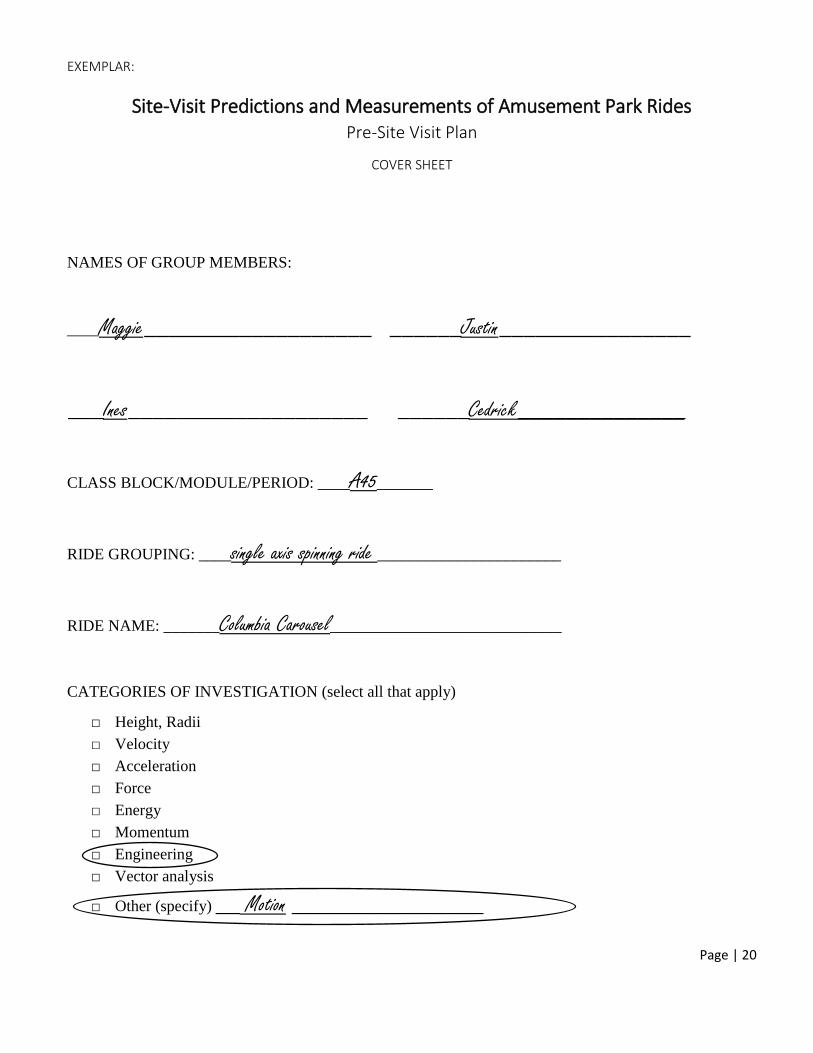
EXEMPLAR:
Site-Visit Predictions and Measurements of Amusement Park Rides Pre-Site Visit Plan
COVER SHEET
NAMES OF GROUP MEMBERS:
____Maggie___________________ ______Justin________________
___Ines____________________ ______Cedrick______________
CLASS BLOCK/MODULE/PERIOD: ____A45_______
RIDE GROUPING: ____single axis spinning ride _______________________
RIDE NAME: _______Columbia Carousel_____________________________
CATEGORIES OF INVESTIGATION (select all that apply)
□ Height, Radii
□ Velocity
□ Acceleration
□ Force
□ Energy
□ Momentum
□ Engineering
□ Vector analysis
□ Other (specify) __ Motion ________________
Page | 21
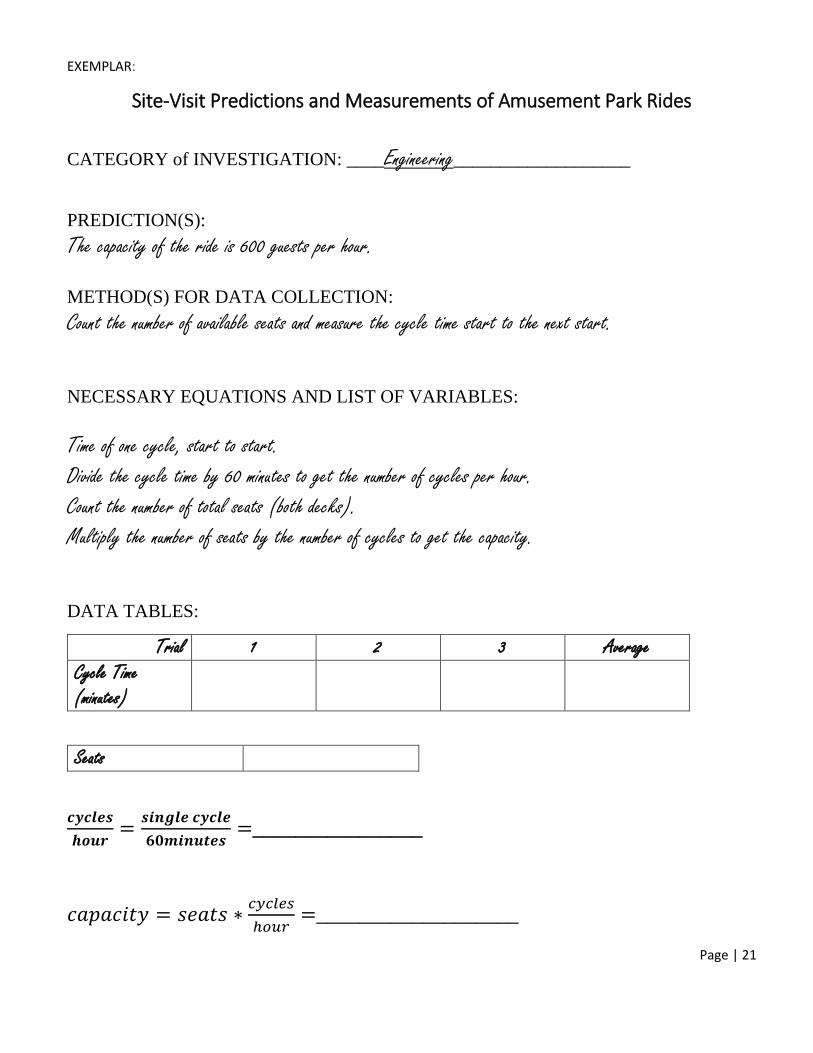
EXEMPLAR:
Site-Visit Predictions and Measurements of Amusement Park Rides
CATEGORY of INVESTIGATION: ____Engineering___________________
PREDICTION(S):
The capacity of the ride is 600 guests per hour.
METHOD(S) FOR DATA COLLECTION:
Count the number of available seats and measure the cycle time start to the next start.
NECESSARY EQUATIONS AND LIST OF VARIABLES:
Time of one cycle, start to start.
Divide the cycle time by 60 minutes to get the number of cycles per hour.
Count the number of total seats (both decks).
Multiply the number of seats by the number of cycles to get the capacity.
DATA TABLES:
Trial 1 2 3 Average Cycle Time (minutes)
Seats
𝒄𝒚𝒄𝒍𝒆𝒔
𝒉𝒐𝒖𝒓=
𝒔𝒊𝒏𝒈𝒍𝒆 𝒄𝒚𝒄𝒍𝒆
𝟔𝟎𝒎𝒊𝒏𝒖𝒕𝒆𝒔=________________
𝑐𝑎𝑝𝑎𝑐𝑖𝑡𝑦 = 𝑠𝑒𝑎𝑡𝑠 ∗𝑐𝑦𝑐𝑙𝑒𝑠
ℎ𝑜𝑢𝑟=___________________
Page | 22
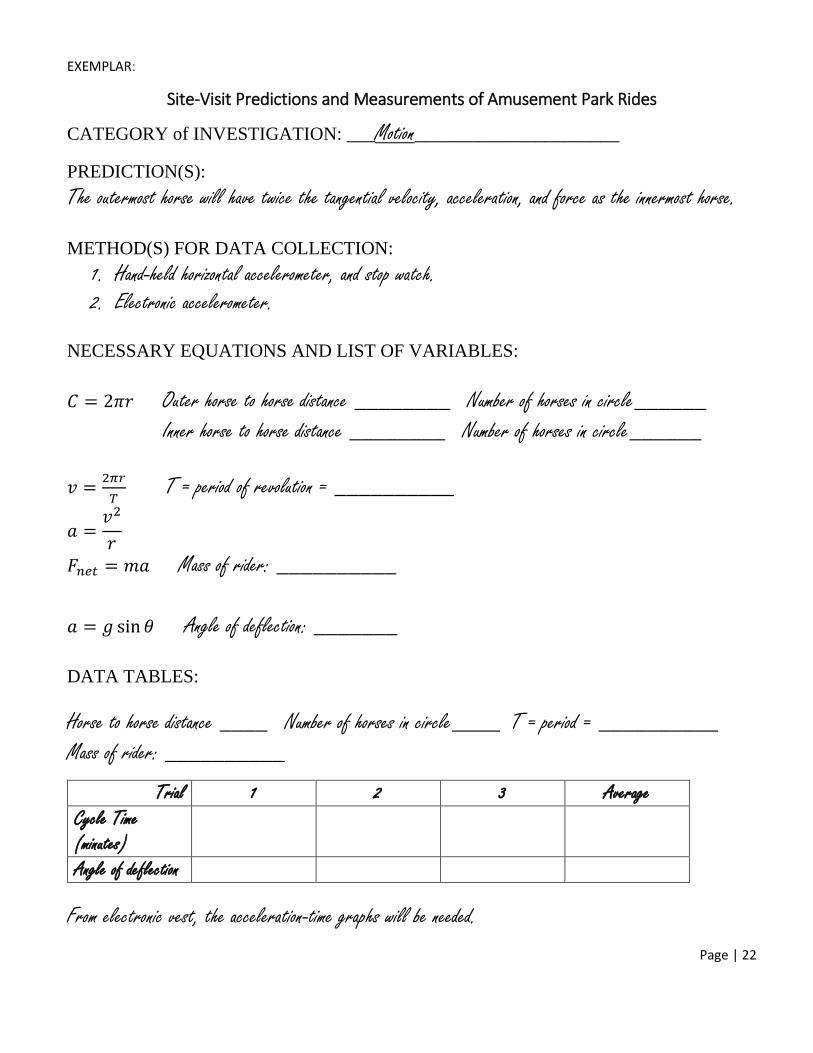
EXEMPLAR:
Site-Visit Predictions and Measurements of Amusement Park Rides
CATEGORY of INVESTIGATION: ___Motion______________________
PREDICTION(S):
The outermost horse will have twice the tangential velocity, acceleration, and force as the innermost horse.
METHOD(S) FOR DATA COLLECTION:
1. Hand-held horizontal accelerometer, and stop watch. 2. Electronic accelerometer.
NECESSARY EQUATIONS AND LIST OF VARIABLES:
𝐶 = 2𝜋𝑟 Outer horse to horse distance ________ Number of horses in circle______
Inner horse to horse distance ________ Number of horses in circle______
𝑣 =2𝜋𝑟
𝑇 T = period of revolution = __________
𝑎 =𝑣2
𝑟
𝐹𝑛𝑒𝑡 = 𝑚𝑎 Mass of rider: __________
𝑎 = 𝑔 sin 𝜃 Angle of deflection: _______
DATA TABLES:
Horse to horse distance ____ Number of horses in circle____ T = period = __________
Mass of rider: __________
Trial 1 2 3 Average Cycle Time (minutes)
Angle of deflection
From electronic vest, the acceleration-time graphs will be needed.
Page | 23
Pre-Trip Class Activities
1. Review kinematics and dynamics. It is helpful to present the students with whiteboard problems for
preview in class. You can provide students with typical data and graphs for them to perform calculations, draw diagrams, and the like.
2. To demonstrate a ride, set up a model of a rotating swing ride or a Hot WheelsTM track with a vertical
loop. Students can take measurements of the angle of the swing chains as a function of the speed of
rotation, or of the mass of the passengers. They can practice measuring the time needed for a car to pass through a point on the track by taping two cars together to make a measurable train. Ask from
what minimum height the car must fall in order to stay on the track of the vertical loop. This
experiment is good for both demonstration and laboratory purposes. It leads naturally to the role of friction in transferring energy that would otherwise be available for speed. Students are prepared for
the fact that their calculation, using ideal conditions, will differ from the actual velocities that they will measure in the park.
3. Construct accelerometers. If you will be constructing mechanical accelerometers, cut the plastic tubing ahead of time, both horizontal and vertical devices in the PASCO scientific kit can be constructed easily
in a single class period. Calibrating the horizontal device takes some explanation and is a good
homework assignment. Accelerometer kits come in class sets of 15 (15 vertical and 15 horizontal devices).
Order using catalog number ME-9426, from:
PASCO Scientific, 10101 Foothills Blvd.
Roseville, CA 95678
Phone: 1-800-772-8700
E-mail: [email protected]
Website: http://www.pasco.com/
4. Select a triangulation activity, such as finding the height of a nearby tall object, as a laboratory
exercise. The flagpole in front of the school is a favorite object for measuring heights. Remember that the equations assume that the pole is perpendicular to the baseline. If your pole is on a mound, the activity will not give accurate results. This affords an excellent opportunity to discuss error analysis.
5. Practice measuring by pacing. Triangulating a horizontal distance can lead into a discussion of how we know the distances to stars and across unabridged rivers.
6. If you will be using data acquisition hardware and software, create activities for the students to have familiarity with the equipment and to practice understanding the output.
Page | 24
7. Show a videotape, website, or slides of actual rides to give students some concept of the size and
speed of certain rides. Slides can be used to practice estimating heights and angles of elevation of devices such as roller coasters.
8. Emphasize that students are not required to ride the rides. Only the accelerometer readings are taken on the rides. All other measurements are taken by an observer on the ground.
9. Post a map of the park if you can. Encourage students to ride the most popular attractions before the park becomes crowded. Locate the First Aid station and discuss how students can reach you if necessary. Establish a location in the park where you might establish a rendezvous place and time.
10. Create laboratory groups and activities for the park. Students should stay in groups for educational
and safety reasons. Announce requirements and options, when the work is due, and how it will be
graded. Make sure students know that line cutting is grounds for expulsion from the park by Six Flags Great America Security. Students who cut lines and are made to leave the park must wait outside park gates for the rest of the school to leave for the day.
11. Six Flags uses an electronic detection system at the front gate. Purses, knapsacks, bags, etc. are subject to search. Glass containers are prohibited. All school and municipal rules apply to the visit,
including consumption of controlled substances. Proper attire (shirts, no bikini tops, shoes, etc.) are to be worn at all times.
12. Electronic data collection instruments helpful but not necessary. Two suppliers that have been long time
supporters for Physics Day are:
Pasco Scientific http://www.pasco.com
Vernier Software and Technology http://www.vernier.com
13. There are several different phone apps that may help in data collection and analysis. One suggested app
is Physics Toolbox by Vieyra Software.

Page | 25
Tips to the Teacher
1. Equipment needed in the park:
Timing device, at least one per group. Stop watch, phone, etc. will work.
Accelerometers; mechanical, electronic, or both.
Measuring string and knowledge of their pace.
Calculator, writing device, and paper.
Ziploc™ bag for student documents and equipment.
Dry clothes as necessary.
2. Distribute tickets as they exit the bus. This speeds entry into the park.
3. Remind students to double-check the restraints on each ride. Be sure that they understand that
safety is a serious matter.
4. When ordering tickets, check with the park sales office for meal deals. There is an all-you can-eat catered meal option that provides everyone with lunch, affordably. Be sure that students are aware that no outside food is allowed in the park, unless there is some medical or religious reason.
5. Announce the lateness penalty for either boarding the bus at school or leaving the park.
6. If the student work is due as the bus arrives back at school, you will get it on time but the product will be more ragged than if is due the next day.
7. Be sure that your students know how to identify your bus. Put a large sign in the front window or some other insignia.
8. Be sure you have sufficient adult chaperones on each bus in case you need someone to stay with an ill student.
9. Be sure to explain to students that timing devices should be used for timing rides while watching and not riding the ride.
10. Permission slips must indicate any special medical needs to allergies such as bee stings and a way of
contacting parents.
11. Instruct students to wear secure shoes or sneakers and bring appropriate clothing and sun block. This can
mean a windbreaker for a chancy day or a change of clothing if they intend to go on water rides.
Page | 26
How to Use the Historical Question Bank
This question bank has been designed to include questions that are frequently found in pre-NGSS
Amusement Park Physics packets. We have designed the packet this way to give ideas of ranges and kinds of
questions that would support appropriate learning. If you choose a more traditional activity, only one or two
rides should be assigned per group. This affords them the time for multiple trials and to delve deeply into the
science and engineering of the thrill inducing machine.
We encourage students to keep a journal or laboratory report. Possibly this report might contain a written
description of the procedure used to collect the necessary data and then sample calculations showing
pertinent equations with the correct units. Pictures, diagrams, and graphs (where appropriate) help tell a
more complete story.
When calculating forces, momenta, energy, and other quantities requiring mass, we recommend students
estimate the mass of a typical rider to be between 60 - 70 kg. This will produce more meaningful numbers
for the introductory level student who will relate it to their sensations, than trying to relate it to the loads the
roller coaster sustains.
Page | 27
Electronic Data Collection
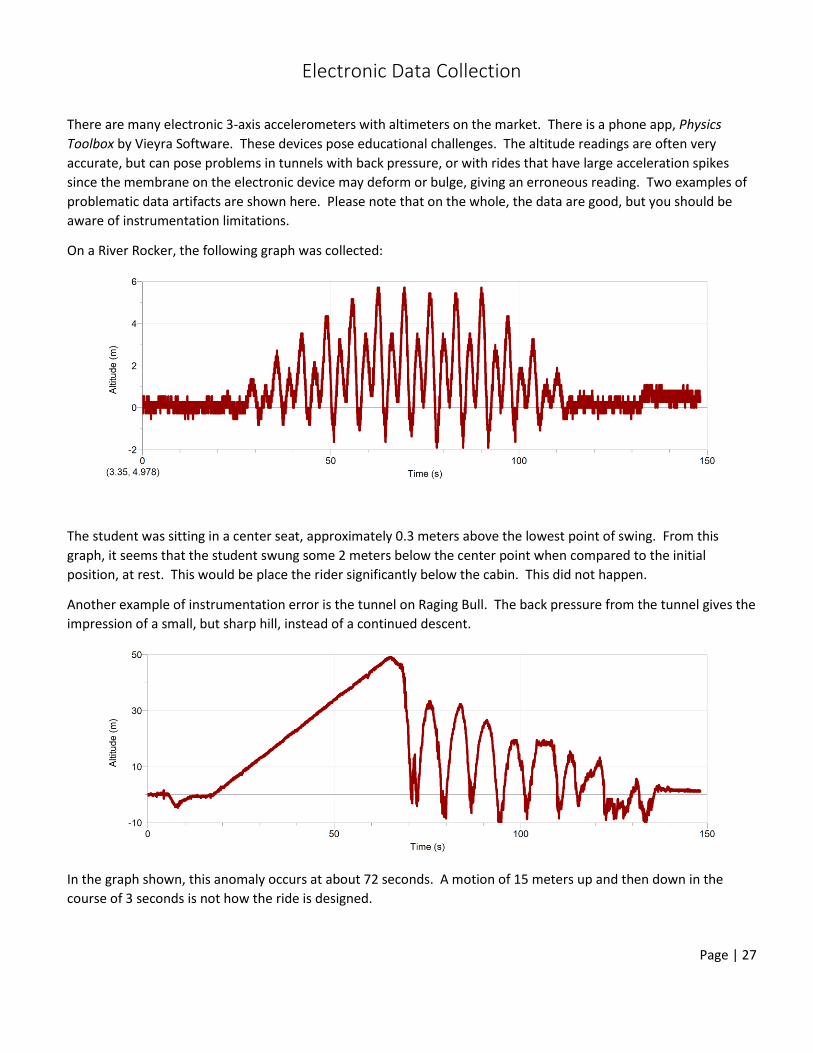
There are many electronic 3-axis accelerometers with altimeters on the market. There is a phone app, Physics
Toolbox by Vieyra Software. These devices pose educational challenges. The altitude readings are often very
accurate, but can pose problems in tunnels with back pressure, or with rides that have large acceleration spikes
since the membrane on the electronic device may deform or bulge, giving an erroneous reading. Two examples of
problematic data artifacts are shown here. Please note that on the whole, the data are good, but you should be
aware of instrumentation limitations.
On a River Rocker, the following graph was collected:
The student was sitting in a center seat, approximately 0.3 meters above the lowest point of swing. From this
graph, it seems that the student swung some 2 meters below the center point when compared to the initial
position, at rest. This would be place the rider significantly below the cabin. This did not happen.
Another example of instrumentation error is the tunnel on Raging Bull. The back pressure from the tunnel gives the
impression of a small, but sharp hill, instead of a continued descent.
In the graph shown, this anomaly occurs at about 72 seconds. A motion of 15 meters up and then down in the
course of 3 seconds is not how the ride is designed.
Page | 28
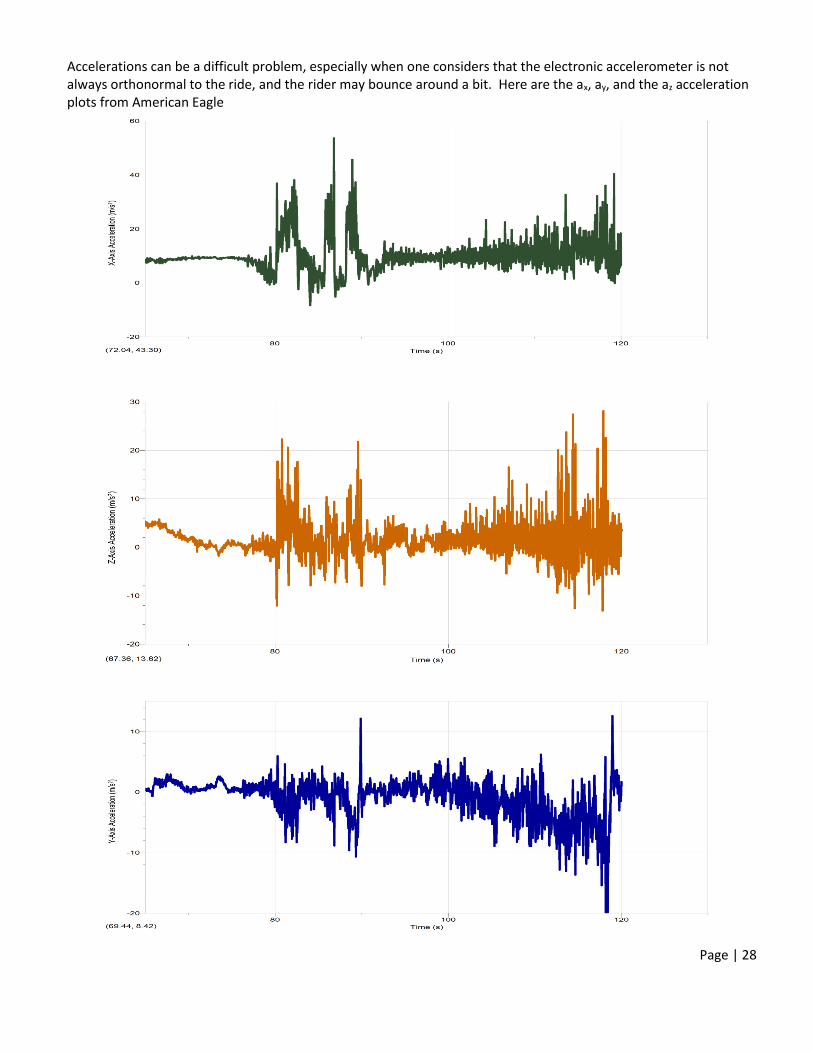
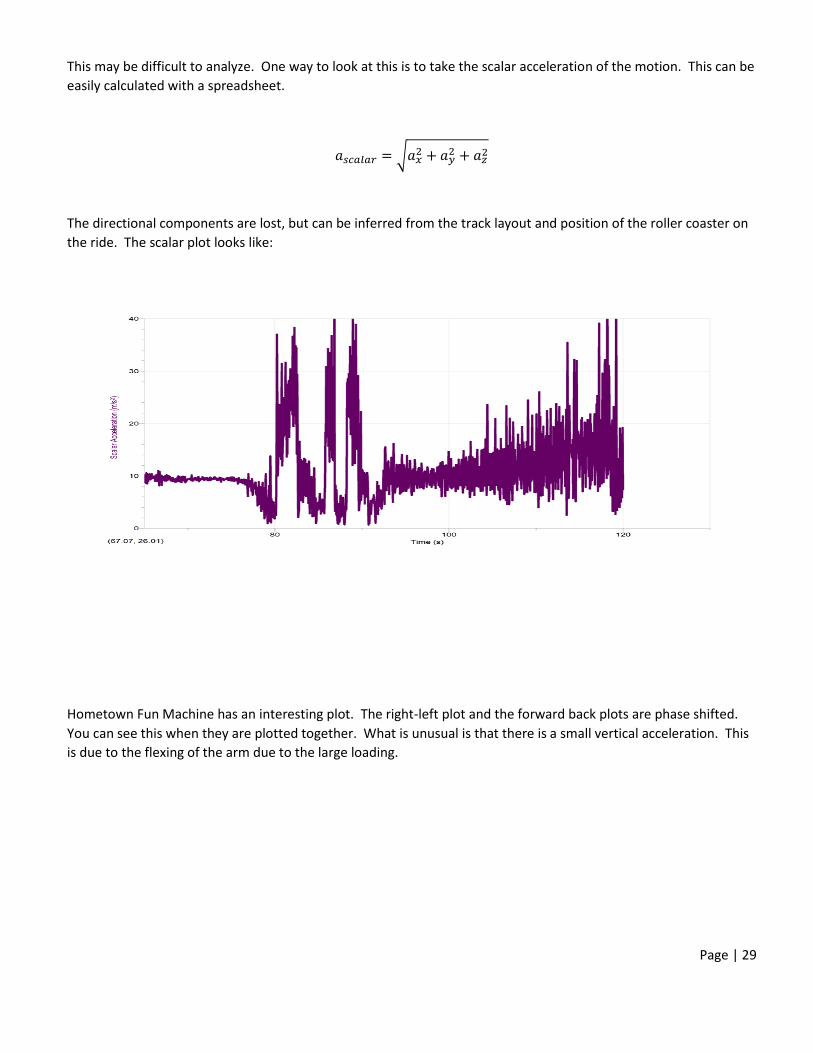
Accelerations can be a difficult problem, especially when one considers that the electronic accelerometer is not always orthonormal to the ride, and the rider may bounce around a bit. Here are the ax, ay, and the az acceleration plots from American Eagle
Page | 29
This may be difficult to analyze. One way to look at this is to take the scalar acceleration of the motion. This can be
easily calculated with a spreadsheet.
𝑎𝑠𝑐𝑎𝑙𝑎𝑟 = √𝑎𝑥2 + 𝑎𝑦
2 + 𝑎𝑧2
The directional components are lost, but can be inferred from the track layout and position of the roller coaster on
the ride. The scalar plot looks like:
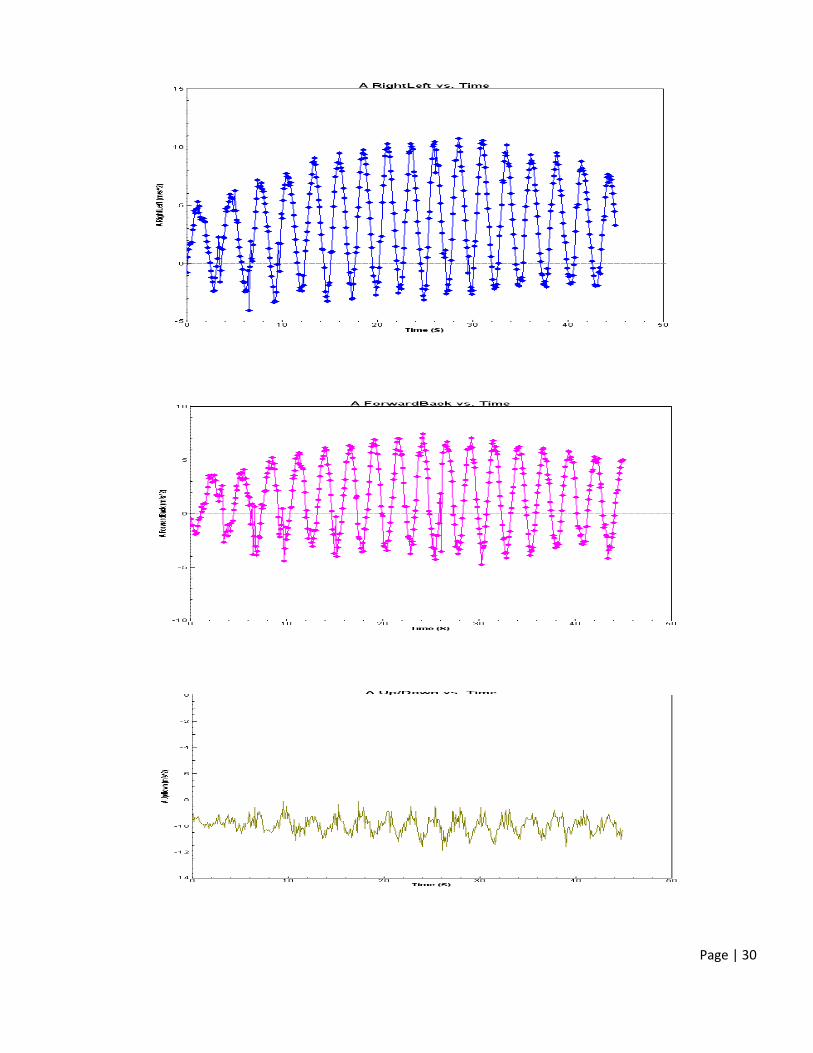
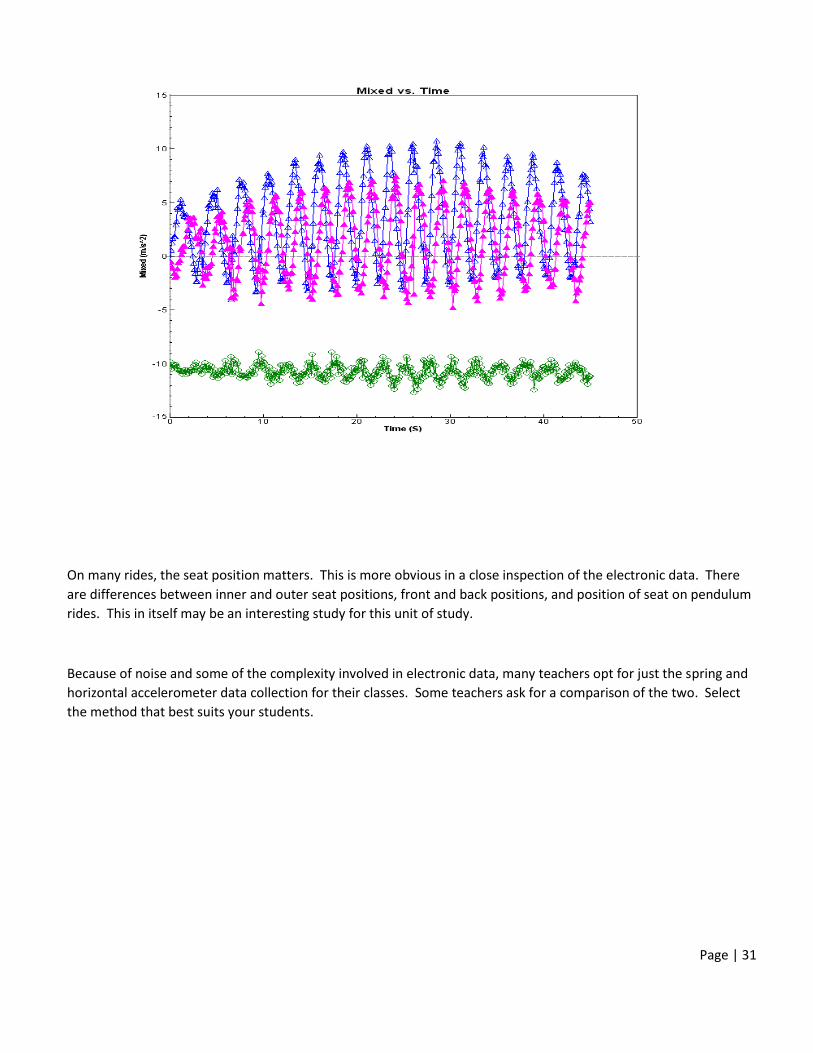
Hometown Fun Machine has an interesting plot. The right-left plot and the forward back plots are phase shifted.
You can see this when they are plotted together. What is unusual is that there is a small vertical acceleration. This
is due to the flexing of the arm due to the large loading.
Page | 30
Page | 31
On many rides, the seat position matters. This is more obvious in a close inspection of the electronic data. There
are differences between inner and outer seat positions, front and back positions, and position of seat on pendulum
rides. This in itself may be an interesting study for this unit of study.
Because of noise and some of the complexity involved in electronic data, many teachers opt for just the spring and
horizontal accelerometer data collection for their classes. Some teachers ask for a comparison of the two. Select
the method that best suits your students.
Page | 32
Electronic Data Analysis – Vertical Circular Rides
Many students and teachers have some confusion about using the electronic data for vertical loop
analysis. This usually arises from the motion of the ride not being uniform, and not understanding the
frame of reference of the rider. There are a number of non-uniform motion tutorials found online. We
recommend a review of such material. What is presented here is in part repeated in the student manual.
We will use the ride Mardi Gras Hangover as the example.
Mardi Gras Hangover can be programmed for different experiences. Commonly, the experience is similar
to this presentation, but may differ. A sample word description of the motion: For the center of mass
(middle car), starting at the bottom of the ride, the passenger goes clockwise (CW) to 8 o’clock,
counterclockwise (CCW) to 3 o’clock, CW twice over the top and then dwells at the top, CCW three times
over the top stopping at 3 o’clock, CW to 7 o’clock, and then back to the starting position.
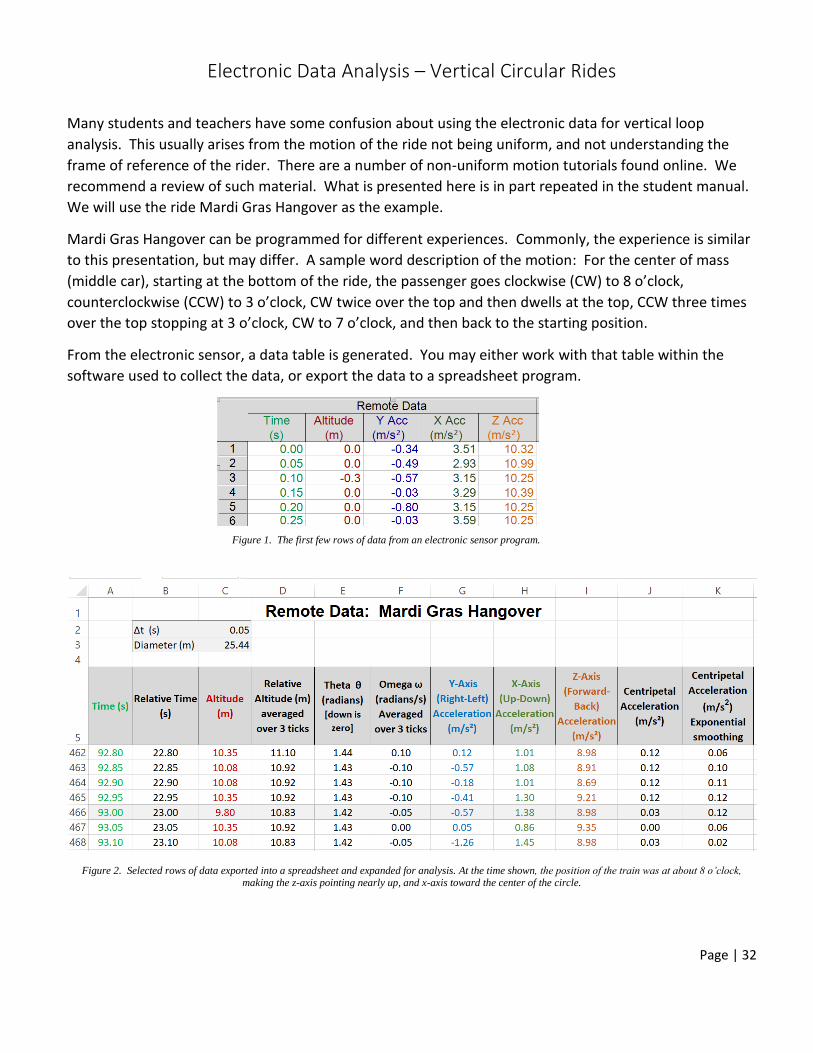
From the electronic sensor, a data table is generated. You may either work with that table within the
software used to collect the data, or export the data to a spreadsheet program.
Figure 2. Selected rows of data exported into a spreadsheet and expanded for analysis. At the time shown, the position of the train was at about 8 o’clock, making the z-axis pointing nearly up, and x-axis toward the center of the circle.
Figure 1. The first few rows of data from an electronic sensor program.
Page | 33
The original sensor data is found in columns A, C, G, H, and I. Cell C2 has the time interval, and Cell C3 has the diameter of the ride. Zero degrees is down. The highlighted data are from the first forward movement, leaving 8 o’clock returning downward.
Column B: Relative time is the elapsed time from starting the ride motion minus the elapsed time from starting the accelerometer.
Column D: We added a scaling factor (in this case, 0.75 m) so that the lowest point is closest, and then did 3-point averaging. D466 = ((C466+C465+C464)/3) + 0.75
Column E: Angle Theta (θ) is calculated in radians by:
𝜃 = 𝑐𝑜𝑠−1(1 − (ℎ𝑟⁄ )) = E466 = IF (D466<0,0,ACOS(1-(D466/($C$3/2))))
Column F: Omega (ω), radians per second, 3-point averaged:
𝜔 = 𝜃𝑡⁄ = F466 = ((E466+E465+E464)-(E465+E464+E463))/(3*$C$2)
Column J: Centripetal acceleration: acentripetal = ω2r = J466 = (F466^2)*($C$3*0.5)
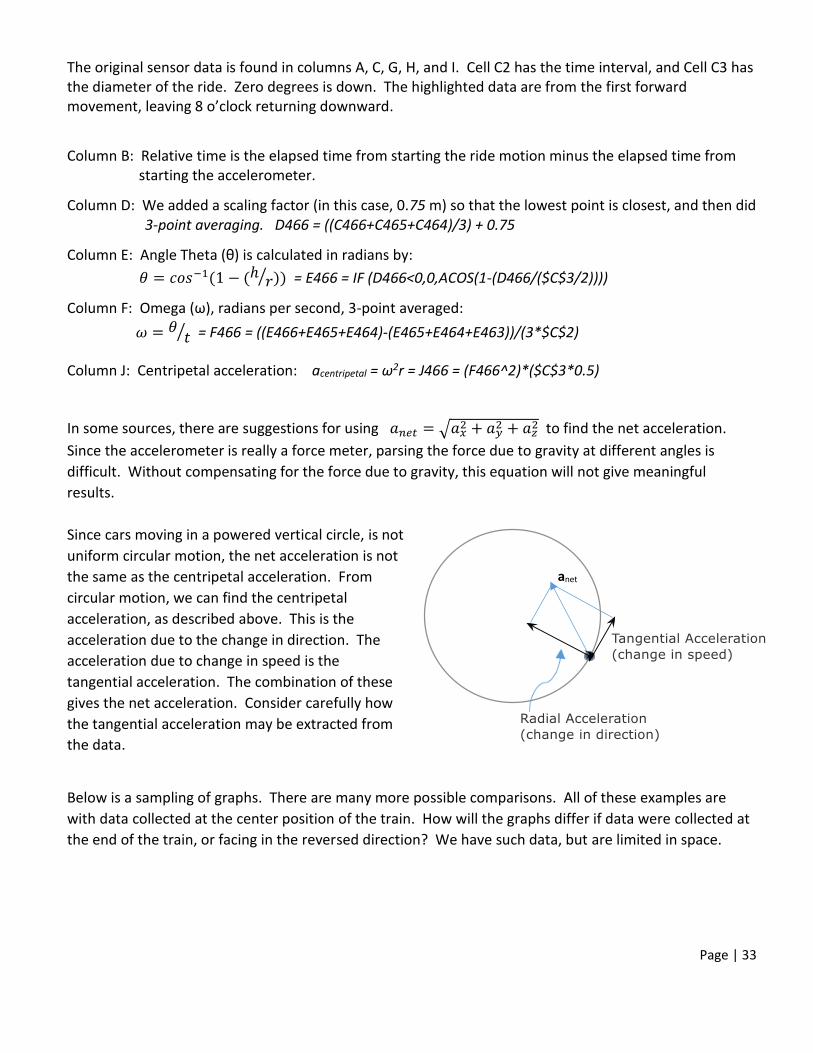
In some sources, there are suggestions for using 𝑎𝑛𝑒𝑡 = √𝑎𝑥2 + 𝑎𝑦
2 + 𝑎𝑧2 to find the net acceleration.
Since the accelerometer is really a force meter, parsing the force due to gravity at different angles is
difficult. Without compensating for the force due to gravity, this equation will not give meaningful
results.
Since cars moving in a powered vertical circle, is not
uniform circular motion, the net acceleration is not
the same as the centripetal acceleration. From
circular motion, we can find the centripetal
acceleration, as described above. This is the
acceleration due to the change in direction. The
acceleration due to change in speed is the
tangential acceleration. The combination of these
gives the net acceleration. Consider carefully how
the tangential acceleration may be extracted from
the data.
Below is a sampling of graphs. There are many more possible comparisons. All of these examples are
with data collected at the center position of the train. How will the graphs differ if data were collected at
the end of the train, or facing in the reversed direction? We have such data, but are limited in space.
anet
Page | 34
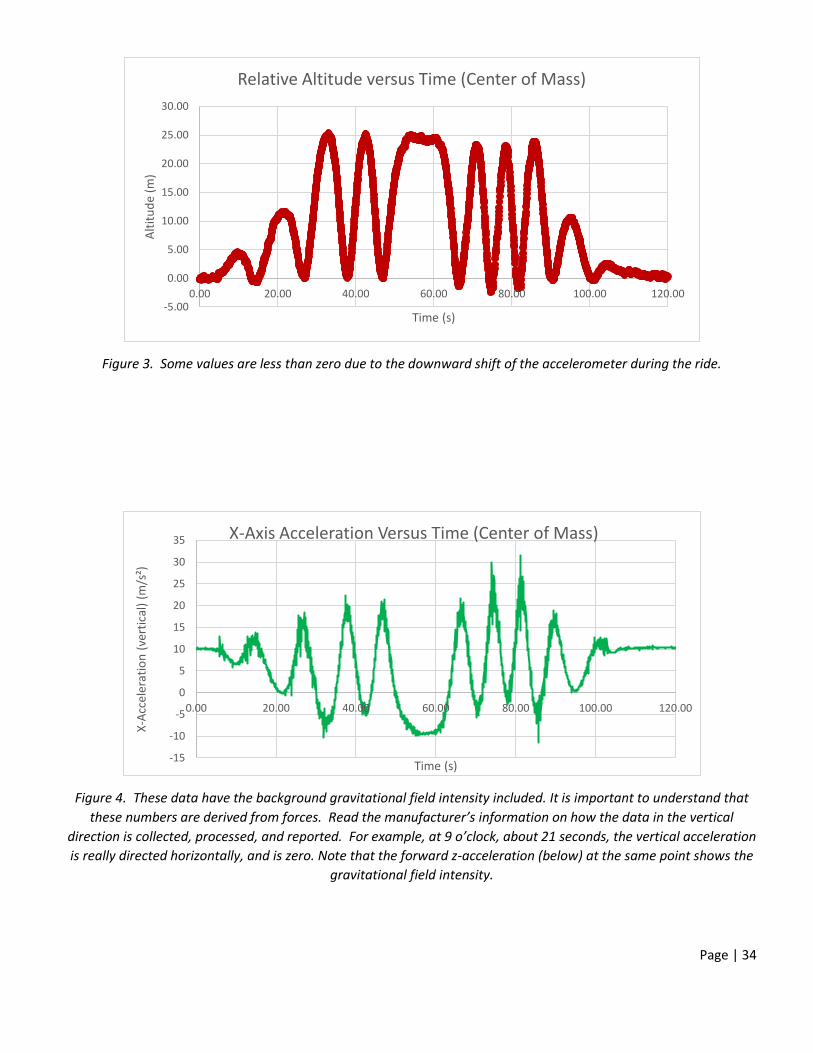
Figure 3. Some values are less than zero due to the downward shift of the accelerometer during the ride.
Figure 4. These data have the background gravitational field intensity included. It is important to understand that
these numbers are derived from forces. Read the manufacturer’s information on how the data in the vertical
direction is collected, processed, and reported. For example, at 9 o’clock, about 21 seconds, the vertical acceleration
is really directed horizontally, and is zero. Note that the forward z-acceleration (below) at the same point shows the
gravitational field intensity.
-5.00
0.00
5.00
10.00
15.00
20.00
25.00
30.00
0.00 20.00 40.00 60.00 80.00 100.00 120.00
Alt
itu
de
(m)
Time (s)
Relative Altitude versus Time (Center of Mass)
-15
-10
-5
0
5
10
15
20
25
30
35
0.00 20.00 40.00 60.00 80.00 100.00 120.00
X-A
ccel
erat
ion
(ve
rtic
al)
(m/s
²)
Time (s)
X-Axis Acceleration Versus Time (Center of Mass)
Page | 35
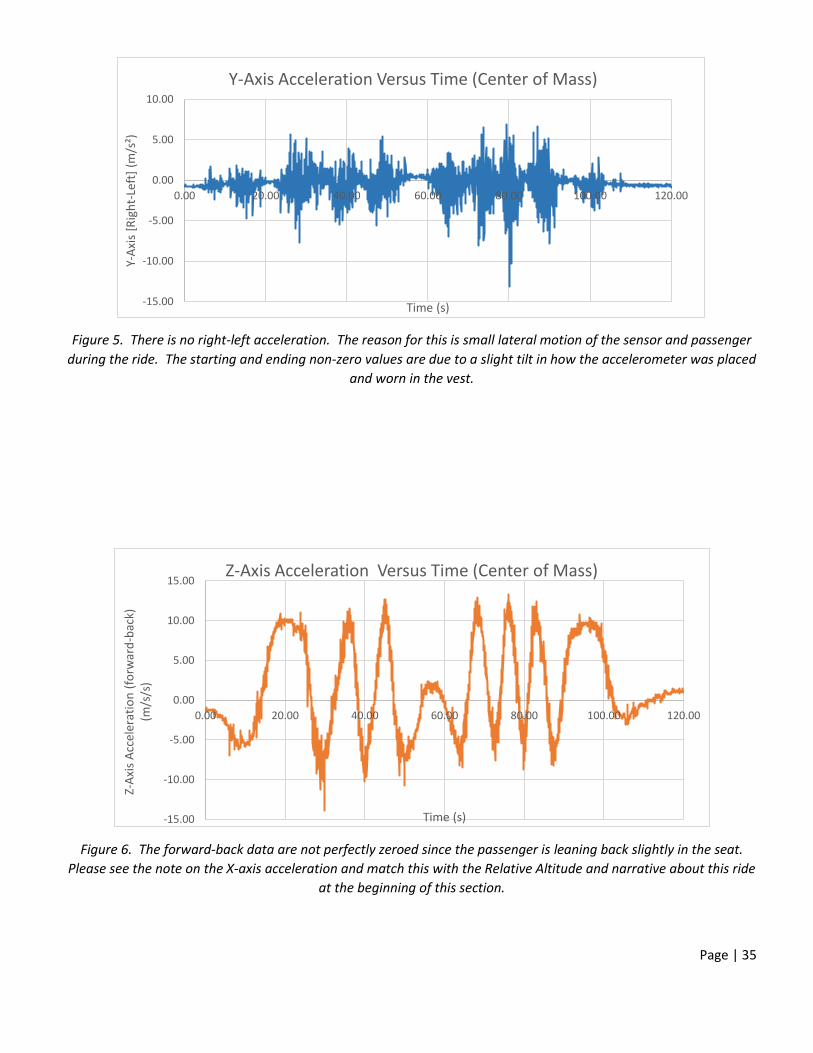
Figure 5. There is no right-left acceleration. The reason for this is small lateral motion of the sensor and passenger
during the ride. The starting and ending non-zero values are due to a slight tilt in how the accelerometer was placed
and worn in the vest.
Figure 6. The forward-back data are not perfectly zeroed since the passenger is leaning back slightly in the seat.
Please see the note on the X-axis acceleration and match this with the Relative Altitude and narrative about this ride
at the beginning of this section.
-15.00
-10.00
-5.00
0.00
5.00
10.00
0.00 20.00 40.00 60.00 80.00 100.00 120.00
Y-A
xis
[Rig
ht-
Left
] (m
/s²)
Time (s)
Y-Axis Acceleration Versus Time (Center of Mass)
-15.00
-10.00
-5.00
0.00
5.00
10.00
15.00
0.00 20.00 40.00 60.00 80.00 100.00 120.00
Z-A
xis
Acc
eler
atio
n (
forw
ard
-bac
k)
(m/s
/s)
Time (s)
Z-Axis Acceleration Versus Time (Center of Mass)
Page | 36
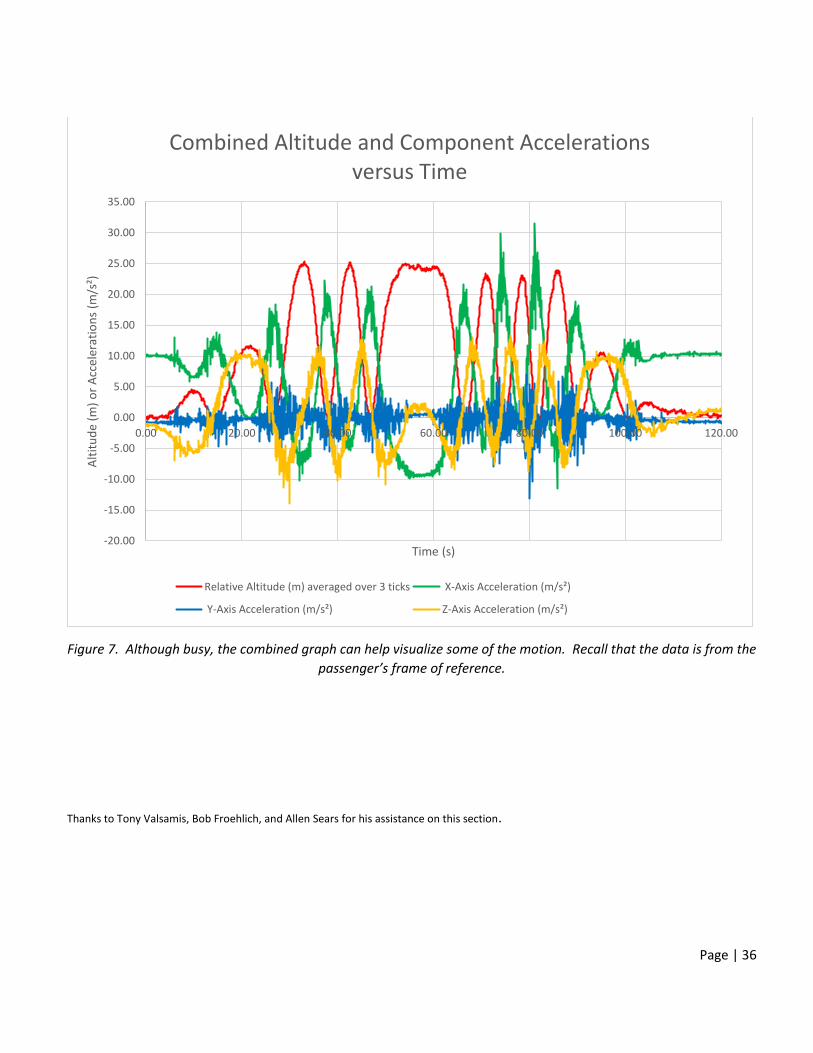
Figure 7. Although busy, the combined graph can help visualize some of the motion. Recall that the data is from the
passenger’s frame of reference.
Thanks to Tony Valsamis, Bob Froehlich, and Allen Sears for his assistance on this section.
-20.00
-15.00
-10.00
-5.00
0.00
5.00
10.00
15.00
20.00
25.00
30.00
35.00
0.00 20.00 40.00 60.00 80.00 100.00 120.00
Alt
itu
de
(m)
or
Acc
eler
atio
ns
(m/s
²)
Time (s)
Combined Altitude and Component Accelerations versus Time
Relative Altitude (m) averaged over 3 ticks X-Axis Acceleration (m/s²)
Y-Axis Acceleration (m/s²) Z-Axis Acceleration (m/s²)
Page | 37
Suggestions for Taking Measurements
TIME The timings that are required to work out the problems can easily be measured by using a watch with a
second hand, a digital watch with a stopwatch mode or a smart phone app. When measuring the period
of a ride that involves harmonic or circular motion, measure the time for several repetitions of the
motion. This will give a better estimate of the period of motion than just measuring one cycle. You may
want to measure the time two or three trials and then average them.
DISTANCE Since you cannot interfere with the normal operation of the rides, you will not be able to directly measure
heights, diameters, etc. Most of the distances can be measured remotely using the methods described
below. They will give you a reasonable estimate. Try to keep consistent units, i.e. meters, centimeters,
etc., to make calculations easier.
Pacing: Determine the length of your stride by walking at your normal rate over a measured distance.
Divide the distance by the number of steps and you can get the average distance per step.
Knowing this, you can pace off horizontal distances.
My pace = m
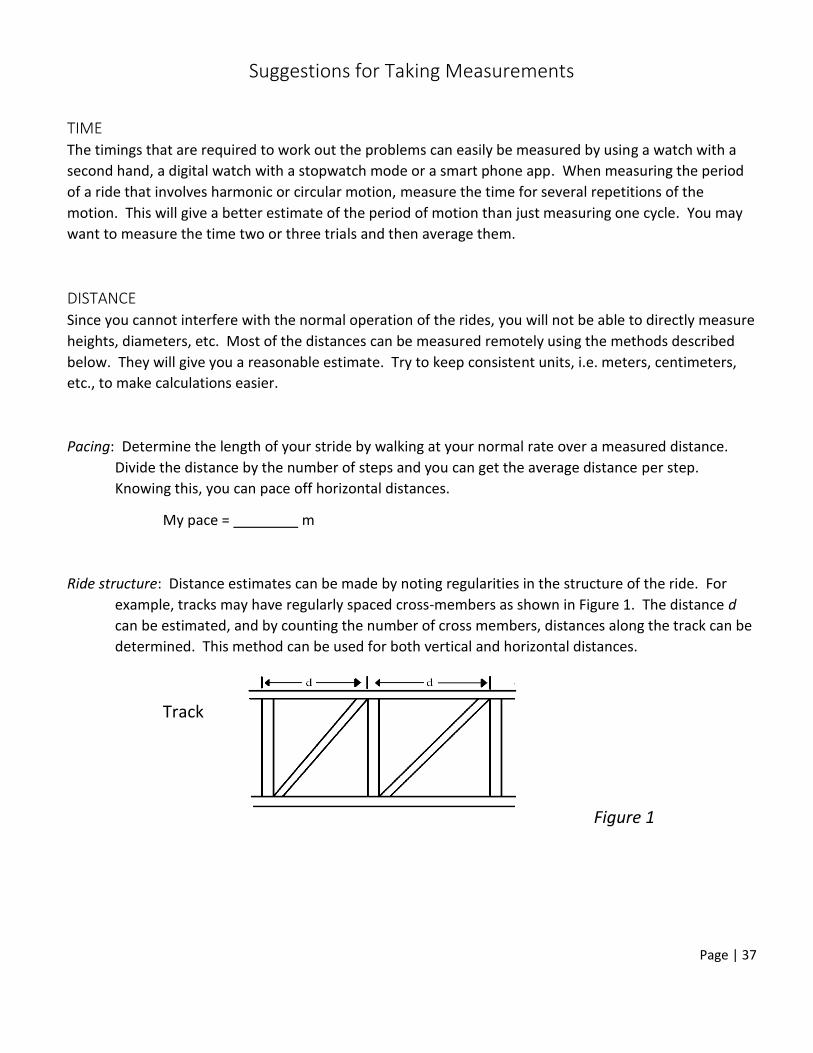
Ride structure: Distance estimates can be made by noting regularities in the structure of the ride. For
example, tracks may have regularly spaced cross-members as shown in Figure 1. The distance d
can be estimated, and by counting the number of cross members, distances along the track can be
determined. This method can be used for both vertical and horizontal distances.
Track
Figure 1
Page | 38
b
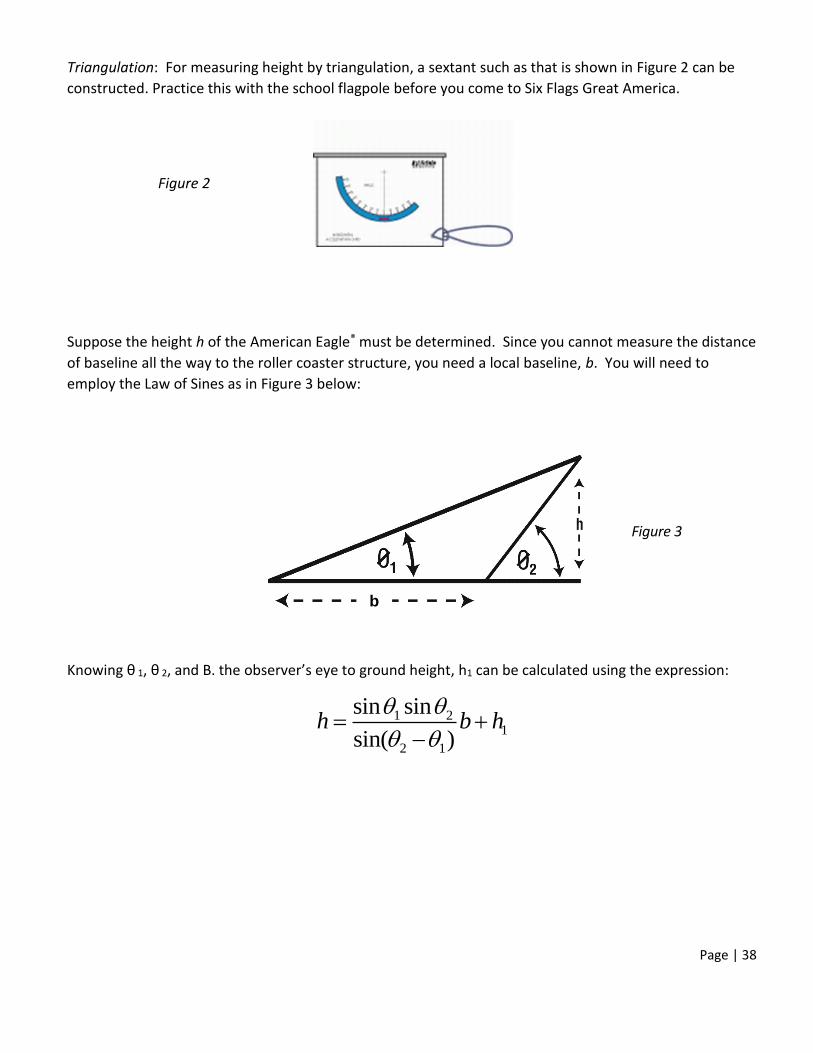
Triangulation: For measuring height by triangulation, a sextant such as that is shown in Figure 2 can be
constructed. Practice this with the school flagpole before you come to Six Flags Great America.
Figure 2
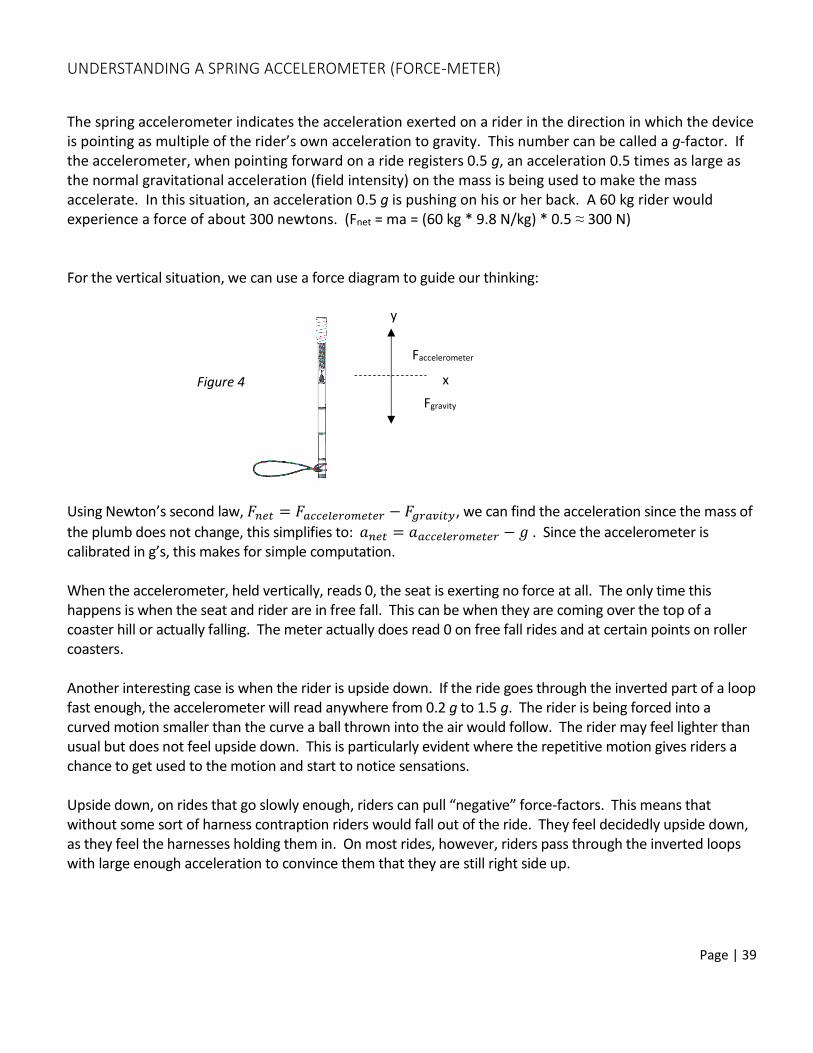
Suppose the height h of the American Eagle® must be determined. Since you cannot measure the distance
of baseline all the way to the roller coaster structure, you need a local baseline, b. You will need to
employ the Law of Sines as in Figure 3 below:
Figure 3
Knowing θ 1, θ 2, and B. the observer’s eye to ground height, h1 can be calculated using the expression:
1 21
2 1
sin sin
sin( )h b h
Page | 39
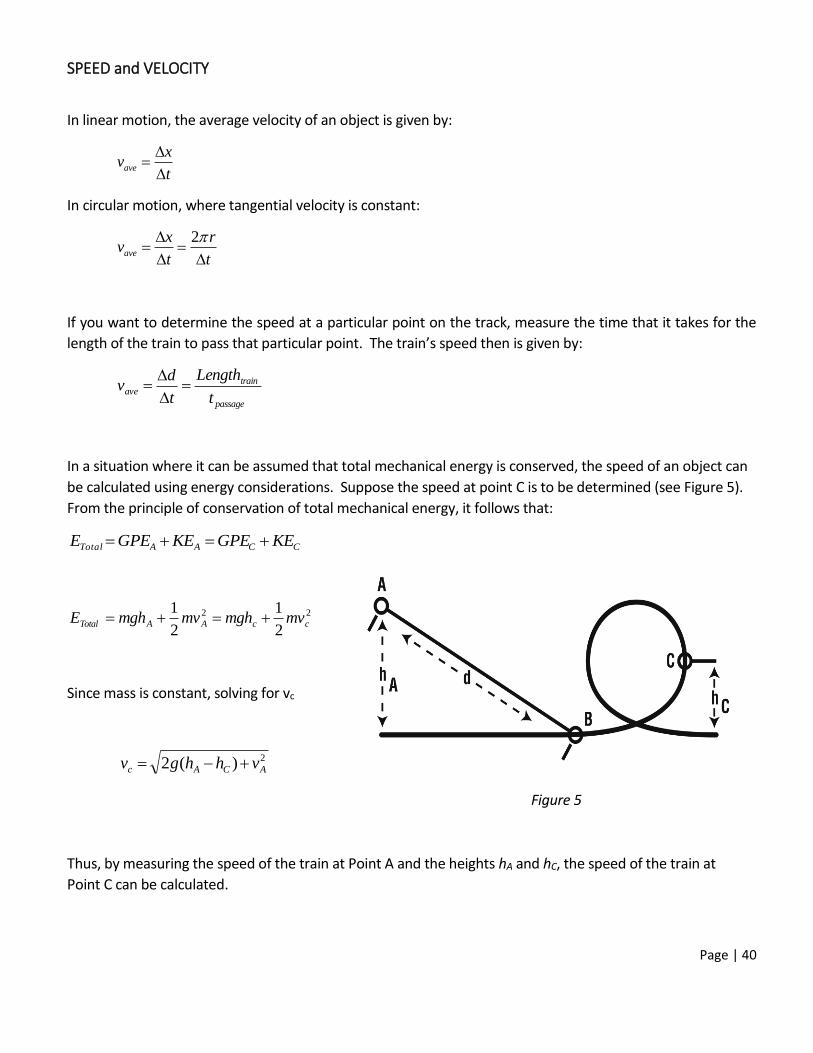
UNDERSTANDING A SPRING ACCELEROMETER (FORCE-METER)
The spring accelerometer indicates the acceleration exerted on a rider in the direction in which the device is pointing as multiple of the rider’s own acceleration to gravity. This number can be called a g-factor. If the accelerometer, when pointing forward on a ride registers 0.5 g, an acceleration 0.5 times as large as the normal gravitational acceleration (field intensity) on the mass is being used to make the mass accelerate. In this situation, an acceleration 0.5 g is pushing on his or her back. A 60 kg rider would experience a force of about 300 newtons. (Fnet = ma = (60 kg * 9.8 N/kg) * 0.5 ≈ 300 N) For the vertical situation, we can use a force diagram to guide our thinking: Using Newton’s second law, 𝐹𝑛𝑒𝑡 = 𝐹𝑎𝑐𝑐𝑒𝑙𝑒𝑟𝑜𝑚𝑒𝑡𝑒𝑟 − 𝐹𝑔𝑟𝑎𝑣𝑖𝑡𝑦, we can find the acceleration since the mass of
the plumb does not change, this simplifies to: 𝑎𝑛𝑒𝑡 = 𝑎𝑎𝑐𝑐𝑒𝑙𝑒𝑟𝑜𝑚𝑒𝑡𝑒𝑟 − 𝑔 . Since the accelerometer is calibrated in g’s, this makes for simple computation. When the accelerometer, held vertically, reads 0, the seat is exerting no force at all. The only time this happens is when the seat and rider are in free fall. This can be when they are coming over the top of a coaster hill or actually falling. The meter actually does read 0 on free fall rides and at certain points on roller coasters. Another interesting case is when the rider is upside down. If the ride goes through the inverted part of a loop fast enough, the accelerometer will read anywhere from 0.2 g to 1.5 g. The rider is being forced into a curved motion smaller than the curve a ball thrown into the air would follow. The rider may feel lighter than usual but does not feel upside down. This is particularly evident where the repetitive motion gives riders a chance to get used to the motion and start to notice sensations. Upside down, on rides that go slowly enough, riders can pull “negative” force-factors. This means that without some sort of harness contraption riders would fall out of the ride. They feel decidedly upside down, as they feel the harnesses holding them in. On most rides, however, riders pass through the inverted loops with large enough acceleration to convince them that they are still right side up.
Figure 4
Faccelerometer
Fgravity
x
y
Page | 40
SPEED and VELOCITY
In linear motion, the average velocity of an object is given by:
ave
xv
t
In circular motion, where tangential velocity is constant:
2
ave
x rv
t t
If you want to determine the speed at a particular point on the track, measure the time that it takes for the
length of the train to pass that particular point. The train’s speed then is given by:
passage
trainave
t
Length
t
dv
In a situation where it can be assumed that total mechanical energy is conserved, the speed of an object can
be calculated using energy considerations. Suppose the speed at point C is to be determined (see Figure 5).
From the principle of conservation of total mechanical energy, it follows that:
CCAATotal KEGPEKEGPEE
22
2
1
2
1ccAATotal mvmghmvmghE
Since mass is constant, solving for vc
2)(2 ACAc vhhgv
Figure 5
Thus, by measuring the speed of the train at Point A and the heights hA and hC, the speed of the train at
Point C can be calculated.
Page | 41
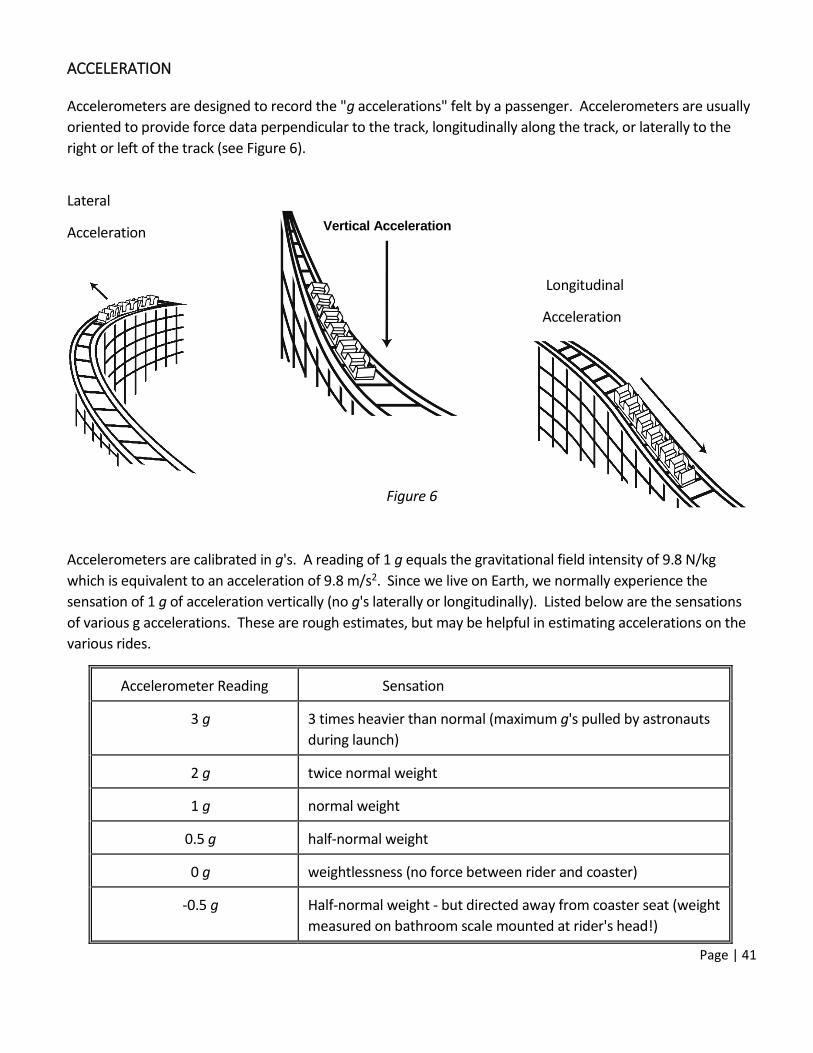
ACCELERATION
Accelerometers are designed to record the "g accelerations" felt by a passenger. Accelerometers are usually
oriented to provide force data perpendicular to the track, longitudinally along the track, or laterally to the
right or left of the track (see Figure 6).
Lateral
Acceleration
Longitudinal
Acceleration
Figure 6
Accelerometers are calibrated in g's. A reading of 1 g equals the gravitational field intensity of 9.8 N/kg
which is equivalent to an acceleration of 9.8 m/s2. Since we live on Earth, we normally experience the
sensation of 1 g of acceleration vertically (no g's laterally or longitudinally). Listed below are the sensations
of various g accelerations. These are rough estimates, but may be helpful in estimating accelerations on the
various rides.
Accelerometer Reading Sensation
3 g 3 times heavier than normal (maximum g's pulled by astronauts
during launch)
2 g twice normal weight
1 g normal weight
0.5 g half-normal weight
0 g weightlessness (no force between rider and coaster)
-0.5 g Half-normal weight - but directed away from coaster seat (weight
measured on bathroom scale mounted at rider's head!)
Vertical Acceleration
Page | 42
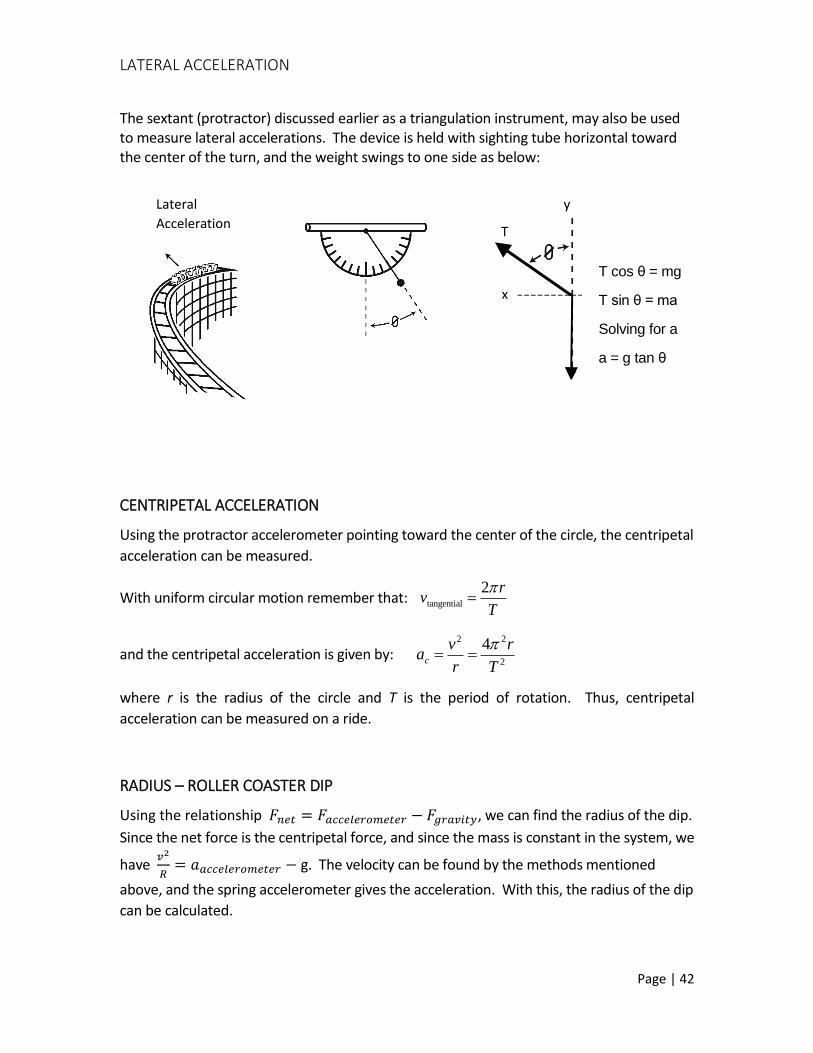
LATERAL ACCELERATION
The sextant (protractor) discussed earlier as a triangulation instrument, may also be used to measure lateral accelerations. The device is held with sighting tube horizontal toward the center of the turn, and the weight swings to one side as below:
T cos θ T cos θ = mg
T sin θ = ma
Solving for a
a = g tan θ
CENTRIPETAL ACCELERATION
Using the protractor accelerometer pointing toward the center of the circle, the centripetal
acceleration can be measured.
With uniform circular motion remember that: tangential
2 rv
T
and the centripetal acceleration is given by: 2
22 4
T
r
r
vac
where r is the radius of the circle and T is the period of rotation. Thus, centripetal
acceleration can be measured on a ride.
RADIUS – ROLLER COASTER DIP
Using the relationship 𝐹𝑛𝑒𝑡 = 𝐹𝑎𝑐𝑐𝑒𝑙𝑒𝑟𝑜𝑚𝑒𝑡𝑒𝑟 − 𝐹𝑔𝑟𝑎𝑣𝑖𝑡𝑦, we can find the radius of the dip.
Since the net force is the centripetal force, and since the mass is constant in the system, we
have 𝑣2
𝑅= 𝑎𝑎𝑐𝑐𝑒𝑙𝑒𝑟𝑜𝑚𝑒𝑡𝑒𝑟 − g. The velocity can be found by the methods mentioned
above, and the spring accelerometer gives the acceleration. With this, the radius of the dip
can be calculated.
Lateral
Acceleration T
x
y
Page | 43
Ride Information
The information in this section is general background information on the
ride. Many times a student might ask about manufacturer, track layout, a
picture (also available in the student manual) and other information. This
section is intended to be general reference.
NOTES:
Although Little Dipper does not have a separate student write-up, many of the
questions for Whizzer and American Eagle may be applied for this ride.
Similar questions for Hometown Fun Machine also apply to Condor. Condor matches
Hometown Fun Machine with the exception that Condor is on an elevator and is
gimballed.
Similar questions apply to Triple Play, except that each pod in Triple Play tilts.
The Lobster has an offset due to a cam causing an undulating tilt for the plane of
rotation of each pod.
Fiddler’s Fling is similar to Hometown Fun Machine, but is on a constant tilt to the
horizontal.
Ricochet is much more complicated and is not recommended for the high school
classroom.
Page | 44
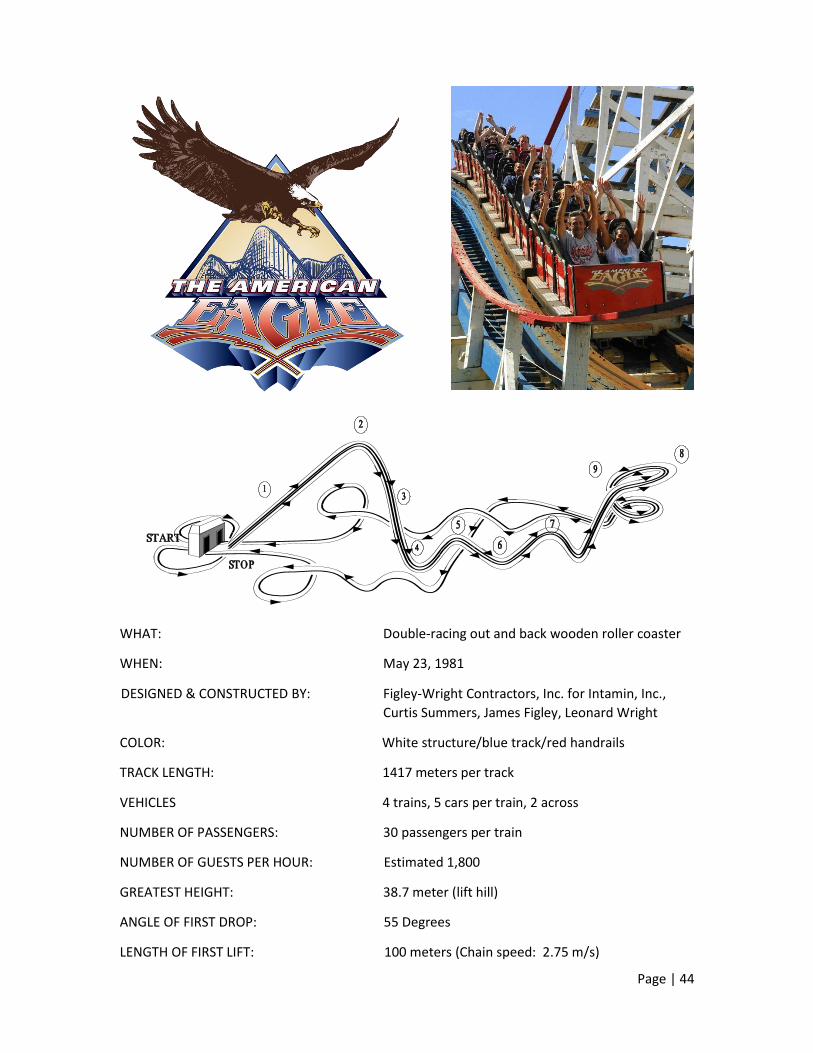
WHAT: Double-racing out and back wooden roller coaster
WHEN: May 23, 1981
DESIGNED & CONSTRUCTED BY: Figley-Wright Contractors, Inc. for Intamin, Inc.,
Curtis Summers, James Figley, Leonard Wright
COLOR: White structure/blue track/red handrails
TRACK LENGTH: 1417 meters per track
VEHICLES 4 trains, 5 cars per train, 2 across
NUMBER OF PASSENGERS: 30 passengers per train
NUMBER OF GUESTS PER HOUR: Estimated 1,800
GREATEST HEIGHT: 38.7 meter (lift hill)
ANGLE OF FIRST DROP: 55 Degrees
LENGTH OF FIRST LIFT: 100 meters (Chain speed: 2.75 m/s)

Page | 45
MAXIMUM SPEED: 29.6 meters/second
DURATION OF RIDE: 2 minutes 35 seconds
ACCELERATIONS: Do not exceed 1.65 g's in the dips
OTHER INTERESTING FACTS: 2,000 concrete footings (average of 0.5 meters in
diameter, 1.4 meters in depth)
13,900 kilograms of nails
over 20,000 man hours to build
Page | 46
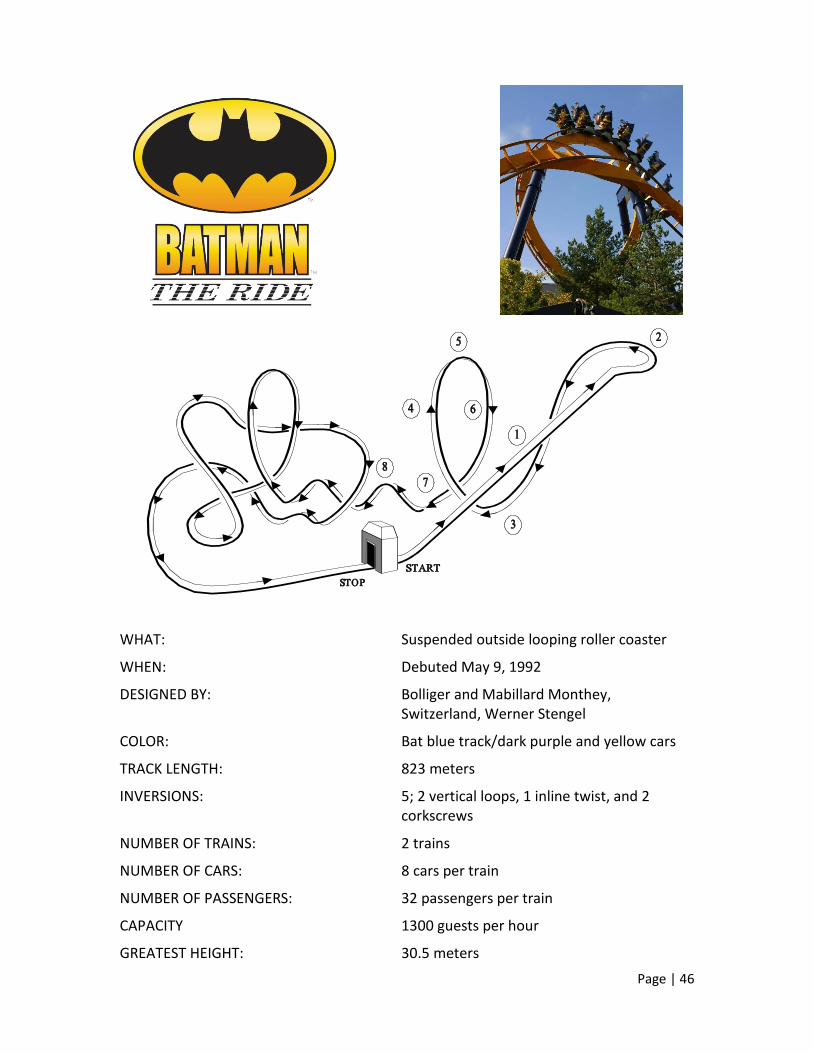
WHAT: Suspended outside looping roller coaster
WHEN: Debuted May 9, 1992
DESIGNED BY: Bolliger and Mabillard Monthey, Switzerland, Werner Stengel
COLOR: Bat blue track/dark purple and yellow cars
TRACK LENGTH: 823 meters
INVERSIONS: 5; 2 vertical loops, 1 inline twist, and 2 corkscrews
NUMBER OF TRAINS: 2 trains
NUMBER OF CARS: 8 cars per train
NUMBER OF PASSENGERS: 32 passengers per train
CAPACITY 1300 guests per hour
GREATEST HEIGHT: 30.5 meters

Page | 47
MAXIMUM SPEED: 22.4 meters per second
HEIGHT OF FIRST VERTICAL LOOP: 23.5 meters
DURATION OF RIDE: 1 minute 30 seconds
SPECIAL FEATURES: Outside looping, suspended high-speed chairlift-type vehicles, "heart-line spin." In 2005, named an ACE Coaster Landmark.
Page | 48
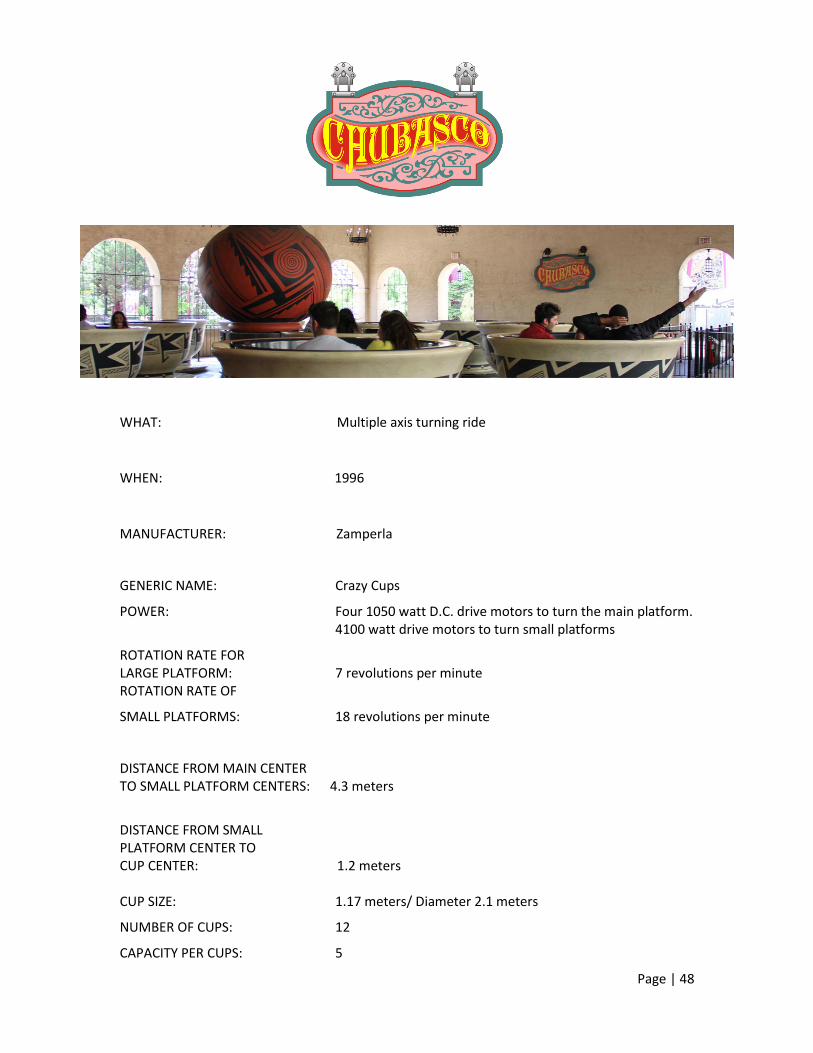
WHAT: Multiple axis turning ride
WHEN: 1996
MANUFACTURER: Zamperla
GENERIC NAME: Crazy Cups
POWER: Four 1050 watt D.C. drive motors to turn the main platform. 4100 watt drive motors to turn small platforms
ROTATION RATE FOR LARGE PLATFORM: 7 revolutions per minute ROTATION RATE OF
SMALL PLATFORMS: 18 revolutions per minute
DISTANCE FROM MAIN CENTER TO SMALL PLATFORM CENTERS: 4.3 meters
DISTANCE FROM SMALL PLATFORM CENTER TO CUP CENTER: 1.2 meters CUP SIZE: 1.17 meters/ Diameter 2.1 meters
NUMBER OF CUPS: 12
CAPACITY PER CUPS: 5

Page | 49
MAXIMUM RIDE CAPACITY PER HOUR: 1200 guests per hour
CYCLE TIME: 2 minutes 30 seconds
Page | 50
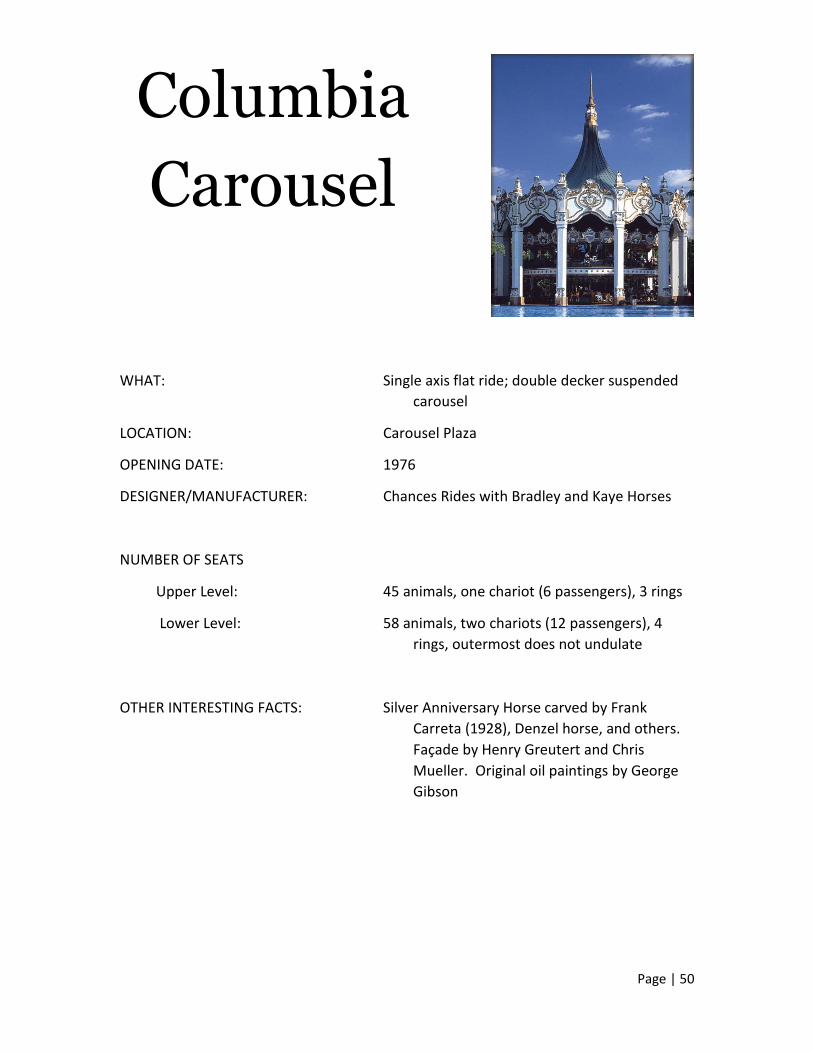
WHAT: Single axis flat ride; double decker suspended
carousel
LOCATION: Carousel Plaza
OPENING DATE: 1976
DESIGNER/MANUFACTURER: Chances Rides with Bradley and Kaye Horses
NUMBER OF SEATS
Upper Level: 45 animals, one chariot (6 passengers), 3 rings
Lower Level: 58 animals, two chariots (12 passengers), 4
rings, outermost does not undulate
OTHER INTERESTING FACTS: Silver Anniversary Horse carved by Frank
Carreta (1928), Denzel horse, and others.
Façade by Henry Greutert and Chris
Mueller. Original oil paintings by George
Gibson
Columbia
Carousel
Page | 51
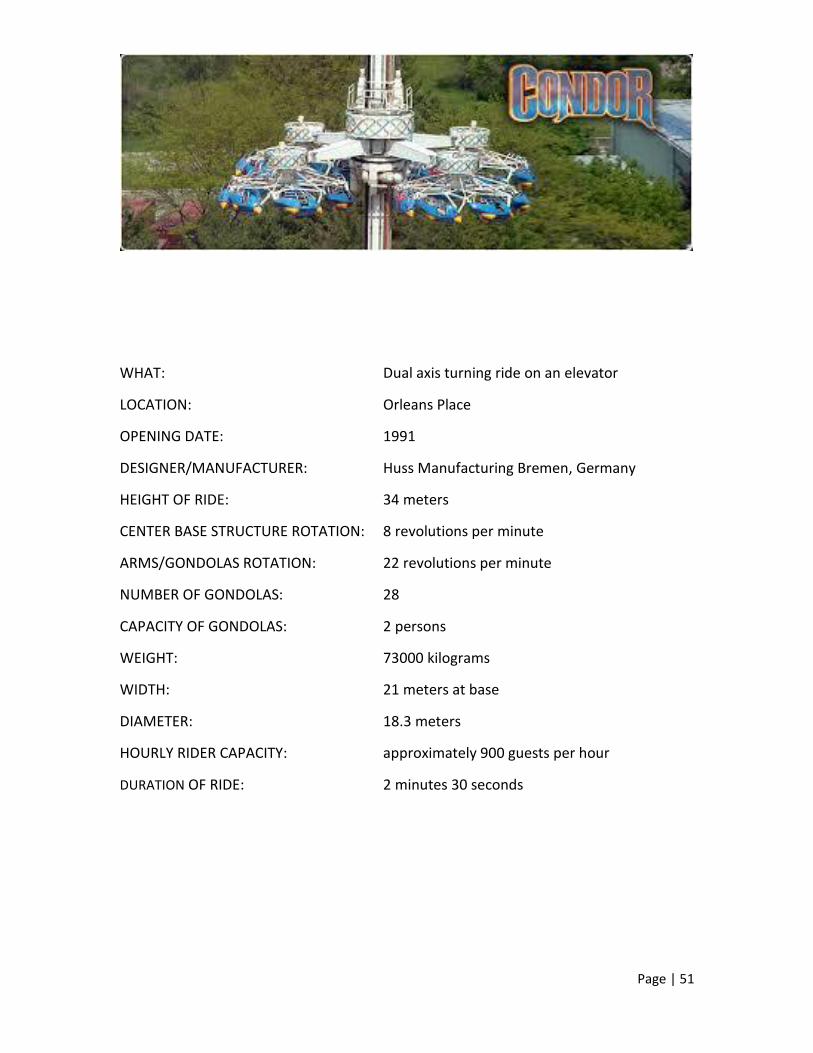
WHAT: Dual axis turning ride on an elevator
LOCATION: Orleans Place
OPENING DATE: 1991
DESIGNER/MANUFACTURER: Huss Manufacturing Bremen, Germany
HEIGHT OF RIDE: 34 meters
CENTER BASE STRUCTURE ROTATION: 8 revolutions per minute
ARMS/GONDOLAS ROTATION: 22 revolutions per minute
NUMBER OF GONDOLAS: 28
CAPACITY OF GONDOLAS: 2 persons
WEIGHT: 73000 kilograms
WIDTH: 21 meters at base
DIAMETER: 18.3 meters
HOURLY RIDER CAPACITY: approximately 900 guests per hour
DURATION OF RIDE: 2 minutes 30 seconds
Page | 52
INDUSTRY NAME: Wild Mouse Coaster
MANUFACTURER: Mack Rides, GmbH and Company, Werner Stengel
DATE INSTALLED: May 21, 2008
MAXIMUM SPEED: 13.5 meters per second
RIDE LENGTH: 370 meters
MAXIMUM HEIGHT: 14 meters
RIDE TIME: 1 minute 50 seconds
NUMBER OF CARS: 8 cars, 2 rows
SEATS PER CAR: 4
CAPACITY: 900 guests per hour
DESCRIPTION: An exciting ride with sudden turns and drops.
OTHER INFORMATION: Indoor rollercoaster that employs lighting effects.
Page | 53
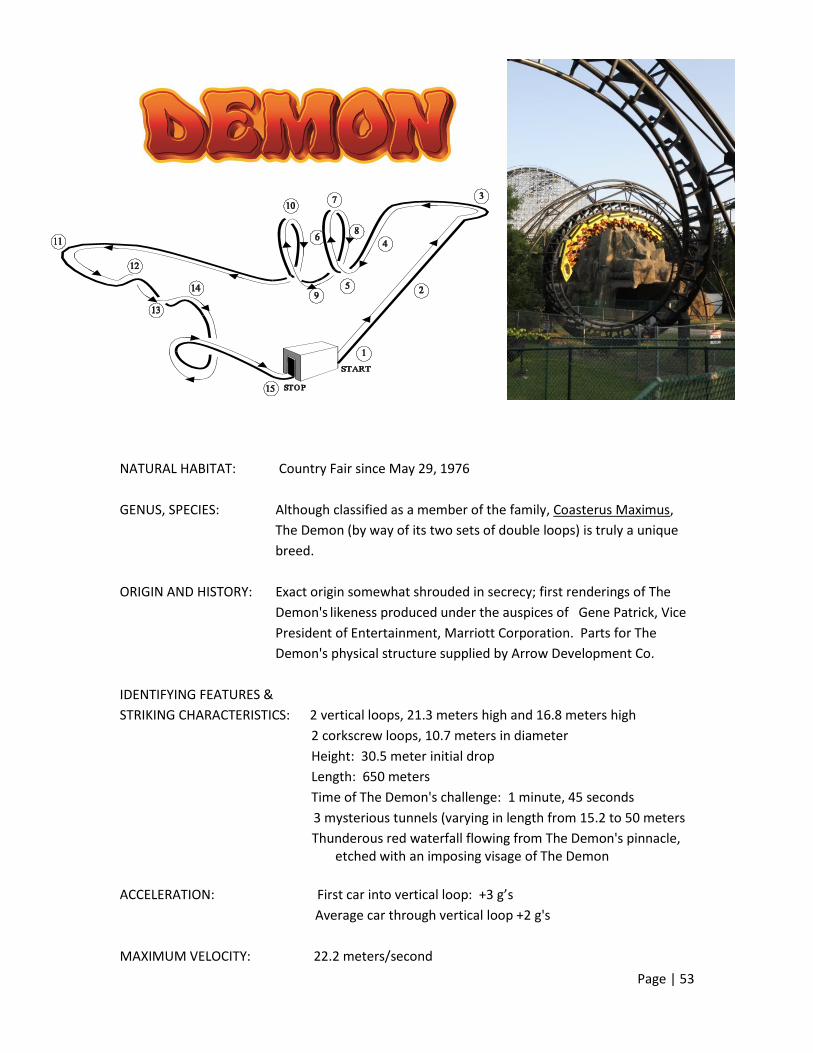
NATURAL HABITAT: Country Fair since May 29, 1976
GENUS, SPECIES: Although classified as a member of the family, Coasterus Maximus,
The Demon (by way of its two sets of double loops) is truly a unique
breed.
ORIGIN AND HISTORY: Exact origin somewhat shrouded in secrecy; first renderings of The
Demon's likeness produced under the auspices of Gene Patrick, Vice
President of Entertainment, Marriott Corporation. Parts for The
Demon's physical structure supplied by Arrow Development Co.
IDENTIFYING FEATURES &
STRIKING CHARACTERISTICS: 2 vertical loops, 21.3 meters high and 16.8 meters high
2 corkscrew loops, 10.7 meters in diameter
Height: 30.5 meter initial drop
Length: 650 meters
Time of The Demon's challenge: 1 minute, 45 seconds
3 mysterious tunnels (varying in length from 15.2 to 50 meters
Thunderous red waterfall flowing from The Demon's pinnacle, etched with an imposing visage of The Demon
ACCELERATION: First car into vertical loop: +3 g’s
Average car through vertical loop +2 g's
MAXIMUM VELOCITY: 22.2 meters/second

Page | 54
CAPACITY: 1300 guests per hour
VEHICLES: 3 trains, 24 riders per train
Page | 55
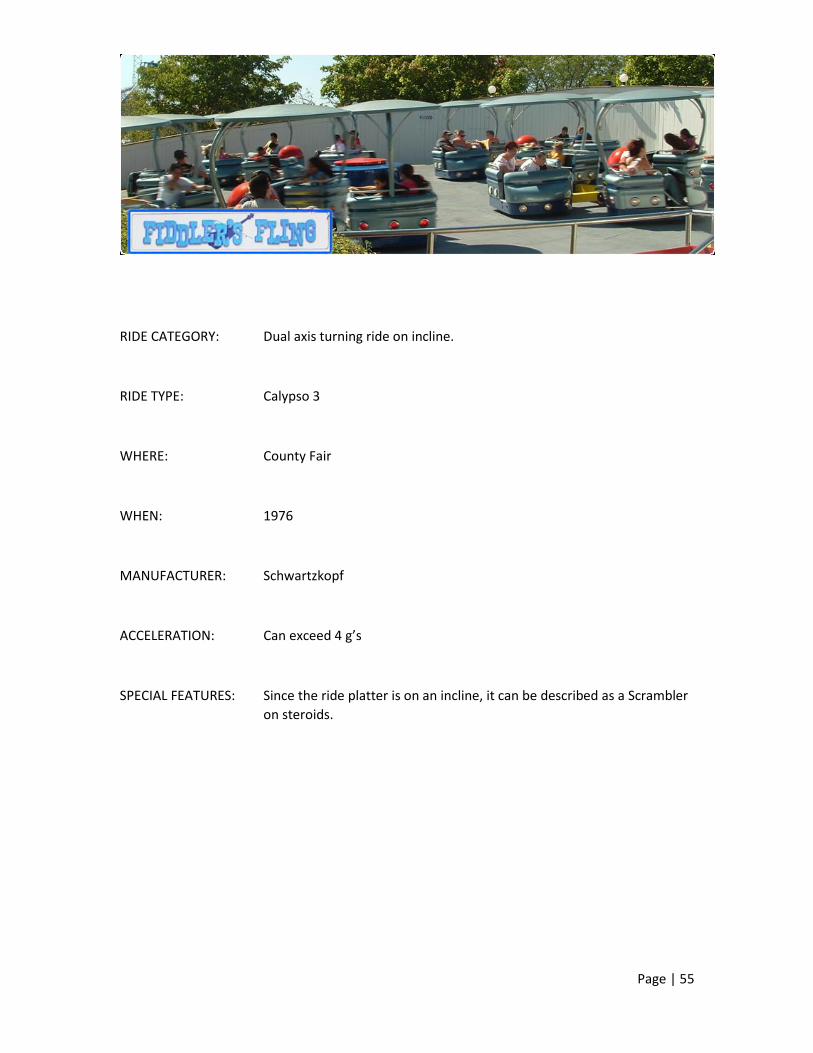
RIDE CATEGORY: Dual axis turning ride on incline.
RIDE TYPE: Calypso 3
WHERE: County Fair
WHEN: 1976
MANUFACTURER: Schwartzkopf
ACCELERATION: Can exceed 4 g’s
SPECIAL FEATURES: Since the ride platter is on an incline, it can be described as a Scrambler
on steroids.
Page | 56
A
B
C
D
Copper Sheets
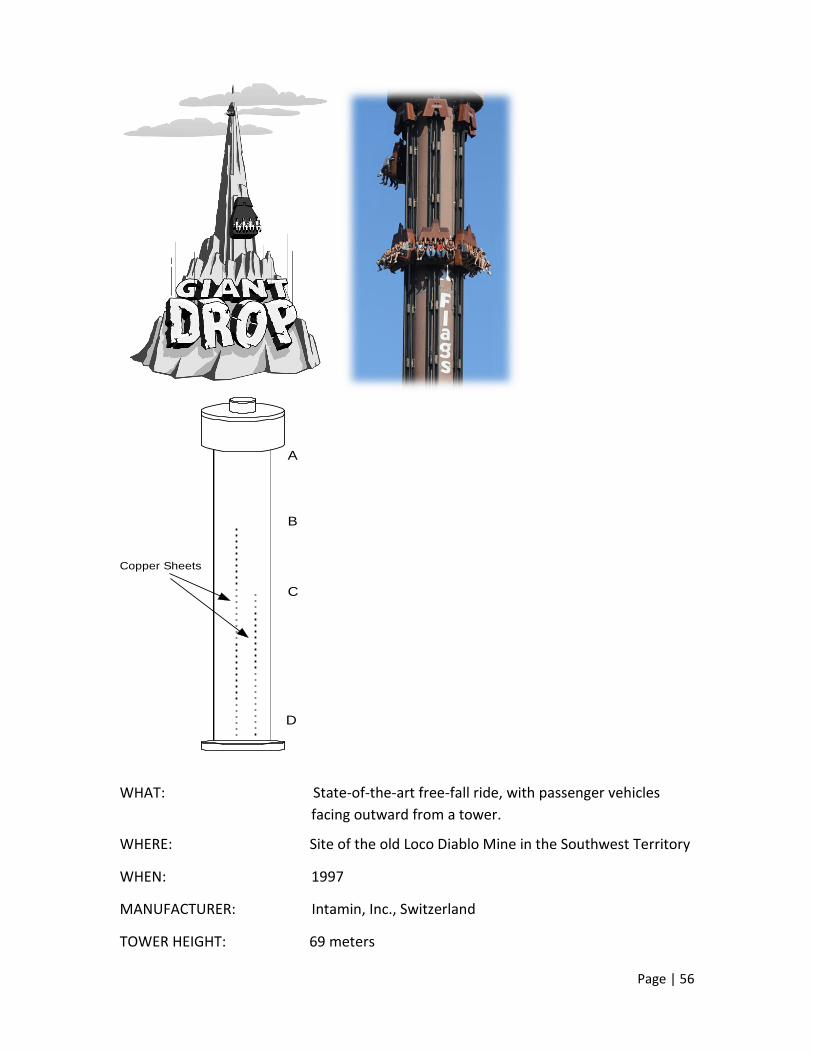
WHAT: State-of-the-art free-fall ride, with passenger vehicles
facing outward from a tower.
WHERE: Site of the old Loco Diablo Mine in the Southwest Territory
WHEN: 1997
MANUFACTURER: Intamin, Inc., Switzerland
TOWER HEIGHT: 69 meters

Page | 57
DROP OF VEHICLE: 62.5 meters
NUMBER OF CARS: 6
PASSENGERS PER CAR: 4
MAXIMUMSPEED OF DROP: Approximately 28 meters per second
SPECIAL FEATURES: Giant Drop’s magnetic brakes are frictionless, making this
the smoothest, most exhilarating drop ride.

Page | 58
WHAT: Wooden Looping Roller Coaster
WHEN: Debuted June 19, 2014
DESIGNED BY: Rocky Mountain Construction, Alan Schilke
TRACK LENGTH: 940 m
NUMBER OF TRAINS: 2 trains
NUMBER OF CARS: 4 cars, 2 across
NUMBER OF PASSENGERS: 24 passengers
GREATEST HEIGHT: 55 meter
MAXIMUM SPEED: 32 meters per second
DURATION OF RIDE: 1 minute 30 seconds
CAPACITY: 800 guests per hour
SPECIAL FEATURES: 85O First drop, over banked turns, low g roll,
magnetic braking

Page | 59
TYPE OF RIDE: Giant vertical circular thrill ride, also known as Ring of Fire
WHERE: Mardi Gras
MANUFACTURER: Larson International
WHEN: May 26, 2018
HEIGHT: 30.1 meters
DURATION: 90 seconds
INVERSIONS: 6 per cycle
VELOCITY: Variable, with a maximum of 13.4 meters per second
Page | 60
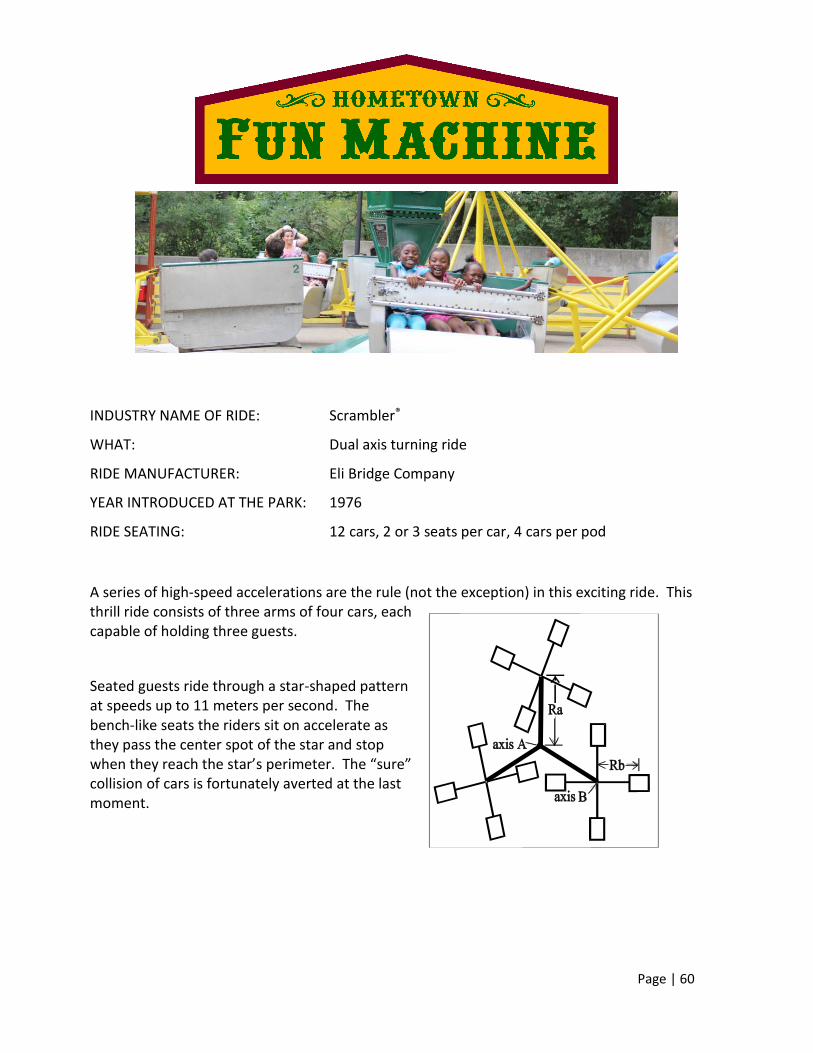
INDUSTRY NAME OF RIDE: Scrambler®
WHAT: Dual axis turning ride
RIDE MANUFACTURER: Eli Bridge Company
YEAR INTRODUCED AT THE PARK: 1976
RIDE SEATING: 12 cars, 2 or 3 seats per car, 4 cars per pod
A series of high-speed accelerations are the rule (not the exception) in this exciting ride. This thrill ride consists of three arms of four cars, each capable of holding three guests.
Seated guests ride through a star-shaped pattern at speeds up to 11 meters per second. The bench-like seats the riders sit on accelerate as they pass the center spot of the star and stop when they reach the star’s perimeter. The “sure” collision of cars is fortunately averted at the last moment.
Page | 61
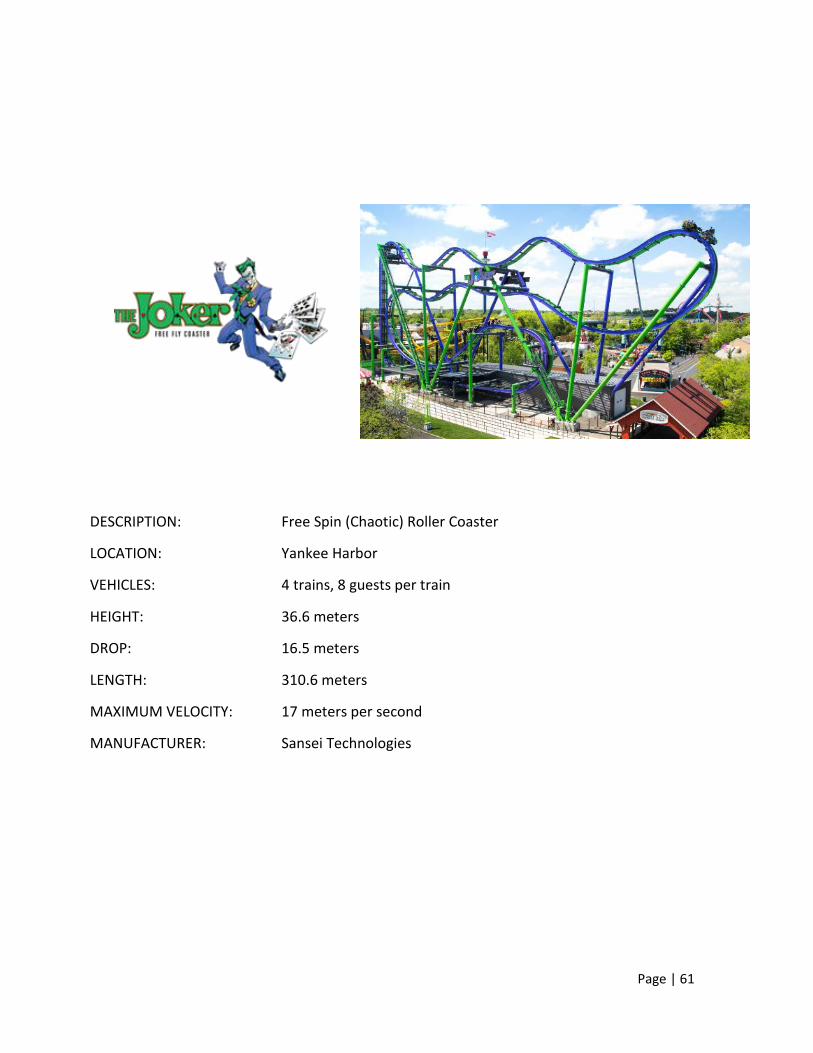
DESCRIPTION: Free Spin (Chaotic) Roller Coaster
LOCATION: Yankee Harbor
VEHICLES: 4 trains, 8 guests per train
HEIGHT: 36.6 meters
DROP: 16.5 meters
LENGTH: 310.6 meters
MAXIMUM VELOCITY: 17 meters per second
MANUFACTURER: Sansei Technologies
Page | 62
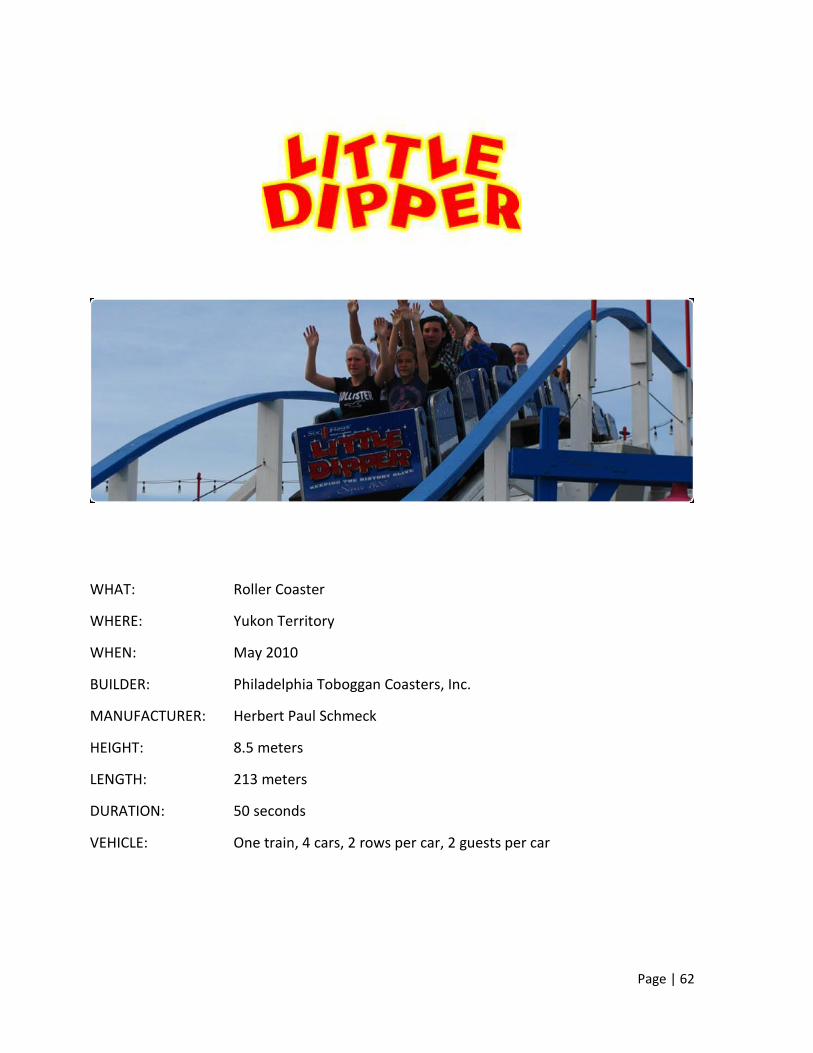
WHAT: Roller Coaster
WHERE: Yukon Territory
WHEN: May 2010
BUILDER: Philadelphia Toboggan Coasters, Inc.
MANUFACTURER: Herbert Paul Schmeck
HEIGHT: 8.5 meters
LENGTH: 213 meters
DURATION: 50 seconds
VEHICLE: One train, 4 cars, 2 rows per car, 2 guests per car
Page | 63
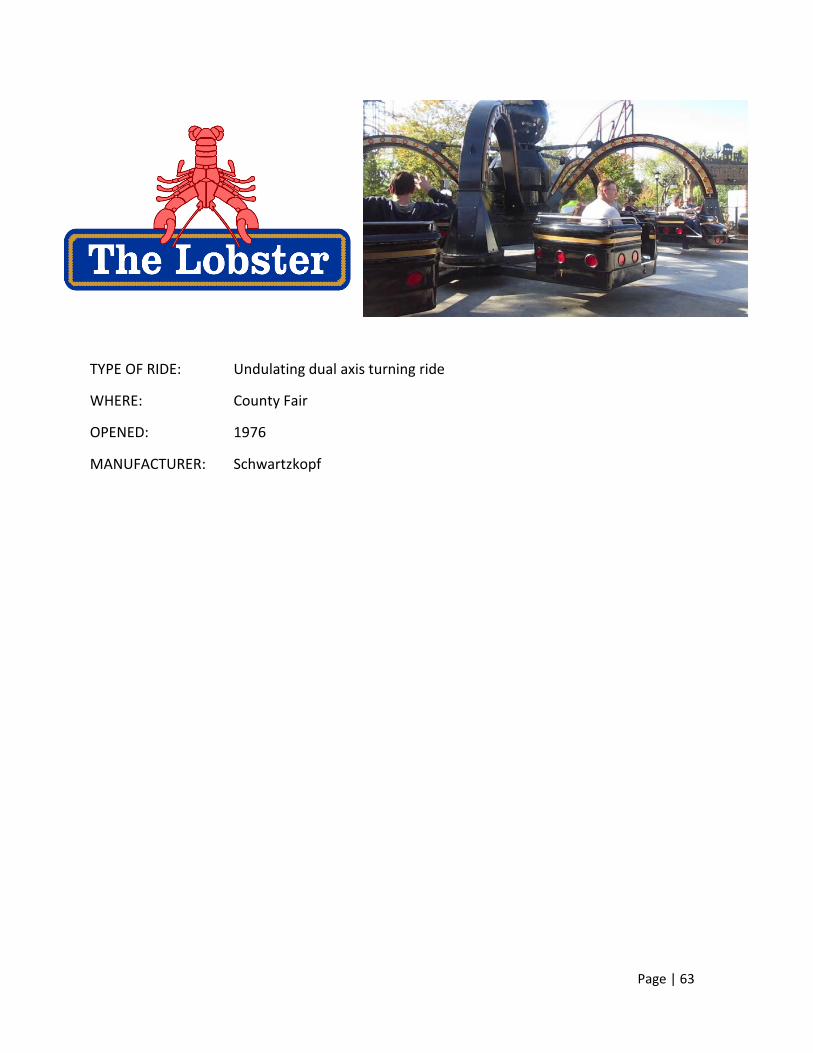
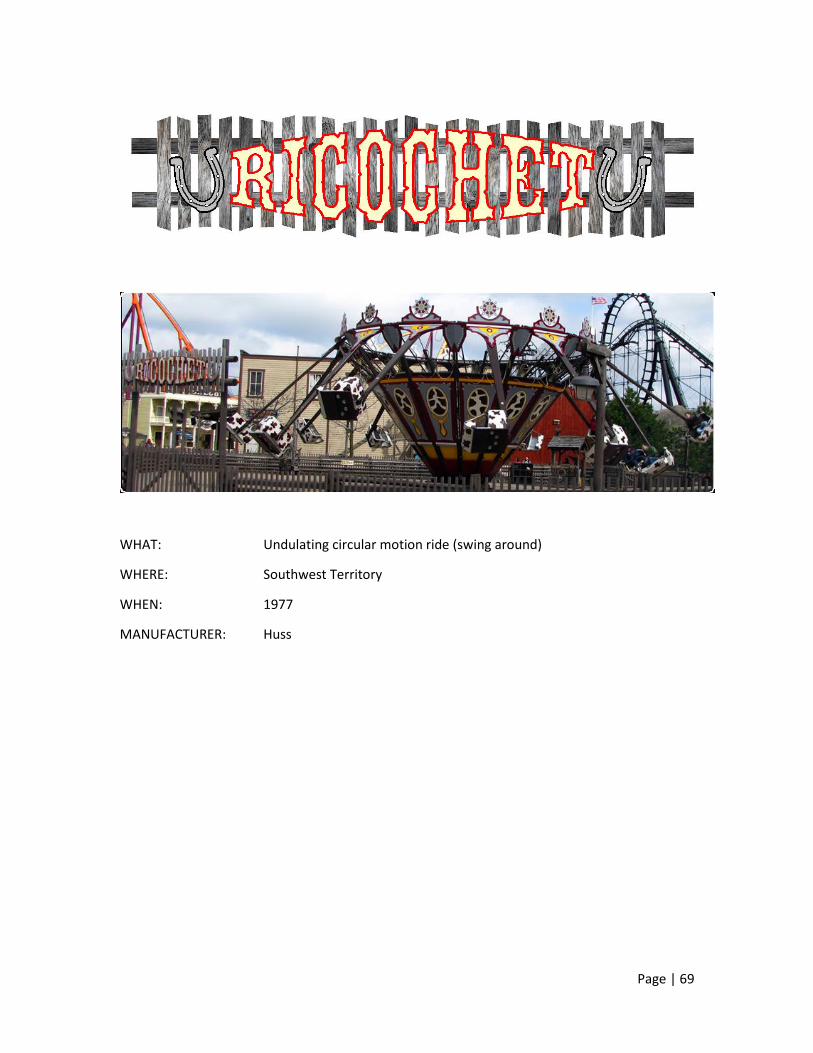
TYPE OF RIDE: Undulating dual axis turning ride
WHERE: County Fair
OPENED: 1976
MANUFACTURER: Schwartzkopf
Page | 64
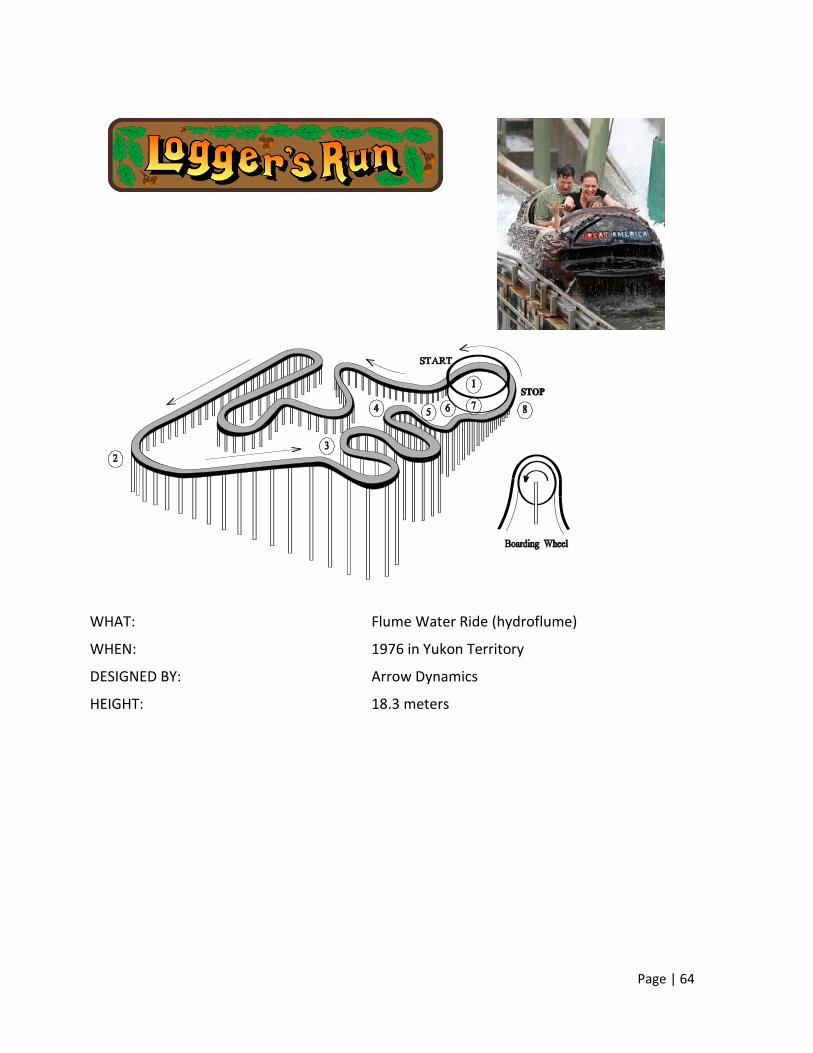
WHAT: Flume Water Ride (hydroflume)
WHEN: 1976 in Yukon Territory
DESIGNED BY: Arrow Dynamics
HEIGHT: 18.3 meters
Page | 65
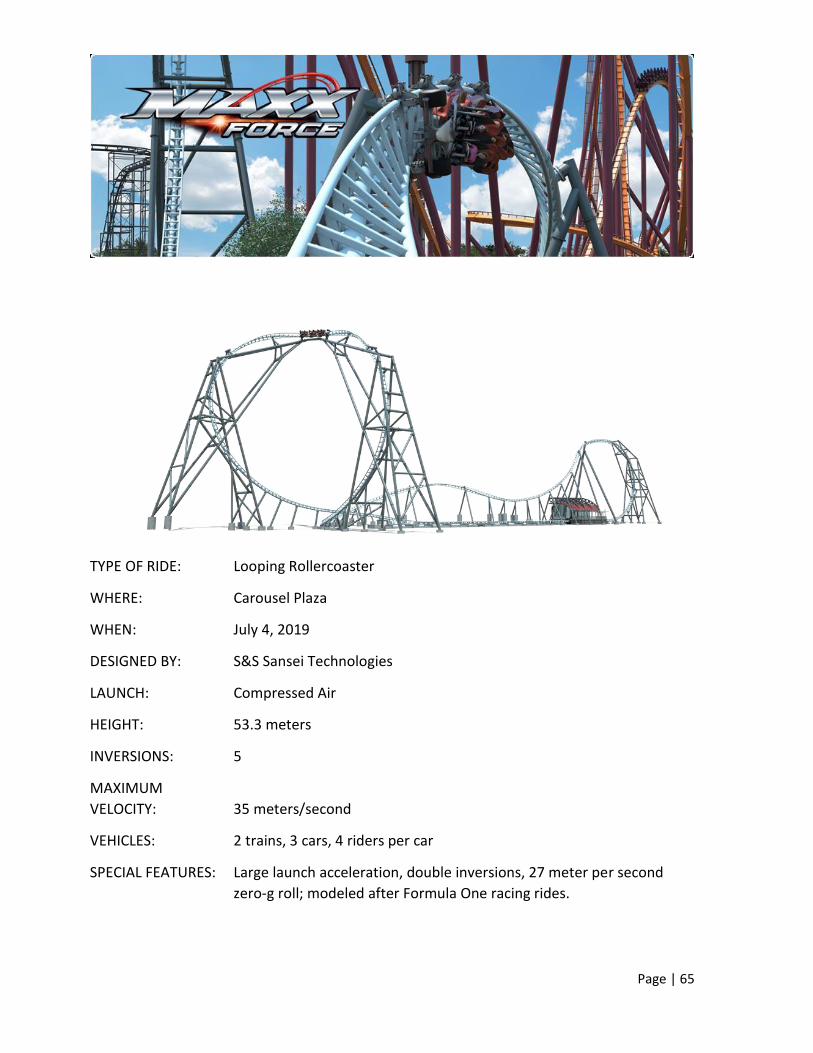
TYPE OF RIDE: Looping Rollercoaster
WHERE: Carousel Plaza
WHEN: July 4, 2019
DESIGNED BY: S&S Sansei Technologies
LAUNCH: Compressed Air
HEIGHT: 53.3 meters
INVERSIONS: 5
MAXIMUM
VELOCITY: 35 meters/second
VEHICLES: 2 trains, 3 cars, 4 riders per car
SPECIAL FEATURES: Large launch acceleration, double inversions, 27 meter per second
zero-g roll; modeled after Formula One racing rides.
Page | 66
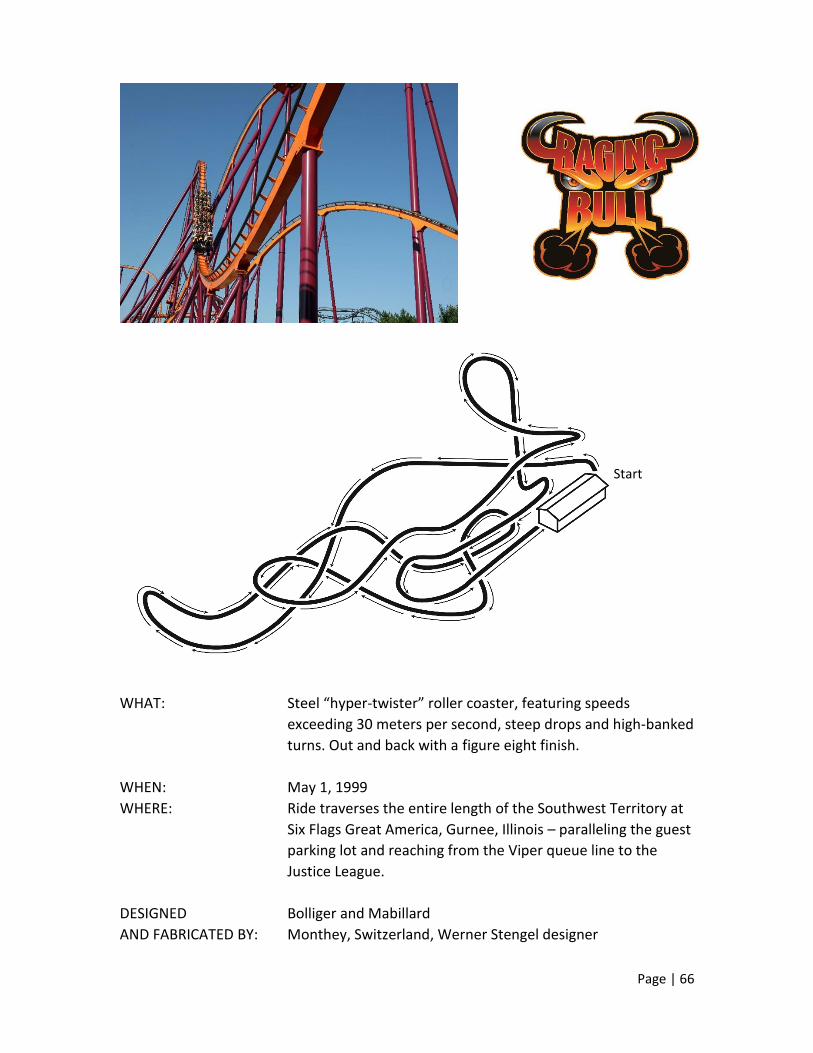
WHAT: Steel “hyper-twister” roller coaster, featuring speeds
exceeding 30 meters per second, steep drops and high-banked
turns. Out and back with a figure eight finish.
WHEN: May 1, 1999
WHERE: Ride traverses the entire length of the Southwest Territory at
Six Flags Great America, Gurnee, Illinois – paralleling the guest
parking lot and reaching from the Viper queue line to the
Justice League.
DESIGNED Bolliger and Mabillard
AND FABRICATED BY: Monthey, Switzerland, Werner Stengel designer
Start
Page | 67
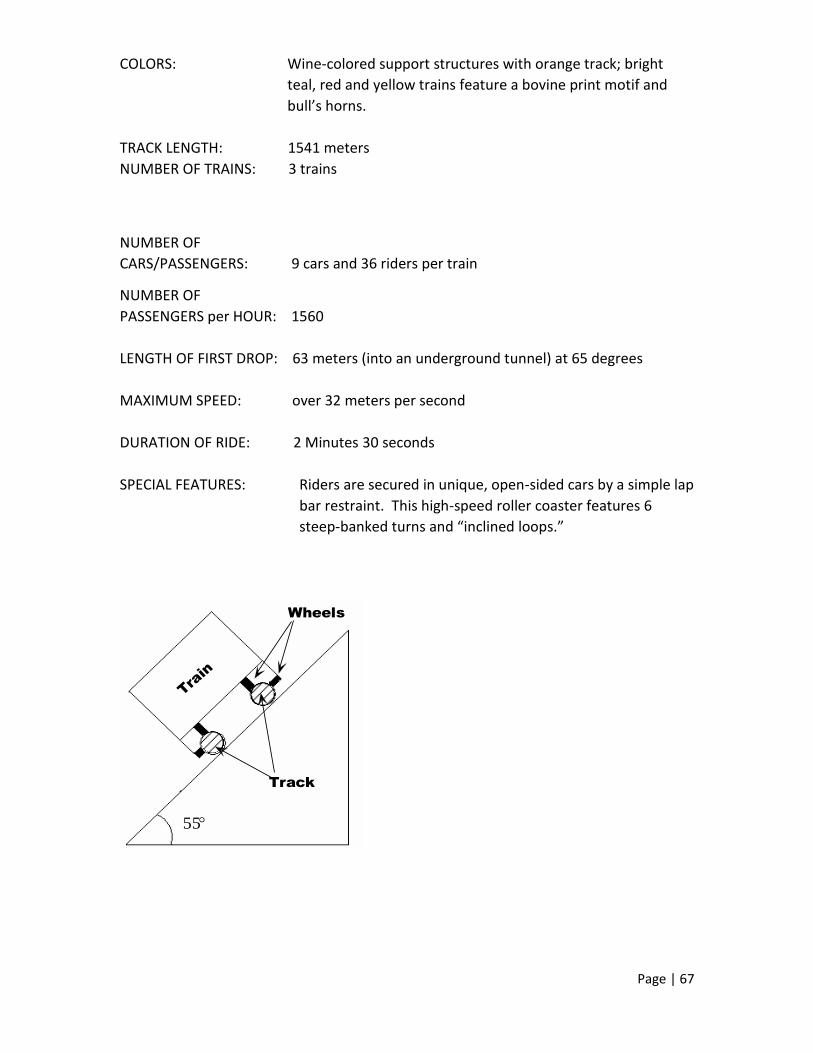
COLORS: Wine-colored support structures with orange track; bright
teal, red and yellow trains feature a bovine print motif and
bull’s horns.
TRACK LENGTH: 1541 meters
NUMBER OF TRAINS: 3 trains
NUMBER OF
CARS/PASSENGERS: 9 cars and 36 riders per train
NUMBER OF
PASSENGERS per HOUR: 1560
LENGTH OF FIRST DROP: 63 meters (into an underground tunnel) at 65 degrees
MAXIMUM SPEED: over 32 meters per second
DURATION OF RIDE: 2 Minutes 30 seconds
SPECIAL FEATURES: Riders are secured in unique, open-sided cars by a simple lap
bar restraint. This high-speed roller coaster features 6
steep-banked turns and “inclined loops.”
Wheels
Track
Tra
in
55
Page | 68
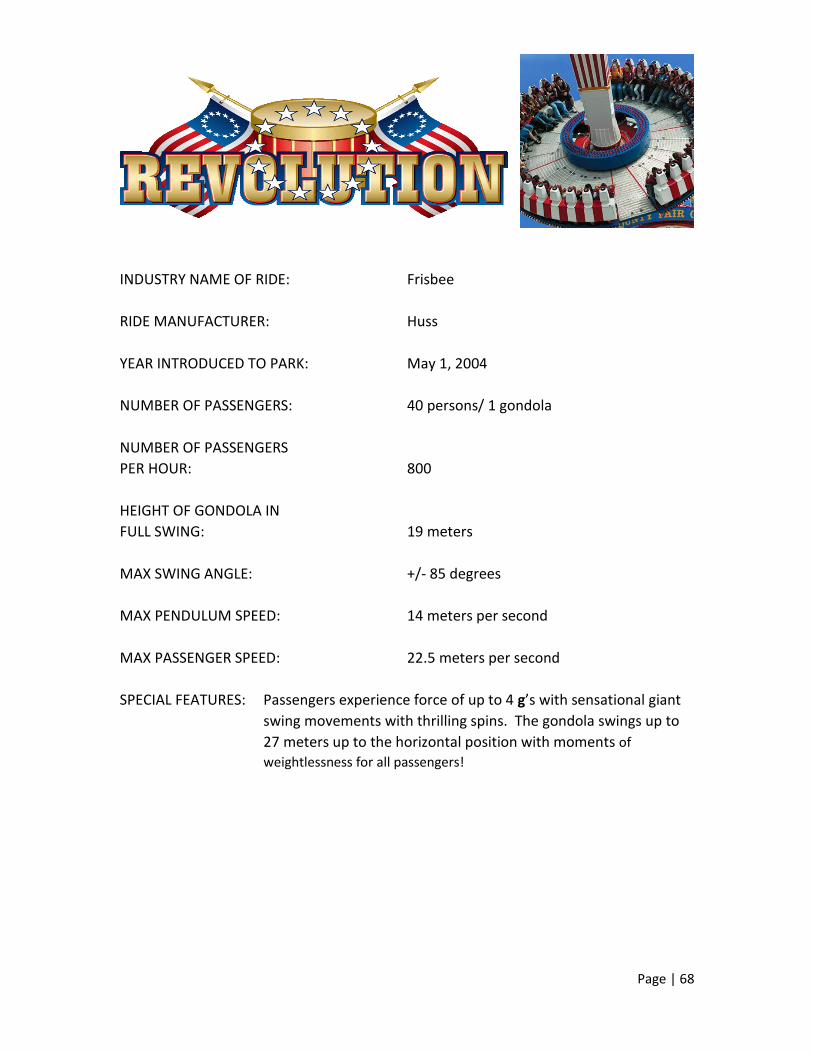
INDUSTRY NAME OF RIDE: Frisbee
RIDE MANUFACTURER: Huss
YEAR INTRODUCED TO PARK: May 1, 2004
NUMBER OF PASSENGERS: 40 persons/ 1 gondola
NUMBER OF PASSENGERS
PER HOUR: 800
HEIGHT OF GONDOLA IN
FULL SWING: 19 meters
MAX SWING ANGLE: +/- 85 degrees
MAX PENDULUM SPEED: 14 meters per second
MAX PASSENGER SPEED: 22.5 meters per second
SPECIAL FEATURES: Passengers experience force of up to 4 g’s with sensational giant
swing movements with thrilling spins. The gondola swings up to
27 meters up to the horizontal position with moments of
weightlessness for all passengers!
Page | 69
WHAT: Undulating circular motion ride (swing around)
WHERE: Southwest Territory
WHEN: 1977
MANUFACTURER: Huss
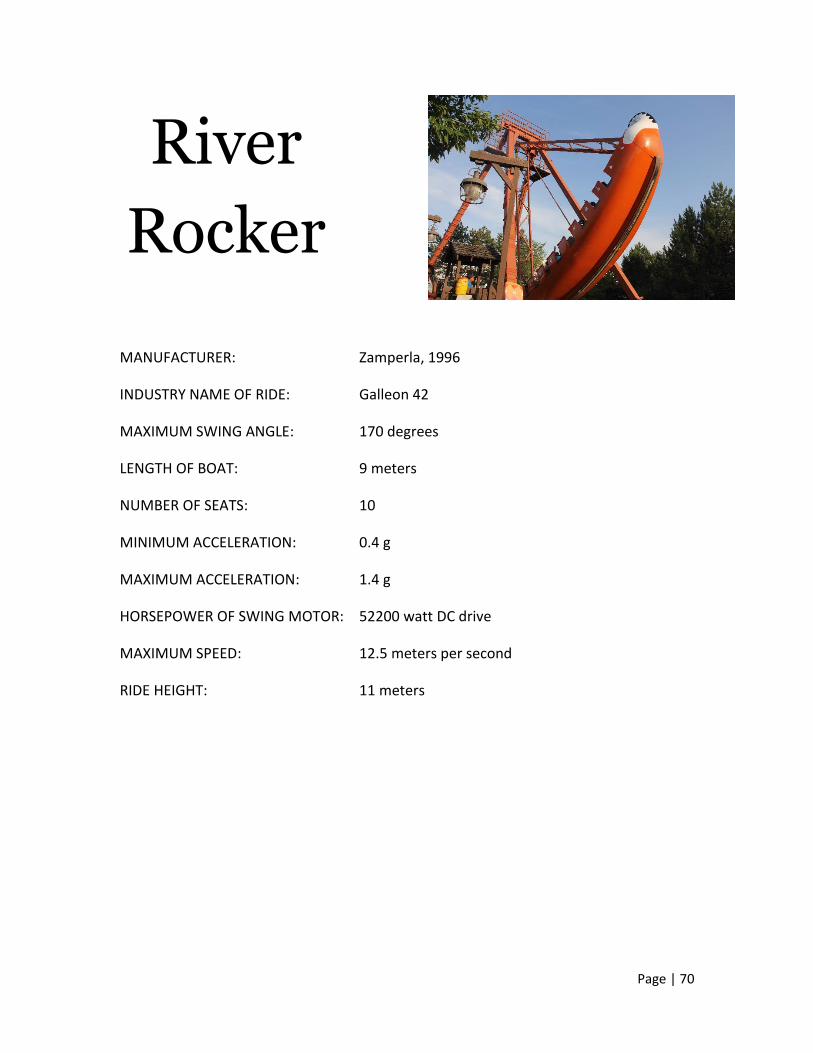
Page | 70
MANUFACTURER: Zamperla, 1996
INDUSTRY NAME OF RIDE: Galleon 42
MAXIMUM SWING ANGLE: 170 degrees
LENGTH OF BOAT: 9 meters
NUMBER OF SEATS: 10
MINIMUM ACCELERATION: 0.4 g
MAXIMUM ACCELERATION: 1.4 g
HORSEPOWER OF SWING MOTOR: 52200 watt DC drive
MAXIMUM SPEED: 12.5 meters per second
RIDE HEIGHT: 11 meters
River
Rocker
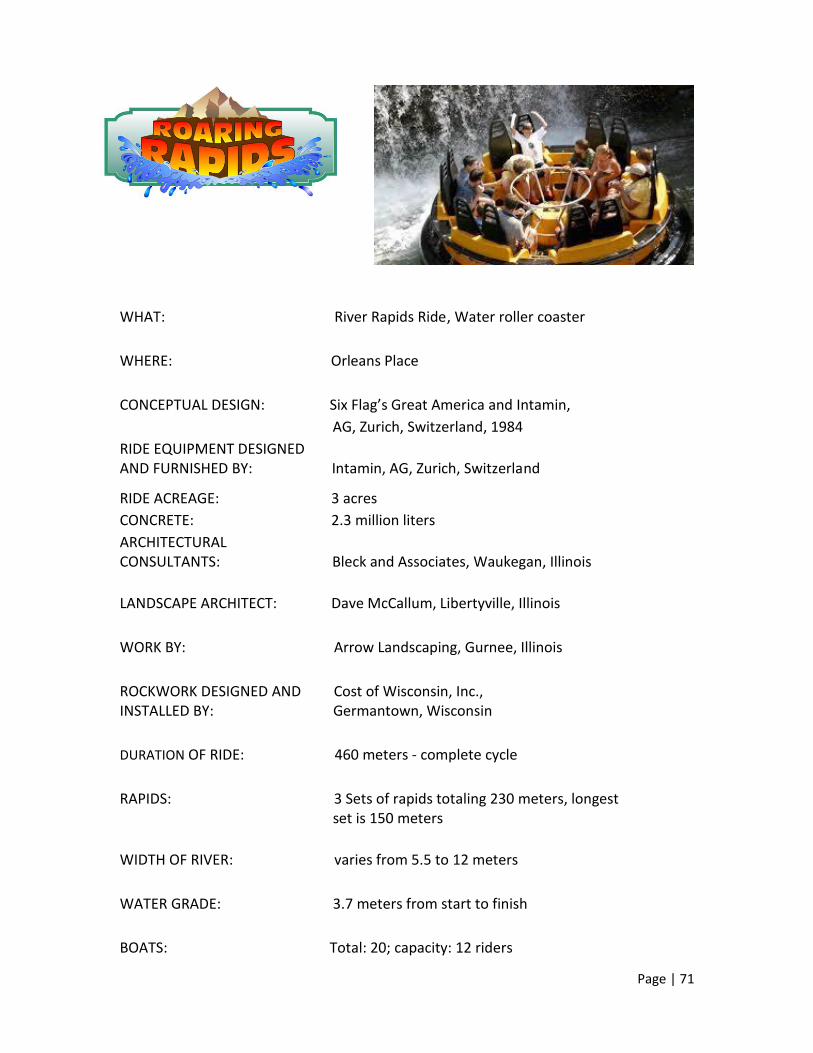
Page | 71
WHAT: River Rapids Ride, Water roller coaster
WHERE: Orleans Place
CONCEPTUAL DESIGN: Six Flag’s Great America and Intamin,
AG, Zurich, Switzerland, 1984
RIDE EQUIPMENT DESIGNED AND FURNISHED BY: Intamin, AG, Zurich, Switzerland
RIDE ACREAGE: 3 acres
CONCRETE: 2.3 million liters
ARCHITECTURAL CONSULTANTS: Bleck and Associates, Waukegan, Illinois
LANDSCAPE ARCHITECT: Dave McCallum, Libertyville, Illinois
WORK BY: Arrow Landscaping, Gurnee, Illinois
ROCKWORK DESIGNED AND Cost of Wisconsin, Inc., INSTALLED BY: Germantown, Wisconsin
DURATION OF RIDE: 460 meters - complete cycle
RAPIDS: 3 Sets of rapids totaling 230 meters, longest set is 150 meters
WIDTH OF RIVER: varies from 5.5 to 12 meters
WATER GRADE: 3.7 meters from start to finish
BOATS: Total: 20; capacity: 12 riders
Page | 72
Size: 4 meters in diameter
RIDE CAPACITY: Approximately 2,000 guests per hour
DURATION OF RIDE: Approximately 5 minutes
WATER PUMPS: 5 main pumps – 130,500 watts each 5 auxiliary pumps – 127,000 watts total
WATER USAGE: Capacity: 4.54 million liters with 680,000 liters pumped
per minute. All water for the ride is recirculated.
BOAT PROPULSION: Boats are free-floating and propelled only by the flow of
the river.
SPECIAL EFFECTS: 2 wave makers – 18700 watts each
One 37 meter tunnel with special light, sound, and
animated effects.
3 waterfall complexes
HIGHLIGHTS: First River rapids ride in United States to use a turntable
loading station.
Landscape artistically designed to resemble Natural River
using native grasses, wildflowers, and over 1,400 trees
and shrubs.
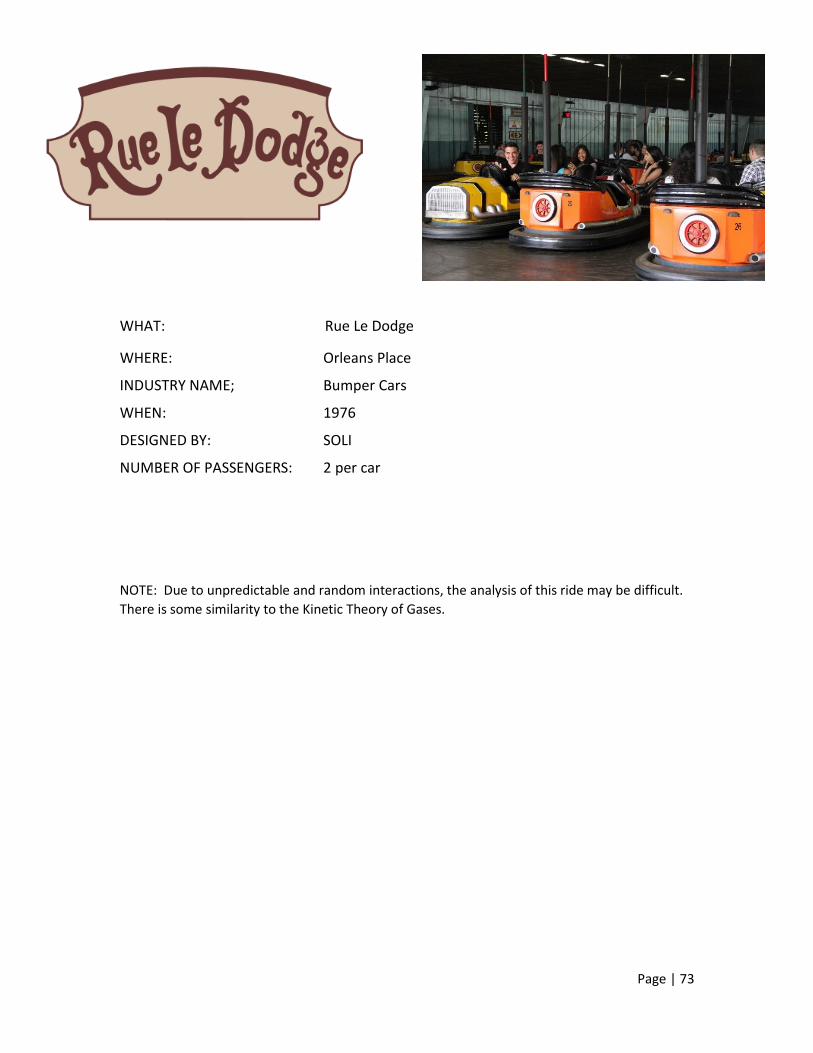
Page | 73
WHAT: Rue Le Dodge
WHERE: Orleans Place
INDUSTRY NAME; Bumper Cars
WHEN: 1976
DESIGNED BY: SOLI
NUMBER OF PASSENGERS: 2 per car
NOTE: Due to unpredictable and random interactions, the analysis of this ride may be difficult.
There is some similarity to the Kinetic Theory of Gases.
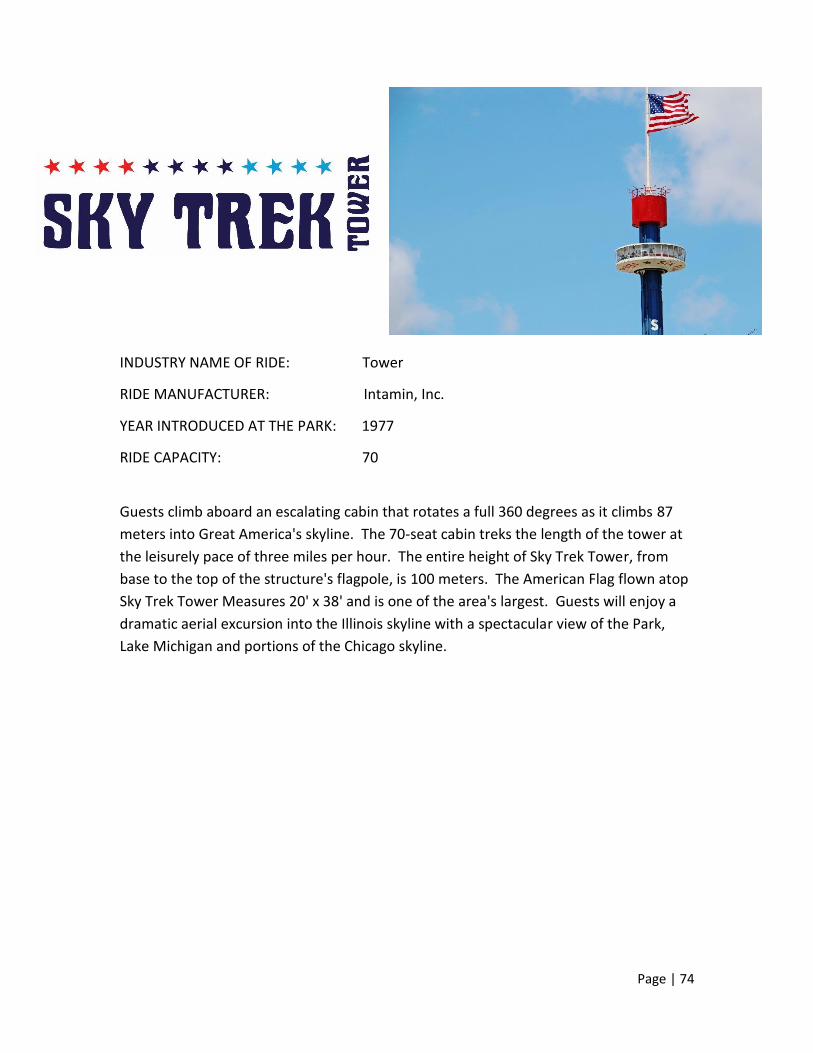
Page | 74
INDUSTRY NAME OF RIDE: Tower
RIDE MANUFACTURER: Intamin, Inc.
YEAR INTRODUCED AT THE PARK: 1977
RIDE CAPACITY: 70
Guests climb aboard an escalating cabin that rotates a full 360 degrees as it climbs 87
meters into Great America's skyline. The 70-seat cabin treks the length of the tower at
the leisurely pace of three miles per hour. The entire height of Sky Trek Tower, from
base to the top of the structure's flagpole, is 100 meters. The American Flag flown atop
Sky Trek Tower Measures 20' x 38' and is one of the area's largest. Guests will enjoy a
dramatic aerial excursion into the Illinois skyline with a spectacular view of the Park,
Lake Michigan and portions of the Chicago skyline.
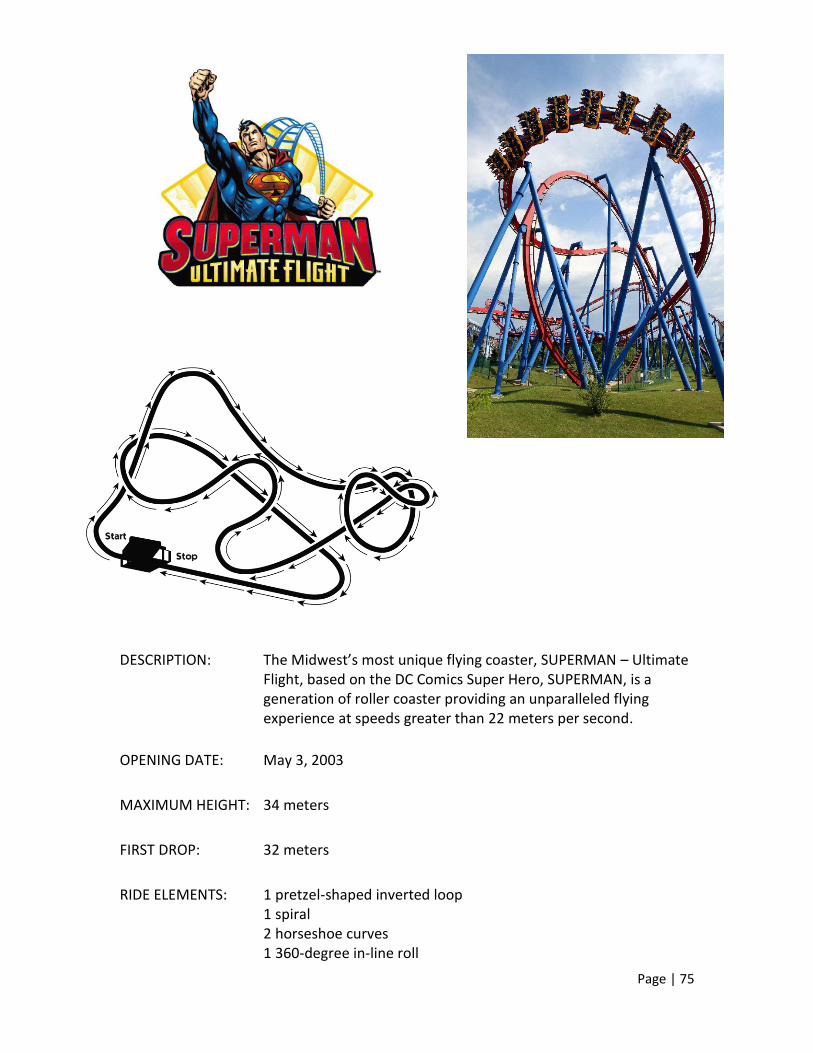
Page | 75
DESCRIPTION: The Midwest’s most unique flying coaster, SUPERMAN – Ultimate
Flight, based on the DC Comics Super Hero, SUPERMAN, is a generation of roller coaster providing an unparalleled flying experience at speeds greater than 22 meters per second.
OPENING DATE: May 3, 2003
MAXIMUM HEIGHT: 34 meters
FIRST DROP: 32 meters
RIDE ELEMENTS: 1 pretzel-shaped inverted loop 1 spiral 2 horseshoe curves 1 360-degree in-line roll
Page | 76
2 inversions RIDE FEATURES: A pretzel-shaped, inverted loop where trains climb to the top of
the figure and dive into the loop traveling amazingly close to the ground heightening the feeling of flying.
A sequence of thrilling curves and dives that includes a highly inclined “horseshoe” curve and high-speed spiral.
A 360-degree, in-line roll will surprise guests just before entering
the station. TRACK LENGTH: 853 meters of twisting, looping blue, red, and yellow steel RIDE TIME: Nearly 3 minutes VEHICLES: Two sleek trains specially designed to carry 32 passengers FLYING
four abreast. SAFETY SYSTEMS: Computer controlled fail-safe brakes and padded shoulder/breast
harnesses and lap bars assure proper ride safety and comfort. CAPACITY: 1,100 riders per hour MANUFACTURER: Bolliger & Mabillard of Monthey, Switzerland
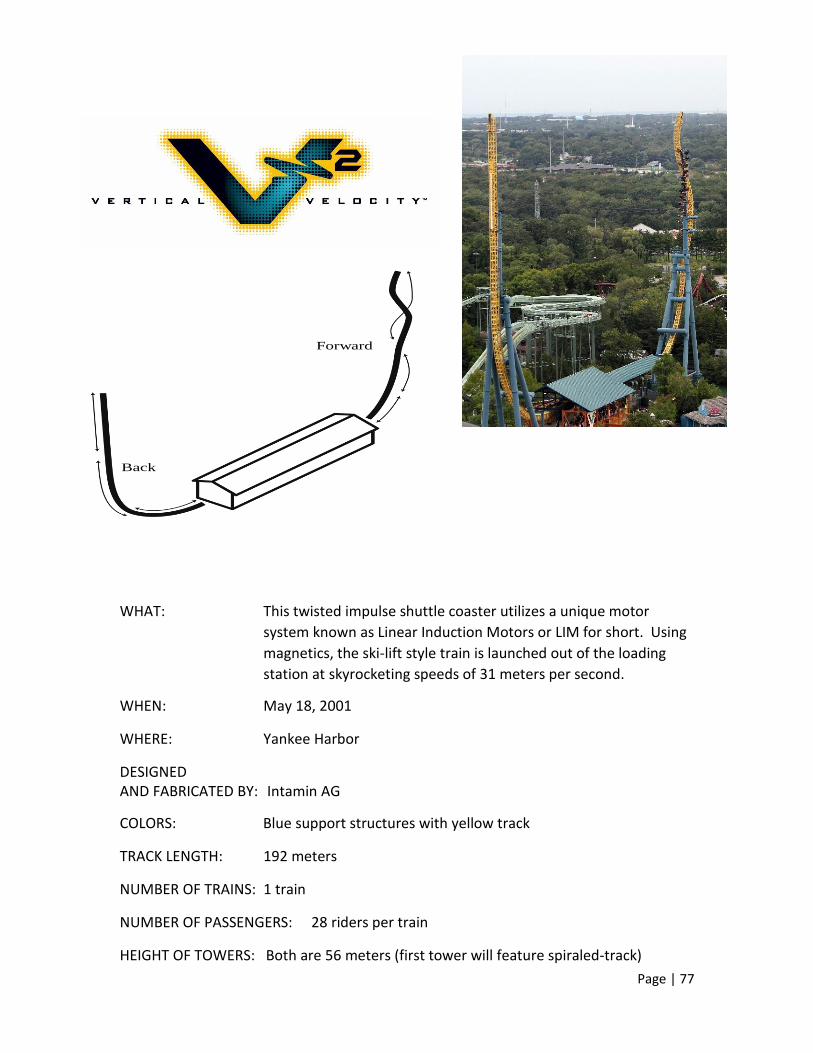
Page | 77
WHAT: This twisted impulse shuttle coaster utilizes a unique motor
system known as Linear Induction Motors or LIM for short. Using
magnetics, the ski-lift style train is launched out of the loading
station at skyrocketing speeds of 31 meters per second.
WHEN: May 18, 2001
WHERE: Yankee Harbor
DESIGNED AND FABRICATED BY: Intamin AG
COLORS: Blue support structures with yellow track
TRACK LENGTH: 192 meters
NUMBER OF TRAINS: 1 train
NUMBER OF PASSENGERS: 28 riders per train
HEIGHT OF TOWERS: Both are 56 meters (first tower will feature spiraled-track)
Forward
Back

Page | 78
MAXIMUM SPEED: 31 meters per second
SPECIAL FEATURES: The U-shaped track and spiraled first tower will take riders on a
one-of-kind journey.
DURATION OF RIDE: 45 seconds
CAPACITY: 720 guests per hour
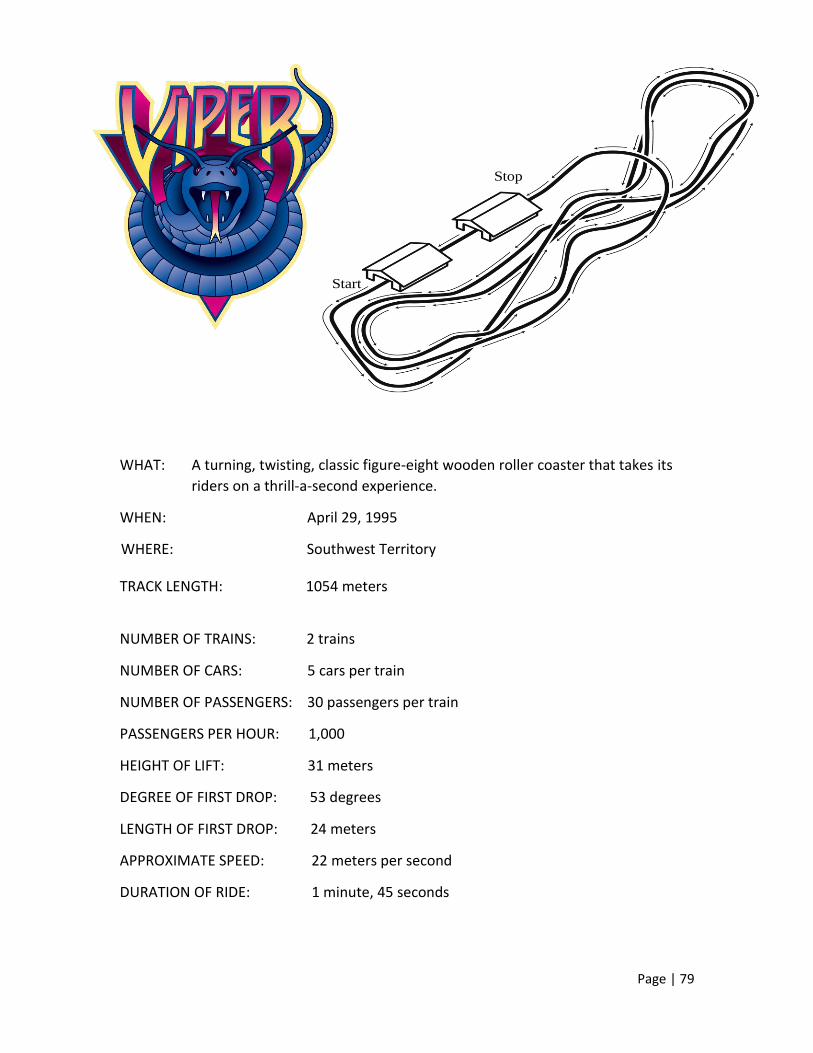
Page | 79
Start
Stop
WHAT: A turning, twisting, classic figure-eight wooden roller coaster that takes its
riders on a thrill-a-second experience.
WHEN: April 29, 1995
WHERE: Southwest Territory
TRACK LENGTH: 1054 meters
NUMBER OF TRAINS: 2 trains
NUMBER OF CARS: 5 cars per train
NUMBER OF PASSENGERS: 30 passengers per train
PASSENGERS PER HOUR: 1,000
HEIGHT OF LIFT: 31 meters
DEGREE OF FIRST DROP: 53 degrees
LENGTH OF FIRST DROP: 24 meters
APPROXIMATE SPEED: 22 meters per second
DURATION OF RIDE: 1 minute, 45 seconds
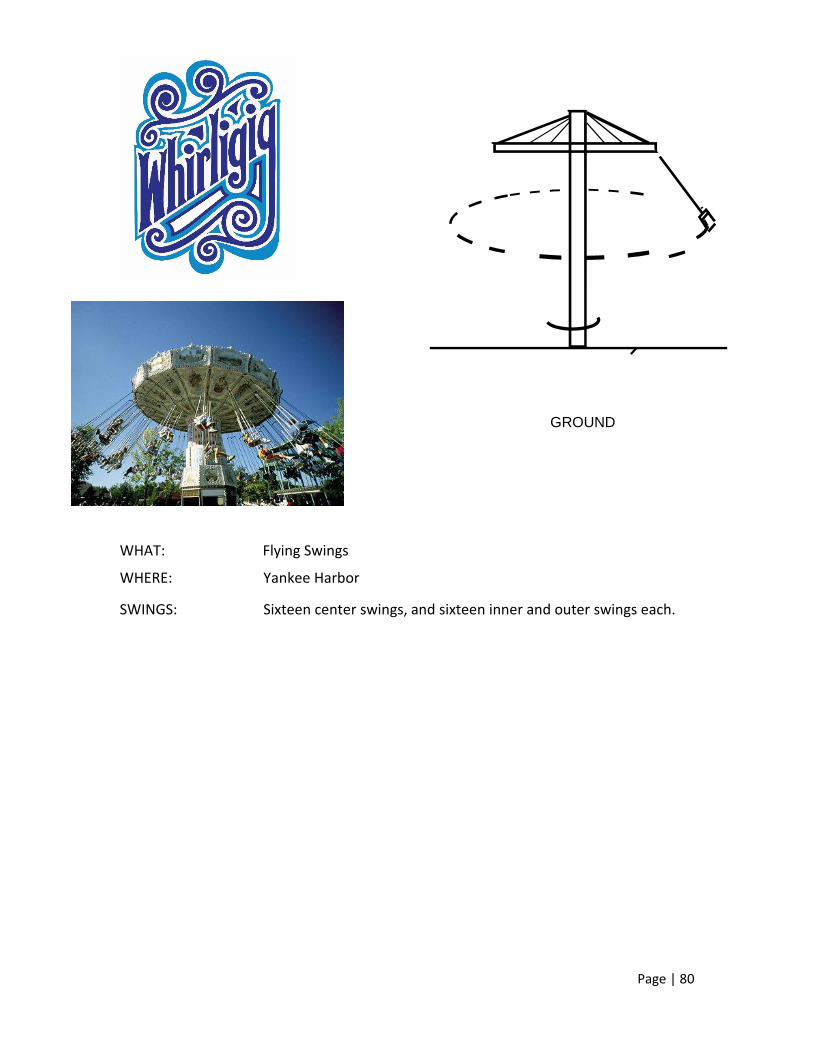
Page | 80
WHAT: Flying Swings
WHERE: Yankee Harbor
SWINGS: Sixteen center swings, and sixteen inner and outer swings each.
GROUND
Page | 81
DESCRIPTION: Steel roller coaster (also known as Speed Racer or Extended Jumbo Jet) PREMIERED: May 29, 1976 WHERE: Hometown Square MAXIMUM HEIGHT: 21 meters MAXIMUM SPEED: 19 meters/second LENGTH OF TRACK: 940 meters NUMBER OF TRAINS: Three trains NUMBER OF CARS: Four cars per train NUMBER OF PASSENGERS: 6 passengers per car

Page | 82
NUMBER OF GUESTS PER HOUR: 1,620 guests per hour DURATION OF RIDE: 2 minutes MANUFACTURER: Anton Schwarzkopf, West Germany; Werner Stengel designer
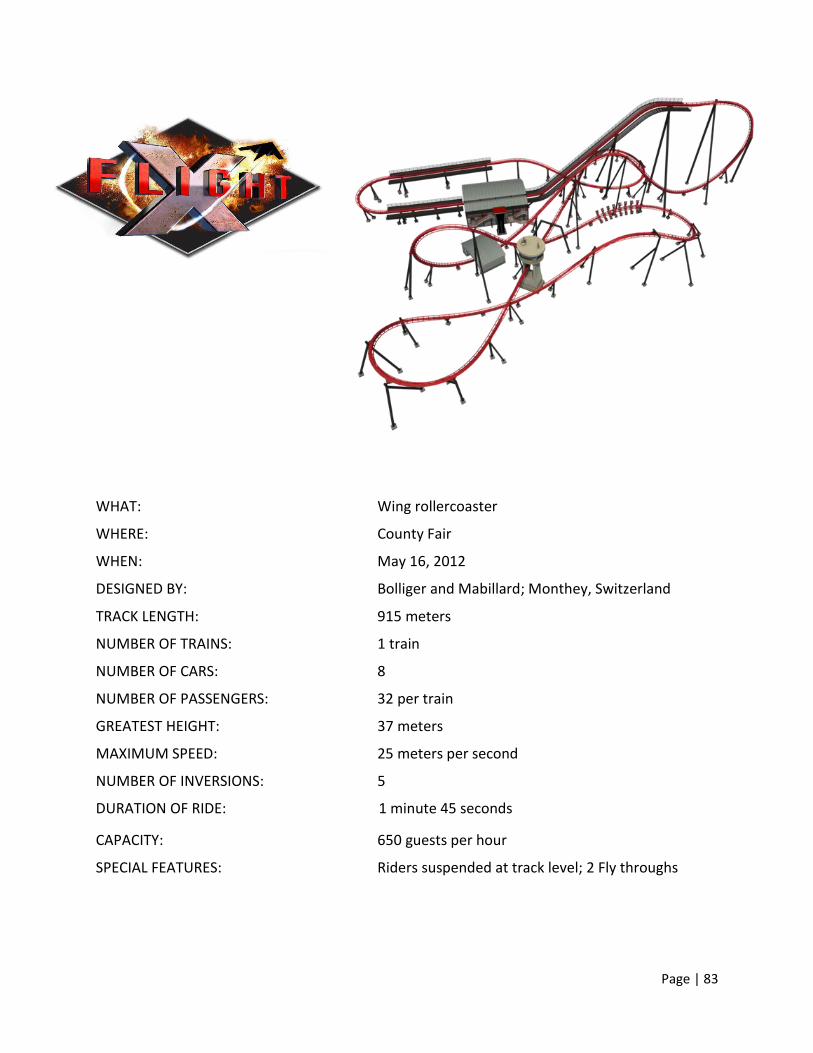
Page | 83
WHAT: Wing rollercoaster
WHERE: County Fair
WHEN: May 16, 2012
DESIGNED BY: Bolliger and Mabillard; Monthey, Switzerland
TRACK LENGTH: 915 meters
NUMBER OF TRAINS: 1 train
NUMBER OF CARS: 8
NUMBER OF PASSENGERS: 32 per train
GREATEST HEIGHT: 37 meters
MAXIMUM SPEED: 25 meters per second
NUMBER OF INVERSIONS: 5
DURATION OF RIDE: 1 minute 45 seconds
CAPACITY: 650 guests per hour
SPECIAL FEATURES: Riders suspended at track level; 2 Fly throughs
Page | 84
AMUSEMENT PARK PHYSICS RESOURCE LIST
Selected Bibliography A more detailed review of literature and bibliography is in the Amusement Park Physics: A Teacher’s
Guide, Second Edition by Nathan A. Unterman, listed below.
ARTICLES FROM PERIODICALS
Bartlett, Albert A., "Which Way is ‘UP’ or the ‘Force of Gravity’ in Some Simple Accelerated Systems."
The Physics Teacher, Volume 10, Number 8, pp. 429-437. November 1972.
Article on defining frames of reference.
Escobar, Carole, "Amusement Park Physics," The Physics Teacher, Volume 28 pp. 446-453. October 1990.
Excellent background source for teachers.
Exploratorium Quarterly, Volume 11, Issue 2. Summer 1987 (entire issue).
This has a broad review of the science and talks of illusions in the carnival area.
Jones, Christopher, "What a Blast," Compressed Air, Volume 103, Number 6, pp. 22-29. September 1998.
The only review to date of a new kind of thrill ride that runs on compressed air.
McGehee, John, "Physics Students’ Day at Six Flags/Magic Mountain," The Physics Teacher, Volume 26,
Number 1, pp. 12-17, January 1988.
Description of Physics Day at Six Flags/Magic Mountain.
Natale, Kim "Final Exam in an Amusement Park" The Physics Teacher 23, no. 4 (1985): 228
Roeder, John L., "Physics and the Amusement Park," The Physics Teacher, Volume 13, Number 6, pp.
327-332. September 1975.
Discussion of field trip and some science of the amusement park.
Summers, Carolyn, and Howard Jones "Roller Coaster Science" Science and Children 21, no. 2 (Oct. 1983): 2-14
Taylor, George, Joseph Page, Murray Bentley, and Diana Lossner "A Physics Laboratory at Six Flags Over
Georgia" The Physics Teacher 22, no. 6 (September 1984): 361-367
Walker, Jean, "The Amateur Scientist," Scientific American, Volume 249, Number 4, pp. 162-169.
October 1983.
An excellent non-mathematical article detailing the physics of many rides.
Page | 85
BOUND MATERIALS
Anderson, Norman, Ferris Wheels: An Illustrated History, Bowling Green State University Popular Press,
1992. ISBN 978-0879725327.
An outstanding scholarly work on the history and construction of Ferris Wheels. Includes
numerous references, patent drawings, etc.
Bakken, Clarence, Amusement Park Physics, 2nd Edition, Amusement Park Physics Handbook Committee,
American Association of Physics Teachers, College Park, MD. 2011.
This is an excellent update to Carole Escobar’s book (below). It has an excellent section on
electronic accelerometers. ISBN 978-1931024129
Cartmell, Robert, The Incredible Scream Machine: A History of the Roller Coaster, Amusement Park
Books, Inc., Fairview Park, OH 44126. 1987. ISBN 978-0879723415.
History and construction of roller coasters. Some engineering notes.
Escobar, Carole, editor, Amusement Park Physics Handbook, Amusement Park Physics Handbook
Committee, American Association of Physics Teachers, College Park, MD. 1989. ISBN 978-0917853539.
Major resource for teachers. Includes activities and The Physics Teacher article reprints.
Gryczan, Matthew, Carnival Secrets. How to Win at Carnival Games, Which Games to Avoid, How to
Make Your Own Games, Piccadilly Books, Colorado Springs, CO, 1993. ISBN 978-0941599248.
Outstanding paperback that discusses the science, probability, and construction of carnival
games. Some can be easily made into physics labs.
Mangels, William F., The Outdoor Amusement Industry: From Earliest Times to the Present, 1952. Library
of Congress Catalog Card Number: 52-13299.
History of amusement parks and carnivals.
Munch, Richard, Harry G. Traver: Legends of Terror, Amusement Park Books, Mentor, OH. 1982.
ISBN 0-935408-02-9
Biographical information about a roller coaster designer. Contains track layouts.
Unterman, Nathan A., Amusement Park Physics: A Teacher’s Guide, Second Edition; J. Weston Walch,
Publisher, Portland, ME. ©2001. ISBM 978-0825142644.
Major resource for teachers. Includes question bank, activities, and background.
SOFTWARE
There are several design programs on the market. Most are accurate, but do not indicate to the student
how the result numbers are calculated. This limits the instructional usefulness of these programs.
Page | 86
VIDEOS
Scientific American Frontiers – The World of Science with Woody Flowers, PBS, 8:00 p.m., October 10,
1990
America Screams, Hosted by Vincent Price. Rhino Home Video, RNVD 1419, 1987
NOVA: Roller Coaster! NOVA Season 21, PBS WGW706, November 1993
**Video analysis software is available from many sources. Search, video analysis software.
**There are many videos on YouTube and other places on the Internet. Care should be taken in
selecting these, as many do not treat the science and engineering accurately.
SUPPLIERS
Pasco Scientific
10101 Foothills Blvd. Roseville, CA 95747-7100
800-772-8700
http://www.pasco.com/
Vernier Software & Technology
13979 SW Millikan Way
Beaverton, OR 97005-2886
888-277-2440
http://www.vernier.com/
K'Nex® Industries, Inc.
P.O. Box 700
Hatfield, PA 19440-0700
http://www.knex.com/knex-education/
Amusement Park models and kits
800-543-5639