Survey Management - Safe Supportive...
48
Survey Management Kimberly Kendziora, Ph.D., American Institutes for Research Chris Boccanfuso, Ph.D., Child Trends
-
Upload
duongxuyen -
Category
Documents
-
view
214 -
download
0
Transcript of Survey Management - Safe Supportive...

Survey Management
Kimberly Kendziora, Ph.D., American Institutes for Research
Chris Boccanfuso, Ph.D., Child Trends
The Safe and Supportive Schools Technical Assistance Center
Funded by the U.S. Department of Education’s Office of Safe
and Drug-Free Schools.
Provides training and support to states, including 11 grantees
funded under the Safe and Supportive Schools Program and
other state administrators; administrators of districts and
schools; teachers; support staff at schools; communities and
families; and students.
Goal is to improve school’s conditions for learning through
measurement and program implementation, so that all students
have the opportunity to realize academic success in safe and
supportive environments.
*The content of this presentation was prepared under a contract from the U.S. Department of
Education, Office of Safe and Drug-Free Schools to the American Institutes for Research (AIR).
This presentation does not necessarily represent the policy or views of the U.S. Department of
Education, nor do they imply endorsement by the U.S. Department of Education.
Page 2
Webinar Objectives
Page 3
Participants will learn about how to:
- Develop surveys and administration plans that are consistent with program
objectives and strategies
- Promote engagement and support among school community stakeholders
- Conduct data collection effectively and ensure data quality
- Support relevant and useful findings and reporting for multiple stakeholders
Future Webinars
Future webinars will cover the following topics in greater detail:
- Survey development (March 30 and 31)
- Survey administration (April 27 and 28)
- Analysis of survey data (May 25 and 26)
- Reporting and dissemination (June 29 and 30)
Page 4
Page 5
Agenda / Table of Contents
Developing meaningful surveys
Who should be surveyed?
Considerations in designing a survey
Involving stakeholders
Survey operations
1
2
3
4
5
Analysis, reporting, and data use6

Developing Surveys
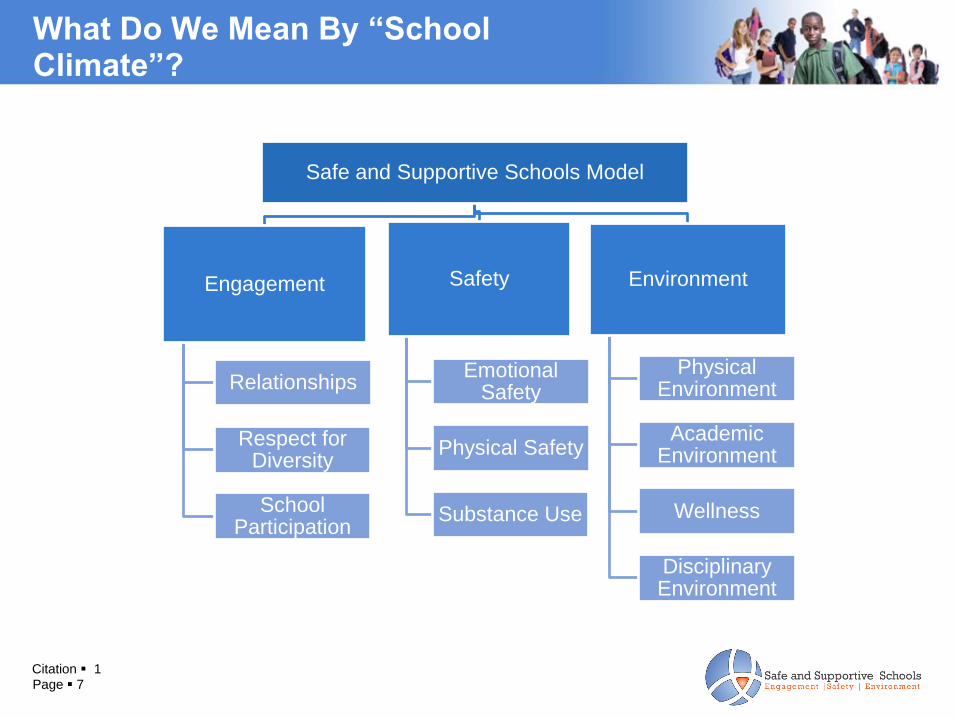
What Do We Mean By “School Climate”?
Page 7
Safe and Supportive Schools Model
Engagement
Relationships
Respect for Diversity
School Participation
Safety
Emotional Safety
Physical Safety
Substance Use
Environment
Physical Environment
Academic Environment
Wellness
Disciplinary Environment
Citation 1
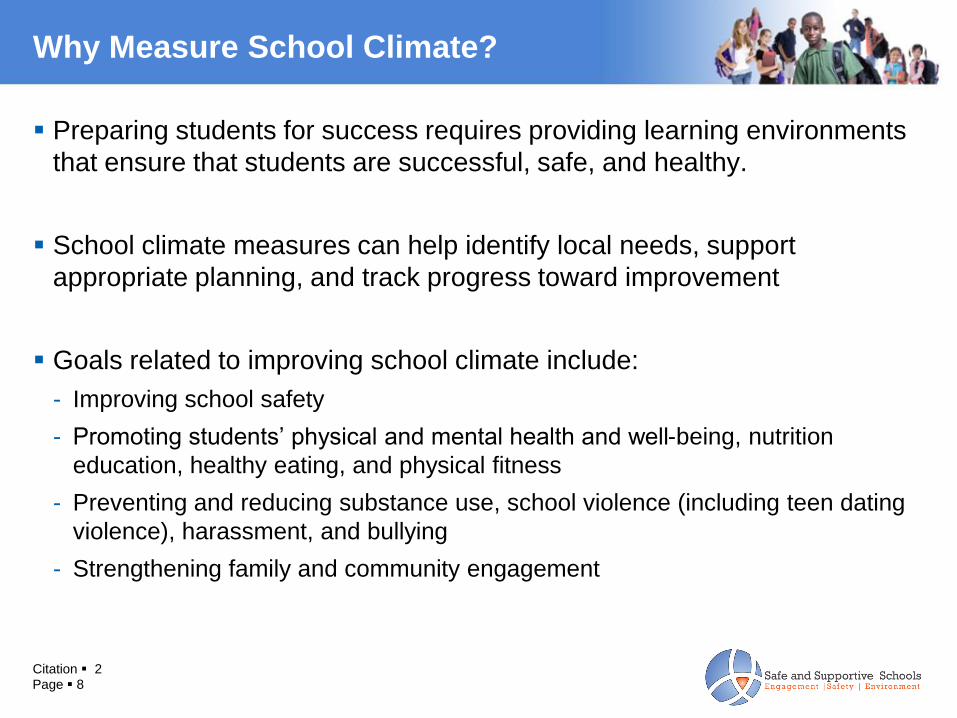
Why Measure School Climate?
Preparing students for success requires providing learning environments
that ensure that students are successful, safe, and healthy.
School climate measures can help identify local needs, support
appropriate planning, and track progress toward improvement
Goals related to improving school climate include:
- Improving school safety
- Promoting students’ physical and mental health and well-being, nutrition
education, healthy eating, and physical fitness
- Preventing and reducing substance use, school violence (including teen dating
violence), harassment, and bullying
- Strengthening family and community engagement
Page 8Citation 2
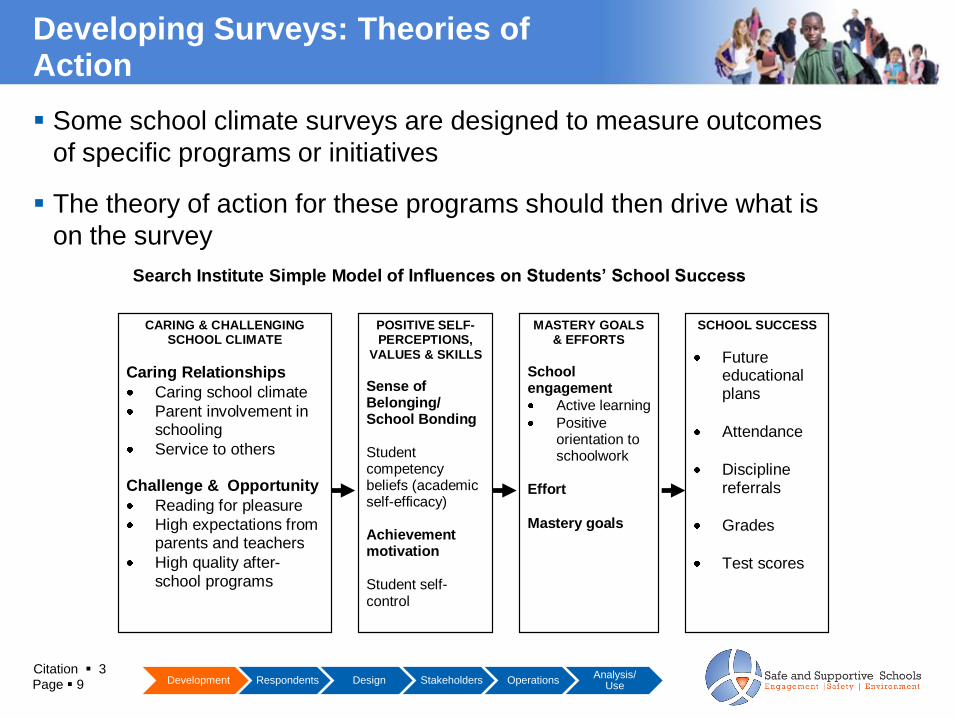
Developing Surveys: Theories of Action
Some school climate surveys are designed to measure outcomes
of specific programs or initiatives
The theory of action for these programs should then drive what is
on the survey
Page 9 Development Respondents Design Stakeholders OperationsAnalysis/
Use
Citation 3
Search Institute Simple Model of Influences on Students’ School Success
CARING & CHALLENGING SCHOOL CLIMATE
Caring Relationships
Caring school climate
Parent involvement in schooling
Service to others Challenge & Opportunity
Reading for pleasure
High expectations from parents and teachers
High quality after-school programs
POSITIVE SELF- PERCEPTIONS,
VALUES & SKILLS Sense of Belonging/ School Bonding Student competency beliefs (academic self-efficacy) Achievement motivation Student self-control
MASTERY GOALS & EFFORTS
School engagement
Active learning
Positive orientation to schoolwork
Effort
Mastery goals
SCHOOL SUCCESS
Future educational plans
Attendance
Discipline referrals
Grades
Test scores
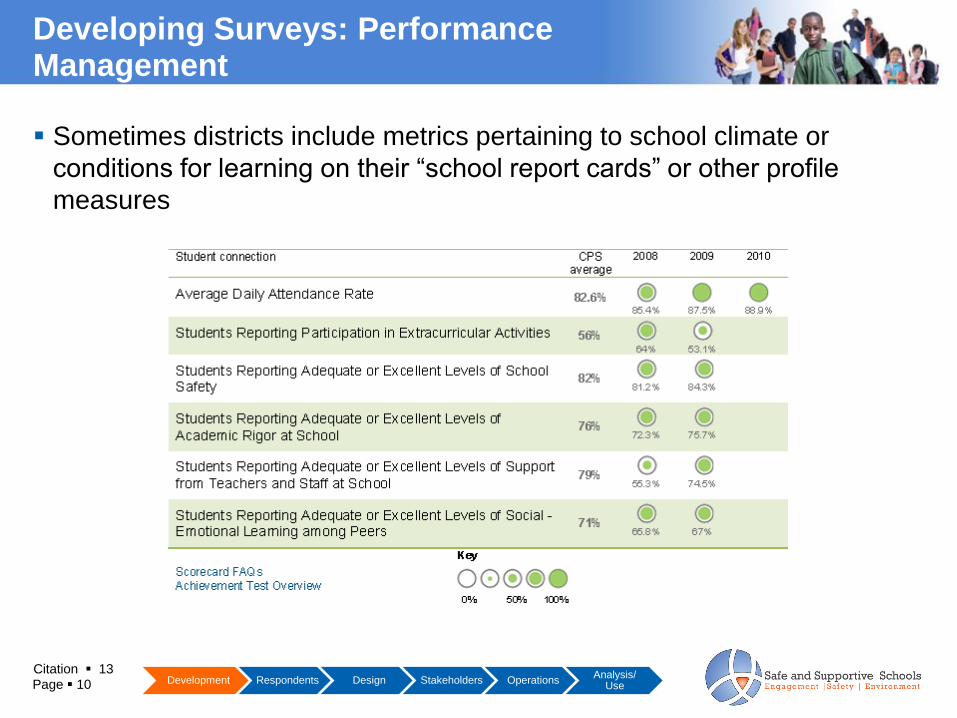
Developing Surveys: Performance Management
Sometimes districts include metrics pertaining to school climate or
conditions for learning on their “school report cards” or other profile
measures
Page 10 Development Respondents Design Stakeholders OperationsAnalysis/
Use
Citation 13
Developing Surveys From Other Surveys
Regardless of your survey’s purpose or the specific concepts you will be
including, the items you use often can come from prior instruments
It is a good idea to ensure that any other instruments you draw from are
reliable and valid
Sources include:
- The Centers for Disease Control: Measuring Violence-Related Attitudes,
Behaviors, and Influences Among Youths: A Compendium of Assessment Tools
http://www.cdc.gov/ncipc/pub-res/measure.htm
- Surveys conducted by the National Center for Education Statistics, including the
Crime and Safety Survey, Schools and Staffing Survey, and several longitudinal
education surveys http://nces.ed.gov/surveys/SurveyGroups.asp?group=1
- Journal articles on school climate
- Other states in your region
Page 11 Development Respondents Design Stakeholders OperationsAnalysis/
Use
Citation 4
Refining Survey Items
Need to understand how the items you’ve selected will work with your
population
Cognitive laboratory testing
- “Think aloud” interviews
- We are interested in what you are thinking when you respond to the statements.
In order to find out what you are thinking, I want you to think out loud as you
answer. In other words, I want you to say out loud everything you say to
yourself silently, when you are thinking.
Pilot testing
- Respondents in the pilot test should include all subgroups likely to participate in
the full operational survey
Page 12 Development Respondents Design Stakeholders OperationsAnalysis/
Use
Citations 4, 5, 6

Who Should Be Surveyed?
Who Should Be Surveyed?
Students
- Student voice important to include in district and school decision-making
- Student perceptions of safety, support, engagement and challenge
Staff
- Staff perceptions about the quality of relationships among adults in a school is
predictive of whether educational reform efforts work to improve student
achievement.
Families
- It can be challenging to reach a truly representative sample of families
- When families are surveyed, special attention to response rates must be paid
- Consider alternative methods of obtaining family perceptions
Page 14 Development Respondents Design Stakeholders OperationsAnalysis/
Use
Citations 7,8
Political affiliations or beliefs of the student or the student’s family
Mental and psychological problems of the student or the student’s family;
Sex behavior or attitudes;
Illegal, anti-social, self-incriminating or demeaning behavior;
Critical appraisals of other individuals with whom respondents have close family relationships;
Legally recognized privileged or analogous relationships, such as those of lawyers, physicians, and ministers;
Religious practices, affiliations, or beliefs of the student or the student’s parent; or,
Income
Student Survey Topics Requiring Family Consent Procedures
Development Respondents Design Stakeholders OperationsAnalysis/
UsePage 15Citation 9
If administration is VOLUNTARY and the survey contains any of the
subjects above…investigators may use PASSIVE consent…
Notify parents* or students who have turned 18 or are emancipated
minors about the survey, including the specific date of its
administration and the types of questions included in the instrument
Provide parents* with an opportunity to inspect the survey instrument
prior to its administration
* or students who have turned 18 or are emancipated minors
Student Surveys and Waivers of Documented Family Consent
Development Respondents Design Stakeholders OperationsAnalysis/
UsePage 16Citation 9
If administration is VOLUNTARY and contains any of the subjects
above…may use PASSIVE consent…
Provide parents* with an opportunity to opt out of participation
Ensure that the administration of the survey is voluntary considering
the “totality of the circumstances
* or students who have turned 18 or are emancipated minors
Student Surveys and Waivers of Documented Family Consent (cont.)
Development Respondents Design Stakeholders OperationsAnalysis/
UsePage 17Citation 9
If administration is REQUIRED and contains any of the subjects
above…must use ACTIVE consent…
Prior written consent of the parent* before administering the survey.
* or students who have turned 18 or are emancipated minors
Student Surveys and Documented Family Consent
Development Respondents Design Stakeholders OperationsAnalysis/
UsePage 18Citation 9
Considerations in Developing a Survey
Considerations in Designing a Survey
Sample versus census
- A census ensures that everyone has a chance to be heard
- A census provides the most accurate and unbiased description of the
population, including subgroups (assuming representative response)
- Samples are less expensive and less burdensome
- Random samples reduce bias as long as follow-up and completion are adequate
Stratified random sampling
- Some sampling procedures generally produce biased results:
Making a survey broadly available and anyone who wants to go out of their
way to take it may do so (for example, including it in a newsletter)
Surveying just those individuals or schools that are easiest to reach
Page 20 Development Respondents Design Stakeholders OperationsAnalysis/
Use
Citations 5, 6
Oversampling and Weighting
For some surveys, it is important to ensure that there are enough
members of a certain subgroup (often 100) so that more reliable estimates
can be reported for that group
A survey that includes an oversample also typically weights the results so
that members in the oversampled group are weighted to their actual
proportion in the population
- This allows for the overall survey results to represent both the national
population and the oversampled subgroup
- Weighting will not “fix” an un-representative sample
Page 21 Development Respondents Design Stakeholders OperationsAnalysis/
Use
Citations 5, 6
Response Rates
The percentage of the sample invited to complete a survey that actually
responds
- Response rates interact with other factors (population size, variability in
responding) to determine the level of confidence you can have in your results
Institute for Education Sciences generally establishes a response rate
target for student or staff surveys of 80%
No agreed-upon target for family surveys
Bias analyses
- Compare responders to non-responders if possible
- Non-responders to voluntary surveys are often individuals at higher risk
- Potentially weight results to account for nonresponse bias
Page 22 Development Respondents Design Stakeholders OperationsAnalysis/
Use
Citations 5, 6
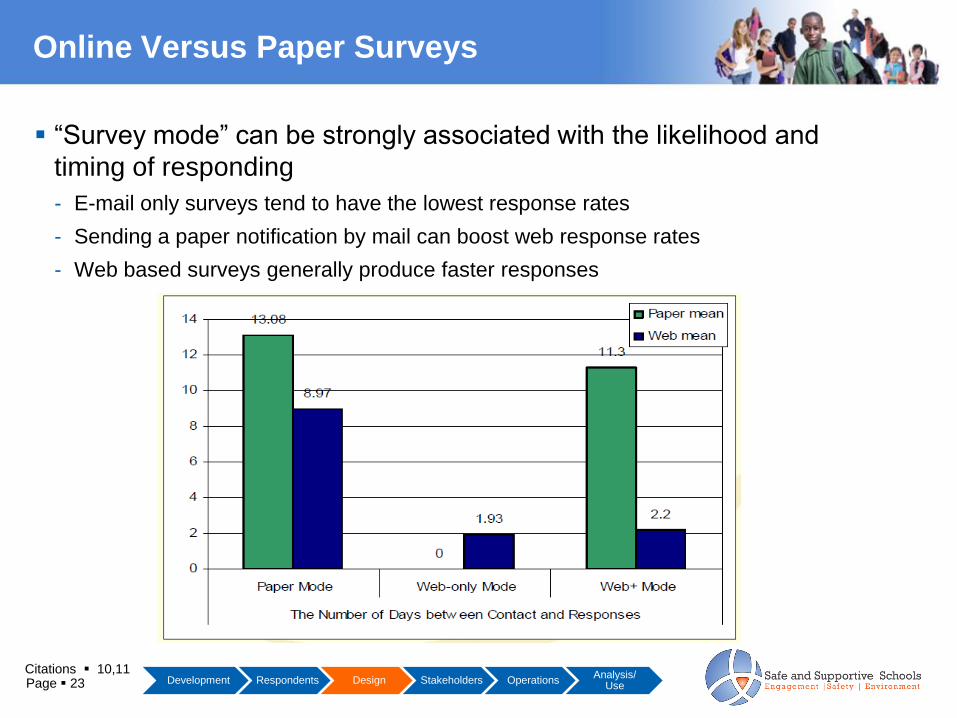
Online Versus Paper Surveys
“Survey mode” can be strongly associated with the likelihood and
timing of responding
- E-mail only surveys tend to have the lowest response rates
- Sending a paper notification by mail can boost web response rates
- Web based surveys generally produce faster responses
Page 23 Development Respondents Design Stakeholders OperationsAnalysis/
Use
Citations 10,11
Online Versus Paper (cont.)
Commercially available online platforms include Survey Monkey,
Zoomerang, Survey Gizmo, WebSurveyor, and many others
Districts may have data systems that allow for student surveys (e.g.,
Naviance) or staff surveys (e.g., eSchool, Aesop)
Paper surveys require careful formatting and scanning
- Printers should package paper surveys according to the unit of survey
administration
- Scanners require clean, flat survey forms
Page 24 Development Respondents Design Stakeholders OperationsAnalysis/
Use
Anonymous Versus Confidential
Anonymous surveys are those where you truly cannot link a form to a
person
- Useful for collection of sensitive information
Confidential surveys may include names or bar codes linked to ID
numbers
- Allows merging of survey responses with other demographic or educational
information
Good measurement depends upon respondent confidence that their
responses will not be made individually public or shared with people who
know them or have power over them
Page 25 Development Respondents Design Stakeholders OperationsAnalysis/
Use
Citation 6
Alternative Versions
Translated versions
Braille versions
Read-aloud CD versions
Read-aloud by individual or through speech synthesis
These all make participation easier and more comfortable for respondents,
but survey results are not always directly comparable across different
versions
Page 26 Development Respondents Design Stakeholders OperationsAnalysis/
Use
Citation 5
Survey Presentation and Length
How you describe a survey when you introduce it to respondents can
affect the way people respond
- Attitudes toward the survey sponsor and interest in the topic are related to
carelessness in completing the questions
Longer surveys are associated with lower response
- Younger students and students with disabilities may have a harder time
completing longer surveys
- May have skipped items or failed to complete survey
- Piloting can test for this
Page 27 Development Respondents Design Stakeholders OperationsAnalysis/
Use
Citation 5
Incentives
In general, incentives improve response rates and improve speed of
responding
Effective incentives
- Are either given in advance or immediately after survey completion
- Are not coercive
- Lottery incentives help with initial responding, but less so by follow-up
Challenges
- Expense
- Need to collect identifying information to provide incentive
Page 28 Development Respondents Design Stakeholders OperationsAnalysis/
Use
Citations 5, 6

Involving Stakeholders
Involving Stakeholders
To create sustainable changes in school climate, you must get buy-in
from various stakeholder groups – starting with buy-in for measuring
school climate. How do you convince groups to buy in?
- Provide stakeholders with the message of why school climate is so vital to
student outcomes
- Provide stakeholders with a framework for collaboration in which there is 1)
a clear plan of action to improve climate, and 2) their voices will be heard
during the planning and implementation processes
Development Respondents Design Stakeholders OperationsAnalysis/
UsePage 30
Strategies for Communicating the Importance of School Climate
Allow input from the intended audience on the best mode of
communication
Use non-technical language whenever possible
Provide concise, accurate information – brief word documents or power
points
Tailor your strategy to the stakeholder group you are addressing!
Development Respondents Design Stakeholders OperationsAnalysis/
UsePage 31
Messages to Stakeholders
Why is measuring climate necessary?
- Data can identify needs and inform future interventions – this is the first step
to improving climate
- Data can document improvements and successes
- Data can identify subgroups who perceive that school climate is poor
- Data can identify areas where students, staff, and parents view climate
differently
- Data reports can create opportunities for staff, teachers and parents to
discuss climate issues
- Existing measures of school climate are incomplete
- Better climate = better standardized test scores, higher grad rates, more
satisfied teachers, lower teacher turnover rates, improved school safety,
improved child wellness, less risk taking behavior, and improved social-
emotional skills
Development Respondents Design Stakeholders OperationsAnalysis/
UsePage 32
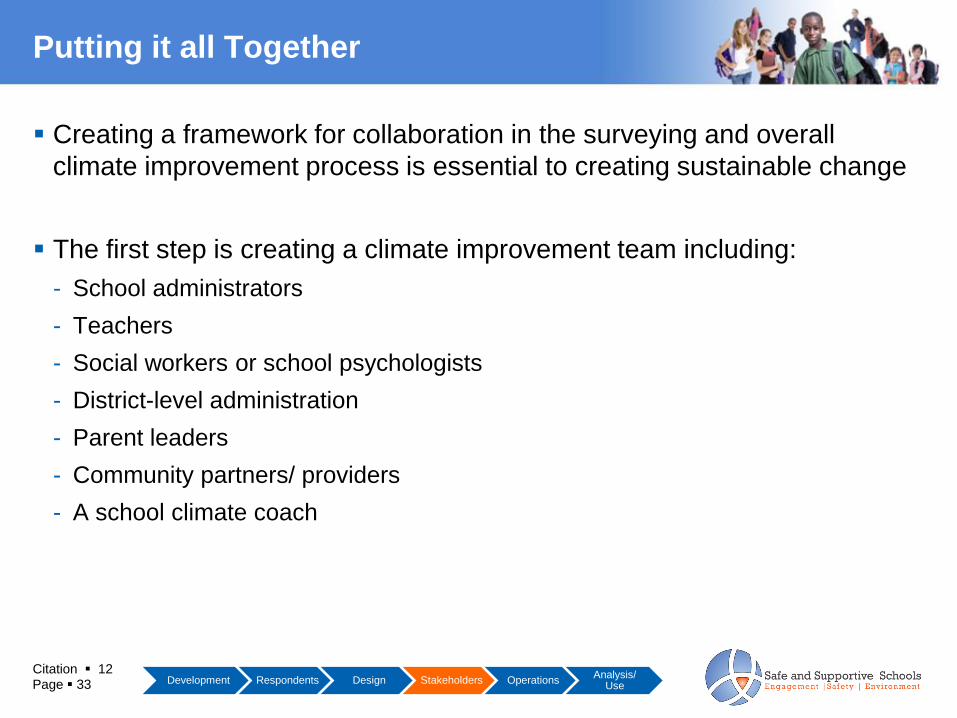
Putting it all Together
Creating a framework for collaboration in the surveying and overall
climate improvement process is essential to creating sustainable change
The first step is creating a climate improvement team including:
- School administrators
- Teachers
- Social workers or school psychologists
- District-level administration
- Parent leaders
- Community partners/ providers
- A school climate coach
Development Respondents Design Stakeholders OperationsAnalysis/
UsePage 33Citation 12
Survey Operations
Survey Operations
Now that stakeholders all know that the survey will be happening, it is
time to:
- Identify survey coordinators in each building
- Train survey coordinators
oA manual is very helpful
oClear flow of materials/actions is important
- Consider establishing a “help line” for respondents who are missing forms or
login information, or who are having other difficulties
Page 35 Development Respondents Design Stakeholders OperationsAnalysis/
Use
Administration Setting
Where will respondents complete the survey?
- At school
- At home
- At a senior picnic
When will respondents complete the survey?
- If the survey is to be administered annually, doing it at the same time each year
improves comparability
Be sure to document the choices you make, so your survey will be easily
repeatable
Page 36 Development Respondents Design Stakeholders OperationsAnalysis/
Use
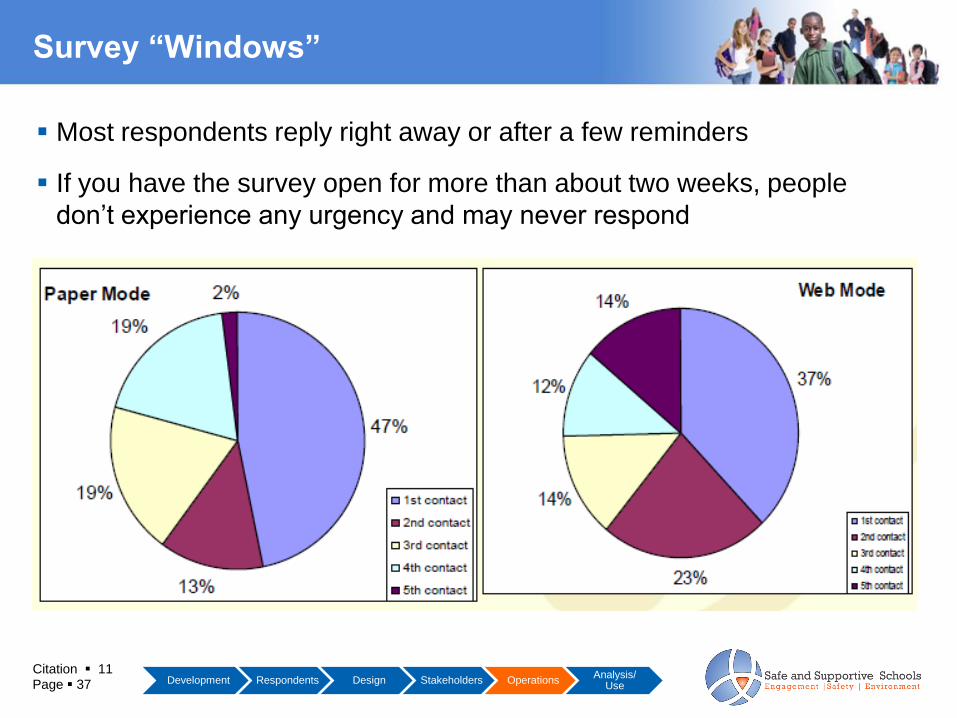
Survey “Windows”
Most respondents reply right away or after a few reminders
If you have the survey open for more than about two weeks, people
don’t experience any urgency and may never respond
Page 37 Development Respondents Design Stakeholders OperationsAnalysis/
Use
Citation 11

Analysis, Reporting, And Data Use
Preparing Survey Data
Data cleaning
- Patterns of missing data
- “Lazy” respondents
- Social validity
“Attemptedness” criteria: what is a “complete” survey?
Psychometric analysis
- Reliability, validity
Scoring/analysis
- Scaling, IRT/Rasch analysis, prevalence/incident counts
- Means use more information in the data and are more precise, but percentages
reaching a cutoff may be easier to communicate
- Student-level, classroom-level, school-level, district-level aggregation
Page 39 Development Respondents Design Stakeholders OperationsAnalysis/
Use
Citations 5, 6
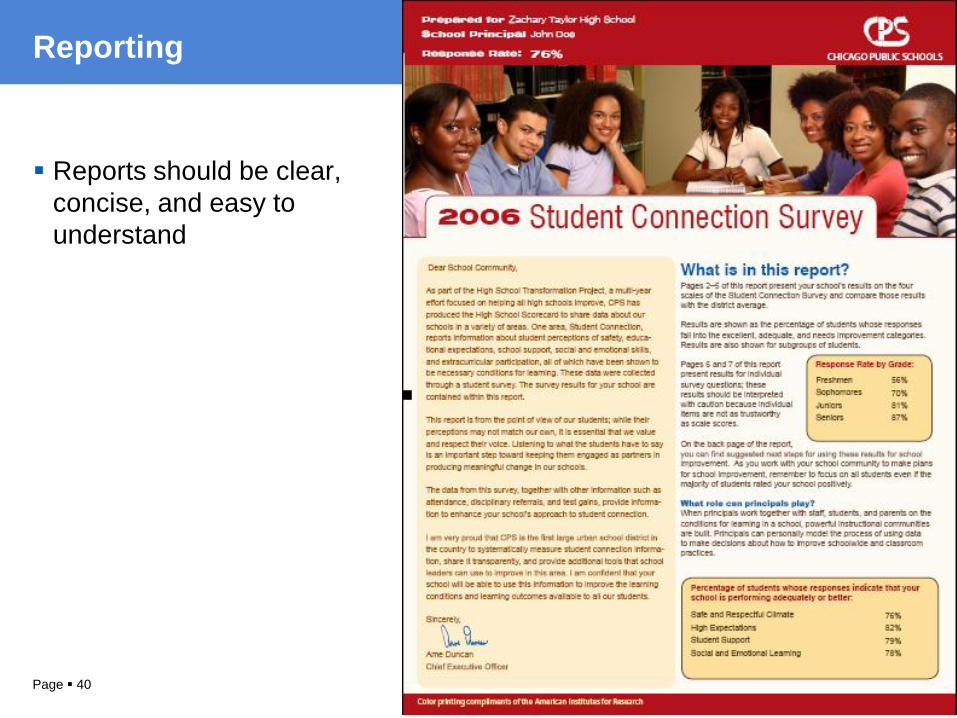
Reporting
Reports should be clear,
concise, and easy to
understand
Page 40
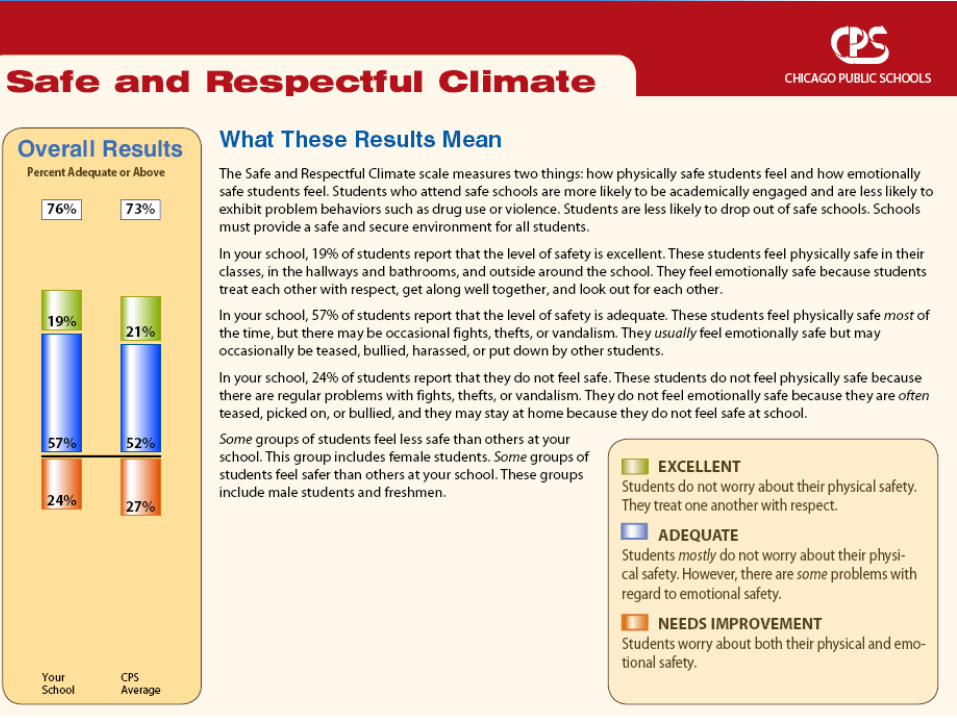
Reporting
Norm-referenced scores tell how someone did relative to the others who
took the survey
- Percentile scores are norm-referenced
- A “norm” for school climate might be how your climate scores compare with
state or national surveys using the same measures
Criterion-referenced scores tell how someone did relative to some
standards
- Achievement tests that provide information about proficiency level are criterion-
referenced
- A “criterion” for school climate would be your aspirational standard that reflects
your vision for your school’s climate
Page 41 Development Respondents Design Stakeholders OperationsAnalysis/
Use
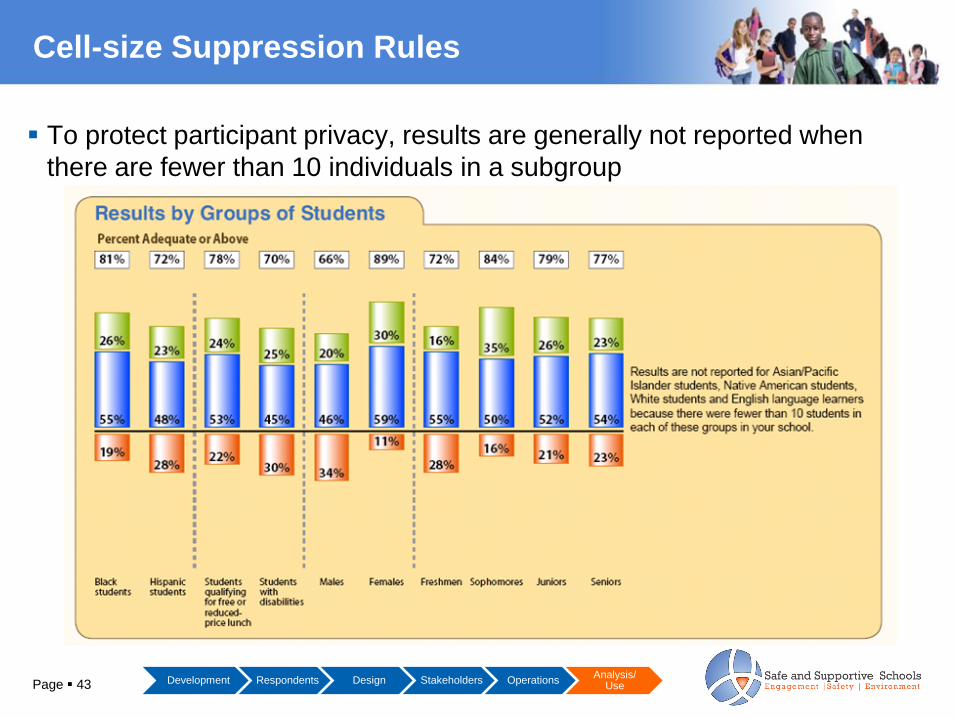
Cell-size Suppression Rules
To protect participant privacy, results are generally not reported when
there are fewer than 10 individuals in a subgroup
Page 43 Development Respondents Design Stakeholders OperationsAnalysis/
Use
Using School Climate Reports
School improvement plans
Research on conditions for learning that promote student achievement
Evaluating interventions aimed at improving schooling
Development Respondents Design Stakeholders OperationsAnalysis/
UsePage 44
Upcoming Webinars
Bullying PreventionMarch 16, 2011 4:00 pm − 5:30 pm ET
March 17, 2011 11:00 am − 12:30 pm ET
Survey Development March 30, 2011 4:00 pm − 5:30 pm ET
March 31, 2011 11:00 pm − 12:30 pm ET
Addressing Risk Behavior through Positive Youth
Development StrategiesApril 13, 2011 4:00 pm − 5:30 pm ET
April 14, 2011 11:00 − 12:30 pm ET
Survey AdministrationApril 27, 2011 4:00 pm − 5:30 pm ET
April 28, 2011 11:00 am − 12:30 pm ET
Page 45
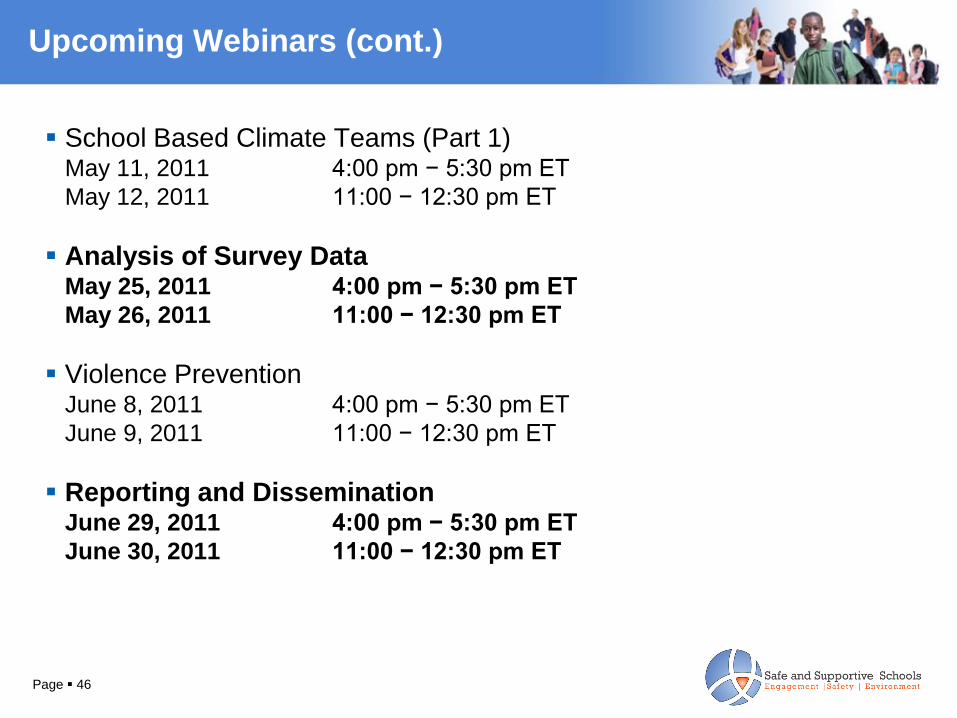
Upcoming Webinars (cont.)
School Based Climate Teams (Part 1)May 11, 2011 4:00 pm − 5:30 pm ET
May 12, 2011 11:00 − 12:30 pm ET
Analysis of Survey Data May 25, 2011 4:00 pm − 5:30 pm ET
May 26, 2011 11:00 − 12:30 pm ET
Violence PreventionJune 8, 2011 4:00 pm − 5:30 pm ET
June 9, 2011 11:00 − 12:30 pm ET
Reporting and DisseminationJune 29, 2011 4:00 pm − 5:30 pm ET
June 30, 2011 11:00 − 12:30 pm ET
Page 46
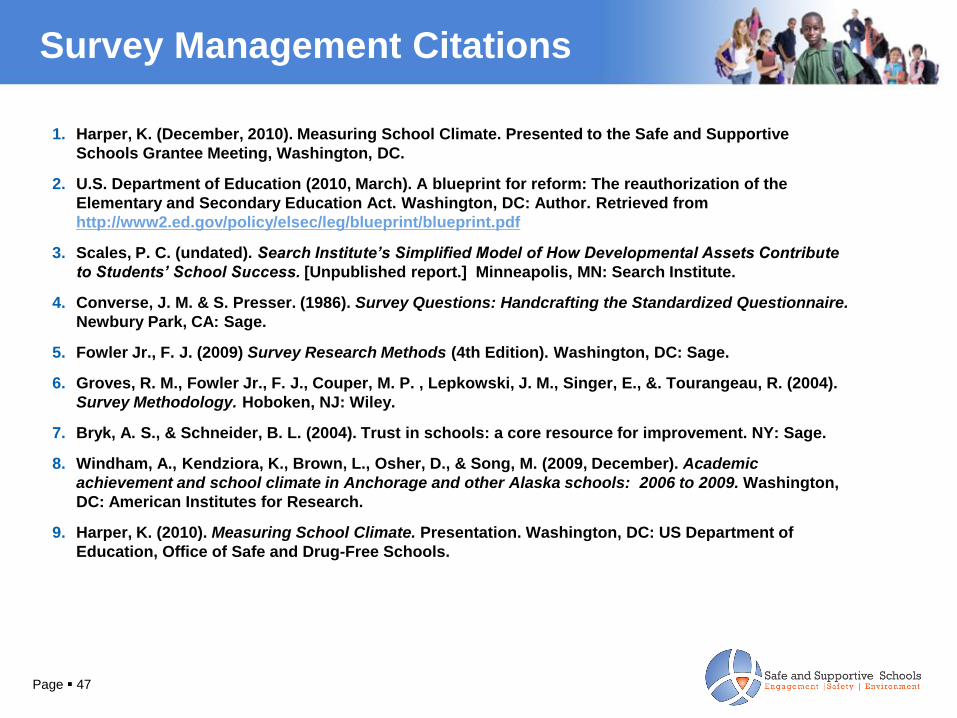
Survey Management Citations
1. Harper, K. (December, 2010). Measuring School Climate. Presented to the Safe and Supportive
Schools Grantee Meeting, Washington, DC.
2. U.S. Department of Education (2010, March). A blueprint for reform: The reauthorization of the
Elementary and Secondary Education Act. Washington, DC: Author. Retrieved from
http://www2.ed.gov/policy/elsec/leg/blueprint/blueprint.pdf
3. Scales, P. C. (undated). Search Institute’s Simplified Model of How Developmental Assets Contribute
to Students’ School Success. [Unpublished report.] Minneapolis, MN: Search Institute.
4. Converse, J. M. & S. Presser. (1986). Survey Questions: Handcrafting the Standardized Questionnaire.
Newbury Park, CA: Sage.
5. Fowler Jr., F. J. (2009) Survey Research Methods (4th Edition). Washington, DC: Sage.
6. Groves, R. M., Fowler Jr., F. J., Couper, M. P. , Lepkowski, J. M., Singer, E., &. Tourangeau, R. (2004).
Survey Methodology. Hoboken, NJ: Wiley.
7. Bryk, A. S., & Schneider, B. L. (2004). Trust in schools: a core resource for improvement. NY: Sage.
8. Windham, A., Kendziora, K., Brown, L., Osher, D., & Song, M. (2009, December). Academic
achievement and school climate in Anchorage and other Alaska schools: 2006 to 2009. Washington,
DC: American Institutes for Research.
9. Harper, K. (2010). Measuring School Climate. Presentation. Washington, DC: US Department of
Education, Office of Safe and Drug-Free Schools.
Page 47
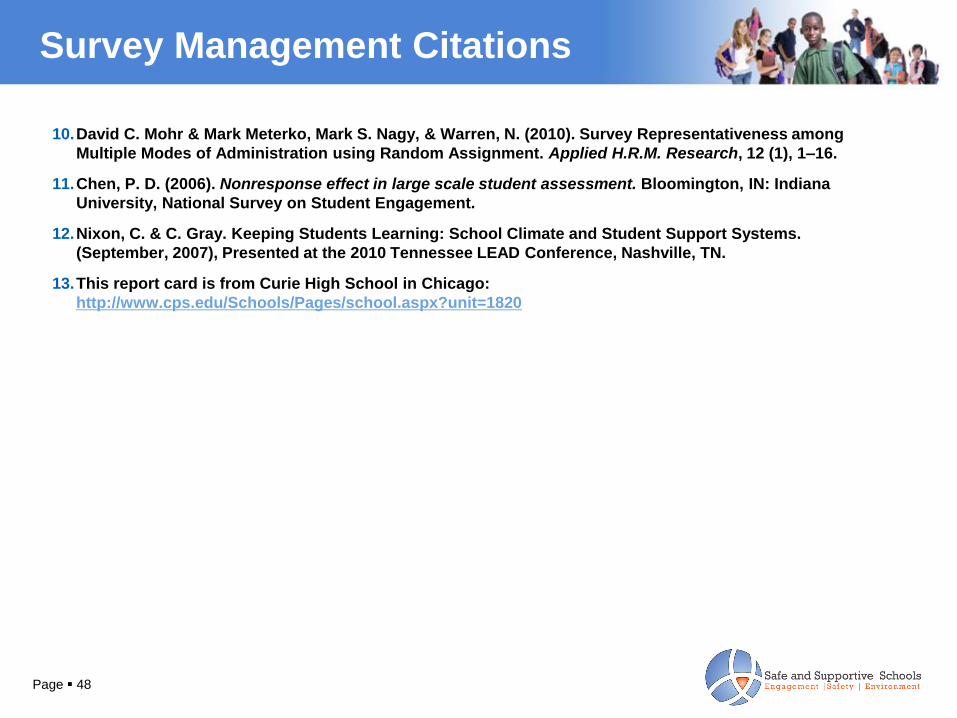
Survey Management Citations
10.David C. Mohr & Mark Meterko, Mark S. Nagy, & Warren, N. (2010). Survey Representativeness among
Multiple Modes of Administration using Random Assignment. Applied H.R.M. Research, 12 (1), 1–16.
11.Chen, P. D. (2006). Nonresponse effect in large scale student assessment. Bloomington, IN: Indiana
University, National Survey on Student Engagement.
12.Nixon, C. & C. Gray. Keeping Students Learning: School Climate and Student Support Systems.
(September, 2007), Presented at the 2010 Tennessee LEAD Conference, Nashville, TN.
13.This report card is from Curie High School in Chicago:
http://www.cps.edu/Schools/Pages/school.aspx?unit=1820
Page 48