Residual shear strength of liquefied soils Response/Boulanger_TRB_2007.pdf · Residual shear...
13
1 University of California, Davis Department of Civil & Environmental Engineering Residual shear strength of liquefied soils Ross W. Boulanger TRB 2007 Lab testing of field samples: Frozen sampling techniques (e.g., Robertson et al. 2000) Tb li ith ti ( C t 1975 P l t l 1985) Evolution of procedures for estimating S r Tube sampling with corrections (e.g., Castro 1975, Poulos et al. 1985) Case history based correlations Back-analyses of flow slide failures Initially by Seed (1987); modifications & updates by others (e.g., Seed & Harder 1990, Wride et al. 1999, Olson & Stark 2002) Void redistribution Articulated by Whitman (1985); advances by physical & analytical modeling (e.g., Kokusho 2000, Kulasingam et al. 2004, Malvick et al. 2004, Naesgaard et al. 2006) Seed (1987) noted that case history based correlations implicitly account for void redistribution
Transcript of Residual shear strength of liquefied soils Response/Boulanger_TRB_2007.pdf · Residual shear...
1
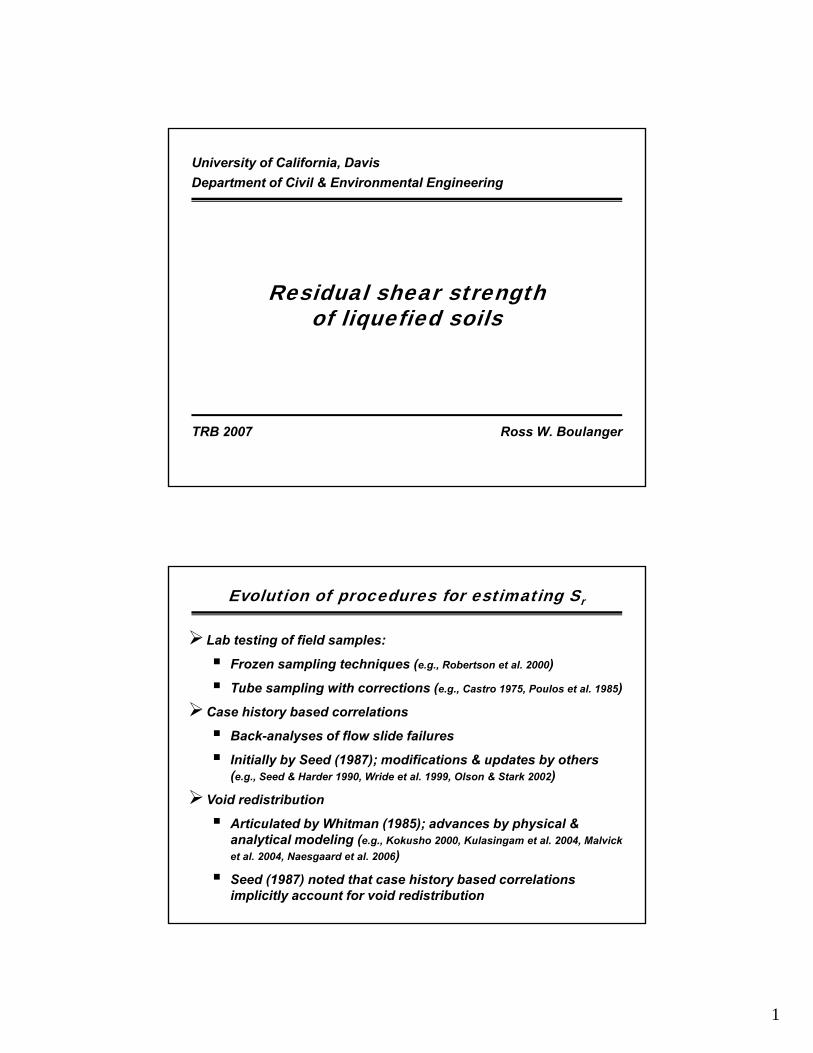
University of California, DavisDepartment of Civil & Environmental Engineering
Residual shear strengthof liquefied soils
Ross W. BoulangerTRB 2007
Lab testing of field samples:
Frozen sampling techniques (e.g., Robertson et al. 2000)
T b li ith ti ( C t 1975 P l t l 1985)
Evolution of procedures for estimating Sr
Tube sampling with corrections (e.g., Castro 1975, Poulos et al. 1985)
Case history based correlations
Back-analyses of flow slide failures
Initially by Seed (1987); modifications & updates by others (e.g., Seed & Harder 1990, Wride et al. 1999, Olson & Stark 2002)
Void redistribution
Articulated by Whitman (1985); advances by physical & analytical modeling (e.g., Kokusho 2000, Kulasingam et al. 2004, Malvick et al. 2004, Naesgaard et al. 2006)
Seed (1987) noted that case history based correlations implicitly account for void redistribution
2
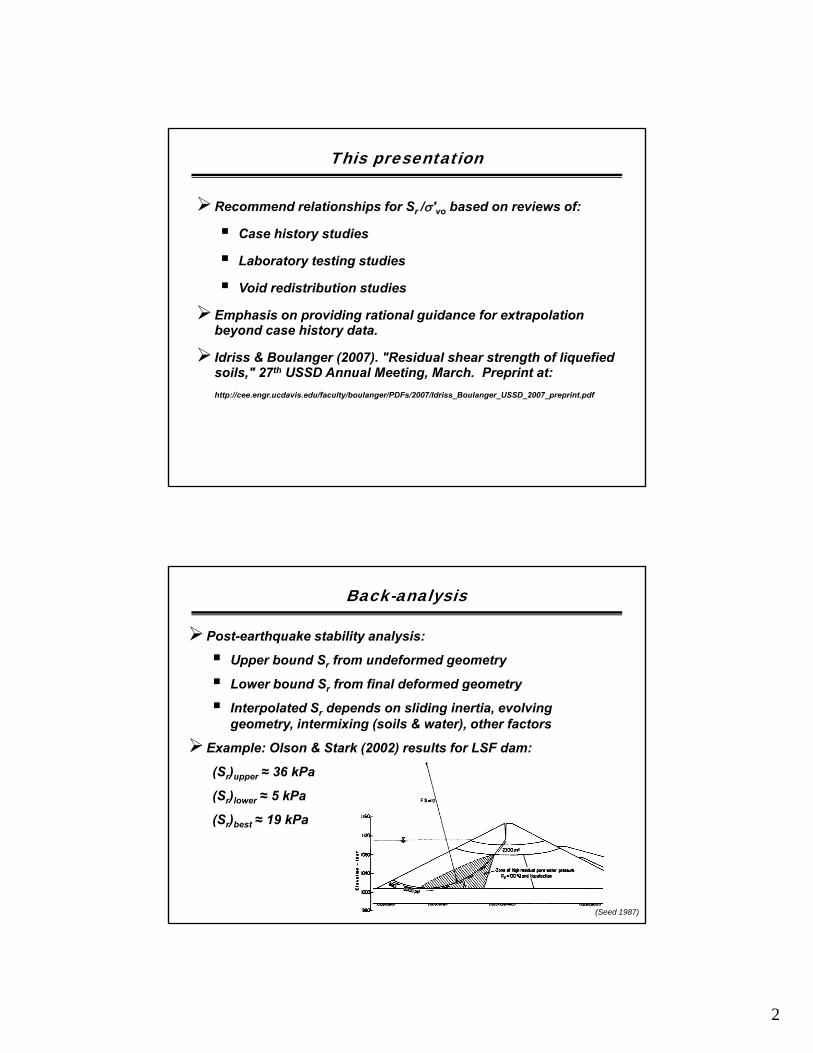
Recommend relationships for Sr /σ'vo based on reviews of:
Case history studies
This presentation
Laboratory testing studies
Void redistribution studies
Emphasis on providing rational guidance for extrapolation beyond case history data.
Idriss & Boulanger (2007). "Residual shear strength of liquefied th SSsoils," 27th USSD Annual Meeting, March. Preprint at:
http://cee.engr.ucdavis.edu/faculty/boulanger/PDFs/2007/Idriss_Boulanger_USSD_2007_preprint.pdf
Back-analysis
Post-earthquake stability analysis:
Upper bound Sr from undeformed geometry
Lower bound S from final deformed geometryLower bound Sr from final deformed geometry
Interpolated Sr depends on sliding inertia, evolving geometry, intermixing (soils & water), other factors
Example: Olson & Stark (2002) results for LSF dam:
(Sr)upper ≈ 36 kPa
(Sr)lower ≈ 5 kPa
(Sr)best ≈ 19 kPa
(Seed 1987)
3
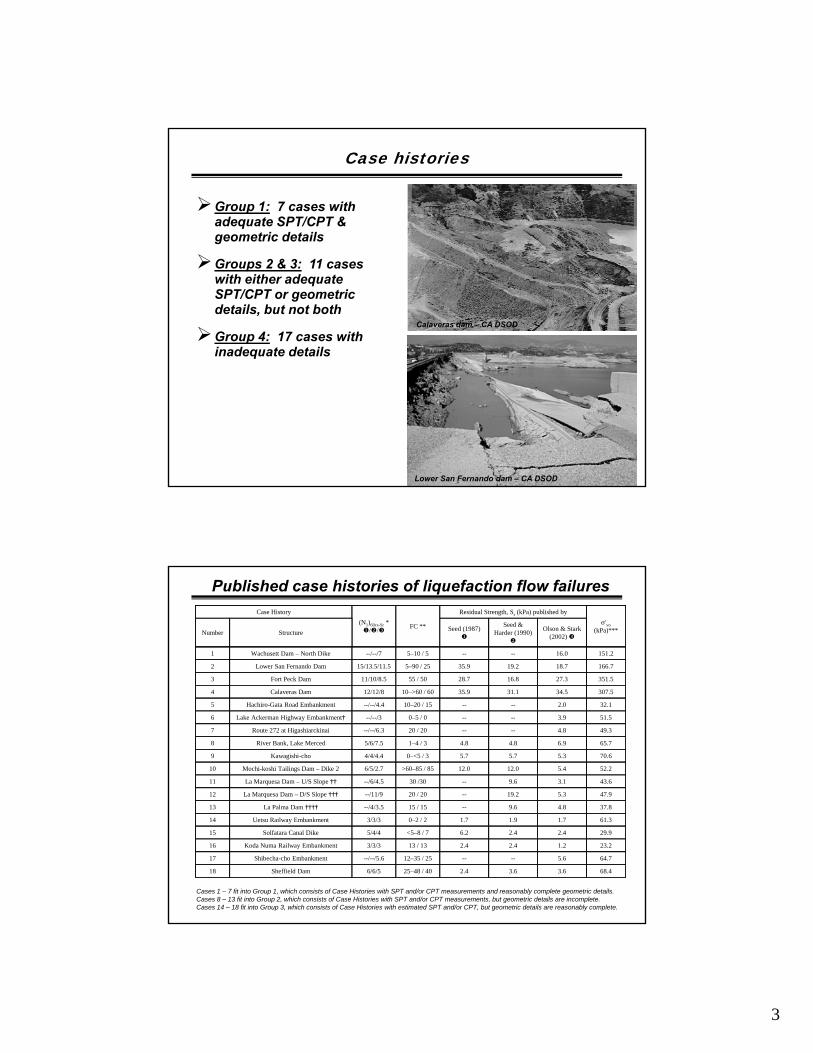
Group 1: 7 cases with adequate SPT/CPT & geometric details
Case histories
Groups 2 & 3: 11 cases with either adequate SPT/CPT or geometric details, but not both
Group 4: 17 cases with inadequate details
Calaveras dam – CA DSOD
Lower San Fernando dam – CA DSOD
Case History(N1)60cs-Sr *
/ / FC **
Residual Strength, Sr (kPa) published byσ'vo
(kPa)***Number Structure Seed (1987) Seed & Harder (1990) Olson & Stark
(2002)
1 Wachusett Dam – North Dike --/--/7 5–10 / 5 -- -- 16.0 151.2
2 Lower San Fernando Dam 15/13.5/11.5 5–90 / 25 35.9 19.2 18.7 166.7
3 Fort Peck Dam 11/10/8.5 55 / 50 28.7 16.8 27.3 351.5
Published case histories of liquefaction flow failures
4 Calaveras Dam 12/12/8 10–>60 / 60 35.9 31.1 34.5 307.5
5 Hachiro-Gata Road Embankment --/--/4.4 10–20 / 15 -- -- 2.0 32.1
6 Lake Ackerman Highway Embankment† --/--/3 0–5 / 0 -- -- 3.9 51.5
7 Route 272 at Higashiarckinai --/--/6.3 20 / 20 -- -- 4.8 49.3
8 River Bank, Lake Merced 5/6/7.5 1–4 / 3 4.8 4.8 6.9 65.7
9 Kawagishi-cho 4/4/4.4 0–<5 / 3 5.7 5.7 5.3 70.6
10 Mochi-koshi Tailings Dam – Dike 2 6/5/2.7 >60–85 / 85 12.0 12.0 5.4 52.2
11 La Marquesa Dam – U/S Slope †† --/6/4.5 30 /30 -- 9.6 3.1 43.6
12 La Marquesa Dam – D/S Slope ††† --/11/9 20 / 20 -- 19.2 5.3 47.9
13 l /4/3 1 / 1 9 6 4 8 3 813 La Palma Dam †††† --/4/3.5 15 / 15 -- 9.6 4.8 37.8
14 Uetsu Railway Embankment 3/3/3 0–2 / 2 1.7 1.9 1.7 61.3
15 Solfatara Canal Dike 5/4/4 <5–8 / 7 6.2 2.4 2.4 29.9
16 Koda Numa Railway Embankment 3/3/3 13 / 13 2.4 2.4 1.2 23.2
17 Shibecha-cho Embankment --/--/5.6 12–35 / 25 -- -- 5.6 64.7
18 Sheffield Dam 6/6/5 25–48 / 40 2.4 3.6 3.6 68.4
Cases 1 – 7 fit into Group 1, which consists of Case Histories with SPT and/or CPT measurements and reasonably complete geometric details.Cases 8 – 13 fit into Group 2, which consists of Case Histories with SPT and/or CPT measurements, but geometric details are incomplete.Cases 14 – 18 fit into Group 3, which consists of Case Histories with estimated SPT and/or CPT, but geometric details are reasonably complete.
4
Values of Δ(N1)60-Sr recommended by Seed (1987)
Fines Content, FC(% passing No. 200 sieve) Δ(N1)60-Sr
10 125 250 475 575 5
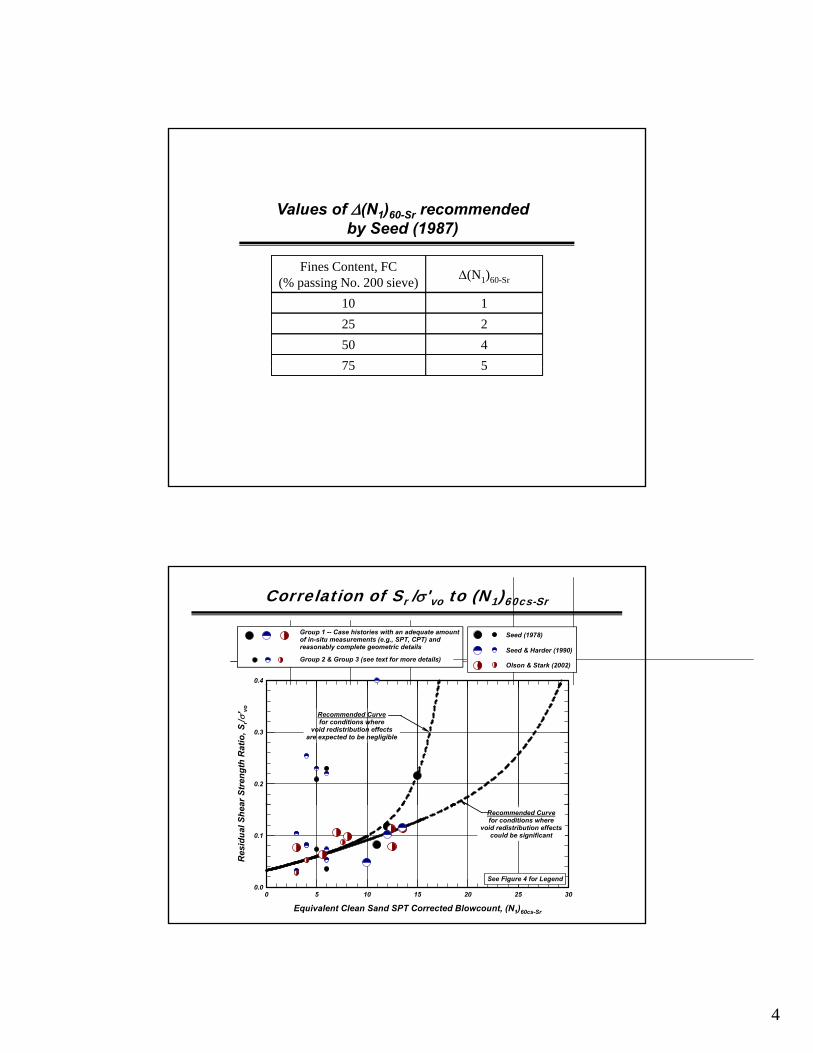
0.4
Correlation of Sr /σ'vo to (N1)60cs-Sr
Group 2 & Group 3 (see text for more details)
Group 1 -- Case histories with an adequate amountof in-situ measurements (e.g., SPT, CPT) andreasonably complete geometric details
Seed (1978)
Seed & Harder (1990)
Olson & Stark (2002)
ar S
tren
gth
Rat
io, S
r/ σ' vo
0.2
0.3
Recommended Curvefor conditions where
void redistribution effectsare expected to be negligible
Equivalent Clean Sand SPT Corrected Blowcount, (N1)60cs-Sr
0 5 10 15 20 25 30
Res
idua
l She
a
0.0
0.1
See Figure 4 for Legend
Recommended Curvefor conditions where
void redistribution effectscould be significant
5
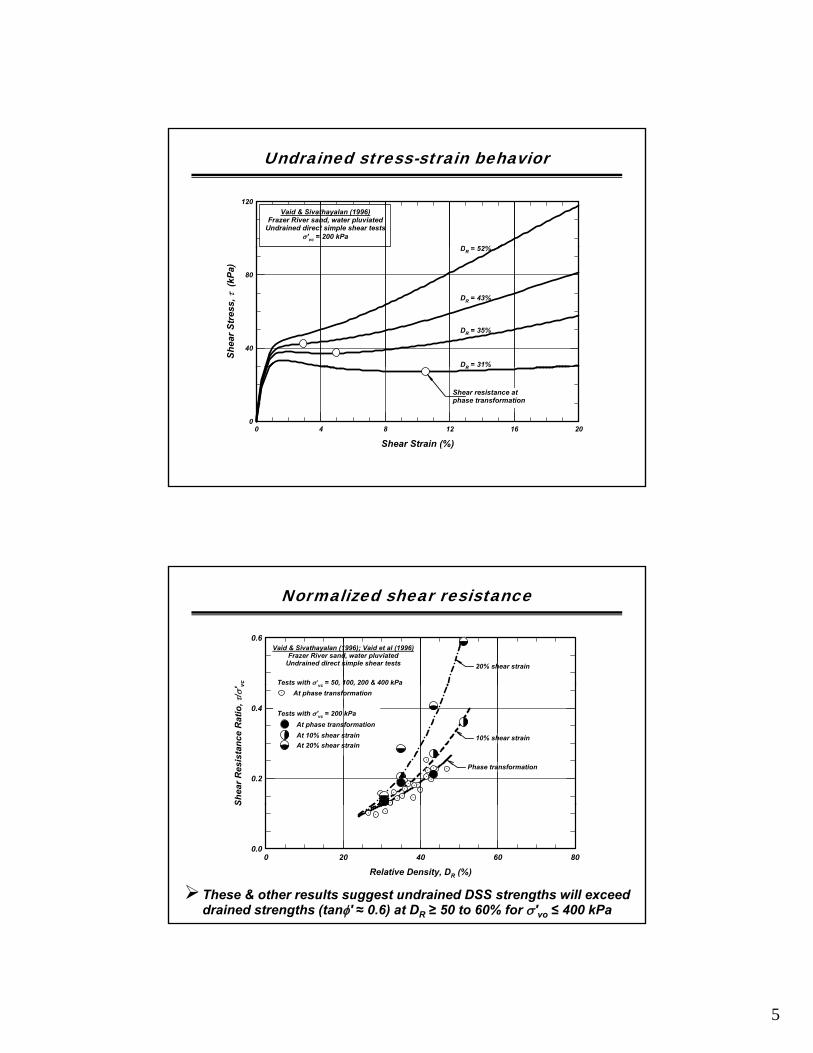
120
D = 52%
Vaid & Sivathayalan (1996)Frazer River sand, water pluviated
Undrained direct simple shear testsσ'vc = 200 kPa
Undrained stress-strain behavior
Shea
r Str
ess,
τ (
kPa)
40
80
DR = 52%
DR = 43%
DR = 35%
DR = 31%
Shear Strain (%)0 4 8 12 16 20
0
Shear resistance atphase transformation
R
vc
0.6
Tests with σ'vc = 50, 100, 200 & 400 kPa
Vaid & Sivathayalan (1996); Vaid et al (1996)Frazer River sand, water pluviated
Undrained direct simple shear tests 20% shear strain
Normalized shear resistance
Shea
r Res
ista
nce
Rat
io, τ
/ σ' v
0.2
0.4
At 20% shear strain
At phase transformationAt 10% shear strain
At phase transformationvc , ,
Tests with σ'vc = 200 kPa
10% shear strain
Phase transformation
Relative Density, DR (%)0 20 40 60 80
S
0.0
These & other results suggest undrained DSS strengths will exceed drained strengths (tanφ' ≈ 0.6) at DR ≥ 50 to 60% for σ'vo ≤ 400 kPa
6
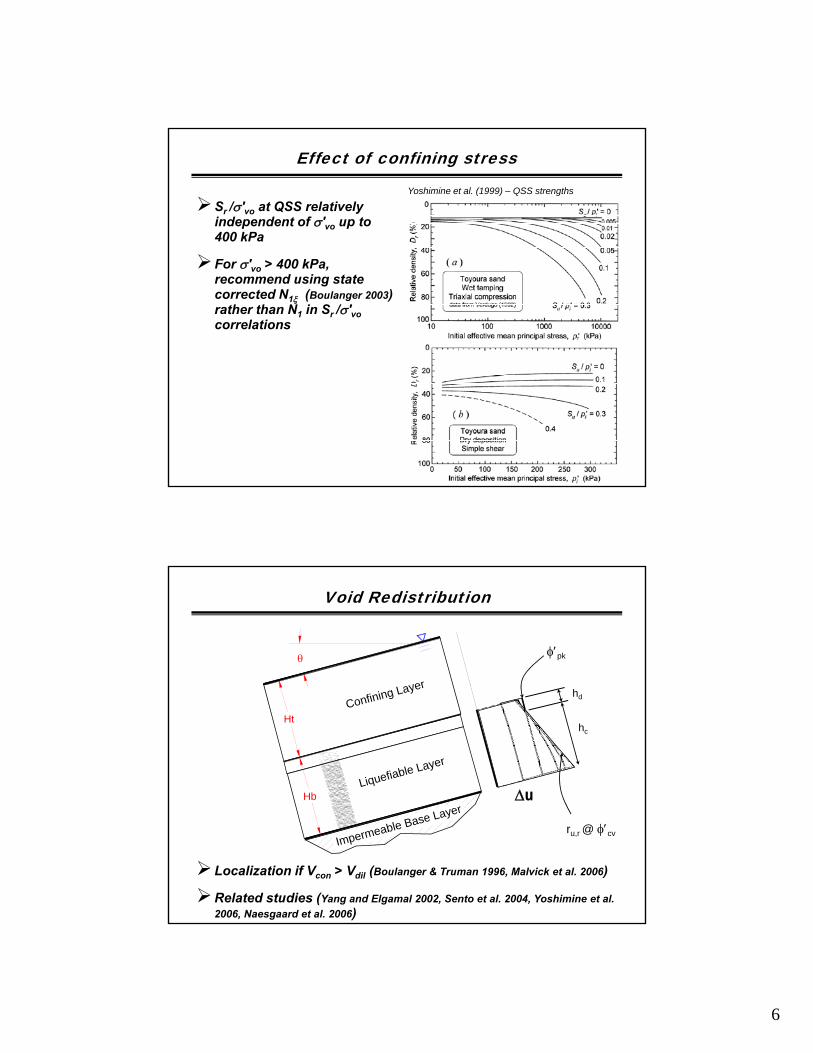
Sr /σ'vo at QSS relatively independent of σ'vo up to 400 kPa
Effect of confining stress
Yoshimine et al. (1999) – QSS strengths
For σ'vo > 400 kPa, recommend using state corrected N1ξ (Boulanger 2003) rather than N1 in Sr /σ'vocorrelations
yer
θ φ′pk
Void Redistribution
HtConfining Layer
HbLiquefiable Layer
Δu
hd
hc
Impermeable Base Layer
ru,r @ φ′cv
Localization if Vcon > Vdil (Boulanger & Truman 1996, Malvick et al. 2006)
Related studies (Yang and Elgamal 2002, Sento et al. 2004, Yoshimine et al. 2006, Naesgaard et al. 2006)
7
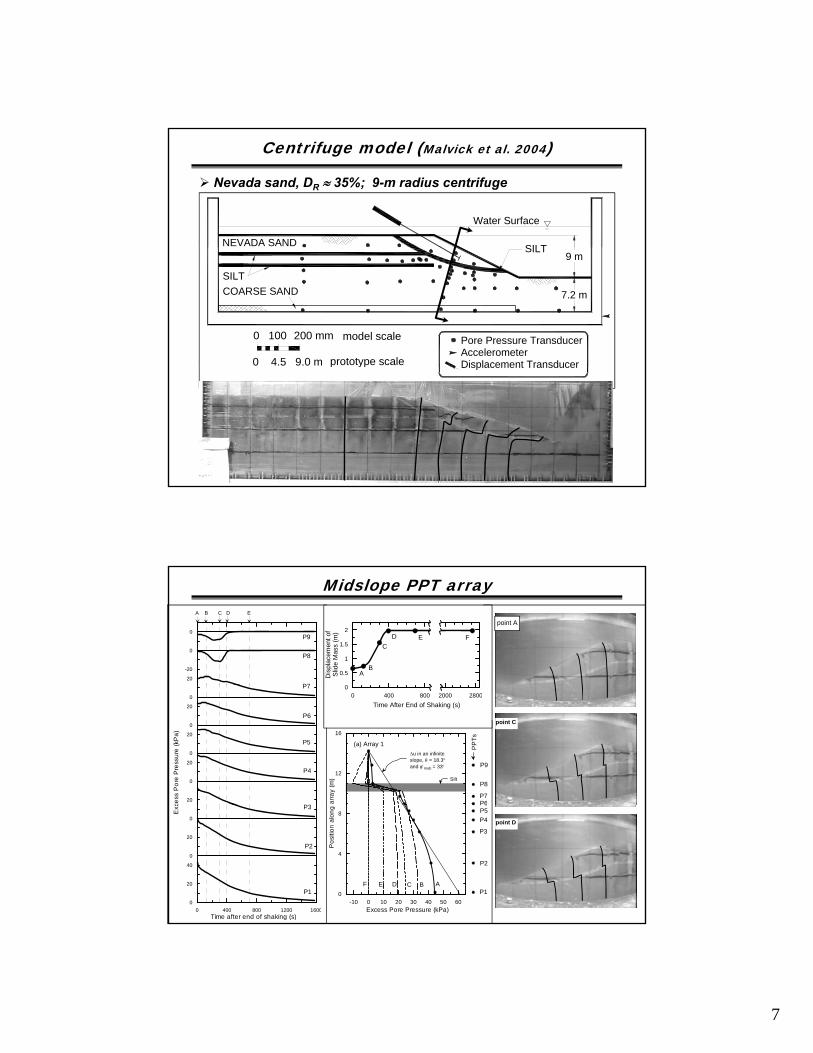
NEVADA SAND SILT
Water Surface
Centrifuge model (Malvick et al. 2004)
Nevada sand, DR ≈ 35%; 9-m radius centrifuge
COARSE SAND
SILT
0 100 200 mm
9 m
7.2 m
0 4.5 9.0 m
model scale
prototype scale
Pore Pressure TransducerAccelerometerDisplacement Transducer
SILT
Displacement Transducer
point point A
Midslope PPT array
20
-20
0
0P9
P7
P8
A B C D E
0
0.5
1
1.5
2
Dis
plac
emen
t of
Slid
e M
ass
(m)
FEDC
BA
point C
12
16
arra
y (m
)
PP
Ts
P6P7
P8
P9
Silt
(a) Array 1Δu in an infinite slope, θ = 18.3° and φ′mob = 33°
0
20
0
20
0
cess
Por
e P
ress
ure
(kP
a)
0
20
20P3
P4
P5
P6
P70 400 800
Time After End of Shaking (s)
02000 2800
point D
-10 0 10 20 30 40 50 60Excess Pore Pressure (kPa)
0
4
8
Pos
ition
alo
ng
P1
P2
P3
P4P5P6
AC BDEF
0 400 800 1200 1600Time after end of shaking (s)
Exc
0
0
20
0
20
40
P1
P2
P3
8
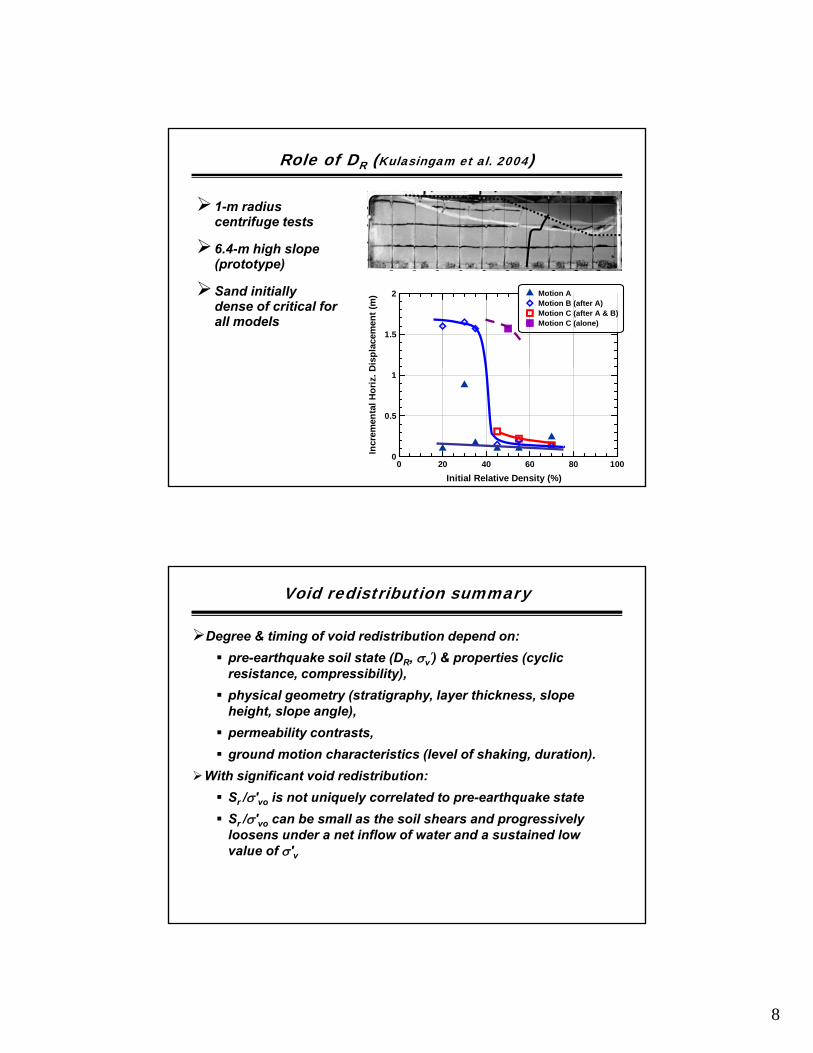
Role of DR (Kulasingam et al. 2004)
1-m radius centrifuge tests
6 4 m high slope
1.5
2
Dis
plac
emen
t (m
) Motion AMotion B (after A)Motion C (after A & B)Motion C (alone)
6.4-m high slope (prototype)
Sand initially dense of critical for all models
0 20 40 60 80 100Initial Relative Density (%)
0
0.5
1In
crem
enta
l Hor
iz. D
Void redistribution summary
Degree & timing of void redistribution depend on: pre-earthquake soil state (DR, σv
′) & properties (cyclic resistance, compressibility), physical geometry (stratigraphy, layer thickness, slope height, slope angle), permeability contrasts, ground motion characteristics (level of shaking, duration).
With significant void redistribution:Sr /σ'vo is not uniquely correlated to pre-earthquake stater vo
Sr /σ'vo can be small as the soil shears and progressively loosens under a net inflow of water and a sustained low value of σ'v
9
Young NC slightly plastic silts (say PI ≈ 7):
At transition between soils that should be analyzed using procedures developed for clays versus those for sands
Slightly plastic silts
procedures developed for clays versus those for sands (Boulanger and Idriss 2006)
Undrained strengths, su /σ'vo ≈ 0.22 (e.g., Ladd 1991)
Sensitivities, St ≈ 2 to 4 common
Remolded strengths, sur /σ'vo ≈ 0.05 to 0.11
C f fConsistent with findings for slightly plastic silts and sandy silts (e.g., Vasquez-Herrera et al. 1990, Castro and Troncoso 1989, Finn et al. 1991)
S r/ σ' vo
0.4
Recommended Curvefor conditions whereid di t ib ti ff t
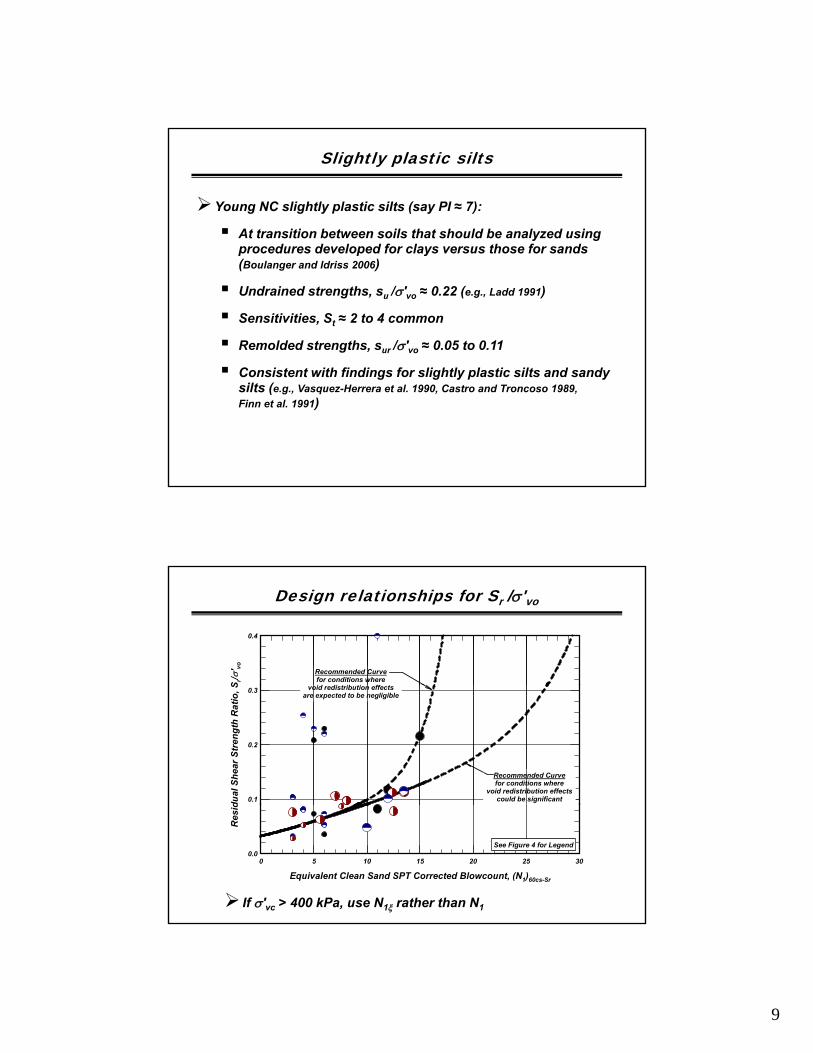
Design relationships for Sr /σ'vo
dual
She
ar S
tren
gth
Rat
io, S
0.1
0.2
0.3 void redistribution effectsare expected to be negligible
Recommended Curvefor conditions where
void redistribution effectscould be significant
Equivalent Clean Sand SPT Corrected Blowcount, (N1)60cs-Sr
0 5 10 15 20 25 30
Res
id
0.0See Figure 4 for Legend
If σ'vc > 400 kPa, use N1ξ rather than N1
10
Relationships for Sr /σ'vo of nonplastic soils recommended based on reviews of case histories, lab studies, and void redistribution studies.
Summary
redistribution studies.
Comparable to values by other investigators for (N1)60cs-Srless than about 12.
Provides guidance at (N1)60cs-Sr greater than about 14.
Curves for cases with or without void redistribution.
Distinguishing between these two cases may requireDistinguishing between these two cases may require appropriately detailed field and analytical studies.
University of California, DavisDepartment of Civil & Environmental Engineering
Questions?
Ross W. Boulanger
11
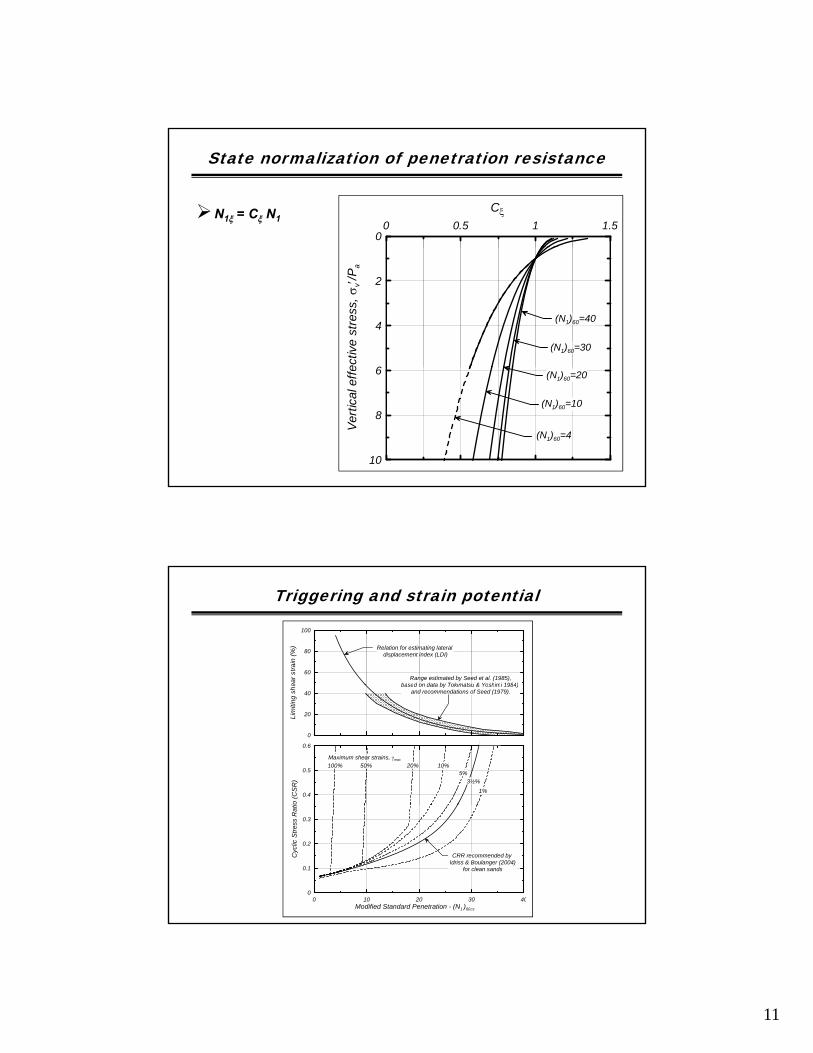
0 0.5 1 1.5Cξ
0
State normalization of penetration resistance
N1ξ = Cξ N1
6
4
2
ectiv
e st
ress
, σv′/
P a
(N1)60=40
(N1)60=30
10
8
6
Verti
cal e
ffe (N1)60=20
(N1)60=10
(N1)60=4
60
80
100
ear s
train
(%)
Range estimated by Seed et al. (1985),based on data by Tokimatsu & Yoshimi 1984)
Relation for estimating lateral displacement index (LDI)
Triggering and strain potential
0.4
0.5
0.6
io (C
SR
)
Maximum shear strains, γmax 100% 50% 10%
5%3½%
1%
20%
0
20
40
Lim
iting
she based on data by Tokimatsu & Yoshimi 1984)
and recommendations of Seed (1979).
0 10 20 30 40Modified Standard Penetration - (N1 )60cs
0
0.1
0.2
0.3
Cyc
lic S
tress
Rat
i
CRR recommended by Idriss & Boulanger (2004)
for clean sands
12
, Sr (
kPa)
40
50
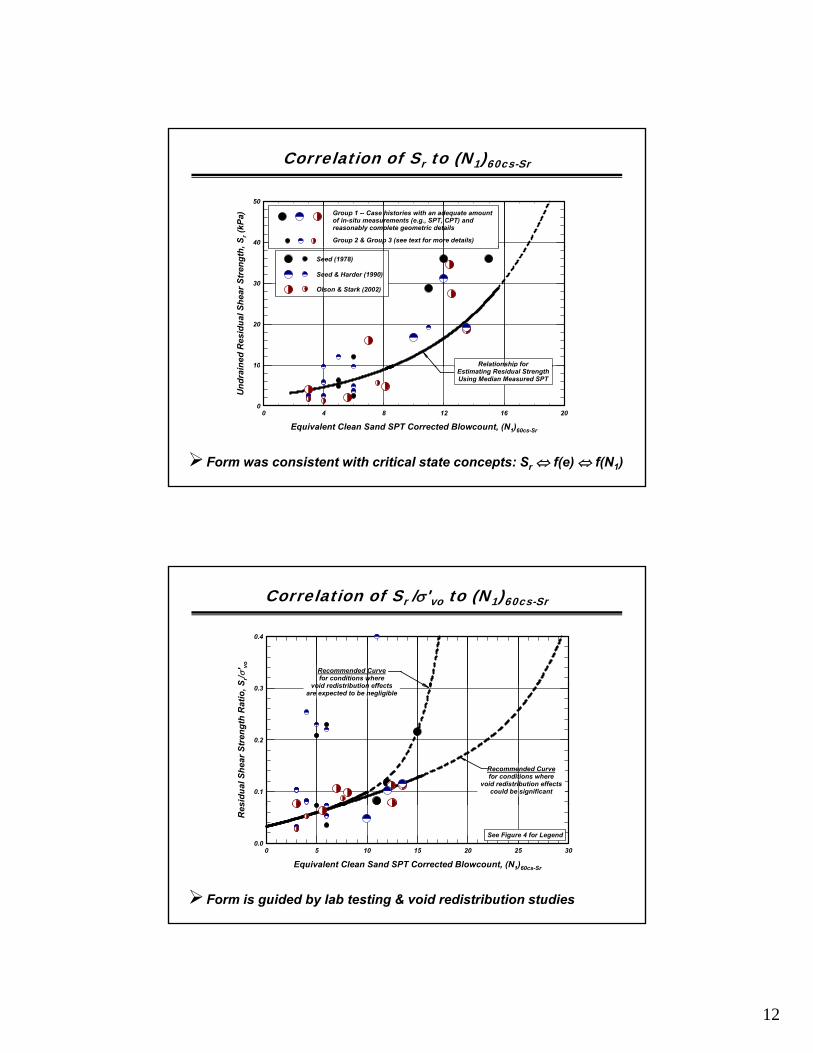
Group 2 & Group 3 (see text for more details)
Group 1 -- Case histories with an adequate amountof in-situ measurements (e.g., SPT, CPT) andreasonably complete geometric details
Correlation of Sr to (N1)60cs-Sr
ned
Res
idua
l She
ar S
tren
gth,
10
20
30
Seed (1978)
Seed & Harder (1990)
Olson & Stark (2002)
Relationship for
Equivalent Clean Sand SPT Corrected Blowcount, (N1)60cs-Sr
0 4 8 12 16 20
Und
rain
0
10 pEstimating Residual StrengthUsing Median Measured SPT
Form was consistent with critical state concepts: Sr ⇔ f(e) ⇔ f(N1)
S r/ σ' vo
0.4
Recommended Curvefor conditions where
void redistribution effects
Correlation of Sr /σ'vo to (N1)60cs-Sr
sidu
al S
hear
Str
engt
h R
atio
, S
0.1
0.2
0.3 void redistribution effectsare expected to be negligible
Recommended Curvefor conditions where
void redistribution effectscould be significant
Equivalent Clean Sand SPT Corrected Blowcount, (N1)60cs-Sr
0 5 10 15 20 25 30
Res
0.0See Figure 4 for Legend
Form is guided by lab testing & void redistribution studies
13
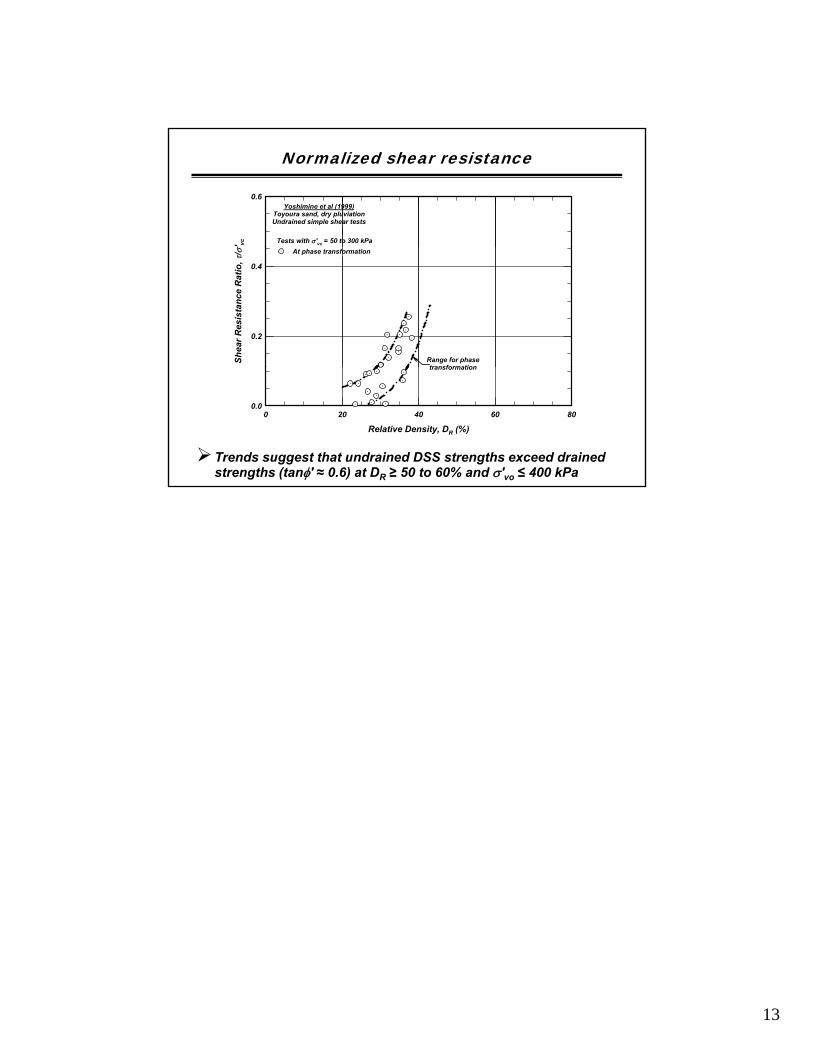
σ'vc
0.6
Tests with σ'vc = 50 to 300 kPa
Yoshimine et al (1999)Toyoura sand, dry pluviationUndrained simple shear tests
Normalized shear resistance
Shea
r Res
ista
nce
Rat
io, τ
/ σ
0.2
0.4
At phase transformation
Range for phasetransformation
Relative Density, DR (%)0 20 40 60 80
0.0
transformation
Trends suggest that undrained DSS strengths exceed drained strengths (tanφ' ≈ 0.6) at DR ≥ 50 to 60% and σ'vo ≤ 400 kPa