Wisconsin Department of Public Instruction Wisconsin’s vision for racial equity in education.

PUBLIC SERVICE COMMISSION OF WISCONSIN
INVESTIGATION INTO THE METHODS USED BY WISCONSIN’S WATER UTILITIES IN
ALLOCATING PUBLIC FIRE PROTECTION (PFP) COSTS
Final Staff Report
Docket 5-WI-104
December 15, 2016
Division of Water, Telecommunications, and Consumer Affairs
PSC REF#:296859Public Service Commission of Wisconsin
RECEIVED: 01/16/17, 3:45:14 PM

i
Table of Contents
1. Purpose of Investigation………………………………………………………….……….1
2. Overview of the Public Fire Protection Charge…………………. ……………………….1
2.1 Definition of the PFP Charge……………………………………………….……..2
2.2 Discussion of the PFP and General Service Customer Classes.…….………….....4
2.3 Identifying the Demand that Controls the Water System Design......................…..4
2.4 Types of PFP Charges……………………………………………………………10
2.5 Statutes, Administrative Code, and Policies for the PFP Charge………………..13
3. Public Fire Protection Cost Sensitivity Using the PSC Model…………………………..15
3.1 Relationship of Utility Size to the PFP Cost-of-Service…………………………15
3.2 Relationship of Water Sales to the PFP Cost-of-Service………………………...16
3.3 Relationship of New Plant Additions to PFP Cost-of-Service………………..…18
4. PSC Cost-of-Service and Rate Design Model...................................................................19
4.1 Overview of the PSC Model……………………………………………………..19
4.2 Comparison of the PSC Model with the AWWA M1 Manual Model…………...21
4.3 PSC Computation of Fire Demand………………………………………………23
4.4 Impact of Fire Demand on the PFP Cost-of-Service…………………………….26
4.5 Impact of System Demand Ratios on the PFP Cost-of-Service………………….28
4.6 Impact of Transmission and Distribution Mains on the PFP Cost-of-Service…...32
4.7 Impact of Customer Demand Ratios on the PFP Cost-of-Service……………….34
4.8 Allocating Costs to the PFP Cost Function……………………………………...37
4.9 Allocating Costs to the PFP Customer Class…………………………………….42
4.10 Rate Design………………………………………………………………………48
4.11 Allocating PFP Costs to Wholesale Customers………………………………….54

ii
5. Methods Used by States to Compute and Recover the Public Fire Protection Cost……..58
6. Discussion of Options for Computing and Allocating Public Fire Protection Charge…..60
6.1 Computation of Fire Demand……………………………………………………60
6.2 Allocation of Costs to the PFP Cost Function and PFP Customer Class………..66
6.3 Limit Maximum PFP Cost-of-Service…………………………………………...76
6.4 Class Absorption Method ……………………………………………………….77
6.5 Impact of Options on the PFP Cost-of-Service to Wholesale Customers……….82
6.6 Rate Design Options……………………………………………………………..85
7. Private Fire Protection…………………………………………………………………...86
8. Recommendations………………………………………………………………………..89

iii
Appendices
Appendix A – Sample Water System Capacity Analysis
Appendix B – Comparison of Max Day Plus PSC Fire Demand and Max Hour Demand
Appendix C – PFP Charge Used by Wisconsin Water Utilities
Appendix D – Percent of Revenue Requirement Versus Number of Customers
Appendix E – Percent Increase in PFP Cost-of-Service Versus Percent Decrease in Water Sales
Appendix F – PSC Fire Demand Versus Population for Wisconsin Water Utilities
Appendix G – System Demand Ratios Versus Population for Wisconsin Water Utilities
Appendix H – List of Wholesale Providers and the Communities They Serve
Appendix I – Results of Survey to 50 Public Utility Commissions
Appendix J – ISO NFF Data for Wisconsin Water Utilities
Appendix K – Option #1 Model Explanation and Results
Appendix L – Option #2 Model Explanation and Results
Appendix M – Option #3 Model Explanation and Results
Appendix N – Class Absorption Method Explanation and Results
Appendix O – Comparison of Max Day Plus ISO Fire Demand and Max Hour Demand
Appendix P – Computing the Private Fire Protection Charge
Appendix Q – Private Fire Protection Revenues for Wisconsin Water Utilities

1
1. Purpose of Investigation
On October 30, 2014, the Public Service Commission of Wisconsin (Commission or
PSC) issued its Final Decision in Docket 3720-WR-108, the “MWW, Milwaukee County,
Wisconsin, for Authority to Increase Water Rates.” (PSC REF#: 223601.) Order Point No. 14
of that decision included two parts. Part A stated that “the Commission shall open a generic
investigation to study the methods of all water utilities in allocating public fire protection costs.”
Part B stated that “MWW and the Wholesale Customers shall work with Commission staff to
further evaluate alternative methods for allocating fire protection costs for use in MWW’s next
rate case.”
The following report addresses Part A by describing how the Commission currently
computes the PFP charge, comparing that method with best practices used by other states,
identifying the assumptions that underlie the Commission’s cost-of-service model (PSC model),
and determining if those assumptions are reasonable or not. The goal of this study is to provide
information to the Commission on changes that could be made to the PSC model to ensure that
the Commission’s methods reflect reasonable assumptions and produce accurate PFP cost
allocations. Also, it is hoped that this study will reduce the number of contested issues
encountered in water rate cases. Part B will be addressed in a subsequent study.
2. Overview of the Public Fire Protection Charge
The Commission regulates 582 water utilities in Wisconsin. All but five of them are
municipally owned. These 582 water utilities earned a total of $665 million in revenues in 2013,
as shown in Figure 1. Approximately $140 million (21 percent) of those revenues were earned
from fire protection charges. Since the PFP charge provides such a significant share of water

2
utility revenues, it is important to make sure these charges are computed using the best methods
available.
2.1 Definition of the PFP Charge
The PFP charge is a charge that covers the costs to augment the utility’s water system in
order to provide the high flows and pressures needed to fight fires.1 These costs include a
portion of the operation and maintenance expenses, depreciation expenses, taxes, and return on
net investment rate base attributable to the relevant water plant. The augmented water plant
1 See comments by Municipal Environmental Group in PSC REF#: 286177
3
attributable to fire protection includes: wells, water treatment equipment, pumps, storage
facilities, water mains, and hydrants. The cost of the water used to fight fires is not included as it
is relatively insignificant compared to the cost of the related plant.
In many cases, if a water system did not have to provide the higher flows and required
minimum system pressure needed to fight fires, its supply, storage and distribution infrastructure
would be smaller and less costly to build, operate and maintain. Such a water system might need
less supply capacity, less pumping capacity, smaller storage facilities, smaller diameter water
mains, and few hydrants (flushing hydrants only). For many water systems, the addition of fire
flow capacity results in additional costs to build and operate the water systems. For example,
Wisconsin Admin Code § NR 811.70(5) requires that utilities install minimum 6-inch diameter
water mains for fire protection purposes. Many small communities could operate with 4-inch
diameter mains or smaller if they did not need to provide the higher flows required to fight fires.
The Commission has traditionally designed water rates to assign the cost to the
cost-causer. Therefore, it has been the Commission’s standard of practice to identify the PFP
cost-of-service, and compute corresponding PFP rates, that assign costs to the appropriate users.
The PFP charge is not simply a “hydrant rental” fee. The cost of the fire hydrants is only a small
portion of the total cost of providing PFP service. It is also important to note that the PFP charge
has no relationship with funding the fire department.
Costs associated with the augmented plant used to provide the high pressures and flows
discharged at public hydrants are paid through Schedule F-1, Public Fire Protection Service.
Costs associated with augmented plant to provide the high pressures and flows discharged
4
through an unmetered private fire protection service (sprinkler system) are paid through
Schedule Upf-1, Private Fire Protection Service – Unmetered (see Section 7).
2.2 Discussion of the PFP and General Service Customer Classes
A perfect cost-of-service model would allocate appropriate costs to each individual
customer based on their unique demand patterns and use of the water system. Unfortunately, it is
cost prohibitive to develop such a model for each water customer. Therefore, customers are
aggregated into groups with similar demand patterns. These groups, called “customer classes,”
are specifically authorized by Wis. Stat. § 196.02(2).
The PSC model identifies the following customer classes: residential, multi-family,
commercial, industrial, public authority, and the PFP customer class. The first five customer
classes use water almost daily in identifiable demand patterns. Each one represents a group of
specific water customer accounts. For that reason, these five customer classes are referred to as
general service customer classes. In contrast, the PFP customer class is very different from the
other five customer classes. The PFP customer class is essentially a standby service. It is not
related to the water use of each customer, but rather the construction characteristics of the
buildings found in the community. The PFP demand does not follow any identifiable demand
pattern, as the water is only needed when and wherever a fire occurs. Therefore, this report
recognizes PFP as a “customer class” that deserves special consideration in the cost-of-service
model, different from the modeling performed for the general service customer classes.
2.3 Identifying the Demand that Controls the Water System Design
When evaluating the capacity of a water system, engineers consider the water system’s
ability to meet demand and its ability to provide reliable service. Typically, the engineer will
5
make sure that the firm supply capacity (supply capacity with largest pumping unit out of
service) plus effective storage meets or exceeds the 1)maximum day demand plus fire demand,
or 2) maximum hour demand, whichever is greater. The maximum day plus fire demand
represents demands created by both the general service and PFP customer classes. The
maximum hour demand represents a demand created by only the general service customer class.
Then the engineer will evaluate the reliability of the water system. This assessment
entails evaluating how the water system performs under various operating scenarios including:
supply source or pump failure, maintenance of storage facilities, drought, etc. Since there is no
universally accepted definition of water system reliability, water system engineers use their
engineering judgement, state code requirements and standard industry engineering
practice. (PSC REF#: 232974 and PSC REF#: 279866.) See Appendix A for an example of a
water system capacity analysis developed by Andrew Jacque of Town and Country Engineering,
Inc.
Over the life of a water system, infrastructure is being added and replaced based on
estimates of current and future water system demand and reliability. Patrick Planton of
SEH, Inc. states that, master planning for water utilities typically uses a 20-year planning
horizon. Supply, treatment and storage projects can take years to implement, and some facilities
have useful lives in excess of 50 years. Therefore, engineers need to take future demands and
water supply needs into account. As water demand grows incrementally over years, a utility
typically is only able to increase supply in large increments (e.g., new supply well that produces
1,000 gpm). (PSC REF#: 279873.)
Unfortunately, even the best planners and engineers cannot predict the future with
certainty, so they may overestimate the water system capacity that a community needs in the

6
future. A community’s general service water demand may face unforeseen changes due to the
loss of a large industrial customer. A lengthy economic downturn along with more water
efficient appliances may reduce general service demand. As a result, some existing water
systems may have excess capacity that was designed to meet general service demand that no
longer exists.
The PSC cost-of-service model assumes that the cost to provide all extra capacity not
required to meet a community’s current water demand is to be allocated to both the general
service customer classes and the PFP customer class based on their proportionate share of the
current demand volume. Implementing cost-based rates requires an identification or estimate of
the capacity costs attributable to the general service customer classes versus the PFP customer
class. In doing so, it is helpful to consider how the size of the utility should affect whether the
general service demand or the fire demand controls the design of the water system.2 For
regulatory purposes we can identify whether a utility’s total demand is controlled by general
service (maximum hour) or by PFP (maximum day plus fire demand). The non-controlling
feature is redundant.
Wisconsin’s 582 regulated water utilities are classified by size into Class AB (serving
more than 4,000 customers), Class C (serving from 1,000 to 4,000 customers), and Class D
(serving fewer than 1,000 customers). Figure 2 shows the number of utilities in each class.
2 See comments by Municipal Environmental Group in PSC REF#: 286177

7
In smaller water systems (Class D), the fire flow typically represents the largest potential
demand on the system. In larger systems (Class AB), the maximum hour demand for general
service may be larger than the fire flow requirements, therefore maximum hour demand controls
the overall design and operation of the water system. For example, based on information from
the most recent rate case, the Orfordville Municipal Water Utility (Class D) has a maximum day
plus fire flow demand of 1,178 gpm (178 gpm + 1,000 gpm). The maximum hour demand
is 250 gpm, which is much less than the maximum day plus fire flow condition. This analysis
indicates that the maximum day plus fire flow demand is the controlling design condition of the
water system. In contrast, Milwaukee Water Works has a current maximum day plus fire flow
demand of 120,982 gpm (103,020 gpm plus 17,962 gpm). The maximum hour demand is
133,814 gpm. In this case, the maximum hour demand for general service would be the

8
controlling condition for the design and operation of the Milwaukee water system. The PSC
cost-of-service model uses the same methodology to compute PFP costs, regardless of whether
the fire flow demand controls the design of the water system or not. Figure 3 shows a plot of the
maximum day plus PSC fire flow demand versus number of customers and also a plot of the
maximum hour demand versus number of customers. This graph is based on 218 water utilities
in Wisconsin that have requested a full rate case since 2006. The data used to make the graph is
included in Appendix B.
Linear trend lines were computed and are also shown on the graph. Figure 4 shows a
detail of the same plot where the trend lines cross. Based on this analysis, the intersection of the
two trend lines is at 30,437 customers. Therefore, when PSC assumptions on a utility’s fire flow
demand are used, it appears that the maximum hour demand is the controlling demand condition
for water systems with more than 30,000 customers. There are six water utilities in Wisconsin
where the maximum hour demand is greater than the maximum day plus fire flow. Five of these
have more than 30,000 customers: Kenosha Water Utility (30,962 customers), Racine Water
Works Commission (33,981 customers), Green Bay Water Utility (35,728 customers), Madison
Water Utility (66,416 customers), and Milwaukee Water Works (162,373 customers). The sixth
utility is the Manitowoc Public Utility (13,644 retail customers) that serves a very large
wholesale population. Possible applications of this analysis will be discussed further in Section
4. If the analysis is performed using a different source for the fire demand data, then the
intersection of the trend lines may change as discussed in Section 6.4.

9

10
2.4 Types of PFP Charges
Prior to 1988, all water utilities in the state collected the PFP cost-of-service from the
local government through a “municipal charge.” The local government then recovered the
municipal charge through the tax levy. In 1988, legislation was enacted that gave the governing
body of any city, village, or town the option of collecting the PFP charge either through the tax
levy (“municipal charge”), as a “direct charge” on general service water customer bills, or as a
combination of these two options.
Figure 5 shows the distribution of various types of PFP charges among Wisconsin’s 582
regulated water utilities. There are 285 water utilities that use only the municipal PFP

11
charge (MC), 192 that use only the direct PFP charge (DC), 90 utilities that use a combination of
the municipal and direct charges (CC), and 15 utilities that have no PFP charge. A list of the
regulated water utilities in Wisconsin and the type of PFP charge that they employ is found in
Appendix C.
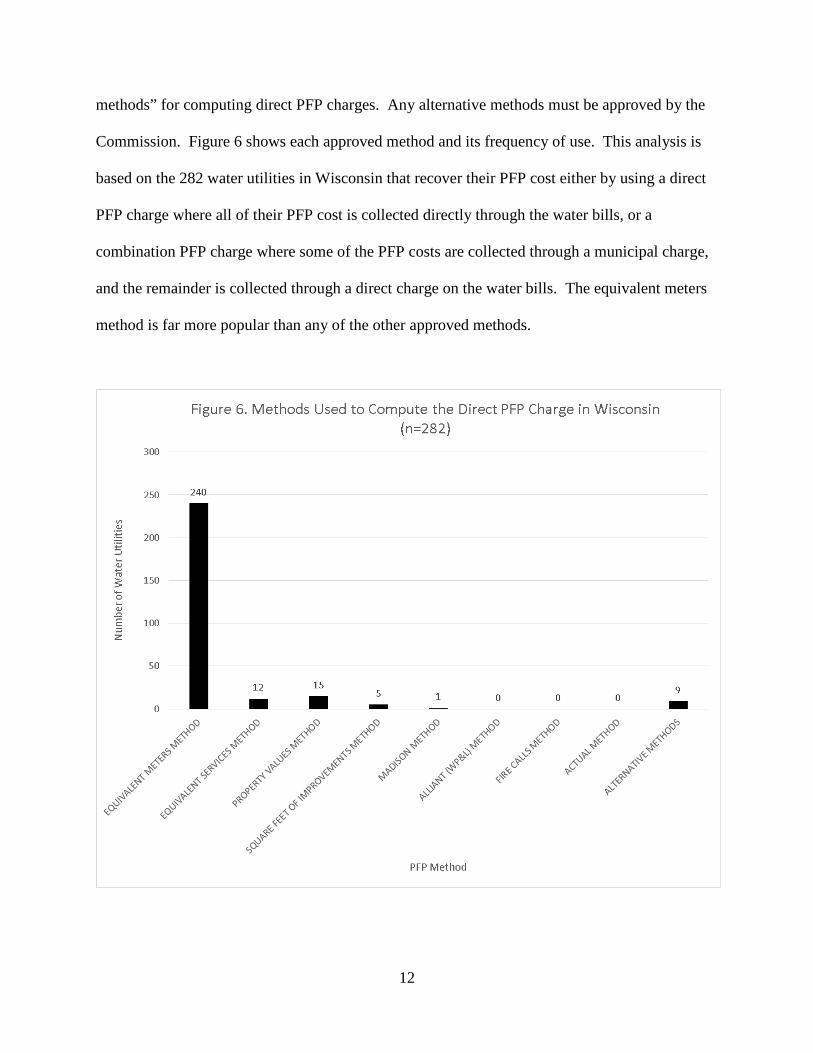
The Commission has permitted water utilities to choose between eight preapproved
methods for computing direct PFP charges: equivalent meters method, equivalent services
method, property values method, square feet of improvements method, Madison method, Alliant
Method, fire calls method, and the Actual method. The last three methods are not currently
being used. In addition, the Commission has allowed utilities to propose their own “alternative
12
methods” for computing direct PFP charges. Any alternative methods must be approved by the
Commission. Figure 6 shows each approved method and its frequency of use. This analysis is
based on the 282 water utilities in Wisconsin that recover their PFP cost either by using a direct
PFP charge where all of their PFP cost is collected directly through the water bills, or a
combination PFP charge where some of the PFP costs are collected through a municipal charge,
and the remainder is collected through a direct charge on the water bills. The equivalent meters
method is far more popular than any of the other approved methods.

13
2.5 Statutes, Administrative Code, and Policies for the PFP Charge
The PSC’s authority to regulate water utilities was created in 1907 by the Railroad
Commission and reinforced in 1931 when the PSC came into existence. Prior to 1988, water
utilities collected the cost of PFP by charging a “municipal charge” to the town, village, or city.
The municipality then recovered this money through property taxes. In 1988, the Wisconsin
State Legislature passed Wis. Stat. § 196.03(3)(b), authorizing direct charges and combination
charges for public fire protection. Subsequently, the Commission issued an order in
Docket 05-WI-100 that provided water utilities with a list of preapproved methods for computing
a direct charge for PFP. Since 1988, approximately one half of Wisconsin’s 582 regulated water
utilities have shifted all or a portion of the PFP cost to direct charges on the water bill. Some
utilities made this change to provide more room under the property tax levy limit. Others made
this change in recognition of the fact that, as their communities used less water, more of the
excess supply capacity cost was being allocated to the PFP charge. Although communities in the
latter category were not building any new plant to serve the PFP customer class, they were still
seeing an increase in the municipal PFP charge.
In 1994, the Court of Appeals of Wisconsin ruled that a charge for fire protection services
under 196.03(3)(b) is a fee and not a tax, and therefore the charging of a PFP fee against a
church is constitutional. City of River Falls v. St. Bridget’s Catholic Church of River Falls, 182
Wis. 2d 436, 513 N.W.2d 673 (Ct. App. 1994).
In 2013, the Wisconsin State Legislature enacted Wis. Stats. § 66.0602(2m)(b). This
statute provides that if a municipality adopts a new fee or a fee increase, on or after July 2, 2013,
for covered services which were partly or wholly funded in 2013 by the property tax levy, that
municipality must reduce its levy limit in the current year by the amount of the new fee or fee

14
increase, less any previous reductions. This requirement does not apply if the municipality
adopts a resolution that the levy limit should not be reduced and the resolution is approved in a
referendum. For most communities, this statute effectively eliminated the shifting of the PFP
cost from a municipal charge to a direct charge. As a result, Wisconsin’s water utilities that rely
on a municipal charge or a combination charge (about 64% of the state’s water utilities) can
expect to see a steady increase in their municipal PFP charges over the coming years for the
reasons discussed above. This increase in the municipal charge may apply pressure on their levy
limits, forcing reduced spending on other municipal services in order to pay the PFP charge if the
municipality is already at its levy limit. The effect of this legislation has a particularly large
impact on smaller communities. Approximately 29 percent of Class AB utilities rely on the
municipal charge or combination charge, while 82 percent of Class D utilities rely on either the
municipal charge or combination charge.
For illustrative purposes only, let’s consider the Orfordville Municipal Water Utility.
Currently it bills the Village of Orfordville an annual public fire protection charge of $88,602.
Suppose the Orfordville Municipal Water Utility’s next cost-of-service study results in a $20,000
increase to the PFP charge, and this exceeds the Village’s levy limit. As the Village of
Orfordville is already at its levy limit, it has three choices for handling this PFP increase: 1) It
may pay the additional $20,000 using the Village’s general fund (and proportionately reducing
funding to other Village services); 2) It may shift the $20,000 increase to the water customer’s
bill as a direct charge (and proportionately reduce the Village’s levy limit); or 3) It may shift the
$20,000 (or more) to the water customer’s bill as a direct charge and adopt a resolution for
approval in a Village-wide referendum stating that the levy limit should not be reduced.

15
3. Public Fire Protection Cost Sensitivity Using the PSC Model
The Commission uses the base extra capacity cost-of-service and rate design model as
included in the American Water Works Association (AWWA) Manual M1, 6th Edition. The
cost-of-service is based on the “base extra capacity” model. Once the model computes the cost-
of-service for the PFP customer class, that amount is recovered through PFP rates.
Characteristics of the resulting PFP cost-of-service are discussed in the following paragraphs.
3.1 Relationship of Utility Size to the PFP Cost-of-Service
Based on the PSC cost-of-service model, the smaller the water utility (the fewer number
of customers), the higher the cost of PFP as a percentage of the total cost-of-service. As
shown in Figure 7, the PFP charge ranges from 9 percent of a water utility’s total annual cost-of-
service (Milwaukee Water Works) to 45 percent of a water utility’s service costs (Tony
Municipal Water Utility). Figure 7 is based on cost-of-service data from March 2006 to the
present. This data is based on cost-of-service studies for 218 of Wisconsin’s 582 regulated water
utilities. The data are included in Appendix D.

16
3.2 Relationship of Water Sales to the PFP Cost-of-Service
Due to the way the PFP customer class is calculated in the Commission’s cost-of-service
model, the PFP cost increases as the general service consumption (consumption from the
residential, commercial, industrial, and public authority customer classes) decreases. From 2007
to 2014, there has been a decline in average residential water use in Wisconsin of almost 13
percent (2014 Wisconsin Water Fact Sheet, Public Service Commission of Wisconsin). As
utility customers reduce water usage over time (e.g., through increased use of water saving
appliances, industrial water reuse and process changes, and other efficiency improvements), the
PFP cost-of-service increases. To illustrate this relationship, Commission staff ran the cost-of-
service model for four sample utilities of various sizes. The PSC cost-of-service model for each
utility was run with incrementally lower water sales, while all other parameters were held

17
constant. The resulting plot of the percent increase in the PFP cost-of-service versus the percent
decrease in total water sales is shown in Figure 8. The data are found in Appendix E.
Reduction in water demand causes incremental increases in available water supply
capacity. As a result the water system may be over designed for current conditions and perhaps
over designed even for the foreseeable future. In cases where general service use decreases, the
PSC model allocates a portion of the excess supply capacity costs to the PFP cost-of-service. Is
it reasonable to allocate excess supply capacity costs to the PFP customer class, or should it be
allocated only to the general service customers? This question will be discussed in more detail in
Section 4.

18
3.3 Relationship of New Plant Additions to PFP Cost-of-Service
The PFP cost-of-service for a particular water utility may increase due to the additions of
new plant. Wells, water treatment technology, booster pumping equipment, transmission mains,
distribution mains, elevated storage tanks/standpipes/reservoirs, and hydrants all have some role
to play in meeting fire demand. The relative importance of each of these components in meeting
fire demand depends on the design of the particular water system.
The Orfordville Municipal Water Utility cost-of-service model is used as a “base model”
to represent a small water utility without any new plant additions. Figure 9 shows how the
addition of different types of new plant can increase the Orfordville PFP cost-of-service. By
adding $500,000 in new wells to the PSC model, the PFP cost-of-service increased by 1 percent
compared to the base model (without any new improvements). By adding $500,000 in new
hydrants, the PFP cost-of-service increased by 47 percent compared to the base model.

19
4. PSC Cost-of-Service and Rate Design Model
4.1 Overview of the PSC Model
The Commission uses the base extra capacity cost-of-service model as presented in the
AWWA Manual M1, 6th Edition. The PSC began using the AWWA-Base Extra-Capacity cost-
of-service model in the l970's, first with the Milwaukee Water Works and then applied to all of
the regulated water utilities in Wisconsin. (See e.g., PSC REF#: 276315.)
The PSC model relies on the PSC’s uniform system of accounts to categorize utility plant
and expenses. Each plant and expense account pertains to one of the following operating costs:

20
operation and maintenance expenses, depreciation expenses, taxes, and return on the net
investment rate base. These accounts are estimated for the test year, and their totals are allocated
to the following service cost functions: base system, base distribution, maximum day system,
maximum hour distribution, maximum hour storage, billing, equivalent meter, equivalent
services, and public fire protection. Service cost functions are then allocated among customer
classes: residential, multi-family, commercial, industrial, public authority, and public fire
protection. Some utilities may have additional customer classes such as wholesale customers or
a separate class for irrigation meters.
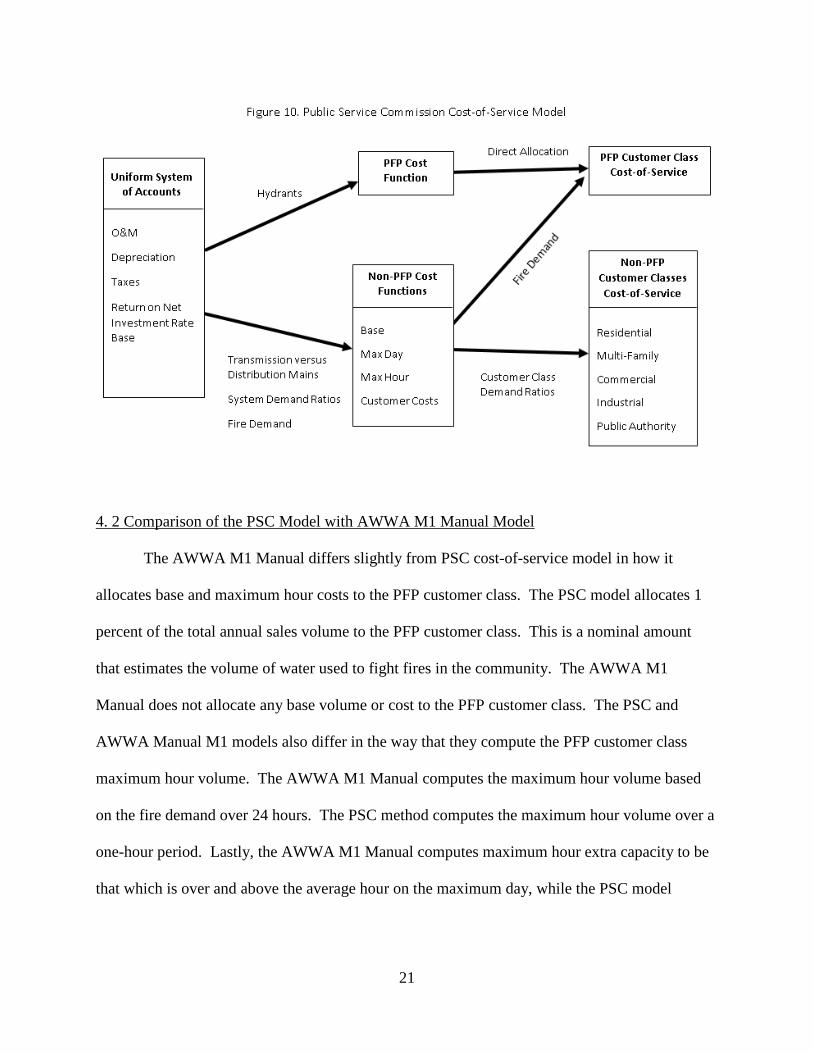
The hydrant accounts are allocated directly to the PFP cost function, which is then
directly allocated to the PFP customer class. The non-hydrant accounts are allocated to the
non-PFP cost functions. A portion of the amounts for the base system, base distribution,
maximum day system, maximum hour distribution, and maximum hour storage cost functions
are then allocated to the PFP customer class based on the fire demand maximum day and
maximum hour PFP volume relative to the maximum day and maximum hour volumes computed
for the other customer classes using their customer demand ratios. The total PFP customer class
is then used to compute the PFP rates. Note that the fire demand and duration affects both the
amount of costs allocated to the maximum day and maximum hour cost functions, and the share
of those functions allocated to the PFP customer class. The non-PFP cost functions are affected
by the system demand ratios and the proportion of transmission versus distribution mains (where
there is not more specific cost data). Figure 10 summarizes how the PSC cost-of-service model
computes the PFP cost-of-service.
21
4. 2 Comparison of the PSC Model with AWWA M1 Manual Model
The AWWA M1 Manual differs slightly from PSC cost-of-service model in how it
allocates base and maximum hour costs to the PFP customer class. The PSC model allocates 1
percent of the total annual sales volume to the PFP customer class. This is a nominal amount
that estimates the volume of water used to fight fires in the community. The AWWA M1
Manual does not allocate any base volume or cost to the PFP customer class. The PSC and
AWWA Manual M1 models also differ in the way that they compute the PFP customer class
maximum hour volume. The AWWA M1 Manual computes the maximum hour volume based
on the fire demand over 24 hours. The PSC method computes the maximum hour volume over a
one-hour period. Lastly, the AWWA M1 Manual computes maximum hour extra capacity to be
that which is over and above the average hour on the maximum day, while the PSC model
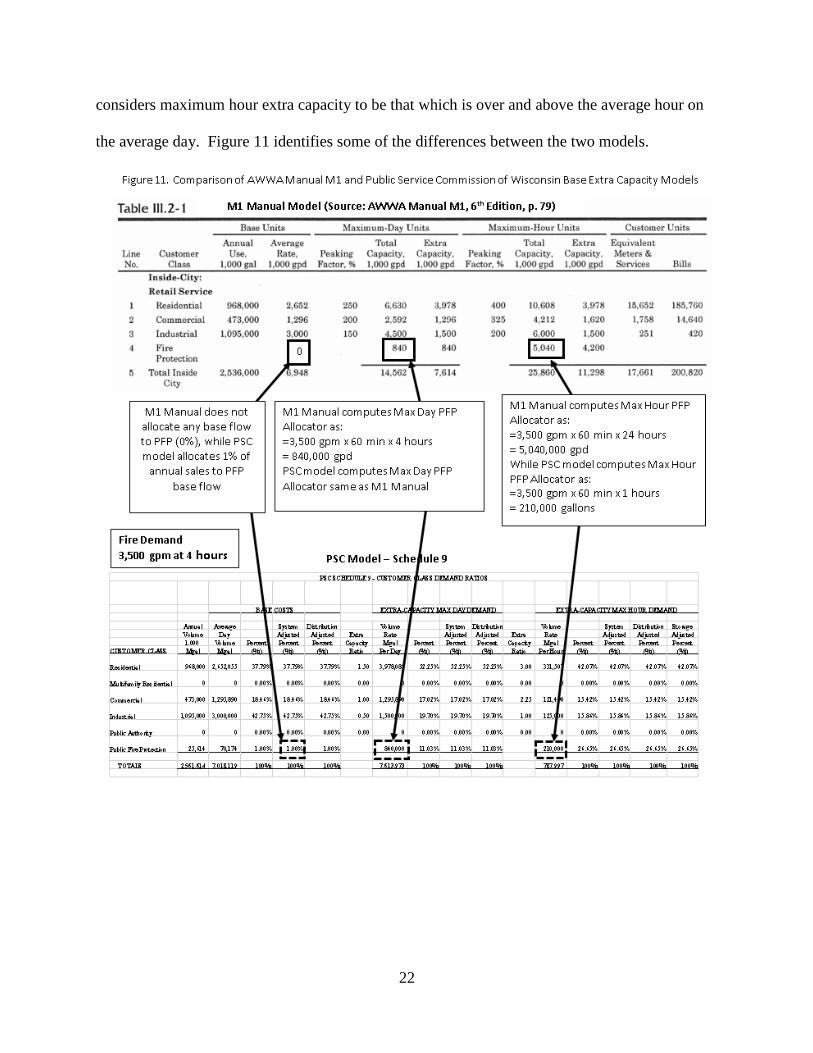
22
considers maximum hour extra capacity to be that which is over and above the average hour on
the average day. Figure 11 identifies some of the differences between the two models.

23
4.3 PSC Computation of Fire Demand
The fire demand used for each of the regulated water utilities in Wisconsin were based on
studies done by the National Board of Fire Underwriters (NBFU). NBFU’s fire demand
calculations, based on a population based equation, formed the basis for the municipal fire flows
used in the PSC water rate cases in the 1970s. NBFU was the forerunner to the Insurance
Services Office (ISO). As noted in comments received in this investigation: “Shortly after ISO
was formed in 1971, it revised the method for identifying fire risk and associated fire flow for
insurance purposes thus the PSC no longer had access to a specific ‘community’ fire flow rate as
it had in the past under NBFU ratings. Because of this change, the PSC staff began prescribing
fire flows in rate cases consistent with the now defunct NBFU grading schedule and over time
has adjusted them as needed to maintain consistency among Wisconsin water utilities.” (PSC
REF#: 276315)
During a water rate case, Commission staff compares the community’s fire demand with
several population based equations: the National Board of Fire Underwriters (NBFU), the
Freeman equation, and the Kuickling equation. Commission staff also estimates the water
system’s capacity to fight fires based on the capacity of existing wells and the effective storage
volumes of reservoirs and elevated storage tanks. Usually, the fire demand used in the previous
rate case is confirmed and carried through to the new rate case. Commission staff changes the
fire demand only if the community’s population has changed dramatically, the capacity of the
water system is less than the community’s estimated fire demand, or for some other compelling
reason. The fire duration is usually the fire flow derived from the above formulas divided
by 1,000 (e.g. 8,000 gpm for 8 hours). These NBFU, Freeman, and Kuickling formulas have
been in use for over 70 years. The Kuickling formula was first published in 1911. The NBFU

24
method is the most recent and dates from the 1940s. It uses data of actual fires between 1906
and 1911 (Carl, K., Young, R., and Gordon Anderson, “Guidelines for Determining Fire-Flow
Requirements”, May 1973, AWWA Water Technology/Distribution Journal).
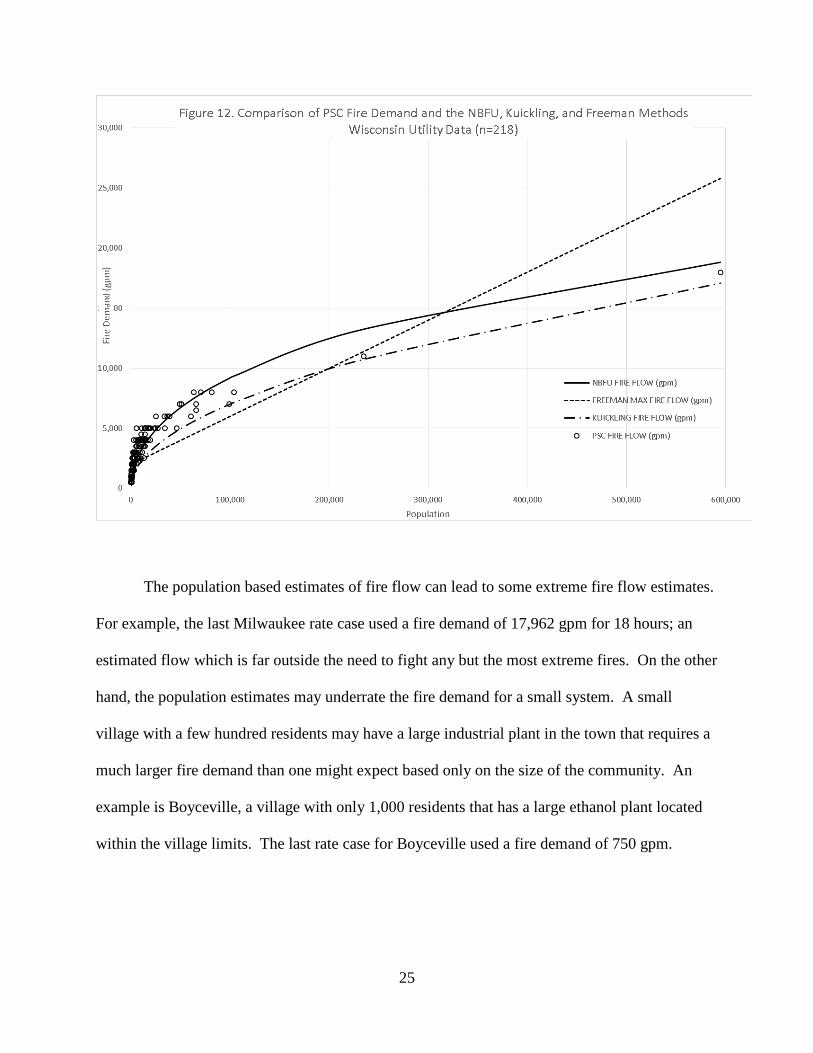
Commission staff has developed a plot of the PSC fire demand versus population for a
sample of regulated water utilities in Wisconsin. Figure 12 includes the data from 218 water
utilities that have undergone a cost-of-service study between 2006 and the present. The figure
also plots the computed fire demand based on population using the NBFU, Freeman, and
Kuickling fire flow equations. The plot shows that the PSC fire demand closely follows the
NBFU method up to a population of about 80,000 persons. The four data points representing
Wisconsin’s four largest water utilities more closely follow the Kuickling method. The data
tables used to create this figure are found in Appendix F.
25
The population based estimates of fire flow can lead to some extreme fire flow estimates.
For example, the last Milwaukee rate case used a fire demand of 17,962 gpm for 18 hours; an
estimated flow which is far outside the need to fight any but the most extreme fires. On the other
hand, the population estimates may underrate the fire demand for a small system. A small
village with a few hundred residents may have a large industrial plant in the town that requires a
much larger fire demand than one might expect based only on the size of the community. An
example is Boyceville, a village with only 1,000 residents that has a large ethanol plant located
within the village limits. The last rate case for Boyceville used a fire demand of 750 gpm.

26
4.4 Impact of Fire Demand on the PFP Cost-of-Service
In the PSC cost-of-service model, the utility’s fire demand (gpm) and duration (hours) do
not impact the computation of the PFP cost function (hydrant costs). However, the fire demand
and duration do impact the calculation of the costs assigned to the PFP customer class (costs
associated with hydrants and oversized infrastructure needed to generate fire flow). First, an
increase in the fire demand and duration increases the maximum day and maximum hour system
demand ratios. These in turn increase the allocation of operation and maintenance expenses,
depreciation expenses, taxes, and return on net investment rate base to the maximum day and
maximum hour extra capacity cost functions, as shown in Figure 13 below.
Fire
Dem
and
(gpm
)
Reve
nue
Requ
irem
ent (
$)
Base
Cos
t - S
yste
m($
)
Base
Cos
t - D
istr
ibut
ion
($)
Max
Day
-Sys
tem
($)
Max
Day
- Di
strib
utio
n ($
)
Max
Hou
r - S
yste
m ($
)
Max
Hou
r (Di
strib
utio
n)
Max
Hou
r (St
orag
e)
Cust
omer
Cos
ts
Fire
Pro
tect
ion
No Change
No Change
No Change
No Change
No Change
Figure 13. Impact of Fire Demand on Allocation of Operating Costs to Cost Functions

27
Second, an increase in the fire demand increases the volume rate per day and volume rate
per hour that is used to allocate the non-PFP cost functions to the PFP customer class. See
Figure 14 below.
Next, the non-billing cost function totals (base system, base distribution, maximum day
system, maximum hour distribution, and maximum hour storage cost function) are allocated to
the public fire protection customer class based on the PFP customer class’ relative volume
percentage. The bottom line is that an increase in the fire demand results in an increase in costs
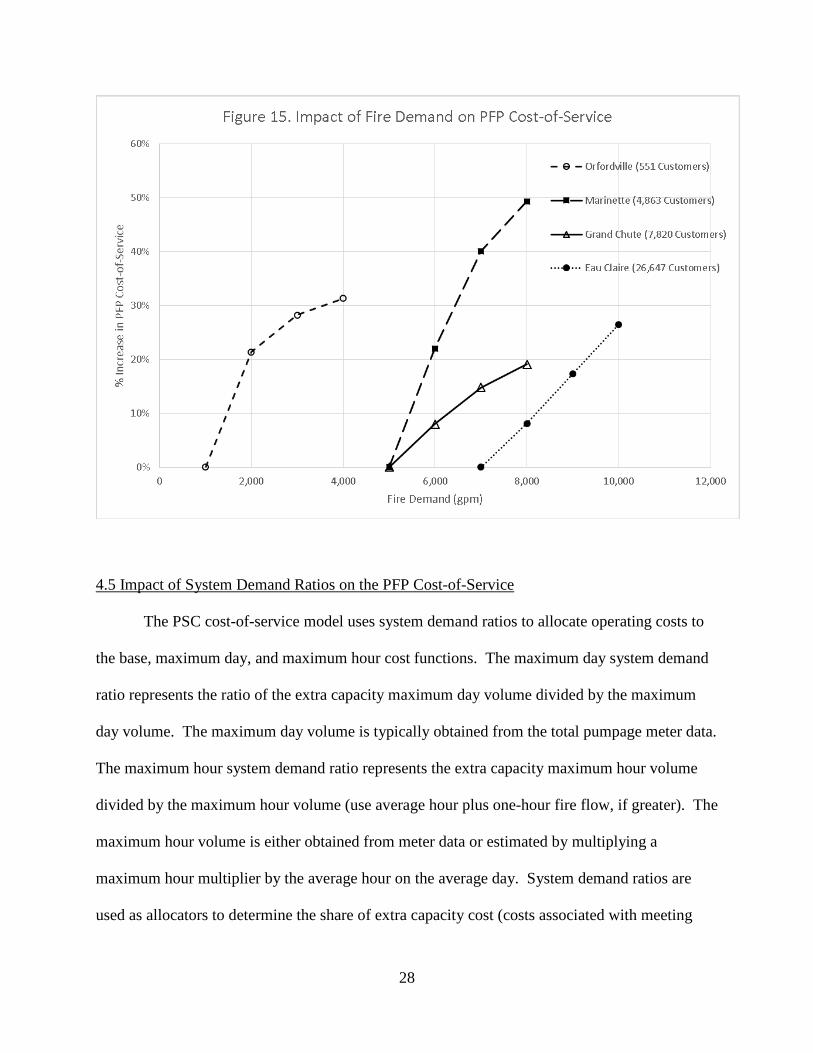
allocated to the PFP customer class. As shown in Figure 15, Commission staff plotted the
impact of increasing fire demand on four different sized water utilities. Holding other factors
constant, as the fire demand increased so did the percent increase in the PFP cost-of-service.
28
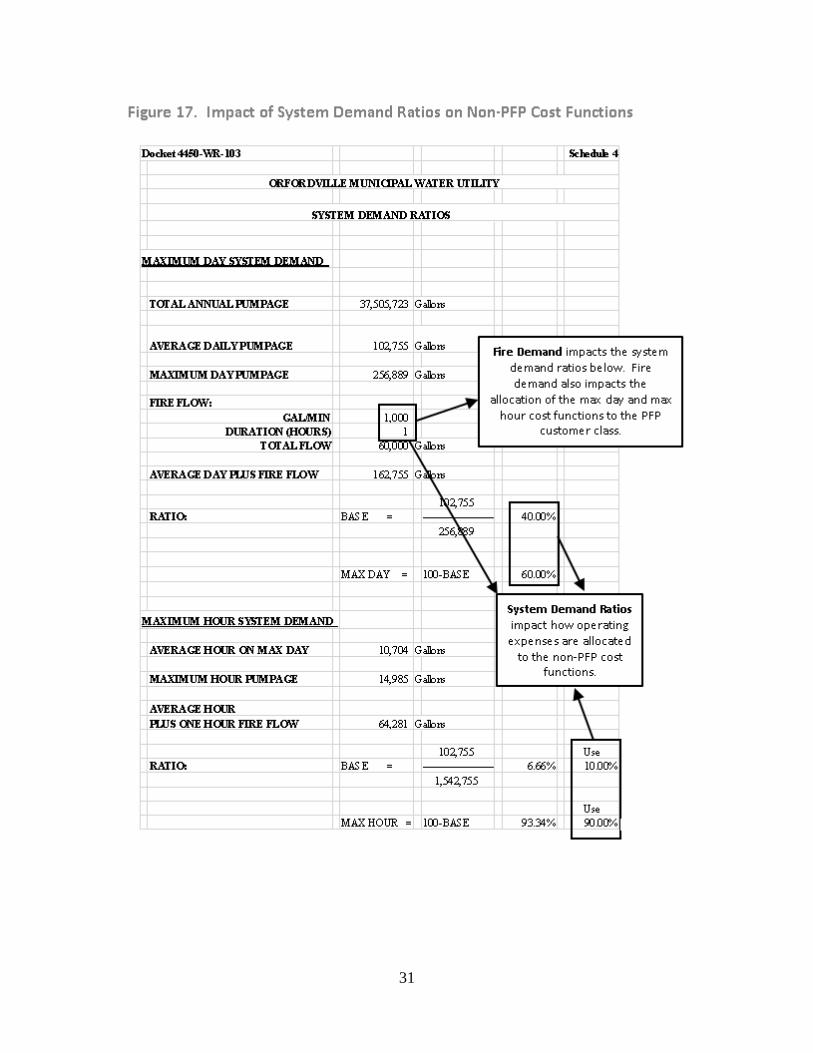
4.5 Impact of System Demand Ratios on the PFP Cost-of-Service
The PSC cost-of-service model uses system demand ratios to allocate operating costs to
the base, maximum day, and maximum hour cost functions. The maximum day system demand
ratio represents the ratio of the extra capacity maximum day volume divided by the maximum
day volume. The maximum day volume is typically obtained from the total pumpage meter data.
The maximum hour system demand ratio represents the extra capacity maximum hour volume
divided by the maximum hour volume (use average hour plus one-hour fire flow, if greater). The
maximum hour volume is either obtained from meter data or estimated by multiplying a
maximum hour multiplier by the average hour on the average day. System demand ratios are
used as allocators to determine the share of extra capacity cost (costs associated with meeting

29
peak demand) versus base cost (costs to provide average rate of water use). Some factors that
may impact the system demand ratios include: the loss or addition of a customer that has a high
peak demand (power plant or canning company), or for example a change in the utility’s fire
demand. Figure 16 shows a plot of Wisconsin water utilities that have had a rate case from 2006
to the present (the two largest utilities have been removed from the figure for clarity purposes).
The figure shows that, as utilities increase in size, their peak demands decrease in relation to
their base demand. Please note that the system demand ratios do not impact the PFP cost
function, because the PFP cost function only receives hydrant costs. The system demand ratios
do impact the allocation of costs to the base, maximum day, and maximum hour cost functions,
and ultimately it impacts the PFP customer class. The data used to produce Figure 16 is found in
Appendix G. Figure 17 shows how the system demand ratios are calculated in the PSC
cost-of-service model.

30
31

32
4.6 Impact of Transmission and Distribution Mains on the PFP Cost-of-Service
The PSC classifies water mains into two categories: transmission mains and distribution
mains. Generally speaking, water mains larger than 12 inches in diameter are transmission
mains, and water mains less than 12 inches in diameter are classified as distribution mains. The
PSC model typically classifies 12-inch diameter mains as transmission mains for Class C and D
utilities, and as distribution mains for Class AB utilities. The reason for this classification is that
the PSC model assumes that transmission mains are designed largely to meet maximum day
demand, while distribution mains are designed to meet maximum hour demand. Therefore,
transmission main costs are typically allocated to the base and maximum day cost functions,
while distribution main costs are allocated to the base and maximum hour cost functions. The
apportioning of transmission and distribution mains does not impact the PFP cost function, but it
does impact the allocation of water main costs to the base, maximum day, and maximum hour
cost functions, and ultimately it impacts the PFP customer class. Figure 18 shows how the PSC
cost-of-service model uses the proportion of transmission mains to distribution mains to allocate
main costs to non-PFP cost functions.

33

34
Figure 19 shows the impact on the PFP cost-of-service model for the Orfordville
Municipal Water Utility with the reclassification of 1,000, 2,000, and 3,000 feet of main from
transmission main to distribution main.
4.7 Impact of the Customer Demand Ratios on the PFP Cost-of-Service
The maximum day (hour) customer demand ratios are the difference between total
maximum day (hour) demand of a particular customer class and the average day rate of use of
that same customer class. Before the advent of advanced metering infrastructure, water utilities
rarely collected customer class maximum day and maximum hour water use data, so
Commission staff developed estimates of the customer demand ratios for each customer class.

35
These customer demand ratios were handed down from rate case to rate case. Now that some
utilities have meters that are actually collecting maximum day and maximum hour customer
class data, Commission staff will be able to refine these customer demand ratios accordingly.
Customer demand ratios are community specific. For some communities the residential class is
more demand oriented than the industrial class. The residential class may use water heavily in
the mornings and evenings, while the industrial class may use water uniformly throughout the
week. In other cases, the industrial customer class is more demand oriented than the residential
class (such as power plants or canning factories). Non-uniform usage causes the utility to
construct plant of a larger scale than would be needed if all usage were uniform. As such, other
factors aside, if demand related costs are going up significantly in a rate case, classes with higher
demand ratios will typically receive a higher percentage increase in rates than good load factor
classes.
Customer demand ratios are used to compute maximum day and maximum hour demand
volumes for the non-PFP customer classes including: residential, multifamily residential,
commercial, industrial, and public authority customer classes. These volumes are then
used (along with the fire demand) to compute the relative maximum day and maximum hour
allocation percentages of the PFP customer class. The PFP allocation percentages are then used
to allocate a portion of the base, maximum day, and maximum hour cost functions to the PFP
customer class.
Figure 20 shows the impact of the customer demand ratios on the PFP cost-of-service.
For each of the four utilities shown in the graph, if the maximum day and maximum hour
customer demand ratios for the non-PFP customer classes are lowered, the PFP cost-of-service
increases proportionately. This is due to the fact that the PFP customer class depends on the

36
relative volume of each customer class, which in turn depends on the customer demand ratios.
The smaller the customer demand ratios, the smaller the relative base, maximum day, and
maximum hour volumes for each non-PFP customer class. As a result, the PFP base, maximum
day, and maximum hour volumes increase, and the PFP cost-of-service increases. Generally, the
larger the number of customers, the larger the PFP cost-of-service, but sometimes the cost of
new plant can result in a smaller utility (Marinette) having a larger PFP cost-of-service than a
larger utility (Grand Chute). Also note that while the customer demand ratios impact the PFP
customer class, they do not impact the PFP cost function.

37
4.8 Allocating Costs to the PFP Cost Function
Within the PSC cost-of-service model, the PFP cost function essentially identifies the
operating costs associated with fire hydrants. The hydrant costs are included in the following
accounting schedules: operation and maintenance expenses, depreciation expenses, taxes, and
return on net investment rate base. The hydrant costs from each accounting schedule are then
added together to compute the total PFP cost function. Figure 21 shows the PFP cost function
amount compared to the number of hydrants for four selected utilities. The strong linear
relationship shows that the PFP cost function is highly correlated with the number of hydrants.

38
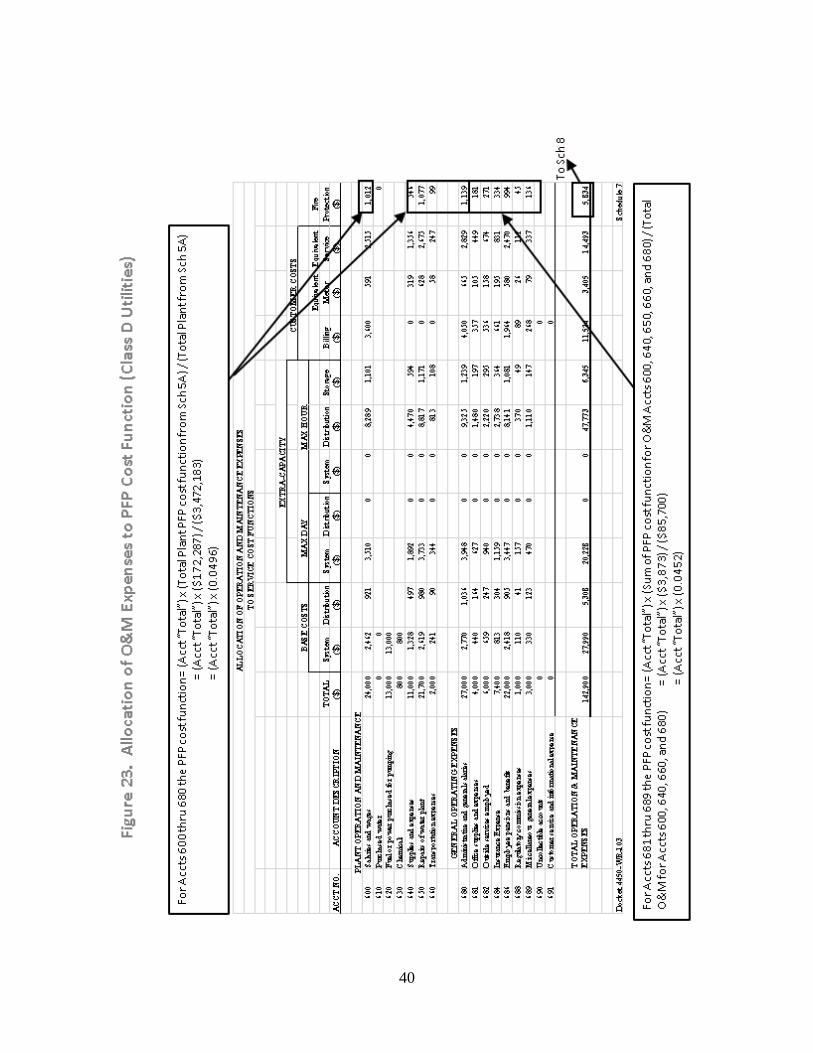
Figure 22 shows how the PSC model allocates the depreciation expense accounts to the
PFP cost function (same for Utility Financed Plant and Total Plant schedules). Figure 23
illustrates how the operation and maintenance expense accounts are allocated to the PFP cost
function. Figure 24 displays how the PFP cost function totals from each accounting schedule are
then totaled to derive the total PFP cost function column. The total PFP cost function is then
directly allocated to the PFP customer class. It is important to note that the total PFP cost
function is not affected by the fire demand, the system demand ratios, or the amount of
transmission mains versus distribution mains. Nor is it impacted by the water usage of the other
customer classes.

39
40

41

42
4.9 Allocating Costs to the PFP Customer Class
The PFP customer class represents the total PFP cost-of-service. It includes hydrant
costs (PFP cost function), and it also includes the costs associated with oversized
infrastructure (e.g. wells, mains, elevated storage tanks, etc.) needed to generate the high flows
used to fight fires. A portion of the base, maximum day, and maximum hour cost functions
capture the costs of these oversized facilities. The PSC cost-of-service model allocates operating
expenses (including operation and maintenance expenses, depreciation expenses, taxes, and
return on net investment rate base) to the base, maximum day, and maximum hour cost functions
based on the system demand ratios and the amount of transmission main to distribution main.
Figures 25 and 26 demonstrate how the PSC model allocates the depreciation expense accounts
to the base, maximum day, and maximum hour cost functions. Figure 27 shows how the
operation and maintenance expenses are allocated to the base, maximum day, and maximum
hour cost functions.

43

44

45

46
The total amounts of the base, maximum day, and maximum hour cost functions are then
allocated to the PFP customer class based on the volume of the PFP customer class (annual,
maximum day, and maximum hour volumes) as compared to the volumes from the other
customer classes (residential, commercial, industrial, and public authority customer classes).
The annual PFP volume is defined as one percent of the utility’s total annual sales volume. The
maximum day and maximum hour PFP volumes are a function of the utility’s fire demand and
duration. The relative volumes of each customer class are a function of their respective annual
sales volume and their customer demand ratios. Figure 28 shows how the base, maximum day,
and maximum hour cost functions are allocated to the PFP customer class.

47

48
4.10 Rate Design
The PSC rate design method strives to follow several important criteria identified by
James Bonbright in his book, “Principles of Public Utility Rates” (Columbia University Press,
1961). Bonbright claims that well designed utility rates will meet the following criteria:
• Practical, simple, and easily understandable.
• Clear, having only one interpretation.
• Achieve proper revenue requirement.
• Provide relatively stable revenues.
• Avoid unnecessary rate shock.
• Based on the cost of providing service.
• Not be unduly discriminatory.
• Promote justified applications and discourage wasteful use.
Keeping these criteria in mind, the mechanics of how the PSC model computes PFP rates
is summarized below. The total amount allocated to the PFP customer class is the PFP
cost-of-service. This is the amount that the PFP rates must recover if the water utility is to
remain financially viable. As discussed in Section 3 of this report, there are three types of PFP
charges, the “municipal charge” (PFP cost-of-service billed to local government and collected
through property taxes), the “direct charge” (PFP cost-of-service collected through water bills),
and a combination of the two.
The municipal charge is simply that portion of the PFP cost-of-service that the utility and
municipality have agreed should be paid for through property taxes. This charge is directly
billed to the municipality. A sample tariff is shown in Figure 29.

49
Figure 29. Sample Tariff for Municipal PFP Charge.
The four most popular preapproved methods for computing the direct PFP charge are: the
equivalent meters method, the equivalent services method, the property values method, and the
square feet of improvements method.
The equivalent meters method is used by 240 of Wisconsin’s 582 regulated water
utilities. It computes charges based on ratios of meter size. Figure 30 shows how the equivalent
meter ratios are used to compute the PFP rates. First, the PSC rate model divides the PFP
cost-of-service by the number of billing periods per year and by the total equivalent meters for
the particular utility. The resulting value is the “Charge per billing period per equivalent meter”
which is $14.38 as shown in the figure. Then, this value is used to compute the equivalent
charges for each meter size. For each meter size, the equivalent charge is equal to the charge per
billing period per equivalent meter times the appropriate equivalent meter ratio. For example,
a 6-inch meter would be charged the equivalent meter charge of $14.38 times an equivalent
meter ratio of 50 which equals a quarterly fee of $718.75. Then, the proposed charges are
entered by hand by rounding up or down the equivalent charges. The PFP cost-of-service is then

50
compared to the total calculated PFP revenue using the proposed charges. The proposed charges
are adjusted until the difference is deemed immaterial.
The equivalent meter method is popular because it is relatively easy to administer.
Unfortunately, it is not perfectly equitable. For example, a warehouse with a 5/8-inch meter will
pay the same PFP charge as a town home with the same size meter, even though the warehouse
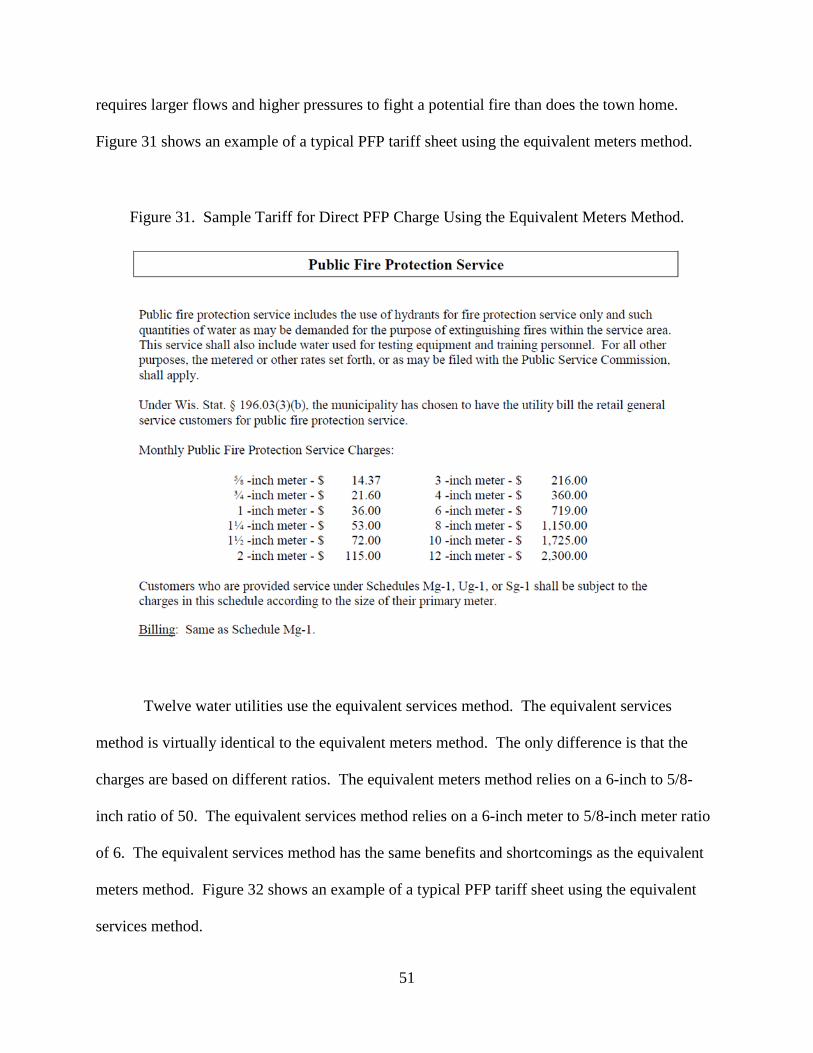
51
requires larger flows and higher pressures to fight a potential fire than does the town home.
Figure 31 shows an example of a typical PFP tariff sheet using the equivalent meters method.
Figure 31. Sample Tariff for Direct PFP Charge Using the Equivalent Meters Method.
Twelve water utilities use the equivalent services method. The equivalent services
method is virtually identical to the equivalent meters method. The only difference is that the
charges are based on different ratios. The equivalent meters method relies on a 6-inch to 5/8-
inch ratio of 50. The equivalent services method relies on a 6-inch meter to 5/8-inch meter ratio
of 6. The equivalent services method has the same benefits and shortcomings as the equivalent
meters method. Figure 32 shows an example of a typical PFP tariff sheet using the equivalent
services method.

52
Figure 32. Sample Tariff for Direct PFP Charge Using the Equivalent Services Method.
The property values method is used by 15 water utilities. This method requires that the
utility compute the assessed value of all of the municipality’s taxable parcels. The utility then
must also identify and estimate the value of parcels that are tax-exempt (tax-exempt properties
must pay the direct PFP charge). The sum of these two amounts is the total property value. The
PFP cost-of-service is then divided by the total property value amount to obtain a PFP rate of
dollars in PFP charge per 100,000 dollars of assessed valuation. Each property owner is then
directly billed a direct PFP charge based on its property’s assessed value (or the property’s
estimated assessed value in the case of tax-exempt properties). This method may be more
equitable in that the PFP charge closely reflects the benefits received. In addition, this method
closely mimics how property owners would be charged if the PFP were collected as a municipal
53
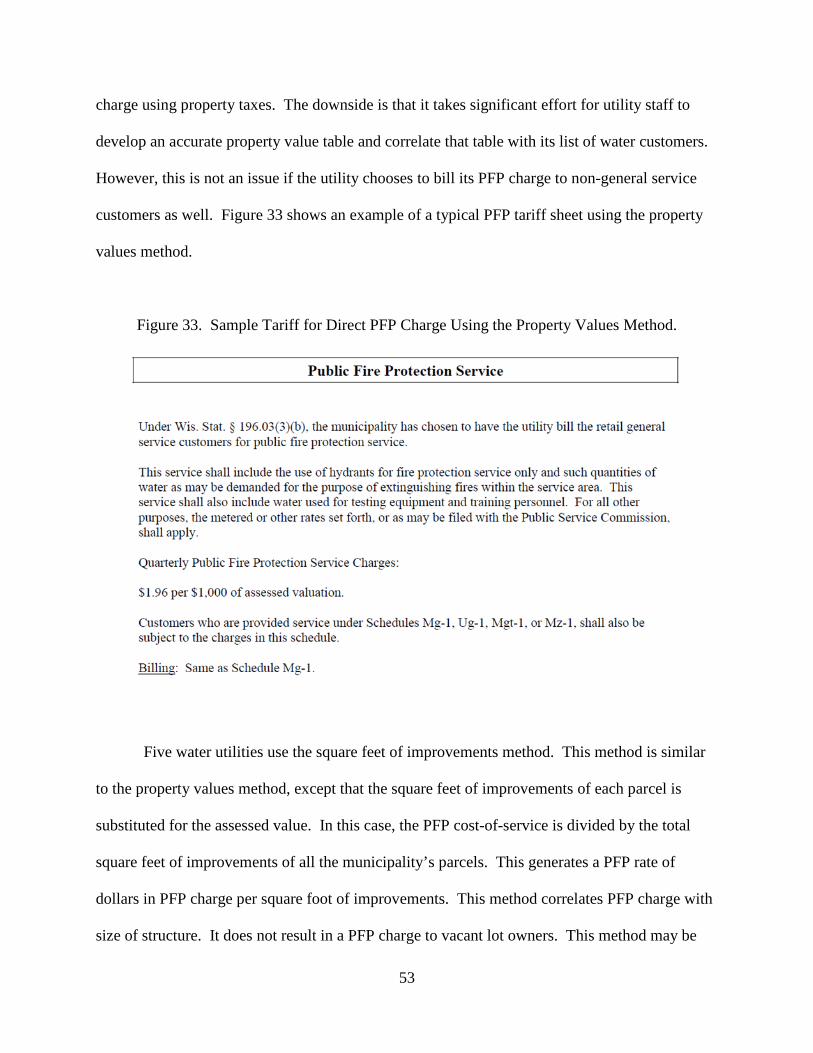
charge using property taxes. The downside is that it takes significant effort for utility staff to
develop an accurate property value table and correlate that table with its list of water customers.
However, this is not an issue if the utility chooses to bill its PFP charge to non-general service
customers as well. Figure 33 shows an example of a typical PFP tariff sheet using the property
values method.
Figure 33. Sample Tariff for Direct PFP Charge Using the Property Values Method.
Five water utilities use the square feet of improvements method. This method is similar
to the property values method, except that the square feet of improvements of each parcel is
substituted for the assessed value. In this case, the PFP cost-of-service is divided by the total
square feet of improvements of all the municipality’s parcels. This generates a PFP rate of
dollars in PFP charge per square foot of improvements. This method correlates PFP charge with
size of structure. It does not result in a PFP charge to vacant lot owners. This method may be

54
difficult to administer for those utilities that lack a municipal Geographic Information System.
Figure 34 shows an example of a typical PFP tariff sheet using the square feet of improvements
method.
Figure 34. Sample Tariff for Direct PFP Charge Using the Square Feet of Improvements Method.
4.11 Allocating PFP Costs to Wholesale Customers
There are 28 regulated water utilities in Wisconsin that provide wholesale water service.
These wholesale providers serve 53 water utilities that act as wholesale customers. The largest
wholesale provider in the state is Milwaukee Water Works. Appendix H contains a table of
these wholesale providers along with the communities that it serves.
The existing PSC cost-of-service and rate design model was created to ensure that the
wholesale customer pays the appropriate cost for any PFP benefits it receives. PFP benefits to
wholesale customers include the cost to provide the higher flows at sufficient pressure and

55
duration needed to fight fires in the wholesale customer community. If needed, a wholesale
customer may rely on the wholesale provider’s excess supply capacity, transmission mains, and
water storage volume to meet the wholesale customer’s PFP needs.
PFP charges to wholesale customers are often contentious issues in water rate cases. The
wholesale provider and the wholesale customer could have a contract that clearly defines the
water service being provided (maximum day, maximum day plus fire flow, etc.). In such cases,
the cost-of-service and rate model could reflect the requirements of the contract. If the wholesale
contract is not clear, or if the actual wholesale supplier’s system hydraulics cannot meet the
minimum contract requirements, then an analysis would be performed to determine what level of
service the wholesale customer actually receives. In the final decision for the latest Milwaukee
Water Works rate case (Docket 3720-WR-108) the Commission ruled that the “Oak Creek
criteria” (Docket 4310-WR-104, p. 32) should be used to determine what PFP charge the
wholesale customer should be allocated. Those criteria are:
• The wholesale customer has the capability to meet its maximum day plus fire flow based
on its own distribution storage.
• The wholesale supplier cannot provide maximum day plus fire flow to the wholesale
customer.
• There exist contractual limitations to the wholesale supplier’s ability to provide
maximum day plus fire flow.
• There exist technical limitations (i.e. flow control devices) to the wholesale supplier’s
ability to provide maximum day plus fire flow.
When performing a cost-of-service study for a wholesale provider, the PSC model first
allocates a portion of the PFP cost-of-service (base distribution, maximum day distribution,

56
maximum hour distribution, and the hydrants costs) solely to the retail customers (retail only
allocation). Then, the PSC model allocates the remaining portion of the PFP cost-of-service
(base system, maximum day system, maximum hour system, and maximum hour storage, where
applicable) to both the wholesale and retail customers (combined allocation). The cost functions
included in each of these two PFP allocations are shown in Figure 35.
Figure 35. PFP Cost Allocation to Retail and Wholesale Customers
The “Combined Allocation” of the PFP customer class (base system, maximum day
system, maximum hour system and maximum hour storage) is then allocated between the retail
and wholesale customers using one of the following methods:
• Population-based methods – relative populations

57
• Milwaukee Method – average of Freeman’s Formula maximum and min, NBFU Method,
and Kuickling Method
• Equivalent meters
• Feet of main / D x L / D x D x L
• Number of customers
• Consumption
• Fire flows totals – flow rate x duration
• Elevated storage
• Number of hydrants
• Wholesaler’s retail PFP charge to wholesale meter
• Combination of various methods
Appendix H also lists the methods used to allocate the PFP cost to the wholesale
customers. Figure 36 shows the number of Wisconsin’s wholesale customers using each PFP
allocation method.

58
5. Methods Used by Other States to Compute and Recover the Public Fire Protection Cost
The PSC created a survey comprised of 20 questions to find out how other public utility
commissions of each state in the United States computes public fire protection costs, allocates
them to the cost functions and customer classes, and then develops appropriate rates. The survey
was sent via email to all 50 public utility commissions. The first email was sent on April 14,
2015. As needed, follow-up emails were sent in May, June, and July 2015. The results of the
survey are included in Appendix I. All 50 public utility commissions responded to the survey.
The quality of the responses varied. The answers to Questions 1 and 2 are discussed below. The
remaining answers are discussed in Section 6 of this report.
59
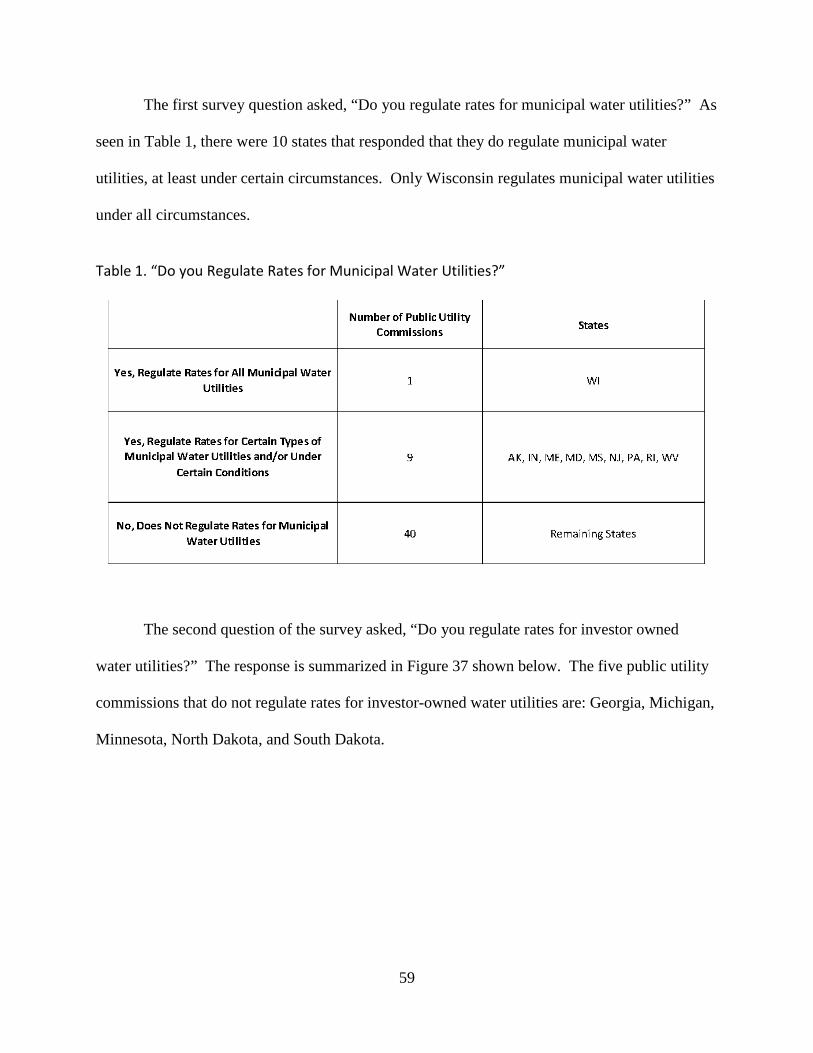
The first survey question asked, “Do you regulate rates for municipal water utilities?” As
seen in Table 1, there were 10 states that responded that they do regulate municipal water
utilities, at least under certain circumstances. Only Wisconsin regulates municipal water utilities
under all circumstances.
Table 1. “Do you Regulate Rates for Municipal Water Utilities?”
The second question of the survey asked, “Do you regulate rates for investor owned
water utilities?” The response is summarized in Figure 37 shown below. The five public utility
commissions that do not regulate rates for investor-owned water utilities are: Georgia, Michigan,
Minnesota, North Dakota, and South Dakota.

60
6. Discussion of Options for Computing and Allocating the Public Fire Protection Charge
Section 4 of this report describes how the PSC model currently computes PFP
cost-of-service and rates. The following sections discuss possible improvements to the PSC
model.
6.1 Computation of Fire Demand
As discussed in Section 4 of this report, the PSC model uses the community’s estimated
fire demand as one factor in computing the non-PFP cost functions. When performing a
cost-of-service study, the PSC model relies on a previous estimate of fire demand from the most
recent rate case, unless there is a reason to change it. Historically, PSC fire demands were based
61
on the NBFU method. This population based equation has the advantage of being consistent
with prior practice. Unfortunately, it may be overestimating the fire demand for large systems
because actual fire demand tops out at the largest building fire, regardless of the size of the
population being served. It also may be underestimating the fire demand of smaller communities
because it does not take into account site specific fire hazards like large industries that may be
located in small communities. In addition, the NBFU population-based equation is based on data
that is over 70 years old, and it does not reflect the current state of fire science.
Today, the Insurance Services Office (ISO) has replaced the NBFU as the national
standard for computing a community’s fire demand. ISO assigns each community a rating
between 1 and 10 based on its firefighting ability. This rating system is a national standard used
by insurance companies to calculate property and homeowners’ insurance premiums. To
determine a community’s rating, ISO conducts on-the-ground surveys of the structures in a
community and calculates a “needed fire flow” (NFF) for each building. When computing each
NFF, ISO takes into account the building area, occupancy, construction type, building use, and
exposures, and the presence of sprinklers. ISO also performs actual hydrant flow tests in each
community to rate the effectiveness of the distribution system to provide water for firefighting.
As part of the rating process, ISO considers the fifth‐highest NFF (NFF5) as representative of the
fire demand for a given community. Unlike the population based formulas, the NFF5 is not an
estimate. It is calculated directly from data about structures located within the community and,
therefore, reflects the unique character of each community.

62
Figure 38 shows that, based on the survey of the 50 public utility commissions, there
are 15 states that compute the community’s fire demand and duration when they calculate the
PFP cost-of-service. Figure 39 shows that 8 of those 15 utilities use the ISO method to compute
fire demand, while three use the population based equations.

63
Commission staff obtained NFF5 fire flow data for 477 of Wisconsin’s 582 regulated
water utilities as a result of generous help from the Insurance Services Office. The sample
consists of 76 Class AB utilities, 126 Class C utilities, and 275 Class D utilities. The data are
shown in Appendix J. Commission staff compared the NFF5 fire flow with the PSC fire demand
to see how they differ. Figure 40 shows that for 26 of the 76 Class AB utilities sampled, the ISO
NFF5 fire flow was greater than the PSC fire demand. The adoption of the ISO NFF5 fire flow
in the PSC cost-of-service study would result in an increase in the PFP cost-of-service for these
26 utilities. Another 35 Class AB utilities from the same sample had ISO NFF5 fire flows less

64
than the PSC fire demand. The remaining 15 Class AB utilities from the same sample had ISO
NFF5 fire flows equal to the PSC fire demand. Figure 40 shows that for 82 of the 126 Class C
utilities sampled, the ISO NFF5 fire flow was greater than the PSC fire demand. The adoption of
the ISO NFF5 fire flow in the PSC cost-of-service study would result in an increase in the PFP
cost-of-service for these 82 utilities. Another 24 Class C utilities from the same sample had ISO
NFF5 fire flows less than the PSC fire demand. The remaining 20 Class C utilities from the
same sample had ISO NFF5 fire flows equal to the PSC fire demand. Among the 275 Class D
utilities sampled, 246 had an ISO NFF5 fire flow greater than the PSC fire demand. Only 17
Class D utilities had ISO NFF5 fire flows less than the PSC fire demand, and another 12 utilities
had ISO NFF5 fire flows equal to the PSC fire demand. Assuming that the 477 utilities sampled
are statistically representative of the entire population of the 582 regulated water utilities in
Wisconsin, the use of the ISO NFF5 fire flows would decrease the PFP cost-of-service for 46
percent of the Class AB utilities. Approximately 65 percent of the Class C utilities could expect
to experience an increase in the PFP cost-of-service. For Class D utilities, about 89 percent of
the utilities would experience an increase in the PFP cost-of-service.

65
Commission staff chose fifteen utilities to compute the actual change in the PFP
cost-of-service that results from using the ISO NFF5 fire flow. These sample utilities include
those with some of the biggest difference between the ISO NFF5 fire flow and the PSC fire
demand. Table 2 summarizes the results. Based on the results displayed below, it is estimated
that if the ISO NFF5 fire flow is substituted for the PSC fire demand, the PFP cost-of-service for
Class AB utilities may change from -35 percent to +4 percent. Similarly, for Class C utilities the
PFP cost-of-service may change from -23 percent to +32 percent. Class D utilities may
experience a PFP cost-of-service change from -19 percent to +28 percent.
26
82
246
35 24 17 15 20
12
0
50
100
150
200
250
300
Class AB (n=76) Class C (n=126) Class D (n=275)
Num
ber o
f Wat
er U
tiliti
esFigure 40. Comparison of ISO NFF5 with PSC Fire Demand
for Select Wisconsin Utilities (n=477)
ISO NFF5 greaterthan PSC FireDemandISO NFF5 lessthan PSC FireDemandISO NFF5 equalsPSC Fire Demand

66
In summary, Commission staff believes that the ISO NFF5 fire flow may be viewed as
superior to the current PSC method for computing fire demand that relies on population based
equations like the NBFU or Kuickling equations. The ISO method is based on an analysis by a
neutral party that results in a calculation of fire demand that could be defended in a contested
rate case.
Utility Name Utility IDNo.
CustomersUtility Class
PSC Fire Demand
(gpm)
PSC Fire Demand Duration(hours)
PFP Cost-of-Service
Based on PSC Fire Demand
($)
ISO 5th Highest Needed
Fire Flow(gpm)
ISO Fire Demand Duration(hours)
PFP Cost-of-Service
Based on ISO Fire Demand
($)
Percent Difference
Between PSC PFP COS and ISO
PFP COS (%)
Milwaukee Water Works 3720 162,369 AB 17,962 18 8,126,970$ 7,500 4 5,310,862$ -35%
Eau Claire Municipal Water Utility 1740 26,769 AB 7,000 7 1,487,464$ 5,500 4 1,265,292$ -15%
Marinette Municipal Water Utility 3370 4,766 AB 5,000 5 1,120,132$ 4,500 4 953,829$ -15%
Grand Chute Sanitary District No. 1 2310 8,332 AB 5,000 5 567,876$ 5,500 4 577,190$ 2%
West Allis Municipal Water Utility 6360 19,507 AB 6,000 6 1,225,153$ 7,000 4 1,276,468$ 4%
Wauwatosa Water Utility 6320 15,517 AB 5,000 5 981,340$ 5,500 4 1,025,414$ 4%
Sussex Water Public Utility 5835 3,380 C 4,500 5 487,293$ 3,500 3 376,016$ -23%
Brown Deer Water Public Utility 780 3,734 C 4,000 4 264,622$ 3,500 3 242,626$ -8%
Mineral Point Municipal Water Utility 3740 1,423 C 1,500 2 137,471$ 2,500 2 147,235$ 7%
Shorewood Municipal Water Utility 5440 3,534 C 2,500 3 374,672$ 3,000 3 409,965$ 9%
Mequon Municipal Water Utility 3595 3,724 C 2,300 2.3 591,022$ 4,500 4 765,295$ 29%
Poynette Municipal Water Utility 4810 997 C 2,000 2 122,904$ 3,000 3 162,672$ 32%
Bristol Water Utility 720 502 D 2,500 2 78,213$ 1,750 2 63,553$ -19%
Orfordville Municipal Water Utility 4450 549 D 1,000 2 88,602$ 2,250 2 99,955$ 13%
Milltown Water Utility 3680 441 D 500 2 33,277$ 3,000 3 42,495$ 28%
Table 2. Comparison of the Impact Using the PSC Fire Demand Versus the ISO 5th Highest Needed Fire Flow on the PFP Cost-of-Service.

67
6.2 Allocation of Costs to the PFP Cost Function and PFP Customer Class
The existing PSC cost-of-service model allocates hydrant costs to the PFP cost function
directly, which makes the PFP cost function simple to understand and to predict. In contrast, the
PFP customer class is based on a calculated function of the hydrant costs, the fire demand, the
system demand ratios, the proportion of transmission main versus distribution main, the
customer demand ratios, and the water sales from each customer class. As shown in Figure 6, as
general water service sales decrease, the PFP cost-of-service increases. This relationship is due
to the fact that the cost of the created excess supply capacity is assigned not only to the general
service customer classes, but also to the PFP customer class, even though the number of hydrants
and the community’s actual PFP demand may not have changed. To address this issue of
increases in PFP charges with decreasing sales volume, the PSC COSS model could be modified
to separate customer water sales volumes from the PFP customer class, or to at least mitigate the
impact of water sales on the PFP customer class.3 Commission staff describes the following
three options for revising the PSC cost-of-service model with the goal of mitigating or separating
customer class sales volumes from the final PFP customer class.4
Option #1 eliminates the allocation of non-PFP cost functions to the PFP customer class.
The result is that the PFP customer class represents hydrant costs only. This result is
accomplished by taking the standard PSC cost-of-service model and assigning zero volumes to
the PFP customer class in the worksheet titled, “Customer Class Demand Ratios” (Schedule 9).
The PFP cost function (hydrant costs) is then the sole amount allocated to the PFP customer class
as shown in Figure 41. The actual model results are shown in Appendix K.
3 See comments by Municipal Environmental Group in PSC REF#: 286177 4 See alternative allocation method proposed by Kaempfer & Associates, Inc. in PSC REF#: 286151

68

69
Option #2 allocates additional accounts directly to the PFP cost function by using
additional system demand ratios that include fire demand. This option was developed by Erik
Granum of Trilogy Consulting, LLC, as one of several possible methods to improve the PSC
model for computing the PFP cost-of-service, as discussed in (PSC REF#: 237301). Option #2
is the same as Erik Granum’s Template #1. It expands the type of facilities and costs directly
allocated to the PFP cost function. The resulting PFP cost function includes contributions from
hydrants as well as source of supply, pumping plant, distribution reservoirs and standpipes, and
distribution main costs. Unfortunately, Option #2 does not significantly mitigate the impact that
the volume of water sales has on the total amount allocated to the PFP customer class as
compared to the standard PSC model. The allocation used in Option #2 is shown in Figure 42.
The actual model results are shown in Appendix L.

70
71
Option #3 is similar to Option #2, but it allocates fewer accounts to the PFP cost function.
The resulting PFP cost function includes hydrants as wells as contributions from the distribution
reservoirs and standpipes account and the distribution main account. Unfortunately, Option #3
does not significantly mitigate the impact that the volume of water sales has on the total amount
allocated to the PFP customer class as compared to the standard PSC model. The actual model
results are shown in Appendix M.
Four sample utilities (Orfordville, Marinette, Grand Chute, and Eau Claire) were used to
compare the resulting PFP cost-of-service using the existing PSC cost-of-service model and the
three options. It is worth noting that all three options are analyzed using the current PSC fire
demand and not the ISO fire demand. The results are shown in Figure 43. Option #1 is the
simplest of the three options because only the hydrant costs are allocated to the final PFP
cost-of-service. Option #2 is the most thorough allocation of costs to the PFP cost-of-service.
Option #3 produced results closest to the existing PSC model.

72
Based on the survey of the 50 public utility commissions, there are eighteen states that
require regulated water utilities to include a separate cost allocation for public fire protection.
The survey found that seventeen states require that cost-of-service studies treat public fire
protection as a separate cost function. Sixteen states identify which assets are directly allocated
to the PFP cost function. These assets are shown in Figure 44. The same sixteen states
identified how costs are allocated to the PFP cost function, as shown in Figure 45. The survey
found that 34 states either do not directly allocate assets to the PFP cost function or they did not
respond to this survey question. These 34 states were identified as “Not Applicable” (N/A).

73

74
The survey found that eighteen states require that cost-of-service studies treat public fire
protection as a separate customer class. Sixteen states identify which assets are directly allocated
to the PFP cost function. These assets are shown in Figure 46. Seventeen states identify how
costs are allocated to the PFP customer class as shown in Figure 47.

75

76
6.3 Limit Maximum PFP Cost-of-Service
Another option for dealing with the issue of increases in the PFP cost-of-service as
general water service sales decrease is to place a cap or maximum limit on the PFP
cost-of-service. This cap could be calculated as a maximum percentage of the total
cost-of-service. Based on the survey of the 50 public utility commissions, there are two states
that report specific methods for capping the maximum allowable public fire protection cost. The
Maine Public Utilities Commission does not allow the PFP cost-of-service to exceed 30 percent
of the total cost-of-service. The Pennsylvania Public Utility Commission limits the PFP
cost-of-service in some cases. For companies that are required to provide a cost of service study,
the rate charged for PFP is limited to 25 percent of the PFP cost-of-service, with some
exceptions.
One result of implementing a cap on the PFP cost-of-service is that if general service
consumption decreases, the cap reduces the allocation of the excess capacity costs to the PFP
cost-of-service. However, the application of a cap may appear to be subjective. Unless it is
codified in statute or administrative code, it may become a contested issue.
Among Wisconsin’s regulated water utilities, the PFP cost-of-service ranges from 9
percent of a water utility’s total cost-of-service (Milwaukee Water Works) to as high as 45
percent of a water utility’s total cost-of-service (Tony Municipal Water Utility). As shown in
Figure 5, as the number of customers increases, the PFP cost-of-service as a percentage of the
total cost-of-service decreases. Based on the same data set, Commission staff computed the
average value for the “PFP cost-of-service as a percentage of total cost-of-service” for each
utility class. The values are shown in Table 3 below. One alternative would be to use these
average values as a cap for each utility class. If such a cap were adopted, those utilities

77
experiencing a decrease in their PFP cost-of-service would see a proportionate increase in the
cost-of-service for their residential, commercial, industrial, and public authority customers.
6.4 Class Absorption Method
John Mayer, a utility rate consultant, proposed the "class absorption" method in his 1988
testimony submitted in Docket 05-WI-100. (PSC REF#: 230968) The class absorption method
eliminates the PFP customer class. Under this method all PFP costs are absorbed into the other
customer classes and recovered through general service rates. The same result has been achieved
in this study by using the PSC cost-of-service model and allocating the hydrant costs in
Account 348 (utility financed plant, total plant, and depreciation expenses schedules) to the cost
functions of base distribution and maximum hour distribution. The allocation is accomplished
using the same allocation factors as those used for Account 343, distribution mains. For
Class AB utilities, the maintenance of hydrants cost in Account 677 of the operation and
maintenance expenses schedule is also allocated to the same cost functions using the same
allocation percentages as are used for Account 673, maintenance of distribution mains. The PFP
volume is then set to zero in the customer class demand ratio schedule. An explanation of this
method is found in Appendix N. Table 4 summarizes how the class absorption method impacts
the cost-of-service amount for the non-PFP customer classes for a select sample of utilities. It is
Table 3. Average PFP Cost-of-Service as a Percentage of Total Cost-of-Service (n=218)
Utility ClassAverge PFP Cost-of-Service as Percentage
of Total Cost-of-ServiceAB 18%C 29%D 34%

78
important to note that these results are the same regardless of whether the model uses the PSC
fire demand or the ISO fire demand.
Residential Cost-of-Service
Multi-Family Cost-
of-Service
Commercial Cost-of-Service
Industrial Cost-of-Service
Public Authority Cost-
of-Service
PFP Cost-of-Service
Total Cost-of-Serivce
PSC Standard Model $154,388 $6,203 $21,514 $0 $11,250 $81,556 $274,911
Class Absorption
Method$218,561 $9,253 $31,276 $0 $15,821 $0 $274,911
% Difference 42% 49% 45% 0% 41% -100% 0%
Residential Cost-of-Service
Multi-Family Cost-
of-Service
Commercial Cost-of-Service
Industrial Cost-of-Service
Public Authority Cost-
of-Service
PFP Cost-of-Service
Total Cost-of-Serivce
PSC Standard Model $1,582,988 $13,525 $567,130 $1,405,641 $194,275 $1,120,132 $4,883,691
Class Absorption
Method$2,082,754 $18,616 $758,638 $1,758,131 $265,552 $0 $4,883,691
% Difference 32% 38% 34% 25% 37% -100% 0%
Residential Cost-of-Service
Multi-Family Cost-
of-Service
Commercial Cost-of-Service
Industrial Cost-of-Service
Public Authority Cost-
of-Service
PFP Cost-of-Service
Total Cost-of-Serivce
PSC Standard Model $2,264,420 $0 $2,132,788 $404,601 $112,762 $567,876 $5,482,447
Class Absorption
Method$2,543,180 $0 $2,379,253 $434,184 $125,830 $0 $5,482,447
% Difference 12% 0% 12% 7% 12% -100% 0%
Residential Cost-of-Service
Multi-Family Cost-
of-Service
Commercial Cost-of-Service
Industrial Cost-of-Service
Public Authority Cost-
of-Service
PFP Cost-of-Service
Total Cost-of-Serivce
PSC Standard Model $4,711,735 $348,402 $1,446,411 $1,030,616 $447,495 $1,487,464 $9,472,123
Class Absorption
Method$5,507,622 $423,762 $1,740,365 $1,223,566 $576,808 $0 $9,472,123
% Difference 17% 22% 20% 19% 29% -100% 0%
Table 4. Comparison of PSC COS Model and Class Absorption COS ModelOrfordville (551 Customers)
Marinette (4,863 Customers)
Grand Chute (7,820 Customers)
Eau Claire (26,647 Customers)

79
Erik Granum has recommended that as an alternative, the class absorption method could
keep the PFP cost function for hydrants so that their function and related costs are clearly
identified. The fire protection costs could then be allocated to the other customer classes at the
back end of the PSC cost-of-service model once all other costs have been appropriately
allocated. This would allow utilities to collect hydrant costs through a fixed public fire
protection charge.
Based on the survey of the 50 public utility commissions, there are eighteen states that
require utilities to roll the cost of public fire protection into general service rates. The results
are shown in Figure 48 below.

80
In 1989, the PSC allowed the Jefferson Water and Electric Department to adopt the class
absorption method as a test case (Docket 2750-WR-101). The resulting cost-of-service design
removed the PFP customer class and rolled that cost into the general service rates. In that case,
the standard PSC cost-of-service model was used, and the total for the PFP customer class was
distributed to the other customer classes. In 2005, Jefferson decided to abandon the class
absorption method and to adopt direct PFP charges based on the equivalent meters method.
The class absorption method addresses the issue discussed in Section 2, namely, how to
allocate costs for very large community water systems, where the maximum hour demand for
general service is larger than the fire demand.5 For these large utilities the general service
maximum hour demand controls the design of the water system. From a regulatory standpoint, it
is Commission staff’s opinion that it does not make sense in these cases to allocate costs to the
PFP customer class, since it represents a redundant demand that is already covered by the
infrastructure needed to meet the general service maximum hour demand. The class absorption
method is a cost-of-service model that assigns all system costs to the non-PFP cost functions for
large utilities.
A potential benefit of using the class absorption method is to eliminate one of the more
contentious issues that occurs during large contested rate cases. The elimination of the PFP
customer class simplifies the overall cost-of-service methodology thus improving a utility’s
ability to predict the impact that increased expenses and new infrastructure spending will have on
water rates. The elimination of the PFP customer class also helps municipalities to perform more
accurate budget planning, as it is often difficult to predict in advance how the PFP cost will
5 See comments by Municipal Environmental Group in PSC REF#: 286177 and by Manitowoc Public Utilities in PSC REF#: 286178

81
change until a new rate case is completed. The timing of the water rate case and the
development of the municipal budget can create problems if PFP costs are higher than expected.
It is Commission staff’s opinion that the class absorption method provides a simpler
cost-of-service analysis that is appropriate for the scale of analysis typically used to estimate
other components of a utility’s water rates such as demand forecasting, estimation of customer
demand ratios, and many of the cost allocation assumptions built into the PSC model.
As discussed in Section 2, there are six water utilities in Wisconsin where the maximum
hour general service demand controls the design and costs of the water system (as analyzed using
the current PSC fire demand method, as opposed to the ISO fire demand). Those utilities are:
Manitowoc Public Utilities, Kenosha Water Utility, Racine Water Works Commission, Green
Bay Water Utility, Madison Water Utility, and Milwaukee Water Works.
If the ISO NFF5 fire flow (rather than the PSC fire demand) is used to perform the same
analysis as in Section 2 of this report, then there are eight water utilities in Wisconsin where the
maximum hour demand exceeds the maximum day plus fire demand. These eight utilities are as
follows: Manitowoc Public Utilities, La Crosse Water Utility, Sheboygan Water Utility, Kenosha
Water Utility, Racine Water Works Commission, Green Bay Water Utility, Madison Water
Utility, and Milwaukee Water Works. The calculations using the ISO fire demand values are
found in Appendix O. Appendix O does not represent a complete list, but only a list of
municipalities for which ISO provided information.
The class absorption method does not compute a PFP cost, and as a result the hydrants
are treated as part of the distribution system. A downside of this approach is that the customer
classes pay for the hydrants in proportion to their base and maximum hour demand
characteristics, which may have little to no relation to their fire demands. Another downside of

82
this approach is that it reduces the amount of fixed revenues thus increasing the share of the
volume based revenues.
6.5 Impact of Options on the PFP Cost-of-Service Allocated to Wholesale Customers
As discussed in Section 4 of this report, the PSC regulates 28 water utilities that provide
wholesale service to another 53 utilities that act as wholesale customers. The PSC requires that
wholesale providers identify their PFP costs and allocate them appropriately to their wholesale
customers. This methodology typically results in the establishment of PFP rates for the
wholesale customers. It is interesting to note that, based on the survey of the 50 public utility
commissions, there are eleven states that require the PFP cost-of-service be allocated to retail
customers only. Another thirteen states require that the PFP cost-of-service be allocated to both
retail and wholesale customers (where applicable). The results are shown in Figure 49 below.

83
Commission staff used the most recent cost-of-service model for Milwaukee Water
Works in Docket 3720-WR-108 to estimate how the use of the ISO NFF5 fire flow would impact
the general service and PFP charges billed to its wholesale customers. (PSC REF#: 222194)
The current fire demand used in the Milwaukee Water Works model is 17,962 gpm for 18 hours.
This value was changed to an ISO NFF5 fire flow value of 7,500 gpm for 4 hours. The result of
changing the fire demand was a 0.37 percent decrease in the total cost-of-service amount for
retail customers. As shown in Table 5, the wholesale customers experienced a change ranging
from a 2.50 percent decrease to a 5.40 percent increase in their total wholesale cost-of-service.
Commission staff then used Milwaukee Water Works’ most recent cost-of-service model
with the ISO NFF5 fire flow to determine what impact the class absorption method would have
on the general service and PFP charges billed to Milwaukee’s wholesale customers. By rolling
the PFP cost into the general service rates, the total cost-of-service for retail customers decreased
Table 5. Impact of the ISO NFF5 Fire Flow on the Cost-of-Service Allocated to Milwaukee Water Work's Wholesale Customers
Gen Service Existing COS
PFP Existing COS
Total Existing COS
Gen Service ISO NFF5 COS
PFP ISO NFF5
COSTotal ISO NFF5
COS
Percent Difference Total COS
Retail Total 70,809,856$ 7,990,659$ 78,800,515$ 73,232,005$ 5,273,541$ 78,505,546$ -0.37%
Brown Deer 721,571$ -$ 721,571$ 747,736$ -$ 747,736$ 3.63%Butler 165,550$ -$ 165,550$ 169,681$ -$ 169,681$ 2.50%
Greendale 729,359$ -$ 729,359$ 768,753$ -$ 768,753$ 5.40%Menomonee Falls 1,604,903$ -$ 1,604,903$ 1,658,680$ -$ 1,658,680$ 3.35%
Mequon 542,431$ 3,339$ 545,770$ 568,556$ 907$ 569,463$ 4.34%New Berlin 1,328,844$ -$ 1,328,844$ 1,376,226$ -$ 1,376,226$ 3.57%Shorewood 717,632$ 63,047$ 780,679$ 743,776$ 17,416$ 761,192$ -2.50%Wauwatosa 2,462,185$ -$ 2,462,185$ 2,549,882$ -$ 2,549,882$ 3.56%West Allis 2,622,493$ 69,926$ 2,692,419$ 2,687,773$ 18,998$ 2,706,771$ 0.53%
County Institutions 433,823$ -$ 433,823$ 451,687$ -$ 451,687$ 4.12%Wholesale Total 11,328,791$ 136,312$ 11,465,103$ 11,722,750$ 37,321$ 11,760,071$ 2.57%
Grand Total 90,265,617$ 90,265,617$ 0.00%
Retail
Wholesale

84
by 0.54 percent. As shown in Table 6, the wholesale customers experienced a change ranging
from a 3.33 percent decrease to a 7.05 percent increase in their total wholesale cost-of-service.
Gen Service Existing COS
PFP Existing COS
Total Existing COS
Gen Service Class
Absorption COS
PFP Class Absorption
COS
Total Class Absorption
COS
Percent Difference Total COS
Retail Total 70,809,856$ 7,990,659$ 78,800,515$ 78,378,085$ -$ 78,378,085$ -0.54%
Brown Deer 721,571$ -$ 721,571$ 758,796$ -$ 758,796$ 5.16%Butler 165,550$ -$ 165,550$ 172,077$ -$ 172,077$ 3.94%
Greendale 729,359$ -$ 729,359$ 780,806$ -$ 780,806$ 7.05%Menomonee Falls 1,604,903$ -$ 1,604,903$ 1,681,727$ -$ 1,681,727$ 4.79%
Mequon 542,431$ 3,339$ 545,770$ 576,934$ -$ 576,934$ 5.71%New Berlin 1,328,844$ -$ 1,328,844$ 1,394,587$ -$ 1,394,587$ 4.95%Shorewood 717,632$ 63,047$ 780,679$ 754,659$ -$ 754,659$ -3.33%Wauwatosa 2,462,185$ -$ 2,462,185$ 2,586,068$ -$ 2,586,068$ 5.03%West Allis 2,622,493$ 69,926$ 2,692,419$ 2,723,527$ -$ 2,723,527$ 1.16%
County Institutions 433,823$ -$ 433,823$ 458,351$ -$ 458,351$ 5.65%Wholesale Total 11,328,791$ 136,312$ 11,465,103$ 11,887,532$ -$ 11,887,532$ 3.68%
Grand Total 90,265,617$ 90,265,617$ 0.00%
Retail
Wholesale
Table 6. Impact of the Class Absorption Method and ISO NFF5 Fire Flow on the Cost-of-Service Allocated to Milwaukee Water Work's Wholesale Customers

85
6.6 Rate Design Options
Based on the survey of the 50 public utility commissions, there are eighteen states that identify
a method for computing separate PFP rates. The results of the survey are shown in Figure 50.
As discussed in Section 4 of this report, the equivalent meters method is the most popular
used by Wisconsin water utilities, likely because it is relatively easy to administer. Some critics
of the method have argued that the size of a water meter has very little correlation with the fire
demand of the property. They contend that the property values method is the most equitable

86
because PFP charges are more closely correlated with the value of the property than the meter
size.
7. Private Fire Protection
The private fire protection charge represents the extra capacity of the water system
needed to provide the high pressures and flows to fight fires through private fire suppression
equipment, such as sprinkler systems. The private fire protection charge is a standby service,
and the actual cost of the water used in fighting fires is considered immaterial. The charge is
used to recover the extra cost required to oversize the wells, pumps, storage tanks, and water
mains in the water system. This charge includes a portion of the operation and maintenance
expenses, depreciation expenses, taxes, and return on net investment rate base attributable to the
facilities available to supply fire protection. The private fire protection charge is computed on a
parallel basis with the public fire protection charge. As such, it is a measure of the cost of
providing the service.
The charge for an unmetered private fire protection connection is based on the potential
demand which could be placed on the system because of that connection. Accordingly, the size
of the connection to the utility’s water main is used as the basis for the private fire protection
service charge. For example, if a commercial property installs a 4-inch lateral to serve an
unmetered private fire suppression system, the water customer is charged an unmetered private
fire protection fee. The Commission has traditionally identified unmetered private fire
protection as an additional service, above and beyond the public fire protection service. That is
why the Commission allows utilities to charge a private fire protection fee included on
Schedule Upf-1 of a utility’s water tariff. The Commission, however, does not require any utility

87
to charge a private fire protection fee. The decision is left up to each utility. A detailed
explanation of how the private fire protection charge is computed is found in Appendix P.
For most Wisconsin water utilities, the private fire protection revenues do not constitute
a significant portion of their total revenue requirements. In fact, 230 of Wisconsin’s 582
regulated water utilities (40 percent) did not report any Private Fire Protection revenues for 2013.
This lack of revenue may be due to water utilities choosing not to have a private fire protection
tariff, or it may be that water utilities have a private fire protection tariff, but they do not have
any private fire protection customers. Based on 2013 annual report data, the private fire
protection revenues account for only 0 percent to 8 percent of the total water utility revenues for
Wisconsin’s 582 regulated water utilities. The median amount of annual private fire protection
revenue was only $1,700 in 2013. The histogram below shows the number of utilities and the
private fire protection annual revenue collected for 2013. Based on the 2013 annual report data,
there are 410 (70 percent) Wisconsin water utilities with total annual private fire protection
revenue below $10,000, based on 2013 annual report data. Milwaukee Water Works has the
largest private fire protection revenue at $705,000 (1 percent of total operating revenues) for
2013. The data used to develop the histogram shown in Figure 51 is found in Appendix Q.
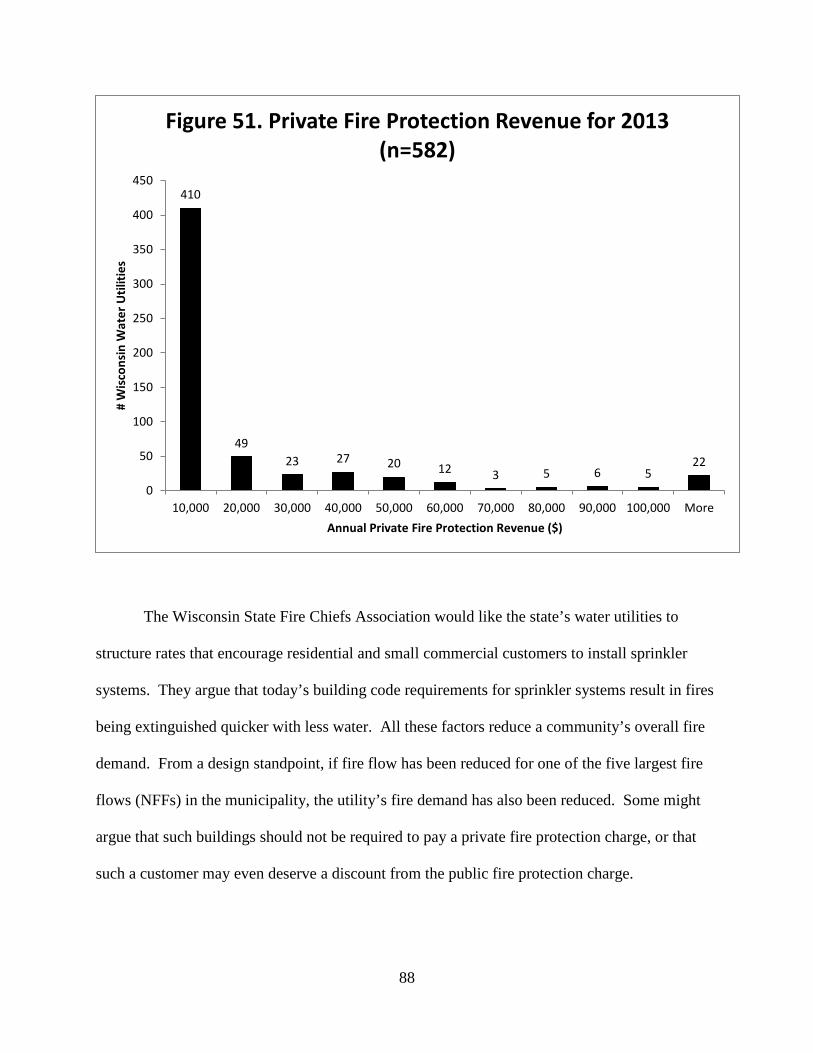
88
The Wisconsin State Fire Chiefs Association would like the state’s water utilities to
structure rates that encourage residential and small commercial customers to install sprinkler
systems. They argue that today’s building code requirements for sprinkler systems result in fires
being extinguished quicker with less water. All these factors reduce a community’s overall fire
demand. From a design standpoint, if fire flow has been reduced for one of the five largest fire
flows (NFFs) in the municipality, the utility’s fire demand has also been reduced. Some might
argue that such buildings should not be required to pay a private fire protection charge, or that
such a customer may even deserve a discount from the public fire protection charge.
410
4923 27 20 12 3 5 6 5
22
0
50
100
150
200
250
300
350
400
450
10,000 20,000 30,000 40,000 50,000 60,000 70,000 80,000 90,000 100,000 More
# W
isco
nsin
Wat
er U
tiliti
es
Annual Private Fire Protection Revenue ($)
Figure 51. Private Fire Protection Revenue for 2013 (n=582)

89
In their 2012 report, “Fire Flow Water Consumption in Sprinklered and Unsprinklered
Buildings: An Assessment of Community Impacts,” Code Consultants Inc. states, “The required
fire flow for a building protected with a sprinkler system is typically permitted to be reduced by
50 percent for one and two-family dwellings and 75 percent for buildings other than one- and
two-family dwellings. Available studies of fire water usage in sprinklered and unsprinklered
residential buildings show the volume of water to be conservative and indicate a reduction of
water used in a sprinklered home to be approximately 90 percent less than that of an
unsprinklered home.” Based on these claims, it appears that fire flow needs are significantly
reduced for sprinklered buildings.
Others argue that residential sprinklered buildings do not lower the community-wide fire
demand because the methods used to compute fire demand rely either on the community’s
population or on the ISO NFF5 fire flow. A few residential sprinklered buildings are not going
to lower the community-wide fire demand. Therefore, since they are receiving standby services
not offered to others, they should pay for this additional service. In addition, the owners of
sprinklered buildings are likely receiving discounts on their property insurance. Therefore, these
customers already receive a benefit from their sprinkler systems.
As stated previously, Wisconsin water utilities are not required to implement private fire
protection charges. One tool for a community to encourage residential sprinkler systems is to
request that the Commission remove Schedule Upf-1 from its water tariff.
8. Recommendations
The Final Decision in Docket 3720-WR-108, the “Application of Milwaukee Water
Works, Milwaukee County, Wisconsin, for Authority to Increase Water Rates” directed
90
Commission staff to open a generic investigation to study the methods of all water utilities in
allocating public fire protection (PFP) costs. The following paragraphs list Commission staff’s
recommendations for improving the methods used to compute the PFP cost-of-service and
resulting rates for Wisconsin’s 582 regulated water utilities.
1. Commission staff recommends that water utilities that have a general service maximum
hour demand greater than the sum of the maximum day demand plus the ISO NFF5 fire
flow should eliminate their PFP customer class and use the class absorption method to
roll PFP costs into the retail and wholesale general service rates.6 For these water
utilities, the overall water system design is controlled by the general service maximum
hour demand and reliability issues. Based on the ISO NFF5 fire flow data that is
currently available, Commission staff estimates approximately eight of Wisconsin’s
larger water utilities fall into this category. These eight utilities include: Manitowoc
Public Utilities, La Crosse Water Utility, Sheboygan Water Utility, Kenosha Water
Utility, Racine Water Works Commission, Green Bay Water Utility, Madison Water
Utility, and Milwaukee Water Works. General Service maximum hour demand is
defined as the maximum hour demand seen in the previous three years. It does not
include maximum hour demand created by temporary operations such as when a tower is
down or while experiencing a main break.
2. Commission staff recommends that the remaining 574 smaller water utilities be given the
option of using either the standard PSC model or Option #1.7 If a water utility is
experiencing significant reductions in water sales, then they may want to use Option #1
6 See comments by Municipal Environmental Group in PSC REF#: 286177 and Milwaukee Water Works in PSC REF#: 286143 7 See comments by Municipal Environmental Group in PSC REF#: 286177

91
to eliminate the link between declining general service sales and the subsequent increase
in the PFP cost-of-service.
3. The ISO NFF5 is appropriate for computing each utility’s fire demand. The ISO method
uses on-the-ground surveys of the structures in each community, which is more accurate
than the older population based equations currently used in the PSC cost-of-service
model.
4. The investigation of the wholesale PFP will be further addressed in Part B of this study.
If a large wholesale provider, such as Milwaukee Water Works, adopts the class
absorption method and rolls the PFP cost into general service rates, then there are no
identifiable PFP costs. Even hydrants costs are included in the overall distribution
system costs and recovered through general service rates.
5. It is apparent that sprinkler systems reduce community fire demand. The Commission
currently allows each water utility to choose whether or not a private fire protection
charge is included in their water tariff. It is Commission staff’s opinion that the private
fire protection charge should be eliminated.8
Please note: Any views by Commission staff in this report are not formal statements of
Commission policy and are not considered precedential. The views of Commission staff
expressed in this report are not binding on the Commission.
8 See comments by Municipal Environmental Group in PSC REF#: 286177 and Milwaukee Water Works in PSC REF#: 286143