Industrial calipers by balaji engineering company navi mumbai navi mumbai

Environmental Status Report
of Navi Mumbai Municipal
Corporation 2016-17


Environmental Status Report of Navi Mumbai Municipal Corporation-2016-17
i
List of Awards
Awards Received in 2016-17
• Navi Mumbai was ranked 1st in Maharashtra (West Zone) and 8th in country as the cleanest
city as per Swaccha Sarvekshan (Survey) -2017
• Under Swaccha Bharat Abhiyan, NMMC ranked first in Advanced Public Toilets and
Information, Education and Behaviour Change Communication (IEBC) categories and received
awards during 45th Skoch Award-2016 held in Hyderabad on 8th &-9th September, 2016.
• Award for Exceptional Performance in Waste Segregation on 5th May 2017 on the eve of
Urban Development Day.
• Maximum Tax Recovery award on 5th May, 2017 on the eve of Urban Development Day.
Awards Received in previous years (2002-2015)
• HUDCO AWARD: For the Best Practices to Improve the Living Environment (2015-2016)
• JCB Clean Earth Award for Excellence in Solid waste Management (2015)
• Award for Solid Waste Management 2014 by EPC World Media Group.
• National Urban Water Award 2011 for contracting O &M services.
• First prize award for Family Welfare Programme, TB prevention & Control program and Second
award for Mother Child Health Care Programme in Maharashtra state.
• Best Urban ICT award for E-Governance project of NMMC by Government of Maharashtra.
• Best practices award for NMMC centre of Education and Training for Handicap by Social
Justice & Special aid department of Government of Maharashtra.
• EPC World Award for Outstanding Contribution in Urban Civic Amenities (STP Project).
• Sant Gadge Baba Nagri Swachata Abhiyan special Award - 2008-09 from Government of
Maharashtra for best Sanitation practices in city.
• Indian Municipal Vision-2020 Award for "WISITEX Green Urban Development Award of the
Decade".
• Government of India National Urban Water Awards (NUWA) 2010 for "Sanitary Improvements
and Safe Disposal Practices, Integrated Storm Water Disposal System".
• Government of India National Urban Water Awards (NUWA) 2010 for "Improved Customer
Satisfaction, Governance, Public Disclosure and Transparency".
• Best City Award for Improvement in Waste Water and Sanitation Services under JNNURM
(2009).
• Vasundhara Award – 2009 by Hon. Chief Minister of GOM for excellence in city environment.
• National Urban Water Award-2009, by Hon. President of India for “Services to Urban Poor.”
• Ranked 1st in the state for the year 2007-2008 & 2008-2009 in implementing the SARVA
SHIKSHA ABHIYAAN campaign of the Government of India. (Education for All).
• National Water Award-2008 constituted by Urban Development Dept (Government of India),
Administrative Staff College of India, Hyderabad and FCCI for successful implementation of
24x7 water supply in Navi Mumbai.
• 1st prize under the Sant Gadgebaba urban cleanliness campaign twice (2002-2003 & 2005-
2006) with cash reward of Rs 50,00,000/-

Environmental Status Report of Navi Mumbai Municipal Corporation-2016-17
ii
Contents
EXECUTIVE SUMMARY ................................................................................................................... 1
ENVIRONMENTAL INDICES FOR NAVI MUMBAI ...................................................................... 10
INITIATIVES UNDER SWACCHA MAHARASHTRA ABHIYAN & ECO-CITY PROGRAM .......... 12
Infrastructure and Facilities developed by NMMC .................................................. 12
Awareness, Outreach and Feedback ........................................................................... 13
Awards and Recognition received by NMMC for initiatives under Swacchatta Abhiyaan ................................................................................................................... 13
Eco City Program .................................................................................................................. 17
Eco-City Forum .............................................................................................................. 17
Urban Farming Forum and Initiatives ........................................................................ 18
NAVI MUMBAI – CITY PROFILE .................................................................................................. 19
Climate............................................................................................................................. 21
Connectivity .................................................................................................................... 23
DRIVERS ........................................................................................................................................ 24
Population growth................................................................................................................ 24
Industrial and Commercial growth ................................................................................... 25
MIDC areas ..................................................................................................................... 25
Jawaharlal Nehru Port Trust ........................................................................................ 26
APMC (Agriculture Produce Marketing Committee) market ................................. 26
CBD (Commercial Business Districts) of Belapur ..................................................... 26
IT parks at Airoli and Mahape ..................................................................................... 27
Malls & Retail Stores ...................................................................................................... 27
Education Industry ........................................................................................................ 27
Urbanization and spatial growth ....................................................................................... 28
AIR QUALITY ................................................................................................................................ 29
Status ...................................................................................................................................... 29
Air Quality Monitoring Network ................................................................................ 29
Inter Station Analysis .................................................................................................... 34
Vehicular Growth .......................................................................................................... 44
Fuel consumption .......................................................................................................... 45
Impact .................................................................................................................................... 47
Diseases caused by air pollution .................................................................................. 47
Response and Initiatives ...................................................................................................... 47
Initiatives by NMMC ..................................................................................................... 47
Initiatives by MPCB ....................................................................................................... 48
WATER RESOURCES ..................................................................................................................... 49
Environmental Status Report of Navi Mumbai Municipal Corporation-2016-17
iii
Status of Water Resources ............................................................................................. 49
Surface Water .................................................................................................................. 49
Ground Water ................................................................................................................. 54
Water Resource Management ...................................................................................... 57
Water supply (Network) ............................................................................................... 57
Per capita water consumption ...................................................................................... 58
Sewage treatment and public toilets ........................................................................... 60
Storm water Management ............................................................................................ 62
Nallahs ............................................................................................................................. 63
Holding Ponds ................................................................................................................ 66
Pressure and Impacts ........................................................................................................... 67
Electricity consumption of STPs in NMMC ............................................................... 68
Distribution losses and Leakages ................................................................................ 68
Release of Sewage and industrial effluents ................................................................ 69
Comprehensive Environmental Pollution Index (CEPI) Action Plan for Navi Mumbai .................................................................................................................................... 70
Illegal dumping of debris and other waste in water bodies .................................... 71
Silting of holding ponds ................................................................................................ 72
Initiatives for Conservation and reuse of water ........................................................ 73
LAND RESOURCE ......................................................................................................................... 75
Status ................................................................................................................................ 76
Built up area .................................................................................................................... 77
Biodiversity of NMMC .................................................................................................. 81
Mining and Quarrying .................................................................................................. 82
Dumping of Debris ........................................................................................................ 83
Destruction of Mangroves ............................................................................................ 83
Poaching of Flamingos .................................................................................................. 83
Urban Heat Island Effect ............................................................................................... 84
Compounded Impacts ................................................................................................... 84
Response ................................................................................................................................ 84
Green Buildings .............................................................................................................. 84
Addition of Open Spaces .............................................................................................. 85
Raising awareness about Bio wealth of City .............................................................. 85
Restoration of Stone Quarries and Protection of Hills .............................................. 87
Protection of Mangrove-Wetland ecosystem ............................................................. 88
SOLID WASTE MANAGEMENT ................................................................................................... 89
Municipal Solid Waste ......................................................................................................... 89
Source and Composition ............................................................................................... 89
Segregation, Processing & Scientific Disposal ........................................................... 92

Environmental Status Report of Navi Mumbai Municipal Corporation-2016-17
iv
Quantification, Segregation and Disposal .................................................................. 93
Response Initiatives ....................................................................................................... 94
Biomedical Waste ................................................................................................................. 97
Generation and Collection ............................................................................................ 97
Treatment & Disposal .................................................................................................... 98
Construction and Demolition Waste ................................................................................. 99
Hazardous Waste ................................................................................................................. 99
Generation, Collection and Disposal ........................................................................... 99
HEALTH ....................................................................................................................................... 101
Environment and Health ................................................................................................... 101
Water Borne Diseases ......................................................................................................... 102
Vector Borne Diseases ........................................................................................................ 103
Malaria ........................................................................................................................... 103
Dengue ........................................................................................................................... 104
Response ........................................................................................................................ 104
Air Borne Disease - Tuberculosis ..................................................................................... 108
Response ........................................................................................................................ 109
ANNEX–I: CALCULATION OF INDICES ..................................................................................... 110
ANNEX–II: DETAILS FOR DETERMINING ENVIRONMENTAL PERFORMANCE INDEX ......... 115
ANNEX- III - CATEGORY WISE NO OF VEHICLES REGISTERED IN NAVI MUMBAI RTO ... 123
Environmental Status Report of Navi Mumbai Municipal Corporation-2016-17
v
Abbreviations
APMC Agricultural Produce Market Complex
AQI Air Quality Index
BEST Brihanmumbai Electricity Supply and Transport
BOD Biochemical Oxygen Demand
BPO Business Process Outsourcing
CAAQMS Continuous Ambient Air Quality Monitoring System
CAGR Compound Annual Growth Rate
CBD Central Business District
CIDCO City and Industrial Development Corporation
CNG Compressed Natural Gas
COD Chemical Oxygen Demand
CPCB Central Pollution Control Board
CSIR Council of Scientific & Industrial Research
DO Dissolved Oxygen
EPI Environmental Performance Index
ESR Environmental Status Report
FAO Food and Agriculture Organization of the United Nations
FO Furnace Oil
GTIPL Gateway Terminal India Private Ltd
HSD High Speed Diesel
IOCL Indian Oil Corporation Limited
IT Information Technology
JNPCT Jawaharlal Nehru Port Container Terminal
LDO Light Diesel Oil
LPCD Liters per Capita per Day
LPG Liquefied Petroleum Gas
LULC Land Use and Land Cover
MCZMA Maharashtra Coastal Zone Management Authority
MIDC Maharashtra Industrial Development Corporation
Environmental Status Report of Navi Mumbai Municipal Corporation-2016-17
vi
MLD Million Liters Per Day
MMR Mumbai Metropolitan Region
MPCB Maharashtra Pollution Control Board
MRSAC Maharashtra Remote Sensing Application Centre
NAAQMS National Ambient Air Quality
NAAQS National Ambient Air Quality Standard
NAMP National Air Monitoring Program
NEERI National Environmental Engineering Research Institute
NMMC Navi Mumbai Municipal Corporation
NMMT Navi Mumbai Municipal Transport
NO2 Nitrogen Dioxide
NOx Oxides of Nitrogen
NSICT Nhava Sheva International Container Terminal
PDS Public Distribution System
PM10 Particulate Matter below 10 micrometers diameter
PM2.5 Particulate Matter below 2.5 micrometers diameter
PNG Piped Natural Gas
PUC Pollution Under Control
PVC Polyvinyl chloride
RSPM Respirable Suspended Particulate Matter
RTO Regional Transport Office
SO2 Sulphur Dioxide
SO2 Oxides of Sulphur
STP Sludge Treatment Pool
tCO2e Tons of Carbon Dioxide Equivalent
TERI The Energy and Resources Institute
TEU's Twenty foot Equivalent Units
TTC Trans-Thane Creek
ULB Urban Local Body
US-EPA United States Environmental Protection Agency
WHO World Health Organization

Environmental Status Report of Navi Mumbai Municipal Corporation-2016-17
vii
List of Tables
Table No. 1: Environmental Indices of Navi Mumbai .................................................................. 10
Table No. 2: Environmental Performance Index ........................................................................... 11
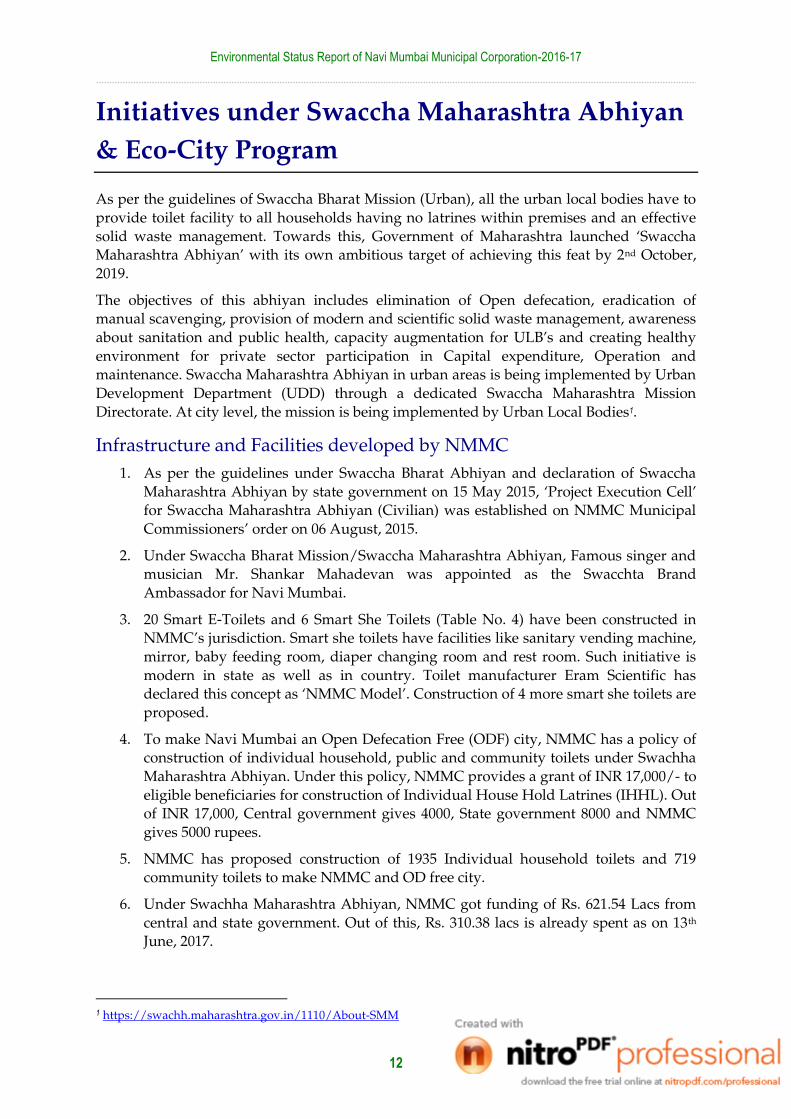
Table No. 3: Number and Locations of Smart E Toilets (Single seated, unisex) ....................... 14
Table No. 4: Smart She Toilets with rest room (Exclusively for Women) .................................. 15
Table No. 5: Summary of Public/Community Toilets in areas under NMMC jurisdiction .... 16
Table No. 6: Geographic and demographic highlights of Navi Mumbai .................................. 19
Table No. 7. Yearly trend of concentration of SO2 at CAAQMS in Navi Mumbai ................... 31
Table No. 8: Yearly trend in concentration of NOX at AAQMS in Navi Mumbai .................... 32
Table No. 9: Yearly trend in concentration of PM10 at AAQMS in Navi Mumbai .................... 33
Table No. 10: Yearly trend in concentration of PM2.5 at AAQMS in Navi Mumbai ................. 34
Table No. 11: Concentration of SO2 across NMMC region (2016-17) ......................................... 35
Table No. 12: Concentration of NOX across NMMC region (2016-17) ........................................ 36
Table No. 13: Concentration of PM2.5 across NMMC region (2015-16) ...................................... 37
Table No. 14: Concentration of PM10 across NMMC region (2016-17) ....................................... 38
Table No. 15: Speciation of Morbe Dam ......................................................................................... 49
Table No. 16: Average water quality of raw and treated water before supply ......................... 50
Table No. 17: Node wise details of lakes and their coverage in NMMC area ........................... 51
Table No. 18: Annual average water quality of lakes in NMMC area (1 of 2) .......................... 52
Table No. 19: Annual average water quality of lakes in NMMC area (2 of the 2) .................... 53
Table No. 20: Annual average water quality of creek water samples in NMMC area ............. 54
Table No. 21: Well water quality recorded in NMMC area in 2016-17 ...................................... 56
Table No. 22: Water Quality of Turbhe bore well ......................................................................... 57
Table No. 23: Highlights of the water supply network at a glance ............................................. 57
Table No. 24: List of functional Sewage Treatment Plants in NMMC area (2016-17) .............. 60
Table No. 25: Average performance and efficiency of STPs in NMMC area ............................ 62
Table No. 26: Ward wise length of storm water drains in NMMC area .................................... 62
Table No. 27: Details of open Nallahs in NMMC area ................................................................. 63
Table No. 28: Annual Average water quality of water samples collected from nallahs .......... 64
Table No. 29: Details of holding ponds in NMMC area ............................................................... 66
Table No. 30: Annual average quality of water samples collected from holding ponds ......... 67
Table No. 31: Consumption of electricity by the STPs in NMMC............................................... 68
Table No. 32: Break up of Land Use Land Cover pattern in NMMC ......................................... 76
Table No. 33: Ward wise open spaces along with their area in NMMC .................................... 81

Environmental Status Report of Navi Mumbai Municipal Corporation-2016-17
viii
Table No. 34: Node wise quantity of daily MSW generated and number of dustbins in
NMMC (2016-17) ....................................................................................................................... 91
Table No. 35: List of vehicles used for collection and transportation of solid waste ............... 91
Table No. 36: Leachate analysis report at Turbhe site in NMMC ............................................... 93
Table No. 37: Node wise waste collection places and quantity of waste collected .................. 95
Table No. 38: Composition of biomedical waste generated by NMMC hospitals .................... 98
Table No. 39: Health care facilities in NMMC ............................................................................. 101
Table No. 40: Persons affected by Water borne diseases in NMMC ......................................... 102
Table No. 41: UHP wise reported malarial cases in past five years in NMMC area .............. 104
Table No. 42: List of places and number of trainees trained against swine flu ....................... 107
Table No. 43: Assignment of importance units and PEQ scale for parameters selected for computing EQI ......................................................................................................................... 112
Table No. 44: Estimation of Environmental Quality Index ........................................................ 113
List of Figures
Figure No. 1: Environmental Indices for Navi Mumbai (2015-17) ................................................ 2
Figure No. 2: Category wise share in occurrence of various categories of Air Quality Index
2016-17 .......................................................................................................................................... 3
Figure No. 3: Zone wise Noise pollution levels in Navi Mumbai 2016-17 .................................. 4
Figure No. 4: Environmental Indices of Navi Mumbai ................................................................ 10
Figure No. 5: Environmental Performance Index.......................................................................... 11
Figure No. 6: Month wise temperatures recorded in NMMC area 2016-17 .............................. 21
Figure No. 7: Decadal trend of annual rainfall recorded in Navi Mumbai ............................... 22
Figure No. 8: Rainfall recorded in Navi Mumbai .......................................................................... 22
Figure No. 9: Trend for number of operational NMMT buses plying in respective fiscal years
...................................................................................................................................................... 23
Figure No. 10: Population growth in Navi Mumbai ..................................................................... 25
Figure No. 11: Trend of property development over last 8 years in Navi Mumbai ................. 28
Figure No. 12: Yearly Trend in concentration of SO2 at AAQMS in Navi Mumbai ................ 31
Figure No. 13: Yearly Trend in concentration of NOx at AAQMS in Navi Mumbai ............... 32
Figure No. 14: Yearly Trend in concentration of PM10 at AAQMS in Navi Mumbai ............... 33
Figure No. 15: Yearly Trend in concentration of PM2.5 at AAQMS in Navi Mumbai .............. 34
Figure No. 16: Concentration of SO2 in NMMC region for the year 2016-17 ............................ 35
Figure No. 17: Concentration of NOX in NMMC region for the year 2016-17 ........................... 36
Figure No. 18: Concentration of PM2.5 in NMMC region for the year 2016-17 ......................... 37

Environmental Status Report of Navi Mumbai Municipal Corporation-2016-17
ix
Figure No. 19: Concentration of PM10 in NMMC region for the year 2016-17 .......................... 38
Figure No. 20: Concentration of CO in NMMC region for the year 2016-17 ............................. 39
Figure No. 21: Concentration of Ozone in NMMC region for the year 2016-17 ....................... 40
Figure No. 22: Concentration of Methane in NMMC region for the year 2016-17 ................... 40
Figure No. 23: Occurrence of AQI classes for air pollutants in NMMC (2016-17) .................... 41
Figure No. 24: Level of noise pollution in various areas of Navi Mumbai ................................ 42
Figure No. 25: Level of noise pollution in silent areas NMMC area........................................... 43
Figure No. 26: Estimated number of Motor Vehicles on Road in Vashi RTO ........................... 44
Figure No. 27: Decadal trend in annual vehicle registrations in Navi Mumbai ....................... 45
Figure No. 28: Trend in sale of Petrol, Diesel and Furnace Oil in NMMC area by HPCL ...... 46
Figure No. 29 : Trend in sale of LDO in NMMC area in NMMC area by HPCL ...................... 46
Figure No. 30: Benchmarking for per capita water supply for major ULBs in MMR .............. 58
Figure No. 31: Trend in share of potable and non-potable water samples in NMMC area .... 59
Figure No. 32: Ward wise % non-potablity for different types of water in NMMC area ........ 59
Figure No. 33: Trend of water demand in NMMC ....................................................................... 67
Figure No. 34: Trend of water supply and distribution losses in NMMC ................................. 68
Figure No. 35: Ward wise land use categories in NMMC ............................................................ 77
Figure No. 36: Composition of solid waste in NMMC ................................................................. 90
Figure No. 37: The process flow diagram of the Municipal solid waste .................................... 93
Figure No. 38: Quantity of biomedical waste received and treated per year ............................ 98
Figure No. 39: Trend in cases of water borne diseases reported in NMMC area ................... 103
Figure No. 40: Total number of Dengue cases reported in Navi Mumbai ............................... 105
Figure No. 41: Total number of cases and deaths reported due to TB in the past five years 109
List of Maps
Map No. 1: Wards of NMMC along with latitude and longitude............................................... 20
Map No. 2: Spatial representation of existing and proposed CAAQMS in NMMC area ........ 30
Map No. 3: Water Quality Monitoring Stations along creeks in NMMC area .......................... 55
Map No. 4 Location of STPs in NMMC area .................................................................................. 61
Map No. 5: Water Quality Monitoring stations along Nallahs in NMMC area ........................ 65
Map No. 6: Land Use Land Cover pattern of Navi Mumbai ....................................................... 75
Environmental Status Report of Navi Mumbai Municipal Corporation-2016-17
x
List of Pictures
Picture No. 1: E-Toilet with a detailed instruction of its usage displayed at each toilet ......... 14
Picture No. 2: She-toilet with restroom facilities installed by NMMC ....................................... 15
Picture No. 3: Community toilet facilities installed by NMMC .................................................. 16
Picture No. 4: Snapshot of the cover page and a sample illustration from the handbook ...... 17
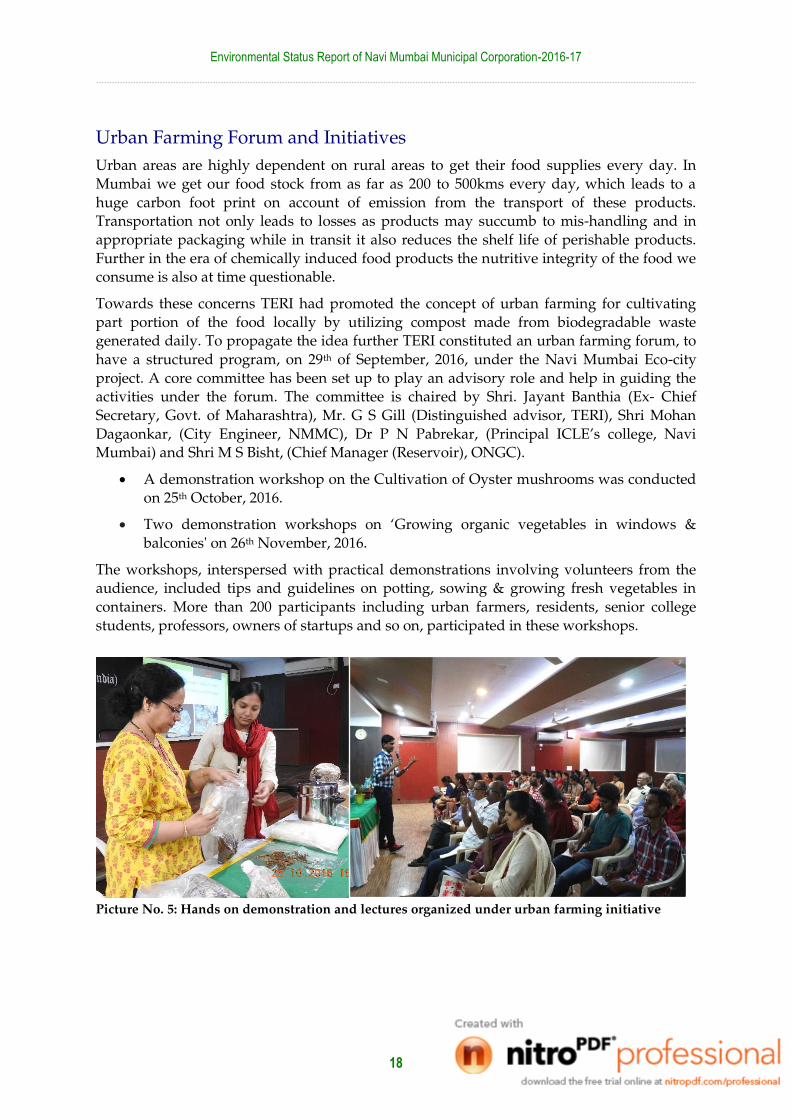
Picture No. 5: Hands on demonstration and lectures organized under urban farming initiative ...................................................................................................................................... 18
Picture No. 6: The partially completed Seawoods Grand Central Station ................................. 27
Picture No. 7: Schematic of the Dutch dyke (Left) and its actual photograph with flap gates (right)........................................................................................................................................... 66
Picture No. 8: MIDC effluent sample collection from industries near Khairne nallah ............ 70
Picture No. 9: Water body at Nerul after its renovation and beautification .............................. 72
Picture No. 10: Growth of mangroves at holding pond in Koparkhairne ................................. 73
Picture No. 11: Back flushing of water at Bhokarpada water treatment plant .......................... 74
Picture No. 12: Dense mangroves cover along Thane creek ........................................................ 79
Picture No. 13: Lesser flamingos at Navi Mumbai ........................................................................ 82
Picture No. 14: Giant tortoise installation at Amusement park at Kopri village-Vashi ........... 85
Picture No. 15: Biodiversity lecterns at Airoli ................................................................................ 86
Picture No. 16: Coastal and Marine Biodiversity Centre (CMBC) at Airoli .............................. 87
Picture No. 17: Satellite picture and schematic layout depicting sections at Turbhe landfill
site ................................................................................................................................................ 92
Picture No. 18: Plastic Baling machine (Left) and Plastic agglomerate (right) at Turbhe
landfill site .................................................................................................................................. 94
Picture No. 19: Road construction using Plastic waste at Turbhe MIDC ................................... 95
Picture No. 20: Vehicle (Left) and collection container deputed by MWML for collection of
BMW ............................................................................................................................................ 97
Picture No. 21: Anti-Larval Spraying activity (Left) Inventory of Guppy Fish Breeding sites (right)......................................................................................................................................... 106
Picture No. 22: Students an d staff members of NMMC schools taking P ledge during Anti
Dengue Month(left) and An awareness campaign during Ganapti utsav (right) .......... 107
Environmental Status Report of Navi Mumbai Municipal Corporation-2016-17
1
Executive Summary
Navi Mumbai is a planned township off the west coast of the Indian state of Maharashtra in
Konkan division. Since it is a planned city, it is well equipped with the state of art facilities
specially related to urban services like solid waste management, public transport, healthcare facilities, sewage treatment, well established road network, efficient storm water
management system and many more. Navi Mumbai, in true terms has lived to its
expectations of absorbing the population shock from the mega city of Mumbai which is evident from the fact that Navi Mumbai recorded a decadal population growth by more
than 51% between 2001 and 2011.
The population of NMMC (Navi Mumbai Municipal Corporation) area was estimated to be about 14.69 lakhs 2016–17 which 1.4% more compared to last year as per the survey data of
UHPs (Urban Health Posts), Health department NMMC. The total number of properties
have also increased to 3,07,710 with residential properties having the highest share of 82% followed by commercial buildings (17%) and industrial properties (1%).
This increase in population coupled with growth in industrial, educational hub, economic
activities and infrastructure are the major driving forces for the growth of a city which exert pressure on the resources of the city like water, air and land. This pressure alters the normal
state of the resources either in terms of resource availability (land and water supply) or
pollution loads (water and air pollution).
Taking this into consideration this report which documents the status of the environment
has been presented as per the DPSIR (Drivers, Pressure, Status, Impact and Response)
framework proposed by MPCB (Maharashtra Pollution Control Board) guidelines 2009.
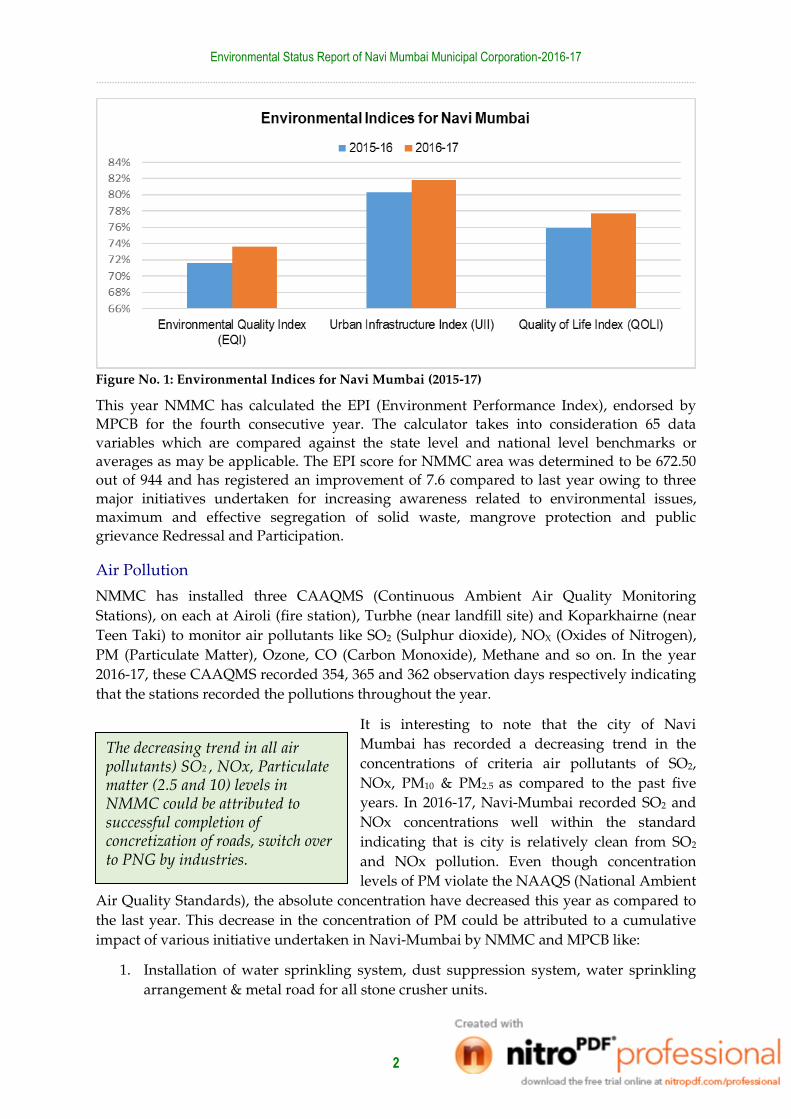
Environmental Indices for Navi Mumbai
To have a comprehensive overview of the
environmental performance and the state of resources NMMC has been annually calculating indices such as,
EQI (Environmental Quality Index); UII (Urban
Infrastructure Index); and QOLI (Quality of Life Index), since the past 16 years. For the year 2016-17,
the EQI has improved by 2.07% followed by UII by
1.47% (Figure No. 1). Overall improvement of EQI is attributed to the improvement in air and water quality,
better management of water supply, effective
segregation and maximum recycling of solid waste, Protection of mangroves, continuous monitoring of
water quality, reduction in wastage of water by 1%
and so on. While the increase in value of UII is attributed to increase in the development of road & footpaths, improvement in playgrounds,
public Grievance Redressal and Participation. The improvement of EQI and UII has thus
improved the QOLI for citizen of NMMC.
NMMC has recorded an improvement in the EQI, UII and EPI, owing to various pro-environment initiatives like effective waste segregation and maximum recycling, Mangrove protection, road and footpath development, Public grievance system and improvements in playgrounds.
Environmental Status Report of Navi Mumbai Municipal Corporation-2016-17
2
Figure No. 1: Environmental Indices for Navi Mumbai (2015-17)
This year NMMC has calculated the EPI (Environment Performance Index), endorsed by
MPCB for the fourth consecutive year. The calculator takes into consideration 65 data
variables which are compared against the state level and national level benchmarks or averages as may be applicable. The EPI score for NMMC area was determined to be 672.50
out of 944 and has registered an improvement of 7.6 compared to last year owing to three
major initiatives undertaken for increasing awareness related to environmental issues, maximum and effective segregation of solid waste, mangrove protection and public
grievance Redressal and Participation.
Air Pollution
NMMC has installed three CAAQMS (Continuous Ambient Air Quality Monitoring
Stations), on each at Airoli (fire station), Turbhe (near landfill site) and Koparkhairne (near
Teen Taki) to monitor air pollutants like SO2 (Sulphur dioxide), NOX (Oxides of Nitrogen),
PM (Particulate Matter), Ozone, CO (Carbon Monoxide), Methane and so on. In the year
2016-17, these CAAQMS recorded 354, 365 and 362 observation days respectively indicating
that the stations recorded the pollutions throughout the year.
It is interesting to note that the city of Navi
Mumbai has recorded a decreasing trend in the
concentrations of criteria air pollutants of SO2,
NOx, PM10 & PM2.5 as compared to the past five
years. In 2016-17, Navi-Mumbai recorded SO2 and
NOx concentrations well within the standard
indicating that is city is relatively clean from SO2
and NOx pollution. Even though concentration
levels of PM violate the NAAQS (National Ambient
Air Quality Standards), the absolute concentration have decreased this year as compared to
the last year. This decrease in the concentration of PM could be attributed to a cumulative
impact of various initiative undertaken in Navi-Mumbai by NMMC and MPCB like:
1. Installation of water sprinkling system, dust suppression system, water sprinkling
arrangement & metal road for all stone crusher units.
The decreasing trend in all air pollutants) SO2 , NOx, Particulate matter (2.5 and 10) levels in NMMC could be attributed to successful completion of concretization of roads, switch over to PNG by industries.

Environmental Status Report of Navi Mumbai Municipal Corporation-2016-17
3
2. Completion of road construction activity along the MIDC patch leading to reduction
in road traffic congestion
3. Change of fuel pattern to PNG (Piped Natural Gas) as fuel supplied by MGL
(Mahanagar Gas Limited) by the Industries within TTC (Trans-Thane Creek)
industrial belt, which has led to reduction in combustion of fuels which otherwise
led to emissions
4. Closure of stone quarry sites within Navi Mumbai region on account of expiry of
lease
The concentration of CO, as recorded by all stations, were relatable to seasonal pattern. The
CAAQMS at Koparkhairne station recorded the highest eight hourly average of 5.1 mg/m3
and 3.4 mg/m3 in month of January followed by CAAQMS at Airoli 3.18 mg/m3 in month of
November as against the eight hourly standard of 2mg/m3. Turbhe recorded the CO levels
in range of 0.2 mg/m3 to 2.0 mg/m3 throughout the year which indicates that the area
represented by the CAAQMS at Turbhe was non-polluted for carbon monoxide pollution. In
terms of ozone, Navi Mumbai was non-polluted as the concentrations of O3 were well
within the standards and did not violate the standard for even a single day.
Figure No. 2: Category wise share in occurrence of various categories of Air Quality Index 2016-17
Based on the Air Quality Index it is determined that the air quality in the year 2016-17 was
non-polluted for more than half at Koparkhairne and Turbhe and mere 10% or less
observation days recorded air pollution in ‘Poor’ or ‘Very Poor’ category. However in Airoli
area around 90% of the observation days has air quality in ‘Good’ and ‘Satisfactory’ quality.
It is primarily the bias because of PM2.5 & PM10 pollution near Turbhe and Koparkhairne as
for the NOx and SO2 sub indexing, all the CAAQMS recorded air quality in either ‘Good’ or
‘Satisfactory’ category.
0%10%20%30%40%50%60%70%80%90%
100%
Airo
li (3
54)
Kop
arkh
airn
e (
362
)
Tur
bhe
(365
)
Airo
li (3
54)
Kop
arkh
airn
e (
362
)
Tur
bhe
(365
)
Airo
li (3
54)
Kop
arkh
airn
e (
362
)
Tur
bhe
(365
)
Airo
li (3
54)
Kop
arkh
airn
e (
362
)
Tur
bhe
(365
)
Airo
li (3
54)
Kop
arkh
airn
e (
362
)
Tur
bhe
(365
)
PM 10 PM 2.5 SO2 Nox
AQI Parameterwise AQI
Category wise share in occurrence of various categories of Air Quality Index 2016-17
Good Satisfactory Moderate Poor Very Poor No data

Environmental Status Report of Navi Mumbai Municipal Corporation-2016-17
4
Noise Pollution
The residential areas and silence zones violated the day time standards except the commercial zones. The sound levels recorded across the city in different zones are presented
below in Figure No. 3. The noise levels at Vashi Hospital, Sector 10 from residential area has
increased by 6 % as compared to previous which recorded 58dB in 2015-16. The noise levels in traffic zones was recorded in range of 66-70 dB .Increase in vehicular population of the
city and increase in honking & driving practices attributed to increase in noise levels.
Figure No. 3: Zone wise Noise pollution levels in Navi Mumbai 2016-17
Water Resources and Quality
NMMC is blessed with abundant water resources in terms of both surface and ground
water. The surface water resources include 24 lakes and ponds, 11 holding ponds and creek
front of about 22km, NMMC area merits various vital environmental and physical services provided by these entities in terms of controlling the floods, water logging, and surface
runoffs and so on.
The lakes in NMMC area are maintained properly by NMMC authority with all parameters except S.S. and DO exceeding in certain lakes. In case of Sulphates, only Vashigaon lake
showed high amount (1198.97 mg/l) than the permissible limit (<1000 mg/l) while all other
parameters were found to be within permissible limits. Major problem was seen in Creeks where all creeks except creek near Nerul Palm Beach road showed higher amount BOD. DO
level was also exceeded in some creeks. All creek samples crossed the permissible limit for
chlorides (<600 mg/l). This could be attributed to the release of untreated effluents from industrial area and other cities along the thane creek.
This year NMMC took a special drive to monitor nallah water quality along the industrial
belt. The Kharine nallah was taken up for this drive. Effluent sample collection, from 84 potentially water polluting industries, was conducted and analysis was done in triplicates
by laboratories of NNMC, the industry itself and a third party certified agency. The reports
were submitted to MPCB for further action. NMMC plans to undertake many similar drives to curb unregulated release of effluents in the nallahs and drains in NMMC.

Environmental Status Report of Navi Mumbai Municipal Corporation-2016-17
5
In terms of ground water resources there are 132 wells regularly monitored by NMMC for
their water quality. Even though all the parameters were well within the limits for groundwater, the samples detected the presence of Escherichia coli and faecal coliforms.
Water supply
Morbe dam, situated on the Dhavri river (tributary of Patalganga river) near Khalapur,
Raigad district is the source of fresh water for
NMMC jurisdiction area. Around 392 MLD (Million Litres per Day) water is supplied from
Morbe dam to the treatment plant at Bhokarpada
in the year 2016–17. NMMC supplies water 24X7 to nearly 75% of the area of the city while the
remaining area is catered to water supply for
about 4–8 hours per day, thus ensuring 100% coverage.
This year the share of Non-Revenue Water has reduced to 18.05% from 19% (3 MLD) be
largely attributed to Installation of AMR (Automatic Meter Reader) and water supply disconnection against consumers failing AMR installation. A total of 4168 AMR were
installed as on 30 March 2017. NMMC undertook active drive on disconnecting illegal water
connections in the year 2016-17. Also NMMC was vigilant for prompt action and 100% addressal of complaints for pipe breaks and leakages in NMMC area, thus helping bring
down the losses to a large extent.
In 2016-17, NMMC monitored 20,859 drinking water samples at the tap end, from all the nodes. Out of these about 4.72% (984) samples were detected to be non–potable which
indicated high potability, ensuring that the water supplied by NMMC was of good quality.
This is true for samples collected in rainy season and recurrently of some village & slum area which merit attention.
Sewage Treatment
NMMC has 7 active STPs (Sewage Treatment Plants) which have secondary treatment
facilities with an aggregate capacity of about 454 MLD. The Aerated lagoon at Nerul 2 is
now connected to Sanpada STP while NMMC has further taken over the charge of a 30MLD
STP at Ghansoli from CIDCO. It is estimated that around 205 MLD of sewage is generated in
the NMMC area and all the generated sewage is collected and treated, indicating that almost
100% of water is treated before releasing in the creek. NMMC has further proposed sewage
network in slum pockets for collection and connect it to STPs. NMMC has prepared plan for
Airoli and Ghansoli node. Plan for Turbhe, Digha and Nerul is under process.
NMMC regularly monitors the inlet and outlet water samples for bacteriological and
chemical parameters. In the year 2016-17, the efficiency of the STPs were almost 100% in
terms of regulating the BOD (Biochemical Oxygen Demand), COD levels, suspended solids, pH, oil and grease, nitrate, nitrite and dissolved oxygen levels. The average effluent water
quality released from the STPs was well within the standards for all the parameters.
In case of Nallahs, all the parameters except Chlorides were found to be within the permissible limit. Chlorides level were found to be high. This may be due to effluent
discharge into the nallahs from surrounding industries and settlements. NMMC also
1 % reduction in NRW, resulting in savings of 3 Million Liters of water per day. Achieved through stringent initiatives like installation of AMRs, disconnection of Illegal connections and prompt leakage redressal.

Environmental Status Report of Navi Mumbai Municipal Corporation-2016-17
6
performed water quality testing of Holding pond samples and this year the holding pond at
Vashi sector 30 violated BOD level (121 mg/l). Higher DO levels (10.3mg/l) were found only at Belapur Sector 15A while Vashi sector 11 & 12 (2.0mg/l) and Vashi sector 30
(3.0mg/l) showed less DO levels. Rest all the parameters like pH, nitrite, nitrate and
phosphates were well in the limits.
Land use and green cover
The total area under NMMC’s jurisdiction is estimated to be approximately 108.63 sq. km.
Out of the total area, 56% of land accounts for Built Up area followed by Forests (24%),
Wetlands (12%) and the remaining area is broadly classified under water bodies or
agriculture. There are a total of 163 gardens and 80 open spaces which support the
biodiversity of the city. NMMC has proposed the Amusement park at Kopri village in Vashi,
on the lines of the Old Woman’s Shoehouse in Malabar Hill. The work is almost completed
and NMMC plans to inaugurate it soon.
As per the provisional figures, Navi Mumbai has 8.5 Lakhs of tree cover across the city.
Total 25,000 trees have been planted across various nodes in the year 2016-17.
Mangrove Ecosystem
Due to Navi Mumbai’s geographical location along the coastline, Mangroves are important
natural ecosystem for Navi Mumbai. Mangroves play a valuable role as natural barrier
against possible natural calamities like cyclones, floods and tsunamis. They also play a vital
role by reducing carbon footprint owing to its carbon sequestration potential. As per study
conducted by TERI, it is predicted that about 0.26% carbon emissions per year are
sequestered by the mangroves in Navi Mumbai. Around 14.71 sq. km of mangroves in Navi
Mumbai have been notified as ‘reserved forests’ under NMMC limits.
Protection of Mangrove-Wetland ecosystem
NMMC has taken special initiatives to protect and conserve the mangrove forests and the highlights of the initiatives taken in 2016-17 include the following:
Toll free hotline numbers for all wards for grievances against mangrove destruction
has been initiated
Construction of barricading using of curb stones for preventing access of vehicle for
illegal dumping and trespassers
Encroachments from mangroves of Vashi, Ghansoli and Airoli nodes were removed
and replaced by putting fencing.
2 Anti-debris mobile squad for monitoring of illegal activities in mangroves region.
NMMC further proposes to install CCTV’s in mangrove area to have surveillance check on
illegal activities, mangrove plantation drives, develop a mangrove park and set up bird
watching towers near the mangrove area for nature and bird lovers.
Biodiversity
Navi Mumbai is bestowed with high biodiversity due to presence of several habitats ranging
from low hills with tropical semi-evergreen to mangroves forests. Part of Thane Creek and
Uran Creek are the key biodiversity hotspots to observe migratory birds whereas Nerul’s
Talave, Airoli & Ghansoli mudflats are also home to some exotic birds. Various migratory

Environmental Status Report of Navi Mumbai Municipal Corporation-2016-17
7
birds such as the Lesser Flamingos are observed to visit mangrove and mudflats of the city
for breeding and feeding purposes increasing the bio wealth of the city. In order to increase
awareness and sensitize citizens about the local biodiversity of the city, NMMC in
collaboration with TERI has installed biodiversity panels at Nisarga Udyan, Koparkhairane,
and Airoli. Mangrove cell, Forest Department- Government of Maharashtra has developed a
Coastal and Marine Biodiversity Centre (CMCB) at Airoli node in Navi Mumbai to improve
knowledge of citizens about local coastal and marine habitat.
Restoration of Stone Quarries and Protection of Hills
The abandoned stone quarries in Navi Mumbai have affected the aesthetic beauty of the city,
more over the lease of the sites have also expired in 2016 rendering all the sites vacant.
Towards this NMMC has proposed actions for restoration of abandoned quarries and
protection of hills by using them as follows
Use of abandoned quarries for Rainwater harvesting
Planting trees for restoration of land under abandoned quarries
Abandoned quarries can be restored by sanitary land filling
Municipal Solid Waste
Generation and Collection
NMMC has designed a specific solid waste management
strategy for effective disposal of municipal waste. In the
year 2016-17, the daily average MSW was 725 Metric
Tonnes (MT) which has increased by about 30 tons as
compared to the last year. The major share of about 92%
(672 MT) of the total waste is generated from residential
areas of which the Turbhe node generated the maximum MSW, more than 105 MT/day
while Digha node generated about 33 MT/day of MSW. The waste generated from the city
comprises mainly of biodegradable waste (54%).
Waste from the roads is collected through sweeping while household waste is mechanically
collected and loaded in refuse transportation vehicles by transportation contractors. Each
node is provided with green and blue dustbins. The green bins are used to collect the wet
waste while the blue for dry waste. About 56% of solid waste is segregated at source in
NMMC regions.
Along with green and blue dustbins, NMMC has started disseminating red bins for e-waste
collection. Eco Friend Industries has been appointed by NMMC to collect e waste as sample
on demo stage from red bins placed at NMMC headquarters at CBD Belapur, Wonders Park
at Nerul and at Inorbit mall, Vashi.
MSW Disposal
In the year 2016-17 the Turbhe landfill site received around 725 MT waste per day. The MSW
at disposal site is segregated into dry, wet and mixed waste. The plastic is segregated and
transferred to baling unit which converts plastic pieces into small beads which is then
supplied to plastic recycling vendors and other industrial applications. Waste LDPE (Low
Density Polyethylene) collected by NMMC is converted to granules and then processed to
NMMC has achieved more than 60% waste segregation at source through various awareness drives.

Environmental Status Report of Navi Mumbai Municipal Corporation-2016-17
8
use as replacement for Bitumen for road construction. This year NMMC, on a sample basis
undertook 10 pilot projects under this initiative. The dry waste like paper, cardboard, plastic
and other corrugated materials are used to produce a homogenous material known as RDF
(Refuse Derived Fuel), while waste like glass, metal are recycled. The wet waste is converted
to compost using windrows technology and the compost is sold to various clients. NMMC
had organized ‘Anti-Plastic Drive’ at Jewel of Navi Mumbai (Nerul) on 8th January, 2017 for
awareness of harmful effects of plastic. Under this drive, plastic waste from each node is
collected and transferred to Turbhe Solid Waste Management site for scientific processing.
Biomedical and Hazardous Waste
In the year 2016-17 around 13,200kgs (13.2 tons) of biomedical waste was generated in
NMMC area from various hospitals and dispensaries. The collection and disposal is
managed by MWML (Mumbai Waste Management Limited), a private contractor empaneled
by MPCB (Maharashtra Pollution Control Board) and disposed of at the hazardous waste
disposal facility at Taloja The TTC industrial areas houses more than 3000 industrial units,
which generates hazardous waste like spent oil, ETP sludge, pesticides, lead batteries and so
on. It is estimated that around 7216 MT of landfill able hazardous waste was generated and
collected in the year 2016-17. Out of which 6945MT of waste was disposed by TTCWMA
(Trans Thane Creek Waste Management Association) in their land fill site. The incinerable
waste is managed by MWML.
Health
Navi Mumbai has diverse health care services and facilities including clinics, hospitals, super speciality hospitals, private and government dispensaries and so on. There are 6
NMMC (Municipal hospitals) along with 198 private hospitals, 22 NMMC (municipal)
dispensaries and 1 mobile dispensary. Apart from these facilities there are around 315 Ayurvedic, 191 homeopathic, 75 pediatrics and 83 gynaecologists’ clinics as well. Hospitals
are equipped with latest technologies and specialist doctors, experienced staff are competent
to handle emergency cases. Day and night pharmacy and medical services are also available in the city. NMMC’s health department monitors the status of each disease every year and
maintains an inventory of the cases recorded and the subsequent deaths, if any, for keeping
a track on the health status of the city.
Water borne diseases
Diseases like Gastroenteritis, dysentery, Hepatitis-B, Typhoid are commonly occurring
water borne diseases in Navi Mumbai. In 2016-17, occurrence of gastroenteritis decreased by almost 90% with only 35 reported cases compared to 351 in last year. The percentage of
Dysentery decreased by 98% from 65 cases in 2015-16 to just 1 in 2016-17. Similarly, Typhoid
cases went down from 54 in 2015-16 to 19 in 2016-17. Only Hepatitis B showed an upward trend by double the number of cases from 6 in 2015-16 to 12 in 2016-17.
Tuberculosis
Tuberculosis is a major air borne disease in the world and of major concern in India. The number of cases of Tuberculosis grew by 6.3% and almost 1909 Person were detected with
TB as against 1795.patients last year. NMMC is undertaking necessary measures to reduce
the diseases in the city. To eradicate TB, NMMC started providing DOTS (Directly observed treatment, short course), also known as TB-DOTS everyday instead of 3 days in a week from

Environmental Status Report of Navi Mumbai Municipal Corporation-2016-17
9
current year. These DOTS are available in NMMC affiliated hospitals, NGOs, heath posts.
Also Conduction of Cartridge Based Nucleic Acid amplification Test (CB-NAAT) on MDR (Multi-Drug Resistance) and XDR (Extensively Drug-Resistant) TB patients and providing
medicines free of cost.
Vector borne diseases
Mosquitoes, ticks and fleas are the major vectors which carries infectious pathogens like
bacteria, protozoa which are responsible for vector borne diseases. Such diseases are more
prevalent in tropical and sub-tropical climate. Malaria and dengue are more common vector borne diseases in the world. Health department monitors spread of these diseases and
continuously works towards prevention and control of these diseases.
Malaria and Dengue
Through the bite of female Anopheles mosquito, Plasmodium parasite enters the human body
and causes malaria. Similarly, mosquito species Aedes aegypti is the vector for dengue fever.
Both diseases are more prevalent in the areas having high rainfall, lack of proper hygienic and sanitation facilities and unplanned urban growth. The disease could be prevented by
following good practices like covering, cleaning domestic water storage tanks periodically,
preventing mosquito breeding sites through proper environmental management. 2016-17 recorded decrease in number of malaria and dengue cases then the previous year. In 2016-
17, Malaria cases went down from 301 in 2015-16 to 242 in 2016-17. Similarly, 54 cases of
dengue were registered this year than 76 in 2015-16. Along with regular control measures like anti-larval spraying and fogging, NMMC’s health department took following effective
measures in 2016-17 to control spread of vector borne diseases,
• Conduction of malaria camps, student’s March, society meetings and private medical workshops in June 2016 as a part of an initiative of Malaria Prevention Month.
• Collection of blood samples and treatment on patients in July 2016 as a part of
Dengue Prevention Month. • During Ganesh-Utsav and Mahashivratri festival in 2016, awareness was done
through camps, banners, hoardings.
• Survey of Guppy fish sites as an effective biological control against mosquito larvae and spraying of anti-Mosquito powder in Government, private schools and colleges
Conclusion
The necessary initiatives taken by NMMC to improve the air quality, water quality effective segregation of solid waste, protection of ecosystem, development of road & footpaths and
playgrounds has increased the EQI and UII of Navi Mumbai. The improvement of EQI and
UII has thus improved the QOLI for citizen of NMMC. Realising the further pressures on resources, NMMC is undertaking the necessary initiatives to conserve the resources in the
city.

Environmental Status Report of Navi Mumbai Municipal Corporation-2016-17
10
Environmental Indices for Navi Mumbai
The Environment is something we all are familiar with. It’s everything that makes up our
surroundings and affects our ability to live on the earth. An Environment is a very broad
and complex term which covers a wide range of areas. For a common man, Understanding environment, its types, various factors and parameters involved in each type is very difficult
and technical. The aim of assessing status of environment is sustainable development while
maintaining environment quality. Many indices have been developed globally to determine an environmental index (absolute value) using various parameters. These indices can be
used to determine a baseline value for necessary factors and then set up a trend for those
factors that could be analysed for following years to track the development and address the gaps specifically. Three indices have been calculated annually for the past 15 years by
NMMC, viz EQI (Environmental Quality Index); UII (Urban Infrastructure Index); and QOLI
(Quality of Life Index). NMMC has also calculated the EPI (Environmental Performance Index), endorsed by MPCB (Maharashtra Pollution Control Board).
The computation of these indices has been presented in Annex-I. Overall improvement of
EQI is attributed to the improvement in air and water quality, effective segregation and maximum recycling of solid waste, Protection of mangroves, continuous monitoring of
water quality, and so on. While the increase in value of UII is attributed to increase in the
development of road & footpaths, improvement in playgrounds, public Grievance Redressal and Participation.The improvement of EQI and UII has thus improved the QOLI for citizen
of NMMC. The trend of the EQI, UII and QOLI for the past five years is presented in Figure
No.1 and Table No.1.
Table No. 1: Environmental Indices of Navi Mumbai
Sr. No Index 2012-13 2013-14 2014-15 2015- 16 2016-17
1 Environmental Quality Index (EQI) 70.02% 70.69% 71.38% 71.59% 73.66%
2 Urban Infrastructure Index (UII) 78.94% 79.06% 79.65% 80.29% 81.76%
3 Quality of Life Index (QOLI) 74.48% 74.88% 75.52% 75.94% 77.71%
Figure No. 4: Environmental Indices of Navi Mumbai
Environmental Status Report of Navi Mumbai Municipal Corporation-2016-17
11
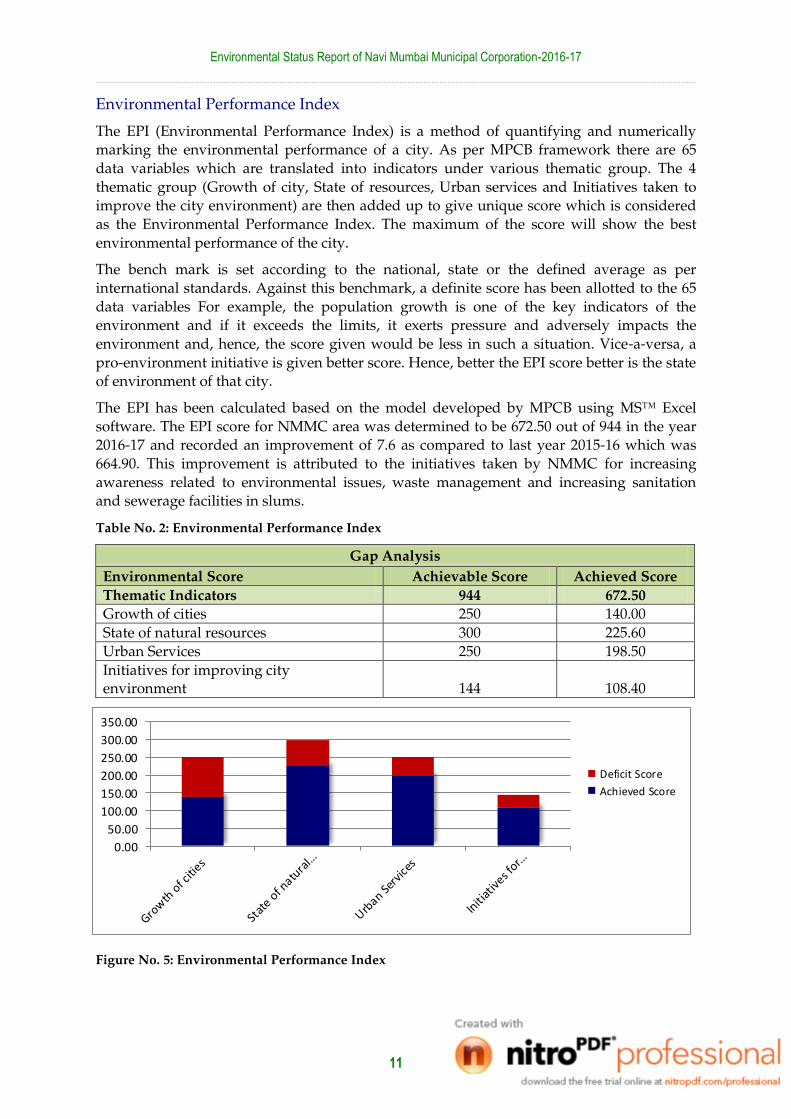
Environmental Performance Index
The EPI (Environmental Performance Index) is a method of quantifying and numerically marking the environmental performance of a city. As per MPCB framework there are 65
data variables which are translated into indicators under various thematic group. The 4
thematic group (Growth of city, State of resources, Urban services and Initiatives taken to improve the city environment) are then added up to give unique score which is considered
as the Environmental Performance Index. The maximum of the score will show the best
environmental performance of the city.
The bench mark is set according to the national, state or the defined average as per
international standards. Against this benchmark, a definite score has been allotted to the 65
data variables For example, the population growth is one of the key indicators of the environment and if it exceeds the limits, it exerts pressure and adversely impacts the
environment and, hence, the score given would be less in such a situation. Vice-a-versa, a
pro-environment initiative is given better score. Hence, better the EPI score better is the state of environment of that city.
The EPI has been calculated based on the model developed by MPCB using MS™ Excel
software. The EPI score for NMMC area was determined to be 672.50 out of 944 in the year 2016-17 and recorded an improvement of 7.6 as compared to last year 2015-16 which was
664.90. This improvement is attributed to the initiatives taken by NMMC for increasing
awareness related to environmental issues, waste management and increasing sanitation and sewerage facilities in slums.
Table No. 2: Environmental Performance Index
Gap Analysis
Environmental Score Achievable Score Achieved Score
Thematic Indicators 944 672.50
Growth of cities 250 140.00
State of natural resources 300 225.60
Urban Services 250 198.50
Initiatives for improving city environment 144 108.40
Figure No. 5: Environmental Performance Index
0.00
50.00
100.00
150.00
200.00
250.00
300.00
350.00
Deficit Score
Achieved Score
Environmental Status Report of Navi Mumbai Municipal Corporation-2016-17
12
Initiatives under Swaccha Maharashtra Abhiyan
& Eco-City Program
As per the guidelines of Swaccha Bharat Mission (Urban), all the urban local bodies have to
provide toilet facility to all households having no latrines within premises and an effective
solid waste management. Towards this, Government of Maharashtra launched ‘Swaccha Maharashtra Abhiyan’ with its own ambitious target of achieving this feat by 2nd October,
2019.
The objectives of this abhiyan includes elimination of Open defecation, eradication of manual scavenging, provision of modern and scientific solid waste management, awareness
about sanitation and public health, capacity augmentation for ULB’s and creating healthy
environment for private sector participation in Capital expenditure, Operation and maintenance. Swaccha Maharashtra Abhiyan in urban areas is being implemented by Urban
Development Department (UDD) through a dedicated Swaccha Maharashtra Mission
Directorate. At city level, the mission is being implemented by Urban Local Bodies1.
Infrastructure and Facilities developed by NMMC
1. As per the guidelines under Swaccha Bharat Abhiyan and declaration of Swaccha
Maharashtra Abhiyan by state government on 15 May 2015, ‘Project Execution Cell’ for Swaccha Maharashtra Abhiyan (Civilian) was established on NMMC Municipal
Commissioners’ order on 06 August, 2015.
2. Under Swaccha Bharat Mission/Swaccha Maharashtra Abhiyan, Famous singer and musician Mr. Shankar Mahadevan was appointed as the Swacchta Brand
Ambassador for Navi Mumbai.
3. 20 Smart E-Toilets and 6 Smart She Toilets (Table No. 4) have been constructed in NMMC’s jurisdiction. Smart she toilets have facilities like sanitary vending machine,
mirror, baby feeding room, diaper changing room and rest room. Such initiative is
modern in state as well as in country. Toilet manufacturer Eram Scientific has declared this concept as ‘NMMC Model’. Construction of 4 more smart she toilets are
proposed.
4. To make Navi Mumbai an Open Defecation Free (ODF) city, NMMC has a policy of construction of individual household, public and community toilets under Swachha
Maharashtra Abhiyan. Under this policy, NMMC provides a grant of INR 17,000/- to
eligible beneficiaries for construction of Individual House Hold Latrines (IHHL). Out of INR 17,000, Central government gives 4000, State government 8000 and NMMC
gives 5000 rupees.
5. NMMC has proposed construction of 1935 Individual household toilets and 719 community toilets to make NMMC and OD free city.
6. Under Swachha Maharashtra Abhiyan, NMMC got funding of Rs. 621.54 Lacs from
central and state government. Out of this, Rs. 310.38 lacs is already spent as on 13th June, 2017.
1 https://swachh.maharashtra.gov.in/1110/About-SMM
Environmental Status Report of Navi Mumbai Municipal Corporation-2016-17
13
7. Under CSR (Corporate Social Responsibility), various corporates have built toilets in
NMMC. The Shelter Associates of Pune built 54 Individual household toilets in Ramabai Ambedkar nagar (Belapur) and 334 in Samta nagar, Airoli naka (Airoli).
While the Shipping Corporation of India constructed 20 seating public toilets in
Bhimanagar (Rabale). Lubrizol India constructed a modern NAMMA (initiative of Commissionerate of Municipal administration, Chennai) smart toilet with capacity of
7 seats at Pfizer road, Hanuman nagar, Turbhe. Similarly, the construction of SS
(Stainless Steel) twin bins has been done using CSR funding.
8. Under MLA’s (Member of Legislative Assembly) Local Development Program 2015-
16, construction of 2 modern community toilets have been complete out of 4
proposed toilets near Belapur Vidhan sabha. Similary 1 mobile toilet is set up in Airoli vidhan sabha area.
9. During the financial year 2017-18, construction of community smart toilets at
gardens, playgrounds and other public places is proposed.
Awareness, Outreach and Feedback
1. Between April 2016 to March 2017, around 170 thematic Cleanliness Drives were successfully conducted which included around 165781 man hours.
2. An Android based toilet Locator app has been developed to track all public/
community toilets located in NMMC jurisdiction area.
3. Immediate actions of cleanliness related issues through Swachhta APP and NMMCs
App. Information related to Swaccha Abhiyan and public response can be monitored
through Whatsapp/Facebook/Twitter.
4. Installation of Citizen Feedback Unit in selected public toilets for recording public
opinions.
Awards and Recognition received by NMMC for initiatives under Swacchatta Abhiyaan
1. Navi Mumbai was ranked 1st in Maharashtra (West Zone) and 8th in country as the
cleanest city as per Swaccha Sarvekshan (Survey) -2017.
2. Under Swaccha Bharat Abhiyan, NMMC ranked first in Advanced Public Toilets and
Information, Education and Behaviour Change Communication (IEBC) categories
and received awards during 45th Skoch Award-2016 held in Hyderabad on 8th &-9th September, 2016.
3. Committee from Quality Council of India declared NMMC jurisdiction area as Open
Defecation Free (Hagandari-mukta) area in December 2016. The report has been submitted to the government.
4. The Smart E-Toilet and She –Toilet initiative received an award by “Washroom
Beyond” (Wb) magazine in 2016.
Environmental Status Report of Navi Mumbai Municipal Corporation-2016-17
14
Table No. 3: Number and Locations of Smart E Toilets (Single seated, unisex)
Sr.No. Node Number Locations
1
Belapur 4
Near T. S Chanakya Signal, Palm Beach Road
2 Near NRI Signal, Sector 50 Bus Terminal, Palm Beach Road
3 At Uran Junction, Sector 15, CBD Belapur, Palm Beach Road
4 Near DAV School, Sector 48, Nerul
5
Nerul 3
Near Vajrani Sports Signal, Palm Beach Road
6 Near D Y Patil Sports Stadium, Sion Panvel Highway
7 Opp. Nerul Bus Terminus, Sector-3
8 Vashi 2
Mini Sea Shore (North), Sector 10-A
9 Mini Sea Shore (South), Sector 10-A
10 Turbhe
2 Opp. Gokul Dairy, Palm Beach Road
11 Near Moraj Signal, Palm Beach Road
12
Koparkhairne
5 Near Lokmat Bus Stop Thane Belapur Road
13 Mahape over Bridge, Thane Belapur Road
14 Pawane near Zydus Company, Thane Belapur Road
15 Near Pawane Police Chowki, Thane Belapur Road
16 Near Bawkaleshwar Temple, Pawane MIDC
17
Ghansoli
3 Near Rabale Police Station, Thane Belapur Road
18 Talavali Naka, Thane Belapur Road
19 Ghansoli Naka, Thane Belapur Road
20 Airoli 1 Near Reliable Company, Thane Belapur Road
Picture No. 1: E-Toilet with a detailed instruction of its usage displayed at each toilet

Environmental Status Report of Navi Mumbai Municipal Corporation-2016-17
15
Table No. 4: Smart She Toilets with rest room (Exclusively for Women)
Sr.No. Node Location
1 Belapur CBD Belapur Bus Terminus, Sector 6
2 Nerul R.R.Patil Udyan, Nerul
3 Vashi Opp Center One Mall, Sector-30, Vashi
4 Vashi Vashi bus terminus, Sector-9
5 Koparkhairne Near D-mart circle, Sector-7
6 Airoli Near Airoli bus terminus, sector-3
Picture No. 2: She-toilet with restroom facilities installed by NMMC
Environmental Status Report of Navi Mumbai Municipal Corporation-2016-17
16
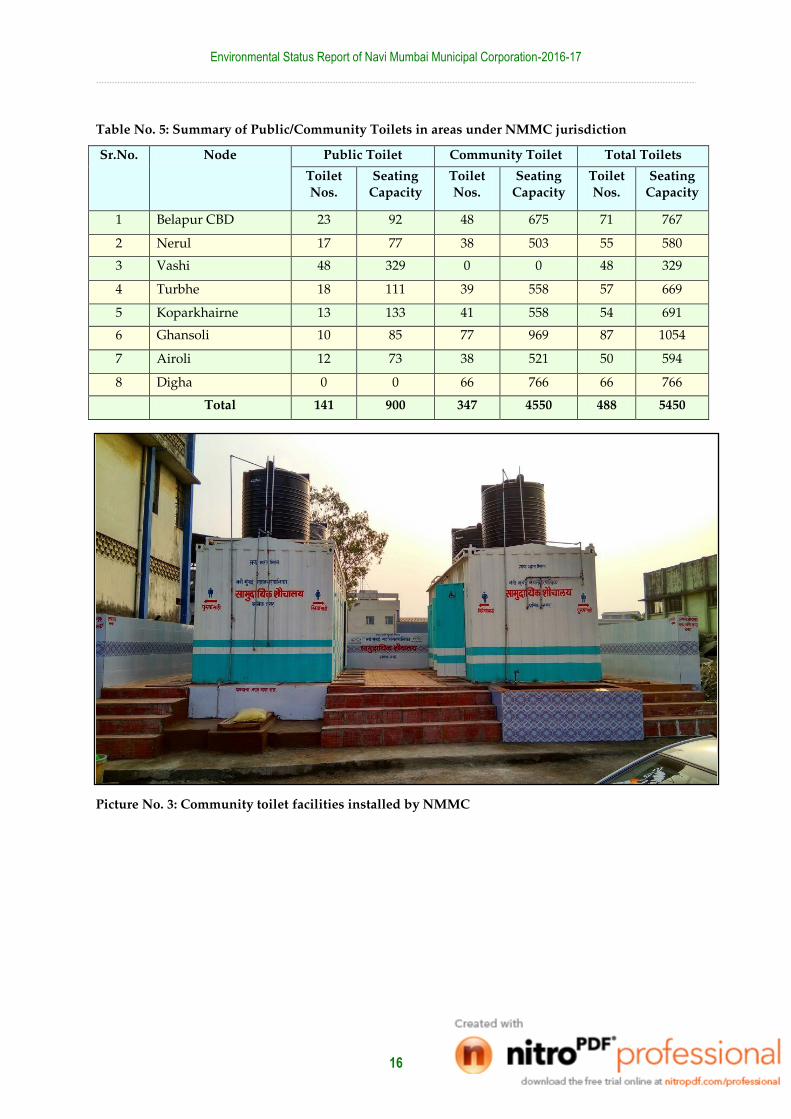
Table No. 5: Summary of Public/Community Toilets in areas under NMMC jurisdiction
Sr.No. Node Public Toilet Community Toilet Total Toilets
Toilet
Nos.
Seating
Capacity
Toilet
Nos.
Seating
Capacity
Toilet
Nos.
Seating
Capacity
1 Belapur CBD 23 92 48 675 71 767
2 Nerul 17 77 38 503 55 580
3 Vashi 48 329 0 0 48 329
4 Turbhe 18 111 39 558 57 669
5 Koparkhairne 13 133 41 558 54 691
6 Ghansoli 10 85 77 969 87 1054
7 Airoli 12 73 38 521 50 594
8 Digha 0 0 66 766 66 766
Total 141 900 347 4550 488 5450
Picture No. 3: Community toilet facilities installed by NMMC

Environmental Status Report of Navi Mumbai Municipal Corporation-2016-17
17
Eco City Program
As a response to the environmental indicators and to minimize the local and global impacts
from NMMC area, the corporation has undertaken the ‘Eco-City program in collaboration with The Energy and Resources Institute (TERI). The program aspires to develop Navi
Mumbai as India’s first ‘Eco City’ on the principles of sustainable development. The major
objective of the project is to appropriately utilize and conserve the natural resources within the municipal limits and promote sustainable development in the city. In the first phase,
TERI developed the carbon inventory to estimate the carbon footprint of the city and
subsequently developed a comprehensive action plan. The highlights of the initiatives undertaken in the year 2016-17 is presented below.
Eco-City Forum
Under the Eco-city project, TERI and NMMC launched the Eco-city Forum on 29th July 2016. The forum has been launched with the following objectives
To generate a movement where all the concerned stakeholders would be involved at
various stages to make Navi Mumbai an Eco city
To encourage dialogues on the right challenges, with right people and at right time.
To derive appropriate actions leading towards implementable solutions.
The program was witnessed participation of around 160 citizens, who were introduced to the concept of the program and was followed by a panel discussion to seek support of the
citizens. The activities of the forum would initially focus on the themes of Green Buildings,
Urban Farming, Energy Conservation and Water Conservation.
The event also witnessed the release of the book ‘Handbook on Water Conservation’ (Picture
No. 4) developed under the project. The book presents easy to understand illustrations
highlighting simple techniques to conserve water in our day to day life. The book and been uploaded on TERI’s website and can be accessed on the following weblink
http://www.teriin.org/files/water_handbook.pdf
Picture No. 4: Snapshot of the cover page and a sample illustration from the handbook
Environmental Status Report of Navi Mumbai Municipal Corporation-2016-17
18
Urban Farming Forum and Initiatives
Urban areas are highly dependent on rural areas to get their food supplies every day. In
Mumbai we get our food stock from as far as 200 to 500kms every day, which leads to a
huge carbon foot print on account of emission from the transport of these products. Transportation not only leads to losses as products may succumb to mis-handling and in
appropriate packaging while in transit it also reduces the shelf life of perishable products.
Further in the era of chemically induced food products the nutritive integrity of the food we consume is also at time questionable.
Towards these concerns TERI had promoted the concept of urban farming for cultivating
part portion of the food locally by utilizing compost made from biodegradable waste generated daily. To propagate the idea further TERI constituted an urban farming forum, to
have a structured program, on 29th of September, 2016, under the Navi Mumbai Eco-city
project. A core committee has been set up to play an advisory role and help in guiding the activities under the forum. The committee is chaired by Shri. Jayant Banthia (Ex- Chief
Secretary, Govt. of Maharashtra), Mr. G S Gill (Distinguished advisor, TERI), Shri Mohan
Dagaonkar, (City Engineer, NMMC), Dr P N Pabrekar, (Principal ICLE’s college, Navi Mumbai) and Shri M S Bisht, (Chief Manager (Reservoir), ONGC).
A demonstration workshop on the Cultivation of Oyster mushrooms was conducted
on 25th October, 2016.
Two demonstration workshops on ‘Growing organic vegetables in windows &
balconies' on 26th November, 2016.
The workshops, interspersed with practical demonstrations involving volunteers from the audience, included tips and guidelines on potting, sowing & growing fresh vegetables in
containers. More than 200 participants including urban farmers, residents, senior college
students, professors, owners of startups and so on, participated in these workshops.
Picture No. 5: Hands on demonstration and lectures organized under urban farming initiative

Environmental Status Report of Navi Mumbai Municipal Corporation-2016-17
19
Navi Mumbai – City Profile
In Mumbai, the total landmass available for development is limited due to its geographic
location and this was already realised in the late 60’s by the developers and planners. Hence,
exploring other options to divert and to control population of Mumbai was suggested, by city planners, by constructing a twin city, Navi Mumbai, as an alternative to address the
issue of space crunch in Mumbai.
Conceived in the year 1972, Navi Mumbai is one of the largest planned cities of India and was designed to decongest Mumbai. In 1970 CIDCO (City & Industrial Development
Corporation), a state public sector undertaking, was incorporated with purpose to plan,
develop and maintain the city of Navi Mumbai under ‘Companies Act' of 1956. CIDCO prepared development plan for Navi Mumbai covering 95 villages from Thane to Raigad
district with an estimated area of 343.70 sq.km2. CIDCO has planned to develop 14 nodes in
Navi Mumbai out of which 8 nodes were handed over to NMMC (Navi Mumbai Municipal Corporation) in 1991 for its maintenance. The development of industrial belt in Navi
Mumbai attracted a large population as it gave rise to employment opportunities. Further
given the ease of connectivity to Mumbai, the city witnessed quick progress in term of urbanisation.
Navi Mumbai is a part of Konkan coast line and is located in centre of MMR (Mumbai
Metropolitan Region) with Thane creek on west side while the Parsik hill ranges surrounded on east side, whereas Thane and Panvel region covers the North and South zone. NMMC
jurisdiction is divided in eight zones starting with Digha in north and Belapur in south (Map
No. 1). Out of the total area of 343.70 sq. km for Navi Mumbai, 108.63 Sq. km area is under NMMC3. As per UHP (Urban Health Post) estimate for the year 2016-17 the population
residing within NMMC, area is more than 14 lakhs (14,69,302) with an average population
density of about 13,525 persons per sq. km. The geographic and demographic profile of Navi Mumbai is represented in Table No. 6.
Table No. 6: Geographic and demographic highlights of Navi Mumbai
Heads Attributes
Longitude
Latitude
72°58’ to 73°03’E 19°00’ to 19°12’N
Mean Height above Sea Level 3.25 Metres
Nodes under NMMC Belapur, Nerul, Turbhe, Vashi, Koparkhairane, Ghansoli, Airoli and Digha.
Total area under NMMC jurisdiction 108.63 sq. km
Estimated Population 2016-17 (UHP Survey) 14,69,302
Population (Census of India-2011) 11,20,547
Population Density (Census data-2011) 10,315 persons per sq. km
Sex Ratio (As per census data-2011) 837 Females per 1000 Males,
Source: Census of India 2011
2 https://www.nmmc.gov.in/history 3 City Engineering Department, NMMC

Environmental Status Report of Navi Mumbai Municipal Corporation-2016-17
20
Map No. 1: Wards of NMMC along with latitude and longitude

Environmental Status Report of Navi Mumbai Municipal Corporation-2016-17
21
Climate
Navi Mumbai lies in the tropical climatic zone and has three seasons’ summer, monsoon and winter. The annual temperature in Navi Mumbai varies from 22°C to 36°C while in summers
the maximum temperature ranges between 36°C to 41°C and the minimum temperatures in
winter ranges between 17°C to 20°C. The average annual rainfall is 2000-2500 mm and humidity is 61-86 %. Based on IMD’s (Indian Meteorology Department) observations
recorded at TBIA’s (Thane Belapur Industry Association’s) premises, the predominant wind
direction in Navi Mumbai is southwest in monsoon and north-east during rest of the year.4
Based on the data recorded at the CAAQMS (Continuous Ambient Air Quality Monitoring
Stations), for NMMC, the monthly average temperatures (Figure No. 6) were recorded to be
between 25°C to 31°C for the year 2016-17. The highest maximum average temperature of 31°C was recorded in the month of May (summer season) and the lowest temperature of
about 25°C was recorded in the January month.
In the year 2016 Navi Mumbai received around 2706.44 mm of rainfall (Figure No. 7). As seen in the same figure Navi Mumbai has experienced high rainfall in the months of July
(1080.85mm) and August (465.08mm) and September (470.65mm), compared to previous
year 2015. The month of June recorded relatively low rainfall (635.23mm) compared to the year 2015 (709.33) and was also the third highest rainfall (635.23) recorded in in June
compared to the years. In this year, the July month recorded the highest rainfall (1080.85)
while there was no rainfall in November (Figure No. 8).
Figure No. 6: Month wise temperatures recorded in NMMC area 2016-17 Data source: CAAQMS of NMMC at Airoli, Turbhe and Koparkhairne
4 http://www.nmmconline.com/web/guest/climate
0.00
5.00
10.00
15.00
20.00
25.00
30.00
35.00
40.00
Apr May Jun Jul Aug Sep Oct Nov Dec Jan Feb Mar
Tem
p (
°C)
Month Wise temperature in NMMC 2016-17
Min. Average Max.

Environmental Status Report of Navi Mumbai Municipal Corporation-2016-17
22
Figure No. 7: Decadal trend of annual rainfall recorded in Navi Mumbai
Source: Environmental Laboratory, NMMC
Figure No. 8: Rainfall recorded in Navi Mumbai
Source: Environmental Laboratory, NMMC
3268 3153
2501 2317
1670
23652609
2326
3347
2530
1614
2706
0
500
1000
1500
2000
2500
3000
3500
4000
2005 2006 2007 2008 2009 2010 2011 2012 2013 2014 2015 2016
Rai
nfa
ll in
mm
Month
Decadal trend of annual rainfall recorded in Navi Mumbai
June July August September October November
635.23
1080.85
465.08 470.65
54.60
0.00
200.00
400.00
600.00
800.00
1000.00
1200.00
June July August September October
Rai
nfa
ll in
mm
Month
Rainfall recorded in Navi Mumbai 2016-17

Environmental Status Report of Navi Mumbai Municipal Corporation-2016-17
23
Connectivity
In terms of rail connectivity, Navi Mumbai has six rail corridors, 157 km railway system and an independent mainline rail terminal connecting the city directly to Chhatrapati Shivaji
Maharaj Terminus (town side) as well as western parts of Mumbai.5 The city also has good
accessibility to Pune and Pimpri regions through road as well as rail transport.
The NMMC area is served by 4 bus transport agencies operation between Mumbai-NMMC
area, within NMMC area, Thane-NMMC area and surrounding areas. The road transport
wing of Navi Mumbai includes connectivity from bus operators of BEST (Brihanmumbai Electric Supply and Transport), NMMT (Navi Mumbai Municipal Transport), KDMT
(Kalyan- Dombivli Municipal Transport) and KMT (Khopoli Municipal Transport) which
provide bus services to entire Navi Mumbai city as well as to certain parts of Mumbai, Thane, Kalyan, Dombivli, Badlapur, Taloja, Panvel and Uran.
NMMT has 3 Depots and buses runs on 70 routes daily. The number of operational buses
under NMMT was 480 in the year 2016-17. NMMC has a fleet of both AC (82) and Non AC (398) buses in its inventory. Buses runs either on Diesel or CNG. As seen in Figure No. 9,
NMMT had 90 more buses plying in 2016-17 (480) as compared to the previous year (390).
As per the data records of NMMT, the average monthly earnings from passenger tickets is around INR 75 Lakhs. The distance travelled by buses per day is on an average 275.94 km.
for both CNG and Diesel buses.
Many projects, like the Navi Mumbai Metro, trans-harbour link between Mumbai (Wadala) and Navi Mumbai (Ulwe), elevated corridor on Palm Beach road, as well as the ambitious
international airport proposed near Panvel, are expected to enhance the connectivity as well
as the status of the city.
Figure No. 9: Trend for number of operational NMMT buses plying in respective fiscal years
Source: NMMT
5 http://www.nmmconline.com/nmmt
281 281261
376 376336
356 360390
480
0
100
200
300
400
500
600
2007-08 2008-09 2009-10 2010-11 2011-12 2012-13 2013-14 2014-15 2015-16 2016-17
No
s
Trend for number of operational NMMT buses plying in respective fiscal years

Environmental Status Report of Navi Mumbai Municipal Corporation-2016-17
24
Drivers
All over the world, urban population is increasing after the industrial revolution. There is
rapid migration of people from rural to urban areas for jobs and better living which has led
to rapid urbanization globally. The convenience of access to goods, better education, employment, medical services, lifestyle, connectivity, employment opportunities and so on
are some of the benefits of urban areas. Hence, the process of urbanization forms one of the
most important dimensions of economic, social and physical change. However, urbanization is also a challenge which leads to variety of problems. Continuous influx of people from
rural to urban areas creates pressure on natural resources like land and water. It also leads to
pollution due to discharge of various untreated by products in water as well as air.
Due to urbanization, all developing countries including India is witnessing increasing levels
of urban population. Indian urban population is increased from 17.9% to 33.14% in 2016 and
the trend is rising continuously6.While cities are regarded as 'Engines of growth', they continue to face enormous challenges. Increasing urbanization has led to tremendous
pressure on land, civic infrastructure, transport, open spaces and so on. It is projected that
the urban population would grow to about 470 million in 2021 and 700 million in 20417. The rapid expansion of urban areas due to rise in population and economic growth is increasing
additional demand on natural resources thereby causing land-use changes especially in
megacities.
The population of India has increased by more than 22% (181 million) during the decade
2001-20118. In India, share of urban population has increased from 29.24% in 2005 to 32.75%
in 2015 and is continuously increasing year on year9. The increase in population directly leads to increase in demand for land, water as well as other natural resources, indirectly
impacting their natural status. Thus population growth acts as crucial driver to urbanisation,
which may impact various resources. These resources have been analysed in separate sections for their status, the Pressures being exerted on them, the ―Impact of various urban
activities on these resources, and the ―Response taken by the corporation to reduce the
impacts.
Population growth
NMMC estimates the population of the city every year based on the survey data of the
UHPs (Urban Health Posts) in NMMC. In the year 2016-17, the population of NMMC was
estimated to be about 14,69,302 and registered a growth of about 1.4% as compared to 2015-
16 (14,48,506). The development of industrial belt with ample job opportunities, higher
income leading to better lifestyle, and other facilities has led to migration of people into the city. The population growth for last 5 years for Navi Mumbai has been represented in Figure
No. 10.
6 http://data.worldbank.org/indicator/SP.URB.TOTL.IN.ZS?locations=IN 7 Ministry of Statistics & Programme Implementation, Government of India, Conference of Central and State Statistical Organisations (COCSSO), page 6 8 http://censusindia.gov.in/2011-prov-results/data_files/india/pov_popu_total_presentation_2011.pdf 9 https://www.statista.com/statistics/271312/urbanization-in-india/

Environmental Status Report of Navi Mumbai Municipal Corporation-2016-17
25
Figure No. 10: Population growth in Navi Mumbai
Source: UHP Survey, NMMC
Industrial and Commercial growth
The policy adopted by The Maharashtra Government lead to the development of an
industrial area in Navi Mumbai which resulted in migration/re-location of people to Navi
Mumbai for better lifestyle and job opportunities. Development of industrial belt in Navi Mumbai has led to rapid industrialization in the city which has been one of the prime
economic driver for the city. About 16% of total area in Navi Mumbai falls under MIDC
(Maharashtra Industrial Development Corporation) zone10. The city is also home to various educational institutes which offer variety of courses. Various MNC’s (Multi-National
Companies) have their offices/branches in the city which makes this city an attractive
business destination. It has various recreational and public places which makes it an ideal city for living. The key industrial growth centres have been discussed below.
MIDC areas
The Trans Thane creek (TTC) Industrial area lies within the NMM C limits while the Taloja MIDC area lies in close proximity of NMMC area. The TTC industrial area accounts for more
than 3000 industries while the Taloja industrial area consists of large, medium and small
industrial units. Various types of processing industries including chemical, paper, plastic and so on are located in these industrial areas. Some of the well-known industries in these
areas include Balmer Lawrie & Co. Ltd., Reliance Paper Products, E Merck (I) Ltd.,
Hindustan Lever Ltd. and Pidilite Industries Ltd, Pfizer, Lubrizol India Ltd., Polyolefins Industries Ltd., Herdillia Chemicals Ltd., BASF (India) Ltd., Star Chemicals, Indofil
Chemicals Ltd., and Phoenix Chemical Works and so on11.
Apart from industrial units, there exists a CBD (Central Business District) located at Belapur spreads over 575 hectare which has been developed to house various corporate as well as
government offices. The area is known to account for country's most prominent IT- BPO
10 http://www.nmmconline.com/web/guest/land-usage 11 http://www.tbiaindia.org/Industry.html
1427375 1429518
1437379
1448506
1469302
1400000
1410000
1420000
1430000
1440000
1450000
1460000
1470000
1480000
2012-13 2013-14 2014-15 2015-16 2016-17
Nu
mb
ers
Population Growth in Navi Mumbai

Environmental Status Report of Navi Mumbai Municipal Corporation-2016-17
26
establishments. Employments observed in CBD Belapur are around 32% while 37% jobs are
IT-BPO establishments located in Vashi.12
Jawaharlal Nehru Port Trust
The Jawaharlal Nehru Port Trust, located within the Mumbai harbour on the west coast of
India, was commissioned on 26th May 1989, is one of the most modern major ports in India. It is country’s largest container port which handles around 60% of the country's
containerized cargo. It is considered as hub port on the western coast of India handling
around 60% of the country's containerized cargo. It has three dedicated container terminals namely JNPCT (Jawaharlal Nehru Port Container Terminal), NSICT (Nhava Sheva
International Container Terminal) & GTIPL (Gateway Terminal India Private Ltd). As on
2016, it is connected with 34 Container Freight Stations (CFSs) and 46 Connected Inland Depots (ICDs). The port has handled 62.15 million tonnes of cargo in financial year 2016-17,
out of which Containerized cargo constituted around 54.53 million tonnes, liquid cargo 6.78
million tonnes and remaining 0.84 million tonnes was of miscellaneous types of dry bulk cargo13.
APMC (Agriculture Produce Marketing Committee) market
The APMC market established at Vashi node of NMMC, spread across almost 8 hectares, is one of the biggest agricultural markets in Asia and has given a unique identity to the city.
Agricultural produce from various parts of the country arrives at APMC which attracts a lot
of wholesalers as well as retailers as it gets distributed to various suburbs of the city. Since its establishment in 1996, about 13 major wholesale agricultural produce markets from
Mumbai were shifted to APMC Vashi. The APMC has an estimated annual trade turnover of
INR. 6000 crores, and generates employment for about 1 lakh people. APMC comprises of four markets divided into two phases.- Phase-I comprises Market I and Market –II for
wholesale dealing of onion & potato and fruit & vegetable respectively whereas Phase-II has
Market-I which is the commodity market and Market-II which is the grain, rice and oilseed market 14.
CBD (Commercial Business Districts) of Belapur
CBD Belapur is a chief business district of Mumbai after Vashi, Bandra-Kurla Complex, Nariman Point and Worli. CBD Belapur houses several economic and government
administrative and private companies' offices (including government offices and banks).
Konkan Bhavan building houses several state government offices, like the Director of Town planning and Public Works Department.
The CGO (Central Government Office) Complex has offices of Chief Commissioner of
Central Excise, Special Crime Branch, MTNL (Mahanagar Telephone Nigam Limited) and Court. Other government offices include Cotton Corporation of India Ltd and the
headquarters of Konkan Railway. Various banks like The Reserve Bank of India, State Bank
of India, Bank of India, Punjab National Bank, and Industrial Development Bank of India Limited and other nationalized banks have their presence here. CBD Belapur is home to
several call centres, shipping companies, eateries, restaurants as well as educational
institutions.
12 http://www.cidco.maharashtra.gov.in/NM_Commercial_Infrastructure.aspx 13 http://www.jnport.gov.in 14 http://www.navimumbai.com/apmc.aspx#

Environmental Status Report of Navi Mumbai Municipal Corporation-2016-17
27
IT parks at Airoli and Mahape
Navi Mumbai is also a major hub for corporate offices and multinational companies. It is one of the most preferred destination for booming IT industry. Mahape has the largest and
modern state of the art Software Park called ‘Millennium Business Park’, spread over 20 lakh
sq. Feet. Similarly, the ‘Airoli Knowledge Park’ is an ideal location for many IT and BPO companies due to its vicinity to Mumbai. Both these major IT parks are well connected by
road and easily accessible from other major metropolis like Thane and Mumbai.
Malls & Retail Stores
There are adequate utility services, malls, retail shops, multiplexes in Navi Mumbai. Vashi is
the leading node compared to others having big and famous malls like Centre One,
Raghuleela mall and Inorbit mall which are the best shopping destinations with stores like CROMA Electronics, Pantaloons Fashion store, Food Bazaar, Shoppers stop and many more.
There are 6 major operational malls in this zone. D-Mart has launched hypermalls in Navi
Mumbai at Koparkhairne and Nerul. In addition to this there is many medium to small format retail outlets in Navi Mumbai and this year the Seawoods central station complex
(Picture No. 6) has launched a mall facility with several brands and retails outlets.
Picture No. 6: The partially completed Seawoods Grand Central Station
Source: https://az810817.vo.msecnd.net/data/LNTRealty/images/projects/seawoods/img1-
seawood.jpg
Education Industry
A number of premier schools and colleges have been set up in Navi Mumbai. Each of the
nodes is self-sufficient in terms of providing quality education. Navi Mumbai has all types of educational institutes including Pre-primary (245), Primary and Secondary schools (471),
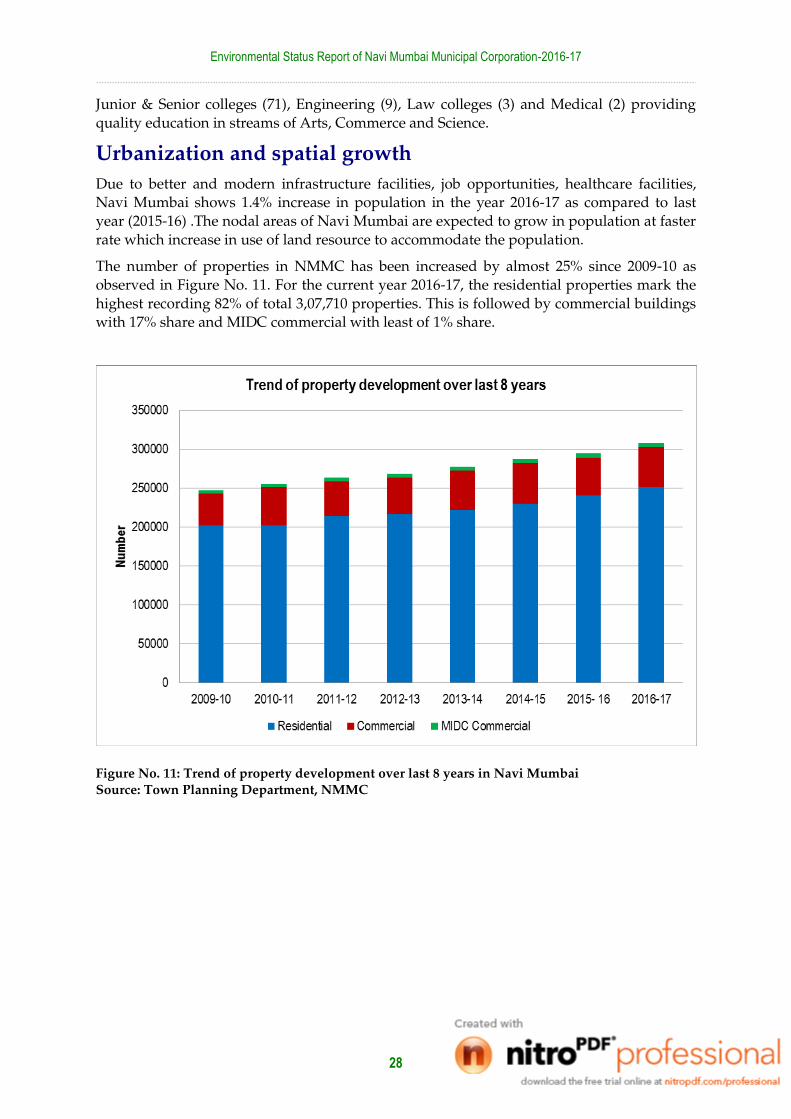
Environmental Status Report of Navi Mumbai Municipal Corporation-2016-17
28
Junior & Senior colleges (71), Engineering (9), Law colleges (3) and Medical (2) providing
quality education in streams of Arts, Commerce and Science.
Urbanization and spatial growth
Due to better and modern infrastructure facilities, job opportunities, healthcare facilities, Navi Mumbai shows 1.4% increase in population in the year 2016-17 as compared to last
year (2015-16) .The nodal areas of Navi Mumbai are expected to grow in population at faster
rate which increase in use of land resource to accommodate the population.
The number of properties in NMMC has been increased by almost 25% since 2009-10 as
observed in Figure No. 11. For the current year 2016-17, the residential properties mark the
highest recording 82% of total 3,07,710 properties. This is followed by commercial buildings
with 17% share and MIDC commercial with least of 1% share.
Figure No. 11: Trend of property development over last 8 years in Navi Mumbai
Source: Town Planning Department, NMMC

Environmental Status Report of Navi Mumbai Municipal Corporation-2016-17
29
Air Quality
The Earth’s atmosphere is a layer of gases surrounding the planet. This mixture of gases
which envelopes the earth is commonly known as Air. The composition of pure air consists
majorly of Nitrogen (78%) and Oxygen. (21%) while other gases like Argon, Carbon-di-oxide, methane and so on are present in trace amounts. Any change in natural composition
of air due to addition of undesirable elements arising from anthropogenic activities like
combustion of fossil fuels. Emissions from Power plants, industries, automobiles, construction activities and so on emit tonnes of air pollutants (any solid, liquid or gaseous
substance, including noise) in the atmosphere which deteriorates the air quality and expose
citizens to great health risks. Higher concentrations of air pollutants may be or tend to be
injurious to human beings or other living creatures or plants or property or environment15.
The Global Burden of Disease (GBD) stated about 4.2 million deaths due to exposure of
PM2.5 (Particulate Matter <2.5 microns) have occurred thus ranking fifth for total deaths worldwide. In 2015, about 17.1% of deaths are occurred from ischemic heart disease, 14.2%
from stroke, 16.5% from lung cancer, 24.7% from LRIs (Lower Respiratory tract Infections),
and 27.1% from COPD (Chronic Obstructive Pulmonary Disease) were recorded due to exposure for Particulate Matter16.As per the WHO (World Health Organization), almost 80%
of urban population are exposed to air quality which fails to meet the WHO guidelines thus
resulting in respiratory disease and other health problems17.
Thus in order to monitor the air quality CPCB (Central Pollution Control Board) at national
level compares the status of air quality parameters which indicate the comparative status of
various cities. In addition to this, at state level MPCB and at city level NMMC also monitors the air quality parameters. The following sections discusses the status of the network and
the air quality thus recorded for various air pollutants and the pressures inducing air
pollution.
Status
Air Quality Monitoring Network
At present there are 4 CAAQMS (Continuous Ambient Air Monitoring Stations) installed at Airoli, Koparkhairane, Turbhe, and Nerul. NMMC has also proposed installation of a
CAAQMS at CBD-Belapur. NMMC operates a mobile monitoring van which is deputed at
various locations in the nodes of Navi Mumbai to monitor the air quality.
The tally of active ambient air quality monitoring stations and their spatial representation is
depicted in Map No. 2. These AAQMS monitor various parameters like SO2 (Sulphur-
dioxide), NOx (Oxides of Nitrogen), PM (Particulate Matter), Methane, CO (Carbon Monoxide) and so on.
15 http://www.moef.nic.in/legis/air/air1.html 16 State of Global Air/2017, Institute for Health Metrics and Evaluation’s Global Burden of Disease Project and the Health Effects Institute 17 http://www.who.int/mediacentre/news/releases/2016/air-pollution-rising/en/

Environmental Status Report of Navi Mumbai Municipal Corporation-2016-17
30
Map No. 2: Spatial representation of existing and proposed CAAQMS in NMMC area
Source: Environment Laboratory, NMMC

Environmental Status Report of Navi Mumbai Municipal Corporation-2016-17
31
Trend in SO2 concentrations
Sulfur dioxide is a highly toxic, colorless, nonflammable gas with a pungent odor. SO2 belongs to sulfur oxides (SOx) group. Among the oxides, SO2 is of major concern related to
human health as compared to other gases within the group. Sulfur dioxide (SO2) is primarily
emitted from anthropogenic sources like burning of fossil fuels by power plants and other industrial facilities as well as fuel combustion in mobile sources such as locomotives, ships,
and other equipment18,19As seen in Table No. 7 and Figure No. 12 the annual SO2
concentrations for all the 3 continuous stations are well below the annual average standards for SO2 (50µg/m3) as per NAAQS (National Ambient Air Quality Standards) set by CPCB.
The SO2 concentration levels in Koparkhairne is decreased by 1.3 times as compared to
previous year 2015-16 which recorded 37.36 µg/m3. Similarly SO2 concentration at Turbhe
recorded a decrease by 1.2 times as compared to previous year (44.46 µg/m3).
Table No. 7. Yearly trend of concentration of SO2 at CAAQMS in Navi Mumbai
Year Koparkhairne
(µg/m3)
Airoli
(µg/m3)
Vashi
(µg/m3)
Turbhe
(µg/m3)
Annual Standard 50 50 50 50 2009-10 23.05 53.60 2010-11 20.01 44.72 2011-12 13.906 19.82 45.14 2012-13 32.245 21.25 24.28 50.08 2013-14 20.3 22.00 31 45 2014-15 14.46 17.92 Site shifting
under process
42.79 2015-16 37.36 26.05 44.46
2016-17 28.84 25.50 36.24
Source: Environmental Laboratory, NMMC
Figure No. 12: Yearly Trend in concentration of SO2 at AAQMS in Navi Mumbai
Source: Environmental Laboratory, NMMC
Trend of NOX concentrations
NOx represents seven compounds (N2O, NO, N2O2, N2O3, NO2, N2O4 and N2O5). Among the NOX family, NO2 has adverse effect on human health since it causes lung disorders and also
18 https://www.pca.state.mn.us/air/sulfur-dioxide 19 https://www.epa.gov/so2-pollution/sulfur-dioxide-basics
0102030405060
0
10
20
30
40
50
60
Koparkhairne Airoli Vashi Turbhe
µg
/m3
Location
SO2
2009-10 2010-11 2011-12 2012-13 2013-14
2014-15 2015-16 2016-17 Standard

Environmental Status Report of Navi Mumbai Municipal Corporation-2016-17
32
acts as contributor in formation of secondary pollutants such as Ozone and acid rain. NOx is
majorly emitted from combustion of fuel automobiles and mobile sources (50%), electric power plants (20%) and other domestic usage (30%)20.
From Table No. 8 and
Figure No. 13 it is observed that NOx concentrations were found to be within permissible limit (40 µg/m3) in 2016-17 across all the CAAQMS. The Nox levels showed a decreasing
trend at all locations. The NOx levels at Koparkhairne has decreased almost twice the
readings as compared to previous year 2015-16.Airoli lies on borderline recording 40 µg/m3
equal to standards.
Table No. 8: Yearly trend in concentration of NOX at AAQMS in Navi Mumbai
Year Koparkhairne
(µg/m3)
Airoli
(µg/m3)
Vashi
(µg/m3)
Turbhe
(µg/m3)
Annual Standard 40 40 40 40
2009-10 82.69 57
2010-11 66.56 45
2011-12 79.34 59.13 43
2012-13 80.34 77.69 56 22
2013-14 63.83 46.38 44 30
2014-15 42.53 27.25 Site shifting
under process
35
2015-16 57.40 42.35 33.30
2016-17 27.72 39.74 28.61
Source: Environmental Laboratory, NMMC
Figure No. 13: Yearly Trend in concentration of NOx at AAQMS in Navi Mumbai
Source: Environment Laboratory, NMMC
Trend of PM10 concentrations
Particulate matter, a complex mixture of extremely small particles and liquid droplets which
are made up of a number of components, including acids (such as nitrates and sulfates),
organic chemicals, metals, and soil or dust particles21. Particles that are 10 micrometers in diameter or smaller can pass through the throat and nose and enter the lungs and are
20 https://www3.epa.gov/ttncatc1/dir1/fnoxdoc.pdf 21 https://www3.epa.gov/pm/
0
20
40
60
80
100
Koparkhairne Airoli Vashi Turbhe
µg
/m3
Location
NOx
2009-10 2010-11 2011-12 2012-13 2013-14
2014-15 2015-16 2016-17 Standard

Environmental Status Report of Navi Mumbai Municipal Corporation-2016-17
33
commonly referred to as RSPM (Respirable Suspended Particulate Matter). Once inhaled,
these particles can affect the heart and lungs and cause serious health effects.
It is observed that from Table No. 9 and
Figure No. 14 that levels of PM10 exceeded the annual standard (60µg/m3) at Koparkhairne
and Turbhe. Airoli showed PM 10 levels within the standard. The levels of PM10 at Koparkhairne (99.44µg/m3) and Turbhe (97µg/m3) have decreased by 1.4 and 1.6 times
respectively as compared to last year. The concentrations of PM10 recorded at Airoli has
decreased from 78.43 µg/m3 (2015-16) to 55.81 µg/m3 (2016-17). The decrease in concentration levels of PM10 may be attributed to closure of quarries in Navi Mumbai region
in 2016-17.
Table No. 9: Yearly trend in concentration of PM10 at AAQMS in Navi Mumbai
Year Koparkhairne (µg/m3) Airoli (µg/m3)
Vashi (µg/m3) Turbhe (µg/m3)
Annual Standard 60 60 60 60
2009-10 154.26 96
2010-11 141.25 92
2011-12 162.37 141.53 111
2012-13 176.41 161.41 110 204.64
2013-14 135.53 74.60 108 151.2
2014-15 137.31 139.67 Site shifting under process
187.87
2015-16 138.62 78.43 154.95
2016-17 99.44 55.81 97.69
Source: Environmental Laboratory, NMMC
Figure No. 14: Yearly Trend in concentration of PM10 at AAQMS in Navi Mumbai
Source: Environment Laboratory, NMMC
Trends in PM2.5 concentrations
PM2.5 is particulate matter of 2.5 micrometers in diameter, which is smaller - 1/30th the
diameter of a human hair, which are emitted directly or formed secondarily in the atmosphere such as sulphates, nitrates and so on22.
From Table No. 10 and Figure No. 15 PM2.5 levels in Navi Mumbai has violated the standards
(40 µg/m3) at all regions except Airoli (24.03 µg/m3). The decreasing trend in PM2.5 levels is
22 https://www3.epa.gov/pm/designations/basicinfo.htm
0
50
100
150
200
250
Koparkhairne Airoli Vashi Turbhe
µg
/m3
Location
PM 10
2009-10 2010-11 2011-12 2012-13 2013-14
2014-15 2015-16 2016-17 Standard

Environmental Status Report of Navi Mumbai Municipal Corporation-2016-17
34
observed over last 5 years. The concentrations of PM2.5 at Turbhe shows 1.3 times (49.79
µg/m3) decrease in concentration as compared to previous year (61.62 µg/m3.). Similarly PM2.5 levels at Koparkhairne region have decreased from 61.62 µg/m3 (2015-16) to 40.92
µg/m3 (2016-17).
Table No. 10: Yearly trend in concentration of PM2.5 at AAQMS in Navi Mumbai
Year Koparkhairne
(µg/m3)
Airoli
(µg/m3)
Turbhe (µg/m3)
Annual Standard 40 40 40
2009-10 41.58
2010-11 39.38
2011-12 78.40 33.11
2012-13 74.89 50.46 71.16
2013-14 64.63 18.11 54.2
2014-15 63.98 42.82 71.57
2015-16 61.62 31.85 65.50
2016-17 40.92 24.03 49.79
Source: Environmental Laboratory, NMMC
Figure No. 15: Yearly Trend in concentration of PM2.5 at AAQMS in Navi Mumbai
Source: Environment Laboratory, NMMC
Inter Station Analysis
SO2
The interstation analysis for concentration of SO2 presented in Figure No. 16 and
Table No. 11 indicates that the annual SO2 concentrations at all the 3 stations are under the
annual standards (50µg/m3). Even the 98th percentile values for daily concentrations were well below the daily standards (80µg/m3) at all 3 stations. Even though all the annual
averages are well below the daily standards, the daily peak value at Turbhe is noted to be
80µg/m3 which is equal to annual standard.
0.0010.0020.0030.0040.0050.0060.0070.0080.0090.00
Koparkhairne Airoli Turbhe
µg
/m3
Location
PM 2.5
2009-10 2010-11 2011-12 2012-13 2013-14
2014-15 2015-16 2016-17 Standard

Environmental Status Report of Navi Mumbai Municipal Corporation-2016-17
35
Table No. 11: Concentration of SO2 across NMMC region (2016-17)
Row Labels Max of
SO2
98
Percentile
Average of
SO2
Min of
SO2
Daily
Standard
Annual
Standard
Airoli 43.03 41.54 25.50 7.8 80 50
Koparkhairne 68.24 58.26 28.84 0.46 80 50
Turbhe 80.60 73.12 36.24 0.8 80 50
Source: Environmental Laboratory, NMMC
Figure No. 16: Concentration of SO2 in NMMC region for the year 2016-17
Source: Environment Laboratory, NMMC
0.00
20.00
40.00
60.00
80.00
100.00
Airoli Koparkhairne Turbhe
µg/
m3
SO2
Max of SO2
98 Percentile
Average of SO2
Min
Daily Standard
Annual Standard

Environmental Status Report of Navi Mumbai Municipal Corporation-2016-17
36
NOx
The interstation analysis for concentration of NOx displayed in Table No. 12 and Figure No.
17 indicate that all 3 stations are within the annual standard (40µg/m3). Even though the concentrations are within annual standard, the NOx levels at Airoli lies on borderline (39.74
µg/m3) in 2016-17. Also the 98 percentile at Airoli violates the daily standard (80 µg/m3)
.The 98 percentile for Koparkahirne and Turbhe was recorded within the limit. Airoli station recorded the max of NOx 93.05 µg/m3 which is 1.15 times the daily standard followed by
Koparkhairne which recorded about 92.90 µg/m3.Turbhe was noted to be within the
permissible limit in terms of daily and annual standard for NOx levels.
Table No. 12: Concentration of NOX across NMMC region (2016-17)
Row Labels Max of
NOX
98
Percentile
Average of
NOX
Min Daily
Standard
Annual
Standard
Airoli 93.05 83.80 39.74 6.3 80 40
Koparkhairne 92.90 75.69 27.72 1.67 80 40
Turbhe 50.30 46.80 28.61 0.1 80 40
Source: Environment Laboratory, NMMC
Figure No. 17: Concentration of NOX in NMMC region for the year 2016-17
Source: Environment Laboratory, NMMC
0.00
20.00
40.00
60.00
80.00
100.00
Airoli Koparkhairne Turbhe
µg/
m3
NOx
Max of SO2
98 Percentile
Average of SO2
Min
Daily Standard
Annual Standard

Environmental Status Report of Navi Mumbai Municipal Corporation-2016-17
37
PM2.5
Table No. 13 and Figure No. 18 represents interstation analysis for concentration of PM2.5.The
analysis indicate that Turbhe (49.79 µg/m3) exceeds the annual standards of 40 µg/m3. Koparkhairane stations records 40.92 µg/m3 which slightly exceeds the annual limit. Airoli
was noted to be in range in terms of annual standard. However the 98 percentile exceeded
the daily standard 60 µg/m3 at all 3 locations. Turbhe recorded 129.61 µg/m3 which is almost double than the daily standard followed by 100.63 µg/m3 at Koparkhairne. Airoli
recorded 69.42 µg/m3 slightly higher than daily standard.. This indicates rise in PM2.5
pollution due to traffic congestion within Navi Mumbai city.
Table No. 13: Concentration of PM2.5 across NMMC region (2015-16)
Row Labels Max of
PM 2.5
98
Percentile Avg of PM 2.5 Min
Daily
Standard
Annual
Standard
Airoli 80.86 69.42 24.03 0.01 60 40
Koparkhairne 114.00 100.63 40.92 1.78 60 40
Turbhe 148.11 129.61 49.79 0.07 60 40
Source: Environment Laboratory, NMMC
Figure No. 18: Concentration of PM2.5 in NMMC region for the year 2016-17
Source: Environment Laboratory, NMMC
0.00
20.00
40.00
60.00
80.00
100.00
120.00
140.00
160.00
180.00
Airoli Koparkhairne Turbhe
µg/
m3
PM2.5
Max of SO2
98 Percentile
Average of SO2
Min
Daily Standard
Annual Standard

Environmental Status Report of Navi Mumbai Municipal Corporation-2016-17
38
PM10
Table No. 14 and Figure No. 19 represents the interstation analysis for concentration of PM10
in Navi Mumbai region. The annual average of PM10 exceeds the annual standard limit (60 µg/m3) at all locations except at Airoli (55.81 µg/m3). The concentration of PM10 was found
to be highest at Koparkhairane (99.44 µg/m3) followed by Turbhe (97.69µg/m3). The
98percentile readings also exceeded the daily standards (100µg/m3) for all the stations except Airoli (96.58µg/m3). Koparkhairane stations recorded the 98th percentile value almost
double (209.80µg/m3) the daily standard, followed by Turbhe which recorded daily
maximum PM10 concentrations of 198.16 µg/m3.
All the daily peak values for PM10 were also highly exceeding the daily standards indicating
serious threat of PM10 pollution. The maximum reading was noted at Airoli (257.25 µg/m3)
and Koparkhairne (257.25 µg/m3) which exceeded about 2.5 times the standard value followed by Turbhe (228.55 µg/m3) 2.3 times the daily standard.
Table No. 14: Concentration of PM10 across NMMC region (2016-17)
Row Labels Max of
PM 10
98
percentile Avg of PM 10 Min
Daily
Standard
Annual
Standard
Airoli 257.25 96.58 55.81 1 100 60
Koparkhairne 257.25 209.80 99.44 11 100 60
Turbhe 228.55 198.16 97.69 8.8 100 60
Source: Environmental Laboratory, NMMC
Figure No. 19: Concentration of PM10 in NMMC region for the year 2016-17
Source: Environment Laboratory, NMMC
0.00
30.00
60.00
90.00
120.00
150.00
180.00
210.00
240.00
270.00
300.00
Airoli Koparkhairne Turbhe
µg/
m3
PM10
Max of SO2
98 Percentile
Average of SO2
Min
Daily Standard
Annual Standard

Environmental Status Report of Navi Mumbai Municipal Corporation-2016-17
39
Carbon monoxide
It can be observed from Figure No. 20 that Airoli and Koparkhairne violated the 8 hourly
standards (2mg/m3) of CO in certain months. The CO levels at Turbhe were seen within the standard limit. A seasonal pattern can be observed in the concentration of CO as recorded
by all stations. The maximum 8 hourly CO concentration was recorded at Koparkhairne
AAQMS followed by Airoli. Koparkhairne station has recorded the highest readings (5.1 mg/m3 and 3.4 mg/m3) exceeding 2.5 times the standards in month of January. Airoli
recorded highest reading in month of November (3.18 mg/m3) which exceeds the standard.
Turbhe recorded the CO levels in range of 0.2 mg/m3 to 2.0 mg/m3 throughout the year.
Figure No. 20: Concentration of CO in NMMC region for the year 2016-17
Source: Environment Laboratory, NMMC
Ozone
Navi Mumbai is non-polluted for ozone pollution as recorded by the station at Koparkhairane. It is clearly observed from Figure No. 21 that the ozone concentrations are
well below the standards (100 µg/m3) for all the months. Slight increase in the winter season
(December to March) is observed in the concentrations of Ozone. The highest concentration of Ozone is observed in Month of February (60.55 µg/m3).
Methane
The concentration of Methane recorded at 3 AAQMS namely Airoli, Koparkhairane and
Turbhe are presented below in Figure No. 22 .Turbhe has recorded highest methane concentration due to presence of landfill site as compared to Koparkhairane and Airoli.The
average 8 hourly reading at Turbhe are recorded between 9- 10 ppm. The daily maximum
value for Turbhe is recorded as 89 ppm.
0
1
2
3
4
5
6
mg/
m3
CO
Airoli Koparkhairne Turbhe CPCB Standard

Environmental Status Report of Navi Mumbai Municipal Corporation-2016-17
40
Figure No. 21: Concentration of Ozone in NMMC region for the year 2016-17
Source: Environment Laboratory, NMMC
Figure No. 22: Concentration of Methane in NMMC region for the year 2016-17
Source: Environment Laboratory, NMMC
0
15
30
45
60
75
90
0-8 16-24 8-16 0-8 16-24 8-16 0-8 16-24 8-16
Airoli Koparkhairne Turbhe
ppm
Methane
Max of Methane
Average of Methane
Min of Methane
0
20
40
60
80
100
120
µg
/m3
Ozone
Koparkhairne CPCB Standard

Environmental Status Report of Navi Mumbai Municipal Corporation-2016-17
41
Air Quality Index
Air Quality Index (AQI) is the most convenient way to convey the information on outdoor air quality which could be easily understood by general public. AQI transforms complex air
quality data of various pollutants into a single index value. Most of the AQI developed by
various agencies are within a range of 0 to 500 and is categorized into Good, Satisfactory, Moderate, Poor, Very Poor or Severe based on the concentrations of various pollutants and
their health impacts at various concentrations. Higher value of AQI indicates high level of
pollution. The AQI for Navi Mumbai is based on calculation of AQI developed by CPCB23.
From Figure No. 23, it is observed that Navi Mumbai is clean for NOx, SO2, CO and Ozone
pollutants as all the observations are either in Good or Satisfactory category. Only 5-10% of
observations were recorded under Moderate category. The regions of Turbhe and Koparkhairne were observed to be polluted under Moderate to Very poor category for
particulate matter. 15% of observations were seen under Poor category followed by 3%
under Severe category for PM2.5 (RSPM) more than 50% observation were noted under Moderate category for PM10 (SPM). Airoli region was clean for all parameters throughout
the year.
Figure No. 23: Occurrence of AQI classes for air pollutants in NMMC (2016-17)
Source: Environment Laboratory, NMMC
*Note: Ozone was not monitored at Airoli and Turbhe in 2016-17
23 CPCB 2014, National Air Quality Index, Central Pollution Control Board, Ministry of Environment & Climate Change, Government of India
0%
10%
20%
30%
40%
50%
60%
70%
80%
90%
100%
Airo
li (3
54)
Kop
arkh
airn
e (
362)
Tu
rbh
e (3
65)
Airo
li (3
54)
Kop
arkh
airn
e (
362)
Tu
rbh
e (3
65)
Airo
li (3
54)
Kop
arkh
airn
e (
362)
Tu
rbh
e (3
65)
Airo
li (3
54)
Kop
arkh
airn
e (
362)
Tu
rbh
e (3
65)
Airo
li (3
54)
Kop
arkh
airn
e (
362)
Tu
rbh
e (3
65)
Airo
li* (
354)
Kop
arkh
airn
e (
362)
Tu
rbh
e* (
365
)
PM 10 PM 2.5 SO2 Nox CO O3
Occurence of different AQI classes for different air pollutants in Navi Mumbai (2016-17)
Good Satisfactory Moderate Poor Very Poor No data
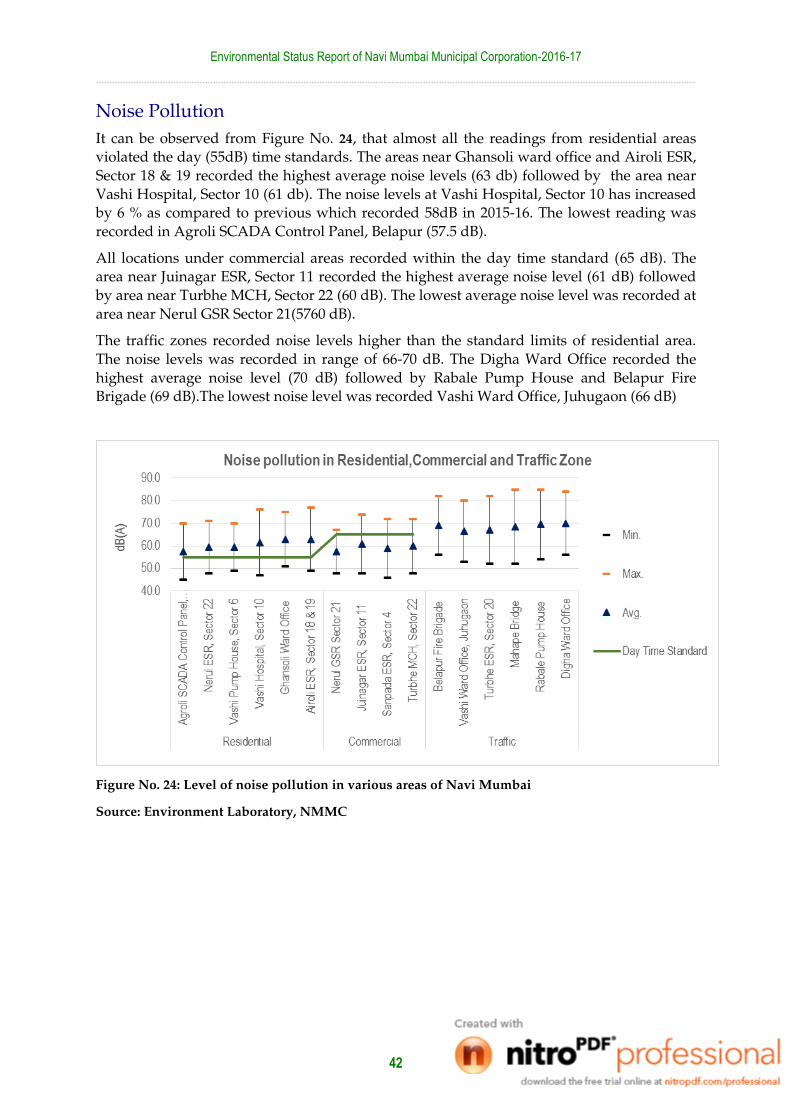
Environmental Status Report of Navi Mumbai Municipal Corporation-2016-17
42
Noise Pollution
It can be observed from Figure No. 24, that almost all the readings from residential areas violated the day (55dB) time standards. The areas near Ghansoli ward office and Airoli ESR,
Sector 18 & 19 recorded the highest average noise levels (63 db) followed by the area near
Vashi Hospital, Sector 10 (61 db). The noise levels at Vashi Hospital, Sector 10 has increased by 6 % as compared to previous which recorded 58dB in 2015-16. The lowest reading was
recorded in Agroli SCADA Control Panel, Belapur (57.5 dB).
All locations under commercial areas recorded within the day time standard (65 dB). The area near Juinagar ESR, Sector 11 recorded the highest average noise level (61 dB) followed
by area near Turbhe MCH, Sector 22 (60 dB). The lowest average noise level was recorded at
area near Nerul GSR Sector 21(5760 dB).
The traffic zones recorded noise levels higher than the standard limits of residential area.
The noise levels was recorded in range of 66-70 dB. The Digha Ward Office recorded the
highest average noise level (70 dB) followed by Rabale Pump House and Belapur Fire Brigade (69 dB).The lowest noise level was recorded Vashi Ward Office, Juhugaon (66 dB)
Figure No. 24: Level of noise pollution in various areas of Navi Mumbai
Source: Environment Laboratory, NMMC

Environmental Status Report of Navi Mumbai Municipal Corporation-2016-17
43
Figure No. 25: Level of noise pollution in silent areas NMMC area
Source: Environment Laboratory, NMMC
Figure No. 25 represents the silence zones in NMMC area. In the year 2016-17, all stations in
silence zones under NMMC exceeded the average day standard limits of 50dB. R.F.Naik
Vidyalaya, Sector 7, Koparkhairne recorded the highest average daily noise levels of 65dB.followed by Mathadi Hospital, Sector 5, Koparkhairne with average noise level of 64
dB. The lowest average noise level (55 dB.) was recorded at Gyanpushpa Vidyamandir,
Sector 4, CBD Belapur.

Environmental Status Report of Navi Mumbai Municipal Corporation-2016-17
44
Pressures
Vehicular Growth
As depicted in Figure No. 26 there has been a steady increase in number of registered
vehicles. The overall vehicle population on road has increased by 41,387 (11%) as compared to previous year. The major growth (16%) is observed in number of Taxi/Auto rickshaws in
the year 2016-17 .Decrease in number of Buses/Carriages (39%) 2 wheelers (7%) and 4
wheelers (3%) is noted in the current year 2016-17. The major decline in number of heavy vehicles is observed by 43% followed by number of buses (39%) as compared to previous
year. The total number of vehicles registered in Navi Mumbai (Category wise) are presented
in Annex –III
Figure No. 26: Estimated number of Motor Vehicles on Road in Vashi RTO
Source: RTO Publication 2016-17
202252
231449
257831270975
298461
336262
384551
425938
0
50000
100000
150000
200000
250000
300000
350000
400000
450000
09-10 10-11 11-12 12-13 13-14 14-15 15-16 16-17
Estimated number of Motor Vehicles on Road in Vashi RTO

Environmental Status Report of Navi Mumbai Municipal Corporation-2016-17
45
Figure No. 27: Decadal trend in annual vehicle registrations in Navi Mumbai
Source: RTO Publication 2016-17
Fuel consumption
Figure No. 28 represents the trend of fuel consumption within Navi Mumbai city. Motor
Spirits (MS) commonly known as petrol, HSD are the commonly used fuels within the city
.Due presence of TTC industrial belt within NMMC limits, there is huge demand for petroleum products like Furnace oil and HSD in industries too.
In 2016-17 the total petroleum sale within Navi Mumbai is noted to be around 78 thousand
Kiloliters (KL).The sale in Navi Mumbai has grown by 37% as compared to previous year 2015-16. With only a slight dip in the year 2014-15, there has been an increasing trend in
consumption of fuels in Navi Mumbai. In the year, the sale of HSD has increased by 57%,
followed by MS and Furnace oil by 17% as compared to previous year. The decrease in LDO (Figure No. 29 ) is seen by 63% as compared to last year.
0
5000
10000
15000
20000
25000
30000
35000
40000
45000
50000
05-06 06-07 07-08 08-09 09-10 10-11 11-12 12-13 13-14 14-15 15- 16 16-17
Trend of registered vehicles at Navi Mumbai
2 wheelers 4 wheelers Taxi/ Autorikshaw Buses/ Carriages Other heavy vehicles

Environmental Status Report of Navi Mumbai Municipal Corporation-2016-17
46
Figure No. 28: Trend in sale of Petrol, Diesel and Furnace Oil in NMMC area by HPCL
Source: HPCL
Figure No. 29 : Trend in sale of LDO in NMMC area in NMMC area by HPCL
Source: HPCL
481
627
426
158
0
100
200
300
400
500
600
700
2013-14 2014-15 2015-16 2016-17
Kilo
liter
Trend in sale of LDO in NMMC area by HPCL
2013-14 2014-15 2015-16 2016-17
Furnace Oil 1998 1993 3210 3758
HSD 29871 23988 29011 45446
Motor Spirit 20889 20934 25135 29411
0
10000
20000
30000
40000
50000
60000
70000
80000
90000
Kil
oli
ter
Trend in sale of Petrol ,Diesel and Furnace Oil in NMMC area by HPCL

Environmental Status Report of Navi Mumbai Municipal Corporation-2016-17
47
Impact
Diseases caused by air pollution
Due to long term exposure to air pollution, cases of respiratory disorders like Asthma,
COPD (Chronic Obstructive Pulmonary Disorder) such as chronic bronchitis and
emphysema and lung cancer are increasing day by day due to air pollution. As per the
Global Burden of Disease (GBD) that about 4.2 million deaths due to exposure of PM 2.5.
About 17.1% of deaths are occurred from ischemic heart disease, 14.2% from stroke, 16.5%
from lung cancer, 24.7% from LRIs, and 27.1% from Chronic Obstructive Pulmonary Disease
(COPD) due to long exposure of Particulate Matter. Exposure to ambient ozone has also
resulted in 254,000 deaths globally24.As per WHO, India has about 15-20 million population
suffering from asthma out of which 10% to 15% are noted in 5-11 year old children25.
Hence monitoring of these diseases is an important to monitor the health status of the city.
However data regarding the above mentioned diseases in unavailable. Thus it is
recommended that NMMC could coordinate and maintain data for patients suffering from
these disorders through a joint effort between the private and public hospitals.
Response and Initiatives
Measures taken by NMMC and MPCB to improve air quality within Navi Mumbai city are highlighted below:
Initiatives by NMMC
NMMC has successfully completed the concretisation of the MIDC road has largely helped to reduce the issue of traffic congestion. The completion of work of Sion-
Panvel highway has resulted in diverting a large amount of traffic from entering the
city. Use of Sweeping machines for vacuum suction of dust/fine particles at Palm Beach
road, Thane-Belapur and other major roads to reduce air pollutants.
NMMC has installed timers at traffic signals which helps reduce idling period Number of quarries are closed which has resulted in decline of particulate matter
within the Navi Mumbai municipal limits
Online Display of Air quality index in public is installed by NMMC at four locations - Airoli (Fire Station), Turbhe (landfill Site), Koparkhairne (Teen Taki signal) & Nerul
(Wonders park - managed by IITM).
As response to MHA-USAID-UNIDO Partnership project on Developing Resilient Cities through Risk Reduction in context of Disaster and Climate change (2016-2020),
Navi Mumbai in collaboration with IITM (SAFAR), Pune is implementing a pilot
project on Strengthening early warning system for monitoring and disseminating air quality parameters and weather forecasts for stakeholders. This is first kind of
initiative done by Government of India across the nation.
As per the meeting held on 30th June 2017, the highlights of SAFAR project are listed below:
24 State of Global Air/2017, Institute for Health Metrics and Evaluation’s Global Burden of Disease Project and the Health Effects Institute 25 http://www.who.int/mediacentre/factsheets/fs206/en/
Environmental Status Report of Navi Mumbai Municipal Corporation-2016-17
48
1. As per the project total 5-6 AAQMS are required to install in Navi Mumbai ,but in
order to reduce the expenditure incurred in procuring Air Quality Monitoring Instruments existing 4 AAQMS are integrated into the SAFAR Project
2. New AQMS shall be installed in Belapur and two industrial areas.
3. At least one station for monitoring mercury shall be installed in Mahape, since it's an industrial belt.
4. Existing LED display boards over Railway Stations, NMMT Bus stands, for
informing public about health status of the environment.
Initiatives by MPCB
Monitoring infrastructure
Three AAQMS (Nerul, Rabale, Mahape) have been established by MPCB under NAMP
(National Air Quality Monitoring Program). Installation of CAAQM station at Mahape is
proposed by MPCB. Inventory of Hazardous air Pollutant emitting units along with LDAR (Leak detection &
repair) system is maintained by MPCB. Total 16 industries identified as a Hazardous Air
Pollutant emitting units out of which 10 industries have installed LDAR. MPCB has installed additional manual Ambient air monitoring station at MIDC Mahape
for monitoring 12 parameters (Sulphur Dioxide, Nitrogen Dioxide, Particulate matter
(PM10), Particulate Matter (PM2.5), Ozone, Lead, Carbon Monoxide, Ammonia, Benzene, Benzo(a)Pyrene(BaP), Arsenic and Nickel).
All the bulk drug units in TTC MIDC have been directed to install VOC analyzer with
alarm system by MPCB. Source emission monitoring from industries in CEPI (Comprehensive Environmental
Pollution Index) Area is carried out by MPCB.
Air pollution control measures
Stone quarries and crushing units were identified as one of main source for particulate
matter as per a survey study was carried out by NEERI & IIT under MPCB26. Post the
survey action against 24 defaulting units, was taken out of which 19 stone crushers units have taken steps towards improvement of air pollution control system by installing dust
suppression system, water sprinkling arrangement & metal road. All stone crusher units
have installed water sprinkling system & cover the trucks during transportation of raw
& finished material as recommended by MPCB.
Around 69 industries in TTC industrial area have changed their fuel pattern to PNG
(Piped Natural Gas) as fuel supplied by MGL (Mahanagar Gas Limited) and 22 more industries have already submitted their application for PNG connection.
Proposal for installation of new CNG station is in consideration by the Mahanagar Gas
in TTC MIDC Area to help promote usage of CNG fired vehicles Synchronize traffic line strategy for phase out old vehicles by RTO is recommended by
MPCB.
26 http://cpcb.nic.in/Progress_Report_Navi_Mumbai_Nov_2016.pdf

Environmental Status Report of Navi Mumbai Municipal Corporation-2016-17
49
Water Resources
Earth is termed as ‘Blue Planet’ because 71% of the earth’s surface if covered with water. The
earth has an abundance of water yet majority of water (97.5%) is saline water. Out of
remaining 2.5% of fresh water, around two thirds if it is in frozen form in ice caps and glaciers. Only about 0.3% of freshwater is available for human use majority of which comes
from rivers27. Water is one of the vital renewable resources on earth. Lakes, rivers, streams
groundwater are important fresh water sources. The majority of freshwater is actually found underground as soil moisture and in aquifers. Water is required for our daily activities like
drinking, cleaning, cooking and all industries require water for their operations. There are
hydropower plants which utilizes water for electricity generation. Water is having multiple benefits but due to ever increasing population and urbanization, pressure is increasing on
this vital resource and problems like water shortage and water quality deterioration is
arising. Hence, we must put more attention on saving and managing this source.
Status of Water Resources
Water resources in terms of surface and groundwater are available within NMMC region.
The surface water resources include ponds, creeks, lakes, dams and reservoirs whereas groundwater resource includes wells and bore wells. The population of Navi Mumbai
depends on these water resources for daily water supply and other activities. Realising this
fact, NMMC regularly monitors the water resources in order to check and record the quality of water.
Surface Water
Dam (Reservoir)
NMMC area has 3 dams namely Hetawane, Barvi and Morbe in its viscinity. The NMMC
gets its daily supply of water from Morbe dam, a earthern dam, on the Dhavri river
(tributary of Patalganga river) near Khalapur, Raigad district. The height of the dam above lowest foundation is 194 ft. while the length is 11,220 ft. It covers the surface area of about
9,780 sq km. It was constructed by MJP (Maharashtra Jeevan Pradhikaran), Government of
Maharashtra in 1999, who then granted possession of Morbe dam to NMMC in November 2002. The silent features of Morbe dam is presented in Table No. 15.
Table No. 15: Speciation of Morbe Dam
Specifications Attributes
Name of the dam Morbe
Distance from city (NMMC Jurisdiction) 31 km
Type of dam Gravity
Impounds Dhavari river
Height 53.40 m
Length 3,250 m
Dam volume 18,075 x 103 m3
Total capacity 19,089 x 104 m3
Surface area 978 hectares
Source: Central Water Commission28
27 http://www.ngwa.org/Fundamentals/teachers/Pages/information-on-earth-water.aspx 28 http://www.cwc.nic.in/main/downloads/National%20Register%20of%20Large%20Dams%202009.pdf

Environmental Status Report of Navi Mumbai Municipal Corporation-2016-17
50
NMMC daily monitors the water quality of the raw as well as treated water before it is
supplied to the city. The raw water is initially pumped from the dam to the water treatment plant situated at Bhokarpada. 0.2mg/l chlorine is used as a disinfectant and added at source
as well as at water treatment plant. NMMC, thus elaborates water quality checking and
monitoring system at Morbe dam. The Table No. 16 below represents the average water quality of raw and treated water supplied by NMMC as per BIS standards.
Table No. 16: Average water quality of raw and treated water before supply
Sr.
No Test Parameters Units
Raw Water
(Bhokarpada)
Pure
Water
(W.T.P)
BIS Specifications
10500:2012
Normal Values
Desirable
Limits
Permissible
Limits
1 Physical Appearance Clear Clear
2 Odour Odourless Odourless Agreeable Agreeable
3 Turbidity N.T.U 2.4 0.5 1 5
4 pH Value 7.1 7.2 6.5 to 8.5 No relaxation
5 Free Residual Chlorine mg/l nil 0.8 0.2 1.0
Source: District Public Health Laboratory, Konkan Bhavan, Belapur, Navi Mumbai
Lakes and ponds
Lakes and ponds are of importance because of their extent of utilization. These can be used
as a popular recreational spot or even as a source of fresh water. Lakes and ponds not only
support biodiversity but also helps regulate the processes of soil formation, groundwater recharge and flood protection. Within NMMC, there are total 24 lakes with varying
capacities and account to a total coverage area of 2.23 Lakh sq.m. The Belapur node has 5
lakes, maximum number amongst all nodes, and accounts around 28% of the lake area share in NMMC jurisdiction. This is followed by Ghansoli node with 25% of share area and has 4
lakes within the node. The Gothivali Lake in Ghansoli is the biggest lake and has a surface
area of 32,635 sq. m. The Mahape Lake in Koparkhairne node is smallest lake with area of 1,338 sq. m. Node wise details of the lakes with coverage area are described in the Table No.
17 below. Most of the lakes are observed to be surrounded by residential areas and have
Gabion wall structures.

Environmental Status Report of Navi Mumbai Municipal Corporation-2016-17
51
Table No. 17: Node wise details of lakes and their coverage in NMMC area
Source: Environmental Laboratory, NMMC
NMMC monitors the water quality of lakes at frequent intervals (Table No. 18 and Table No.
19). On analysing the samples it is observed that the pH levels for all the lakes are well within the limits. The concentrations of suspended solids at Vashigaon Lake (315mg/l) was
found almost triple than the permissible limit (100 mg/l) while Shirvane lake (111mg/l) and
Savalogaon lake (112mg/l) also recorded suspended solids concentrations higher than the
permissible limit. The dissolved oxygen (DO) level was found to be slightly high (7.2 mg/l)
in Diva Lake, Talvali Lake (7.2mg/l), Sanpada (7.5mg/l) and Koparkhairne (7.7mg/l)
compared to the limits (4 - 7mg/l). Vashigaon (1198.97mg/l) showed higher Sulphate amount than the permissible limit (<1000mg/l). Total Dissolved Solids (TDS) level was
found to be within the permissible limit in all lakes and none of the lakes exceeded the
standard for B.O.D, C.O.D, Nitrate, Nitrite, Phosphate, Chloride, and Hardness. These tests indicates that the overall quality of the lakes are good in Navi Mumbai.
Node Name of Lake/Pond Riparian zone Surrounding area Area of
lake (Sq m)
Airoli Airoli Naka Concrete wall Residential 3,988
Diva Gabion wall Residential 2,042
Belapur
Agroli Gabion wall Trees and Garden 12,693
Belapur Concrete wall Residential and a temple 17,905
Darave Gabion wall Residential 5,724
Karave Concrete wall Residential 23,506
Killegaonthan Gabion wall Residential 2,650
Digha Borol 1,500
Khokad Gabion wall Residential and Highway 17,842
Ghansoli
Gothivali Gabion wall Residential and Informal hutments 32,635
Gumali Concrete wall Residential 3,596
Rabada Gabion wall Residential and Highway 7,823
Talvali Gabion wall Residential 11,590
Koparkhairne
Khairne Concrete wall Residential 13,870
Koparkhairne Concrete wall Residential 2,231
Mahape Concrete wall MIDC area 1,338
Savaligaon - Slums 6,060
Nerul Nerul Sector 20 Gabion wall Residential 9,894
Shirvane Gabion wall Residential 13,686
Turbhe Sanpada Natural Residential 2,500
Turbhegaon Gabion wall Residential 8,482
Vashi
Juhugaon Concrete wall Dense residential area on all four sides
1,486
Kopari Gabion wall Trees and Garden 10,000
Vashigaon Gabion wall Residential 10,620
Total
2,23,661
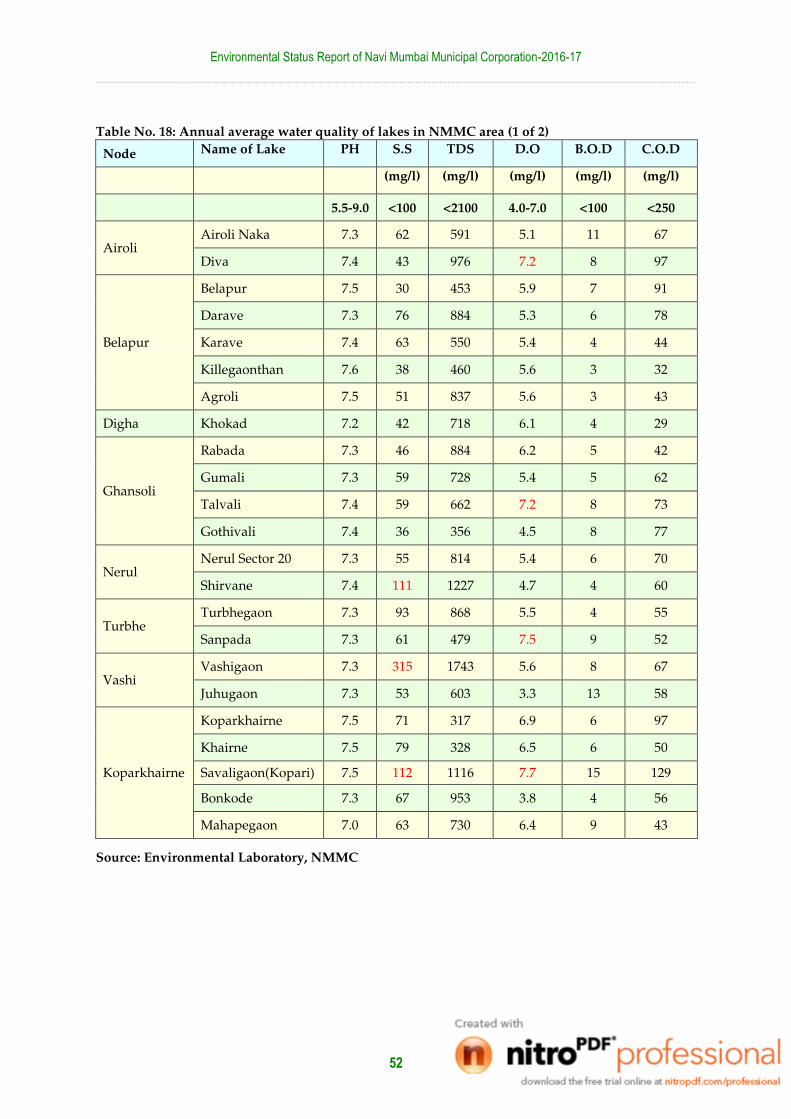
Environmental Status Report of Navi Mumbai Municipal Corporation-2016-17
52
Table No. 18: Annual average water quality of lakes in NMMC area (1 of 2)
Node Name of Lake PH S.S TDS D.O B.O.D C.O.D
(mg/l) (mg/l) (mg/l) (mg/l) (mg/l)
5.5-9.0 <100 <2100 4.0-7.0 <100 <250
Airoli Airoli Naka 7.3 62 591 5.1 11 67
Diva 7.4 43 976 7.2 8 97
Belapur
Belapur 7.5 30 453 5.9 7 91
Darave 7.3 76 884 5.3 6 78
Karave 7.4 63 550 5.4 4 44
Killegaonthan 7.6 38 460 5.6 3 32
Agroli 7.5 51 837 5.6 3 43
Digha Khokad 7.2 42 718 6.1 4 29
Ghansoli
Rabada 7.3 46 884 6.2 5 42
Gumali 7.3 59 728 5.4 5 62
Talvali 7.4 59 662 7.2 8 73
Gothivali 7.4 36 356 4.5 8 77
Nerul Nerul Sector 20 7.3 55 814 5.4 6 70
Shirvane 7.4 111 1227 4.7 4 60
Turbhe Turbhegaon 7.3 93 868 5.5 4 55
Sanpada 7.3 61 479 7.5 9 52
Vashi Vashigaon 7.3 315 1743 5.6 8 67
Juhugaon 7.3 53 603 3.3 13 58
Koparkhairne
Koparkhairne 7.5 71 317 6.9 6 97
Khairne 7.5 79 328 6.5 6 50
Savaligaon(Kopari) 7.5 112 1116 7.7 15 129
Bonkode 7.3 67 953 3.8 4 56
Mahapegaon 7.0 63 730 6.4 9 43
Source: Environmental Laboratory, NMMC

Environmental Status Report of Navi Mumbai Municipal Corporation-2016-17
53
Table No. 19: Annual average water quality of lakes in NMMC area (2 of the 2)
Node Name of Lake Nitrate Nitrite Phosphate Chloride Hardness Sulphate
(mg/l) (mg/l) (mg/l) (mg/l) (mg/l) (mg/l)
<45 <5 <1000 - <1000
Airoli Airoli Naka 3.127 3.450 0.414 54.93 380 227.24
Diva 4.305 0.251 0.390 102.18 285 223.05
Belapur
Belapur 1.736 1.101 0.302 70.28 188 175.43
Darave 3.006 1.740 0.335 72.74 445 441.28
Karave 2.250 0.248 0.250 68.74 188 271.14
Killegaonthan 1.222 0.024 0.437 40.38 155 109.19
Agroli 2.764 0.546 0.209 35.53 343 407.19
Digha Khokad 2.273 0.303 0.318 59.25 288 348.82
Ghansoli
Rabada 5.083 0.122 0.341 112.68 308 344.19
Gumali 0.690 1.021 0.326 71.18 280 244.90
Talvali 2.997 0.590 0.386 90.82 236 203.87
Gothivali 1.864 0.322 0.595 59.26 153 131.90
Nerul Nerul Sector 20 2.872 0.030 0.292 51.71 414 344.90
Shirvane 2.691 2.510 0.268 87.33 733 485.48
Turbhe Turbhegaon 3.233 1.857 0.246 37.95 496 429.45
Sanpada 2.900 1.269 0.218 33.98 210 357.43
Vashi Vashigaon 2.665 0.079 0.162 43.66 816 1198.97
Juhugaon 1.097 2.069 0.866 66.23 190 182.19
Koparkhairne
Koparkhairne 1.875 0.147 0.291 46.87 130 85.19
Khairne 1.796 1.565 0.218 72.72 188 86.33
Savaligaon(Kopari)
3.123 0.032 0.344 174.35 475 389.32
Bonkode 3.436 4.666 0.170 53.81 350 235.81
Mahapegaon 3.356 1.664 0.171 110.28 308 265.32
Source: Environmental Laboratory, NMMC

Environmental Status Report of Navi Mumbai Municipal Corporation-2016-17
54
Creek
NMMC monitors creek water and has setup monitoring stations at 6 different locations (Map No. 3). The annual average water quality of creek in NMMC area is tabulated below in
Table No. 20. From the annual average values for the water quality tests, it is found that the
creek water from all 6 locations has very high levels of chlorides. All the readings from creek water samples have violated the limits for chloride (<600 mg/l) by more than 12 times. This
has led to reduction in oxygen levels in the creek ecosystem which is clearly reflected from
the low DO (Dissolved Oxygen) levels in the water samples at Nerul Palm beach road (0.4 mg/l), Sanpada (3.4 mg/l) and Koparkhairne (1.4 mg/l). Except Nerul Palm beach road
location, all other locations shows BOD more than the permissible limit. Creek near
Koparkhairne shows the highest reading for BOD (181 mg/l) than the permissible limit (<100 mg/l). Thus the creek water is in a polluted state in Navi Mumbai.
Ground Water
Due to well-planned and established chain of water supply, the dependence of the NMMC region on ground water table for its daily activities is low compared to other regions.
NMMC performs regular analysis and monitors the quantity of various parameters like pH,
DO, BOD, residual chlorine, hardness, sulphate and faecal coliform. In the year 2016-17, NMMC conducted water quality test for around 22 wells in NMMC area (Table No. 21). All
the parameters were detected to be within limits but the samples revealed presence of E-coli
and faecal coliform in all the water samples. Water quality was also identified for the borewell present at the Landfill site at Turbhe (Table No. 17). It readings indicate all the
parameters are well between the limits but detects the presence of coliform.
Table No. 20: Annual average water quality of creek water samples in NMMC area
Location
Parameters
pH SS DO BOD TKN Nitrate Phosphate Chloride
(mg/l) (mg/l) (mg/l) (mg/l) (mg/l) (mg/l) (mg/l)
Limits 5.5-9.0 <100 4.0-7.0 <100 <5
<45 <600
Belapur 7.0 552 4.3 107 15.978 3.051 2.497 7732.92
Near Nerul Palm Beach Road
7.0 716 0.4 94 16.521 3.142 1.672 7392.34
Near Vashi Bridge 6.7 1230 5.2 154 10.163 3.555 0.252 16524.05
Sanpada 6.8 1032 3.4 166 13.804 3.038 0.179 15076.60
Koparkhairne 7.0 517 1.4 181 9.828 3.647 1.407 7712.93
Near Airoli Bridge 6.8 802 4.5 107 11.012 4.765 2.271 10902.47
Source: Environmental Laboratory, NMMC

Environmental Status Report of Navi Mumbai Municipal Corporation-2016-17
55
Map No. 3: Water Quality Monitoring Stations along creeks in NMMC area
Source: Environment Laboratory, NMMC

Environmental Status Report of Navi Mumbai Municipal Corporation-2016-17
56
Table No. 21: Well water quality recorded in NMMC area in 2016-17
Source: Environmental Laboratory, NMMC
Sr. No
.
Location PARAMETERS
p
H
Tur
bidi
ty
Resi
dual
Chlorine
DO BO
D
CO
D
Chlo
ride
Hard
ness
Sulp
hate
MPN
Count
/100 ml
E.C
oli
F.C
oli
NT
U
(mg/
l)
(mg
/l)
(mg
/l)
(mg
/l)
(mg/
l)
(mg/l
)
(mg/
l)
1 Agroligaon, Sector 29 7.3 0.00 Nil 4.5 25 61 38.92 450 380.90
23 +ve
+ve
2 Shahabazgaon, Sector 19
7.2 0.00 Nil 2.2 5 20 58.39 220 116.76
23 +ve
+ve
3 Shiravane, Sector 1, Nerul
7.5 0.00 Nil 3.5 5 20 25.95 80 48.95 23 +ve
+ve
4 Sarsole, Sector 6, Nerul 7.0 7.70 Nil 2.4 19 40 51.90 270 67.80 23 +ve
+ve
5 Karavegaon, Near Lake, Nerul
7.3 0.00 Nil 2.4 11 51 64.87 120 62.47 23 +ve
+ve
6 Daravegaon, Sector 23, Nerul
7.3 0.00 Nil 3.5 6.0 20 51.90 200 80.38 23 +ve
+ve
7 Turbhegaon, Sector 21 6.7 0.00 Nil 4.7 28 71 194.62
750 476.19
23 +ve
+ve
8 Ganpatipada, Turbhe 7.2 0.00 Nil 3.2 24 40 71.36 200 37.90 23 +ve
+ve
9 Tin Taki, Sector 18,Koparkhairne
7.3 0.00 Nil 2.4 8 20 32.44 120 23.42 23 +ve
+ve
10 Infront of P.C.Patil's House, Sector 19, Koparkhairne
7.3 0.00 Nil 1.6 29 81 45.41 100 32.57 23 +ve
+ve
11 Near Keshav Uncle's House, Sector 19, Koparkhairne
7.1 0.00 Nil 3.7 15 30 64.87 250 84.95 23 +ve
+ve
12 Anant Patil, Chinchali, Ghansoli
7.0 0.00 Nil 3.1 13 30 110.28
430 158.85
23 +ve
+ve
13 Old Video Center. Talvalinaka, Ghansoli
7.1 0.00 Nil 4.6 16 51 77.85 80 57.33 23 +ve
+ve
14 Rabadagaon behind GSR/ESR, Rabada
7.2 0.00 Nil 2.5 15 51 45.41 80 36.76 23 +ve
+ve
15 Near Vitthal Mandir, Divagaon, Airoli
7.3 0.00 Nil 3.4 35 71 32.44 50 38.09 23 +ve
+ve
16 Vitbhatti, Airoligaon, Airoli
7.0 0.00 Nil 5.6 12 40 97.31 310 171.61
23 +ve
+ve
17 Near Hanuman Mandir, Chinchpada, Airoli
7.1 0.00 Nil 5.5 14 30 77.85 230 18.85 23 +ve
+ve
18 Ilathanpada, Digha 7.2 0.00 Nil 3.7 7.0 20 64.87 220 44.57 23 +ve
+ve
19 Subhashnagar, Digha 7.2 0.00 Nil 4.0 14 51 110.28
360 64.76 23 +ve
+ve
20 Sanjay Gandhi Nagar, Digha
7.2 19.40
Nil 5.2 14 30 77.85 260 62.23 23 +ve
+ve
21 Juhugaon, Sector 11, Vashi
7.0 37.90
Nil 1.4 20 40 77.85 260 82.09 23 +ve
+ve
22 Vashigaon, Sector 6, Vashi
6.7 51.10
Nil 1.5 15 51 38.92 790 176.76
23 +ve
+ve

Environmental Status Report of Navi Mumbai Municipal Corporation-2016-17
57
Table No. 22: Water Quality of Turbhe bore well
Locat
ion
of
Well
(Tur
bhe)
pH Turb
idity
Resid
ual
Chlor
ine
DO BO
D
CO
D
Chlor
ide
Hardn
ess
Sulph
ate
MPN
Count/
100 ml
E.C
oli
F.C
oli
NTU (mg/l)
(mg
/l)
(mg
/l)
(mg
/l) (mg/l) (mg/l) (mg/l) (mg/l)
Turbhe
Landfill site
Bore well
7.5 2.7 Nil 5.5 2 50 214.08 340 210 23 +ve +ve
6.9 1.07 Nil 5.9 2 70 159.95 350 206 23 +ve -ve
7.3 0.9 Nil 6.0 2 30 166.62 330 160.76 23 +ve +ve
7.3 2.5 Nil 5.2 4 38 90.823 30 144.95 23 +ve +ve
7 0.3 Nil 5.3 4 19 58.39 110 118.29 23 +ve +ve
7.8 0.3 Nil 6.1 8 80 82.95 300 162.29 23 +ve +ve
7.7 0.7 Nil 6.3 2 30 129.75 280 156.38 23 +ve +ve
6.6 0.7 Nil 4.5 1 19 123.26 420 108.19 23 +ve +ve
6.7 0.0 Nil 6.6 2 20 175.16 450 61.71 23 +ve +ve
Aver
age 7.2 1.0
5.7 3.0 39.6 133.4 290.0 147.6 23 +ve +ve
Source: Environmental Laboratory, NMMC
Water Resource Management
Water supply (Network)
This year on an average (average supply across all months), NMMC supplied around 392
MLD of treated water to Navi Mumbai city from the Bhokarpada treatment plant. Upon
deducing the water losses, which account to about 18% of the water supply, it is estimated
that around 321.4 MLD (Table No. 23) water was supplied by NMMC out of which 290.4
MLD was supplied to domestic sector, 25 MLD to the commercial sector and around 6 MLD
to gaonthan and slums. The supply of water to about 1,25,732 connections was through the well-developed distribution network of 972 km long facilitated by 132 booster pumps. The
NMMC provides max. 24 hours water supply to almost 75percent while in the remaining
25% of the NMMC area water is supplied for about 4 to 8 hours.
Table No. 23: Highlights of the water supply network at a glance
Head Details
Total Average water supply in 16-17 392 MLD
Processing and Distribution losses ~18%
Net Water Supply to Navi Mumbai (NMMC limits) 321.44 MLD
Length of distribution network 1130 Km
Number of booster pumps 162
Water supply breakup Metered: 321.4 MLD Unmetered: 70.6 MLD
Water supply sectoral break up Domestic: 290.4 MLD Commercial: 25 MLD Gaothan& Slums: 6 MLD
Source: Environmental Laboratory, NMMC

Environmental Status Report of Navi Mumbai Municipal Corporation-2016-17
58
Per capita water consumption
The per capita water supplied indicates the ability of the municipal water supply system in being able to source, treat water to potable standards and supply it into the distribution
system. It is expressed in LPCD -Litres Per Capita per Day. According to CPHEEO (Central
Public Health and Environmental Engineering Organization), Ministry of Urban Development, Government of India29, the benchmark water supply is 135 LPCD including
losses. It is estimated that net water supply in NMMC area is about 200 LPCD this year
which is higher than the designated benchmark. The NMMC supplies the highest LPCD water supply as against the other ULB’s in MMR (Figure No. 30).
Figure No. 30: Benchmarking for per capita water supply for major ULBs in MMR
Source: Performance assessment system 30
Drinking water quality at tap end
NMMC regularly monitors drinking water samples at various points across the city to check
the quality of water for its potability. Consumption of contaminated water may lead to severe diseases in individuals which can result in epidemic, if not treated. All necessary
quality controls are taken by NMMC in order to supply potable water to citizens. If any
contamination is detected, corrective measures are taken. In the year 2016-17, total 19,875 samples were analysed out of which 4.72% (984) samples were detected to be non- potable
(Figure No. 31).
From Figure No. 32, it is observed that Nerul zone registered non potability samples for Co-Op. Housing Societies as well as commercial water samples for 9–10% of the samples.
Similarly, Koparkhairne node recorded non potability for about 6% for both Co-op. Housing
societies and Domestic samples. Compared to 12% non potability of domestic samples in year 2015-16, Belapur node recorded all the domestic samples as potable in 2016-17. Airoli
(4.7%), Ghansoli 4.8%) and Vashi (4.6%) recorded more than 4% of water samples as non-
potable from commercial sector. Belapur node recorded 4.9% of the samples from public tap
29http://saiindia.gov.in/english/home/Public_Folder/Professional_Practices_Group/State_Local_Manual/PUDUCHERRY_MANUAL/Wad%20Manual/Water%20Supply.pdf 30http://www.pas.org.in/

Environmental Status Report of Navi Mumbai Municipal Corporation-2016-17
59
water as non-potable which was found to be highest compared to all nodes. Other nodes
recorded non-potable sample for less than 4% of the observations.
Figure No. 31: Trend in share of potable and non-potable water samples in NMMC area
Source: Environmental Laboratory, NMMC
Figure No. 32: Ward wise % non-potablity for different types of water in NMMC area Source: Environmental Laboratory, NMMC
0
0.5
1
1.5
2
2.5
3
3.5
4
4.5
5
0
5000
10000
15000
20000
25000
per
cen
tag
e
Nu
mb
ers
Year
Trend in share of potable and non-potable water samples
Non-potable Potable %nonpotable
0
2
4
6
8
10
12
% P
ota
bili
ty
Ward wise % non-potability for different types of water in NMMC area
Commercial
Co-Op. Hsg. Soc.
Domestic
Public Tap Water
Reservoir

Environmental Status Report of Navi Mumbai Municipal Corporation-2016-17
60
Sewage treatment and public toilets
NMMC has a well-planned underground sewage network which has coverage of about 99% in NMMC area and caters to about 2,44,345 connections. The total length of sewer lines is
448.37 km which caters 100% of the population. Also, there are about 506 public toilets (5567
seating capacity) with equal distribution for men and women.
Sewage Treatment Facilities
NMMC has 7 sewage treatment plants and one aerated lagoon connected to Sanpada STP
(Map No. 4) for treatment of sewage generated in NMMC jurisdiction area. The total capacity of STPs accounts for 424 MLD. Daily around 205 MLD sewage gets generated and
100% of the sewage gets treated in STPs. The STPs possess Primary as well as Secondary
treatment system which works on the of Cyclic Activated Sludge Treatment technology
using advanced Sequencing Batch Reactor (SBR) process. The system operates in a batch
reactor mode which eliminates all the inefficiencies of the continuous processes. The
complete process takes place in a single reactor, within which all biological treatment steps take place sequentially. Water quality tests are conducted daily during secondary treatment
at an ISO certified laboratory.
Special suction units are installed to clean the sewage from public toilets. There are around 10 suction units having capacities of 2000 liters (7 Nos) and 6000 liters (3 Nos). They are
responsible to collect and dispose of the sewage to the treatment plants. A brief detail of the
STPs in Navi Mumbai under NMMC is provided in Table No. 24.
Table No. 24: List of functional Sewage Treatment Plants in NMMC area (2016-17)
Sr.
No. Node & Sector Design Capacity (MLD) Treatment technology
1 CBD Belapur - 12 19
Cyclic Activated Sludge Process (SBR Tech)
2 Nerul - 50 100
3 Sanpada - 21 37.5
4 Vashi - 18 100
5 Koparkhairne - 14 87.5
6 Ghansoli - 15 30
7 Airoli - 18 80
Total 454
Source: Environmental Laboratory, NMMC

Environmental Status Report of Navi Mumbai Municipal Corporation-2016-17
61
Map No. 4 Location of STPs in NMMC area

Environmental Status Report of Navi Mumbai Municipal Corporation-2016-17
62
Performance of Sewage Treatment plant
Before discharge water from STPs into the creek, NMMC performs monitoring of water quality regularly. This helps in checking levels of various parameters which affects water
quality and also to check efficiency of treatment plants. The data for the inlet and outlet is
presented in Table No. 25. All parameters are well within the standard limit from all 7 STPs.
Table No. 25: Average performance and efficiency of STPs in NMMC area
Source: Respective STPs Laboratory, NMMC
Standards as per BIS Notification dated 21st April 2015
Storm water Management
NMMC area has storm water drain networks of total 550km (Table No. 26) in length. The
ratio of length of storm water drains to total length of major roads in NMMC area is 84% and covers almost the entire city except for the MIDC area where the ratio is about 50%
The main features of the storm water drains are the Nallahs and the unique holding ponds
of the city which prevent flooding of water in the city. NMMC regularly monitors the water quality in the Nallahs as well as the holding ponds.
Table No. 26: Ward wise length of storm water drains in NMMC area
Sr.No Ward Name Ward Number Storm Water Drain Length
(Km)
1 Belapur A 82.00
2 Nerul B 111.00
3 Vashi C 90.15
4 Turbhe D 82.00
5 Kopharkhirane E 79.00
6 Ghansoli F 40.00
7 Airoli G 65.85
8 Digha H 0
9 MIDC
0
Total 550
Source: Environmental Laboratory, NMMC
STP
PH B.O.D(mg/l) C.O.D(mg/l) S.S(mg/l)
6.5-9 <10 <50 <20
In Eff In Eff In Eff In Eff
CBD Belapur - 12 7.1 7.5 105 4 255 49 162 8
Nerul - 50 6.9 7.1 146 4 235 35 133 8
Sanpada – 21 6.9 7.4 140 3 294 32 128 7
Vashi - 18 6.8 7.0 140 4 256 48 174 9
Koparkhairne - 14 6.9 7.2 116 4 324 28 131 6
Ghansoli - 15 6.8 7.2 124 4 252 44 112 6
Airoli - 18 6.7 7 156 4 306 44 152 8

Environmental Status Report of Navi Mumbai Municipal Corporation-2016-17
63
Nallahs
There are 10 major nallahs which collect and discharge storm water in creek area (Map No. 5). These nallahs originate in MIDC area and carry industrial effluent to the creek. They
carry mixed wastewater during dry season. The list of nallahs is tabulated in Table No. 27
and the water quality of the samples collected from nallahs is presented in Table No. 28.
Compared to last year (2015-16), the suspended solid levels in the year 2016-17 are found to
be within the permissible limit (<600 mg/l) prescribed by CPCB in all water samples of
nallahs (Table No. 28). Except for Pavane MIDC and Turbhe sector 24, all remaining nallahs shows high amount of chloride than the permissible limit. Belapur sector 12 shows highest
level of chloride (7966.47mg/l) which is almost 8 times higher than the prescribed standard
of 1000mg/l followed by Juinagar Herdillia nallah (5944.04mg/l) and Airoli Bharat Bijali Nallah (4074.08mg/l).
Table No. 27: Details of open Nallahs in NMMC area
Sr.
No Nallah Node From To
Length
(meters)
1 Nalla No-1 Belapur Sector-1 Sector-12 2418
Artist Village Branch 726
Sector-1a Nalla 430
Nalla N0-2 CBD Railway St- Sector-15 1105
2 Nalla N0-3 Nerul Sector-9 Palm Beach Marg
4273
Sector-15a 2661
3 Nalla N0-4 Sanpada MIDC Sector-4 7233
Railway Branch 1418
Sector-4 Branch 1403
Herdilia Branch 1550
MIDC Branch 1875
4 Nalla N0-5 Vashi Sector-12 Vashi R/W Station
7310
5 Nalla N0-6 Koparkhairane Khairane Nalla 7990
Branch-1 3709
Branch-2 739
Branch-3 1678
Branch-4 1470
6 Nalla No-7 Mahpe Nala 2036
7 Nalla No-8 Ghansoli NOCIL Nalla 4690
Branch-1 1360
Branch-2 2937
Branch-3 1615
Branch-4 1620
8 Nalla No-9 Airoli Bharat Bijlee Nalla 1891
MSEB Nalla 1911
Branch-1 732
Branch-2 670
9 Nalla No-10 Digha Ilthanpada Nalla 3500
Thane Boundry-Digha 3332
Total 74282
Source: Environmental Laboratory, NMMC

Environmental Status Report of Navi Mumbai Municipal Corporation-2016-17
64
Table No. 28: Annual Average water quality of water samples collected from nallahs
Zone Name Of Nallah
Parameters
pH D.O B.O.D C.O.D S.S. Nitrate Nitrite Sulphide Chloride
(mg/l) (mg/l) (mg/l) (mg/l) (mg/l) (mg/l) (mg/l) (mg/l)
Limits
5.5-9.0
- <350 - <600 <45 - - <1000
Belapur
Belapur Sector 12
7.3 3.1 23 397 523 1.532 0.149 18.80 7966.47
Belapur Sector 15A
7.6 1.3 24 235 49 2.040 0.151 21.20 170.29
Vashi Vashi Sector 18 ( Khairne Nallah)
7.0 1.6 60 353 117 2.942 0.065 31.04 3035.66
Turbhe
Turbhe Mafco Nallah sector 17,18
7.0 1.7 11 94 273 2.602 0.070 30.48 1186.61
Pavane MIDC Nallah
7.2 1.6 45 240 161 4.157 0.144 31.36 396.33
Turbhe Sector 19 6.9 0.8 27 128 376 1.551 0.062 32.64 2677.66
Turbhe Sector 24 7.3 0.9 12 133 169 0.647 0.067 15.84 418.46
Juinagar Herdillia Nallah
7.1 3.0 59 570 260 1.701 0.144 32.00 5944.04
Koparkhairne
Koparkhairne Sector 11
7.1 0.9 20 279 150 4.199 0.069 13.36 3220.10
Mahape Bridge Nallah
7.0 1.5 84 448 258 3.275 0.126 13.12 3344.25
Airoli Airoli Bharat Bijali Nallah
7.0 1.2 63 348 218 3.017 0.230 9.76 4074.08
Ghansoli Nocil Nallah 6.9 1.8 82 417 102 4.828 0.249 18.32 1493.34
Nerul Nerul Palm Beach Road
7.5 0.6 19 193 213 2.880 0.034 23.92 1907.28
Source: Environmental Laboratory, NMMC

Environmental Status Report of Navi Mumbai Municipal Corporation-2016-17
65
Map No. 5: Water Quality Monitoring stations along Nallahs in NMMC area

Environmental Status Report of Navi Mumbai Municipal Corporation-2016-17
66
Holding Ponds
CIDCO used the Dutch technology for flood control to optimise the reclamation levels of the city, as certain areas of Navi Mumbai are located below the High Tide Level. This method is
used for control of ingress of seawater during high tide and allowing excess water to flow in
to the sea during low tide naturally or by pumping with the help of high capacity pumps during high tide. For disposal of rainwater, holding ponds have been constructed in
different nodes. Bunds have been constructed around these ponds and control mechanism
for release of water during low tides has been installed (Picture No. 7). For disposal of rainwater, total 11 holding ponds have been constructed in Belapur, Vashi Turbhe,
Koparkhairane and Airoli nodes under NMMC. Bunds have been constructed around these
ponds and control mechanism for release of water during low tides has been installed (Table No. 29).
Picture No. 7: Schematic of the Dutch dyke (Left) and its actual photograph with flap gates (right)
Table No. 29: Details of holding ponds in NMMC area
Sr. No. Node Location Area in hectare
1 Belapur (CBD) Sector 12 5.5
2 Belapur (CBD) Sector 15A 13.85
3 Vashi Sector 8A 2.3
4 Vashi Vashi Gaon 1.93
5 Vashi Sector 10A 15
6 Vashi Sector 12 24
7 Koparkhairne Sector 14 9
8 Airoli Sector 18 16
9 Airoli Sector 19 14
10 Vashi Behind Rly. Station 77
11 Sanpada Sector 30A 22
Total 200.58
Source: Environmental Laboratory, NMMC

Environmental Status Report of Navi Mumbai Municipal Corporation-2016-17
67
Table No. 30: Annual average quality of water samples collected from holding ponds
Holding Ponds
PARAMETERS
pH S.S D.O B.O.D Nitrate Nitrite Phosphate
(mg/l) (mg/l) (mg/l) (mg/l) (mg/l) (mg/l)
5.5-9.0
4.0-7.0 <100 <45 <5
Belapur Sector 12 6.9 475 3.4 56 2.926 0.059 0.204
Belapur Sector 15A 7.1 1072 10.3 70 2.948 0.111 0.212
Vashi Sector 8 6.8 631 2.5 40 3.641 0.904 0.358
Vashi Sector 10A 6.7 1000 6.9 103 4.131 0.781 0.248
Vashi Sector 11 & 12 7.0 393 2.0 25 5.397 0.385 1.668
Vashi Sector 30 6.8 807 3.0 121 3.400 1.076 0.536
Koparkhairne Sector 14 6.9 790 4.8 41 0.886 0.105 0.284
Airoli Sector 18 6.6 717 4.4 81 4.945 0.414 2.354
Airoli Sector 19 6.7 1043 6.3 60 5.317 0.319 0.695
Sanpada Sector 18 to 20 6.8 1003 3.4 157 3.161 0.045 0.358
Source: Environmental Laboratory, NMMC
Table No. 30 depicts the water quality monitored at the holding ponds in the year 2016- 17.
The pond at Vashi sector 30 violated BOD level (121 mg/l). Rest all locations have BOD within permissible limit. Higher DO levels (10.3mg/l) were found only at Belapur Sector
15A while Vashi sector 11 & 12 (2.0mg/l) and Vashi sector 30 (3.0mg/l) showed less DO
levels. Rest all the parameters like pH, nitrite, nitrate and phosphates were well in the limits.
Pressure and Impacts
Various pressures exist on water as resource. These pressures are in form of increase in
water demand, water pollution (industries and domestic) and water losses due to theft and
leakage. The pressures on water resource in Navi Mumbai city are presented in this section.
Owing to rapid urbanization in NMMC area there has been increase in demand for water.
The demand for water supply has increased from 336 MLD (2010-11) to 392 MLD (2016-17).
The Figure No. 33 shows trend of water demand in NMMC jurisdiction area. It is estimated
that the water requirement for NMMC would increase to about 500MLD by the year 2042.
Figure No. 33: Trend of water demand in NMMC
Source: Water supply and sewerage department, NMMC
336 347
393410 421
401 392
0
50
100
150
200
250
300
350
400
450
2010-11 2011-12 2012-13 2013-14 2014-15 2015-16 2016-17
ML
D
Trend of water demand in NMMC jurisdiction area
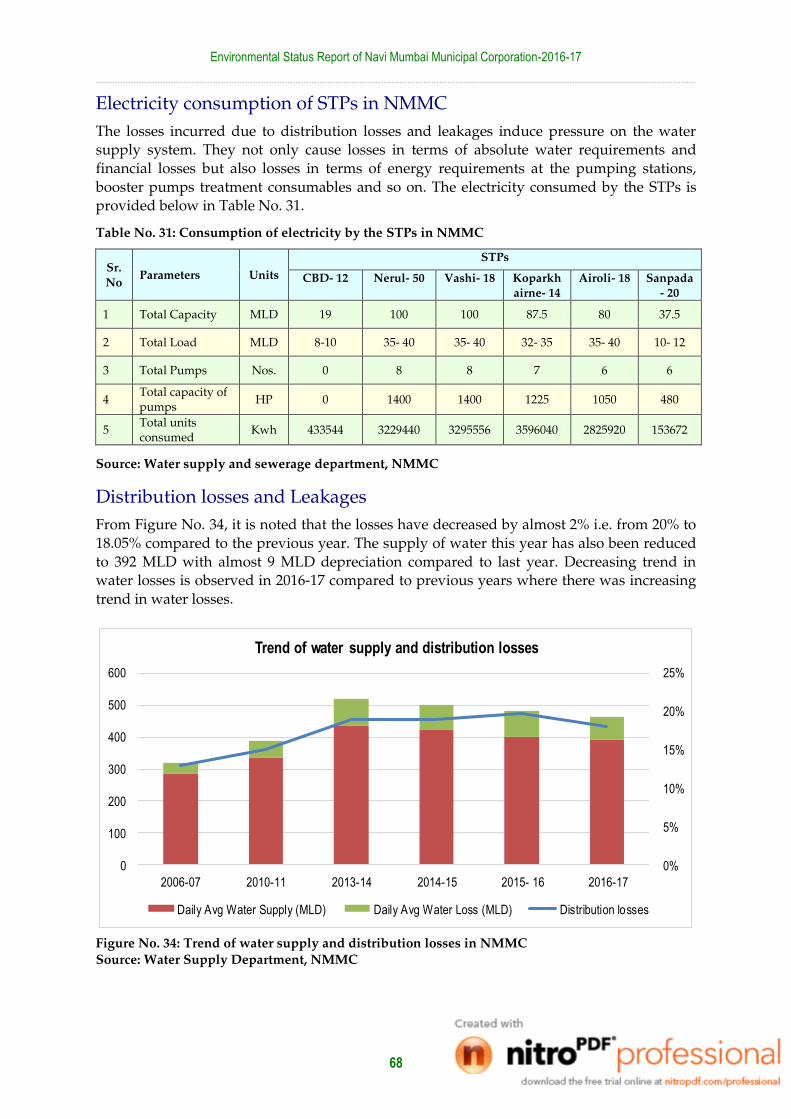
Environmental Status Report of Navi Mumbai Municipal Corporation-2016-17
68
Electricity consumption of STPs in NMMC
The losses incurred due to distribution losses and leakages induce pressure on the water supply system. They not only cause losses in terms of absolute water requirements and
financial losses but also losses in terms of energy requirements at the pumping stations,
booster pumps treatment consumables and so on. The electricity consumed by the STPs is provided below in Table No. 31.
Table No. 31: Consumption of electricity by the STPs in NMMC
Sr.
No Parameters Units
STPs
CBD- 12 Nerul- 50 Vashi- 18 Koparkh
airne- 14
Airoli- 18 Sanpada
- 20
1 Total Capacity MLD 19 100 100 87.5 80 37.5
2 Total Load MLD 8-10 35- 40 35- 40 32- 35 35- 40 10- 12
3 Total Pumps Nos. 0 8 8 7 6 6
4 Total capacity of pumps
HP 0 1400 1400 1225 1050 480
5 Total units consumed
Kwh 433544 3229440 3295556 3596040 2825920 153672
Source: Water supply and sewerage department, NMMC
Distribution losses and Leakages
From Figure No. 34, it is noted that the losses have decreased by almost 2% i.e. from 20% to
18.05% compared to the previous year. The supply of water this year has also been reduced
to 392 MLD with almost 9 MLD depreciation compared to last year. Decreasing trend in water losses is observed in 2016-17 compared to previous years where there was increasing
trend in water losses.
Figure No. 34: Trend of water supply and distribution losses in NMMC
Source: Water Supply Department, NMMC
0%
5%
10%
15%
20%
25%
0
100
200
300
400
500
600
2006-07 2010-11 2013-14 2014-15 2015- 16 2016-17
Trend of water supply and distribution losses
Daily Avg Water Supply (MLD) Daily Avg Water Loss (MLD) Distribution losses

Environmental Status Report of Navi Mumbai Municipal Corporation-2016-17
69
Response
Installation of AMR’s
In order to maintain a tally of water consumption and increase the share of metered water
supply, NMMC initiated a drive for installing node wise AMR’s (Automatic Meter Reader)
system. For piped water supply with connection of 20 mm and above NMMC has made it compulsory to install AMR’s. Around 3272 active consumers from residential, 720 from
commercial and 176 institutional consumers have installed AMR till March, 2017.
Water supply Disconnections
The consumers which didn’t oblige to the installation of AMRs NMMC took strict action
against the consumers and upon issuing warnings disconnected the water connections if
they failed to install AMRs. Water supply of around 218 active consumers of residential, 51 commercial and 5 institutional consumers have been disconnected. Further, around 11056
illegal water connections were disconnected and around 192 booster pumps are removed.
Release of Sewage and industrial effluents
As per CPHEEO, about 70-80% of total water supplied for domestic use gets generated as
wastewater31. The waste water from industries and domestic activities accounts for major
source of water pollution. Navi Mumbai being coastal region, any release of polluted water can lead to water pollution affecting the marine and coastal ecosystem. With rapid
expansion of city from last few years and increase in water supply, the quantity of
wastewater generated has increased in the same proportion. It is observed that the sewage generated this year has been increased slightly by 5 MLD compared to last year. The water
supplied for the year 2016-17 is 392 MLD which is cut off by 9 MLD as compared to 2015-16
(401 MLD). The total sewage generated for the year 2016-17 accounts for 205 MLD.
Response – Nallah quality testing drive
On receiving complaints and grievances from citizens on release of polluted water/effluents
from the nallahs and streams in Navi Mumbai, NMMC has carried out survey of chemical industries around Khairne nallah (Koparkhairne) to check pollution level.
Effluent samples were collected on 10th January, 2017 (Picture No. 8) and analysed for
various parameters to estimate the level of pollutants in the samples. Samples were tested in triplicate by three agencies namely – NMMC environmental Laboratory, A third Party
certified laboratory and the in-house laboratories of the chemical industries and reports
were submitted and presented to MPCB.
Similar nallah water quality analysis drives for industrial effluents quality are proposed
along all the nallahs. The Sanpada-Juinagar nallah has been shortlisted as the next nallah
under the drive.
31R Kaur, SP Wani, AK Singh and K La, Wastewater production, treatment and use in India,

Environmental Status Report of Navi Mumbai Municipal Corporation-2016-17
70
Picture No. 8: MIDC effluent sample collection from industries near Khairne nallah
Response - Sewage network in slum pockets
1. NMMC has proposed to provide proper sewerage system for slum pockets and
connects the sewage to STPs. NMMC has assured the drainage network in slum
pocket area will be complete in one and half years year after taking possession of land for pumping station from MIDC authority.
2. NMMC has carried out survey of Ghansoli &Airoli node and prepared plan for
collection of sewage & connect to nearest STP. Also, completed survey of Digha, Tubhe and Nerul area and preparation of plan is under process. After completion of
individual plan, combine DPR will be prepared and on the basis of DPR work will be
carried out.
Comprehensive Environmental Pollution Index (CEPI) Action Plan for Navi Mumbai
CPCB had carried out Comprehensive Environmental Assessment of 88 industrial clusters in country in December 2009 based on CEPI. For calculating CEPI, Navi Mumbai region was
divided into 3 sectors namely Residential cluster (NMMC area), Residential-Industrial
cluster (mixed) and Industrial cluster (TTC MIDC area of Turbhe, Rabale, Koparkhairne and Mahape) for consideration of CEPI. MPCB and NMMC have taken various short and long
term measures with the help of stakeholders for improving CEPI. The list of measures
undertaken (status as on December 2016) has been enlisted below.
Initiatives by MPCB/TBIA
1. Airoli and Digha Industrial area (K block) has been connected to CETP-TBIA Navi
Mumbai through underground effluent collection system.
2. MPCB regularly monitors performance of ETPs (Effluent Treatment Plants). There
are total 48 large and medium scale industries generating trade effluent and have

Environmental Status Report of Navi Mumbai Municipal Corporation-2016-17
71
installed necessary ETPs. These ETPs perform satisfactorily and meet all consented
standards. MPCB is taking further action on industries which fail to meet all consented standards. All major industries have improved their ETPs in order to
reduce pollution load by atleast 10%.
3. Under NMMC area, MIDC authority has initiated steps towards replacement of existing old pipeline by HDPE pipeline in TTC MIDC area. For this work, Tender
process is also floated. As per details received from MIDC authority during meeting
held on 04/1/2017, the total length of pipeline is 130KM. Remoulding of 39.53KM HDPE pipeline is proposed and tender for replacement of 6.30KM pipeline is under
process.
4. Monitoring of ground water quality at Turbhe landfill site for checking any contamination in ground water. Recent report on checking of ground water between
21/07/2016 to 26/07/2016 shows no abnormality in ground water quality.
5. The recent improvements/ upgradation undertaken by TBIA for improving the CETP for enhancing its overall performance are as follows
Installation of specially designed slow speed agitators
Construction of new equalization tank
Installation of RO system having capacity of 100 CMD
6. Installation of Supervisory control and data acquisition (SCADA) as a mitigative
measure towards leakage of effluent carrying pipeline is under process. Till now, total 12 industries installed SCADA system.
7. Awareness programs are conducted regularly in coordination with TBIA, TTCWMA,
CETP & other industries.
Illegal dumping of debris and other waste in water bodies
Dumping of solid waste like plastics, demolition and construction wastes, garbage (animal
and vegetable wastes), rubbish, yard debris, ashes, wood waste and so on leads to water pollution. Many religious offerings are also dumped into the holding ponds and lakes
adding to water pollution. In order to prevent such pollution for lakes and ponds, NMMC
has undertaken Lake Vision project in 2009-10 which has the following objectives:
Decorative lights, flowerpots, cobal stone path way, stamp concrete for Ghat.
Periodic dewatering and de-silting of lakes to increase the water holding capacity
RCC Nirmalyakund, Washing area & idol immersion partition to the lake in order to
control the entry of pollutants.
Aeration system and central fountain in the lakes to improve water quality.
Construction of Gabion retaining wall along periphery & partition wall for Idol
Immersion tank
Washing areas have been designed such that the run off from the washing (soap lather
and waste water) does not enter the water body and is released into the storm water
drains.
Beautification of lake surroundings by ultra-modern infrastructure (Picture No. 9)

Environmental Status Report of Navi Mumbai Municipal Corporation-2016-17
72
Picture No. 9: Water body at Nerul after its renovation and beautification
Silting of holding ponds
Holding ponds lies between the creek and the land where there is movement of water in and out of the holding pond owing to the tidal currents. The tidal currents cause effective
transportation of mangrove propagules in the holding ponds which have increased the
growth of mangrove in the holding ponds. The growth of mangroves in the holding ponds causes silting which further reduces their capacity to hold water (.Picture No. 10) Due to this
reason holding ponds are not serving the purpose of their construction. The silting of
holding ponds may lead to flooding during rains and high tides in the city.
Response:
NMMC filed a petition on 18th December 2005 to carry out repair work of holding ponds. In
2006, the high court granted permission to carry out regular work which included:
1. Installation of new flap gates.
2. Repairing of bunds and repairing of service roads used to take machinery if
necessary 3. Pipe outlet repairing and small repair works
4. Flap gate repairing
In 2010, it was decided that NMMC should apply for the requisite permissions of de-siltation to MCZMA before applying to High court. Accordingly NMMC has applied to
MCZMA of Govt. of Maharashtra on 30th August 2012 which was passed on 4th March 2013
to develop action plan. A detailed action plan has been submitted on 5th August 2013 by NMMC proposing treated silt to be used for quarry slope refill. The addition of artificial soil
in steep quarry slopes needs to be carried out using specialized technologies. The hearing in
this case is awaited from the Hon’ble High court
NMMC further proposes to develop a nursery for mangroves and the propogules, using this
silt. Given that the soil is very saline it shall not be suitable for cultivation of any other tree
species since they would not be able to adapt to saline conditions. As there are very few nurseries, the saplings could be distributed across the city and also in other areas of MMR. It
will not only save the cost for treating the large quantity of soil but also it could be a unique
feature for the Corporation. The citizen groups may be informed about these nurseries so that the mangrove patches destroyed along the coast may be restored.

Environmental Status Report of Navi Mumbai Municipal Corporation-2016-17
73
Picture No. 10: Growth of mangroves at holding pond in Koparkhairne
Initiatives for Conservation and reuse of water
Reuse of water at WTP
Realizing the current need to conserve water, NMMC has adopted a method of “Back flushing” of water at the Bhokarpada water treatment plant (Picture No. 11). Around 10- 12 MLD of water is back treated and the water is used for various purposes. Initially the treated water was released in the natural stream but now the water is stored in a newly developed water storage tank. The work of installing of the water storage tank and other equipment was completed by April 2015. The stored water can now fulfill the need of around 50,000 people in the city. This initiative has also resulted into a saving of INR 1,08,000 per day which shall help compensate the cost of installation of tank and other equipment in the next 2 years.
Supply side management
Realizing the importance of conservation and preservation of water resources in the city, NMMC has taken several initiatives which not only help in reducing the pressure on water
resources in the city but also help in conservation of energy.
NMMC has planned 24x7 water supply in the city while also keeping up to the standard of 150 LPCD as prescribed by Ministry of Urban Development Government
of India.

Environmental Status Report of Navi Mumbai Municipal Corporation-2016-17
74
24x7 water supply with the help of gravity helps save a lot of electrical energy as all
the Elevated Service Reservoirs (ESRs) & Ground Service Reservoir (GSRs) could be bypassed.
Picture No. 11: Back flushing of water at Bhokarpada water treatment plant
Source: City Engineering department, NMMC
Reuse of Treated Water
NMMC has made it mandatory for industries to use treated wastewater which can be
supplied to meet demand of water for various secondary applications in the city.
A direct pipeline is proposed to be commissioned from the Sewage Treatment Plant
(STP) to the industries to directly transfer the treated sewage water thus reducing the
cost of transportation. This pipeline would be installed under the AMRUT scheme.
Further two ESR’s (Elevated Storage Reserves) are proposed for storage of this
treated water. This would help in supply water through an effective channels.
Total sewage generation from NMMC area is 205 MLD and same is treated in 08 STPs located at different locations.
Treated Sewage water of STPs is currently used for the following
o Supplied to CIDCO for watering plantations along road dividers
o Supplied to NRI complex at Seawoods for gardening purpose
o Supplied to construction sites for construction activity
o Used for watering of lawns in NMMC gardens

Environmental Status Report of Navi Mumbai Municipal Corporation-2016-17
75
Land Resource
Map No. 6: Land Use Land Cover pattern of Navi Mumbai

Environmental Status Report of Navi Mumbai Municipal Corporation-2016-17
76
Land is a basic natural resource and is important for overall sustainability of all terrestrial
ecosystems. In industries like agriculture, forestry, mining, fishing, this resource plays a reproductive economic factor. Over centuries, people have been exploiting land resource
and its allied products for their ever growing needs but these resources are finite and their
over exploitation exerts more pressure on such resources. Increased demand or pressure results in range of problems like degradation of land, decreased crop productions due to
wrong agricultural practices, soil pollution due to uncontrolled use of chemical fertilizers,
competition for various development activities.
CIDCO (City and Industrial Development Corporation of Maharashtra), a public sector
undertaking developed by the Government of Maharashtra has already put a lot of planning
in development of Navi Mumbai. Appropriate plans were executed for building residential, commercial, industrial zones while maintaining green cover or spaces in and around the
city. This section highlights the current situation of land resources in NMMC and also
discusses the effects of various developmental activities on them.
Status
Change in Earth’s surface is the combination of variety of geological and physical processes
like soil erosion, plate tectonics, weathering of rocks, earthquakes, volcanoes and flood. Similarly, Humans also shape the land through activities like Deforestation, agricultural
practices, mining, increasing construction activities. Land Use is the concept which explains
the utilization and management of land and its resources by humans while Land Cover comprises of physical and biological components which exists on land surface in the form of
forest cover and manmade structures32.
As per the data recorded by MRSAC (Maharashtra Remote Sensing Application Centre) the land use pattern of the city consists of built up area, agricultural land, forests, wastelands,
water bodies, roads, and so on (Map No. 6). NMMC’s jurisdiction is spread across 108.63 sq.
km (Table No. 32) of which built up area constitutes major portion (56.16%) and accounts to about 61.01 sq.km. This comprises residential, commercial, industrial, administrative
constructions and infrastructure such as crematoriums, water supply, sewage disposal,
roads, and railways. Forest cover is around (24.44%) which covers around 26.55 sq.km of area. Wetlands are an important feature of the city with 13.46 sq.km area under lakes,
mangroves, wetlands, creeks, mudflats and manmade water bodies.
Table No. 32: Break up of Land Use Land Cover pattern in NMMC
Sr. No Land Use Land Cover %Share of land cover Area in km2
1 Built Up 56.16 61.01
2 Forest 24.44 26.55
3 Wetlands 12.39 13.46
4 Wastelands 05.39 05.85
5 Agricultural Land 01.29 01.40
6 Water Bodies 00.33 00.36
Grand Total 100 108.63
Source: MRSAC
32 https://enviroliteracy.org/land-use/

Environmental Status Report of Navi Mumbai Municipal Corporation-2016-17
77
It can be observed from Figure No. 35 that more than 75% of the total area in Turbhe and
Vashi is built up area which indicates that the population density in these areas is higher compared to other areas. Forest areas can be observed at Belapur, Digha, Ghansoli,
Koparkhaine and Nerul which indicates need for protection of these areas to conserve the
green spaces of the city. Wetlands can be observed in all the wards except Digha. Marginal farm lands can be observed in Belapur, Ghansoli, Koparkhairane and Nerul which indicates
that agricultural practices are still carried out in the city but at a very small scale.
Built up area
The term built up area is an important land use for any city and is used primarily in urban
planning, real estate development and construction industry. The increase in built up areas
shows impact on the environment due to soil sealing and disturbance due to increase in transportation, noise levels, resources utilization, increased waste generation and ultimately
pollution33. More than 60% of the area in Navi Mumbai is under built up area for
construction of residential, commercial, and industrial complexes in each node. Residential area comprises of majority of the built up area of the city to accommodate the ever
increasing population. The current status and the threats exerted by growth in the
residential, commercial and industrial area have been discussed in the Drivers section of the report. The built up area in the city is also under various infrastructural development
projects such as roads, railways, WTP & STP (Water and Sewage Treatment Plants), SWM
(Solid Waste Management) & so on. The status of these infrastructural projects is further elaborated in their respective sections.
Figure No. 35: Ward wise land use categories in NMMC
Source: MRSAC
33 http://www.vliz.be/projects/deduce/IFS/IFS02.pdf

Environmental Status Report of Navi Mumbai Municipal Corporation-2016-17
78
Wetlands
Wetlands are those areas which are inundated or saturated by surface or groundwater at a frequency and duration sufficient to support prevalence of vegetation typically adapted for
life in saturated soil conditions34. Wetlands usually consist of water structures like lakes,
rivers, mangroves, coral reefs and so on. Artificial man-made wetlands consist of paddy fields, dams, saltpans and so on. Wetlands play a number of roles in the environment,
mainly in water purification, flood control, carbon sink and shoreline stability. Navi
Mumbai is rich in several wetland areas such as lakes, ponds, holding pond, mangrove wetlands, marshlands & so on.
Water Bodies
Navi Mumbai consists of several water bodies such as 24 lakes, creek, ponds, wells & so on. The water bodies are used for various domestic and industrial purposes in the city. These
water bodies have been further discussed and their quality status been presented in the
Water resources section of the report.
Mangroves
Mangroves are salt tolerant plants found in tropical and sub-tropical intertidal regions of the
world which collectively is termed as ‘Mangrove Ecosystem’. Mangrove ecosystems are highly productive yet sensitive and fragile ecosystem which shelters many plants and
animal species35. They are distributed in the inter-tidal region between the sea and land
(Picture No. 12)36. Mangrove wetlands are ecologically important since they support breeding of diverse plants and animals. Increase in mangroves has also been observed from
15.50 sq. km to roughly 49.78 sq. km since the last 2 decades37 but only few areas are under
the jurisdiction of Municipal Corporation. The dominant mangrove species recorded in the area included Avicennia marina and a mangrove weed, Acanthus ilicifolius and Sonnertia alba.
Research studies of NMMC area documents species of true mangroves representing
approximately 3 genera and 3 families while 10 species of mangrove associates belonging to 8 genera under 6 families and 1 species of non-mangrove halophytes have been recorded38..
Mangroves act as a buffer zone between land and sea and protects the land from erosion and
play an important role as a protective shield against cyclones, ecological disasters and protects shoreline. This is particularly significant for Navi Mumbai due to its geographical
location. They are also important for maintaining biodiversity as mangroves acts as breeding
and nursery grounds for variety of life forms including invertebrates, fishes, amphibians, reptiles and birds species.
34 http://www.wetland.org/downloads/Wetlands101ppt.pdf 35 http://agritech.tnau.ac.in/forestry/forest_mangrove_index.html 36 http://www.marineclimatechange.com/marineclimatechange/bluecarbon_2_files/Girietal2011.pdf 37 http://wgbis.ces.iisc.ernet.in/biodiversity/sahyadri_enews/newsletter/issue40/news/toi_mangroves_cidco.pdf 38 Pawar (2011). Floral Diversity Of Mangrove Ecosystem From Coastal Environment Of Uran (Raigad), Navi Mumbai, Maharashtra. Electronic Journal of Environmental Sciences Vol. 4, 113-117 (2011) ISSN: 0973-9505

Environmental Status Report of Navi Mumbai Municipal Corporation-2016-17
79
Picture No. 12: Dense mangroves cover along Thane creek
Carbon sequestration by mangroves in NMMC
Carbon sequestration is the term used to describe acquisition and storage of Carbon. It is the process of capturing and storing Carbon that would otherwise be emitted or remained in the
atmosphere or to prevent carbon emissions produced by human activities in the atmosphere
by capturing and diverting them to secure storage. Mangrove forests are one of the most promising means of carbon sequestration, having the highest net primary productivity
among all ecosystems. Mangrove species are able to reduce the amount of excess carbon in
the air by sequestering carbon dioxide and thereby reducing the concentration of greenhouse gases39. Studies have found that mangroves have the potential to store more
carbon in their biomass compared to tropical and temperate forests40. It is found that the
global carbon burials (Carbon sequestration) of mangroves are approximately 18.4 Tera
grams of carbon per year (Tg C/year)41.
As the Carbon footprint of Navi Mumbai is estimated to be about 2.8 million metric
tonnes/year as per study conducted by TERI, it could be predicted that almost 0.26% carbon emissions are sequestered by the mangroves of Navi Mumbai per year.
39 http://www.mangrovesforfiji.com/mangroves/carbon-sequestration 40http://www.wetlands.org/News/tabid/66/ID/3503/Not-all-mangroves-are-identical-new-study-reveals-hotspots-for-mangrove-biomass.aspx 41 Patil V., Singh A., Carbon Sequestration in Mangroves Ecosystems, Vol. 7 No. 1A,2012,Pg No.577

Environmental Status Report of Navi Mumbai Municipal Corporation-2016-17
80
Habitats in the city
Natural Areas
Natural forests are an important component of the green areas in Navi Mumbai and about
16.35 % of total NMMC area (26.55 sq. km) is forest area. The city encompasses various
habitats ranging from low hills with tropical semi-evergreen, tropical moist deciduous, tropical dry deciduous, to marshlands, estuary and mangroves. Around 1,471 hectares (14.71
sq. km) of mangroves on government land in Navi Mumbai have been notified as ‘reserved
forests’. Such areas with a high green-coverage have ecological and environmental significance & can also improve the urban climate, abate the urban heat-island effect and
reduce environmental damage.
Navi Mumbai city has a good area under tree cover. A study by NASA (National Aeronautics and Space Administration) indicates that it takes 17.5 trees per person to
produce sufficient oxygen for survival but it takes 20 trees per person to consume the CO2
each person generates. Thus trees play a vital role in regulating the city’s environment and helps maintain proper balance. NMMC has carried out tree plantations in every block
consecutively as per the requirement which can be observed in Table No. 24. Out of the total
trees present in the city 1.14 Lakhs (1,14,931) have been planted on road dividers. As per the provisional figures, the total tree count of the city is around 8.5 Lakhs
As these green areas work not only as lungs for the city but also provide various
environmental services, conservation of these areas is of key importance in order to ensure sustainable environment of the city.
Man-made Areas
Growing urbanisation which has resulted in loss of natural areas of the city has exacerbated
the process of air, water and land pollution. As the World’s cities continue to grow,
continuing to value green spaces is important but it is also a challenge, particularly in
developing nations where there is a pressure for space, resources and development. A network of gardens and open spaces are critical for providing healthy habitats and
preserving regional ecosystems amid growing cities. Urban Heat Island Effect can be
reduced or virtually eliminated by increased numbers of green spaces in cities. Gardens and parks act as small regulators to clean the environment of the city. They not only help in
reducing the pollution of the city but also contribute to the environment by providing
oxygen, enriching the climate, conserving water, preserving soil, and acting as micro habitats for a variety of city dwelling fauna such as birds and butterflies. Also they create a
peaceful and aesthetically pleasing environment. Gardens further play a significant role in
enhancing the physical, emotional and spiritual well-being necessary to build healthy and socially sustainable communities. Realizing the importance of these green components for
the city, NMMC has taken various initiatives in the form of afforestation programs and
proposing new gardens for effective conservation of the environment.
Other than garden NMMC is also undertaking initiative such as tree plantations on the other
open spaces/areas present in the city such as the circles, Road dividers and T belts (Table
No. 33).
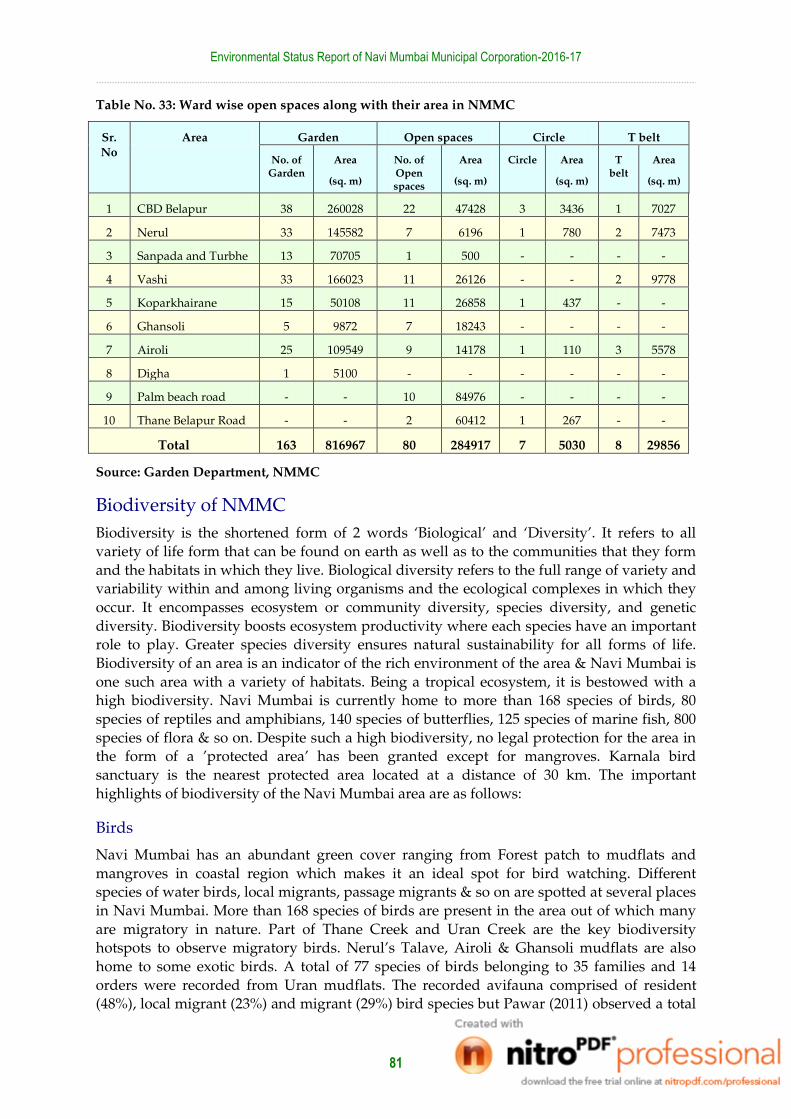
Environmental Status Report of Navi Mumbai Municipal Corporation-2016-17
81
Table No. 33: Ward wise open spaces along with their area in NMMC
Sr.
No
Area Garden Open spaces Circle T belt
No. of
Garden
Area
(sq. m)
No. of
Open spaces
Area
(sq. m)
Circle Area
(sq. m)
T
belt
Area
(sq. m)
1 CBD Belapur 38 260028 22 47428 3 3436 1 7027
2 Nerul 33 145582 7 6196 1 780 2 7473
3 Sanpada and Turbhe 13 70705 1 500 - - - -
4 Vashi 33 166023 11 26126 - - 2 9778
5 Koparkhairane 15 50108 11 26858 1 437 - -
6 Ghansoli 5 9872 7 18243 - - - -
7 Airoli 25 109549 9 14178 1 110 3 5578
8 Digha 1 5100 - - - - - -
9 Palm beach road - - 10 84976 - - - -
10 Thane Belapur Road - - 2 60412 1 267 - -
Total 163 816967 80 284917 7 5030 8 29856
Source: Garden Department, NMMC
Biodiversity of NMMC
Biodiversity is the shortened form of 2 words ‘Biological’ and ‘Diversity’. It refers to all
variety of life form that can be found on earth as well as to the communities that they form
and the habitats in which they live. Biological diversity refers to the full range of variety and variability within and among living organisms and the ecological complexes in which they
occur. It encompasses ecosystem or community diversity, species diversity, and genetic
diversity. Biodiversity boosts ecosystem productivity where each species have an important role to play. Greater species diversity ensures natural sustainability for all forms of life.
Biodiversity of an area is an indicator of the rich environment of the area & Navi Mumbai is
one such area with a variety of habitats. Being a tropical ecosystem, it is bestowed with a high biodiversity. Navi Mumbai is currently home to more than 168 species of birds, 80
species of reptiles and amphibians, 140 species of butterflies, 125 species of marine fish, 800
species of flora & so on. Despite such a high biodiversity, no legal protection for the area in the form of a ’protected area’ has been granted except for mangroves. Karnala bird
sanctuary is the nearest protected area located at a distance of 30 km. The important
highlights of biodiversity of the Navi Mumbai area are as follows:
Birds
Navi Mumbai has an abundant green cover ranging from Forest patch to mudflats and
mangroves in coastal region which makes it an ideal spot for bird watching. Different species of water birds, local migrants, passage migrants & so on are spotted at several places
in Navi Mumbai. More than 168 species of birds are present in the area out of which many
are migratory in nature. Part of Thane Creek and Uran Creek are the key biodiversity hotspots to observe migratory birds. Nerul’s Talave, Airoli & Ghansoli mudflats are also
home to some exotic birds. A total of 77 species of birds belonging to 35 families and 14
orders were recorded from Uran mudflats. The recorded avifauna comprised of resident (48%), local migrant (23%) and migrant (29%) bird species but Pawar (2011) observed a total

Environmental Status Report of Navi Mumbai Municipal Corporation-2016-17
82
of 56 species of birds representing 11 orders, 29 families and 46 genera from the mangroves
of Uran mudflats. Migratory and threatened birds such as Lesser Flamingos visit Navi Mumbai in large numbers. Flocks of flamingos can be observed from Belapur to Airoli in
high numbers along the mangrove patches from November to May. Ornithologists have also
observed a substantial rise in their population and attribute the reason for this to availability of sufficient food and conducive habitat (Picture No. 13).
Picture No. 13: Lesser flamingos at Navi Mumbai
Other Taxa
Other lesser known taxa of Navi Mumbai have been studied to an extent. The data on species diversity of fin fishes from Uran coast revealed the presence of 31 species of which 3 species of Chondricthyes (Cartilaginous fish) representing 2 genera and 2 families and 28 species of Osteicthyes (Bony fish) representing 28 genera and 23 families were recorded. Pawar (2012) have also studied the decapod and molluscan diversity of the Uran Coast where 26 species of decapods were found and 55 species of molluscs representing 13 orders, 30 families and 39 genera were also recorded.
Pressure & Impact
Mining and Quarrying
Mining and Quarrying extract a wide range of useful materials from the ground such as
Coal, metals and stones which are used widely in building and manufacturing industries. But at the same time, it can be very destructive to the environment. Land Degradation is one

Environmental Status Report of Navi Mumbai Municipal Corporation-2016-17
83
of the significant impact arising from these activities which are mainly in form of land
alteration due to excavation, soil pollution due to dumping of mine waste. Stone quarrying causes degradation of forest land, adverse effect on local biodiversity including human
health. It is the main reason for degradation of many natural areas of India. Navi Mumbai
also faces pressures from mining and quarrying activities. A total of 80 leases have been provided in 5 different regions of the city which account to a total area of 823988 sq. m (0.82
sqkm)42. The operators were permitted to carry out mining activities in the area till the year
2016 (September 2016). An approved period of lease for existing sites for stone mining and quarrying has been over. Air pollution with high RSPM level can be observed in the area
near the mining sites as explained in Air section.
Dumping of Debris
Illegal dumping is the improper disposal of waste at any location other than a permitted
landfill or treatment facility. It is not only against the law, but also poses a threat to human
health and the environment. The common locations used for dumping often includes abandoned industrial sites, vacant public or private properties or even in mangrove areas.
Dumbing of debris is currently a serious issue faced by the city. Illegal dumping of debris is
being carried out on a large scale in various wards. Not just construction debris from the city but also debris from nearby regions is randomly dumped in the city at various locations.
Majority of the dumping is carried out in mangrove areas and holding ponds creating a
pressure on these areas. Illegal dumping can impact proper drainage making areas more susceptible to flooding when debris blocks creeks and drainage basins. Mangrove area
proves to be a critical habitat for the migratory birds such as flamingos and other wader
birds which visit the city during the winter season. Dumping of debris in these areas will impact the activities of these birds, possibly causing them to migrate to other areas.
Destruction of Mangroves
Human population is continuously increasing specially near coastal areas which puts significant pressure on natural resources. Mangroves are also facing significant pressure of
destruction due to population growth, dumping of construction and other debris, clearing
mangrove patches for reclamation. Overexploitation and unsustainable demand has resulted in considerable degradation of mangrove areas. Sometimes mangroves also face the threats
from oil spills due to accidents. Illegal deforestation and burning of mangroves is also
observed in some areas.
Poaching of Flamingos
Flamingos congregate each winter on mudflats of Navi Mumbai, on their migratory route.
Since Greater and Lesser flamingos are threatened species, they fall under the protection of the Indian Wildlife (Protection) Act of 1972. Killing them could incur a penalty of up to 7
years in prison43. Still there have been reports of Flamingo poaching reported in some parts
of Navi Mumbai for consumption. In June 2016, there were reports of selling flamingo meat in local markets of Airoli. Poachers trapped these birds using synthetic threads tied on sticks
buried in the mudflats where these birds comes to feed. Synthetic thread cause injuries on
their legs which renders their ability to fly, thus gets trapped in those threads44.
42 http://www.thane.nic.in/pdf/sand_mining/khanipatta_list.pdf 43 http://www.sanctuaryasia.com/conservation/news/9704-mumbais-famed-flamingos-fall-victim-to-poachers. 44 http://www.freepressjournal.in/mumbai/flamingo-birds-are-poached-and-their-meat-sold-at-nearby-markets-in-airoli/878770

Environmental Status Report of Navi Mumbai Municipal Corporation-2016-17
84
Other Projected Impacts
Urban Heat Island Effect
An Urban Heat Island (UHI) is a metropolitan area that is significantly warmer than its
surrounding rural areas due to human activities. The main reason for this effect is the concretization of buildings and houses which indirectly act as insulators of heat. This
insulation makes the areas around buildings warmer. The UHI effect has been observed for
cities like Mumbai, Chennai, Kolkata and Pune with effects in the form of heat stress and rising precipitation which has impacted the urban life of the city. Temperature rise due to
climate change in the city can also add to the threats on biodiversity. Studies in various cities
have recorded migration of wildlife to areas with cooler temperatures, although Navi Mumbai is currently not facing any such effect of the rising urban heat. But in future such
effects may be observed considering the growing trend of urbanization and rise in built up
area in the form of concrete structures in the city.
Compounded Impacts
Increase in building permissions and rise in the number of properties would increase the
pressure on resources to a great extent. All buildings may not be resource efficient and may depend directly on them to fulfil their needs. Thus a rising number of properties will
directly impact the land resources leading to over exploitation of the same. This will impact
the sustainable development of the city leading to scarcity of resources in future. Also rise in properties in a particular area would lead to congestion in that area which would also
indirectly impact the resources of that particular area.
Response
Green Buildings
In order to contribute to the sustainable development of the city, NMMC is promoting the
concept of Green Buildings under their ongoing project titled “Navi Mumbai: An Eco City” in collaboration with TERI (The Energy and Resources Institute). Adoption of the green
building concept would lead to conservation and efficient use of limited resources like land,
water, energy and so on. Given the need of the hour and to set an example for the building & construction industry, NMMC has constructed its own headquarters at Belapur. The
building has received LEED’s Gold rating from IGBC owing to the following green features
implemented and integrated in the building design.
Rainwater harvesting system consisting of 13 pits with a capacity to store up to 80,000
liters of water.
Reflective tiles fitted on the terrace to reduce the load on electric consumption by air-
conditioners.
STP of 0.15 MLD capacity to treat sewage generated in the building.
Recycled water is used for toilet flushing & gardening purpose.
Biomethanation Plant for scientific disposal of canteen waste.
Grass pavers are fitted on the ground to allow percolation of water.
Use of Double Glazed Unit glass to reduce heat transfer & increase energy efficiency
Pneumatic plumbing system to reduce load on water flow.
Recycled wood has been used for furniture in the building

Environmental Status Report of Navi Mumbai Municipal Corporation-2016-17
85
Addition of Open Spaces
As open spaces in the city helps in reducing the impacts of UHI, NMMC and CIDCO plan to increase the area by adding various open spaces in future. NMMC is also taking various
steps to avoid misuse of the open spaces through organizing anti- encroachments drives and
sending legal notices to concerned agencies. This year NMMC is all set to inaugurate the Amusement park at Kopri village in Vashi, on the lines of the Old Woman’s Shoehouse in
Malabar Hill. The construction work is almost completed. The actual picture of the
amusement park is presented in
Picture No. 14: Giant tortoise installation at Amusement park at Kopri village-Vashi
Raising awareness about Bio wealth of City
Biodiversity billboards
In order to increase awareness and sensitize citizens about the local biodiversity of the city,
NMMC in collaboration with TERI has installed biodiversity panels at Nisarga Udyan,
Koparkhairane highlighting the importance of flora and fauna to the city. The garden was transformed from a garbage dumping site and now the garden proves to be a habitat for
many bird species. Similarly boards have been commissioned at Airoli

Environmental Status Report of Navi Mumbai Municipal Corporation-2016-17
86
Picture No. 15: Biodiversity lecterns at Airoli
Developing a Coastal and Marine Biodiversity Centre
To improve knowledge of citizens about local coastal and marine habitat, its inhabitants and
characteristics, Mangrove cell, Forest Department- Government of Maharashtra has
developed a Coastal and Marine Biodiversity Centre (CMCB) at Airoli node in Navi Mumbai. The centre was built in collaboration with the Indo-German (GIZ) Project on
Conservation and Sustainable Management of Marine Protected Areas. It is third marine
interpretation centre of its kind only next to Mahatma Gandhi Marine National Park at Port Blair in Andaman, and Gulf of Mannar Marine Interpretation Centre near Rameswaram in
Tamil Nadu45.
Over 600 marine species are displayed in CMCB. The aim of this concept is to create a state of the art infrastructure wherein visitors can get information about the beauty of coastal and
marine biodiversity of Maharashtra along with important roles plays by coastal area and
threats to such ecosystem through series of visual, audible and tactile elements46. The centre also have indoor features like Coastal and Marine Interpretation centre, souvenir shop,
interactive displays. Outdoor attractions includes mangrove nursery, board walk, creek
view and crab pond. The second phase of the project includes creation of marine museum dedicated solely for skeletal remains of marine mammals while third phase will include
Garden Glow Park project on 5 acres of land which will be have glowing installations
inspired by Dubai Garden Glow, a night time family attraction and is expected to be ready
by December 201847.
45 http://indianexpress.com/article/cities/mumbai/airoli-marine-interpretation-centre-opens-for-tourists-today-4634786/ 46 http://www.travelandtourworld.com/news/article/coastal-marine-biodiversity-centre-launched-airoli-mumbai/ 47 https://blooloop.com/link/garden-glow-park-airoli-mumbai/
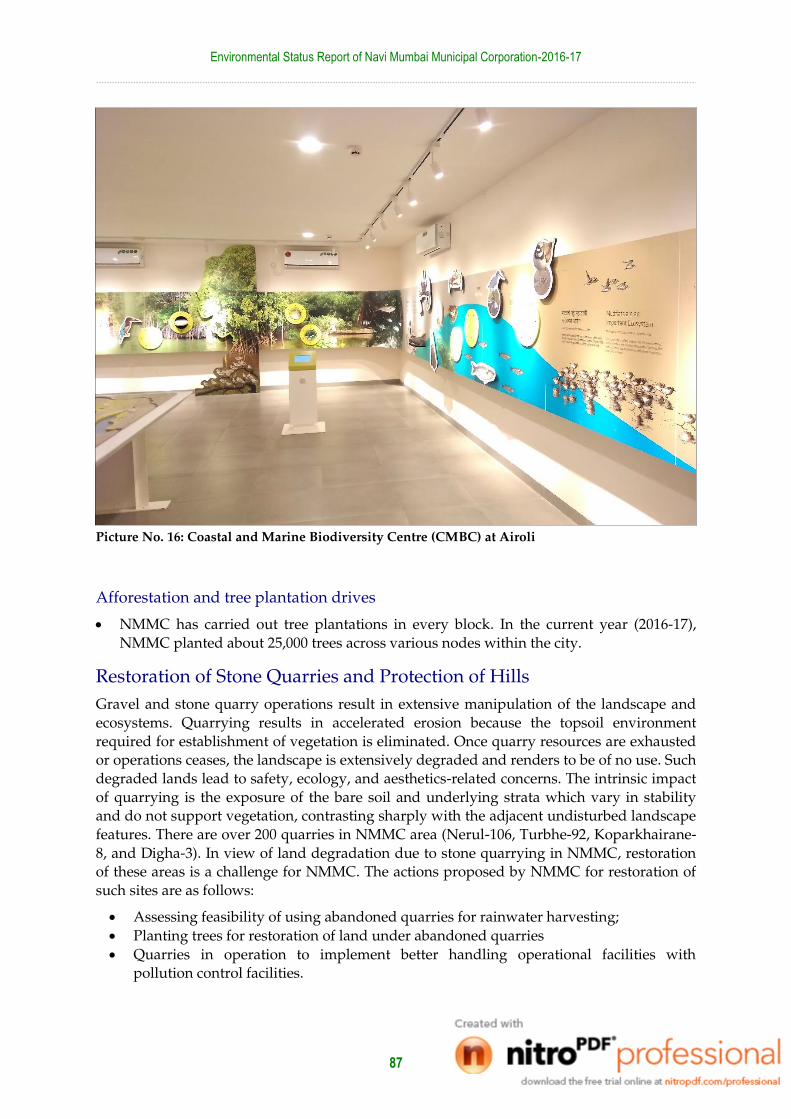
Environmental Status Report of Navi Mumbai Municipal Corporation-2016-17
87
Picture No. 16: Coastal and Marine Biodiversity Centre (CMBC) at Airoli
Afforestation and tree plantation drives
NMMC has carried out tree plantations in every block. In the current year (2016-17),
NMMC planted about 25,000 trees across various nodes within the city.
Restoration of Stone Quarries and Protection of Hills
Gravel and stone quarry operations result in extensive manipulation of the landscape and
ecosystems. Quarrying results in accelerated erosion because the topsoil environment
required for establishment of vegetation is eliminated. Once quarry resources are exhausted or operations ceases, the landscape is extensively degraded and renders to be of no use. Such
degraded lands lead to safety, ecology, and aesthetics-related concerns. The intrinsic impact
of quarrying is the exposure of the bare soil and underlying strata which vary in stability and do not support vegetation, contrasting sharply with the adjacent undisturbed landscape
features. There are over 200 quarries in NMMC area (Nerul-106, Turbhe-92, Koparkhairane-
8, and Digha-3). In view of land degradation due to stone quarrying in NMMC, restoration of these areas is a challenge for NMMC. The actions proposed by NMMC for restoration of
such sites are as follows:
Assessing feasibility of using abandoned quarries for rainwater harvesting;
Planting trees for restoration of land under abandoned quarries
Quarries in operation to implement better handling operational facilities with pollution control facilities.

Environmental Status Report of Navi Mumbai Municipal Corporation-2016-17
88
Abandoned quarries can be restored by sanitary land filling with innocuous inorganic
wastes, especially construction debris by adopting suitable slopes from stability angle
and with due compaction.
Protection of Mangrove-Wetland ecosystem
High Court gave orders to NMMC for protecting mangroves (Kandalvan) under NMMC
jurisdiction area from destruction caused by illegal dumping in mangrove area. Various steps were taken by NMMC during 2016-17 for protecting mangroves. They are as follows
Appointing all Section Officer as Nodal Officer by NMMC for preventing illegal
dumping and to take necessary action in case of any illegal dumping.
Toll free hotline numbers for all wards for grievances against mangrove destruction
has been commissioned. Also responsible citizens can click photos of such illegal
activities and send it on WhatsApp number availed by NMMC. Citizens can also
register complaint or upload photos on nmmconline.com (egrievance).
As per High court’s order, putting any sign boards/posters, banners in or near
mangrove area (ecologically sensitive places) is punishable under Environment Protection Act, 1986.
Construction of curb stones for preventing entry of any vehicle for illegal dumping.
Mangroves from Vashi, Ghansoli and Airoli nodes were protected by removing encroachments and by putting fencing.
Created 2 Anti-debris mobile squad (Turbhe-Nerul-Vashi-CBD Belapur) and
(Ghansoli-Koparkhairne-Airoli-Digha) for monitoring of illegal activities in mangroves region.
Several Police cases against mangrove destruction were registered
All this efforts for mangrove protection were appreciated in a meeting chaired by Regional/Divisional Commissioner, Konkan division.
Proposed Activities
Increase Mangrove cover by undertaking mangrove plantation drives
Installation of CCTV’s in mangrove area to have surveillance check on trespassers and illegal activities
NMMC is planning to conduct many Mangrove Plantation Drive and construction of Mangrove Park in Airoli.
Informative sign boards and signage’s to be put up in mangrove forest indicating the
punishment for trespassers
NMMC proposes to set up bird watching towers near the mangrove area for the citizens of Navi Mumbai in order to increase awareness among citizens regarding
significance of migratory birds. This initiative will also allow citizens to connect with
nature.

Environmental Status Report of Navi Mumbai Municipal Corporation-2016-17
89
Solid Waste Management
Solid Waste Management, especially in urban areas, is one of the most critical issues these days. Solid Waste refers to trash or garbage discarded as unwanted or refuse arising from residential, institutional, commercial, industrial activities. SWM (Solid Waste Management) is a discipline which is associated with control of generation, storage, collection, transport, processing and disposal of solid waste materials while considering public health, economics and environmental aspects. Apart from residential and commercial areas Navi Mumbai has a strong presence of industrial area and a strong network of hospitals and medical facilities which generate diverse categories of waste. The following section discusses the various categories of waste generated and their disposal technique in Navi Mumbai.
Municipal Solid Waste
Consumption of resources leaves behind waste in various forms and consumerism, urbanization, penetration of use-and-throw concepts, irresponsible disposal of plastic (poly-ethylene), excessive use of packaging materials, plastic, styro-foam and so on has increased waste generation manifolds. Our changing lifestyle has further added to a diversity in waste generation ranging from food to clothes, plastics to E-waste. If non-disposed responsibly this waste accumulation may lead to various environmental as well as health issues.
NMMC is responsible for Municipal Solid Waste Management in NMMC area and it has appointed private contractors in 91 zones (including Thane Belapur Industrial Area) on day for collection, transportation and disposal of waste on day to day basis. NMMC collects and disposes the solid waste at the Turbhe scientific landfill site after appropriate segregation and processing of the waste as well as the leachate collected.
Source and Composition
In the year 2016-17, it is estimated that on an average around 726 Metric Tonnes (MT) of
solid waste/day was generated in NMMC area which is almost 30 tons more as compared to
the last year. As seen in Figure No. 36, the solid waste in NMMC mainly consists of biodegradable waste from the residential and commercial areas followed by plastic, paper
and so on. Metal waste possess the lowest share in total composition of solid waste. The
main source of solid waste is from the residential areas comprising of household waste, accounting to more than 92% (672 MT) of the total waste. Also considering the breakup of
the waste generated from the residential sector (Table No. 33)highest quantity (108.58
MT/day) of waste was generated and collected from Turbhe node, while lowest (32.50 MT/day) quantity of waste was generated from Digha node. The presence of APMC
(Agriculture Produce Marketing Committee) right within the city is also a major source of
solid waste, and accounts to about 7.1% (51.69 MT) of the total solid waste generated in the city. NMMC is also responsible for collecting and disposing the non-hazardous waste
generated by the industries in the MIDC area.

Environmental Status Report of Navi Mumbai Municipal Corporation-2016-17
90
Figure No. 36: Composition of solid waste in NMMC
Source: Environment Laboratory, NMMC
Collection
The services offered by the department of Solid Waste Management department in Navi
Mumbai can be broadly classified into two categories which are majorly operated through
private contractors.
1. Daily road sweeping and cleaning of storm water drains prior to monsoon and
2. Solid Waste collection and Transport.
Solid Waste Collection is carried out for the entire city (108.63 sq.km) covering about 6343 units of housing societies, around 3977 units of Industries and 800 units of commercial
establishments. The total number of household covered is estimated to be around 2.99 Lakhs
through door to door collection (bell ringing) on daily basis thus ensures almost 100%
coverage for solid waste collection. A significant numbers of dustbins are provided in each
node of NMMC and at market places. There are total 14,660 bins (80L- 238, 120L-6300, 240L-
7525 and 1.1m3 – 598) across various nodes of the city. The node wise distribution of green and blue dustbins, 120 Liters and 240 liters has been presented in Table No. 33.The green
bins are used to collect the wet waste while the blue for dry waste.
Domestic solid waste from houses is mechanically collected and loaded in refuse transportation vehicles by transportation contractors. Around 483 persons are employed for
waste collection and disposal at dumping site. The transportation vehicles used for the
collection and transportation of solid waste is provided below in Table No. 35.

Environmental Status Report of Navi Mumbai Municipal Corporation-2016-17
91
Table No. 34: Node wise quantity of daily MSW generated and number of dustbins in NMMC
(2016-17)
Sr.
No Node Ward
Average daily
MSW generation
(Metric tons)
Number of Dustbins
120 Liters
(green and
blue)
240 liters
(green and
blue)
Total
1 Belapur A 99.89 1987 1504 3491
2 Nerul B 101.11 968 1277 2245
3 Vashi C 85.25 939 815 1754
4 Turbhe D 108.58 439 958 1397
5 Koparkhairane E 106.10 1110 915 2025
6 Ghansoli F 63.29 111 643 754
7 Airoli G 74.44 716 1309 2025
8 Digha H 32.50 30 104 134
Subtotal 671.16 9 APMC 51.69
10 Others 2.5
Total 725.35
(approx 725) 6,300 7,525 13,825
Source: Department of Solid Waste Management, NMMC
Sweeping
Daily sweeping in NMMC area is undertaken through private contractors. The city has been
divided into 8 administrative divisions which are divided into 91 sub-divisions for monitoring purpose. A total of 1317 km length of road is swept everyday an average one
sweeper sweeps 700 running meters of road length. The total number of sweepers employed
for this purpose is 2646 and sweeping is conducted daily for about 8 hours starting in the morning.
NMMC has 8 mechanical sweepers for efficient sweeping of roads. About 196.16 km road is
swept by the sweeping machines per day. The sweeping machines are fitted with suction technology, water sprinklers and brushes which are used to collect dirt, sand, pebbles and
scattered leaves from the road. A list of equipment owned by the contractor are Fibre bins
(1856), Hand Containers (148), Grass cutting Machines (89) and Flippers (408).
Table No. 35: List of vehicles used for collection and transportation of solid waste
Sr. No Type of vehicle Total no. of vehicles
1. 16 TGVW Compactor 45
2. 10- 11 TGVW Compactor 24
3. 15 GVW Mini Truck 50
4. Green waste vehicle 8
5. Inspection vehicle 5
6. Washing Jet hyper spray vehicle 2
Source: Solid Waste Department, NMMC

Environmental Status Report of Navi Mumbai Municipal Corporation-2016-17
92
Segregation, Processing & Scientific Disposal
Landfill Site – Basic Details
NMMC has its own sanitary landfill site at Turbhe, spread over 65 acres, which receives
municipal solid waste daily for segregation, processing and scientific disposal. It is
estimated that in the year 2016-17 the Turbhe landfill site received around 725 MT waste per day. The sanitary landfill has been protected, from stray dogs and trespassers, by
constructing a compound wall along the periphery. Trees of various species are planted
around the periphery of landfill site. Completed phases of sanitary landfill are covered with grass and reduce the direct emissions of ‘Greenhouse gas’, the landfill gas (majorly methane)
is flared. Air Quality Monitoring Station present at this site helps to monitor air pollution
from this integrated solid waste disposal facility at Turbhe.
Landfill site produces sizable amount of leachate which needs to be treated to prevent
contamination of ground water table. For this purpose, LTP (Leachate Treatment Plant) was
commissioned in 2011-12 where leachate gets recycled through Sequencing Batch Reactor (SBR) technology. The LTP has a design capacity of 60 KLD and on an average has a load of
25 KLD during non-monsoon months while during monsoon months the load reaches to
about 50 KLD. The treated leachate is sprayed on the windrow composting pile-stocks to help maintain temperature of the windrows. The leachate water is regularly sampled and
the quality of water is tested each year
Picture No. 17: Satellite picture and schematic layout depicting sections at Turbhe landfill site
Picture source: Google Maps
Composting unit
Segre
gation
Un
it
Plastic B
ailing U
nit
RDF
Unit
LT panel room
Leachate Unit
Admin Block
CCoonnffeerreennccee RRoooomm
Weigh Bridge
HT Panel
Room
Vehicle Repairing Shed
Mo
nso
on
She
d

Environmental Status Report of Navi Mumbai Municipal Corporation-2016-17
93
Quantification, Segregation and Disposal
At the land fill site in the waste processing plant, the waste is segregated into three sections namely dry, wet and mixed waste. From the dry and mixed waste, plastic is segregated and
transferred to baling unit which converts plastic pieces into small beads (LDPE granules).
These are then used for construction of roads and other industrial applications. The dry combustible waste like paper, cardboard, plastic and other corrugated materials are used to
produce a homogenous material known as RDF (Refuse Derived Fuel) which can be used as
a substitute for cement, lime plants or can be used to produce electricity. Other dry waste like glass, metal goes for recycling while wet waste converted to compost via windrows
technology. A schematic of the processing and the overview of the segregation and disposal
process is elaborated in Figure No. 37. While disposing the solid waste, de-odorant is sprayed to minimize the stench and nuisance which may be caused by flies and pests
Figure No. 37: The process flow diagram of the Municipal solid waste
Source: Solid Waste Department, NMMC
Table No. 36: Leachate analysis report at Turbhe site in NMMC
Parameters
pH D.O B.O.D C.O.D Chloride Sulphate Hardness
Influent 7.4 1.1 577 2524 1799.33 345.70 653
Effluent 7.4 5.9 51 385 807.17 245.20 351
Note: All Values are in mg/l except pH
Source: Environment Laboratory, NMMC

Environmental Status Report of Navi Mumbai Municipal Corporation-2016-17
94
Picture No. 18: Plastic Baling machine (Left) and Plastic agglomerate (right) at Turbhe landfill site
Response Initiatives
Segregation at Source
NMMC has initiated segregation of solid waste at the source for effective management and
disposal of solid waste. The domestic waste which comprises of the dry and wet waste is collected differently at the door which further helps reducing the extra work of segregating
the waste at the landfill site. In the year 2016-17, around 2,99,363 houses were covered on
door to door basis and around 422 MTs of segregated waste at source was collected on daily basis. At city level, NMMC has kept dustbins of various sizes (80,120,240 litres) and colours
like green (wet waste) and blue (dry waste) for segregation at each node. These dustbins are
kept outside hotels, schools, colleges, malls, stations and other public places. Also, NMMC has started disseminating red bins for e-waste collection. The initiative is currently on demo
phase which soon is going to implement on pilot stage throughout NMMC jurisdiction area.
Construction of Road from Solid Waste
NNMC has started using dumped plastic in making roads. Turbhe Landfill site which comes
under NNMC, where plastic waste is recycled and made in into granules. This granules
which are been made are mixed in tar (1% concentration) and used in making roads. NNMC has already started working with this plastic granules. Currently NNMC has started
working with plastic granules, only on 100 meters roads. NNMC has undertaken
construction of 10 such roads like the ones at Ghansoli underpass, MIDC Turbhe road and near Mahape Lake. For making plastic roads, plastic granules is mixed with tar and small
stones (ashpalt), then they are mixed together on very high temperature, this ready mixture
is used as wearing cot, on roads48.
48 http://www.freepressjournal.in/mumbai/navi-mumbai-municipal-repairing-roads-with-granules-made-out-of-waste-plastic/994341

Environmental Status Report of Navi Mumbai Municipal Corporation-2016-17
95
Picture No. 19: Road construction using Plastic waste at Turbhe MIDC
Anti-Plastic Drive (January 8th)
It is very important to control use of plastic considering harmful effects of plastic on the environment and human life. Towards this, an ‘Anti-Plastic Drive’ was organized at Jewel of
Navi Mumbai (Nerul) on 8th January, 2017 in collaboration with Sakal Group. Under this
initiative, around 3885 large sack (24100 kg) of plastic was collected from 322 places in NMMC jurisdiction area. Three vehicles were provided to each node to transfer all plastic
waste to Turbhe Solid Waste Management site for scientific processing. The plastic waste
was processed and converted into small plastic beads. NMMC is utilizing these plastic beads for constructing new concrete roads through modern technique.
Table No. 37: Node wise waste collection places and quantity of waste collected
Node Places Total plastic waste collected
(in kg)
CBD Belapur 45 2035
Nerul 75 3410
Vashi 36 1045
Turbhe 28 1490
Koparkhairne 96 9180
Ghansoli 21 2446
Airoli 15 2320
Digha 6 2174
Total 322 24100
Source: Public Relations Office, NMMC

Environmental Status Report of Navi Mumbai Municipal Corporation-2016-17
96
Red bin Initiative
NMMC has started E-waste collection as per Solid waste Management Rules, 2016. NMMC planned to place red bins for collection of domestic E-waste and hazardous waste like
deodorant sprays, room fresheners, and dead batteries.
Eco Friend Industries has been appointed by NMMC to collect e waste as sample on demo stage from red bins placed at NMMC headquarters at CBD Belapur, Wonders Park at Nerul
and at Inorbit mall, Vashi. The waste will be collected every fortnight by the appointed
firm49. Same work is going to be conducted on pilot scale through Eco Friend Industries and NMMC for which NMMC has displayed banners regarding this initiative.
Brand Ambassador for Swachha Navi Mumbai Mission Mr. Shankar Mahadevan, Singer and
Musician, motivated people about scientific disposal of E-waste. The segregation will start soon all over the NMMC jurisdiction area by providing red bins in residential societies,
railway stations, public places, malls, colleges and hospitals.
Scientific Closure of Old Wild Dumping Ground at Koparkhairne
Scientific closure of an old wild dumping ground at Koparkhairne, having an area of 17
hectare containing 20 lakhs M.T garbage was completed by NMMC. A network of wells to
collect trapped landfill gas (LFG) was laid and a flaring unit was installed at site to burn the LFG. Leachate collection tank was also constructed to collect the leachate which is being
treated before disposal. Treated sewage water from nearby Sewerage Treatment Plant is
being used for watering the lawn through Sprinkling System. NMMC has set a leading
example in closing existing open dumping ground and converting into lush green garden. In
the year 2013-14, grass layer for 22000 sq. mt area was laid to increase the green cover of the
garden. As part of the development of Phase II, a jogging track has also been set up which is highly appreciated by the citizens residing in the nearby localities. The closure of
Koparkhairne dumping ground and the sanitary landfill at Turbhe are ideal projects as per
Municipal Solid Waste (Management & Handling) Rules September 2000 and appreciated by visitors from World Bank, foreign missions, Municipal Commissioners from various state
and other visitors.
Proposed Initiatives
Decentralized biogas plants of 10-30 MT capacity to be installed at the ward level in order to generate energy which could be used for area lighting at the ward level.
Initiative to achieve 100% segregation of Municipal solid waste at source from all nodes under NMMC jurisdiction.
Under the banner of Swacch Bharat Mission, NMMC has planned to install a Waste to Energy plant in the module of 600 TPD which shall help convert the Refuse
derived fuel (RDF) to Energy.
NMMC is planning to set up a construction and demolition waste debris recycling plant realizing the need for conservation of environment.
Setting up of an E-waste recycling plant has been proposed by NMMC.
NMMC also plans to setup up a waste to energy plant based of biomass gasifier technology to process coconut shell waste and generate electricity. A pilot plant of
25kWe is proposed at the Turbhe land fill site and the power thus generated would
be used for area lighting.
49 http://www.thehindu.com/news/cities/mumbai/nmmc-comes-up-with-red-bins-for-e-waste-hazardous-waste/article18725901.ece

Environmental Status Report of Navi Mumbai Municipal Corporation-2016-17
97
Biomedical Waste
Medical care is crucial for human health but the waste associated with medical facilities
causes a direct impact on community, workers associated with healthcare industries and on
overall environment as it may be infectious, toxic, pointed, sharp, un-hygienic and so on. Hence it is crucial to scientifically manage and dispose biomedical waste to reduce its direct
impact on the environment as well as humans50.
According to Biomedical Waste Management Rules, 2016, it is mandatory to follow notified rules for all persons who generate, collect, receive, store, transport, treat, dispose or handle
biomedical waste in any form including hospitals, nursing homes, clinics, dispensaries,
veterinary institutions, animal houses, pathological labs, blood banks, research and
educational institutions, health camps, vaccination camps, forensic labs, blood donation
camps, first aid rooms of schools51.
Generation and Collection
The Navi Mumbai city generates sizable amount of biomedical waste due to presence of various and advanced healthcare facilities like hospitals, blood banks, dispensaries, research laboratories and so on in Navi Mumbai city limits. MWML (Mumbai Waste Management Limited) is the sole agency responsible for collection, Transportation & Disposal of Bio Medical Waste generated within the city. MWML has the consent issued by MPCB (Maharashtra Pollution Control Board) and an agreement with Navi Mumbai Municipal Corporation for the same. As of 2016-17, around 2033 establishments in NMMC area have been registered with MWML for disposing their biomedical waste.MWML has commissioned barcoding system to maintain the record of bags sale with barcode stickers, Waste receipt heath care establishment wise and Waste disposal batch wise. The average biomedical waste generated by the government run hospitals in NMMC, this year was around 13859.9 Kg (Error! Reference source not found.). Biomedical waste generated is collected from various government and private facilities by private contractor (MWML).
Picture No. 20: Vehicle (Left) and collection container deputed by MWML for collection of BMW
Source: Mumbai Waste Management Limited52
50 http://www.cwejournal.org/pdf/vol7no1/CWEVO7NO1P117-124.pdf 51 http://cpcb.nic.in/Bio_medical.php 52 http://www.mumbaiwastemanagement.com/bio-medical-divison.htm
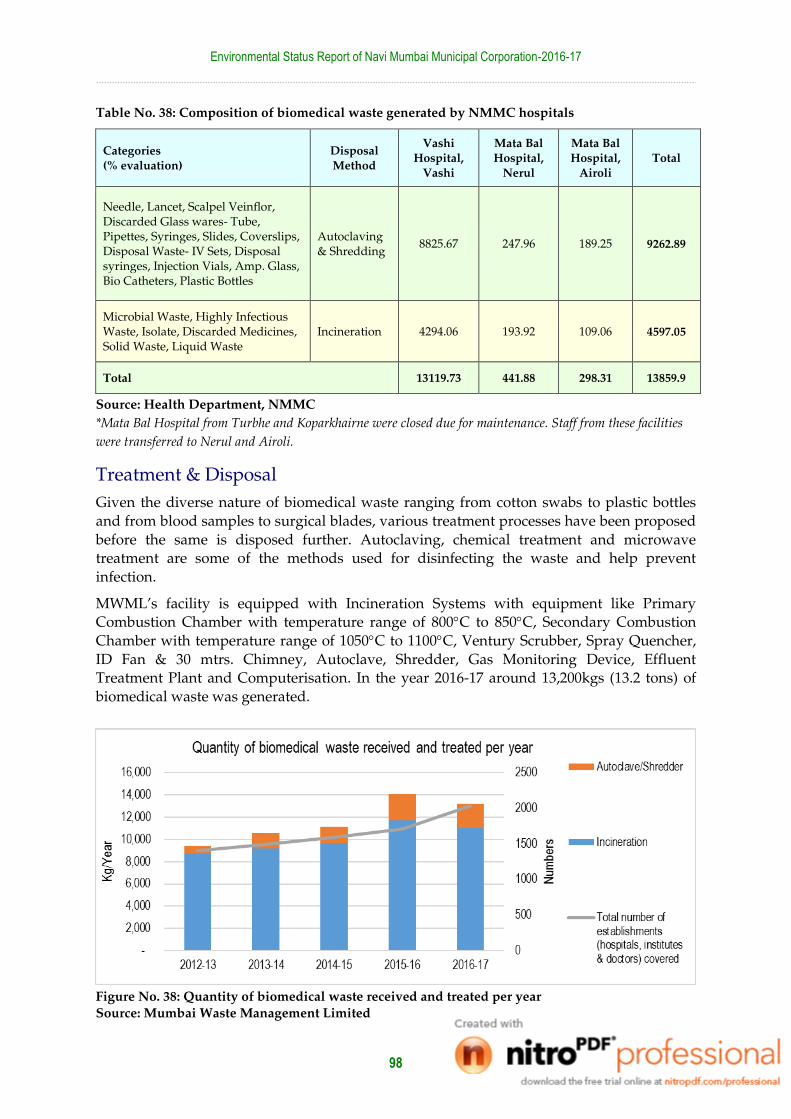
Environmental Status Report of Navi Mumbai Municipal Corporation-2016-17
98
Table No. 38: Composition of biomedical waste generated by NMMC hospitals
Categories
(% evaluation) Disposal
Method
Vashi
Hospital,
Vashi
Mata Bal
Hospital,
Nerul
Mata Bal
Hospital,
Airoli
Total
Needle, Lancet, Scalpel Veinflor, Discarded Glass wares- Tube, Pipettes, Syringes, Slides, Coverslips, Disposal Waste- IV Sets, Disposal syringes, Injection Vials, Amp. Glass, Bio Catheters, Plastic Bottles
Autoclaving & Shredding
8825.67 247.96 189.25 9262.89
Microbial Waste, Highly Infectious Waste, Isolate, Discarded Medicines, Solid Waste, Liquid Waste
Incineration 4294.06 193.92 109.06 4597.05
Total 13119.73 441.88 298.31 13859.9
Source: Health Department, NMMC
*Mata Bal Hospital from Turbhe and Koparkhairne were closed due for maintenance. Staff from these facilities
were transferred to Nerul and Airoli.
Treatment & Disposal
Given the diverse nature of biomedical waste ranging from cotton swabs to plastic bottles
and from blood samples to surgical blades, various treatment processes have been proposed
before the same is disposed further. Autoclaving, chemical treatment and microwave treatment are some of the methods used for disinfecting the waste and help prevent
infection.
MWML’s facility is equipped with Incineration Systems with equipment like Primary Combustion Chamber with temperature range of 800C to 850C, Secondary Combustion
Chamber with temperature range of 1050C to 1100C, Ventury Scrubber, Spray Quencher,
ID Fan & 30 mtrs. Chimney, Autoclave, Shredder, Gas Monitoring Device, Effluent Treatment Plant and Computerisation. In the year 2016-17 around 13,200kgs (13.2 tons) of
biomedical waste was generated.
Figure No. 38: Quantity of biomedical waste received and treated per year
Source: Mumbai Waste Management Limited

Environmental Status Report of Navi Mumbai Municipal Corporation-2016-17
99
Construction and Demolition Waste
C&D (Construction and Demolition) waste is generated whenever any
construction/demolition activity takes place, such as, building roads, bridges, fly over,
subway, remodelling etc. It consists mostly of inert and non-biodegradable material such as concrete, plaster, metal, wood, plastics etc. These wastes are heavy, having high density,
often bulky and occupy considerable storage space either on the road or communal waste
bin/container. Majority of this waste gets dumped along the roadside, wetlands, waterbodies, nallahs and storm water drains, thus choking them. Waste from small
generators like individual house construction or demolition, find its way into the nearby
municipal bin/vat/waste storage depots, making the municipal waste heavy and degrading its quality for further treatment like composting or energy recovery.
It is estimated that the construction industry in India generates about 10-12 million tons of
waste annually. Projections for building material requirement of the housing sector indicate a shortage of aggregates to the extent of about 55,000 million cu.m. An additional 750 million
cu.m. aggregates would be required for achieving the targets of the road sector. Recycling of
aggregate material from construction and demolition waste may reduce the demand-supply gap in both these sectors.
Under Swachh Bharat Abhiyaan, NMMC is in the process of establishing a 300 tons/day
capacity C&D recycling plant at its Turbhe Landfill facility. Around 5 acres of areas has been reserved to construct the facility on a PPP (Public Private Partnership) basis. An operator is
being identified who shall be lend his lift-on-call service to collect C&D waste and NMMC
also plans to install dedicated dustbins across the city for disposal of such waste. The plant
shall segregate the waste into sand, metals and stone dust and also use part of it to
manufacture paver blocks/tiles. Policy level modifications/interventions are under
discussion to decide (i) arrangement on levying of charges for collection of C&D waste and (ii) strategizing mainstreaming of usage of the products for usage in the construction sector.
Hazardous Waste
Hazardous waste is a waste with properties that make it dangerous or capable of having a harmful effect on human health or the environment. Hazardous waste is generated from
many sources, ranging from industrial manufacturing process wastes to batteries and may
come in many forms, including liquids, solids, gases, and sludges. They can be by-products of manufacturing processes or simply discarded commercial products, like cleaning fluids or
pesticides.
Navi Mumbai area comprises of a TTC (Trans Thane Creek) industrial area with diverse profiles like Chemical, Petro-chemical, Engineering, R&D laboratories, Pharma chemical
industries which generate hazardous waste. Towards this the TTCWMA (Trans Thane Creek
Waste Management Association) provides support for disposal of hazardous waste though secured landfill.
Generation, Collection and Disposal
Industries register their membership with TTCWMA upon which the member industry sends their waste representative sample of waste for analysis to identify
“Disposal Pathway”.

Environmental Status Report of Navi Mumbai Municipal Corporation-2016-17
100
As of now there are 1942 members which supply their hazardous waste for treatment
and disposal and the major category of hazardous waste treated by facility is ETP Sludge/ Sludge from Waste Water Treatment Plant which has a Solid texture.
In the year 2016-17 about 7216 MT of hazardous waste was collected and treated by
this facility, out of which around 6945 MT was disposed at the secured landfill site at this facility while the incinerable waste send to MWML, Taloja for incineration
TTCWMA has a NABL accredited laboratory for characterization of waste, effluent
and other environmental parameters.
After analyzing it, TTCWMA send MPCB authorized Hazardous Waste Transport
Trucks to the company.
Company fills Form No. 10 (Manifest form) [as per Hazardous Waste Management Rule 2016] and send the consignment to TTCWMA.
When these consignment comes to TTCWMA site, TTCWMA representative draw
samples from truck and again do the analysis to cross check the parameters and concentration.
Treatment of waste is done by addition of Lime, Cement and Fly ash.
TTCWMA has facility for secured landfilling. These waste is disposed in scientifically prepared secured landfill cells.
The total area allotted by MIDC to TTCWMA is 83,000 Sqr. Mtr and about 50% of the
area is utilized for landfill cells currently is about 45,000 Sqr. Mtr. The expected
lifespan of landfill cell is about 5-7 Years (depending on incoming Quantum of
waste)

Environmental Status Report of Navi Mumbai Municipal Corporation-2016-17
101
Health
Environment and Health
The relationship between environment and its impact on human health is highly complex
and the status of our surrounding environment immensely influences our health. Various environmental factors plays a significant role in cases of health hazards, in humans as well
as animals, globally and in developing countries in particular. These sources includes poor
access and quality of potable water, unplanned urban settlements, air pollution, rapid industrialization, improper waste management, lack of hygienic practices53. According to
WHO (World Health Organization), an estimated 12.6 million (1.26 crores) people died due
to unhealthy working and living environment in 2012 which accounted nearly 1 in 4 of total global deaths54. It has been observed that rate of contracting NCDs such as chronic
respiratory diseases, cardio-vascular disease increases in unhealthy environment.
Cities must have good healthcare facilities along with better environmental conditions to take care of its citizens especially during an epidemic outbreak or any medical emergencies.
There are many private and government hospitals in Navi Mumbai that are equipped with
latest technologies and specialist doctors, experienced staff which can handle any emergency cases. Day and night chemists are also available in the city. The following section presents
list of healthcare facilities (Table No. 39), status of various diseases, actions taken to
overcome or minimize such problems for the year 2016-17. The global standard for density of hospital beds the same is 3.5 beds per 1000 population55 and Navi Mumbai (2.2)56 has
better density of hospital beds as compared to national (0.7) but it falls short in terms of
global average (2.7) per 1000 population.
Table No. 39: Health care facilities in NMMC
2012-2013 2013-2014 2014-15 2015-16 2016-17
No. of Private Hospitals 184 184 188 197 198
Registered With NMMC 180 181 186 197 194
Dispensaries 158 184 191 184 135
Ayurvedic Clinics 351 377 386 377 315
Homeopathy Clinics 144 152 158 152 191
Bachelor of Dental Surgery 54 80 85 80 73
Pediatricians 75 75 75 75 75
Gynecologists 83 83 83 83 83
NMMC Hospitals 5 5 5 6 6
NMMC Dispensaries 20 21 21 21 22
NMMC Mobile Dispensaries 2 2 2 2 1
Private Dispensaries 797 865 920 920 849
Private Nursing Homes 76 81 81 81 81
Source: Health Department, NMMC
53 http://www.who.int/heli/publications/helirevbrochure.pdf?ua=1 54 http://www.who.int/mediacentre/news/releases/2016/deaths-attributable-to-unhealthy-environments/en/ 55 WHO Guidelines 56 This involves private as well as government beds

Environmental Status Report of Navi Mumbai Municipal Corporation-2016-17
102
Water Borne Diseases
Water borne diseases are any illness caused by intake of water contaminated with animal
and human faeces which contains harmful or pathogenic microorganisms. Over the last
decade, water related health issues have become more and more complex with emergence of new water related diseases and re-emergence of already existed ones. Gastroenteritis,
dysentery, Hepatitis-B, Typhoid are commonly observed water borne diseases in Navi
Mumbai. The total number of persons affected by water borne diseases are given below in Table No. 40 .The number of affected persons reduced drastically this year compared to last
5 years.
Table No. 40: Persons affected by Water borne diseases in NMMC
Area Patients Per node
2009-10 2010-11 2011-12 2012-13 2013-14 2014-15 2015-16 2016-17
CBD Belapur 14 21 10 8 5 8 12 2
Karave 21 27 7 6 1 4 8 12
Nerul 23 20 4 8 6 5 12 1
Nerul II 21 32 15 5 7 4 16 0
Shiravane 23 29 17 5 51 42 33 2
Sanpada 8 24 15 7 6 10 21 1
Indranagar 48 37 35 26 29 32 36 5
Turbhe 81 40 63 6 25 30 55 8
Vashi 22 19 16 22 18 12 14 3
Juhugaon 20 12 28 33 1 1 26 7
Khairne 81 38 23 28 52 48 41 11
Mahape 56 16 63 37 24 26 28 1
Pawane 8 15 7 28 18 12 18 4
Ghansoli 18 32 38 21 18 16 34 4
Rabade 3 4 6 8 13 11 12 1
Katkaripada 21 20 2 2 0 5 19 2
Airoli 29 22 86 40 25 25 34 1
Chichpada 50 11 8 3 3 2 12 0
Digha 11 14 13 9 10 8 21 1
Nagaon 0 - - - 2 0 0 0
Ilthanpada 0 16 16 5 4 1 16 1
NOCIL Naka 0 0 0 0 4 0 8 0
Total 558 449 472 307 318 302 476 67
Data source: Health Department, NMMC
As seen in Figure No. 39, the number of cases for gastro intestine diseases have decreased
drastically as compared to the past 2 years. There is almost 90% decrease (35 cases) in the number of cases if compared with the cases recorded last year (351 cases). Norovirus, is
known to cause gastroenteritis and commonly occurs due to consumption of contaminated
food and water. It is also contagious and may be caused upon being in contact with an infected person. A drastic decrease could also be recorded by almost 98% in the cases of
dysentery. The number of cases have decreased from 65 cases in 2015-16 to only 1 case in
2016- 17. Hepatitis-B cases increased by double from 6 cases in 2015-16 to 12 cases in 2016-17
while Typhoid also showed decreasing trend from 54 cases last year to 19 cases in 2016-17.

Environmental Status Report of Navi Mumbai Municipal Corporation-2016-17
103
Figure No. 39: Trend in cases of water borne diseases reported in NMMC area
Source: Health Department, NMMC
Vector Borne Diseases
Vector borne diseases are transmitted by vectors like mosquitoes, ticks and fleas. These
vectors can carry infective pathogens such as bacteria, viruses and protozoa which can be
transferred from one host to another. The Occurrence and distribution of vector borne diseases is greatly influenced by climatic conditions. These diseases are commonly found in
tropical and sub-tropical regions where many people do not get access to safe drinking
water and hygienic conditions. These diseases contributes for around 17% of total global burden of infectious diseases where Malaria is most common and Dengue is one of the
fastest growing vector borne disease in the world57.
Malaria
Plasmodium parasite is responsible for causing Malaria. The spread of parasites in humans
occurs through the bites of female Anopheles mosquitoes. There are five such parasitic
species that cause Malaria in humans out of which P. falciparum and P. vivax pose the greatest threats. The intensity of transmission of Malaria greatly depends on climatic
conditions. Malaria is more common in Tropical and subtropical climates. Table No. 41
enlists UHP wise total number of malaria cases reported by NMMC’s health department in the last 5 years. As seen in the table, a decreasing trend is been observed for the reported
malaria cases from the past 2 years. The number of cases have decreased from 396 in 2013-
14 to 242 in 2016- 17.
57 http://www.who.int/campaigns/world-health-day/2014/vector-borne-diseases/en/

Environmental Status Report of Navi Mumbai Municipal Corporation-2016-17
104
Table No. 41: UHP wise reported malarial cases in past five years in NMMC area
Source: Health Department, NMMC
Dengue
Dengue or Dengue Fever is a tropical mosquito borne viral disease transmitted be female mosquitoes mainly of the species Aedes aegypti. Dengue is spread throughout tropics and its
intensity of occurrence is influenced by rainfall, lack of hygiene and sanitation, unplanned
urban growth. Dengue fever is severe with symptoms like severe headache, nausea,
vomiting, muscle joints and skin rashes. In absence of effective medical treatment, it may
cause death of an individual. The disease could be prevented by following good practices
like covering, cleaning domestic water storage tanks periodically, preventing mosquito breeding sites through proper environmental management. As shown in the Figure No. 40,
the number of cases for Dengue fever have reduced (54) this year registering a decrease of
almost 29% than the cases recorded last year.
Response
NMMC’s health department is vigilant enough to check and initiate effective measures for
the control and eradication of diseases like Malaria & Dengue and water borne diseases. There is a special wing under the expert medical team established by NMMC for detection,
prevention, surveillance of these diseases and they actively run a control program for the
same. The NMMC has undertaken preventive as well as therapeutic measures to eradicate the vector-borne diseases.
Nodes/Year 2012-13 2013-14 2014-15 2015- 16 2016-17
CBD Belapur 14 18 20 30 13
Karave 14 33 34 31 24
Nerul 13 19 18 12 11
Nerul II 17 39 27 19 5
Shiravane 12 23 26 17 8
Sanpada 13 24 20 14 11
Turbhe 16 13 26 20 24
Pawane 7 27 24 24 23
Indiranagar 22 54 39 27 41
Juhugaon 0 2 3 3 1
Vashigaon 2 5 5 4 2
KoperKhairne 17 21 20 19 15
Mahape 6 8 6 6 6
Ghansoli 10 21 16 17 13
Rabade 5 8 6 5 6
Katkaripada 9 12 14 9 7
Airoli 4 10 8 10 6
Chinchpada 4 10 9 7 3
Digha 14 20 16 7 7
Ilthanpada 8 12 13 11 8
NOCIL naka 0 0 6 9 8
Total 207 396 356 301 242

Environmental Status Report of Navi Mumbai Municipal Corporation-2016-17
105
Figure No. 40: Total number of Dengue cases reported in Navi Mumbai
Source: Health Department, NMMC
Regular Preventive measures
Weekly anti-larval spraying and fogging through private contractors divided into 20 groups with 261 contract workers and 44 workers for fogging activity is undertaken
throughout area under NMMC jurisdiction. The program is implemented effectively
due to detailed data availability regarding usage and frequency of anti-larval spraying and fogging (Picture No. 21).
Guppy fish (Poecilia reticulata) is known to consume mosquito larvae and has been
also documented largely through research activities58. NMMC also undertakes various activities to cultivate as well as introduce guppy fishes at potential breeding
sites. A detailed inventory (Picture No. 21) of such breeding sites is conducted before
and after monsoon and currently, there are 11,372 guppy fish locations in NMMC. Every worker possesses information regarding Mosquito breeding sites, map
locations, breeding site and these guppy fishes are introduced periodically to control
the growth of mosquito larvae.
NMMC also undertakes action for appropriate treatment of the affected patients as
well as patients in the window period through a dual pronged approach. Direct and
Indirect. The Direct survey is conducted though Household visits and giving treatment to the patient after blood test. In construction and sensitive sites, weekly
visits are made and in other areas visits are made once every fortnight. In the indirect
survey, proper treatment is provided to patients after taking blood samples through Government hospitals, 4 Mata Bal hospitals and 21 Civilian medical centres. Mass
survey and medical camps are organised if deemed necessary.
Mosquito survey- The survey is done to check status of mosquitoes in particular area to prevent or control any occurrence or spread of mosquito borne diseases. This is
done by conducting a survey of mosquito infected areas for 15 minutes/site and
taking immediate measures if the mosquito density is high.
58 https://www.ncbi.nlm.nih.gov/pubmed/8815867
53
65
27
59
2722
39
24
2
76
54
0
10
20
30
40
50
60
70
80
2006 2007 2008 2009 2010 2011 2012 2013 2014 2015 2016
Nu
mb
ers
Years
No. of person affected by Dengue in NMMC

Environmental Status Report of Navi Mumbai Municipal Corporation-2016-17
106
Picture No. 21: Anti-Larval Spraying activity (Left) Inventory of Guppy Fish Breeding sites (right)
Initiatives taken to control Vector borne diseases in 2016-17
Campaign for awareness against Dengue and Malaria
Campaign was organized in April-May 2016 wherein 308244 houses were visited and
657309 breeding sites were surveyed, out of which 1401 were found to be active
breeding sites. From these sites, 499 breeding sites were destroyed and 902 sites were
treated.
June, 2016 was declared as Malaria Prevention Month and under this initiative, around
160 Malaria camp, 72 medical education in schools, 16 student’s march against malaria,
63 society meetings, and 17 private medical workshops were conducted.
July, 2016 was declared as Dengue Prevention month and workshops were arranged in
69 places. Total 2443 blood samples were collected and 2507 patients were treated.
Around 11205 brochures regarding malaria and dengue prevention were distributed.
Special Indoor Checking Campaign was undertaken during August, 2016 under which
179747 houses were checked. Out of 339512 possible breeding sites, 1246 were found
active which contained 300 Anopheles, 907 Aedes, and 39 culex sites which were
destroyed and others were treated.
During Ganesh-Utsav festival in September, 2016, awareness was done through camps,
banners, hoardings. Similar activities were performed in other months.
Guppy fish campaign was carried out in May, 2016 as a biological treatment for
mosquito problems. After brief survey, guppy fishes were released in 11372 sites in
which 6251 sites are permanent while 5121 are temporary Breeding spots. While anti-
Mosquito powder was sprayed in Government, private schools and colleges.
Apart from the above measures, MPCB and NMMC have also proposed different industries situated in the MIDC areas in Navi Mumbai to upgrade/improve existing effluent treatment systems59. Provision of good drainage systems as well as good treatment systems may reduce the number of casual water pools, which would contribute to the control of vectors such as mosquitos.
59 http://mpcb.gov.in/CEPI/pdf/Action%20Plan%20CEPI-Navimumbai.pdf

Environmental Status Report of Navi Mumbai Municipal Corporation-2016-17
107
Picture No. 22: Students an d staff members of NMMC schools taking P ledge during Anti Dengue
Month(left) and An awareness campaign during Ganapti utsav (right)
Preparedness for Swine Flu outbreak
1. Screening centres – NMMC is has 26 Screening centres for detection and diagnosis of
swine flu which are used in case of swine flu outbreak. 21 in civilian medical centres,
3 in Mata Bal hospitals and 1 each in NMMC public hospital (Vashi) and in D.Y.Patil
hospital (Nerul).
2. NMMC has 2 Isolation wards 1 in Vashi Public Hospital (8 beds) and other in
D.Y.Patil hospital (10 beds).
3. Vaccination of Isolation ward staffs for prevention against swine flu.
4. Medicines and other important equipment in case of swine flu outbreak have been
provided in stock with the screening centres and hospital authorities.
5. Training to people from various sectors has been given through workshops and
posters few of them are listed in Table No. 42.
Table No. 42: List of places and number of trainees trained against swine flu
Sr No Venue Participants
1 Arvato India Limited 500 workers
2 Sai Snehdeep hospital in Koparkhairne 45 staff members
3 Schools 146 Principals and students
4 Civil medical centre, CBD belapur 250 women
5 Private hospitals 207 Private hospitals

Environmental Status Report of Navi Mumbai Municipal Corporation-2016-17
108
Recent Achievements
Improvement is Animal Parasite Index (API) value from 18 in 1997 to 0.21 in 2016 due to effective prevention and control measures. According to State Government
circular, API value less than 2 indicates effective implementation of National Vector
Borne Disease Control Programme.
Success in controlling Dengue spread during September to November 2016 by
Health department.
National Vector Borne Disease Control Programme, Indian Government, New Delhi and Respected Joint Director of Disease control Programme praised the work done
by NMMC for controlling spread of such diseases and designated it as a Role Model
for other Municipal corporations.
Air Borne Disease - Tuberculosis
Airborne diseases are caused by pathogenic microbes that transmits through air as a
medium. These microscopic pathogens gets discharged from an infected person via
coughing, sneezing, laughing or close personal contact. The discharged microbes remains in
air on dust particles and water droplets. Infection occurs once these microbes gets inhaled or
comes in contact through touch. Tuberculosis is an Airborne disease caused by one species
of Mycobacteria, called Mycobacterium tuberculosis. TB is a major cause of human deaths in
India which kills more than 3,00,000 persons every year60.This bacteria can attack any part of
the body but particularly it attacks on Lungs, condition called as Pulmonary TB. The
common symptoms of Pulmonary TB includes fever, chest pain, Loss of appetite, cough, and
weight loss. When an infection occurs in other parts of the body, outside lungs then the
condition is called as extra pulmonary TB.
NMMC is continuously implementing a TB eradication program in the region. It could be
observed from that the number of cases recorded for tuberculosis are showing an increasing
trend for the past 5 years. The total no. new and re treatment cases have increased by 6.3%
from the year 2015 (1795) to 2016 (1909). Along with preventive measures, NMMC is also
planning to have awareness programs to sensitize the citizens about the impacts and threats
of TB. All civic hospitals in NMMC are well equipped to treat TB patients.
60 http://www.tbcindia.nic.in/index4.php?lang=1&level=0&linkid=382&lid=2748

Environmental Status Report of Navi Mumbai Municipal Corporation-2016-17
109
Figure No. 41: Total number of cases and deaths reported due to TB in the past five years Source: Health Department, NMMC
Response
NMMC’s Health department is regularly monitoring spread of air borne disease like Tuberculosis (TB). The department has taken various initiatives and providing facilities like
free medical checkup for TB detection and free medicines from NMMC affiliated hospitals,
health posts, NGOs. The NMMC has undertaken preventive as well as therapeutic measures to eradicate TB.
Provision of Providing DOTS (Directly observed treatment, short course), also
known as TB-DOTS everyday instead of 3 days in a week from current year. These DOTS are available in NMMC affiliated hospitals, NGOs, heath posts.
Conducting Cartridge Based Nucleic Acid amplification Test (CB-NAAT) on MDR
(Multi-Drug Resistance) and XDR (Extensively Drug-Resistant) TB patients and providing medicines free of cost.
Periodic training to hospital staffs and conducting TB eradication program.

Environmental Status Report of Navi Mumbai Municipal Corporation-2016-17
110
Annex–I: Calculation of indices
Approach
The information on environmental parameters is often too complex and non-
comprehendible to non-environmental professionals. The problem is further complicated as environment covers broad spectrum of areas from air quality to biomedical waste
management. The goal of assessing status of environment is planning for sustainable
development by ensuring that quality of life of the people is maintained and, if possible, improved while maintaining quality of environment.
The findings of present environmental assessment are discussed in details in the earlier
sections and same have been used in this section for computations of indicators. The basis has been maintained same to assess the change in environmental status in NMMC area for
the current year.
Methodology
Three indicators have been used in the present assessment:
Environmental Quality Index (EQI);
Urban Infrastructure Index (UII); and
Quality of Life Index (QOLI).
For computation of EQI, ambient air quality (in residential areas & traffic junctions), noise
levels in residential areas & traffic junctions), quality of drinking water, quality of surface
water, quality of ground water, adequacy of sewage treatment, adequacy of solid waste treatment, and adequacy of biomedical waste treatment are used as parameters. While air
quality, noise levels and drinking water quality affects human health both in short term as
also in long-term, impact of changes in other parameters are comparatively less important in short-term. Hence, while computing EQI following procedure has been used:
Out of total score of 100, scores have been assigned to individual parameter based on
importance. This is termed as Parameter Importance Unit (PIU).
For assessing status of individual parameter, a scale has been developed by assigning zero
score to totally un-acceptable parameter measurement and 1 score to desired parameter
measurement. This is termed as Parameter Environmental Quality (PEQ). For various measurements of parameter in NMMC, PEQ has been estimated based on data collected for
ESR, and values have been averaged to estimate overall PEQ for NMMC area.
Environmental Quality Index (EQI) for an individual parameter has been worked out by multiplying PEQ and PIU.
Values of EQI for all parameters have been added to compute EQI.
Using this method, if values of all parameters are as desired ones the value of EQI will be 100.

Environmental Status Report of Navi Mumbai Municipal Corporation-2016-17
111
For assessing UII, population density, water supply system, sewerage system and storm
water collection system, solid waste collection system, slum development, health facility, educational facility, public transport, employment opportunity, parks & gardens, roads
network, entertainment facilities, and public grievance redressal mechanism have been used
as parameters. As assessment of infrastructure facility is more a subjective judgment than quantitative evaluation, a seven-point scale has been used for evaluation of UII for
individual parameters as follows:
Very Poor: 0.0
Poor: 0.20
Satisfactory: 0.40
Good: 0.60
Very good: 0.80
Excellent: 0.90
Outstanding: 1.00
Values of UII for individual parameters have then been converted into percentage for easy
comprehension. Quality of Life Index has been computed as average of EQI and UII.
Estimation of Environmental Quality Index
The importance assigned to various parameters selected for computing EQI and scale used
for assessing the present status is presented in Table No. 43: Assignment of importance units and PEQ scale for parameters selected for computing EQIPEQ for individual parameters
have been computed based on data collected for ESR. Overall EQI is summarised in Table
No. 43 while details of computation are presented in Table No. 44 EQI computed for various nodes of NMMC and it has been found out that present EQI in NMMC area is 73.66%.The
detailed parameters for EQI is tabulated in Table No. 44.
Estimation of Urban Infrastructure Index
In the case of urban infrastructure, mere numbers may be misleading (e.g. average per capita
water supply may be satisfactory but due to uneven distribution satisfaction level may be
low). Hence, for computing UII subjective assessment has been used. Results of computation
are presented in Table No. 1
It has been found out that present UII in NMMC area is 81.76 %.
Estimation of QOL
Quality of environment and availability of infrastructure facilities together decide quality of
life. As the impact of these considerations is synergistic, equal importance needs to be given
to both. Hence, QOL has been computed as average of EQI and UII. Present QOL Index for NMMC area has been worked out as 77.71%.

Environmental Status Report of Navi Mumbai Municipal Corporation-2016-17
112
Table No. 43: Assignment of importance units and PEQ scale for parameters selected for
computing EQI
Sr.
No.
Parameter Parameter
Importance
Unit (PIU)
Parameter Measurement for
PEQ = 0.0 PEQ = 1.0
A. Ambient Air Quality 15
A.1 Air Quality Index-Residential Area (RSPM) 10 200 0
A.2 Air Quality Index-Traffic Junctions (RSPM) 5 200 0
B. Ambient Noise Levels 15
B.1 Noise Level : Residential Area 10 100 0
B.2 Noise Level : Traffic Junctions 5 100 0
C. Ambient (Surface/Ground) Water Quality 15
C.1 Surface (drains) Water Quality, BOD mg/l 3 100 0
C.2 Surface (Lake) Water Quality, BOD mg/l 3 10 0
C.3 Ground (Well) Water Quality, BOD mg/l 3 100 0
C.4 Efficiency of Sewage Treatment Plants 6 0 100
D. Solid Waste Management 15
D.1 Solid Waste Collected, percentage 3 0 100
D.2 Solid Waste Segregation at Household Level,
percentage
2 0 100
D.3 Solid Waste Segregation at Disposal Site,
percentage
2 0 100
D.4 Solid Waste Recycle at Household Level,
percentage
2 0 100
D.5 Solid Waste Recycle at Disposal Site,
percentage
2 0 100
D.6 Biomedical Waste Collected, percentage 2 0 100
D.7 Road/Public Places Cleanliness * 2 0 1
E. Protection of Ecosystem 20
E.1 Protection of mangroves* 10 0 1
E.2 Protection of hills and quarry restoration* 10 0 1
F. Public Health 20
F.1 Drinking Water Quality, % samples fit for
drinking
5 0 100
F.2 No. of cases of water borne diseases in
node(cholera, Jaundice, Hepatitis)
5 100 0
F.3 No of cases of malaria in node 5 100 0
F.4 Cases of TB, percentage population affected 3 1 0
F.5 Control of Street Dogs* 2 0 1
Total 100
Note: (*) Measured as V.Poor =0, Poor =0.2 Satisfactory = 0.4, Good = 0.6, V. Good = 0.80,
Excellent = 0.90, Outstanding=1.0

Environmental Status Report of Navi Mumbai Municipal Corporation-2016-17
113
Table No. 44: Estimation of Environmental Quality Index
Sr.
No.
Parameter Environmental Quality Index, %
Max Average
2015-16
Average
2016-17
Variat
-ion
Remarks
A. Ambient Air Quality
A.1
Air Quality Index-
Residential Area (RSPM)
10 7.11 7.11 0.00 -
A.2
Air Quality Index-Traffic
Junctions (RSPM)
5 2.95 3.00 +0.05
Due to completion of construction of roads in MIDC area.
B. Ambient Noise Levels
B.1 Noise Level:
Residential Area 10 4.18 3.93 -0.25
Increase in vehicular population of the city and increase in honking & driving practices attributed to increase in noise levels.
B.2 Noise Level:
Traffic Junctions 5 1.59 1.58 -0.01
Due to rapid increase in vehicular population in the city and construction of ROB in Thane Belapur Road by MMRDA
C. Ambient (Surface/Ground) Water Quality
C.1 Surface (Drains) Water Quality,
BOD mg/l 3 2.20 2.32 +0.12
Decrease in BOD level of some Nallahs since NMMC conducted survey in Chemical industries along khairne Nallah.
C.2 Surface (Lake) Water Quality,
BOD mg/l 3 2.21 1.84 -0.37
Due to lack of proper security system for preventing contamination of lake water by washing of clothes
C.3 Ground (Well) Water Quality,
BOD mg/l 3 2.55 2.75 +0.20
Due to periodical cleaning & disinfection of wells.
C.4 Efficiency of
Sewage Treatment Plants
6 5.85 5.85 0.00 -
D. Solid Waste Management
D.1 Solid Waste Collected, percentage
3 2.85 2.94 +0.09 Micro planning in door to door garbage collection and change of
compactor capacity to 5T, 8 T & 10 T.
D.2
Solid Waste Segregation at
Household Level,
percentage
2 0.20 1.20 +1.00 Due to proper awareness and
monitoring of segregation of wet & dry garbage at household level. .
D.3
Solid Waste Segregation at Disposal Site,
percentage
2 1.70 1.90 +0.20
Due to proper segregation of wet & dry garbage at source and due to increase in operational efficiency of processing plant

Environmental Status Report of Navi Mumbai Municipal Corporation-2016-17
114
Sr.
No.
Parameter Environmental Quality Index, %
D.4
Solid Waste Recycle at
Household Level, percentage
2 1.60 1.60 0.00 -
D.5
Solid Waste Recycle at
Disposal Site, percentage
2 1.90 1.90 0.00 -
D.6
Biomedical Waste Collected, percentage 2 2.00 2.00 0.00 -
D.7 Road/Public
Places Cleanliness 2 1.80 1.80 0.00 -
E. Protection of Ecosystem
E.1 Protection of mangroves
10 8.00 8.50 +0.50 Due to appointment of Nodal Mangroves
Protection Committee by State Govt.
E.2 Protection of hills
and quarry restoration
10 6.00 6.00 0.00 -
F. Public Health
F.1
Drinking Water Quality, %
samples fit for drinking
5 4.86 4.76 -0.10 In rainy season increase in non-
potability of some village & slum area.
F.2
No. of cases of water borne diseases in
node(cholera, Jaundice, Hepatitis)
5 4.04 4.81 +0.77 Due to proper awareness and
organization of health campaigns
F.3 No of cases
of malaria in node
5 4.29 4.55 +0.26 Due to proper monitoring and control of breeding places of mosquitoes in NMMC area.
F.4
Cases of TB, percentage population
affected
3 2.52 2.52 0.00 -
F.5 Control of Street
Dogs 2 1.20 0.80 -0.40 Due to increase in no. of dog bites
Total 100 71.59 73.66 +2.07

Environmental Status Report of Navi Mumbai Municipal Corporation-2016-17
115
Annex–II: Details for determining
Environmental Performance Index
Thematic
Indicators
Primary
indicators
Data
variables Unit Instructions Source Value Score
Growth of
cities
Demographi
c growth (%
2001)
Population
growth rate %
Census 59.18 2
% of slum
population to
total
population
%
Census 16.66 10
Economic
growth
Work
participation
ratio
%
Census 260 10
% of people
below
poverty line.
%
Statistical
Handbook
s
0.17 10
% of budget
spent on
Environment
al
Infrastructur
e
Budget spent
on Bio
Medical
Waste,
Municipal
Solid Waste
and Sewage
Treatment
Plants to be
considered.
ULB
Budget 15 2
Industrial
growth
% of
polluting
industries to
total
industries
%
Number of
polluting
industries is
the number of
orange and
red category
industries. %
of these
industries to
the total
number of
industries to
be entered.
MPCB
Regional
Offices
51.84 4
Spatial
growth
(Decadal)
Population
density
Perso
ns/sq
Km
Census 10472 2
% of slum
area to city
area
%
Census 21 2
Environmental Status Report of Navi Mumbai Municipal Corporation-2016-17
116
Thematic
Indicators
Primary
indicators
Data
variables Unit Instructions Source Value Score
State of
Natural
resources
Landuse
% of green
area to the
total city area
%
Town
planning
departmen
t
38 10
Green area
per 1000
persons
Ha/p
erson
To be
calculated
from total
green area of
the city and
total
population of
the city.
Town
planning
departmen
t
3.72 10
Air Ambient air
quality Score
Refer to Box
A in Scoring
Details
worksheet for
assigning
values
MPCB
Regional
Offices
B 8
Noise Noise levels
B 8
Water Water
quality B 8
Energy
Per capita
energy
consumption
Kwh/
Annu
m
Maharasht
ra Energy
Developm
ent
Agency
930 2
Share of
renewable
energy in
total energy
consumed
%
0 0
Number of
hours for
load
shedding
hours
0 10
Human Crude death
rate %
Census 4.32 8
Infant
mortality
rate
%
Census 11.10 10
Urban
services
Water
Supply
Net LPCD
supplied lpcd
Water
supply
departmen
t
293 10
% of
households
connected by
%
100 10

Environmental Status Report of Navi Mumbai Municipal Corporation-2016-17
117
Thematic
Indicators
Primary
indicators
Data
variables Unit Instructions Source Value Score
service
connection
Unaccounted
for water %
19 6
Duration of
water supply hours
24 10
Staff per 1000
connections
Perso
ns 5.4 2
Sewerage
Sanitation
% of
population
catered to by
underground
sewer
network
%
Sewerage
Departme
nt
85 10
% area
covered with
collection to
total city area
%
85.00 10
Staff per 1000
connections
Perso
ns 1.05 2
Solid Waste
Mgmt
Total SW
generated
per capita
gm
Solid
Waste
Managem
ent
Departme
nt
463.5 4
Life of
landfill site Years
68 10
% of waste
disposed into
landfill site
to total waste
generated
%
100 10
% of waste
collected to
total waste
generated
%
100 10
% biomedical
waste treated
to total BM
waste
%
100 10
Transport Road area as
% of city area %
Town
Planning
Departme
nt
13.6 8
% of
population
travelling by
%
Regional
Transport
Authority
60.0 4

Environmental Status Report of Navi Mumbai Municipal Corporation-2016-17
118
Thematic
Indicators
Primary
indicators
Data
variables Unit Instructions Source Value Score
public
transport
Initiatives
for
improving
city
environme
nt
Environment
al awareness
and
education
Are the
training
programmes
for school
teachers on
Environment
al education
adequate?
Score
Qualitative
values to be
assigned
based on
extent of
initiative in
the
City/Town as
given below:
VH for Very
High
H for High
M for
ModerateL
for Low
A for Absent
H 6
To what
extent are
awareness
programs on
evironment
launched
during
festivals or
other times
of the year?
M 4
To what
extent
exhibitions /
street plays
etc organized
to spread
environment
al
awareness?
H 6
To what
extent does
the city/town
have any
local
Television
channel
running
programs,
advertisemen
ts related to
environment
M 4

Environmental Status Report of Navi Mumbai Municipal Corporation-2016-17
119
Thematic
Indicators
Primary
indicators
Data
variables Unit Instructions Source Value Score
sponsored by
the
respective
ULB?
To what
extent do the
local
newspapers
include a
section on
environment
sponsored by
the ULB?
H 6
Waste
Management
To what
extent has
the
segregation
of dry and
wet waste
substantially
reduced the
volume of
waste
disposed to
the landfill?
VH 8
To what
extent is
waste
management
decentralized
to NGO /
CBO?
M 4
To what
extent is the
activity of
recycling of
waste by
ragpickers
formalized
by the ULB?
VH 8
To what
extent is
management
of demolition
and
construction
waste
addressed in
M 4
Environmental Status Report of Navi Mumbai Municipal Corporation-2016-17
120
Thematic
Indicators
Primary
indicators
Data
variables Unit Instructions Source Value Score
the policy
and
regulations
of the ULB?
To what
extent is the
city/town
responding
to PPP efforts
in managing
hazardous
waste,
plastic,
electronic
waste and
waste oil?
VH 8
Slum
Improvemen
t
To what
extent are the
regularised
slum areas
formally
provided
with
sanitation
and
sewerage
facilities?
VH 8
To what
extent do the
residents of
slums have
access to
public health
centres and
regular
health
checkups?
VH 8
To what
extent are
adult
education
programs
run by the
ULB in slum
areas?
H 6
To what
extent is the
solid waste
in slum areas
VH 8

Environmental Status Report of Navi Mumbai Municipal Corporation-2016-17
121
Thematic
Indicators
Primary
indicators
Data
variables Unit Instructions Source Value Score
managed by
the ULB?
To what
extent does
the ULB have
regulations
on use of fuel
like banning
firewood and
providing
alternate
fuel?
L 2
Traffic
To what
extent are
paths
dedicated to
bicycle or
pedestrian
movement?
M 4
To what
extent are
steps taken
to prevent
adulteration
of fuel?
L 2
To what
extent are
clean fuels
like CNG
used?
M 4
Water
To what
extent does
the ULB have
regulations/
schemes
encouraging
Rain Water
Harvesting?
M 4
To what
extent do
building
codes have
regulations
for using
water saving
fittings and
fixtures?
M 4

Environmental Status Report of Navi Mumbai Municipal Corporation-2016-17
122
Thematic
Indicators
Primary
indicators
Data
variables Unit Instructions Source Value Score
To what
extent has
the ULB
taken
measures to
identify leaks
and reduce
water losses?
VH 8
To what
extent does
the ULB
check
whether the
water quality
is satisfactory
at the
consumers
end?
VH 8

Environmental Status Report of Navi Mumbai Municipal Corporation-2016-17
123
Annex- III - Category wise No of Vehicles
Registered in Navi Mumbai RTO
SN Catego
ry
Type of
Vehicle
Financial Year
Newly Registered during the year
05-06
06-07
07-08
08-09
09-10
10-11
11-12
12-13
13-14
14-15
15- 16
16-17
1 2-Wheelers
Motor Cycles
11201
14262
12716
11345
5235
16361
15188
17395
16525
17953
24354
22535
2 Scooters 2144
930 163
177 7547
271 81 - 0 0 0 0
3 Mopeds 5 0 0 0 0 0 0 - 0 0 0 0
4 4-Wheelers
Cars 4455
8082
11165
9586
10665
13042
13184
11808
8298 10841
10709
10345
5 Jeeps 25 342 217
162 160 222 104 - 0 0 0 0
6 Station Wagons
0 196 0 0 0 0 0 - 0 0 0 0
7(A)
Taxi/Autorickshaw
Taxi meter fitted
0 0 0 0 0 0 187 - - 0 0 3155
7(B)
Taxi Tourist Cabs
885 1010
1261
731 283 630 548 851 439 917 1966
8 Auto-Rickshaws
892 516 457
227 606 444 493 628 1663 3487
2445
1993
9 Buses Stage carriages
0 0 31 33 49 116 11 4 1 43 44 109
10 Contract carriages
94 131 346
337 209 314 251 - 35 248 334 164
11 School Buses
0 0 14 30 23 35 136 180 99 96 143 32
12 Private Service Vehicles
46 6 32 39 21 43 32 171 5 14 11 10

Environmental Status Report of Navi Mumbai Municipal Corporation-2016-17
124
SN Catego
ry
Type of
Vehicle
Financial Year
Newly Registered during the year
05-06
06-07
07-08
08-09
09-10
10-11
11-12
12-13
13-14
14-15
15- 16
16-17
13 Ambulances
6 4 41 24 35 39 28 10 16 37 18 18
14 Arti.& Muli. Vehicles.
10 43 0 0 0 2 0 30 - 0 0
15 Other Heavy Vehicles
Trucks & Lorries
1094
1316
2297
939 934 1717
1067
901 725 1655
2609
1057
16 Tankers 210 204 445
186 257 168 220 249 155 226 267 283
17 Delivery Van (4 wheelers)
864 1144
667
147 256 309 643 512 213 302 284 197
18 Delivery Van (3 wheelers)
966 2167
1501
978 1095
1237
1462
1565 1019 1602
1866
1129
19 Tractors 20 11 0 0 0 0 0 - 0 0 0 0
20 Trailers 0 347 778
428 460 694 381 438 230 351 364 344
21 Others 0 19 12 11 10 20 57 7 15 25 9 46