Electrospinning Organometallics to Produce Metallic … · Electrospinning Organometallics to...
47
Project Number: SYS - 2007 Electrospinning Organometallics to Produce Metallic Fibers A Major Qualifying Project Report Submitted to the Faculty of the WORCESTER POLYTECHNIC INSTITUTE in partial fulfillment of the requirements for the Degree of Bachelor of Science in Mechanical Engineering by Brendan Malloy ________________________________ Date: April 2008 Approved: _______________________________ Prof. Satya Shivkumar, Major Advisor
Transcript of Electrospinning Organometallics to Produce Metallic … · Electrospinning Organometallics to...
Project Number: SYS - 2007
Electrospinning Organometallics
to Produce Metallic Fibers
A Major Qualifying Project Report
Submitted to the Faculty
of the
WORCESTER POLYTECHNIC INSTITUTE
in partial fulfillment of the requirements for the
Degree of Bachelor of Science
in Mechanical Engineering
by
Brendan Malloy
________________________________
Date: April 2008
Approved:
_______________________________
Prof. Satya Shivkumar, Major Advisor
2
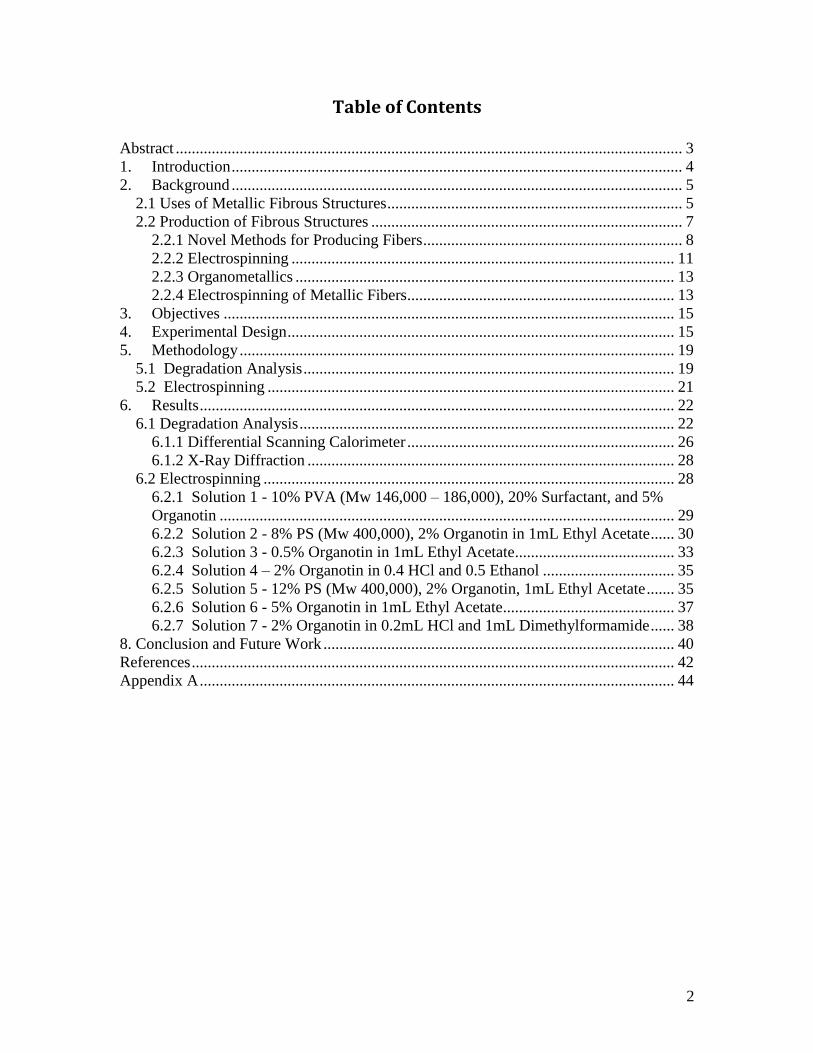
Table of Contents
Abstract ............................................................................................................................... 3 1. Introduction ................................................................................................................. 4 2. Background ................................................................................................................. 5
2.1 Uses of Metallic Fibrous Structures .......................................................................... 5 2.2 Production of Fibrous Structures .............................................................................. 7
2.2.1 Novel Methods for Producing Fibers ................................................................. 8 2.2.2 Electrospinning ................................................................................................ 11 2.2.3 Organometallics ............................................................................................... 13 2.2.4 Electrospinning of Metallic Fibers................................................................... 13
3. Objectives ................................................................................................................. 15
4. Experimental Design ................................................................................................. 15
5. Methodology ............................................................................................................. 19
5.1 Degradation Analysis ............................................................................................. 19
5.2 Electrospinning ...................................................................................................... 21 6. Results ....................................................................................................................... 22
6.1 Degradation Analysis .............................................................................................. 22
6.1.1 Differential Scanning Calorimeter ................................................................... 26 6.1.2 X-Ray Diffraction ............................................................................................ 28
6.2 Electrospinning ....................................................................................................... 28 6.2.1 Solution 1 - 10% PVA (Mw 146,000 – 186,000), 20% Surfactant, and 5%
Organotin .................................................................................................................. 29
6.2.2 Solution 2 - 8% PS (Mw 400,000), 2% Organotin in 1mL Ethyl Acetate ...... 30 6.2.3 Solution 3 - 0.5% Organotin in 1mL Ethyl Acetate........................................ 33
6.2.4 Solution 4 – 2% Organotin in 0.4 HCl and 0.5 Ethanol ................................. 35
6.2.5 Solution 5 - 12% PS (Mw 400,000), 2% Organotin, 1mL Ethyl Acetate ....... 35
6.2.6 Solution 6 - 5% Organotin in 1mL Ethyl Acetate........................................... 37 6.2.7 Solution 7 - 2% Organotin in 0.2mL HCl and 1mL Dimethylformamide ...... 38
8. Conclusion and Future Work ........................................................................................ 40
References ......................................................................................................................... 42 Appendix A ....................................................................................................................... 44
3
Abstract
The goal of this project was to fabricate nanowires by electrospinning an organometallic
solution and burning off the organic component of the compound. The degradation
properties of the organometallic were observed by direct heating in a furnace, differential
scanning calorimetry, x-ray diffraction and energy dispersive spectroscopy. Several
different solutions were electrospun resulting in the formation of both fibrous meshes and
spray coatings. Solutions containing a polymer displayed significant improvement in
viscoelastic properties, resulting in improved electrospinnability. After thermal
degradation, EDS analysis confirmed the presence of tin and tin oxide structures. The
addition of binding agents could facilitate the formation of more complex tin
microstructures.
4
1. Introduction
The field of nanotechnology has existed ever since the invention of the first electronic
devices. The promise of applying nanotechnology to medical treatment and the scaling
down of electronics, along with general miniaturization, has lead to a boom in the
development of this rapidly growing field [1]. The simple act of changing the size of a
structure can have profound effects on physical properties such as melting point,
electrical conductivity, and magnetic properties [1]. Material purity maximizes due to the
inherent lack of defects when working at such small scales. These new properties can
lead to more diverse applications. The ability to apply existing technology to the
development of nanomaterials could significantly facilitate research. One such
technology whose application could be expanded is electrospinning.
Electrospinning has already been used for years to produce polymer nanofibers
[1-4]. If electrospinning could be utilized to fabricate metallic fibers, completely new
materials possessing unique physical structures and properties could be produced. These
materials could see a variety of applications in their stand-alone form, such as filtration,
or they could be incorporated into composite materials. This study investigated the
fabrication of metal/metal-oxide fibers by means of electrospinning an organometallic
compound. The degradation properties of the chosen organometallic were analyzed by
thermally degrading the compound in a furnace, differential scanning calorimeter, x-ray
diffraction and energy-dispersive spectroscopy. The structures formed by electrospinning
different organometallic solutions were analyzed using a scanning electron microscope.
5
2. Background
2.1 Uses of Metallic Fibrous Structures
Metal bars and fibers have been used for decades to imbue existing materials with
superior mechanical properties. Steel rebar can be seen in use every day to reinforce
concrete structures. This same concept is applied, albeit at a much smaller scale,
when metal and ceramic fibers are used as composite matrices in the fabrication of
metal parts. These metal matrix composites can significantly improve frictional
properties, wear resistance, strength and thermal diffusivity [5-7].
Modern disc-brakes are composed primarily of cast iron or ceramic. Steel fibers
are incorporated into the cast to form a composite that offers much higher wear
resistance [7]. However, these steel fibers can result in aggressive warping of the disc
due to the high heats generated. Copper and aluminum fibers are often added to
improve thermal diffusivity and maintain the coefficient of friction at high
temperatures.
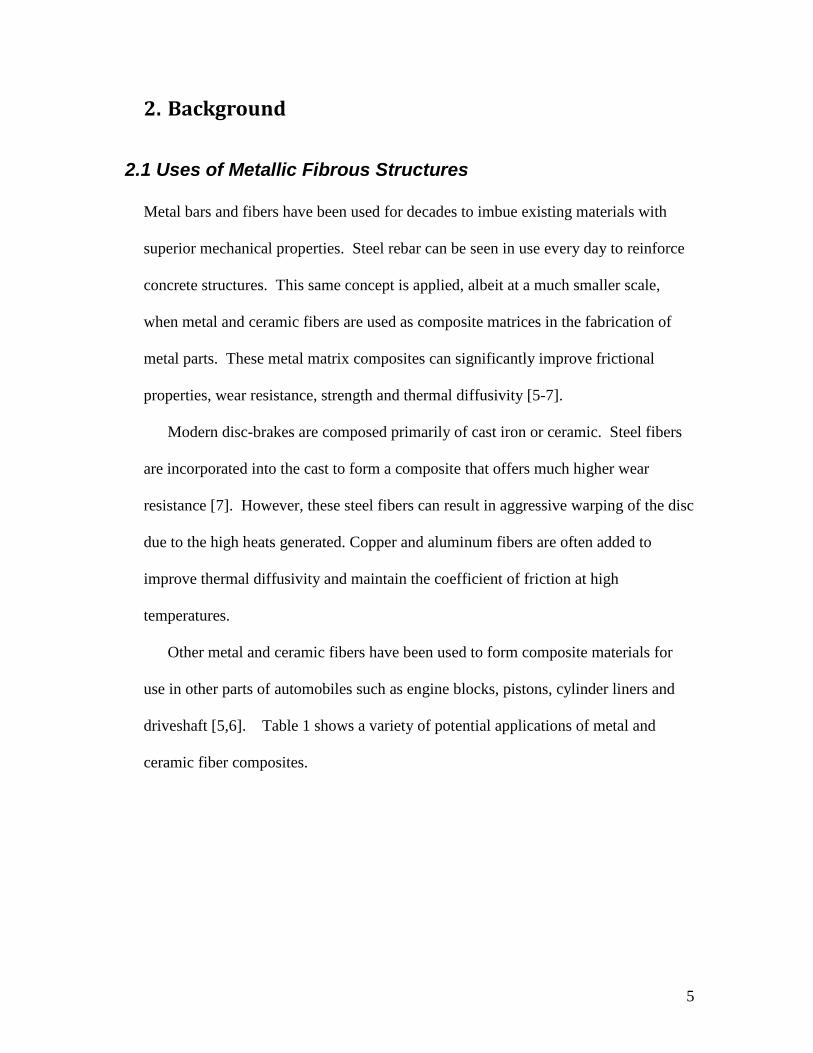
Other metal and ceramic fibers have been used to form composite materials for
use in other parts of automobiles such as engine blocks, pistons, cylinder liners and
driveshaft [5,6]. Table 1 shows a variety of potential applications of metal and
ceramic fiber composites.
6
Table i - Selected Potential Applications of Cast Metal Matrix Composites [5]
Composite Application Special Features
Gr / Al Bearings
Cheaper, lighter, self-lubricating; conserves Cu, Pb, Sn, Zn, etc.
Gr/Al, SiC-Al2O3/Al fiber, Al/FP
Automobile Pistons, cylinder liners, piston rings, connecting rods
Reduced wear, anti-seizing, cold start, lighter, conserves fuel, improves efficiency
Gr / Cu Sliding electrical contacts Excellent conductivity and anti seizing properties
SiC / Al Turbocharger impellers High temperature use
Glass or Carbon bubbles in Al Ultralight materials
Cast Carbon / Mg Fiber Composites
Tubular composites for space structures
Zero thermal expansion, high temperature strength, good specific strength and stiffness
Zircon/Al, SiC/Al, SiO2/Al Cutting tools, machine shrouds, impellers
Hard, abrasion resistant materials
Al-char, Al-clay Low cost, low energy materials
The fabrication of micro- and nano-fibers can result in the formation of porous
structures. These structures exhibit high surface area which can be utilized for use as
heat exchangers [8]. L. Tadrist et al. [8] have found that these porous structures
possess unique characteristics leading to strong thermal performance. The use of a
metallic matrix showed higher heat transfer than standard heat fins.
The porous nature of fibrous structures can also be utilized for filtration. Fibrous
bed filtration has been found to be an effective and efficient method for removing fine
dust from gas flows [9]. Filters composed of metallic fibers are desirable for use in
high temperature environments. Also, while standard flat filters use surface filtration
to stop particles, a fibrous bed can catch particles on the surface and inside the body
of the filter. Very fine particles that would otherwise travel through the filter can be
captured by electrostatic forces generated by the metal.
7
2.2 Production of Fibrous Structures
Large diameter metal fibers such as rebar are produced by pouring molten metal
in to casts. Smaller diameter metal fibers are typically fabricated by wire drawing. In
this process, a cylindrically shaped piece of stock metal is pulled through a die,
reducing the cross-sectional area. The sample is drawn through successively smaller
dies until the desired fiber diameter is reached [10].
Powder metallurgy (P/M) offers a method of part fabrication that allows the
porosity to be controlled. Metal powders are produced through a variety of methods
including atomization, reduction, and electrolytic deposition. These powders are
pressed into a mold of the desired part, forming a green compact. The size and shape
of the powder particles, combined with the pressured applied in the mold, dictate the
density and porosity of the final part [10]. The compact is then sintered at a
temperature lower than the
melting point, but high enough to
allow bonding, resulting in the
formation of the final part.
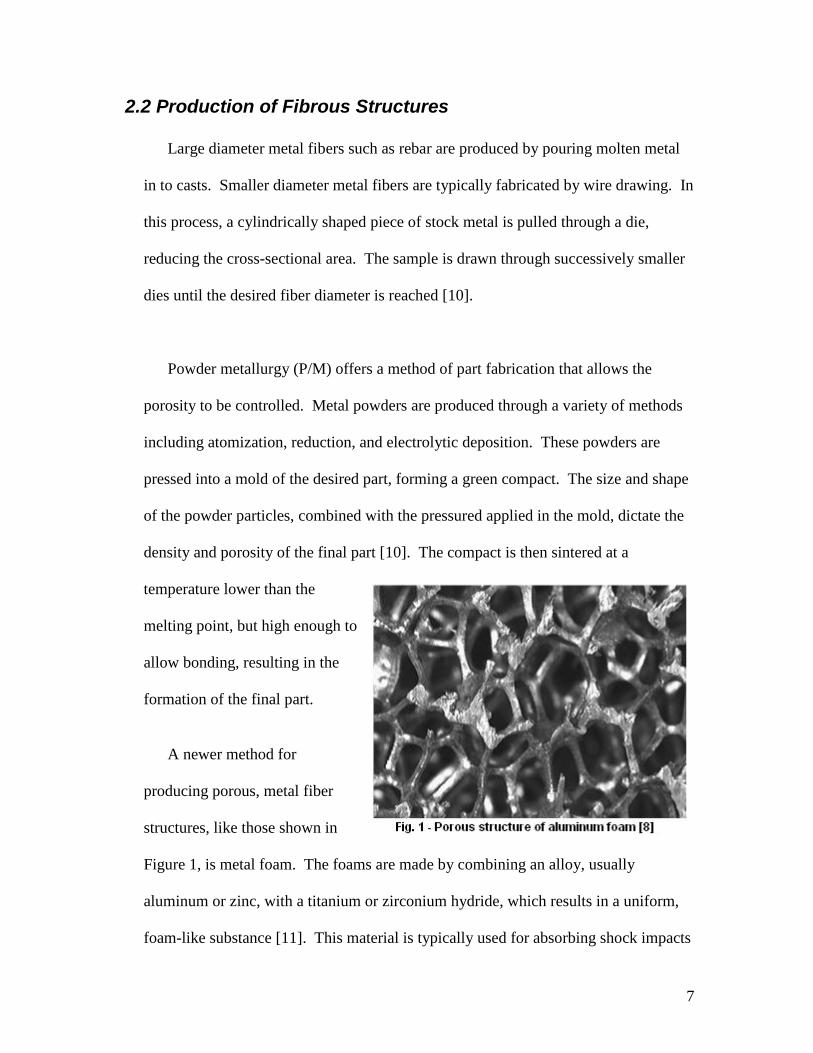
A newer method for
producing porous, metal fiber
structures, like those shown in
Figure 1, is metal foam. The foams are made by combining an alloy, usually
aluminum or zinc, with a titanium or zirconium hydride, which results in a uniform,
foam-like substance [11]. This material is typically used for absorbing shock impacts
8
without elastic rebounds and can be used as a substitute in some metal parts in order
to reduce weight.
2.2.1 Novel Methods for Producing Fibers
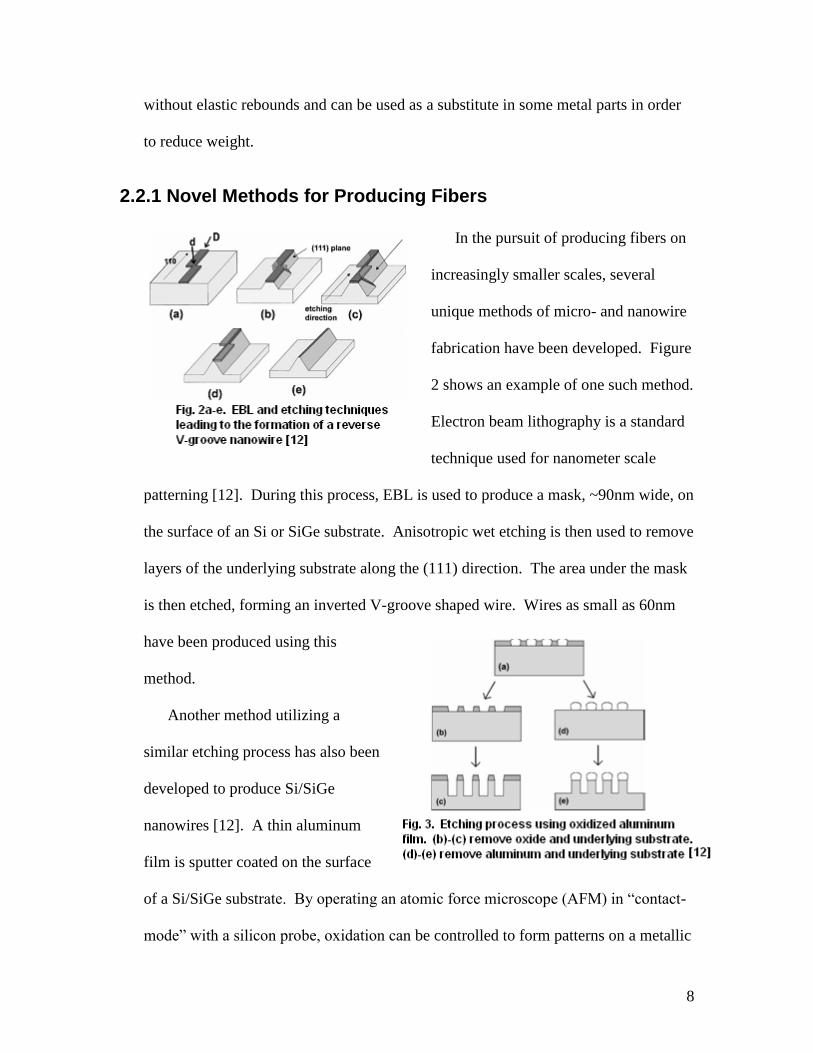
In the pursuit of producing fibers on
increasingly smaller scales, several
unique methods of micro- and nanowire
fabrication have been developed. Figure
2 shows an example of one such method.
Electron beam lithography is a standard
technique used for nanometer scale
patterning [12]. During this process, EBL is used to produce a mask, ~90nm wide, on
the surface of an Si or SiGe substrate. Anisotropic wet etching is then used to remove
layers of the underlying substrate along the (111) direction. The area under the mask
is then etched, forming an inverted V-groove shaped wire. Wires as small as 60nm
have been produced using this
method.
Another method utilizing a
similar etching process has also been
developed to produce Si/SiGe
nanowires [12]. A thin aluminum
film is sputter coated on the surface
of a Si/SiGe substrate. By operating an atomic force microscope (AFM) in “contact-
mode” with a silicon probe, oxidation can be controlled to form patterns on a metallic
9
sample. Using appropriate voltage and scanning rates, aluminum oxide lines are
patterned on the surface of the substrate. Increasing voltage increased the depth of
oxidation. Chemical etching can then be applied to remove either the oxide lines or
the remaining aluminum film. Further etching removes the underlying substrate
forming Si/SiGe nanowires as small as 60nm. An outline of this process is shown in
Figure 3.
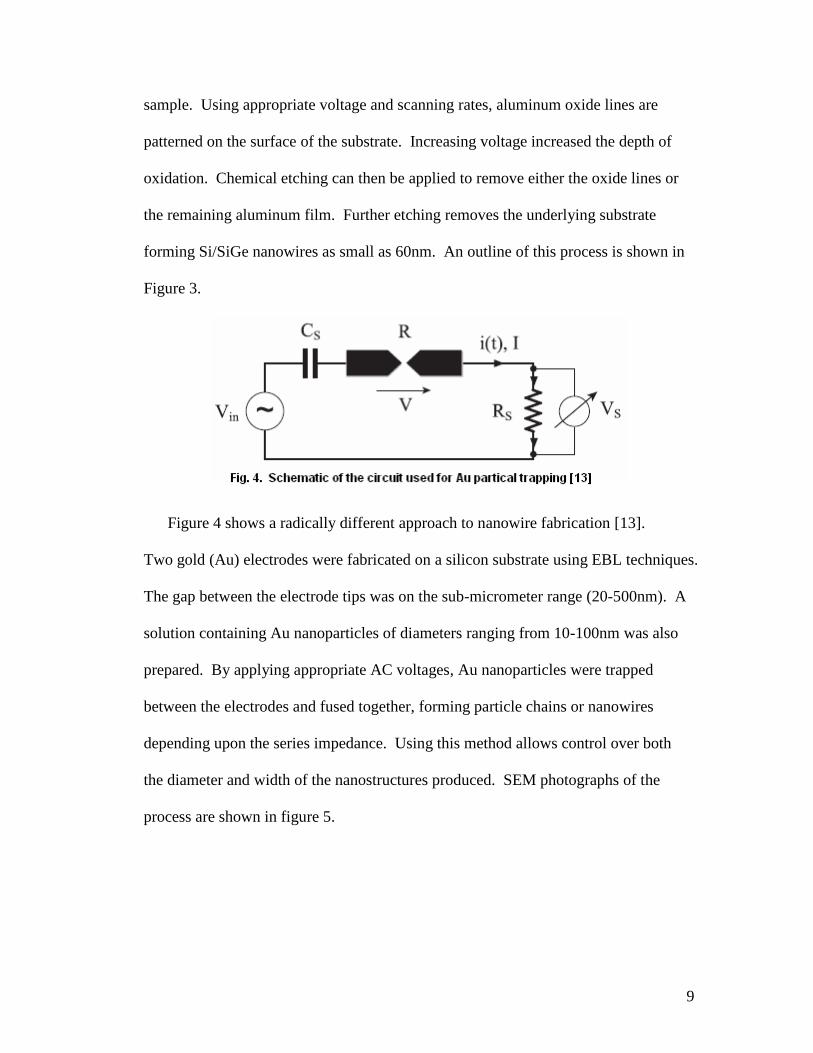
Figure 4 shows a radically different approach to nanowire fabrication [13].
Two gold (Au) electrodes were fabricated on a silicon substrate using EBL techniques.
The gap between the electrode tips was on the sub-micrometer range (20-500nm). A
solution containing Au nanoparticles of diameters ranging from 10-100nm was also
prepared. By applying appropriate AC voltages, Au nanoparticles were trapped
between the electrodes and fused together, forming particle chains or nanowires
depending upon the series impedance. Using this method allows control over both
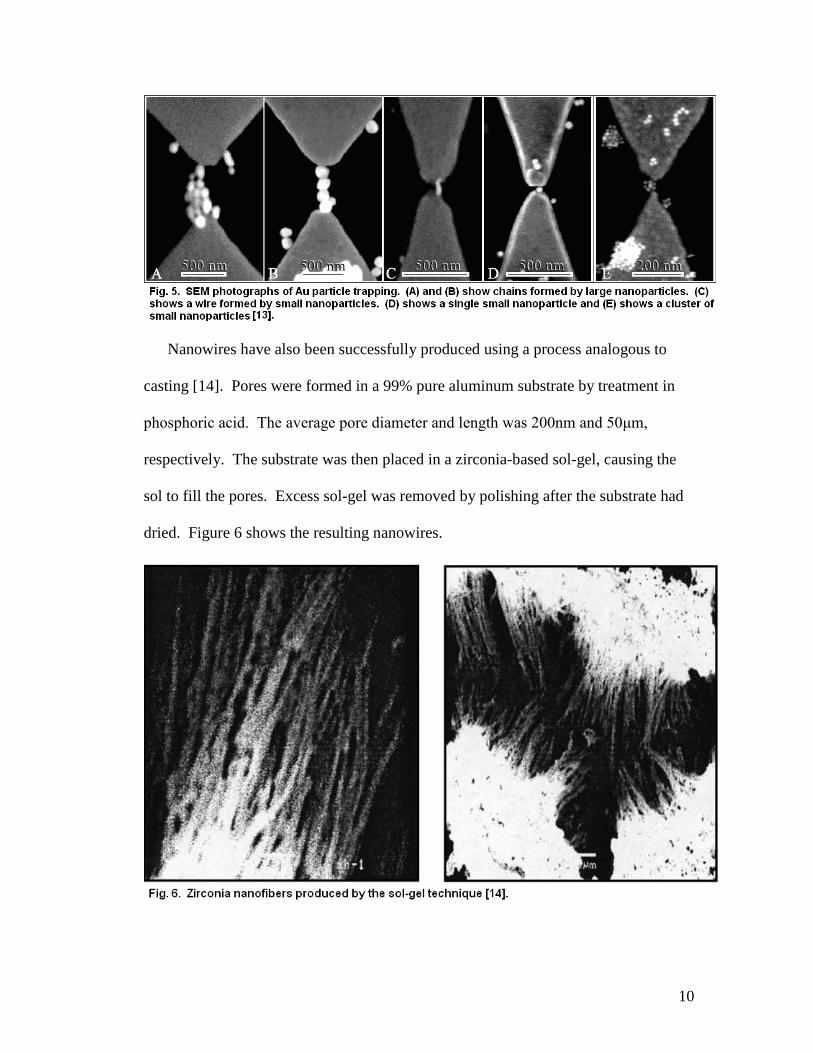
the diameter and width of the nanostructures produced. SEM photographs of the
process are shown in figure 5.
10
Nanowires have also been successfully produced using a process analogous to
casting [14]. Pores were formed in a 99% pure aluminum substrate by treatment in
phosphoric acid. The average pore diameter and length was 200nm and 50μm,
respectively. The substrate was then placed in a zirconia-based sol-gel, causing the
sol to fill the pores. Excess sol-gel was removed by polishing after the substrate had
dried. Figure 6 shows the resulting nanowires.
11
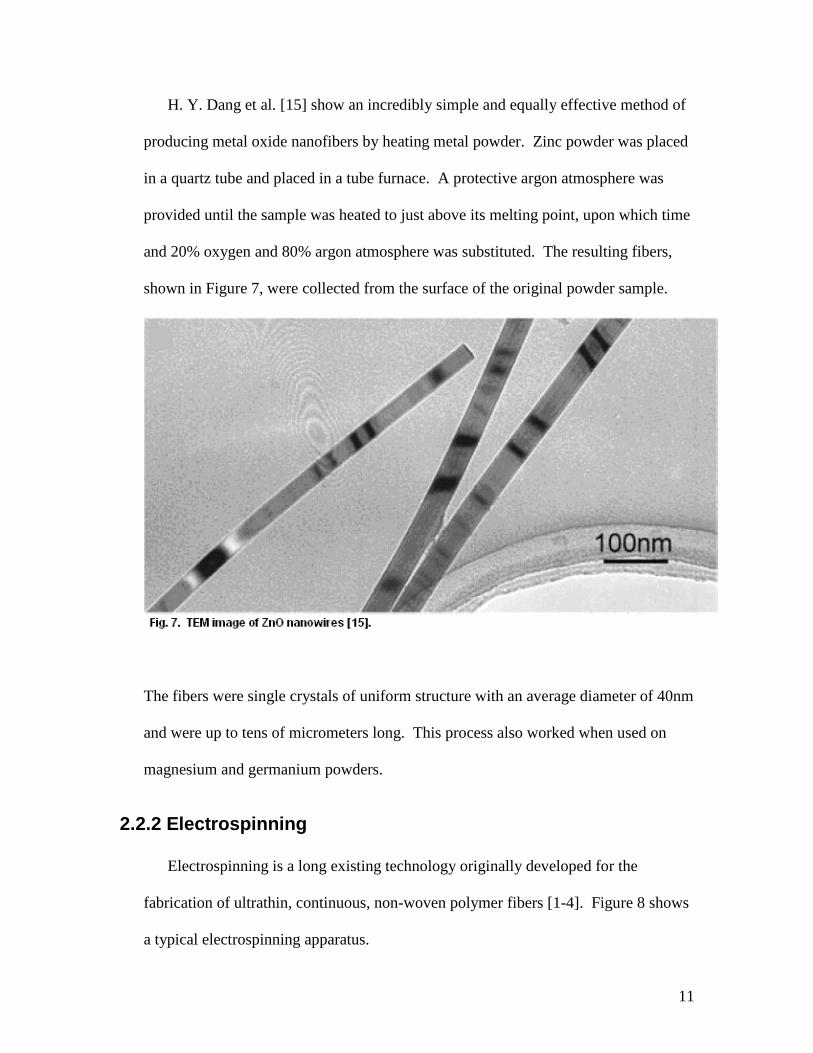
H. Y. Dang et al. [15] show an incredibly simple and equally effective method of
producing metal oxide nanofibers by heating metal powder. Zinc powder was placed
in a quartz tube and placed in a tube furnace. A protective argon atmosphere was
provided until the sample was heated to just above its melting point, upon which time
and 20% oxygen and 80% argon atmosphere was substituted. The resulting fibers,
shown in Figure 7, were collected from the surface of the original powder sample.
The fibers were single crystals of uniform structure with an average diameter of 40nm
and were up to tens of micrometers long. This process also worked when used on
magnesium and germanium powders.
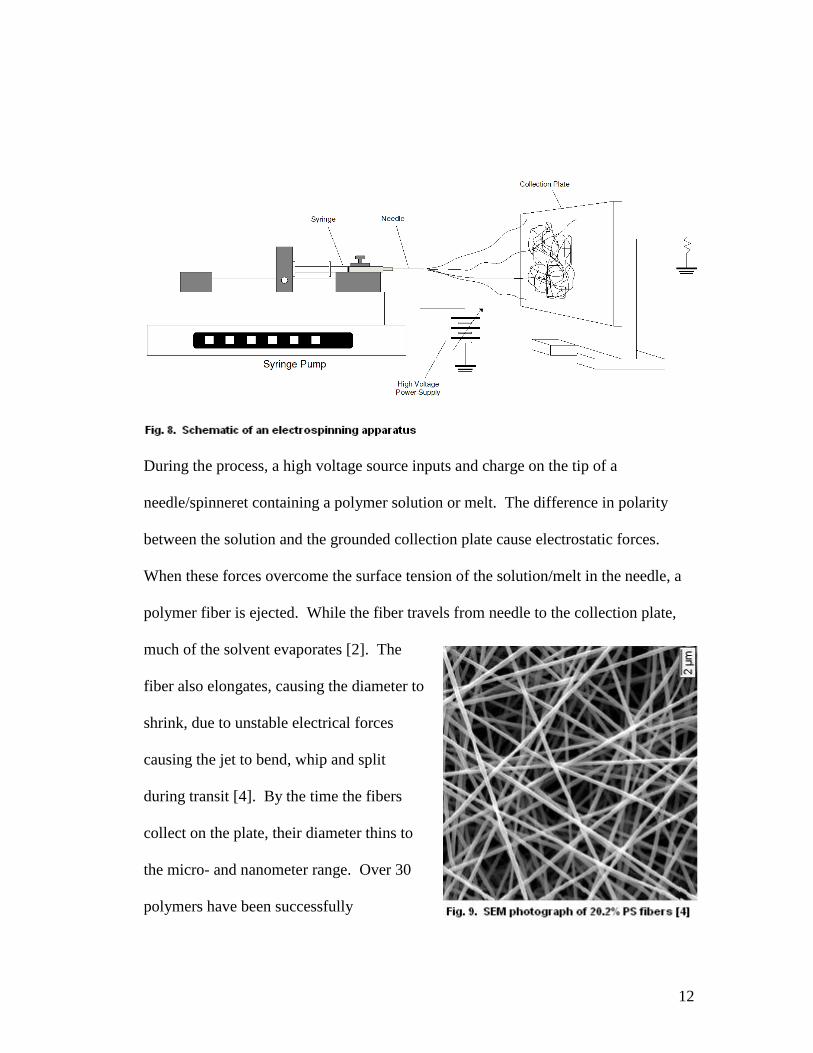
2.2.2 Electrospinning
Electrospinning is a long existing technology originally developed for the
fabrication of ultrathin, continuous, non-woven polymer fibers [1-4]. Figure 8 shows
a typical electrospinning apparatus.
12
During the process, a high voltage source inputs and charge on the tip of a
needle/spinneret containing a polymer solution or melt. The difference in polarity
between the solution and the grounded collection plate cause electrostatic forces.
When these forces overcome the surface tension of the solution/melt in the needle, a
polymer fiber is ejected. While the fiber travels from needle to the collection plate,
much of the solvent evaporates [2]. The
fiber also elongates, causing the diameter to
shrink, due to unstable electrical forces
causing the jet to bend, whip and split
during transit [4]. By the time the fibers
collect on the plate, their diameter thins to
the micro- and nanometer range. Over 30
polymers have been successfully
13
electrospun, producing fibers on the range of 40-500nm [1]. Figure 9 shows the
fibers resulting from the successful electrospinning of a polystyrene solution.
Applications of electrospun fibers include scaffolding for tissue engineering, drug
delivery, filtration, protective clothing, and wound dressings.
2.2.3 Organometallics
An organometallic compound is defined as chemical compound where a metal is
covalently bonded to carbon, although exceptions do exist [16]. While wide spread
use of these compounds is limited because of toxicity, they are very useful when
applied as catalysts. Organotins in particular are commonly used for polymer-
stabilization and as polymerization catalysts as well as for biocidal applications
(destroying microorganisms, insects, and plants) [17,18]. Organometallics are also
soluble in most organic solvents, which is why this project is investigating their use
in electrospinning. This solubility provides a simple and interesting method for
getting a metal into solution.
2.2.4 Electrospinning of Metallic Fibers
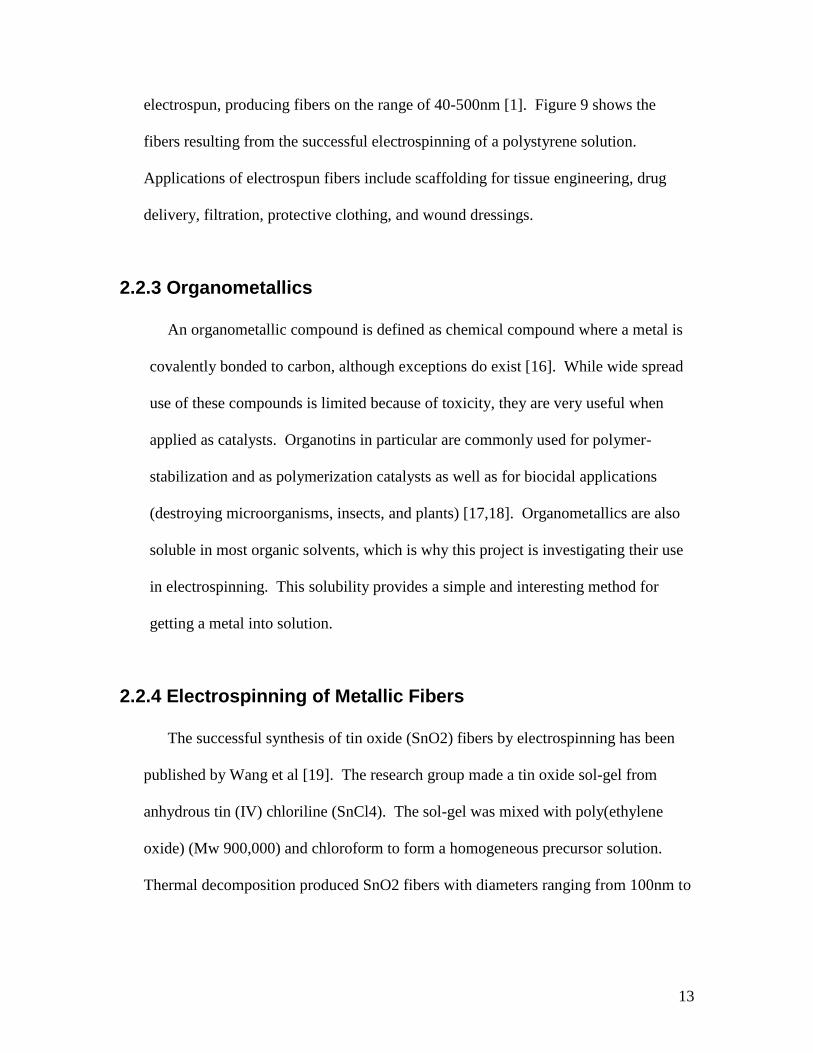
The successful synthesis of tin oxide (SnO2) fibers by electrospinning has been
published by Wang et al [19]. The research group made a tin oxide sol-gel from
anhydrous tin (IV) chloriline (SnCl4). The sol-gel was mixed with poly(ethylene
oxide) (Mw 900,000) and chloroform to form a homogeneous precursor solution.
Thermal decomposition produced SnO2 fibers with diameters ranging from 100nm to
14
several micrometers. Figure 10 shows a single fiber before and after sintering at 600
C.
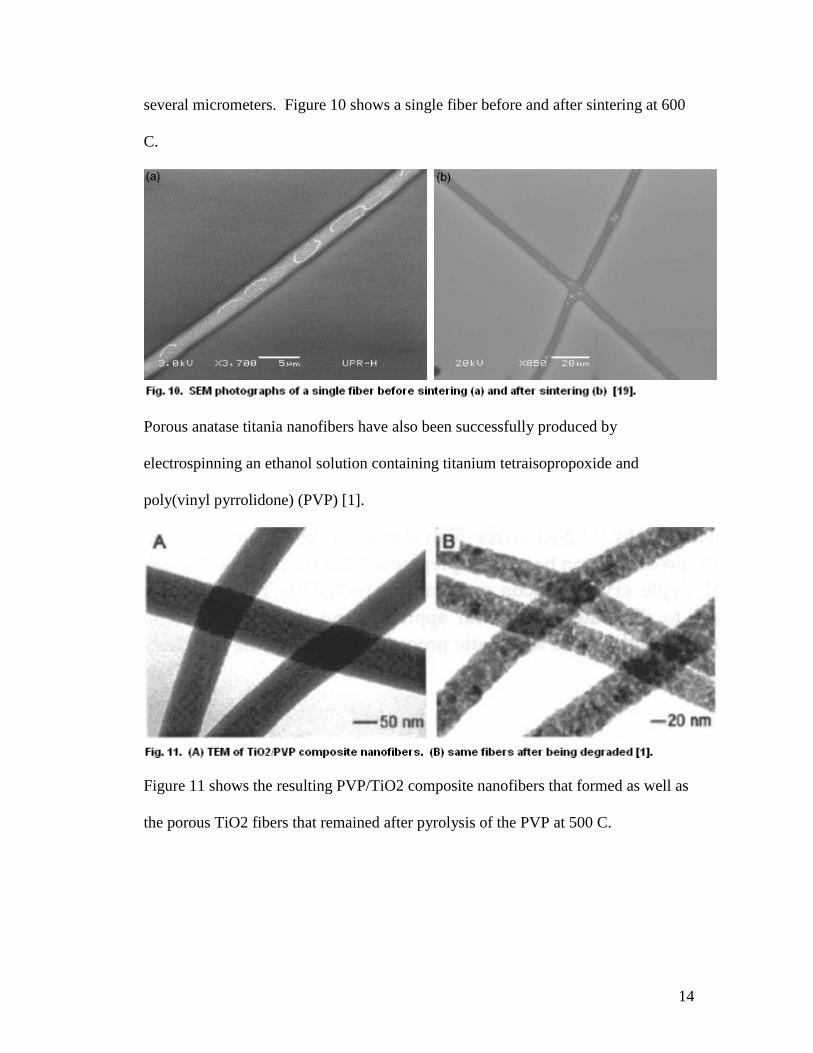
Porous anatase titania nanofibers have also been successfully produced by
electrospinning an ethanol solution containing titanium tetraisopropoxide and
poly(vinyl pyrrolidone) (PVP) [1].
Figure 11 shows the resulting PVP/TiO2 composite nanofibers that formed as well as
the porous TiO2 fibers that remained after pyrolysis of the PVP at 500 C.
15
3. Objectives
To identify a suitable organometallic for use in producing metal or metal
oxide fibers
To examine the thermal degradation characteristics of the chosen
organometallic
To electrospin the chosen organometallic and analyze the structures
formed
To thermally degrade the electrospun structures to form metal or metal
oxide fibers
To examine the feasibility of producing nano-alloy fibers by mixing
organometallics
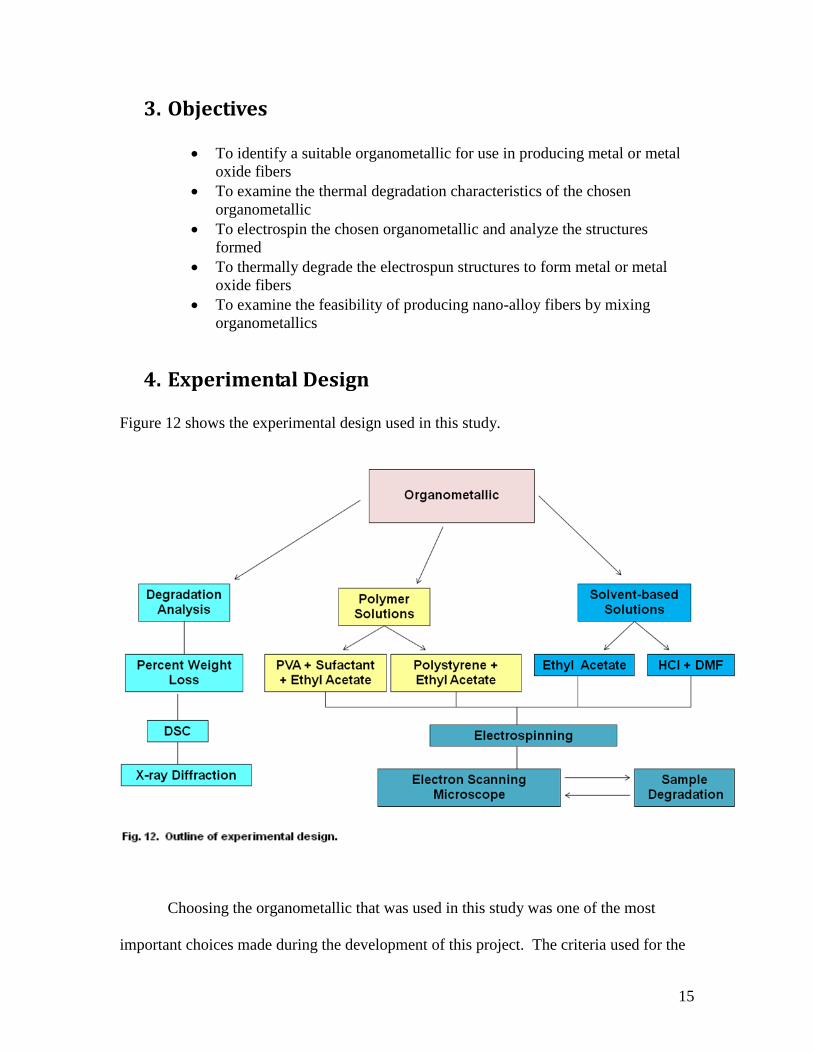
4. Experimental Design
Figure 12 shows the experimental design used in this study.
Choosing the organometallic that was used in this study was one of the most
important choices made during the development of this project. The criteria used for the
16
selection of the material were melting point, molecular structure and price. A melting
point between 100 C and 350 C was considered most desirable as this range was
relatively low, making the material easier to handle and test, but high enough that the
degradation temperature was higher than those of the polymers that would be used in
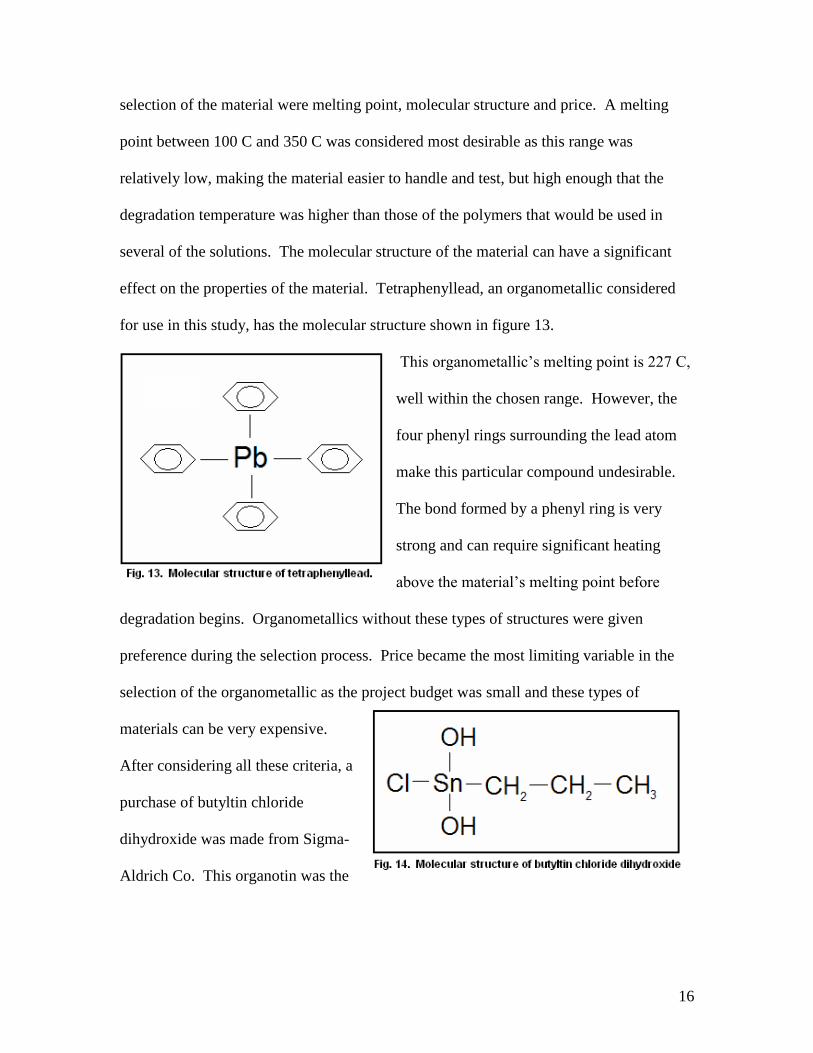
several of the solutions. The molecular structure of the material can have a significant
effect on the properties of the material. Tetraphenyllead, an organometallic considered
for use in this study, has the molecular structure shown in figure 13.
This organometallic’s melting point is 227 C,
well within the chosen range. However, the
four phenyl rings surrounding the lead atom
make this particular compound undesirable.
The bond formed by a phenyl ring is very
strong and can require significant heating
above the material’s melting point before
degradation begins. Organometallics without these types of structures were given
preference during the selection process. Price became the most limiting variable in the
selection of the organometallic as the project budget was small and these types of
materials can be very expensive.
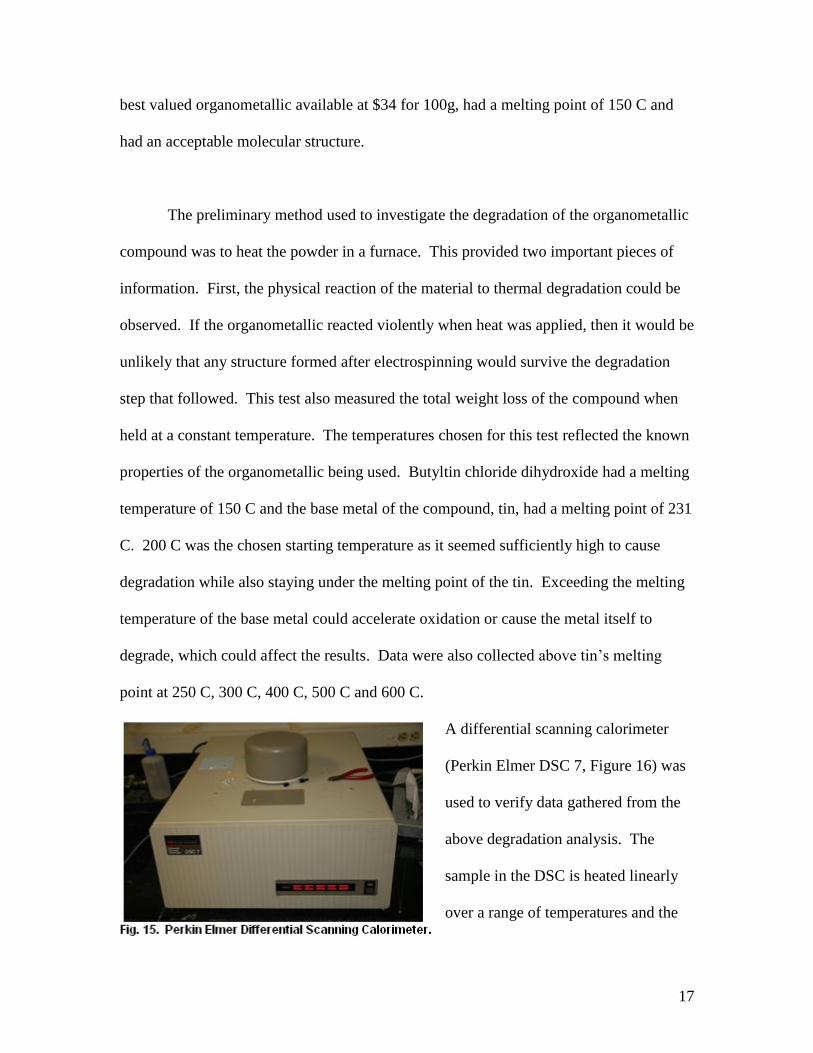
After considering all these criteria, a
purchase of butyltin chloride
dihydroxide was made from Sigma-
Aldrich Co. This organotin was the
17
best valued organometallic available at $34 for 100g, had a melting point of 150 C and
had an acceptable molecular structure.
The preliminary method used to investigate the degradation of the organometallic
compound was to heat the powder in a furnace. This provided two important pieces of
information. First, the physical reaction of the material to thermal degradation could be
observed. If the organometallic reacted violently when heat was applied, then it would be
unlikely that any structure formed after electrospinning would survive the degradation
step that followed. This test also measured the total weight loss of the compound when
held at a constant temperature. The temperatures chosen for this test reflected the known
properties of the organometallic being used. Butyltin chloride dihydroxide had a melting
temperature of 150 C and the base metal of the compound, tin, had a melting point of 231
C. 200 C was the chosen starting temperature as it seemed sufficiently high to cause
degradation while also staying under the melting point of the tin. Exceeding the melting
temperature of the base metal could accelerate oxidation or cause the metal itself to
degrade, which could affect the results. Data were also collected above tin’s melting
point at 250 C, 300 C, 400 C, 500 C and 600 C.
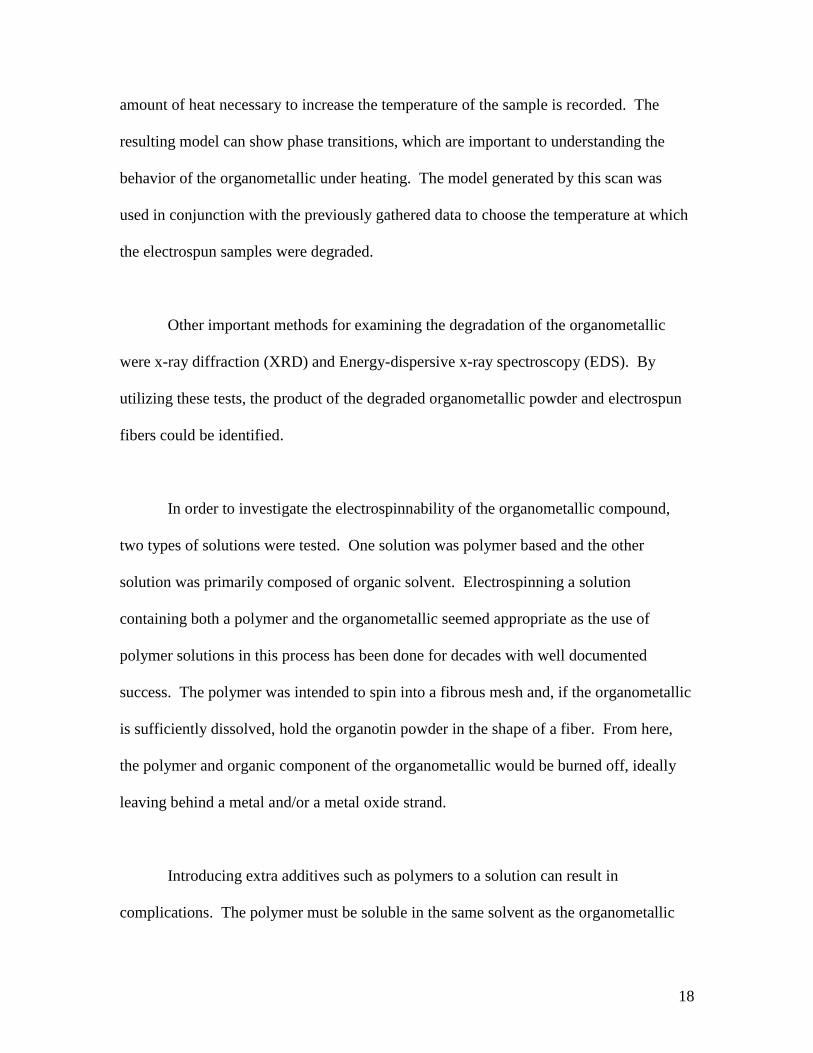
A differential scanning calorimeter
(Perkin Elmer DSC 7, Figure 16) was
used to verify data gathered from the
above degradation analysis. The
sample in the DSC is heated linearly
over a range of temperatures and the
18
amount of heat necessary to increase the temperature of the sample is recorded. The
resulting model can show phase transitions, which are important to understanding the
behavior of the organometallic under heating. The model generated by this scan was
used in conjunction with the previously gathered data to choose the temperature at which
the electrospun samples were degraded.
Other important methods for examining the degradation of the organometallic
were x-ray diffraction (XRD) and Energy-dispersive x-ray spectroscopy (EDS). By
utilizing these tests, the product of the degraded organometallic powder and electrospun
fibers could be identified.
In order to investigate the electrospinnability of the organometallic compound,
two types of solutions were tested. One solution was polymer based and the other
solution was primarily composed of organic solvent. Electrospinning a solution
containing both a polymer and the organometallic seemed appropriate as the use of
polymer solutions in this process has been done for decades with well documented
success. The polymer was intended to spin into a fibrous mesh and, if the organometallic
is sufficiently dissolved, hold the organotin powder in the shape of a fiber. From here,
the polymer and organic component of the organometallic would be burned off, ideally
leaving behind a metal and/or a metal oxide strand.
Introducing extra additives such as polymers to a solution can result in
complications. The polymer must be soluble in the same solvent as the organometallic
19
and the polymer must also degrade at a sufficiently low temperature so as to not influence
the intended degradation temperature. Polymers could also leave carbon residues upon
degradation, which would inhibit the ability to determine results of an electrospinning
trial. To negate this possibility, solutions composed only of the organometallic and an
appropriate solvent were also tested. However, not containing a polymer can lack
sufficient viscosity to be effectively electrospun, resulting in the liquid spraying out of
the needle instead of being extruded as a fiber.
Samples obtained by electrospinning both types of solutions were analyzed by
scanning electron microscope (SEM). This analysis helped realize the electrospinnability
of each type of solution. The samples were then thermally degraded and analyzed again
in the SEM in order to observe whether or not metal or metal oxide fibers had been
successfully produced.
5. Methodology
5.1 Degradation Analysis
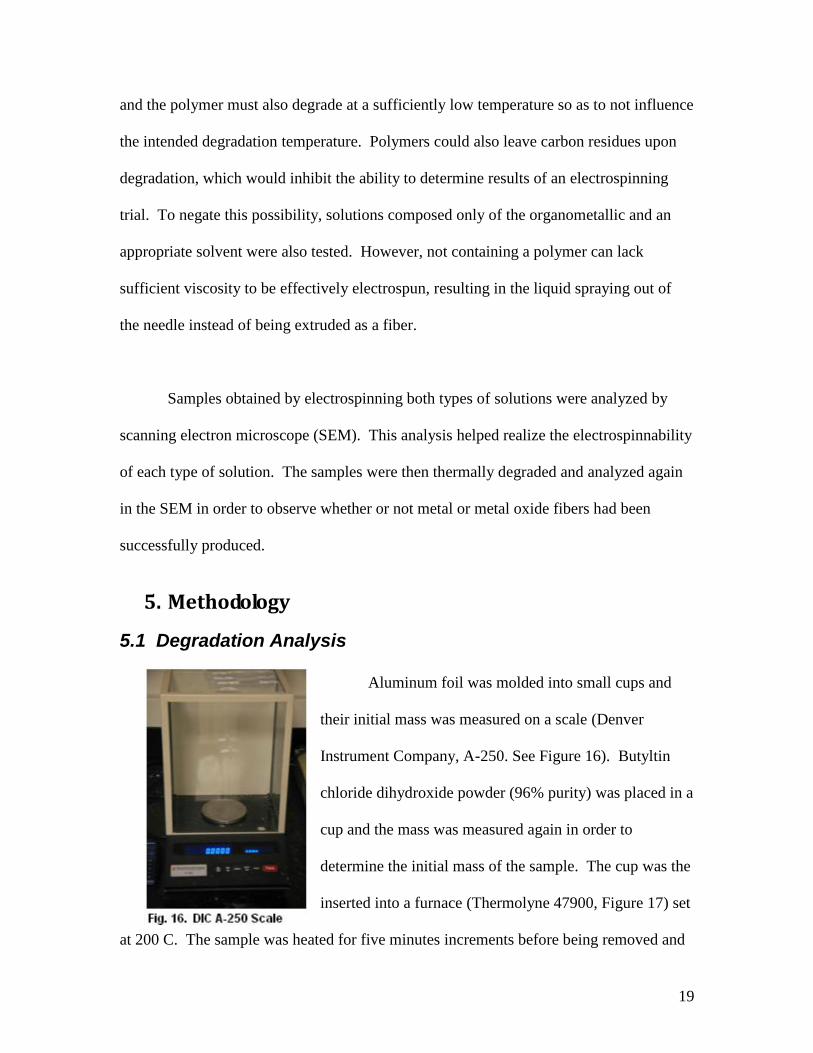
Aluminum foil was molded into small cups and
their initial mass was measured on a scale (Denver
Instrument Company, A-250. See Figure 16). Butyltin
chloride dihydroxide powder (96% purity) was placed in a
cup and the mass was measured again in order to
determine the initial mass of the sample. The cup was the
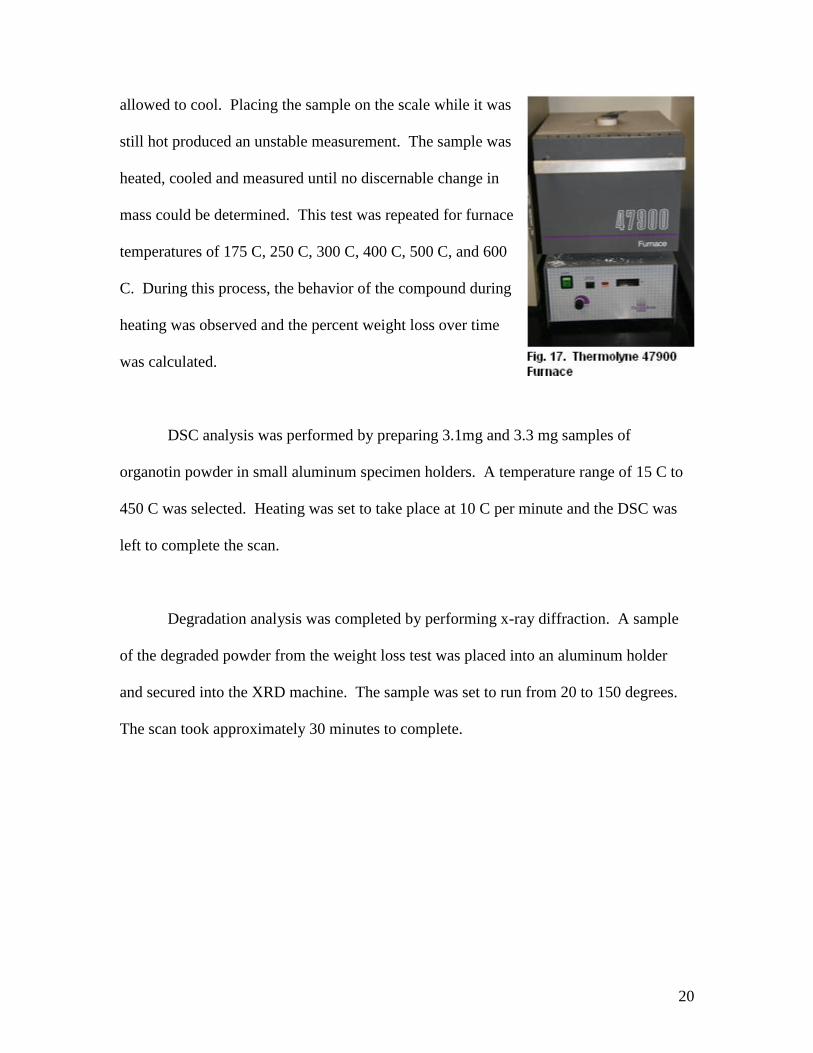
inserted into a furnace (Thermolyne 47900, Figure 17) set
at 200 C. The sample was heated for five minutes increments before being removed and
20
allowed to cool. Placing the sample on the scale while it was
still hot produced an unstable measurement. The sample was
heated, cooled and measured until no discernable change in
mass could be determined. This test was repeated for furnace
temperatures of 175 C, 250 C, 300 C, 400 C, 500 C, and 600
C. During this process, the behavior of the compound during
heating was observed and the percent weight loss over time
was calculated.
DSC analysis was performed by preparing 3.1mg and 3.3 mg samples of
organotin powder in small aluminum specimen holders. A temperature range of 15 C to
450 C was selected. Heating was set to take place at 10 C per minute and the DSC was
left to complete the scan.
Degradation analysis was completed by performing x-ray diffraction. A sample
of the degraded powder from the weight loss test was placed into an aluminum holder
and secured into the XRD machine. The sample was set to run from 20 to 150 degrees.
The scan took approximately 30 minutes to complete.
21
5.2 Electrospinning
For the electrospinning stage of the experiment, several solutions, shown in Table 2
were prepared.
Table ii - Solutions used for electrospinning trials
Each of the solutions were placed into syringes equipped with 30 gauge needles, except
for solution 1 which was also electrospun using an 18 gauge needle. For each run, a
syringe was mounted horizontally on a syringe pump (EW-74900-00, Cole-Parmer) that
was calibrated to achieve a flow rate of 1mL/hr. The high voltage power supply was set
to 10kV and the collection plate was placed 10cm from the tip of the needle for all
experiments. Each electrospinning session took place at room temperature (68-74 F) and
between 23% and 27% humidity. The needle tip and collection plate were both contained
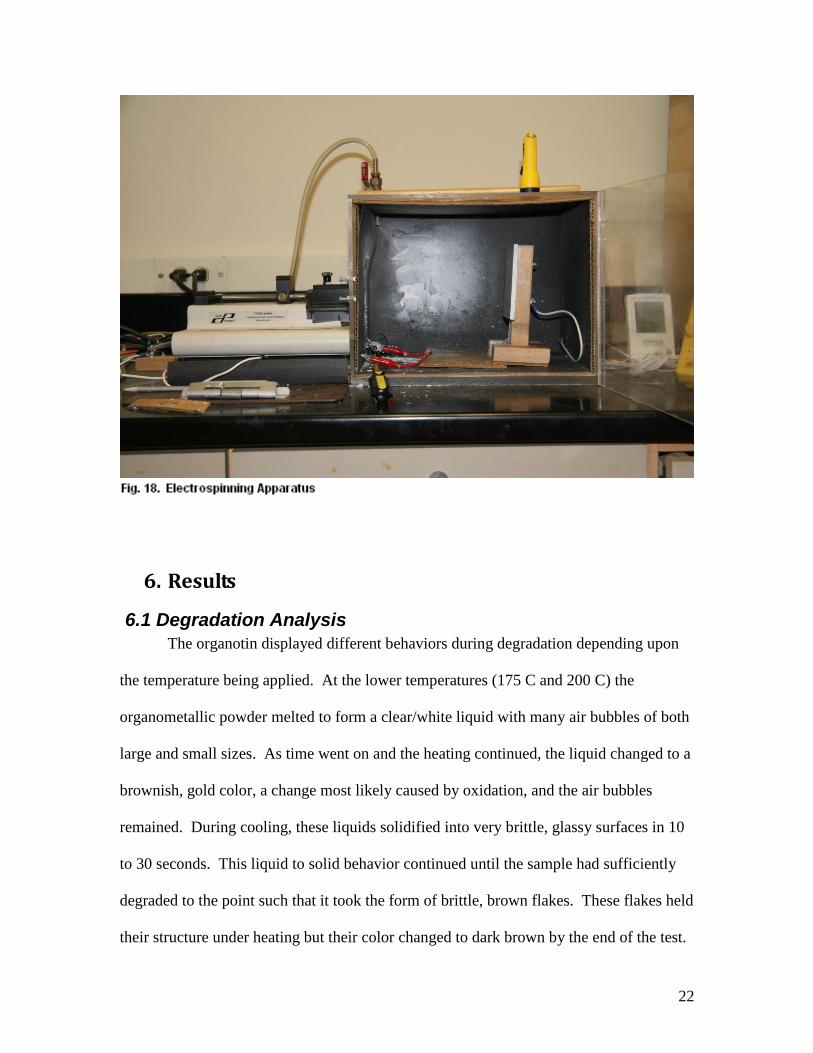
within a plexiglas chamber for the entirety of each electrospinning run. Each of the
resulting samples were left to dry for at least twelve hours before being cut into segments
for analysis in the scanning electron microscope or degradation in the furnace at 300 C.
The electrospinning apparatus used is show in Figure 18.
Solution
1 2 3 4 5 6 7
1g Polyvinyl Acetate
0.08g Polystyrene
0.005g Organotin
0.02g Organotin
0.12g Polystyrene
0.05g Organotin
0.2g Organotin
2g SDS (Surfactant)
0.02g Organotin
1mL Ethyl Acetate 0.4mL HCl
0.02 Organotin
1mL Ethyl Acetate 0.2mL HCl
0.5g Organotin
1mL Ethyl Acetate
0.5mL Ethanol
1mL Ethyl Acetate 1mL DMF
12g Distilled Water
22
6. Results
6.1 Degradation Analysis
The organotin displayed different behaviors during degradation depending upon
the temperature being applied. At the lower temperatures (175 C and 200 C) the
organometallic powder melted to form a clear/white liquid with many air bubbles of both
large and small sizes. As time went on and the heating continued, the liquid changed to a
brownish, gold color, a change most likely caused by oxidation, and the air bubbles
remained. During cooling, these liquids solidified into very brittle, glassy surfaces in 10
to 30 seconds. This liquid to solid behavior continued until the sample had sufficiently
degraded to the point such that it took the form of brittle, brown flakes. These flakes held
their structure under heating but their color changed to dark brown by the end of the test.
23
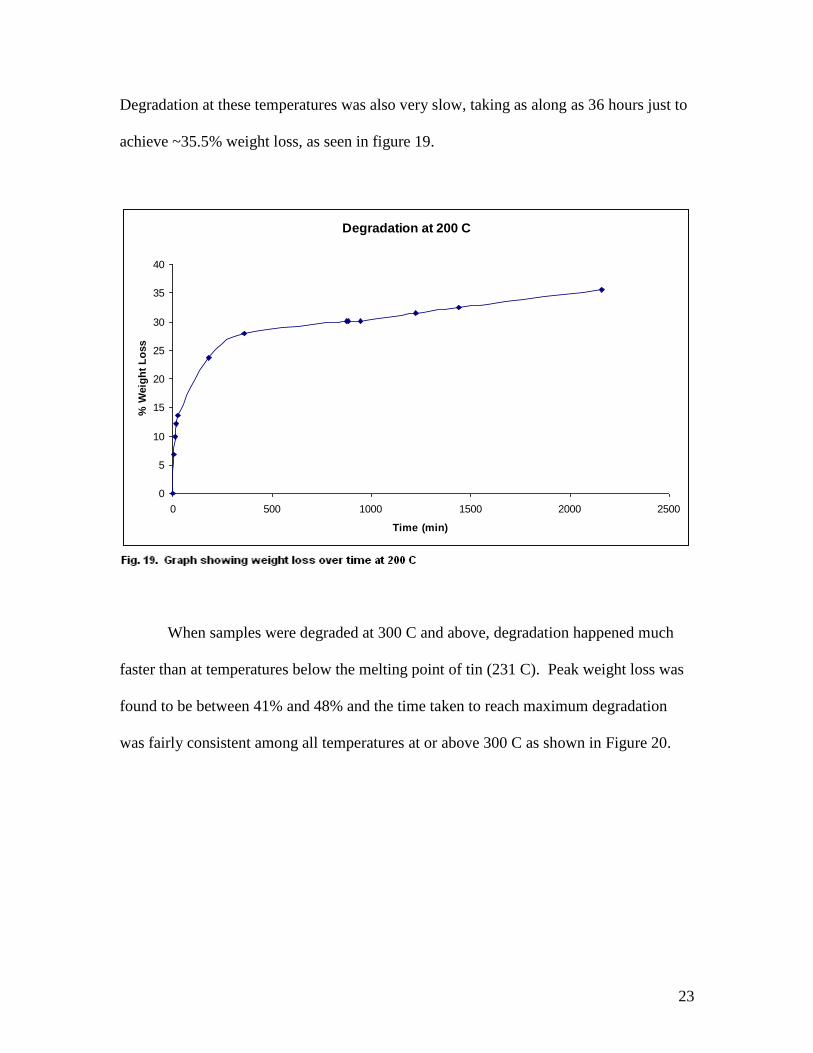
Degradation at these temperatures was also very slow, taking as along as 36 hours just to
achieve ~35.5% weight loss, as seen in figure 19.
Degradation at 200 C
0
5
10
15
20
25
30
35
40
0 500 1000 1500 2000 2500
Time (min)
% W
eig
ht
Lo
ss
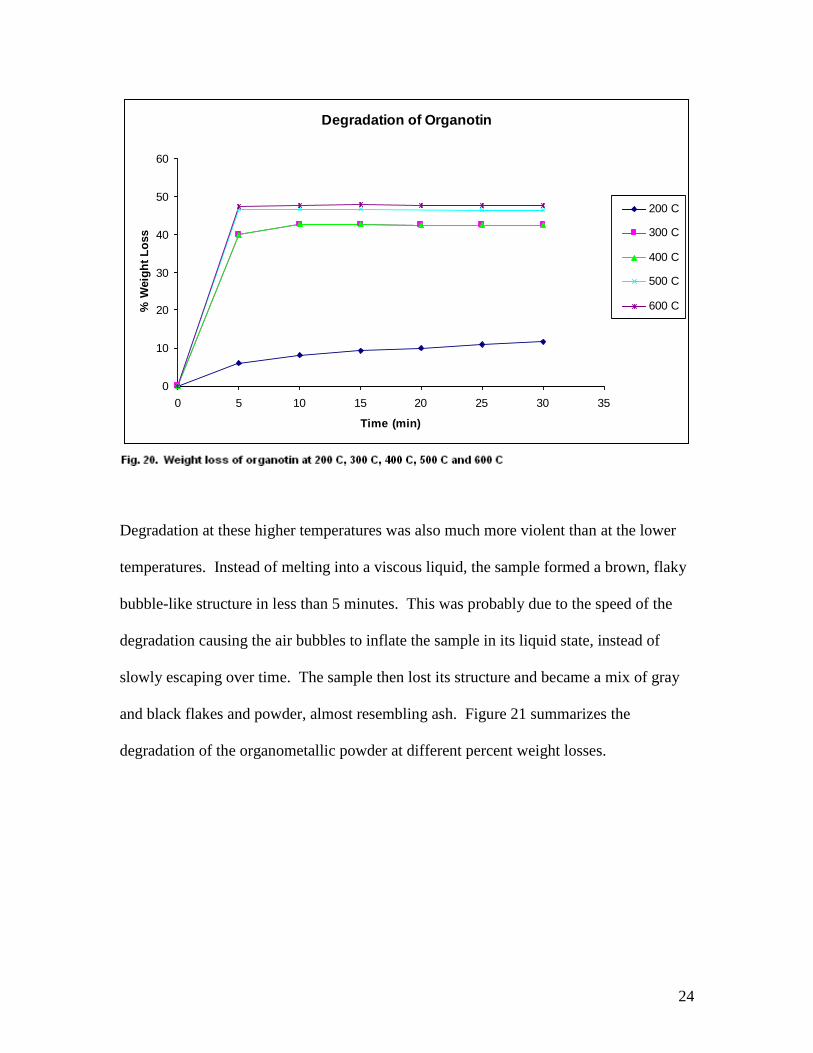
When samples were degraded at 300 C and above, degradation happened much
faster than at temperatures below the melting point of tin (231 C). Peak weight loss was
found to be between 41% and 48% and the time taken to reach maximum degradation
was fairly consistent among all temperatures at or above 300 C as shown in Figure 20.
24
Degradation of Organotin
0
10
20
30
40
50
60
0 5 10 15 20 25 30 35
Time (min)
% W
eig
ht
Lo
ss
200 C
300 C
400 C
500 C
600 C
Degradation at these higher temperatures was also much more violent than at the lower
temperatures. Instead of melting into a viscous liquid, the sample formed a brown, flaky
bubble-like structure in less than 5 minutes. This was probably due to the speed of the
degradation causing the air bubbles to inflate the sample in its liquid state, instead of
slowly escaping over time. The sample then lost its structure and became a mix of gray
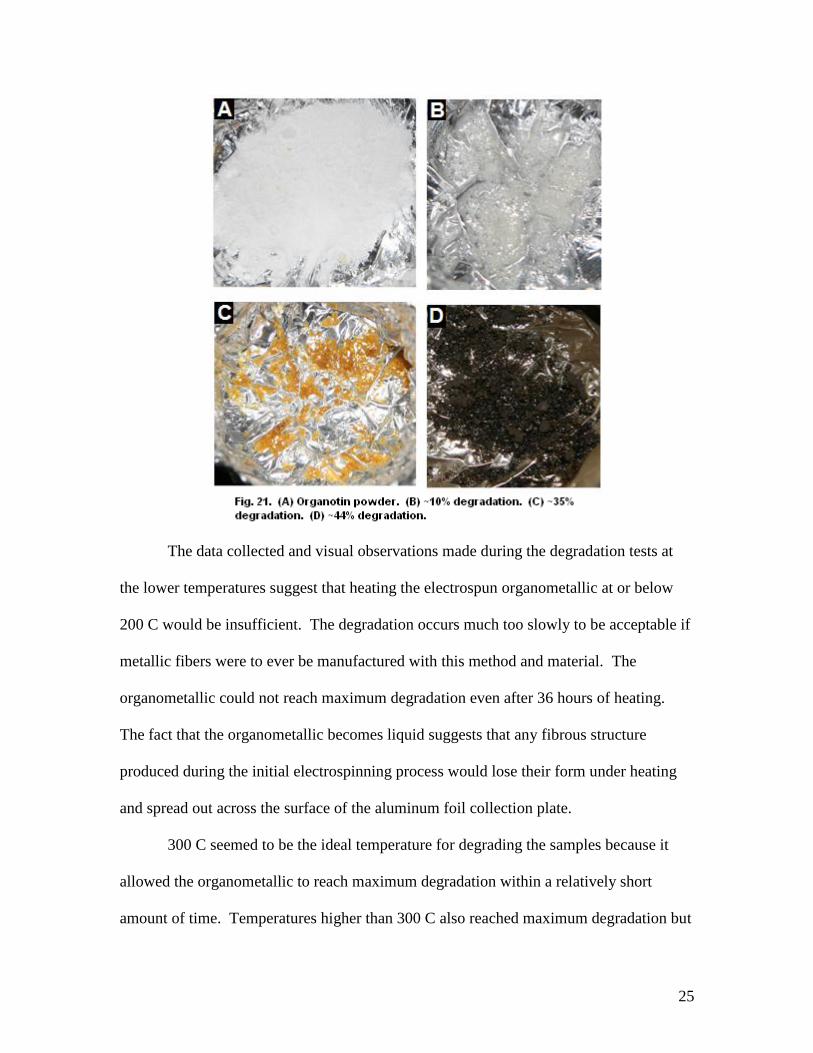
and black flakes and powder, almost resembling ash. Figure 21 summarizes the
degradation of the organometallic powder at different percent weight losses.
25
The data collected and visual observations made during the degradation tests at
the lower temperatures suggest that heating the electrospun organometallic at or below
200 C would be insufficient. The degradation occurs much too slowly to be acceptable if
metallic fibers were to ever be manufactured with this method and material. The
organometallic could not reach maximum degradation even after 36 hours of heating.
The fact that the organometallic becomes liquid suggests that any fibrous structure
produced during the initial electrospinning process would lose their form under heating
and spread out across the surface of the aluminum foil collection plate.
300 C seemed to be the ideal temperature for degrading the samples because it
allowed the organometallic to reach maximum degradation within a relatively short
amount of time. Temperatures higher than 300 C also reached maximum degradation but
26
the samples seemed to react much more violently, as suggested by the amount of residue
on the side of the aluminum cups. These violent reactions are also the likely cause of the
weight loss measurements being consistently larger at the higher temperatures. These
discrepancies were due to material being thrown out of the aluminum containers.
Tabulated data of all weight loss tests can be viewed in the appendix.
6.1.1 Differential Scanning Calorimeter
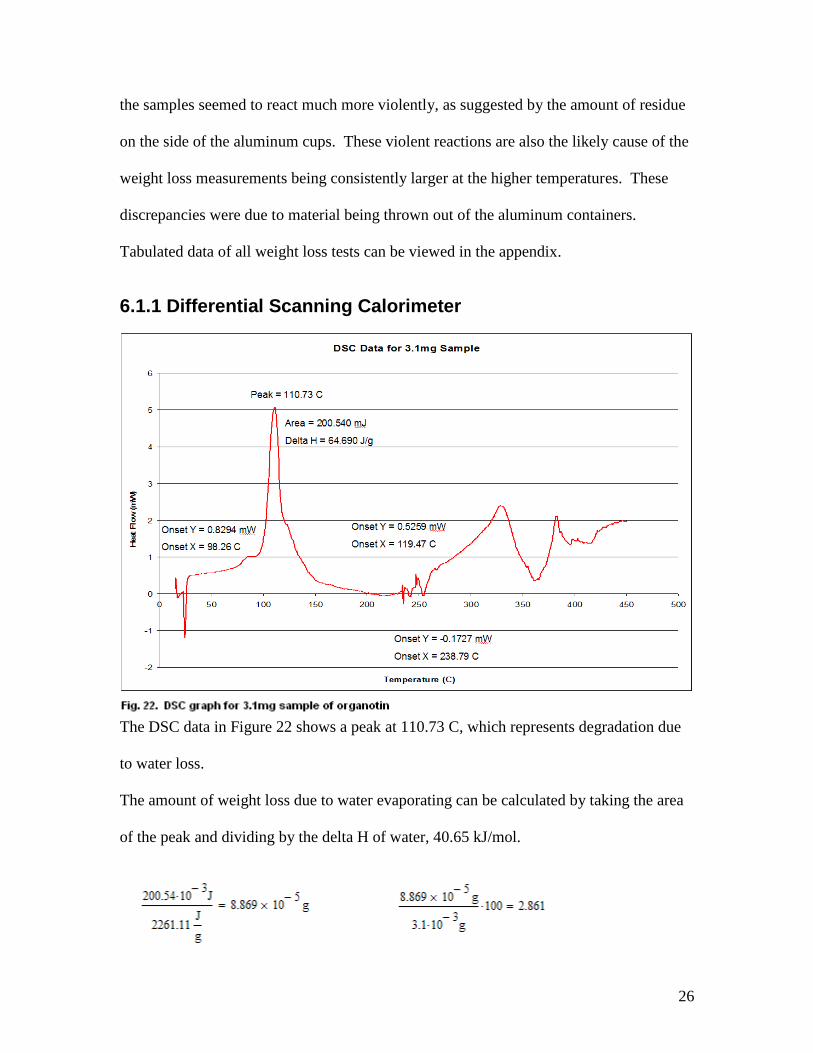
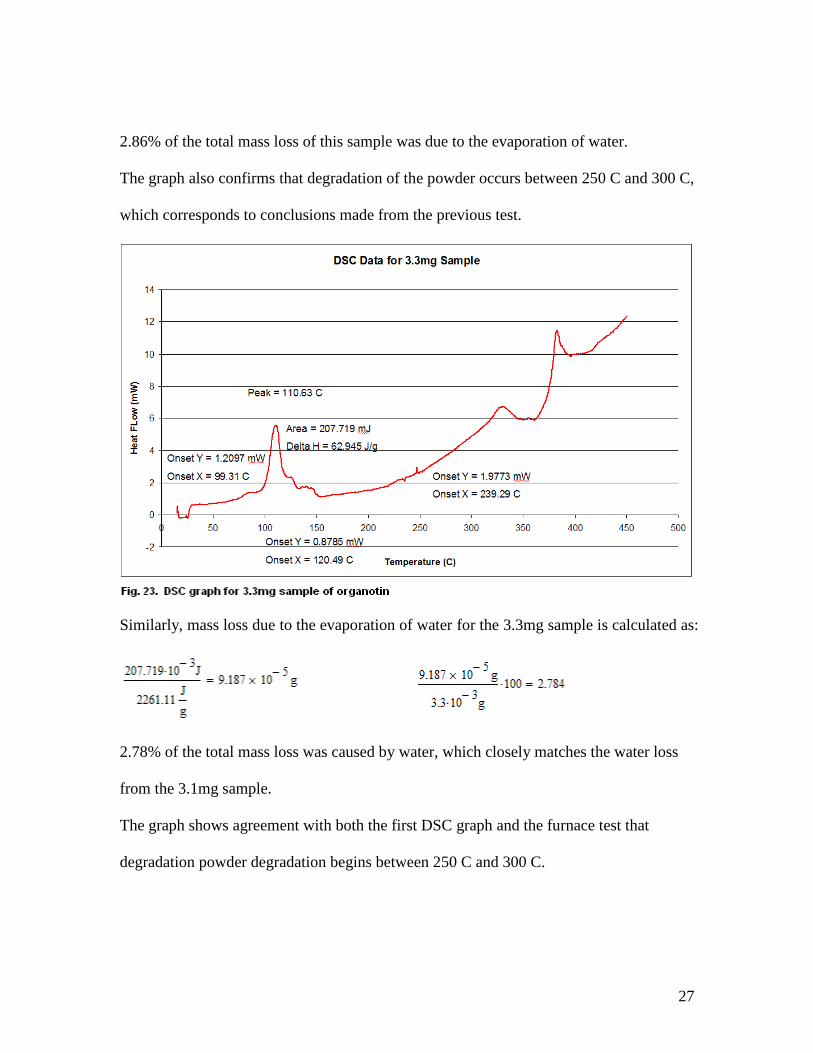
The DSC data in Figure 22 shows a peak at 110.73 C, which represents degradation due
to water loss.
The amount of weight loss due to water evaporating can be calculated by taking the area
of the peak and dividing by the delta H of water, 40.65 kJ/mol.
27
2.86% of the total mass loss of this sample was due to the evaporation of water.
The graph also confirms that degradation of the powder occurs between 250 C and 300 C,
which corresponds to conclusions made from the previous test.
Similarly, mass loss due to the evaporation of water for the 3.3mg sample is calculated as:
2.78% of the total mass loss was caused by water, which closely matches the water loss
from the 3.1mg sample.
The graph shows agreement with both the first DSC graph and the furnace test that
degradation powder degradation begins between 250 C and 300 C.
28
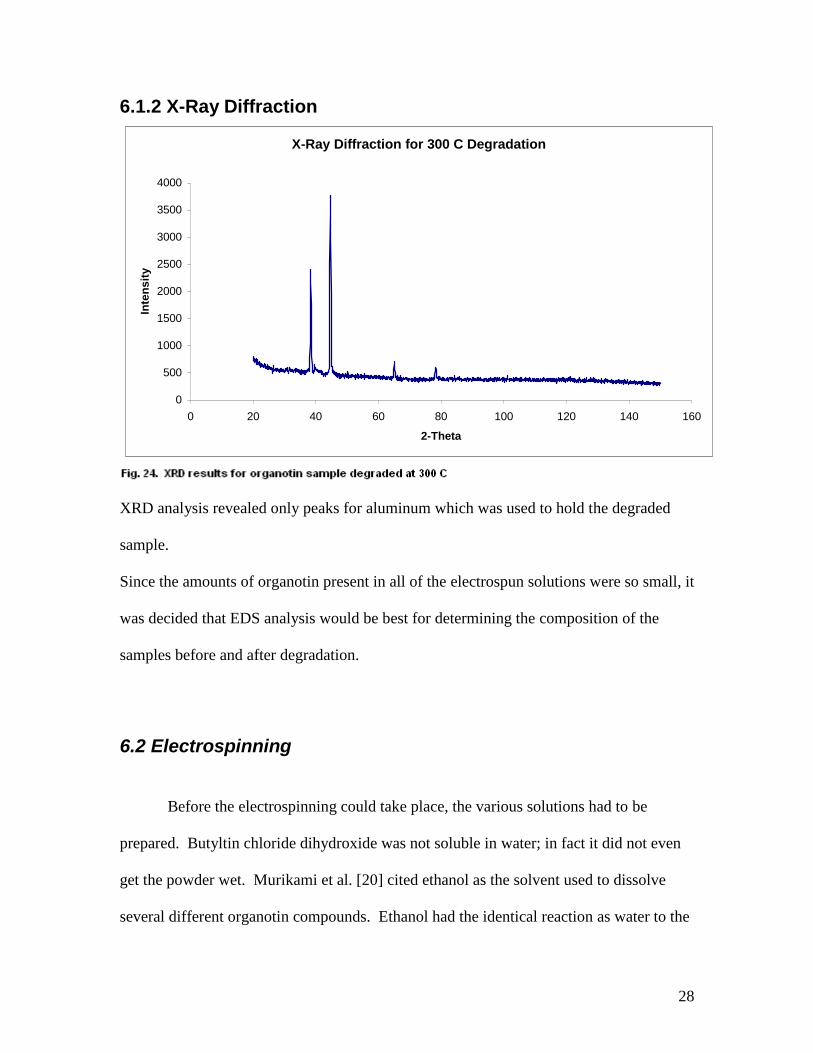
6.1.2 X-Ray Diffraction
X-Ray Diffraction for 300 C Degradation
0
500
1000
1500
2000
2500
3000
3500
4000
0 20 40 60 80 100 120 140 160
2-Theta
Inte
ns
ity
XRD analysis revealed only peaks for aluminum which was used to hold the degraded
sample.
Since the amounts of organotin present in all of the electrospun solutions were so small, it
was decided that EDS analysis would be best for determining the composition of the
samples before and after degradation.
6.2 Electrospinning
Before the electrospinning could take place, the various solutions had to be
prepared. Butyltin chloride dihydroxide was not soluble in water; in fact it did not even
get the powder wet. Murikami et al. [20] cited ethanol as the solvent used to dissolve
several different organotin compounds. Ethanol had the identical reaction as water to the
29
organotin chosen for this experiment. Several different organic solvents were tested
including chloroform, tetrahydrofuran (THF), Dimethylformamide (DMF), and ethyl
acetate. Chloroform, THF and DMF mixtures appeared to form slurries rather than
solutions and most of the organometallic powder eventually precipitate out of the solvent
and settled at the bottom of the mixing beaker. Ethyl acetate also formed a cloudy,
slurry-like mixture but the powder did not readily precipitate out so it became the main
solvent used throughout most of the electrospinning trials.
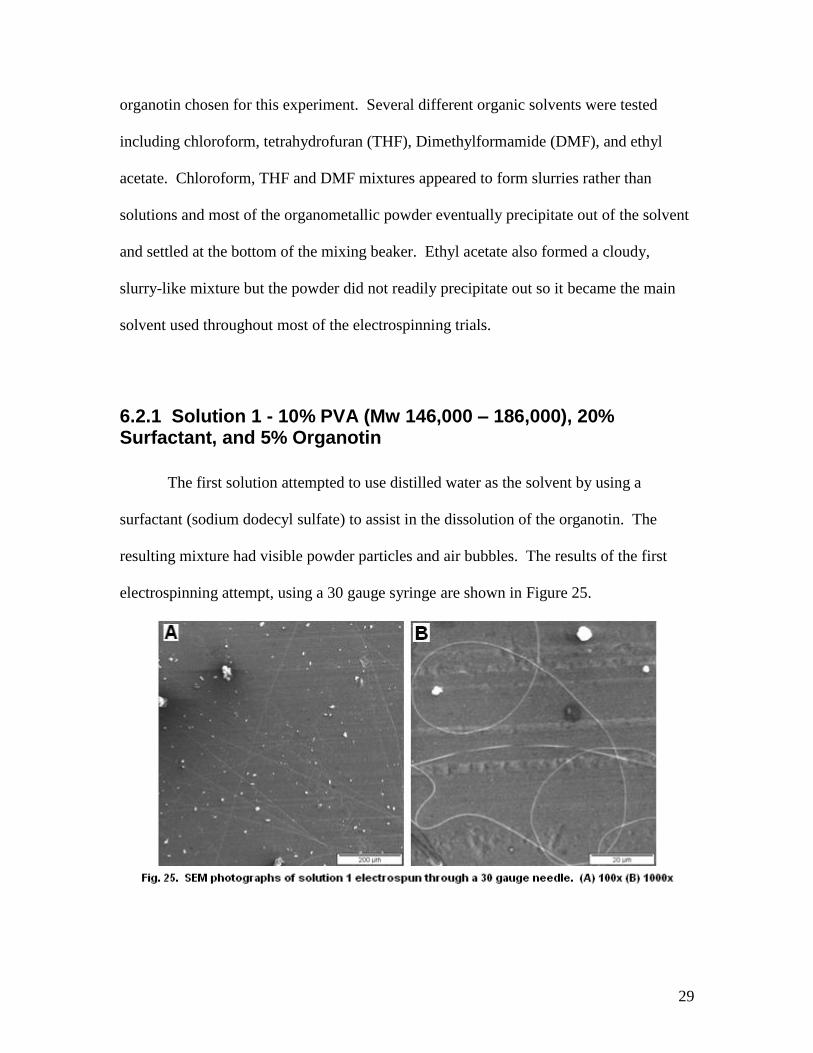
6.2.1 Solution 1 - 10% PVA (Mw 146,000 – 186,000), 20% Surfactant, and 5% Organotin
The first solution attempted to use distilled water as the solvent by using a
surfactant (sodium dodecyl sulfate) to assist in the dissolution of the organotin. The
resulting mixture had visible powder particles and air bubbles. The results of the first
electrospinning attempt, using a 30 gauge syringe are shown in Figure 25.
30
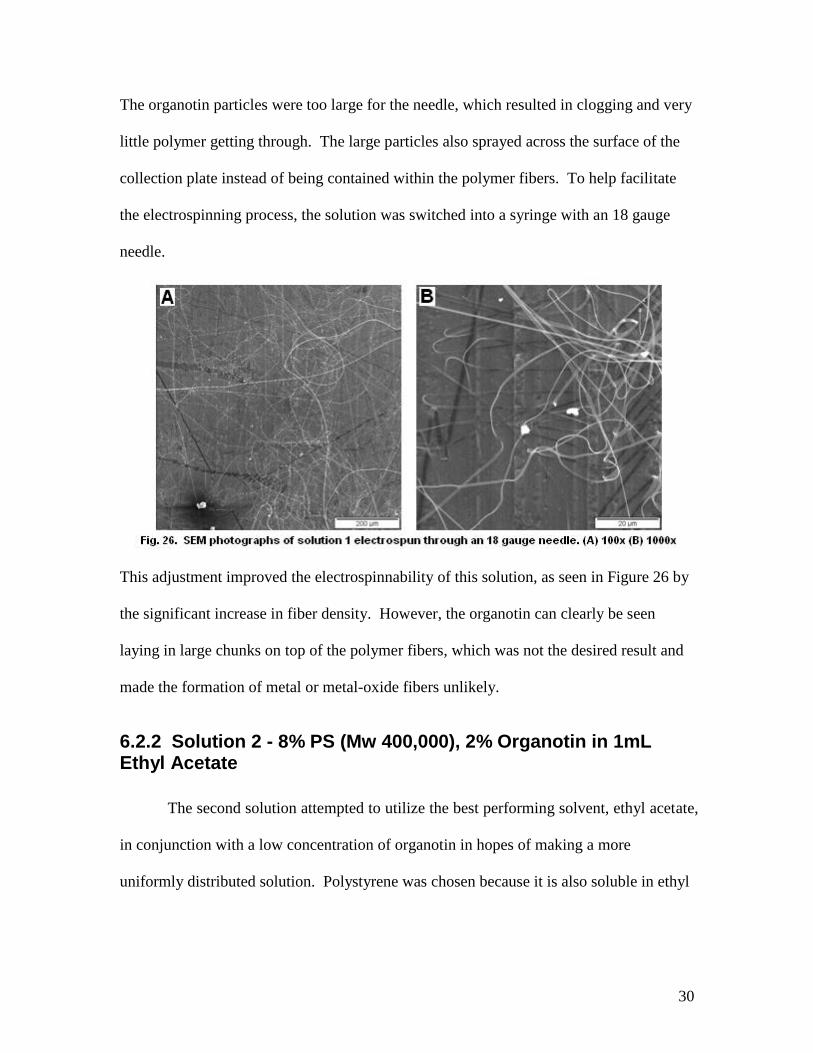
The organotin particles were too large for the needle, which resulted in clogging and very
little polymer getting through. The large particles also sprayed across the surface of the
collection plate instead of being contained within the polymer fibers. To help facilitate
the electrospinning process, the solution was switched into a syringe with an 18 gauge
needle.
This adjustment improved the electrospinnability of this solution, as seen in Figure 26 by
the significant increase in fiber density. However, the organotin can clearly be seen
laying in large chunks on top of the polymer fibers, which was not the desired result and
made the formation of metal or metal-oxide fibers unlikely.
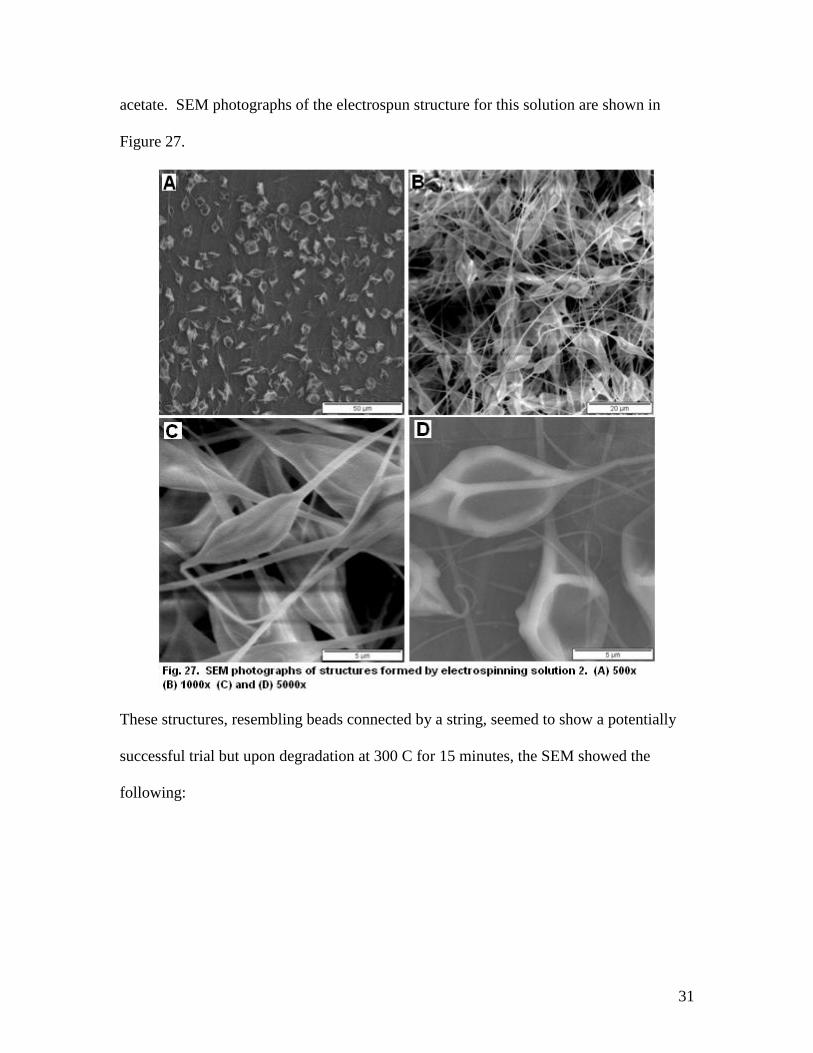
6.2.2 Solution 2 - 8% PS (Mw 400,000), 2% Organotin in 1mL Ethyl Acetate
The second solution attempted to utilize the best performing solvent, ethyl acetate,
in conjunction with a low concentration of organotin in hopes of making a more
uniformly distributed solution. Polystyrene was chosen because it is also soluble in ethyl
31
acetate. SEM photographs of the electrospun structure for this solution are shown in
Figure 27.
These structures, resembling beads connected by a string, seemed to show a potentially
successful trial but upon degradation at 300 C for 15 minutes, the SEM showed the
following:
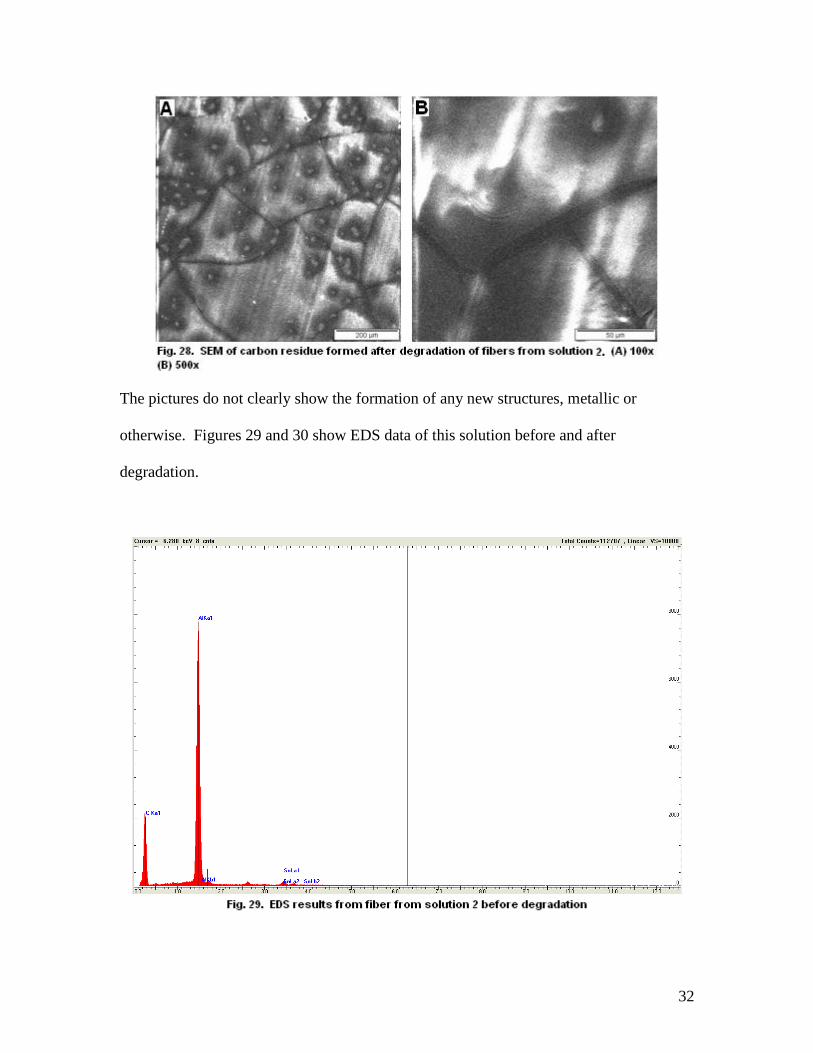
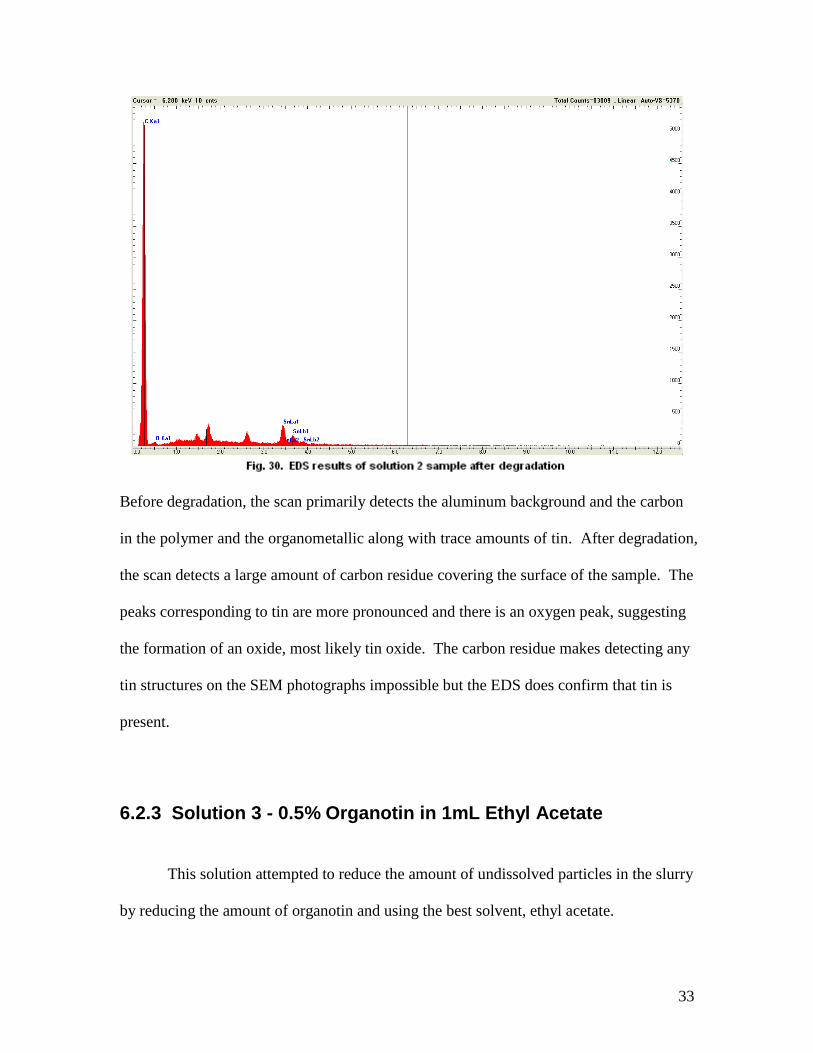
32
The pictures do not clearly show the formation of any new structures, metallic or
otherwise. Figures 29 and 30 show EDS data of this solution before and after
degradation.
33
Before degradation, the scan primarily detects the aluminum background and the carbon
in the polymer and the organometallic along with trace amounts of tin. After degradation,
the scan detects a large amount of carbon residue covering the surface of the sample. The
peaks corresponding to tin are more pronounced and there is an oxygen peak, suggesting
the formation of an oxide, most likely tin oxide. The carbon residue makes detecting any
tin structures on the SEM photographs impossible but the EDS does confirm that tin is
present.
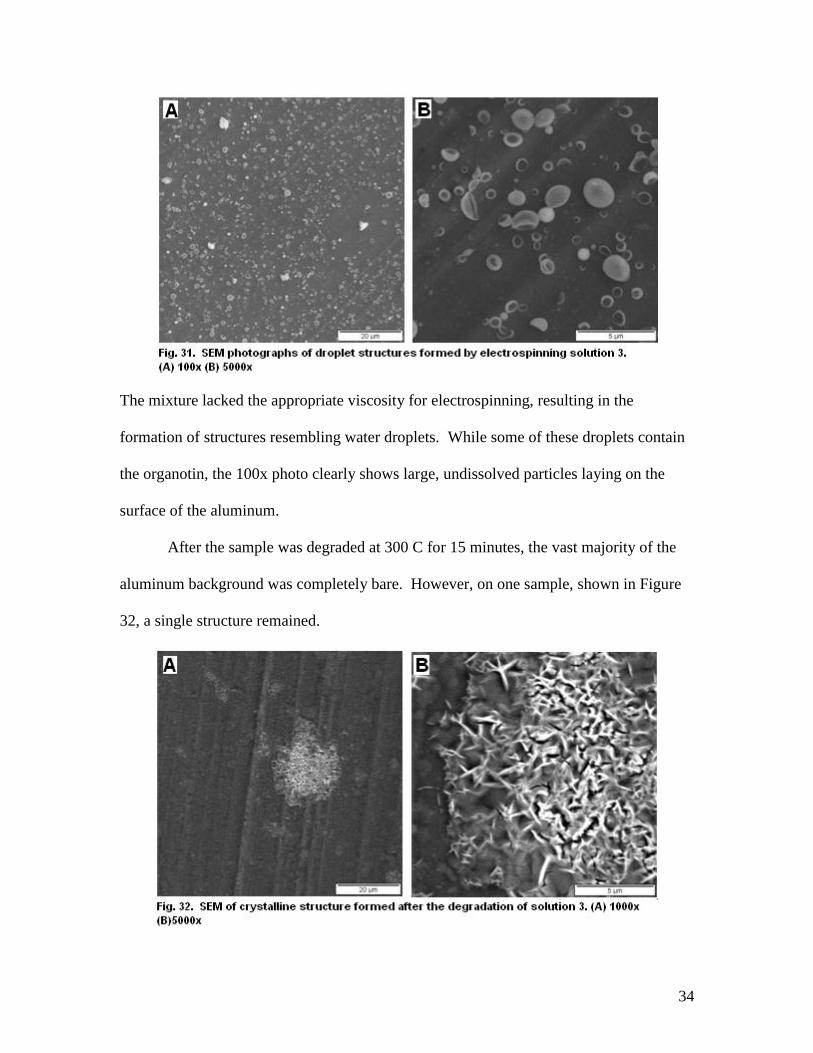
6.2.3 Solution 3 - 0.5% Organotin in 1mL Ethyl Acetate
This solution attempted to reduce the amount of undissolved particles in the slurry
by reducing the amount of organotin and using the best solvent, ethyl acetate.
34
The mixture lacked the appropriate viscosity for electrospinning, resulting in the
formation of structures resembling water droplets. While some of these droplets contain
the organotin, the 100x photo clearly shows large, undissolved particles laying on the
surface of the aluminum.
After the sample was degraded at 300 C for 15 minutes, the vast majority of the
aluminum background was completely bare. However, on one sample, shown in Figure
32, a single structure remained.
35
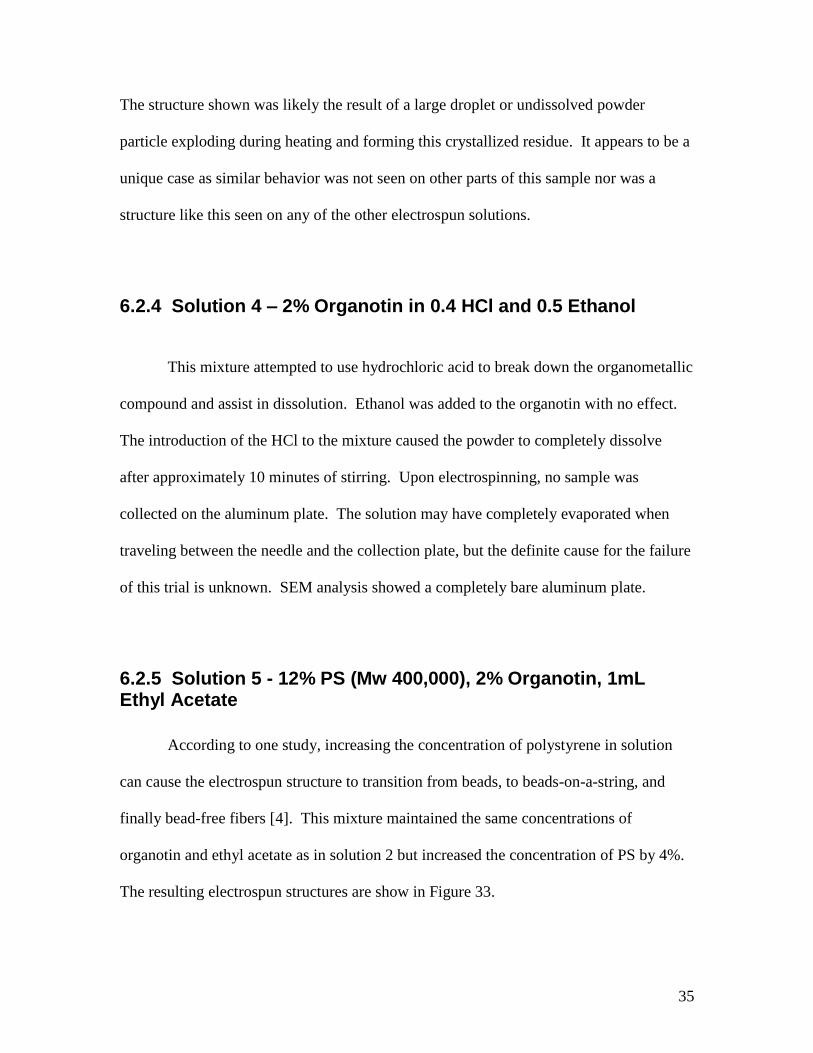
The structure shown was likely the result of a large droplet or undissolved powder
particle exploding during heating and forming this crystallized residue. It appears to be a
unique case as similar behavior was not seen on other parts of this sample nor was a
structure like this seen on any of the other electrospun solutions.
6.2.4 Solution 4 – 2% Organotin in 0.4 HCl and 0.5 Ethanol
This mixture attempted to use hydrochloric acid to break down the organometallic
compound and assist in dissolution. Ethanol was added to the organotin with no effect.
The introduction of the HCl to the mixture caused the powder to completely dissolve
after approximately 10 minutes of stirring. Upon electrospinning, no sample was
collected on the aluminum plate. The solution may have completely evaporated when
traveling between the needle and the collection plate, but the definite cause for the failure
of this trial is unknown. SEM analysis showed a completely bare aluminum plate.
6.2.5 Solution 5 - 12% PS (Mw 400,000), 2% Organotin, 1mL Ethyl Acetate
According to one study, increasing the concentration of polystyrene in solution
can cause the electrospun structure to transition from beads, to beads-on-a-string, and
finally bead-free fibers [4]. This mixture maintained the same concentrations of
organotin and ethyl acetate as in solution 2 but increased the concentration of PS by 4%.
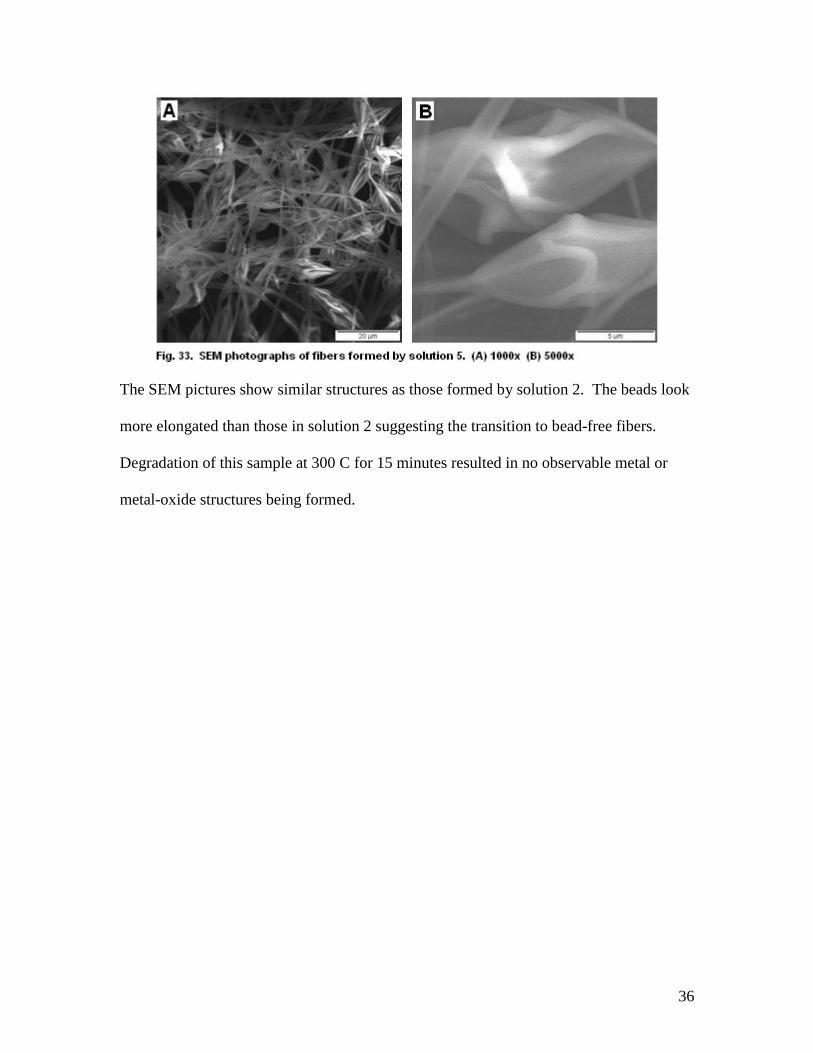
The resulting electrospun structures are show in Figure 33.
36
The SEM pictures show similar structures as those formed by solution 2. The beads look
more elongated than those in solution 2 suggesting the transition to bead-free fibers.
Degradation of this sample at 300 C for 15 minutes resulted in no observable metal or
metal-oxide structures being formed.
37
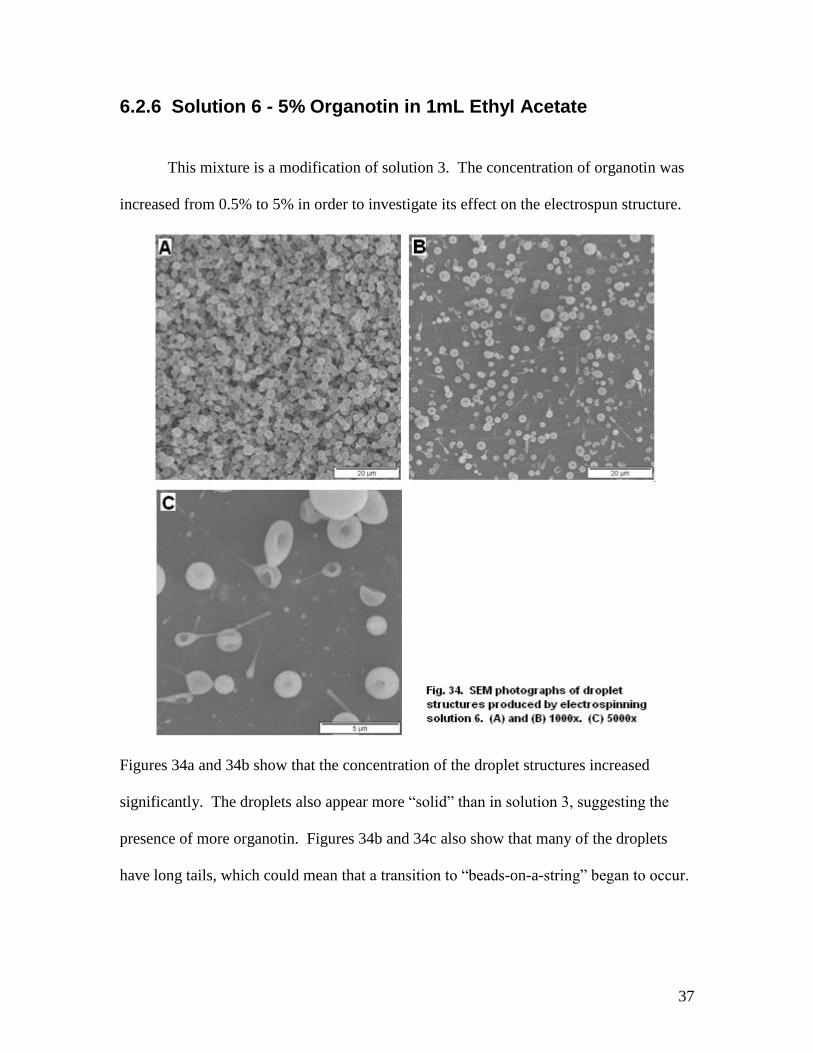
6.2.6 Solution 6 - 5% Organotin in 1mL Ethyl Acetate
This mixture is a modification of solution 3. The concentration of organotin was
increased from 0.5% to 5% in order to investigate its effect on the electrospun structure.
Figures 34a and 34b show that the concentration of the droplet structures increased
significantly. The droplets also appear more “solid” than in solution 3, suggesting the
presence of more organotin. Figures 34b and 34c also show that many of the droplets
have long tails, which could mean that a transition to “beads-on-a-string” began to occur.
38
Degradation of this sample at 300 C for 15 minutes produced a bare aluminum
surface.
6.2.7 Solution 7 - 2% Organotin in 0.2mL HCl and 1mL Dimethylformamide
This solution was another attempt at breaking down the organotin with acid and
dissolving it in one of the less effective organic solvents. Upon electrospinning, this
solution did not stick to the collection plate. Liquid collected and slid down the face of
the aluminum. This was likely caused by the solvent not evaporating while in transit
between the syringe and collection plate. Nonetheless, viable samples were still obtained
from the area around where the solvent dripped.
Even before SEM analysis, small white particles of the powder were visible on
the collection plate. However, they appeared much smaller than the particles seen before
the solution was mixed proving the acid had effectively broken down the organotin.
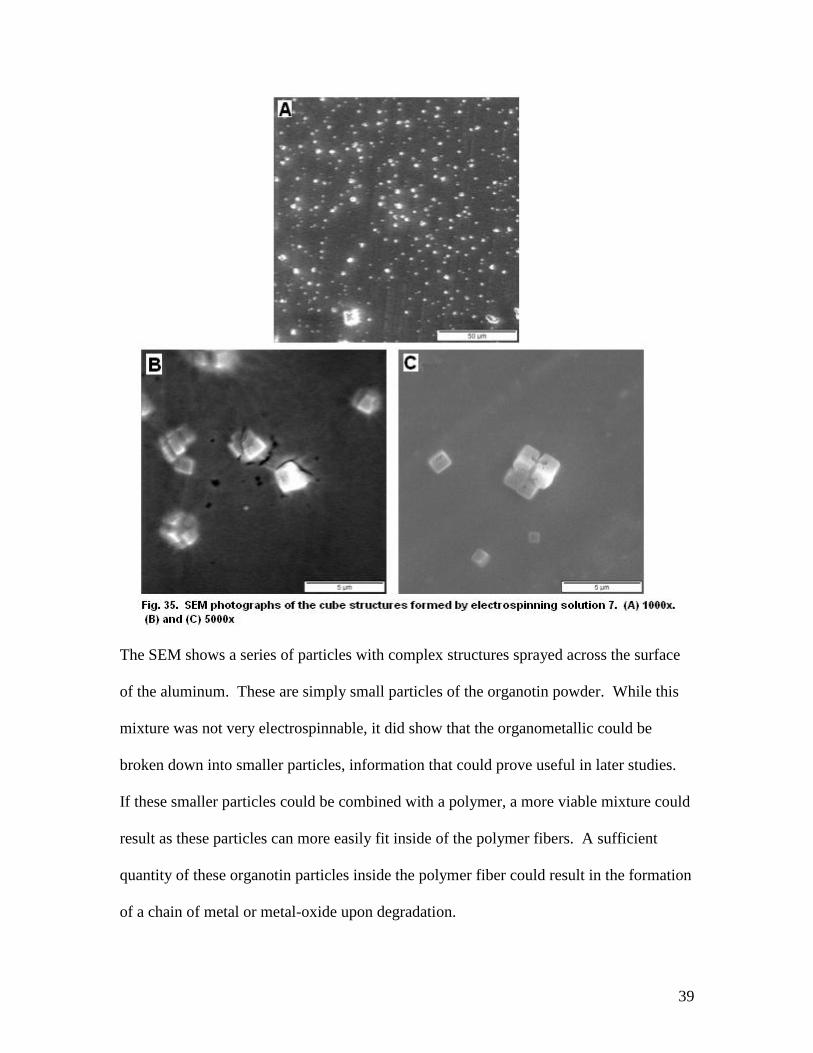
39
The SEM shows a series of particles with complex structures sprayed across the surface
of the aluminum. These are simply small particles of the organotin powder. While this
mixture was not very electrospinnable, it did show that the organometallic could be
broken down into smaller particles, information that could prove useful in later studies.
If these smaller particles could be combined with a polymer, a more viable mixture could
result as these particles can more easily fit inside of the polymer fibers. A sufficient
quantity of these organotin particles inside the polymer fiber could result in the formation
of a chain of metal or metal-oxide upon degradation.
40
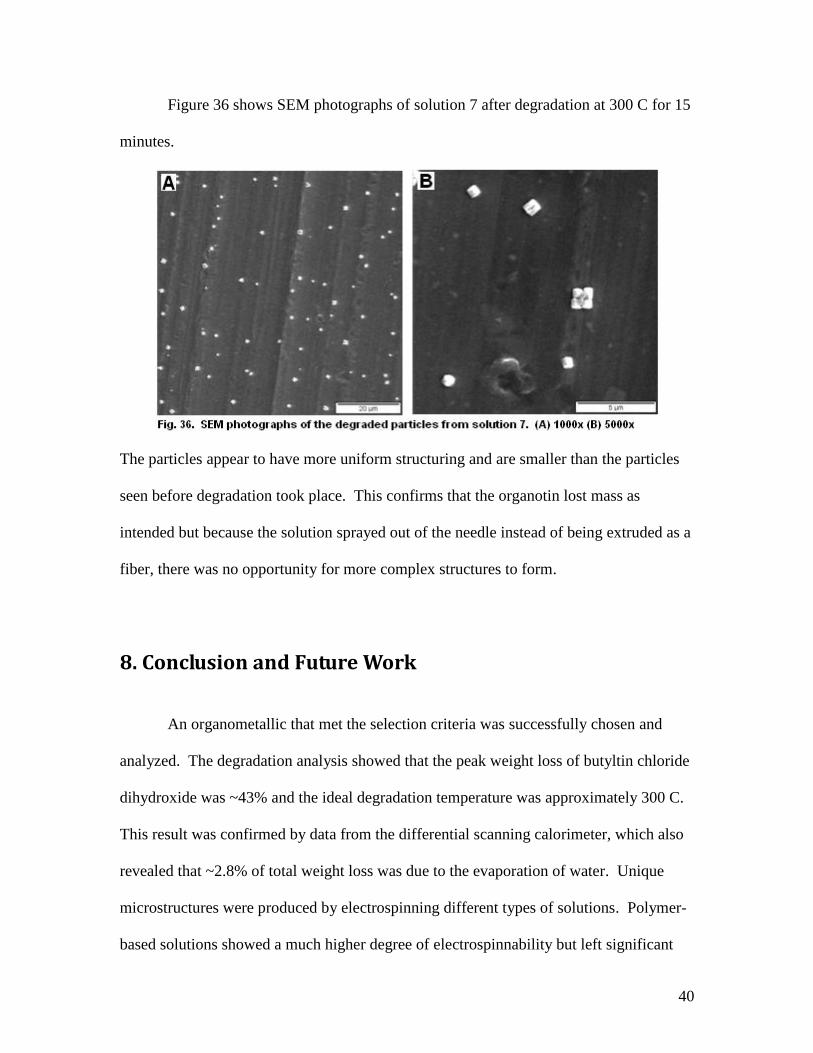
Figure 36 shows SEM photographs of solution 7 after degradation at 300 C for 15
minutes.
The particles appear to have more uniform structuring and are smaller than the particles
seen before degradation took place. This confirms that the organotin lost mass as
intended but because the solution sprayed out of the needle instead of being extruded as a
fiber, there was no opportunity for more complex structures to form.
8. Conclusion and Future Work
An organometallic that met the selection criteria was successfully chosen and
analyzed. The degradation analysis showed that the peak weight loss of butyltin chloride
dihydroxide was ~43% and the ideal degradation temperature was approximately 300 C.
This result was confirmed by data from the differential scanning calorimeter, which also
revealed that ~2.8% of total weight loss was due to the evaporation of water. Unique
microstructures were produced by electrospinning different types of solutions. Polymer-
based solutions showed a much higher degree of electrospinnability but left significant
41
carbon residue upon degradation. The solvent-based solutions showed the formation of
droplet structures, which could be useful as a vehicle for applying organometallic
coatings on a material. The use of acid to break down the organometallic shows promise
but more trials need to be done to fully explore this option.
EDS analysis confirmed the presence of tin and tin oxide particles after thermal
degradation of electrospun structures. Additives may be necessary to bind the
organometallic particles together to facilitate the formation of continuous or
discontinuous fibers. If an effective solvent could be found that would increase the wt%
of organotin in solution to 15-20%, instead of 0.5-5, particle interaction would
significantly increase, which would promote the formation of tin nanostructures.
Future research for this project should focus on solvent interactions with the
organometallic rather than the degradation behavior. The formation of homogeneous
solutions is vital to the electrospinning process, as seen by past successes. The possibility
of alloying two or more metals by means of electrospinning organometallics with
different base metals should also be examined.
42
References
1. Cao, Guozhong Nanostructures and Nanomaterials - Synthesis, Properties and
Applications. null.
2. T. J. Sill, H. A. von Recum, Biomaterials 29 (2008) 1989-2006
3. T. Jarusuwannapoom, W. Hongrojjanawiwat, S. Jitjaicham, L. Wannatong, M.
Nithitanakul, C. Pattamaprom, P. Koombhongse, R. Rangkupan, P. Supaphol,
European Polymer Journal 41 (2005) 409-421
4. G. Eda, Effects of Solution Rheology on Electrospinning of Polystyrene, April
2006
5. Lee, Stuart M. Handbook of Composite Reinforcements (pp 364, 405-417). John
Wiley & Sons.
6. M. J. Koczak, S. C. Khatri, J. E. Allison, M. G. Bader, Metal-Matrix Composites
for Ground Vehicle, Aerospace and Industrial Applications
7. H. Jang, K. Ko, S.J. Kim, R.H. Basch, J.W. Fash, Wear 256 (2004) 406-414
8. L. Tadrist, M. Miscevic, O. Rahli, F. Topin, Experimental Thermal and Fluid
Science 28 (2004) 193–199
9. K. M. Lee, Y. S. Lee, Y. M. Jo, J. Air & Waste Manage. Assoc. 56:1139-1145
10. Kalpakjian, Serope, Manufacturing Engineering and Technology – 4th
Edition.
2001, Prentice-Hall Inc, New Jersey
11. Lewis, Richard J., Sr. (2002). Hawley's Condensed Chemical Dictionary (14th
Edition). John Wiley & Sons.
12 Notargiacomo, E. Giovine, F. Evangelisti, V. Foglietti, R. Leoni, Mat. Sci. and
Eng. C 19 (2002) 185-188
13 L Bernard, M Calame, S J van der Molen, J Liao, C Schonenberger,
Nanotechnology 18 (2007) 235202 (6pp)
14 H. Xu, D. Qin, Z. Yang, H. Li, Materials Chemistry and Physics 80 (2003) 524-
528
15 H. Y. Dang, J. Wang, S. S. Fan, Nanotechnology 14 (2003) 738-741
16 M. S. Silberberg, Chemistry – The Molecular Nature of Matter and Change, 4th
Edition. 1945 – McGraw Hill publishing
43
17 G. E. Coates, M. L. H. Green, P. Powel, K. Wade, Principles of Organometallic
Chemistry. 1968 Methuen & Co. Ltd.
18 J. S. Thayer, Organometallic Chemistry, an overview. 1988 VCH Publishers, Inc.
New York, NY
19 Y. Wang, M. Aponte, N. Leon, I. Ramos, R. Furlan, N. Pinto, J. Am. Ceram. Soc.
88 (8) 2056-2063 (2005)
20 K. Murakami, I. Yagi, S. Kaneko, J. Am. Ceram. Soc. 79 [10] 2557-62 (1996)
44
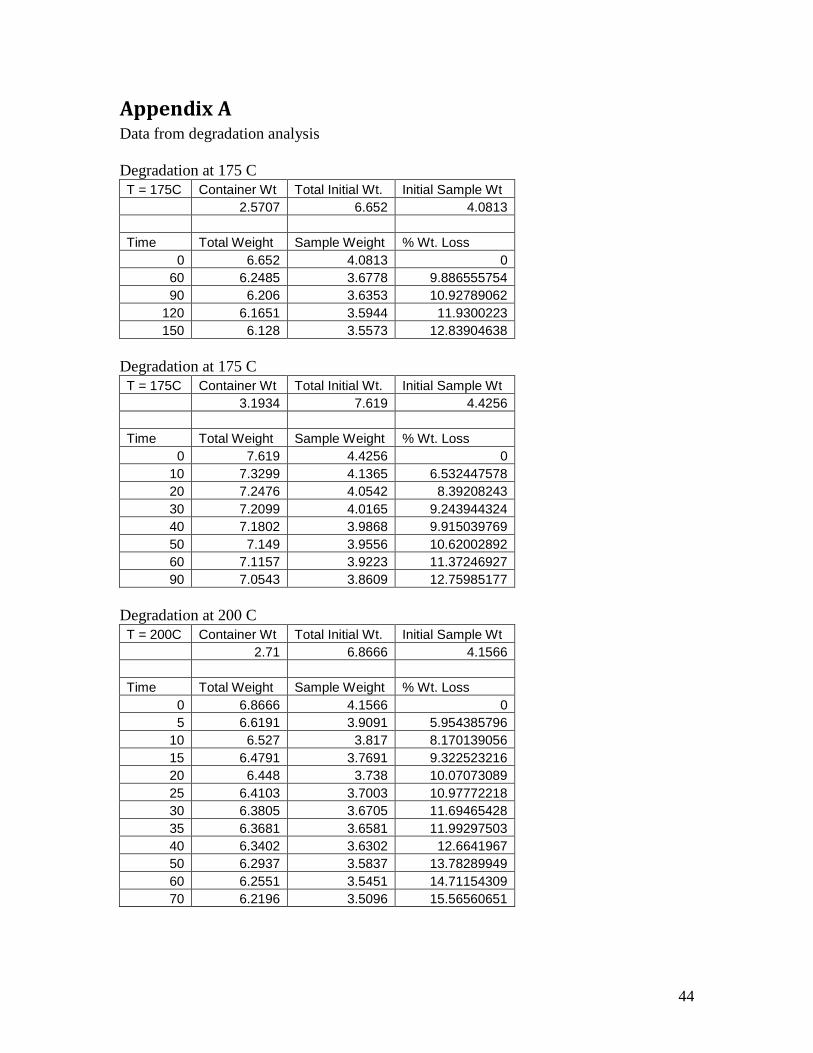
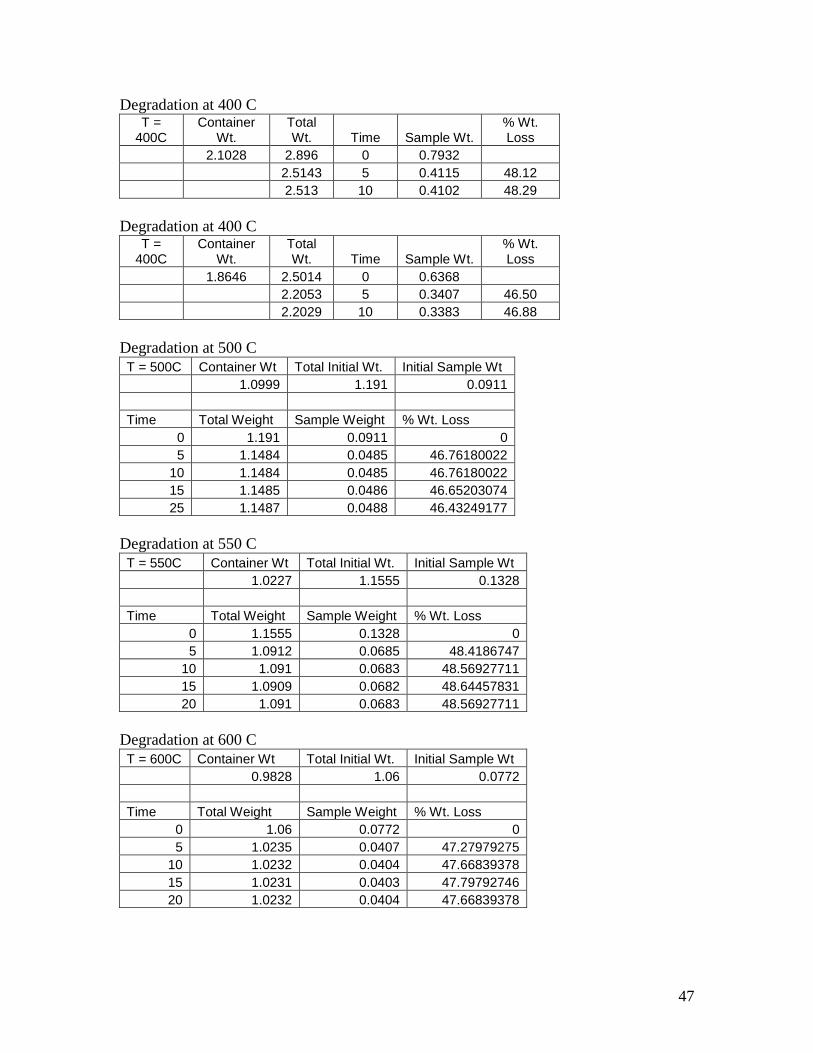
Appendix A Data from degradation analysis
Degradation at 175 C
T = 175C Container Wt Total Initial Wt. Initial Sample Wt
2.5707 6.652 4.0813
Time Total Weight Sample Weight % Wt. Loss
0 6.652 4.0813 0
60 6.2485 3.6778 9.886555754
90 6.206 3.6353 10.92789062
120 6.1651 3.5944 11.9300223
150 6.128 3.5573 12.83904638
Degradation at 175 C
T = 175C Container Wt Total Initial Wt. Initial Sample Wt
3.1934 7.619 4.4256
Time Total Weight Sample Weight % Wt. Loss
0 7.619 4.4256 0
10 7.3299 4.1365 6.532447578
20 7.2476 4.0542 8.39208243
30 7.2099 4.0165 9.243944324
40 7.1802 3.9868 9.915039769
50 7.149 3.9556 10.62002892
60 7.1157 3.9223 11.37246927
90 7.0543 3.8609 12.75985177
Degradation at 200 C
T = 200C Container Wt Total Initial Wt. Initial Sample Wt
2.71 6.8666 4.1566
Time Total Weight Sample Weight % Wt. Loss
0 6.8666 4.1566 0
5 6.6191 3.9091 5.954385796
10 6.527 3.817 8.170139056
15 6.4791 3.7691 9.322523216
20 6.448 3.738 10.07073089
25 6.4103 3.7003 10.97772218
30 6.3805 3.6705 11.69465428
35 6.3681 3.6581 11.99297503
40 6.3402 3.6302 12.6641967
50 6.2937 3.5837 13.78289949
60 6.2551 3.5451 14.71154309
70 6.2196 3.5096 15.56560651
45
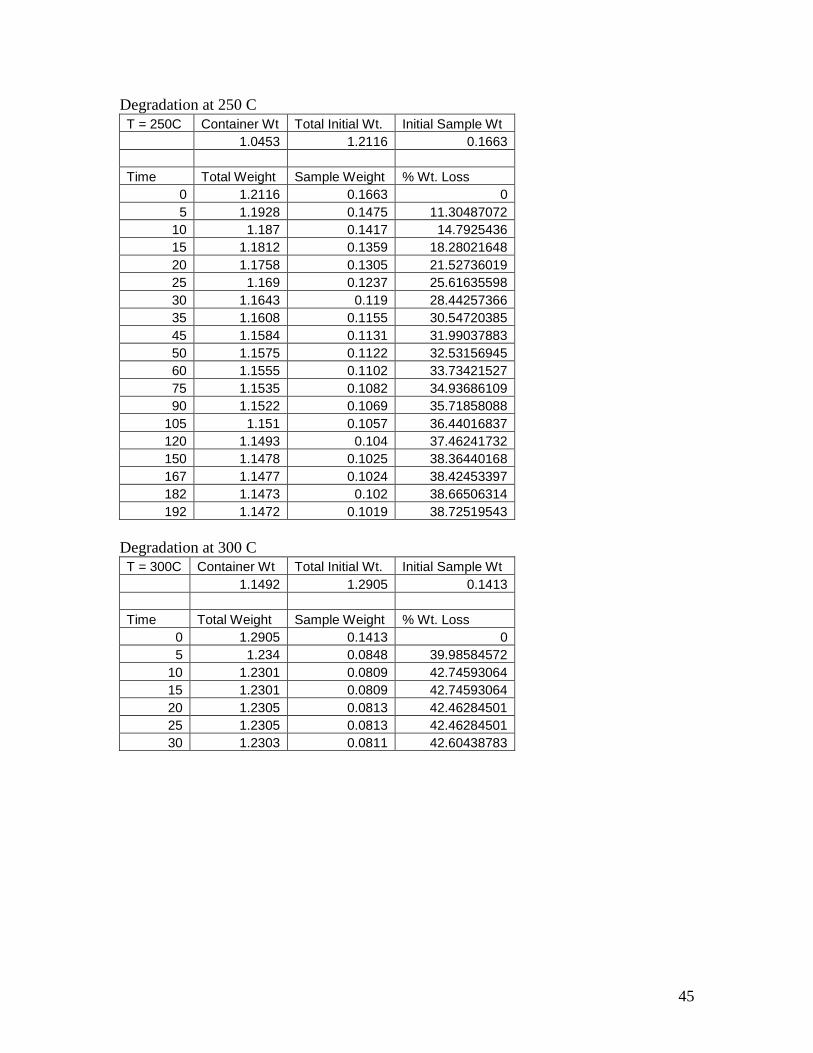
Degradation at 250 C
T = 250C Container Wt Total Initial Wt. Initial Sample Wt
1.0453 1.2116 0.1663
Time Total Weight Sample Weight % Wt. Loss
0 1.2116 0.1663 0
5 1.1928 0.1475 11.30487072
10 1.187 0.1417 14.7925436
15 1.1812 0.1359 18.28021648
20 1.1758 0.1305 21.52736019
25 1.169 0.1237 25.61635598
30 1.1643 0.119 28.44257366
35 1.1608 0.1155 30.54720385
45 1.1584 0.1131 31.99037883
50 1.1575 0.1122 32.53156945
60 1.1555 0.1102 33.73421527
75 1.1535 0.1082 34.93686109
90 1.1522 0.1069 35.71858088
105 1.151 0.1057 36.44016837
120 1.1493 0.104 37.46241732
150 1.1478 0.1025 38.36440168
167 1.1477 0.1024 38.42453397
182 1.1473 0.102 38.66506314
192 1.1472 0.1019 38.72519543
Degradation at 300 C
T = 300C Container Wt Total Initial Wt. Initial Sample Wt
1.1492 1.2905 0.1413
Time Total Weight Sample Weight % Wt. Loss
0 1.2905 0.1413 0
5 1.234 0.0848 39.98584572
10 1.2301 0.0809 42.74593064
15 1.2301 0.0809 42.74593064
20 1.2305 0.0813 42.46284501
25 1.2305 0.0813 42.46284501
30 1.2303 0.0811 42.60438783
46
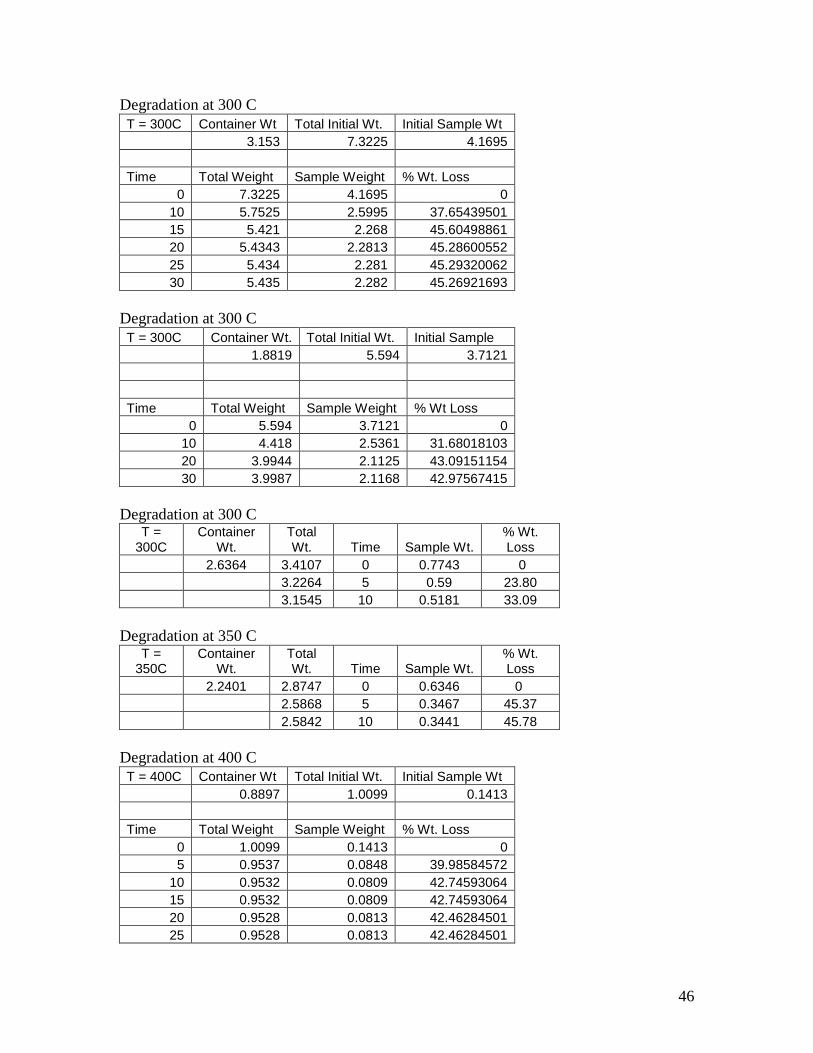
Degradation at 300 C
T = 300C Container Wt Total Initial Wt. Initial Sample Wt
3.153 7.3225 4.1695
Time Total Weight Sample Weight % Wt. Loss
0 7.3225 4.1695 0
10 5.7525 2.5995 37.65439501
15 5.421 2.268 45.60498861
20 5.4343 2.2813 45.28600552
25 5.434 2.281 45.29320062
30 5.435 2.282 45.26921693
Degradation at 300 C
T = 300C Container Wt. Total Initial Wt. Initial Sample
1.8819 5.594 3.7121
Time Total Weight Sample Weight % Wt Loss
0 5.594 3.7121 0
10 4.418 2.5361 31.68018103
20 3.9944 2.1125 43.09151154
30 3.9987 2.1168 42.97567415
Degradation at 300 C T =
300C Container
Wt. Total Wt. Time Sample Wt.
% Wt. Loss
2.6364 3.4107 0 0.7743 0
3.2264 5 0.59 23.80
3.1545 10 0.5181 33.09
Degradation at 350 C T =
350C Container
Wt. Total Wt. Time Sample Wt.
% Wt. Loss
2.2401 2.8747 0 0.6346 0
2.5868 5 0.3467 45.37
2.5842 10 0.3441 45.78
Degradation at 400 C
T = 400C Container Wt Total Initial Wt. Initial Sample Wt
0.8897 1.0099 0.1413
Time Total Weight Sample Weight % Wt. Loss
0 1.0099 0.1413 0
5 0.9537 0.0848 39.98584572
10 0.9532 0.0809 42.74593064
15 0.9532 0.0809 42.74593064
20 0.9528 0.0813 42.46284501
25 0.9528 0.0813 42.46284501
47
Degradation at 400 C T =
400C Container
Wt. Total Wt. Time Sample Wt.
% Wt. Loss
2.1028 2.896 0 0.7932
2.5143 5 0.4115 48.12
2.513 10 0.4102 48.29
Degradation at 400 C T =
400C Container
Wt. Total Wt. Time Sample Wt.
% Wt. Loss
1.8646 2.5014 0 0.6368
2.2053 5 0.3407 46.50
2.2029 10 0.3383 46.88
Degradation at 500 C
T = 500C Container Wt Total Initial Wt. Initial Sample Wt
1.0999 1.191 0.0911
Time Total Weight Sample Weight % Wt. Loss
0 1.191 0.0911 0
5 1.1484 0.0485 46.76180022
10 1.1484 0.0485 46.76180022
15 1.1485 0.0486 46.65203074
25 1.1487 0.0488 46.43249177
Degradation at 550 C
T = 550C Container Wt Total Initial Wt. Initial Sample Wt
1.0227 1.1555 0.1328
Time Total Weight Sample Weight % Wt. Loss
0 1.1555 0.1328 0
5 1.0912 0.0685 48.4186747
10 1.091 0.0683 48.56927711
15 1.0909 0.0682 48.64457831
20 1.091 0.0683 48.56927711
Degradation at 600 C
T = 600C Container Wt Total Initial Wt. Initial Sample Wt
0.9828 1.06 0.0772
Time Total Weight Sample Weight % Wt. Loss
0 1.06 0.0772 0
5 1.0235 0.0407 47.27979275
10 1.0232 0.0404 47.66839378
15 1.0231 0.0403 47.79792746
20 1.0232 0.0404 47.66839378