Appendix A1 PRG Summary Memorandum - New York … · Buffalo River Feasibility Study DRAFT FINAL...
71
Buffalo River Feasibility Study DRAFT FINAL November 19, 2010 Appendix A1 PRG Summary Memorandum
-
Upload
truonghanh -
Category
Documents
-
view
225 -
download
0
Transcript of Appendix A1 PRG Summary Memorandum - New York … · Buffalo River Feasibility Study DRAFT FINAL...

Buffalo River Feasibility Study
D R A F T F I N A L
November 19, 2010
Appendix A1 PRG Summary Memorandum
jcmccool
Rectangle
Ecology Technical Subgroup
Page 1 of 3
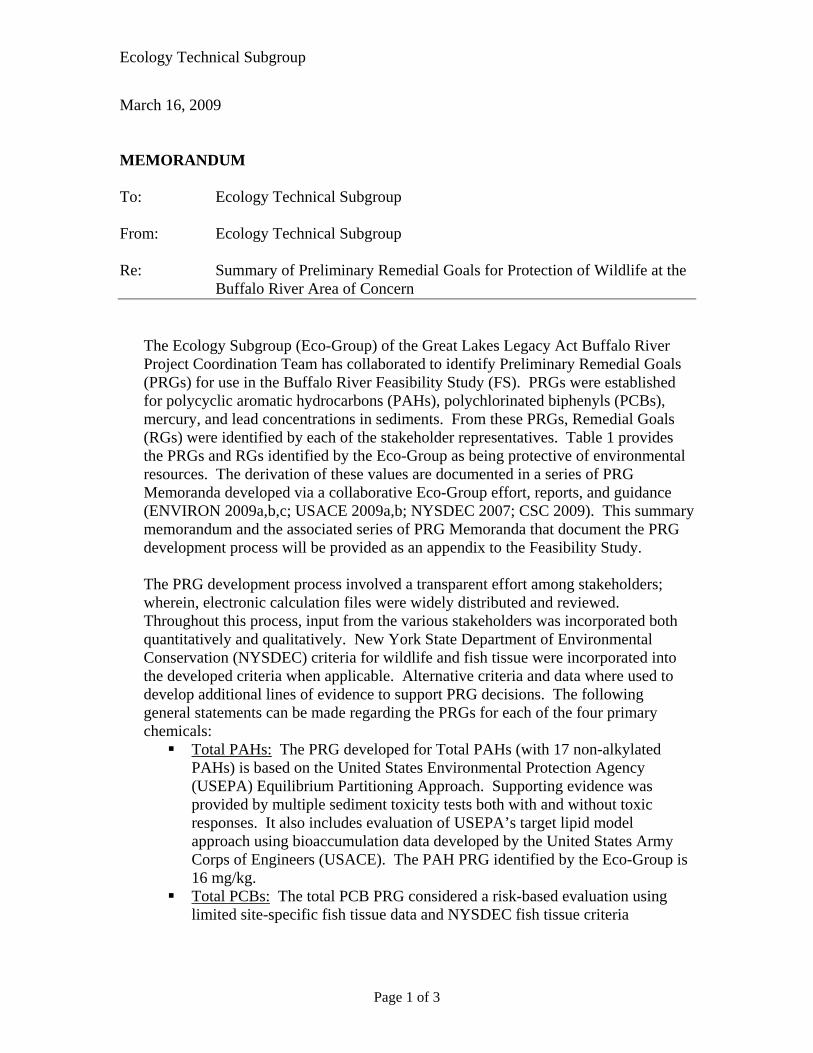
March 16, 2009 MEMORANDUM To: Ecology Technical Subgroup From: Ecology Technical Subgroup Re: Summary of Preliminary Remedial Goals for Protection of Wildlife at the
Buffalo River Area of Concern
The Ecology Subgroup (Eco-Group) of the Great Lakes Legacy Act Buffalo River Project Coordination Team has collaborated to identify Preliminary Remedial Goals (PRGs) for use in the Buffalo River Feasibility Study (FS). PRGs were established for polycyclic aromatic hydrocarbons (PAHs), polychlorinated biphenyls (PCBs), mercury, and lead concentrations in sediments. From these PRGs, Remedial Goals (RGs) were identified by each of the stakeholder representatives. Table 1 provides the PRGs and RGs identified by the Eco-Group as being protective of environmental resources. The derivation of these values are documented in a series of PRG Memoranda developed via a collaborative Eco-Group effort, reports, and guidance (ENVIRON 2009a,b,c; USACE 2009a,b; NYSDEC 2007; CSC 2009). This summary memorandum and the associated series of PRG Memoranda that document the PRG development process will be provided as an appendix to the Feasibility Study. The PRG development process involved a transparent effort among stakeholders; wherein, electronic calculation files were widely distributed and reviewed. Throughout this process, input from the various stakeholders was incorporated both quantitatively and qualitatively. New York State Department of Environmental Conservation (NYSDEC) criteria for wildlife and fish tissue were incorporated into the developed criteria when applicable. Alternative criteria and data where used to develop additional lines of evidence to support PRG decisions. The following general statements can be made regarding the PRGs for each of the four primary chemicals:
Total PAHs: The PRG developed for Total PAHs (with 17 non-alkylated PAHs) is based on the United States Environmental Protection Agency (USEPA) Equilibrium Partitioning Approach. Supporting evidence was provided by multiple sediment toxicity tests both with and without toxic responses. It also includes evaluation of USEPA’s target lipid model approach using bioaccumulation data developed by the United States Army Corps of Engineers (USACE). The PAH PRG identified by the Eco-Group is 16 mg/kg.
Total PCBs: The total PCB PRG considered a risk-based evaluation using limited site-specific fish tissue data and NYSDEC fish tissue criteria
Ecology Technical Subgroup
Page 2 of 3
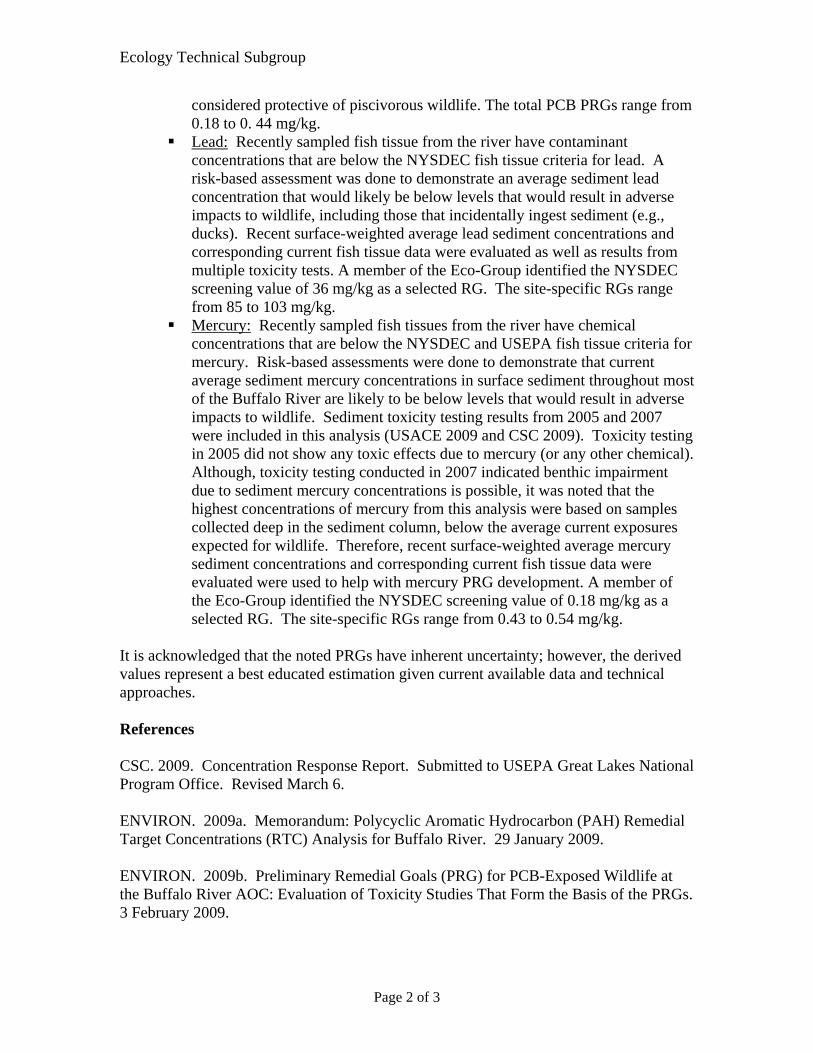
considered protective of piscivorous wildlife. The total PCB PRGs range from 0.18 to 0. 44 mg/kg.
Lead: Recently sampled fish tissue from the river have contaminant concentrations that are below the NYSDEC fish tissue criteria for lead. A risk-based assessment was done to demonstrate an average sediment lead concentration that would likely be below levels that would result in adverse impacts to wildlife, including those that incidentally ingest sediment (e.g., ducks). Recent surface-weighted average lead sediment concentrations and corresponding current fish tissue data were evaluated as well as results from multiple toxicity tests. A member of the Eco-Group identified the NYSDEC screening value of 36 mg/kg as a selected RG. The site-specific RGs range from 85 to 103 mg/kg.
Mercury: Recently sampled fish tissues from the river have chemical concentrations that are below the NYSDEC and USEPA fish tissue criteria for mercury. Risk-based assessments were done to demonstrate that current average sediment mercury concentrations in surface sediment throughout most of the Buffalo River are likely to be below levels that would result in adverse impacts to wildlife. Sediment toxicity testing results from 2005 and 2007 were included in this analysis (USACE 2009 and CSC 2009). Toxicity testing in 2005 did not show any toxic effects due to mercury (or any other chemical). Although, toxicity testing conducted in 2007 indicated benthic impairment due to sediment mercury concentrations is possible, it was noted that the highest concentrations of mercury from this analysis were based on samples collected deep in the sediment column, below the average current exposures expected for wildlife. Therefore, recent surface-weighted average mercury sediment concentrations and corresponding current fish tissue data were evaluated were used to help with mercury PRG development. A member of the Eco-Group identified the NYSDEC screening value of 0.18 mg/kg as a selected RG. The site-specific RGs range from 0.43 to 0.54 mg/kg.
It is acknowledged that the noted PRGs have inherent uncertainty; however, the derived values represent a best educated estimation given current available data and technical approaches. References CSC. 2009. Concentration Response Report. Submitted to USEPA Great Lakes National Program Office. Revised March 6. ENVIRON. 2009a. Memorandum: Polycyclic Aromatic Hydrocarbon (PAH) Remedial Target Concentrations (RTC) Analysis for Buffalo River. 29 January 2009. ENVIRON. 2009b. Preliminary Remedial Goals (PRG) for PCB-Exposed Wildlife at the Buffalo River AOC: Evaluation of Toxicity Studies That Form the Basis of the PRGs. 3 February 2009.
Ecology Technical Subgroup
Page 3 of 3
ENVIRON. 2009c. Memorandum: Preliminary Remedial Goal (PRG) for PCBs and Streamlined Risk Evaluation for PCB-Exposed Wildlife at the Buffalo River AOC. 14 February 2009. ENVIRON. 2009d. Memorandum: Preliminary Remedial Goal (PRG) for Mercury and Lead for Wildlife at the Buffalo River AOC. NYSDEC. 2007. Numerical Guidance Values for Assessing Risk to Aquatic Life from Contaminants in Sediment. Division of Fish, Wildlife, & Marine Resources. June 19. USACE. 2009a. Use of 2005 Toxicity Test on Upper Buffalo River for PRG Development for Protection of Benthic Macroinvertebrates. Power Point presentation to the Ecology Subgroup, January 16, 2009, Buffalo, NY. USACE. 2009b. Development of a Preliminary Remedial Goal for total Polychlorinated Biphenyls (PCBs): Theoretical Bioaccumulation Potential. February 25. Pickard/SWP/4404.
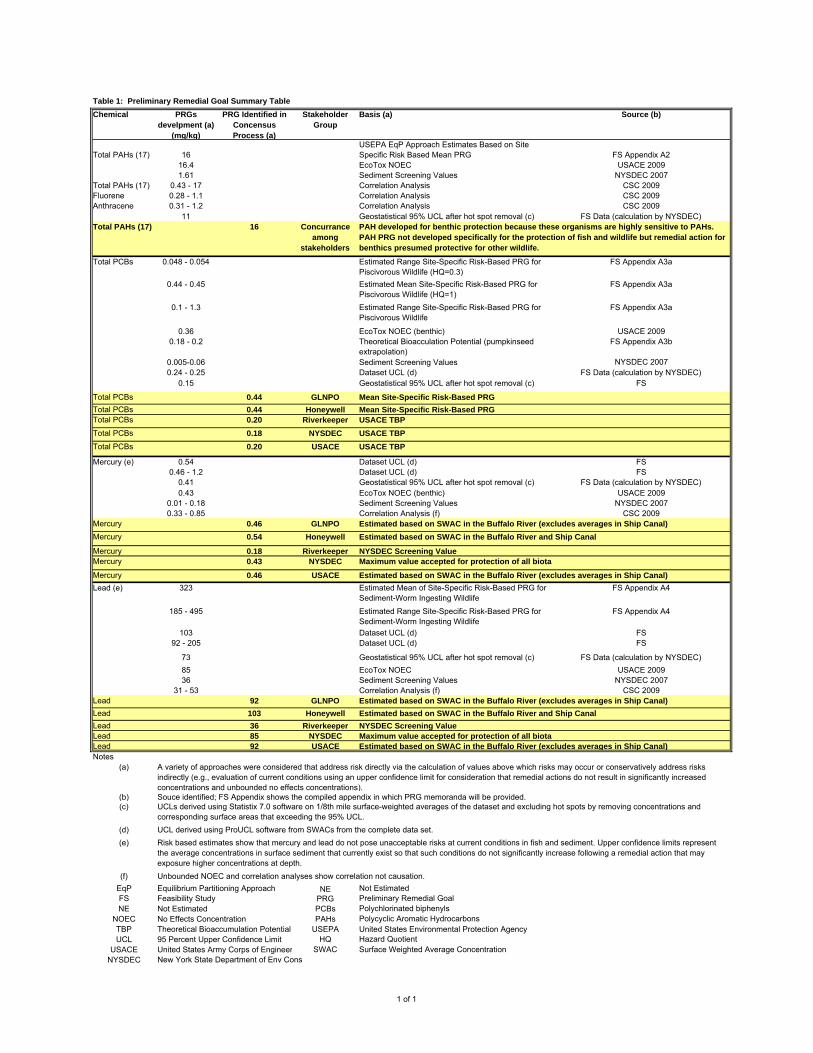
Table 1: Preliminary Remedial Goal Summary Table
Chemical PRGs develpment (a)
(mg/kg)
PRG Identified in Concensus Process (a)
Stakeholder Group
Basis (a) Source (b)
Total PAHs (17) 16USEPA EqP Approach Estimates Based on Site Specific Risk Based Mean PRG FS Appendix A2
16.4 EcoTox NOEC USACE 20091.61 Sediment Screening Values NYSDEC 2007
Total PAHs (17) 0.43 - 17 Correlation Analysis CSC 2009Fluorene 0.28 - 1.1 Correlation Analysis CSC 2009Anthracene 0.31 - 1.2 Correlation Analysis CSC 2009
11 Geostatistical 95% UCL after hot spot removal (c) FS Data (calculation by NYSDEC)Total PAHs (17) 16 Concurrance
among stakeholders
PAH developed for benthic protection because these organisms are highly sensitive to PAHs. PAH PRG not developed specifically for the protection of fish and wildlife but remedial action for benthics presumed protective for other wildlife.
Total PCBs 0.048 - 0.054 Estimated Range Site-Specific Risk-Based PRG for Piscivorous Wildlife (HQ=0.3)
FS Appendix A3a
0.44 - 0.45 Estimated Mean Site-Specific Risk-Based PRG for Piscivorous Wildlife (HQ=1)
FS Appendix A3a
0.1 - 1.3 Estimated Range Site-Specific Risk-Based PRG for Piscivorous Wildlife
FS Appendix A3a
0.36 EcoTox NOEC (benthic) USACE 20090.18 - 0.2 Theoretical Bioacculation Potential (pumpkinseed
extrapolation)FS Appendix A3b
0.005-0.06 Sediment Screening Values NYSDEC 20070.24 - 0.25 Dataset UCL (d) FS Data (calculation by NYSDEC)
0.15 Geostatistical 95% UCL after hot spot removal (c) FS
Total PCBs 0.44 GLNPO Mean Site-Specific Risk-Based PRG
Total PCBs 0.44 Honeywell Mean Site-Specific Risk-Based PRGTotal PCBs 0.20 Riverkeeper USACE TBP
Total PCBs 0.18 NYSDEC USACE TBP
Total PCBs 0.20 USACE USACE TBP
Mercury (e) 0.54 Dataset UCL (d) FS0.46 - 1.2 Dataset UCL (d) FS
0.41 Geostatistical 95% UCL after hot spot removal (c) FS Data (calculation by NYSDEC)0.43 EcoTox NOEC (benthic) USACE 2009
0.01 - 0.18 Sediment Screening Values NYSDEC 20070.33 - 0.85 Correlation Analysis (f) CSC 2009
Mercury 0.46 GLNPO Estimated based on SWAC in the Buffalo River (excludes averages in Ship Canal)
Mercury 0.54 Honeywell Estimated based on SWAC in the Buffalo River and Ship Canal
Mercury 0.18 Riverkeeper NYSDEC Screening ValueMercury 0.43 NYSDEC Maximum value accepted for protection of all biota
Mercury 0.46 USACE Estimated based on SWAC in the Buffalo River (excludes averages in Ship Canal)
Lead (e) 323 Estimated Mean of Site-Specific Risk-Based PRG for Sediment-Worm Ingesting Wildlife
FS Appendix A4
185 - 495 Estimated Range Site-Specific Risk-Based PRG for Sediment-Worm Ingesting Wildlife
FS Appendix A4
103 Dataset UCL (d) FS92 - 205 Dataset UCL (d) FS
73 Geostatistical 95% UCL after hot spot removal (c) FS Data (calculation by NYSDEC)85 EcoTox NOEC USACE 200936 Sediment Screening Values NYSDEC 2007
31 - 53 Correlation Analysis (f) CSC 2009Lead 92 GLNPO Estimated based on SWAC in the Buffalo River (excludes averages in Ship Canal)
Lead 103 Honeywell Estimated based on SWAC in the Buffalo River and Ship Canal
Lead 36 Riverkeeper NYSDEC Screening ValueLead 85 NYSDEC Maximum value accepted for protection of all biotaLead 92 USACE Estimated based on SWAC in the Buffalo River (excludes averages in Ship Canal)Notes
(a) A variety of approaches were considered that address risk directly via the calculation of values above which risks may occur or conservatively address risks indirectly (e.g., evaluation of current conditions using an upper confidence limit for consideration that remedial actions do not result in significantly increased concentrations and unbounded no effects concentrations).
(b) Souce identified; FS Appendix shows the compiled appendix in which PRG memoranda will be provided.(c) UCLs derived using Statistix 7.0 software on 1/8th mile surface-weighted averages of the dataset and excluding hot spots by removing concentrations and
corresponding surface areas that exceeding the 95% UCL.(d) UCL derived using ProUCL software from SWACs from the complete data set. (e) Risk based estimates show that mercury and lead do not pose unacceptable risks at current conditions in fish and sediment. Upper confidence limits represent
the average concentrations in surface sediment that currently exist so that such conditions do not significantly increase following a remedial action that may exposure higher concentrations at depth.
(f) Unbounded NOEC and correlation analyses show correlation not causation.EqP Equilibrium Partitioning Approach NE Not EstimatedFS Feasibility Study PRG Preliminary Remedial GoalNE Not Estimated PCBs Polychlorinated biphenyls
NOEC No Effects Concentration PAHs Polycyclic Aromatic HydrocarbonsTBP Theoretical Bioaccumulation Potential USEPA United States Environmental Protection AgencyUCL 95 Percent Upper Confidence Limit HQ Hazard Quotient
USACE United States Army Corps of Engineer SWAC Surface Weighted Average ConcentrationNYSDEC New York State Department of Env Cons
1 of 1

Buffalo River Feasibility Study
D R A F T F I N A L
November 19, 2010
Appendix A2 PAH PRG Memorandum
Page 1 of 4
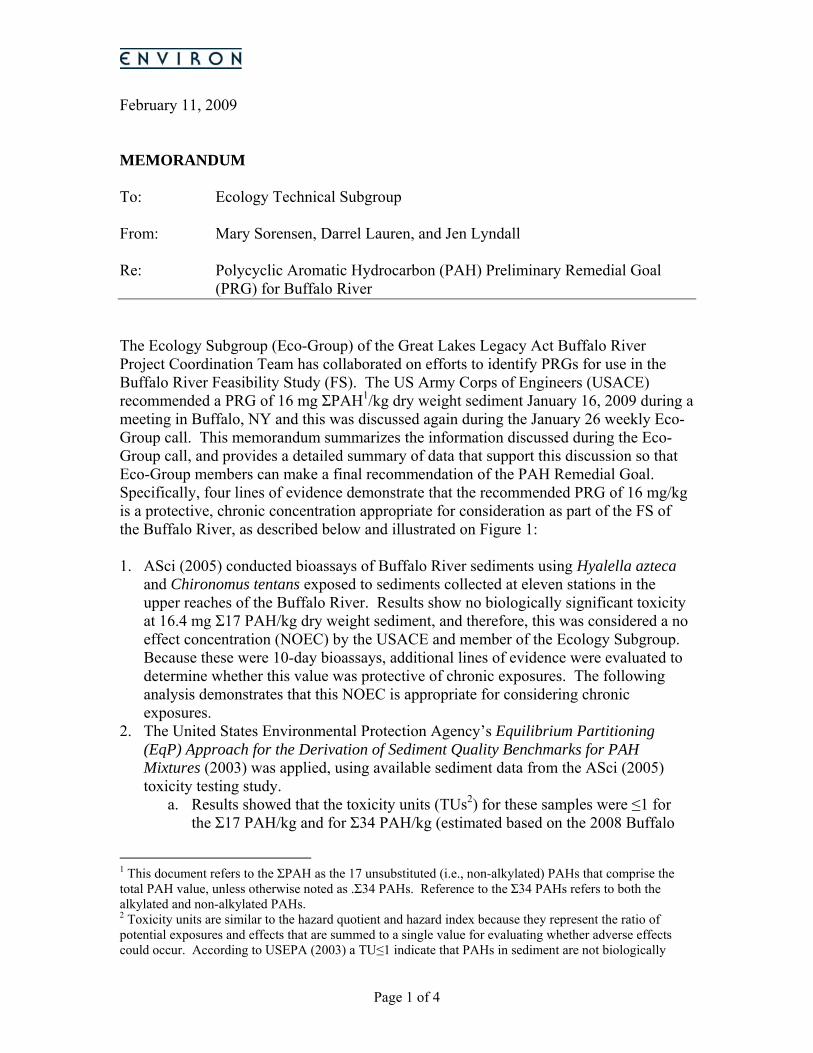
February 11, 2009 MEMORANDUM To: Ecology Technical Subgroup From: Mary Sorensen, Darrel Lauren, and Jen Lyndall Re: Polycyclic Aromatic Hydrocarbon (PAH) Preliminary Remedial Goal
(PRG) for Buffalo River The Ecology Subgroup (Eco-Group) of the Great Lakes Legacy Act Buffalo River Project Coordination Team has collaborated on efforts to identify PRGs for use in the Buffalo River Feasibility Study (FS). The US Army Corps of Engineers (USACE) recommended a PRG of 16 mg ΣPAH1/kg dry weight sediment January 16, 2009 during a meeting in Buffalo, NY and this was discussed again during the January 26 weekly Eco-Group call. This memorandum summarizes the information discussed during the Eco-Group call, and provides a detailed summary of data that support this discussion so that Eco-Group members can make a final recommendation of the PAH Remedial Goal. Specifically, four lines of evidence demonstrate that the recommended PRG of 16 mg/kg is a protective, chronic concentration appropriate for consideration as part of the FS of the Buffalo River, as described below and illustrated on Figure 1: 1. ASci (2005) conducted bioassays of Buffalo River sediments using Hyalella azteca
and Chironomus tentans exposed to sediments collected at eleven stations in the upper reaches of the Buffalo River. Results show no biologically significant toxicity at 16.4 mg Σ17 PAH/kg dry weight sediment, and therefore, this was considered a no effect concentration (NOEC) by the USACE and member of the Ecology Subgroup. Because these were 10-day bioassays, additional lines of evidence were evaluated to determine whether this value was protective of chronic exposures. The following analysis demonstrates that this NOEC is appropriate for considering chronic exposures.
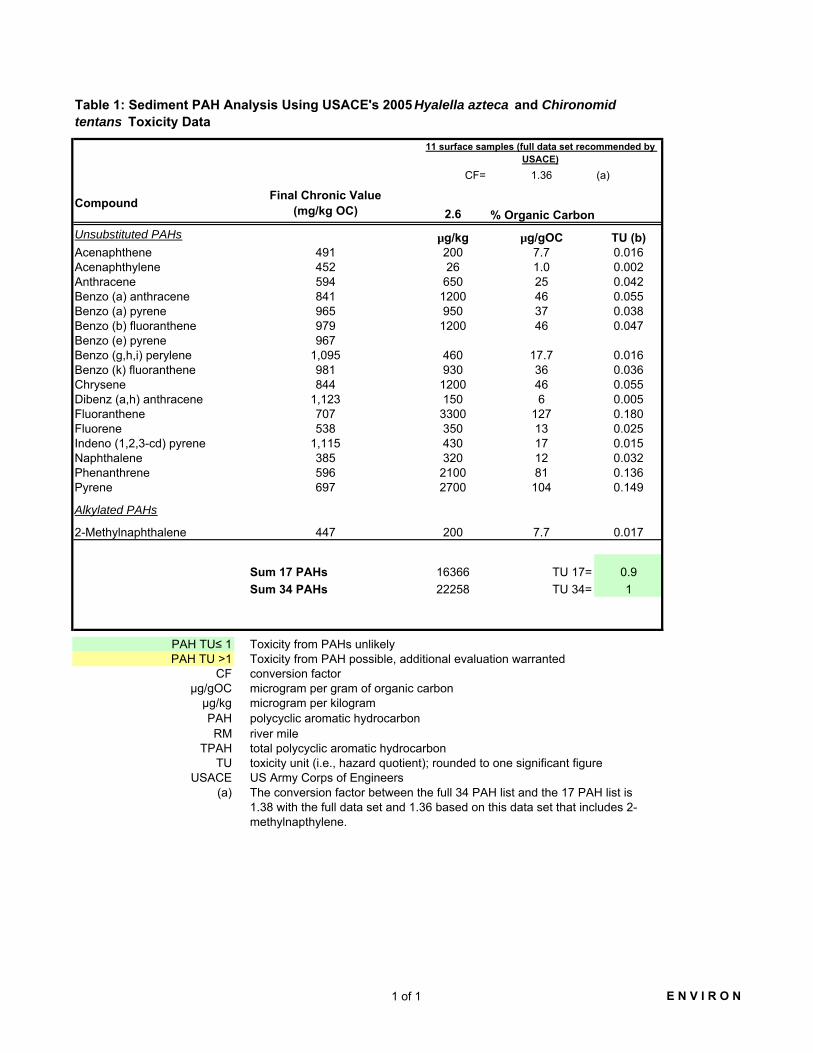
2. The United States Environmental Protection Agency’s Equilibrium Partitioning (EqP) Approach for the Derivation of Sediment Quality Benchmarks for PAH Mixtures (2003) was applied, using available sediment data from the ASci (2005) toxicity testing study.
a. Results showed that the toxicity units (TUs2) for these samples were ≤1 for the Σ17 PAH/kg and for Σ34 PAH/kg (estimated based on the 2008 Buffalo
1 This document refers to the ΣPAH as the 17 unsubstituted (i.e., non-alkylated) PAHs that comprise the total PAH value, unless otherwise noted as .Σ34 PAHs. Reference to the Σ34 PAHs refers to both the alkylated and non-alkylated PAHs. 2 Toxicity units are similar to the hazard quotient and hazard index because they represent the ratio of potential exposures and effects that are summed to a single value for evaluating whether adverse effects could occur. According to USEPA (2003) a TU≤1 indicate that PAHs in sediment are not biologically
Page 2 of 4
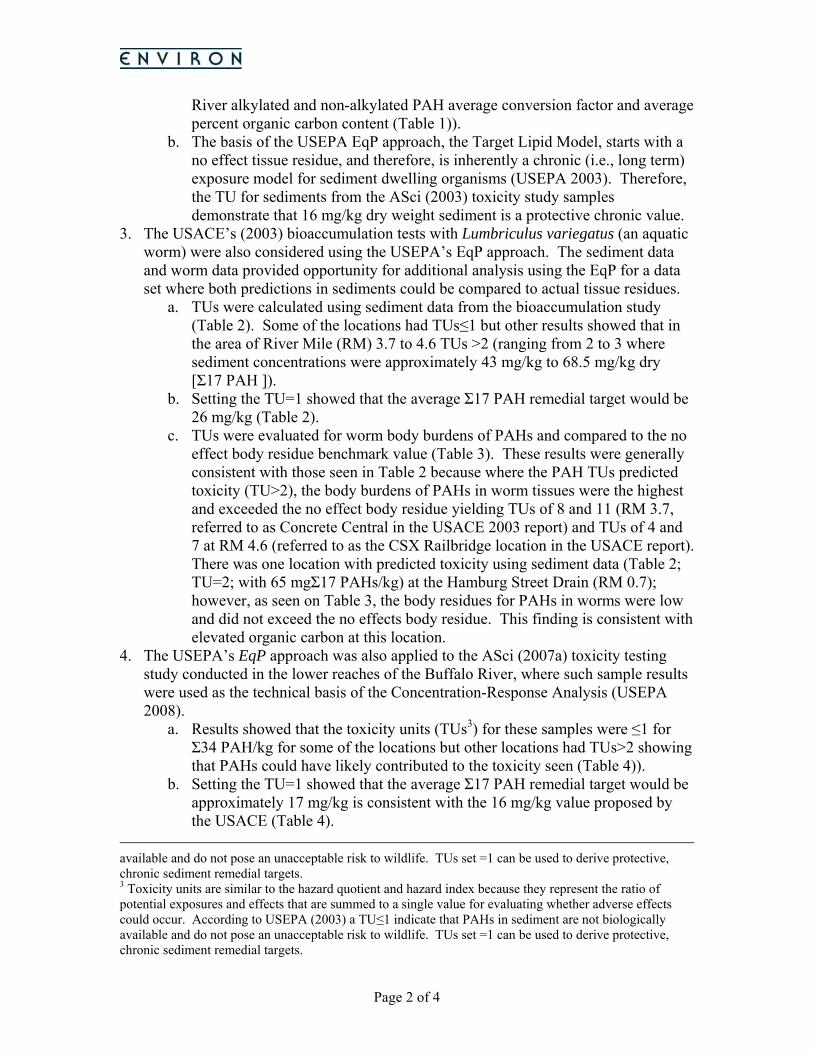
River alkylated and non-alkylated PAH average conversion factor and average percent organic carbon content (Table 1)).
b. The basis of the USEPA EqP approach, the Target Lipid Model, starts with a no effect tissue residue, and therefore, is inherently a chronic (i.e., long term) exposure model for sediment dwelling organisms (USEPA 2003). Therefore, the TU for sediments from the ASci (2003) toxicity study samples demonstrate that 16 mg/kg dry weight sediment is a protective chronic value.
3. The USACE’s (2003) bioaccumulation tests with Lumbriculus variegatus (an aquatic worm) were also considered using the USEPA’s EqP approach. The sediment data and worm data provided opportunity for additional analysis using the EqP for a data set where both predictions in sediments could be compared to actual tissue residues.
a. TUs were calculated using sediment data from the bioaccumulation study (Table 2). Some of the locations had TUs≤1 but other results showed that in the area of River Mile (RM) 3.7 to 4.6 TUs >2 (ranging from 2 to 3 where sediment concentrations were approximately 43 mg/kg to 68.5 mg/kg dry [Σ17 PAH ]).
b. Setting the TU=1 showed that the average Σ17 PAH remedial target would be 26 mg/kg (Table 2).
c. TUs were evaluated for worm body burdens of PAHs and compared to the no effect body residue benchmark value (Table 3). These results were generally consistent with those seen in Table 2 because where the PAH TUs predicted toxicity (TU>2), the body burdens of PAHs in worm tissues were the highest and exceeded the no effect body residue yielding TUs of 8 and 11 (RM 3.7, referred to as Concrete Central in the USACE 2003 report) and TUs of 4 and 7 at RM 4.6 (referred to as the CSX Railbridge location in the USACE report). There was one location with predicted toxicity using sediment data (Table 2; TU=2; with 65 mgΣ17 PAHs/kg) at the Hamburg Street Drain (RM 0.7); however, as seen on Table 3, the body residues for PAHs in worms were low and did not exceed the no effects body residue. This finding is consistent with elevated organic carbon at this location.
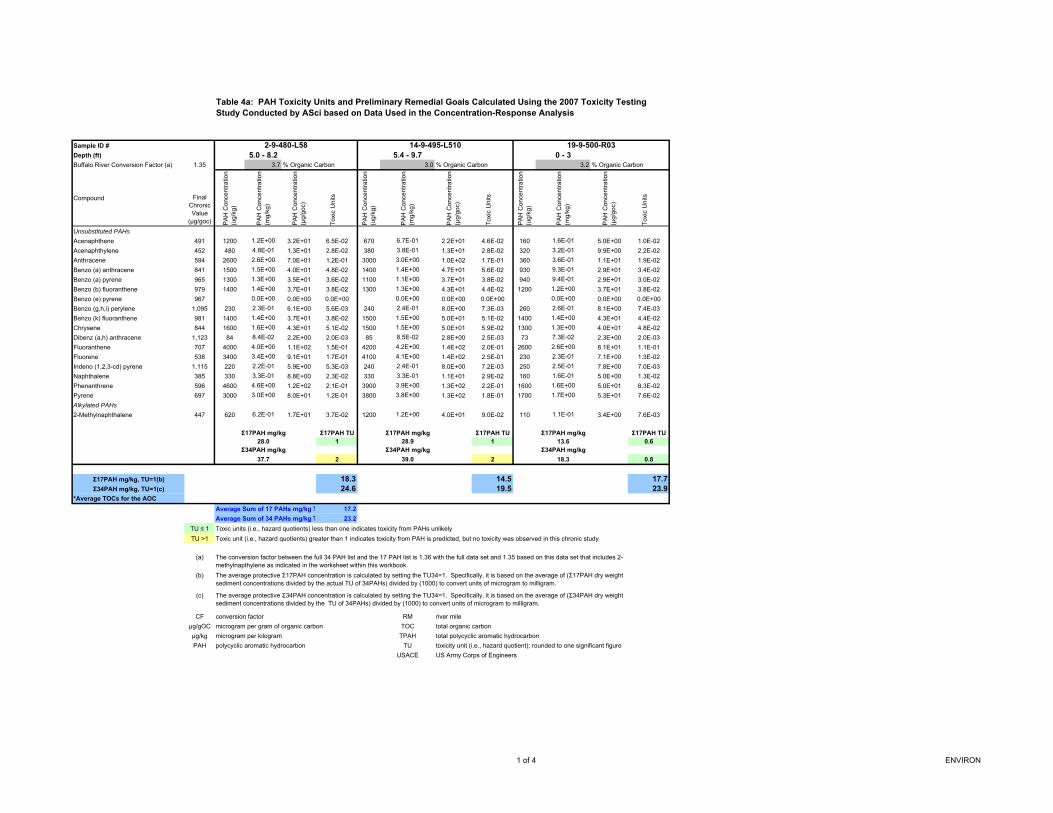
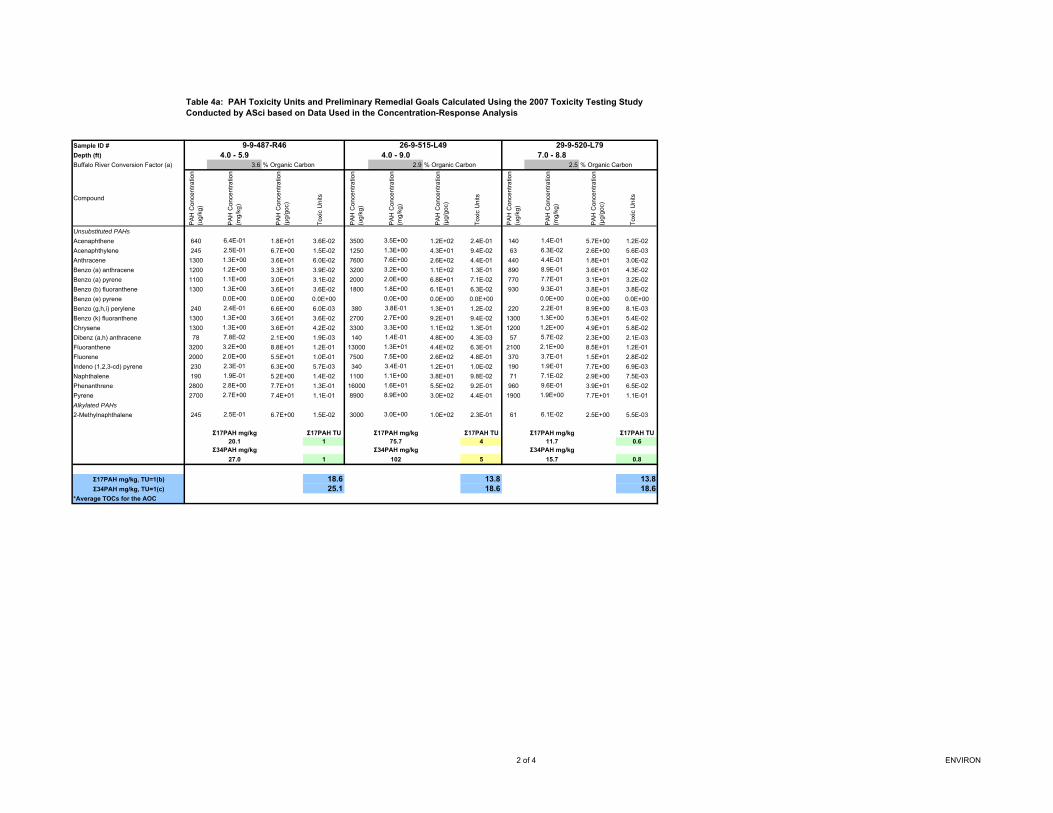
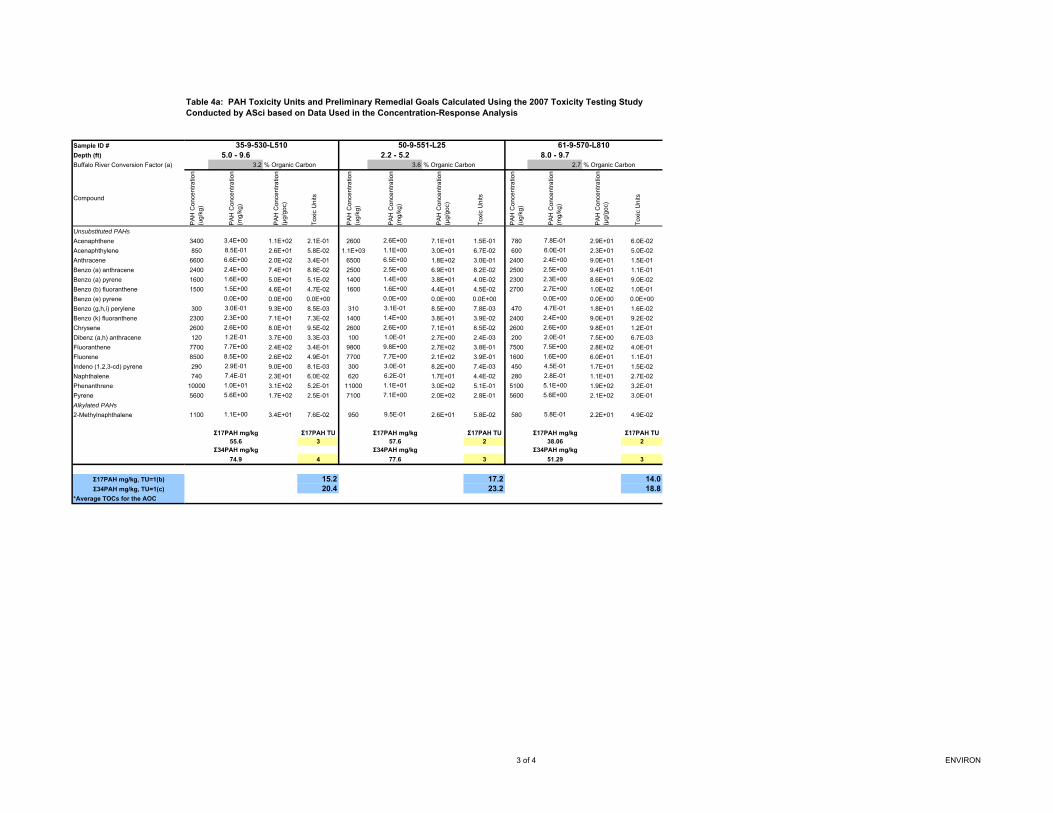
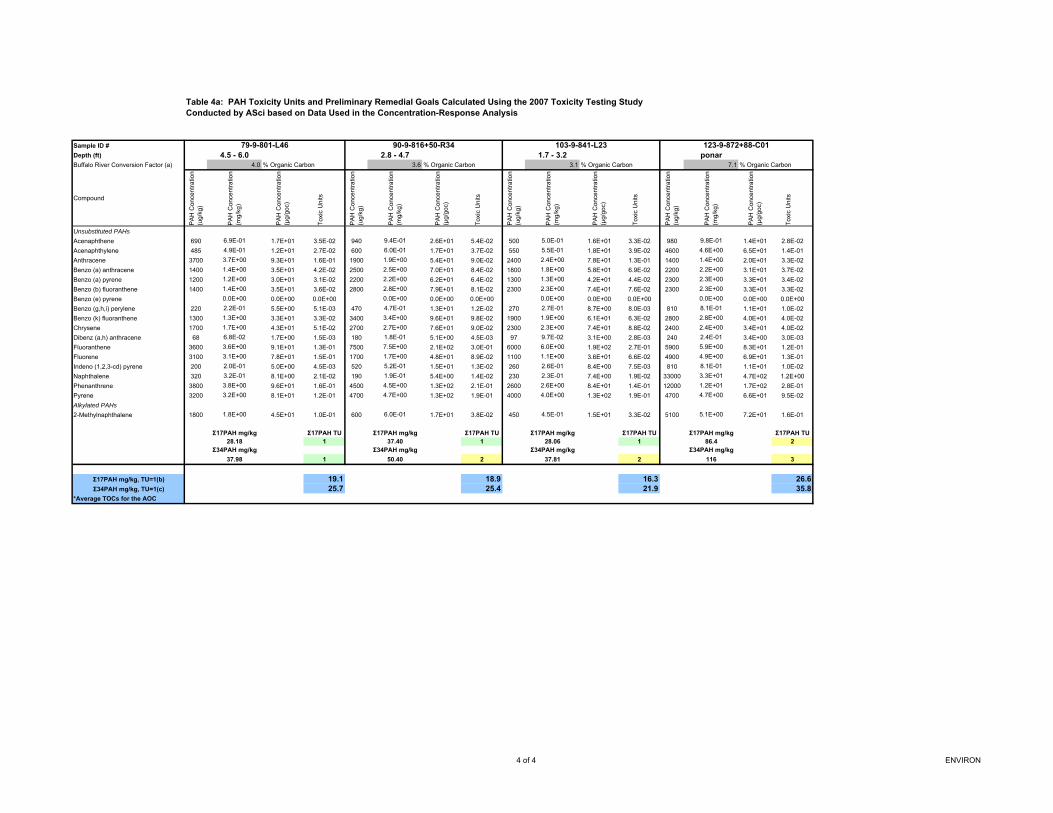
4. The USEPA’s EqP approach was also applied to the ASci (2007a) toxicity testing study conducted in the lower reaches of the Buffalo River, where such sample results were used as the technical basis of the Concentration-Response Analysis (USEPA 2008).
a. Results showed that the toxicity units (TUs3) for these samples were ≤1 for Σ34 PAH/kg for some of the locations but other locations had TUs>2 showing that PAHs could have likely contributed to the toxicity seen (Table 4)).
b. Setting the TU=1 showed that the average Σ17 PAH remedial target would be approximately 17 mg/kg is consistent with the 16 mg/kg value proposed by the USACE (Table 4).
available and do not pose an unacceptable risk to wildlife. TUs set =1 can be used to derive protective, chronic sediment remedial targets. 3 Toxicity units are similar to the hazard quotient and hazard index because they represent the ratio of potential exposures and effects that are summed to a single value for evaluating whether adverse effects could occur. According to USEPA (2003) a TU≤1 indicate that PAHs in sediment are not biologically available and do not pose an unacceptable risk to wildlife. TUs set =1 can be used to derive protective, chronic sediment remedial targets.
Page 3 of 4
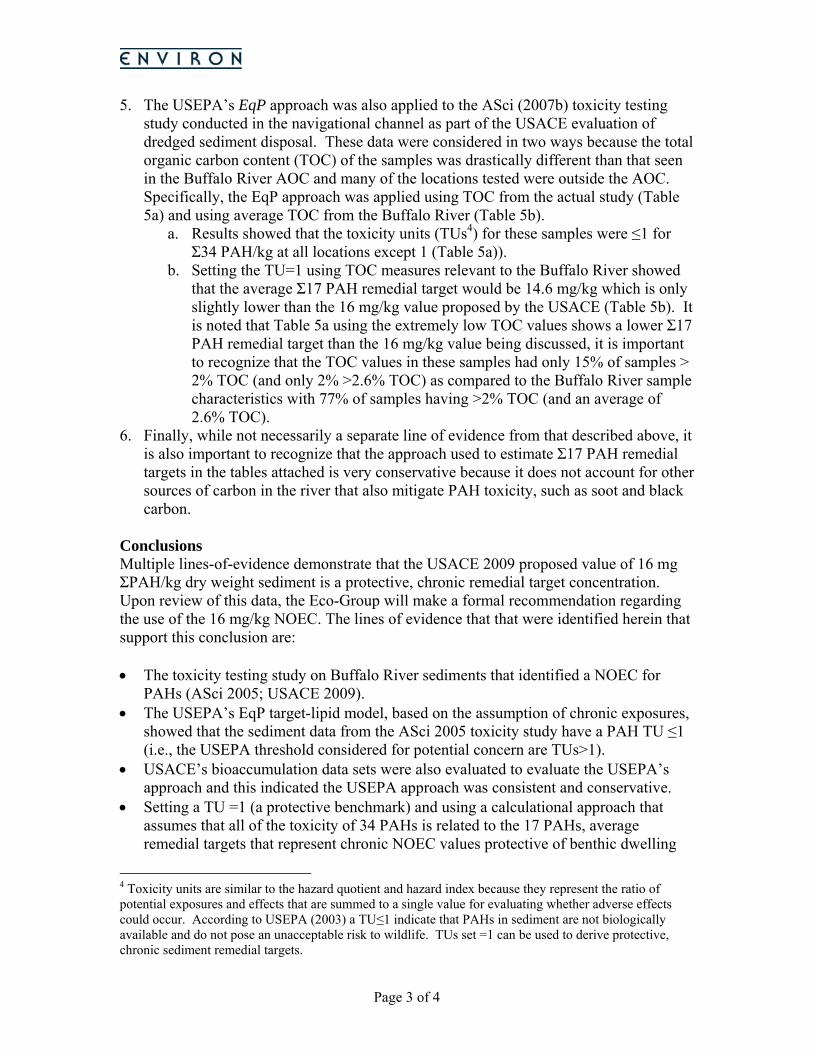
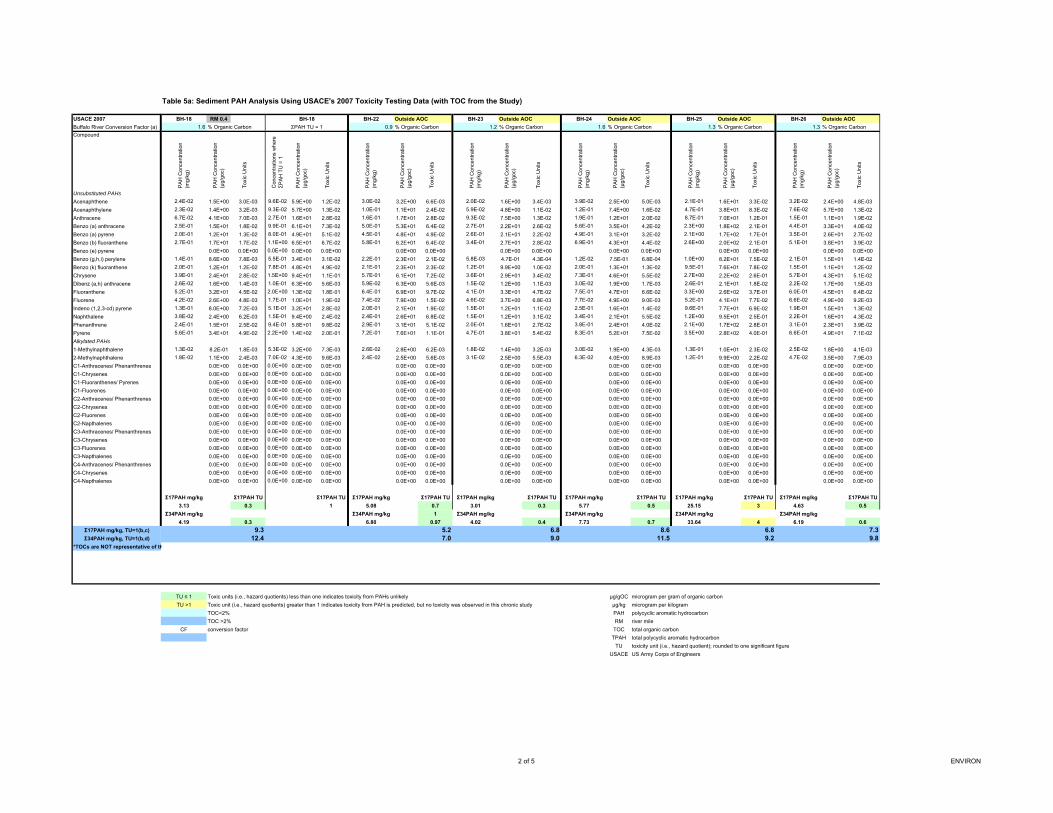
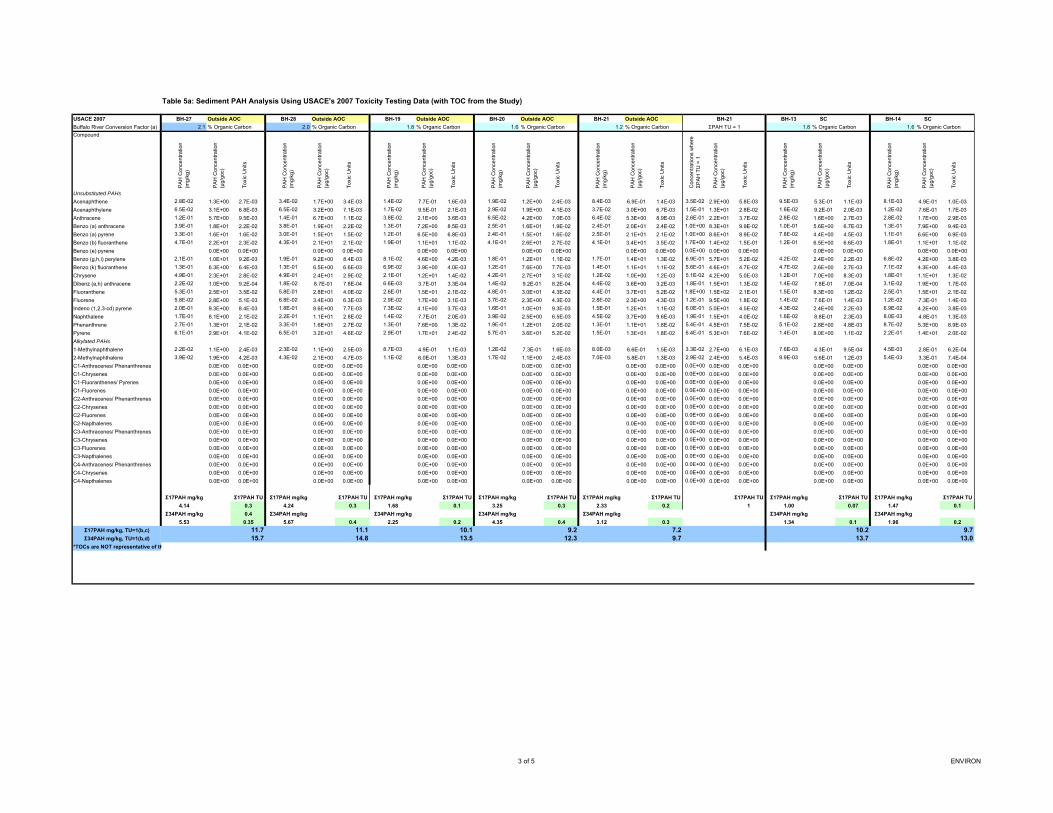
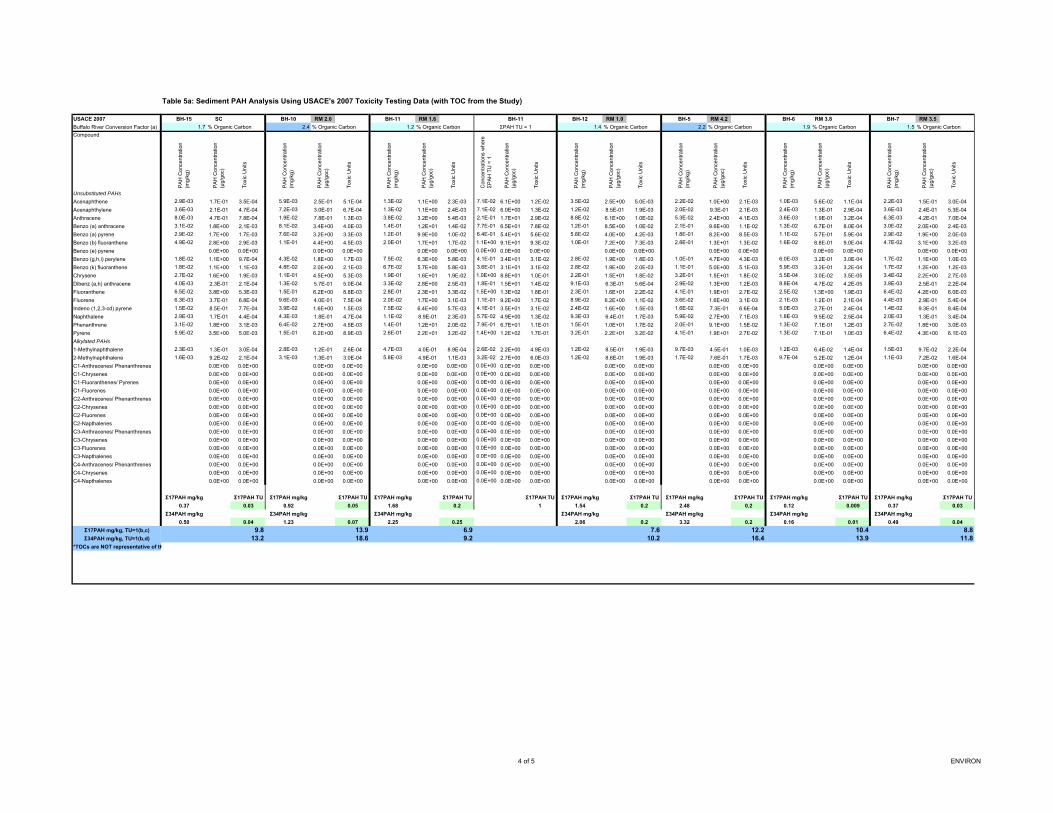
5. The USEPA’s EqP approach was also applied to the ASci (2007b) toxicity testing study conducted in the navigational channel as part of the USACE evaluation of dredged sediment disposal. These data were considered in two ways because the total organic carbon content (TOC) of the samples was drastically different than that seen in the Buffalo River AOC and many of the locations tested were outside the AOC. Specifically, the EqP approach was applied using TOC from the actual study (Table 5a) and using average TOC from the Buffalo River (Table 5b).
a. Results showed that the toxicity units (TUs4) for these samples were ≤1 for Σ34 PAH/kg at all locations except 1 (Table 5a)).
b. Setting the TU=1 using TOC measures relevant to the Buffalo River showed that the average Σ17 PAH remedial target would be 14.6 mg/kg which is only slightly lower than the 16 mg/kg value proposed by the USACE (Table 5b). It is noted that Table 5a using the extremely low TOC values shows a lower Σ17 PAH remedial target than the 16 mg/kg value being discussed, it is important to recognize that the TOC values in these samples had only 15% of samples > 2% TOC (and only 2% >2.6% TOC) as compared to the Buffalo River sample characteristics with 77% of samples having >2% TOC (and an average of 2.6% TOC).
6. Finally, while not necessarily a separate line of evidence from that described above, it is also important to recognize that the approach used to estimate Σ17 PAH remedial targets in the tables attached is very conservative because it does not account for other sources of carbon in the river that also mitigate PAH toxicity, such as soot and black carbon.
Conclusions Multiple lines-of-evidence demonstrate that the USACE 2009 proposed value of 16 mg ΣPAH/kg dry weight sediment is a protective, chronic remedial target concentration. Upon review of this data, the Eco-Group will make a formal recommendation regarding the use of the 16 mg/kg NOEC. The lines of evidence that that were identified herein that support this conclusion are: The toxicity testing study on Buffalo River sediments that identified a NOEC for
PAHs (ASci 2005; USACE 2009). The USEPA’s EqP target-lipid model, based on the assumption of chronic exposures,
showed that the sediment data from the ASci 2005 toxicity study have a PAH TU ≤1 (i.e., the USEPA threshold considered for potential concern are TUs>1).
USACE’s bioaccumulation data sets were also evaluated to evaluate the USEPA’s approach and this indicated the USEPA approach was consistent and conservative.
Setting a TU =1 (a protective benchmark) and using a calculational approach that assumes that all of the toxicity of 34 PAHs is related to the 17 PAHs, average remedial targets that represent chronic NOEC values protective of benthic dwelling
4 Toxicity units are similar to the hazard quotient and hazard index because they represent the ratio of potential exposures and effects that are summed to a single value for evaluating whether adverse effects could occur. According to USEPA (2003) a TU≤1 indicate that PAHs in sediment are not biologically available and do not pose an unacceptable risk to wildlife. TUs set =1 can be used to derive protective, chronic sediment remedial targets.
Page 4 of 4
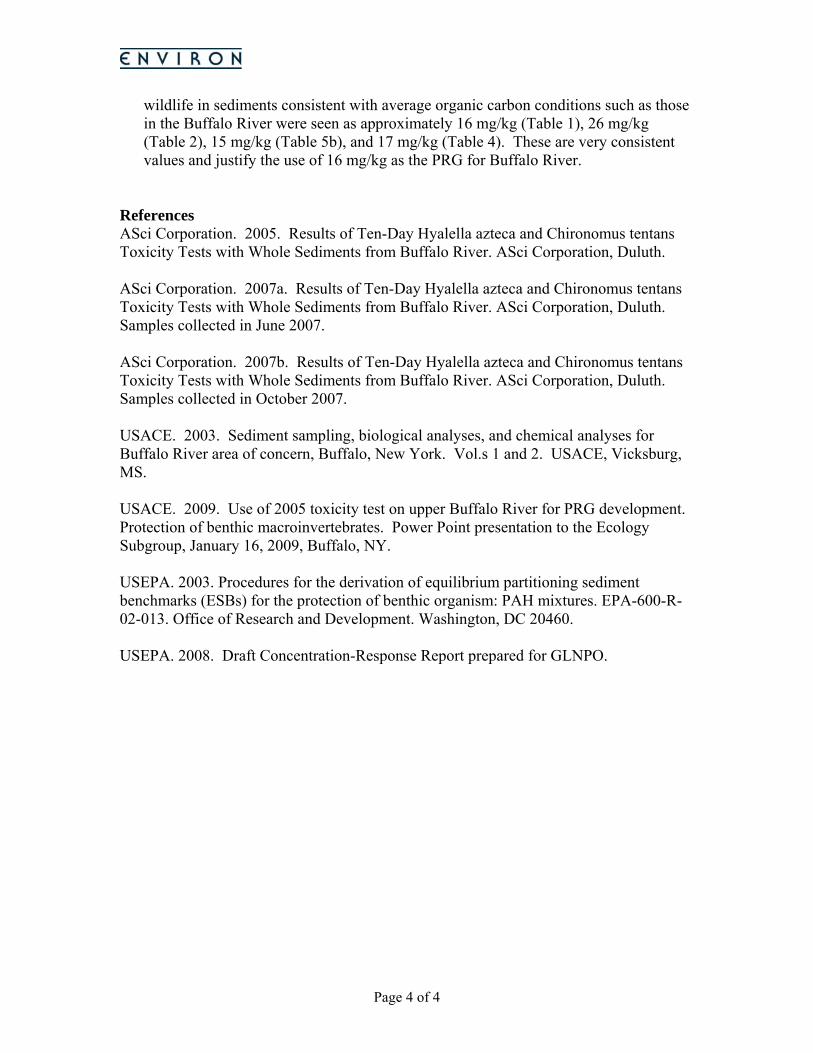
wildlife in sediments consistent with average organic carbon conditions such as those in the Buffalo River were seen as approximately 16 mg/kg (Table 1), 26 mg/kg (Table 2), 15 mg/kg (Table 5b), and 17 mg/kg (Table 4). These are very consistent values and justify the use of 16 mg/kg as the PRG for Buffalo River.
References ASci Corporation. 2005. Results of Ten-Day Hyalella azteca and Chironomus tentans Toxicity Tests with Whole Sediments from Buffalo River. ASci Corporation, Duluth. ASci Corporation. 2007a. Results of Ten-Day Hyalella azteca and Chironomus tentans Toxicity Tests with Whole Sediments from Buffalo River. ASci Corporation, Duluth. Samples collected in June 2007. ASci Corporation. 2007b. Results of Ten-Day Hyalella azteca and Chironomus tentans Toxicity Tests with Whole Sediments from Buffalo River. ASci Corporation, Duluth. Samples collected in October 2007. USACE. 2003. Sediment sampling, biological analyses, and chemical analyses for Buffalo River area of concern, Buffalo, New York. Vol.s 1 and 2. USACE, Vicksburg, MS. USACE. 2009. Use of 2005 toxicity test on upper Buffalo River for PRG development. Protection of benthic macroinvertebrates. Power Point presentation to the Ecology Subgroup, January 16, 2009, Buffalo, NY. USEPA. 2003. Procedures for the derivation of equilibrium partitioning sediment benchmarks (ESBs) for the protection of benthic organism: PAH mixtures. EPA-600-R-02-013. Office of Research and Development. Washington, DC 20460. USEPA. 2008. Draft Concentration-Response Report prepared for GLNPO.
CF= 1.36 (a)
Compound Final Chronic Value (mg/kg OC) 2.6 % Organic Carbon
Unsubstituted PAHs µg/kg µg/gOC TU (b)Acenaphthene 491 200 7.7 0.016Acenaphthylene 452 26 1.0 0.002Anthracene 594 650 25 0.042Benzo (a) anthracene 841 1200 46 0.055Benzo (a) pyrene 965 950 37 0.038Benzo (b) fluoranthene 979 1200 46 0.047Benzo (e) pyrene 967Benzo (g,h,i) perylene 1,095 460 17.7 0.016Benzo (k) fluoranthene 981 930 36 0.036Chrysene 844 1200 46 0.055Dibenz (a,h) anthracene 1,123 150 6 0.005Fluoranthene 707 3300 127 0.180Fluorene 538 350 13 0.025Indeno (1,2,3-cd) pyrene 1,115 430 17 0.015Naphthalene 385 320 12 0.032Phenanthrene 596 2100 81 0.136Pyrene 697 2700 104 0.149
Alkylated PAHs
2-Methylnaphthalene 447 200 7.7 0.017
Sum 17 PAHs 16366 TU 17= 0.9
Sum 34 PAHs 22258 TU 34= 1
PAH TU≤ 1 Toxicity from PAHs unlikelyPAH TU >1 Toxicity from PAH possible, additional evaluation warranted
CF conversion factorµg/gOC microgram per gram of organic carbon
µg/kg microgram per kilogramPAH polycyclic aromatic hydrocarbonRM river mile
TPAH total polycyclic aromatic hydrocarbonTU toxicity unit (i.e., hazard quotient); rounded to one significant figure
USACE US Army Corps of Engineers(a)
11 surface samples (full data set recommended by USACE)
The conversion factor between the full 34 PAH list and the 17 PAH list is 1.38 with the full data set and 1.36 based on this data set that includes 2-methylnapthylene.
Table 1: Sediment PAH Analysis Using USACE's 2005 Hyalella azteca and Chironomid tentans Toxicity Data
1 of 1 E N V I R O N
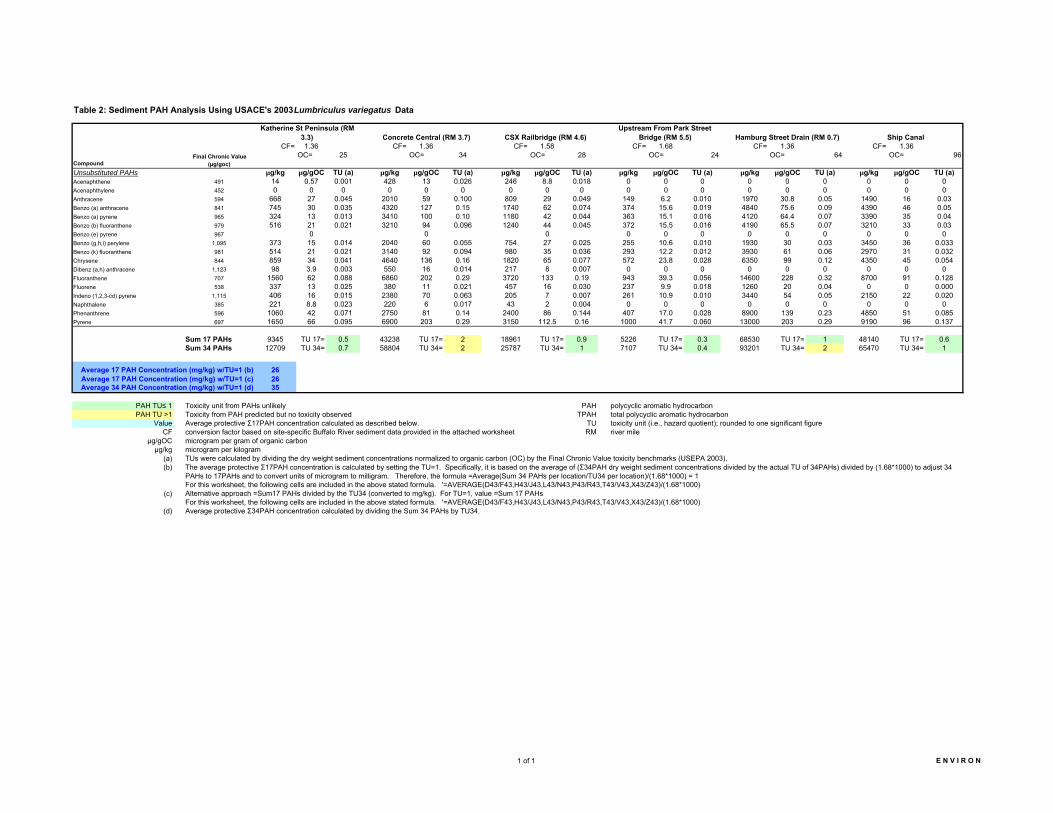
Table 2: Sediment PAH Analysis Using USACE's 2003 Lumbriculus variegatus Data
CF= 1.36 CF= 1.36 CF= 1.58 CF= 1.68 CF= 1.36 CF= 1.36OC= 25 OC= 34 OC= 28 OC= 24 OC= 64 OC= 96
CompoundUnsubstituted PAHs µg/kg µg/gOC TU (a) µg/kg µg/gOC TU (a) µg/kg µg/gOC TU (a) µg/kg µg/gOC TU (a) µg/kg µg/gOC TU (a) µg/kg µg/gOC TU (a)Acenaphthene 491 14 0.57 0.001 428 13 0.026 246 8.8 0.018 0 0 0 0 0 0 0 0 0Acenaphthylene 452 0 0 0 0 0 0 0 0 0 0 0 0 0 0 0 0 0 0Anthracene 594 668 27 0.045 2010 59 0.100 809 29 0.049 149 6.2 0.010 1970 30.8 0.05 1490 16 0.03Benzo (a) anthracene 841 745 30 0.035 4320 127 0.15 1740 62 0.074 374 15.6 0.019 4840 75.6 0.09 4390 46 0.05Benzo (a) pyrene 965 324 13 0.013 3410 100 0.10 1180 42 0.044 363 15.1 0.016 4120 64.4 0.07 3390 35 0.04Benzo (b) fluoranthene 979 516 21 0.021 3210 94 0.096 1240 44 0.045 372 15.5 0.016 4190 65.5 0.07 3210 33 0.03Benzo (e) pyrene 967 0 0 0 0 0 0 0 0 0 0 0 0Benzo (g,h,i) perylene 1,095 373 15 0.014 2040 60 0.055 754 27 0.025 255 10.6 0.010 1930 30 0.03 3450 36 0.033Benzo (k) fluoranthene 981 514 21 0.021 3140 92 0.094 980 35 0.036 293 12.2 0.012 3930 61 0.06 2970 31 0.032Chrysene 844 859 34 0.041 4640 136 0.16 1820 65 0.077 572 23.8 0.028 6350 99 0.12 4350 45 0.054Dibenz (a,h) anthracene 1,123 98 3.9 0.003 550 16 0.014 217 8 0.007 0 0 0 0 0 0 0 0 0Fluoranthene 707 1560 62 0.088 6860 202 0.29 3720 133 0.19 943 39.3 0.056 14600 228 0.32 8700 91 0.128Fluorene 538 337 13 0.025 380 11 0.021 457 16 0.030 237 9.9 0.018 1260 20 0.04 0 0 0.000Indeno (1,2,3-cd) pyrene 1,115 406 16 0.015 2380 70 0.063 205 7 0.007 261 10.9 0.010 3440 54 0.05 2150 22 0.020Naphthalene 385 221 8.8 0.023 220 6 0.017 43 2 0.004 0 0 0 0 0 0 0 0 0Phenanthrene 596 1060 42 0.071 2750 81 0.14 2400 86 0.144 407 17.0 0.028 8900 139 0.23 4850 51 0.085Pyrene 697 1650 66 0.095 6900 203 0.29 3150 112.5 0.16 1000 41.7 0.060 13000 203 0.29 9190 96 0.137
Sum 17 PAHs 9345 TU 17= 0.5 43238 TU 17= 2 18961 TU 17= 0.9 5226 TU 17= 0.3 68530 TU 17= 1 48140 TU 17= 0.6Sum 34 PAHs 12709 TU 34= 0.7 58804 TU 34= 2 25787 TU 34= 1 7107 TU 34= 0.4 93201 TU 34= 2 65470 TU 34= 1
262635
PAH TU≤ 1 Toxicity unit from PAHs unlikely PAH polycyclic aromatic hydrocarbonPAH TU >1 Toxicity from PAH predicted but no toxicity observed TPAH total polycyclic aromatic hydrocarbon
Value Average protective Σ17PAH concentration calculated as described below. TU toxicity unit (i.e., hazard quotient); rounded to one significant figureCF conversion factor based on site-specific Buffalo River sediment data provided in the attached worksheet RM river mile
µg/gOC microgram per gram of organic carbonµg/kg microgram per kilogram
(a)(b)
For this worksheet, the following cells are included in the above stated formula. '=AVERAGE(D43/F43,H43/J43,L43/N43,P43/R43,T43/V43,X43/Z43)/(1.68*1000)(c) Alternative approach =Sum17 PAHs divided by the TU34 (converted to mg/kg). For TU=1, value =Sum 17 PAHs
For this worksheet, the following cells are included in the above stated formula. '=AVERAGE(D43/F43,H43/J43,L43/N43,P43/R43,T43/V43,X43/Z43)/(1.68*1000)(d) Average protective Σ34PAH concentration calculated by dividing the Sum 34 PAHs by TU34.
CSX Railbridge (RM 4.6)
The average protective Σ17PAH concentration is calculated by setting the TU=1. Specifically, it is based on the average of (Σ34PAH dry weight sediment concentrations divided by the actual TU of 34PAHs) divided by (1.68*1000) to adjust 34 PAHs to 17PAHs and to convert units of microgram to milligram. Therefore, the formula =Average(Sum 34 PAHs per location/TU34 per location)/(1.68*1000) = 1
Upstream From Park Street Bridge (RM 5.5) Hamburg Street Drain (RM 0.7) Ship Canal
TUs were calculated by dividing the dry weight sediment concentrations normalized to organic carbon (OC) by the Final Chronic Value toxicity benchmarks (USEPA 2003).
Average 17 PAH Concentration (mg/kg) w/TU=1 (c)Average 17 PAH Concentration (mg/kg) w/TU=1 (b)
Final Chronic Value (µg/goc)
Average 34 PAH Concentration (mg/kg) w/TU=1 (d)
Katherine St Peninsula (RM 3.3) Concrete Central (RM 3.7)
1 of 1 E N V I R O N
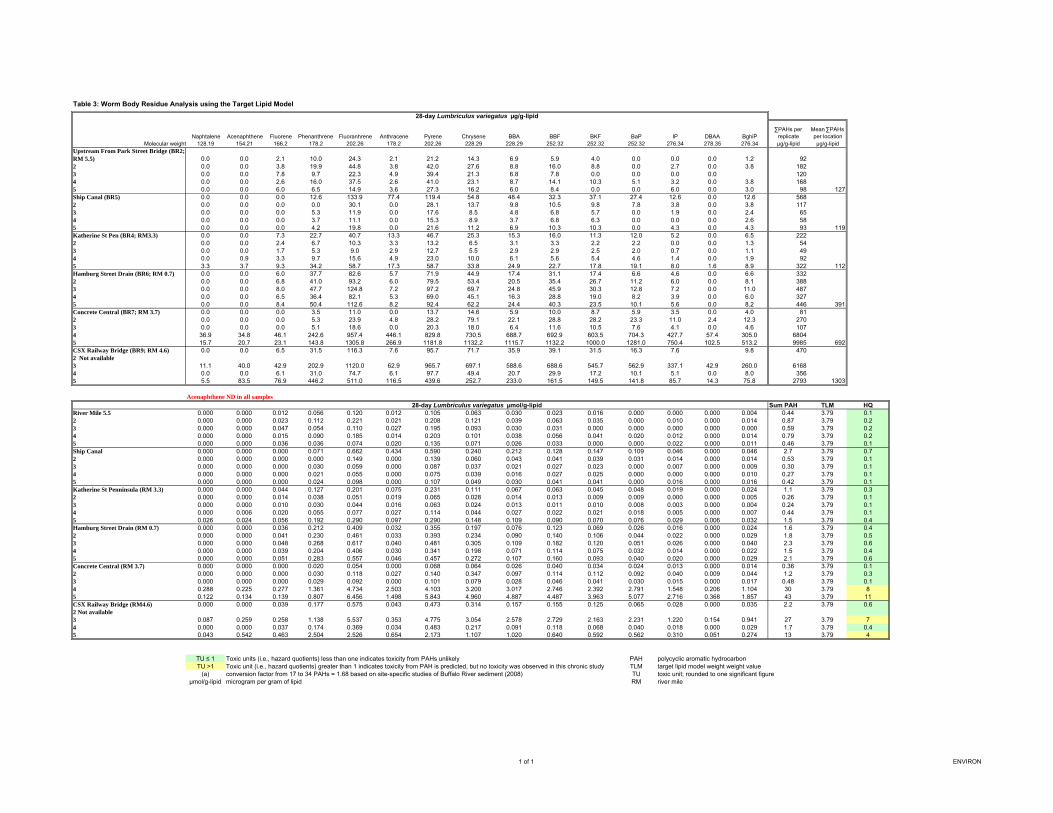
Table 3: Worm Body Residue Analysis using the Target Lipid Model
Naphtalene Acenaphthene Fluorene Phenanthrene Fluoranhrene Anthracene Pyrene Chrysene BBA BBF BKF BaP IP DBAA BghiP∑PAHs per
replicate Mean ∑PAHs per location
Molecular weight 128.19 154.21 166.2 178.2 202.26 178.2 202.26 228.29 228.29 252.32 252.32 252.32 276.34 278.35 276.34 µg/g-lipid µg/g-lipidUpstream From Park Street Bridge (BR2; RM 5.5) 0.0 0.0 2.1 10.0 24.3 2.1 21.2 14.3 6.9 5.9 4.0 0.0 0.0 0.0 1.2 922 0.0 0.0 3.8 19.9 44.8 3.8 42.0 27.6 8.8 16.0 8.8 0.0 2.7 0.0 3.8 1823 0.0 0.0 7.8 9.7 22.3 4.9 39.4 21.3 6.8 7.8 0.0 0.0 0.0 0.0 1204 0.0 0.0 2.6 16.0 37.5 2.6 41.0 23.1 8.7 14.1 10.3 5.1 3.2 0.0 3.8 1685 0.0 0.0 6.0 6.5 14.9 3.6 27.3 16.2 6.0 8.4 0.0 0.0 6.0 0.0 3.0 98 127Ship Canal (BR5) 0.0 0.0 0.0 12.6 133.9 77.4 119.4 54.8 48.4 32.3 37.1 27.4 12.6 0.0 12.6 5682 0.0 0.0 0.0 0.0 30.1 0.0 28.1 13.7 9.8 10.5 9.8 7.8 3.8 0.0 3.8 1173 0.0 0.0 0.0 5.3 11.9 0.0 17.6 8.5 4.8 6.8 5.7 0.0 1.9 0.0 2.4 654 0.0 0.0 0.0 3.7 11.1 0.0 15.3 8.9 3.7 6.8 6.3 0.0 0.0 0.0 2.6 585 0.0 0.0 0.0 4.2 19.8 0.0 21.6 11.2 6.9 10.3 10.3 0.0 4.3 0.0 4.3 93 119Katherine St Pen (BR4; RM3.3) 0.0 0.0 7.3 22.7 40.7 13.3 46.7 25.3 15.3 16.0 11.3 12.0 5.2 0.0 6.5 2222 0.0 0.0 2.4 6.7 10.3 3.3 13.2 6.5 3.1 3.3 2.2 2.2 0.0 0.0 1.3 543 0.0 0.0 1.7 5.3 9.0 2.9 12.7 5.5 2.9 2.9 2.5 2.0 0.7 0.0 1.1 494 0.0 0.9 3.3 9.7 15.6 4.9 23.0 10.0 6.1 5.6 5.4 4.6 1.4 0.0 1.9 925 3.3 3.7 9.3 34.2 58.7 17.3 58.7 33.8 24.9 22.7 17.8 19.1 8.0 1.6 8.9 322 112Hamburg Street Drain (BR6; RM 0.7) 0.0 0.0 6.0 37.7 82.6 5.7 71.9 44.9 17.4 31.1 17.4 6.6 4.6 0.0 6.6 3322 0.0 0.0 6.8 41.0 93.2 6.0 79.5 53.4 20.5 35.4 26.7 11.2 6.0 0.0 8.1 3883 0.0 0.0 8.0 47.7 124.8 7.2 97.2 69.7 24.8 45.9 30.3 12.8 7.2 0.0 11.0 4874 0.0 0.0 6.5 36.4 82.1 5.3 69.0 45.1 16.3 28.8 19.0 8.2 3.9 0.0 6.0 3275 0.0 0.0 8.4 50.4 112.6 8.2 92.4 62.2 24.4 40.3 23.5 10.1 5.6 0.0 8.2 446 391Concrete Central (BR7; RM 3.7) 0.0 0.0 0.0 3.5 11.0 0.0 13.7 14.6 5.9 10.0 8.7 5.9 3.5 0.0 4.0 812 0.0 0.0 0.0 5.3 23.9 4.8 28.2 79.1 22.1 28.8 28.2 23.3 11.0 2.4 12.3 2703 0.0 0.0 0.0 5.1 18.6 0.0 20.3 18.0 6.4 11.6 10.5 7.6 4.1 0.0 4.6 1074 36.9 34.8 46.1 242.6 957.4 446.1 829.8 730.5 688.7 692.9 603.5 704.3 427.7 57.4 305.0 68045 15.7 20.7 23.1 143.8 1305.8 266.9 1181.8 1132.2 1115.7 1132.2 1000.0 1281.0 750.4 102.5 513.2 9985 692CSX Railway Bridge (BR9; RM 4.6) 0.0 0.0 6.5 31.5 116.3 7.6 95.7 71.7 35.9 39.1 31.5 16.3 7.6 9.8 4702 Not available3 11.1 40.0 42.9 202.9 1120.0 62.9 965.7 697.1 588.6 688.6 545.7 562.9 337.1 42.9 260.0 61684 0.0 0.0 6.1 31.0 74.7 6.1 97.7 49.4 20.7 29.9 17.2 10.1 5.1 0.0 8.0 3565 5.5 83.5 76.9 446.2 511.0 116.5 439.6 252.7 233.0 161.5 149.5 141.8 85.7 14.3 75.8 2793 1303
Acenaphthene ND in all samplesSum PAH TLM HQ
River Mile 5.5 0.000 0.000 0.012 0.056 0.120 0.012 0.105 0.063 0.030 0.023 0.016 0.000 0.000 0.000 0.004 0.44 3.79 0.12 0.000 0.000 0.023 0.112 0.221 0.021 0.208 0.121 0.039 0.063 0.035 0.000 0.010 0.000 0.014 0.87 3.79 0.23 0.000 0.000 0.047 0.054 0.110 0.027 0.195 0.093 0.030 0.031 0.000 0.000 0.000 0.000 0.000 0.59 3.79 0.24 0.000 0.000 0.015 0.090 0.185 0.014 0.203 0.101 0.038 0.056 0.041 0.020 0.012 0.000 0.014 0.79 3.79 0.25 0.000 0.000 0.036 0.036 0.074 0.020 0.135 0.071 0.026 0.033 0.000 0.000 0.022 0.000 0.011 0.46 3.79 0.1Ship Canal 0.000 0.000 0.000 0.071 0.662 0.434 0.590 0.240 0.212 0.128 0.147 0.109 0.046 0.000 0.046 2.7 3.79 0.72 0.000 0.000 0.000 0.000 0.149 0.000 0.139 0.060 0.043 0.041 0.039 0.031 0.014 0.000 0.014 0.53 3.79 0.13 0.000 0.000 0.000 0.030 0.059 0.000 0.087 0.037 0.021 0.027 0.023 0.000 0.007 0.000 0.009 0.30 3.79 0.14 0.000 0.000 0.000 0.021 0.055 0.000 0.075 0.039 0.016 0.027 0.025 0.000 0.000 0.000 0.010 0.27 3.79 0.15 0.000 0.000 0.000 0.024 0.098 0.000 0.107 0.049 0.030 0.041 0.041 0.000 0.016 0.000 0.016 0.42 3.79 0.1Katherine St Penninsula (RM 3.3) 0.000 0.000 0.044 0.127 0.201 0.075 0.231 0.111 0.067 0.063 0.045 0.048 0.019 0.000 0.024 1.1 3.79 0.32 0.000 0.000 0.014 0.038 0.051 0.019 0.065 0.028 0.014 0.013 0.009 0.009 0.000 0.000 0.005 0.26 3.79 0.13 0.000 0.000 0.010 0.030 0.044 0.016 0.063 0.024 0.013 0.011 0.010 0.008 0.003 0.000 0.004 0.24 3.79 0.14 0.000 0.006 0.020 0.055 0.077 0.027 0.114 0.044 0.027 0.022 0.021 0.018 0.005 0.000 0.007 0.44 3.79 0.15 0.026 0.024 0.056 0.192 0.290 0.097 0.290 0.148 0.109 0.090 0.070 0.076 0.029 0.006 0.032 1.5 3.79 0.4Hamburg Street Drain (RM 0.7) 0.000 0.000 0.036 0.212 0.409 0.032 0.355 0.197 0.076 0.123 0.069 0.026 0.016 0.000 0.024 1.6 3.79 0.42 0.000 0.000 0.041 0.230 0.461 0.033 0.393 0.234 0.090 0.140 0.106 0.044 0.022 0.000 0.029 1.8 3.79 0.53 0.000 0.000 0.048 0.268 0.617 0.040 0.481 0.305 0.109 0.182 0.120 0.051 0.026 0.000 0.040 2.3 3.79 0.64 0.000 0.000 0.039 0.204 0.406 0.030 0.341 0.198 0.071 0.114 0.075 0.032 0.014 0.000 0.022 1.5 3.79 0.45 0.000 0.000 0.051 0.283 0.557 0.046 0.457 0.272 0.107 0.160 0.093 0.040 0.020 0.000 0.029 2.1 3.79 0.6Concrete Central (RM 3.7) 0.000 0.000 0.000 0.020 0.054 0.000 0.068 0.064 0.026 0.040 0.034 0.024 0.013 0.000 0.014 0.36 3.79 0.12 0.000 0.000 0.000 0.030 0.118 0.027 0.140 0.347 0.097 0.114 0.112 0.092 0.040 0.009 0.044 1.2 3.79 0.33 0.000 0.000 0.000 0.029 0.092 0.000 0.101 0.079 0.028 0.046 0.041 0.030 0.015 0.000 0.017 0.48 3.79 0.14 0.288 0.225 0.277 1.361 4.734 2.503 4.103 3.200 3.017 2.746 2.392 2.791 1.548 0.206 1.104 30 3.79 85 0.122 0.134 0.139 0.807 6.456 1.498 5.843 4.960 4.887 4.487 3.963 5.077 2.716 0.368 1.857 43 3.79 11CSX Railway Bridge (RM4.6) 0.000 0.000 0.039 0.177 0.575 0.043 0.473 0.314 0.157 0.155 0.125 0.065 0.028 0.000 0.035 2.2 3.79 0.62 Not available3 0.087 0.259 0.258 1.138 5.537 0.353 4.775 3.054 2.578 2.729 2.163 2.231 1.220 0.154 0.941 27 3.79 74 0.000 0.000 0.037 0.174 0.369 0.034 0.483 0.217 0.091 0.118 0.068 0.040 0.018 0.000 0.029 1.7 3.79 0.45 0.043 0.542 0.463 2.504 2.526 0.654 2.173 1.107 1.020 0.640 0.592 0.562 0.310 0.051 0.274 13 3.79 4
TU ≤ 1 Toxic units (i.e., hazard quotients) less than one indicates toxicity from PAHs unlikely PAH polycyclic aromatic hydrocarbonTU >1 Toxic unit (i.e., hazard quotients) greater than 1 indicates toxicity from PAH is predicted, but no toxicity was observed in this chronic study TLM target lipid model weight weight value
(a) conversion factor from 17 to 34 PAHs = 1.68 based on site-specific studies of Buffalo River sediment (2008) TU toxic unit; rounded to one significant figureµmol/g-lipid microgram per gram of lipid RM river mile
28-day Lumbriculus variegatus µmol/g-lipid
28-day Lumbriculus variegatus µg/g-lipid
1 of 1 ENVIRON
Sample ID #Depth (ft) 5.0 - 8.2 5.4 - 9.7 0 - 3Buffalo River Conversion Factor (a) 1.35 3.7 % Organic Carbon 3.0 % Organic Carbon 3.2 % Organic Carbon
Compound Final Chronic Value
(µg/goc) PA
H C
once
ntra
tion
(ug/
kg)
PA
H C
once
ntra
tion
(mg/
kg)
PA
H C
once
ntra
tion
(µg/
goc)
Tox
ic U
nits
PA
H C
once
ntra
tion
(ug/
kg)
PA
H C
once
ntra
tion
(mg/
kg)
PA
H C
once
ntra
tion
(µg/
goc)
Tox
ic U
nits
PA
H C
once
ntra
tion
(ug/
kg)
PA
H C
once
ntra
tion
(mg/
kg)
PA
H C
once
ntra
tion
(µg/
goc)
Tox
ic U
nits
Unsubstituted PAHs
Acenaphthene 491 1200 1.2E+00 3.2E+01 6.5E-02 670 6.7E-01 2.2E+01 4.6E-02 160 1.6E-01 5.0E+00 1.0E-02
Acenaphthylene 452 480 4.8E-01 1.3E+01 2.8E-02 380 3.8E-01 1.3E+01 2.8E-02 320 3.2E-01 9.9E+00 2.2E-02
Anthracene 594 2600 2.6E+00 7.0E+01 1.2E-01 3000 3.0E+00 1.0E+02 1.7E-01 360 3.6E-01 1.1E+01 1.9E-02
Benzo (a) anthracene 841 1500 1.5E+00 4.0E+01 4.8E-02 1400 1.4E+00 4.7E+01 5.6E-02 930 9.3E-01 2.9E+01 3.4E-02
Benzo (a) pyrene 965 1300 1.3E+00 3.5E+01 3.6E-02 1100 1.1E+00 3.7E+01 3.8E-02 940 9.4E-01 2.9E+01 3.0E-02
Benzo (b) fluoranthene 979 1400 1.4E+00 3.7E+01 3.8E-02 1300 1.3E+00 4.3E+01 4.4E-02 1200 1.2E+00 3.7E+01 3.8E-02
Benzo (e) pyrene 967 0.0E+00 0.0E+00 0.0E+00 0.0E+00 0.0E+00 0.0E+00 0.0E+00 0.0E+00 0.0E+00
Benzo (g,h,i) perylene 1,095 230 2.3E-01 6.1E+00 5.6E-03 240 2.4E-01 8.0E+00 7.3E-03 260 2.6E-01 8.1E+00 7.4E-03
Benzo (k) fluoranthene 981 1400 1.4E+00 3.7E+01 3.8E-02 1500 1.5E+00 5.0E+01 5.1E-02 1400 1.4E+00 4.3E+01 4.4E-02
Chrysene 844 1600 1.6E+00 4.3E+01 5.1E-02 1500 1.5E+00 5.0E+01 5.9E-02 1300 1.3E+00 4.0E+01 4.8E-02
Dibenz (a,h) anthracene 1,123 84 8.4E-02 2.2E+00 2.0E-03 85 8.5E-02 2.8E+00 2.5E-03 73 7.3E-02 2.3E+00 2.0E-03
Fluoranthene 707 4000 4.0E+00 1.1E+02 1.5E-01 4200 4.2E+00 1.4E+02 2.0E-01 2600 2.6E+00 8.1E+01 1.1E-01
Fluorene 538 3400 3.4E+00 9.1E+01 1.7E-01 4100 4.1E+00 1.4E+02 2.5E-01 230 2.3E-01 7.1E+00 1.3E-02
Indeno (1,2,3-cd) pyrene 1,115 220 2.2E-01 5.9E+00 5.3E-03 240 2.4E-01 8.0E+00 7.2E-03 250 2.5E-01 7.8E+00 7.0E-03
Naphthalene 385 330 3.3E-01 8.8E+00 2.3E-02 330 3.3E-01 1.1E+01 2.9E-02 160 1.6E-01 5.0E+00 1.3E-02
Phenanthrene 596 4600 4.6E+00 1.2E+02 2.1E-01 3900 3.9E+00 1.3E+02 2.2E-01 1600 1.6E+00 5.0E+01 8.3E-02
Pyrene 697 3000 3.0E+00 8.0E+01 1.2E-01 3800 3.8E+00 1.3E+02 1.8E-01 1700 1.7E+00 5.3E+01 7.6E-02
Alkylated PAHs
2-Methylnaphthalene 447 620 6.2E-01 1.7E+01 3.7E-02 1200 1.2E+00 4.0E+01 9.0E-02 110 1.1E-01 3.4E+00 7.6E-03
Σ17PAH mg/kg Σ17PAH TU Σ17PAH mg/kg Σ17PAH TU Σ17PAH mg/kg Σ17PAH TU28.0 1 28.9 1 13.6 0.6
Σ34PAH mg/kg Σ34PAH mg/kg Σ34PAH mg/kg37.7 2 39.0 2 18.3 0.8
Σ17PAH mg/kg, TU=1(b) 18.3 14.5 17.7Σ34PAH mg/kg, TU=1(c) 24.6 19.5 23.9
*Average TOCs for the AOCAverage Sum of 17 PAHs mg/kg T 17.2Average Sum of 34 PAHs mg/kg T 23.2
TU ≤ 1 Toxic units (i.e., hazard quotients) less than one indicates toxicity from PAHs unlikely
TU >1 Toxic unit (i.e., hazard quotients) greater than 1 indicates toxicity from PAH is predicted, but no toxicity was observed in this chronic study
(a)
(b)
(c)
CF conversion factor RM river mile
µg/gOC microgram per gram of organic carbon TOC total organic carbon
µg/kg microgram per kilogram TPAH total polycyclic aromatic hydrocarbon
PAH polycyclic aromatic hydrocarbon TU toxicity unit (i.e., hazard quotient); rounded to one significant figure
USACE US Army Corps of Engineers
The conversion factor between the full 34 PAH list and the 17 PAH list is 1.36 with the full data set and 1.35 based on this data set that includes 2-methylnapthylene as indicated in the worksheet within this workbook.
2-9-480-L58 19-9-500-R0314-9-495-L510
Table 4a: PAH Toxicity Units and Preliminary Remedial Goals Calculated Using the 2007 Toxicity Testing Study Conducted by ASci based on Data Used in the Concentration-Response Analysis
The average protective Σ17PAH concentration is calculated by setting the TU34=1. Specifically, it is based on the average of (Σ17PAH dry weight sediment concentrations divided by the actual TU of 34PAHs) divided by (1000) to convert units of microgram to milligram.
The average protective Σ34PAH concentration is calculated by setting the TU34=1. Specifically, it is based on the average of (Σ34PAH dry weight sediment concentrations divided by the TU of 34PAHs) divided by (1000) to convert units of microgram to milligram.
1 of 4 ENVIRON
Sample ID #Depth (ft)Buffalo River Conversion Factor (a)
Compound
Unsubstituted PAHs
Acenaphthene
Acenaphthylene
Anthracene
Benzo (a) anthracene
Benzo (a) pyrene
Benzo (b) fluoranthene
Benzo (e) pyrene
Benzo (g,h,i) perylene
Benzo (k) fluoranthene
Chrysene
Dibenz (a,h) anthracene
Fluoranthene
Fluorene
Indeno (1,2,3-cd) pyrene
Naphthalene
Phenanthrene
Pyrene
Alkylated PAHs
2-Methylnaphthalene
Σ17PAH mg/kg, TU=1(b)Σ34PAH mg/kg, TU=1(c)
*Average TOCs for the AOC
4.0 - 5.9 4.0 - 9.0 7.0 - 8.83.6 % Organic Carbon 2.9 % Organic Carbon 2.5 % Organic Carbon
PA
H C
once
ntra
tion
(ug/
kg)
PA
H C
once
ntra
tion
(mg/
kg)
PA
H C
once
ntra
tion
(µg/
goc)
Tox
ic U
nits
PA
H C
once
ntra
tion
(ug/
kg)
PA
H C
once
ntra
tion
(mg/
kg)
PA
H C
once
ntra
tion
(µg/
goc)
Tox
ic U
nits
PA
H C
once
ntra
tion
(ug/
kg)
PA
H C
once
ntra
tion
(mg/
kg)
PA
H C
once
ntra
tion
(µg/
goc)
Tox
ic U
nits
640 6.4E-01 1.8E+01 3.6E-02 3500 3.5E+00 1.2E+02 2.4E-01 140 1.4E-01 5.7E+00 1.2E-02
245 2.5E-01 6.7E+00 1.5E-02 1250 1.3E+00 4.3E+01 9.4E-02 63 6.3E-02 2.6E+00 5.6E-03
1300 1.3E+00 3.6E+01 6.0E-02 7600 7.6E+00 2.6E+02 4.4E-01 440 4.4E-01 1.8E+01 3.0E-02
1200 1.2E+00 3.3E+01 3.9E-02 3200 3.2E+00 1.1E+02 1.3E-01 890 8.9E-01 3.6E+01 4.3E-02
1100 1.1E+00 3.0E+01 3.1E-02 2000 2.0E+00 6.8E+01 7.1E-02 770 7.7E-01 3.1E+01 3.2E-02
1300 1.3E+00 3.6E+01 3.6E-02 1800 1.8E+00 6.1E+01 6.3E-02 930 9.3E-01 3.8E+01 3.8E-02
0.0E+00 0.0E+00 0.0E+00 0.0E+00 0.0E+00 0.0E+00 0.0E+00 0.0E+00 0.0E+00
240 2.4E-01 6.6E+00 6.0E-03 380 3.8E-01 1.3E+01 1.2E-02 220 2.2E-01 8.9E+00 8.1E-03
1300 1.3E+00 3.6E+01 3.6E-02 2700 2.7E+00 9.2E+01 9.4E-02 1300 1.3E+00 5.3E+01 5.4E-02
1300 1.3E+00 3.6E+01 4.2E-02 3300 3.3E+00 1.1E+02 1.3E-01 1200 1.2E+00 4.9E+01 5.8E-02
78 7.8E-02 2.1E+00 1.9E-03 140 1.4E-01 4.8E+00 4.3E-03 57 5.7E-02 2.3E+00 2.1E-03
3200 3.2E+00 8.8E+01 1.2E-01 13000 1.3E+01 4.4E+02 6.3E-01 2100 2.1E+00 8.5E+01 1.2E-01
2000 2.0E+00 5.5E+01 1.0E-01 7500 7.5E+00 2.6E+02 4.8E-01 370 3.7E-01 1.5E+01 2.8E-02
230 2.3E-01 6.3E+00 5.7E-03 340 3.4E-01 1.2E+01 1.0E-02 190 1.9E-01 7.7E+00 6.9E-03
190 1.9E-01 5.2E+00 1.4E-02 1100 1.1E+00 3.8E+01 9.8E-02 71 7.1E-02 2.9E+00 7.5E-03
2800 2.8E+00 7.7E+01 1.3E-01 16000 1.6E+01 5.5E+02 9.2E-01 960 9.6E-01 3.9E+01 6.5E-02
2700 2.7E+00 7.4E+01 1.1E-01 8900 8.9E+00 3.0E+02 4.4E-01 1900 1.9E+00 7.7E+01 1.1E-01
245 2.5E-01 6.7E+00 1.5E-02 3000 3.0E+00 1.0E+02 2.3E-01 61 6.1E-02 2.5E+00 5.5E-03
Σ17PAH mg/kg Σ17PAH TU Σ17PAH mg/kg Σ17PAH TU Σ17PAH mg/kg Σ17PAH TU20.1 1 75.7 4 11.7 0.6
Σ34PAH mg/kg Σ34PAH mg/kg Σ34PAH mg/kg27.0 1 102 5 15.7 0.8
18.6 13.8 13.825.1 18.6 18.6
29-9-520-L7926-9-515-L499-9-487-R46
Table 4a: PAH Toxicity Units and Preliminary Remedial Goals Calculated Using the 2007 Toxicity Testing Study Conducted by ASci based on Data Used in the Concentration-Response Analysis
2 of 4 ENVIRON
Sample ID #Depth (ft)Buffalo River Conversion Factor (a)
Compound
Unsubstituted PAHs
Acenaphthene
Acenaphthylene
Anthracene
Benzo (a) anthracene
Benzo (a) pyrene
Benzo (b) fluoranthene
Benzo (e) pyrene
Benzo (g,h,i) perylene
Benzo (k) fluoranthene
Chrysene
Dibenz (a,h) anthracene
Fluoranthene
Fluorene
Indeno (1,2,3-cd) pyrene
Naphthalene
Phenanthrene
Pyrene
Alkylated PAHs
2-Methylnaphthalene
Σ17PAH mg/kg, TU=1(b)Σ34PAH mg/kg, TU=1(c)
*Average TOCs for the AOC
5.0 - 9.6 2.2 - 5.2 8.0 - 9.73.2 % Organic Carbon 3.6 % Organic Carbon 2.7 % Organic Carbon
PA
H C
once
ntra
tion
(ug/
kg)
PA
H C
once
ntra
tion
(mg/
kg)
PA
H C
once
ntra
tion
(µg/
goc)
Tox
ic U
nits
PA
H C
once
ntra
tion
(ug/
kg)
PA
H C
once
ntra
tion
(mg/
kg)
PA
H C
once
ntra
tion
(µg/
goc)
Tox
ic U
nits
PA
H C
once
ntra
tion
(ug/
kg)
PA
H C
once
ntra
tion
(mg/
kg)
PA
H C
once
ntra
tion
(µg/
goc)
Tox
ic U
nits
3400 3.4E+00 1.1E+02 2.1E-01 2600 2.6E+00 7.1E+01 1.5E-01 780 7.8E-01 2.9E+01 6.0E-02
850 8.5E-01 2.6E+01 5.8E-02 1.1E+03 1.1E+00 3.0E+01 6.7E-02 600 6.0E-01 2.3E+01 5.0E-02
6600 6.6E+00 2.0E+02 3.4E-01 6500 6.5E+00 1.8E+02 3.0E-01 2400 2.4E+00 9.0E+01 1.5E-01
2400 2.4E+00 7.4E+01 8.8E-02 2500 2.5E+00 6.9E+01 8.2E-02 2500 2.5E+00 9.4E+01 1.1E-01
1600 1.6E+00 5.0E+01 5.1E-02 1400 1.4E+00 3.8E+01 4.0E-02 2300 2.3E+00 8.6E+01 9.0E-02
1500 1.5E+00 4.6E+01 4.7E-02 1600 1.6E+00 4.4E+01 4.5E-02 2700 2.7E+00 1.0E+02 1.0E-01
0.0E+00 0.0E+00 0.0E+00 0.0E+00 0.0E+00 0.0E+00 0.0E+00 0.0E+00 0.0E+00
300 3.0E-01 9.3E+00 8.5E-03 310 3.1E-01 8.5E+00 7.8E-03 470 4.7E-01 1.8E+01 1.6E-02
2300 2.3E+00 7.1E+01 7.3E-02 1400 1.4E+00 3.8E+01 3.9E-02 2400 2.4E+00 9.0E+01 9.2E-02
2600 2.6E+00 8.0E+01 9.5E-02 2600 2.6E+00 7.1E+01 8.5E-02 2600 2.6E+00 9.8E+01 1.2E-01
120 1.2E-01 3.7E+00 3.3E-03 100 1.0E-01 2.7E+00 2.4E-03 200 2.0E-01 7.5E+00 6.7E-03
7700 7.7E+00 2.4E+02 3.4E-01 9800 9.8E+00 2.7E+02 3.8E-01 7500 7.5E+00 2.8E+02 4.0E-01
8500 8.5E+00 2.6E+02 4.9E-01 7700 7.7E+00 2.1E+02 3.9E-01 1600 1.6E+00 6.0E+01 1.1E-01
290 2.9E-01 9.0E+00 8.1E-03 300 3.0E-01 8.2E+00 7.4E-03 450 4.5E-01 1.7E+01 1.5E-02
740 7.4E-01 2.3E+01 6.0E-02 620 6.2E-01 1.7E+01 4.4E-02 280 2.8E-01 1.1E+01 2.7E-02
10000 1.0E+01 3.1E+02 5.2E-01 11000 1.1E+01 3.0E+02 5.1E-01 5100 5.1E+00 1.9E+02 3.2E-01
5600 5.6E+00 1.7E+02 2.5E-01 7100 7.1E+00 2.0E+02 2.8E-01 5600 5.6E+00 2.1E+02 3.0E-01
1100 1.1E+00 3.4E+01 7.6E-02 950 9.5E-01 2.6E+01 5.8E-02 580 5.8E-01 2.2E+01 4.9E-02
Σ17PAH mg/kg Σ17PAH TU Σ17PAH mg/kg Σ17PAH TU Σ17PAH mg/kg Σ17PAH TU55.6 3 57.6 2 38.06 2
Σ34PAH mg/kg Σ34PAH mg/kg Σ34PAH mg/kg74.9 4 77.6 3 51.29 3
15.2 17.2 14.020.4 23.2 18.8
Table 4a: PAH Toxicity Units and Preliminary Remedial Goals Calculated Using the 2007 Toxicity Testing Study Conducted by ASci based on Data Used in the Concentration-Response Analysis
50-9-551-L2535-9-530-L510 61-9-570-L810
3 of 4 ENVIRON
Sample ID #Depth (ft)Buffalo River Conversion Factor (a)
Compound
Unsubstituted PAHs
Acenaphthene
Acenaphthylene
Anthracene
Benzo (a) anthracene
Benzo (a) pyrene
Benzo (b) fluoranthene
Benzo (e) pyrene
Benzo (g,h,i) perylene
Benzo (k) fluoranthene
Chrysene
Dibenz (a,h) anthracene
Fluoranthene
Fluorene
Indeno (1,2,3-cd) pyrene
Naphthalene
Phenanthrene
Pyrene
Alkylated PAHs
2-Methylnaphthalene
Σ17PAH mg/kg, TU=1(b)Σ34PAH mg/kg, TU=1(c)
*Average TOCs for the AOC
4.5 - 6.0 2.8 - 4.7 1.7 - 3.2 ponar4.0 % Organic Carbon 3.6 % Organic Carbon 3.1 % Organic Carbon 7.1 % Organic Carbon
PA
H C
once
ntra
tion
(ug/
kg)
PA
H C
once
ntra
tion
(mg/
kg)
PA
H C
once
ntra
tion
(µg/
goc)
Tox
ic U
nits
PA
H C
once
ntra
tion
(ug/
kg)
PA
H C
once
ntra
tion
(mg/
kg)
PA
H C
once
ntra
tion
(µg/
goc)
Tox
ic U
nits
PA
H C
once
ntra
tion
(ug/
kg)
PA
H C
once
ntra
tion
(mg/
kg)
PA
H C
once
ntra
tion
(µg/
goc)
Tox
ic U
nits
PA
H C
once
ntra
tion
(ug/
kg)
PA
H C
once
ntra
tion
(mg/
kg)
PA
H C
once
ntra
tion
(µg/
goc)
Tox
ic U
nits
690 6.9E-01 1.7E+01 3.5E-02 940 9.4E-01 2.6E+01 5.4E-02 500 5.0E-01 1.6E+01 3.3E-02 980 9.8E-01 1.4E+01 2.8E-02
485 4.9E-01 1.2E+01 2.7E-02 600 6.0E-01 1.7E+01 3.7E-02 550 5.5E-01 1.8E+01 3.9E-02 4600 4.6E+00 6.5E+01 1.4E-01
3700 3.7E+00 9.3E+01 1.6E-01 1900 1.9E+00 5.4E+01 9.0E-02 2400 2.4E+00 7.8E+01 1.3E-01 1400 1.4E+00 2.0E+01 3.3E-02
1400 1.4E+00 3.5E+01 4.2E-02 2500 2.5E+00 7.0E+01 8.4E-02 1800 1.8E+00 5.8E+01 6.9E-02 2200 2.2E+00 3.1E+01 3.7E-02
1200 1.2E+00 3.0E+01 3.1E-02 2200 2.2E+00 6.2E+01 6.4E-02 1300 1.3E+00 4.2E+01 4.4E-02 2300 2.3E+00 3.3E+01 3.4E-02
1400 1.4E+00 3.5E+01 3.6E-02 2800 2.8E+00 7.9E+01 8.1E-02 2300 2.3E+00 7.4E+01 7.6E-02 2300 2.3E+00 3.3E+01 3.3E-02
0.0E+00 0.0E+00 0.0E+00 0.0E+00 0.0E+00 0.0E+00 0.0E+00 0.0E+00 0.0E+00 0.0E+00 0.0E+00 0.0E+00
220 2.2E-01 5.5E+00 5.1E-03 470 4.7E-01 1.3E+01 1.2E-02 270 2.7E-01 8.7E+00 8.0E-03 810 8.1E-01 1.1E+01 1.0E-02
1300 1.3E+00 3.3E+01 3.3E-02 3400 3.4E+00 9.6E+01 9.8E-02 1900 1.9E+00 6.1E+01 6.3E-02 2800 2.8E+00 4.0E+01 4.0E-02
1700 1.7E+00 4.3E+01 5.1E-02 2700 2.7E+00 7.6E+01 9.0E-02 2300 2.3E+00 7.4E+01 8.8E-02 2400 2.4E+00 3.4E+01 4.0E-02
68 6.8E-02 1.7E+00 1.5E-03 180 1.8E-01 5.1E+00 4.5E-03 97 9.7E-02 3.1E+00 2.8E-03 240 2.4E-01 3.4E+00 3.0E-03
3600 3.6E+00 9.1E+01 1.3E-01 7500 7.5E+00 2.1E+02 3.0E-01 6000 6.0E+00 1.9E+02 2.7E-01 5900 5.9E+00 8.3E+01 1.2E-01
3100 3.1E+00 7.8E+01 1.5E-01 1700 1.7E+00 4.8E+01 8.9E-02 1100 1.1E+00 3.6E+01 6.6E-02 4900 4.9E+00 6.9E+01 1.3E-01
200 2.0E-01 5.0E+00 4.5E-03 520 5.2E-01 1.5E+01 1.3E-02 260 2.6E-01 8.4E+00 7.5E-03 810 8.1E-01 1.1E+01 1.0E-02
320 3.2E-01 8.1E+00 2.1E-02 190 1.9E-01 5.4E+00 1.4E-02 230 2.3E-01 7.4E+00 1.9E-02 33000 3.3E+01 4.7E+02 1.2E+00
3800 3.8E+00 9.6E+01 1.6E-01 4500 4.5E+00 1.3E+02 2.1E-01 2600 2.6E+00 8.4E+01 1.4E-01 12000 1.2E+01 1.7E+02 2.8E-01
3200 3.2E+00 8.1E+01 1.2E-01 4700 4.7E+00 1.3E+02 1.9E-01 4000 4.0E+00 1.3E+02 1.9E-01 4700 4.7E+00 6.6E+01 9.5E-02
1800 1.8E+00 4.5E+01 1.0E-01 600 6.0E-01 1.7E+01 3.8E-02 450 4.5E-01 1.5E+01 3.3E-02 5100 5.1E+00 7.2E+01 1.6E-01
Σ17PAH mg/kg Σ17PAH TU Σ17PAH mg/kg Σ17PAH TU Σ17PAH mg/kg Σ17PAH TU Σ17PAH mg/kg Σ17PAH TU28.18 1 37.40 1 28.06 1 86.4 2
Σ34PAH mg/kg Σ34PAH mg/kg Σ34PAH mg/kg Σ34PAH mg/kg37.98 1 50.40 2 37.81 2 116 3
19.1 18.9 16.3 26.625.7 25.4 21.9 35.8
Table 4a: PAH Toxicity Units and Preliminary Remedial Goals Calculated Using the 2007 Toxicity Testing Study Conducted by ASci based on Data Used in the Concentration-Response Analysis
123-9-872+88-C0179-9-801-L46 103-9-841-L2390-9-816+50-R34
4 of 4 ENVIRON
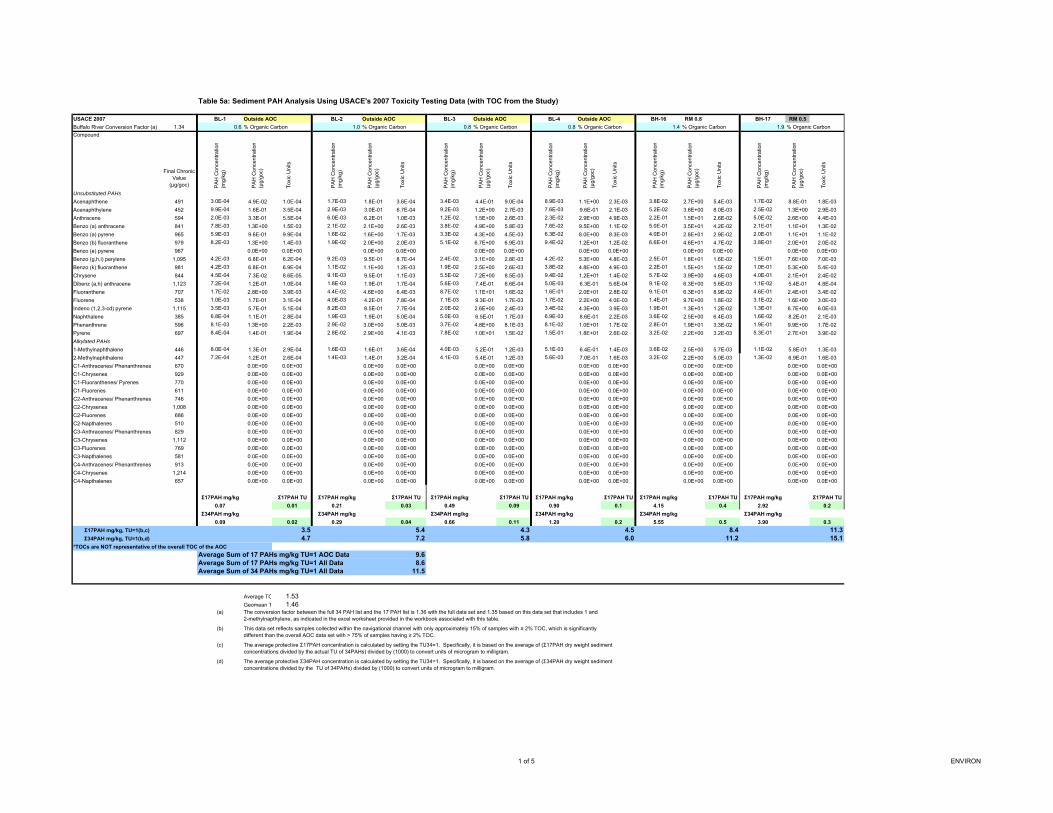
Table 5a: Sediment PAH Analysis Using USACE's 2007 Toxicity Testing Data (with TOC from the Study)
USACE 2007 BL-1 Outside AOC BL-2 Outside AOC BL-3 Outside AOC BL-4 Outside AOC BH-16 RM 0.8 BH-17 RM 0.5Buffalo River Conversion Factor (a) 1.34 0.6 % Organic Carbon 1.0 % Organic Carbon 0.8 % Organic Carbon 0.8 % Organic Carbon 1.4 % Organic Carbon 1.9 % Organic Carbon
Compound
Final Chronic Value
(µg/goc) PA
H C
once
ntra
tion
(mg/
kg)
PA
H C
once
ntra
tion
(µg/
goc)
Tox
ic U
nits
PA
H C
once
ntra
tion
(mg/
kg)
PA
H C
once
ntra
tion
(µg/
goc)
Tox
ic U
nits
PA
H C
once
ntra
tion
(mg/
kg)
PA
H C
once
ntra
tion
(µg/
goc)
Tox
ic U
nits
PA
H C
once
ntra
tion
(mg/
kg)
PA
H C
once
ntra
tion
(µg/
goc)
Tox
ic U
nits
PA
H C
once
ntra
tion
(mg/
kg)
PA
H C
once
ntra
tion
(µg/
goc)
Tox
ic U
nits
PA
H C
once
ntra
tion
(mg/
kg)
PA
H C
once
ntra
tion
(µg/
goc)
Tox
ic U
nits
Unsubstituted PAHs
Acenaphthene 491 3.0E-04 4.9E-02 1.0E-04 1.7E-03 1.8E-01 3.6E-04 3.4E-03 4.4E-01 9.0E-04 8.9E-03 1.1E+00 2.3E-03 3.8E-02 2.7E+00 5.4E-03 1.7E-02 8.8E-01 1.8E-03
Acenaphthylene 452 9.9E-04 1.6E-01 3.5E-04 2.9E-03 3.0E-01 6.7E-04 9.2E-03 1.2E+00 2.7E-03 7.6E-03 9.6E-01 2.1E-03 5.2E-02 3.6E+00 8.0E-03 2.5E-02 1.3E+00 2.9E-03
Anthracene 594 2.0E-03 3.3E-01 5.5E-04 6.0E-03 6.2E-01 1.0E-03 1.2E-02 1.5E+00 2.6E-03 2.3E-02 2.9E+00 4.9E-03 2.2E-01 1.5E+01 2.6E-02 5.0E-02 2.6E+00 4.4E-03
Benzo (a) anthracene 841 7.8E-03 1.3E+00 1.5E-03 2.1E-02 2.1E+00 2.6E-03 3.8E-02 4.9E+00 5.8E-03 7.6E-02 9.5E+00 1.1E-02 5.0E-01 3.5E+01 4.2E-02 2.1E-01 1.1E+01 1.3E-02
Benzo (a) pyrene 965 5.9E-03 9.6E-01 9.9E-04 1.6E-02 1.6E+00 1.7E-03 3.3E-02 4.3E+00 4.5E-03 6.3E-02 8.0E+00 8.3E-03 4.0E-01 2.8E+01 2.9E-02 2.0E-01 1.1E+01 1.1E-02
Benzo (b) fluoranthene 979 8.2E-03 1.3E+00 1.4E-03 1.9E-02 2.0E+00 2.0E-03 5.1E-02 6.7E+00 6.9E-03 9.4E-02 1.2E+01 1.2E-02 6.6E-01 4.6E+01 4.7E-02 3.8E-01 2.0E+01 2.0E-02
Benzo (e) pyrene 967 0.0E+00 0.0E+00 0.0E+00 0.0E+00 0.0E+00 0.0E+00 0.0E+00 0.0E+00 0.0E+00 0.0E+00 0.0E+00 0.0E+00
Benzo (g,h,i) perylene 1,095 4.2E-03 6.8E-01 6.2E-04 9.2E-03 9.5E-01 8.7E-04 2.4E-02 3.1E+00 2.8E-03 4.2E-02 5.3E+00 4.8E-03 2.5E-01 1.8E+01 1.6E-02 1.5E-01 7.6E+00 7.0E-03
Benzo (k) fluoranthene 981 4.2E-03 6.8E-01 6.9E-04 1.1E-02 1.1E+00 1.2E-03 1.9E-02 2.5E+00 2.6E-03 3.8E-02 4.8E+00 4.9E-03 2.2E-01 1.5E+01 1.5E-02 1.0E-01 5.3E+00 5.4E-03
Chrysene 844 4.5E-04 7.3E-02 8.6E-05 9.1E-03 9.5E-01 1.1E-03 5.5E-02 7.2E+00 8.5E-03 9.4E-02 1.2E+01 1.4E-02 5.7E-02 3.9E+00 4.6E-03 4.0E-01 2.1E+01 2.4E-02
Dibenz (a,h) anthracene 1,123 7.2E-04 1.2E-01 1.0E-04 1.8E-03 1.9E-01 1.7E-04 5.6E-03 7.4E-01 6.6E-04 5.0E-03 6.3E-01 5.6E-04 9.1E-02 6.3E+00 5.6E-03 1.1E-02 5.4E-01 4.8E-04
Fluoranthene 707 1.7E-02 2.8E+00 3.9E-03 4.4E-02 4.6E+00 6.4E-03 8.7E-02 1.1E+01 1.6E-02 1.6E-01 2.0E+01 2.8E-02 9.1E-01 6.3E+01 8.9E-02 4.6E-01 2.4E+01 3.4E-02
Fluorene 538 1.0E-03 1.7E-01 3.1E-04 4.0E-03 4.2E-01 7.8E-04 7.1E-03 9.3E-01 1.7E-03 1.7E-02 2.2E+00 4.0E-03 1.4E-01 9.7E+00 1.8E-02 3.1E-02 1.6E+00 3.0E-03
Indeno (1,2,3-cd) pyrene 1,115 3.5E-03 5.7E-01 5.1E-04 8.2E-03 8.5E-01 7.7E-04 2.0E-02 2.6E+00 2.4E-03 3.4E-02 4.3E+00 3.9E-03 1.9E-01 1.3E+01 1.2E-02 1.3E-01 6.7E+00 6.0E-03
Naphthalene 385 6.8E-04 1.1E-01 2.8E-04 1.9E-03 1.9E-01 5.0E-04 5.0E-03 6.5E-01 1.7E-03 6.9E-03 8.6E-01 2.2E-03 3.6E-02 2.5E+00 6.4E-03 1.6E-02 8.2E-01 2.1E-03
Phenanthrene 596 8.1E-03 1.3E+00 2.2E-03 2.9E-02 3.0E+00 5.0E-03 3.7E-02 4.8E+00 8.1E-03 8.1E-02 1.0E+01 1.7E-02 2.8E-01 1.9E+01 3.3E-02 1.9E-01 9.9E+00 1.7E-02
Pyrene 697 8.4E-04 1.4E-01 1.9E-04 2.8E-02 2.9E+00 4.1E-03 7.8E-02 1.0E+01 1.5E-02 1.5E-01 1.8E+01 2.6E-02 3.2E-02 2.2E+00 3.2E-03 5.3E-01 2.7E+01 3.9E-02
Alkylated PAHs
1-Methylnaphthalene 446 8.0E-04 1.3E-01 2.9E-04 1.6E-03 1.6E-01 3.6E-04 4.0E-03 5.2E-01 1.2E-03 5.1E-03 6.4E-01 1.4E-03 3.6E-02 2.5E+00 5.7E-03 1.1E-02 5.8E-01 1.3E-03
2-Methylnaphthalene 447 7.2E-04 1.2E-01 2.6E-04 1.4E-03 1.4E-01 3.2E-04 4.1E-03 5.4E-01 1.2E-03 5.6E-03 7.0E-01 1.6E-03 3.2E-02 2.2E+00 5.0E-03 1.3E-02 6.9E-01 1.6E-03
C1-Anthracenes/ Phenanthrenes 670 0.0E+00 0.0E+00 0.0E+00 0.0E+00 0.0E+00 0.0E+00 0.0E+00 0.0E+00 0.0E+00 0.0E+00 0.0E+00 0.0E+00
C1-Chrysenes 929 0.0E+00 0.0E+00 0.0E+00 0.0E+00 0.0E+00 0.0E+00 0.0E+00 0.0E+00 0.0E+00 0.0E+00 0.0E+00 0.0E+00
C1-Fluoranthenes/ Pyrenes 770 0.0E+00 0.0E+00 0.0E+00 0.0E+00 0.0E+00 0.0E+00 0.0E+00 0.0E+00 0.0E+00 0.0E+00 0.0E+00 0.0E+00
C1-Fluorenes 611 0.0E+00 0.0E+00 0.0E+00 0.0E+00 0.0E+00 0.0E+00 0.0E+00 0.0E+00 0.0E+00 0.0E+00 0.0E+00 0.0E+00
C2-Anthracenes/ Phenanthrenes 746 0.0E+00 0.0E+00 0.0E+00 0.0E+00 0.0E+00 0.0E+00 0.0E+00 0.0E+00 0.0E+00 0.0E+00 0.0E+00 0.0E+00
C2-Chrysenes 1,008 0.0E+00 0.0E+00 0.0E+00 0.0E+00 0.0E+00 0.0E+00 0.0E+00 0.0E+00 0.0E+00 0.0E+00 0.0E+00 0.0E+00
C2-Fluorenes 686 0.0E+00 0.0E+00 0.0E+00 0.0E+00 0.0E+00 0.0E+00 0.0E+00 0.0E+00 0.0E+00 0.0E+00 0.0E+00 0.0E+00
C2-Napthalenes 510 0.0E+00 0.0E+00 0.0E+00 0.0E+00 0.0E+00 0.0E+00 0.0E+00 0.0E+00 0.0E+00 0.0E+00 0.0E+00 0.0E+00
C3-Anthracenes/ Phenanthrenes 829 0.0E+00 0.0E+00 0.0E+00 0.0E+00 0.0E+00 0.0E+00 0.0E+00 0.0E+00 0.0E+00 0.0E+00 0.0E+00 0.0E+00
C3-Chrysenes 1,112 0.0E+00 0.0E+00 0.0E+00 0.0E+00 0.0E+00 0.0E+00 0.0E+00 0.0E+00 0.0E+00 0.0E+00 0.0E+00 0.0E+00
C3-Fluorenes 769 0.0E+00 0.0E+00 0.0E+00 0.0E+00 0.0E+00 0.0E+00 0.0E+00 0.0E+00 0.0E+00 0.0E+00 0.0E+00 0.0E+00
C3-Napthalenes 581 0.0E+00 0.0E+00 0.0E+00 0.0E+00 0.0E+00 0.0E+00 0.0E+00 0.0E+00 0.0E+00 0.0E+00 0.0E+00 0.0E+00
C4-Anthracenes/ Phenanthrenes 913 0.0E+00 0.0E+00 0.0E+00 0.0E+00 0.0E+00 0.0E+00 0.0E+00 0.0E+00 0.0E+00 0.0E+00 0.0E+00 0.0E+00
C4-Chrysenes 1,214 0.0E+00 0.0E+00 0.0E+00 0.0E+00 0.0E+00 0.0E+00 0.0E+00 0.0E+00 0.0E+00 0.0E+00 0.0E+00 0.0E+00
C4-Napthalenes 657 0.0E+00 0.0E+00 0.0E+00 0.0E+00 0.0E+00 0.0E+00 0.0E+00 0.0E+00 0.0E+00 0.0E+00 0.0E+00 0.0E+00
Σ17PAH mg/kg Σ17PAH TU Σ17PAH mg/kg Σ17PAH TU Σ17PAH mg/kg Σ17PAH TU Σ17PAH mg/kg Σ17PAH TU Σ17PAH mg/kg Σ17PAH TU Σ17PAH mg/kg Σ17PAH TU0.07 0.01 0.21 0.03 0.49 0.09 0.90 0.1 4.15 0.4 2.92 0.2
Σ34PAH mg/kg Σ34PAH mg/kg Σ34PAH mg/kg Σ34PAH mg/kg Σ34PAH mg/kg Σ34PAH mg/kg0.09 0.02 0.29 0.04 0.66 0.11 1.20 0.2 5.55 0.5 3.90 0.3
Σ17PAH mg/kg, TU=1(b,c) 3.5 5.4 4.3 4.5 8.4 11.3Σ34PAH mg/kg, TU=1(b,d) 4.7 7.2 5.8 6.0 11.2 15.1
*TOCs are NOT representative of the overall TOC of the AOCAverage Sum of 17 PAHs mg/kg TU=1 AOC Data 9.6Average Sum of 17 PAHs mg/kg TU=1 All Data 8.6Average Sum of 34 PAHs mg/kg TU=1 All Data 11.5
Average TO 1.53Geomean T 1.46
(a)
(b)
(c)
(d)
The conversion factor between the full 34 PAH list and the 17 PAH list is 1.36 with the full data set and 1.35 based on this data set that includes 1 and 2-methylnapthylene, as indicated in the excel worksheet provided in the workbook associated with this table.
This data set reflects samples collected within the navigational channel with only approximately 15% of samples with ≥ 2% TOC, which is significantly different than the overall AOC data set with > 75% of samples having ≥ 2% TOC.
The average protective Σ17PAH concentration is calculated by setting the TU34=1. Specifically, it is based on the average of (Σ17PAH dry weight sediment concentrations divided by the actual TU of 34PAHs) divided by (1000) to convert units of microgram to milligram.
The average protective Σ34PAH concentration is calculated by setting the TU34=1. Specifically, it is based on the average of (Σ34PAH dry weight sediment concentrations divided by the TU of 34PAHs) divided by (1000) to convert units of microgram to milligram.
1 of 5 ENVIRON
USACE 2007Buffalo River Conversion Factor (a)
Compound
Unsubstituted PAHs
Acenaphthene
Acenaphthylene
Anthracene
Benzo (a) anthracene
Benzo (a) pyrene
Benzo (b) fluoranthene
Benzo (e) pyrene
Benzo (g,h,i) perylene
Benzo (k) fluoranthene
Chrysene
Dibenz (a,h) anthracene
Fluoranthene
Fluorene
Indeno (1,2,3-cd) pyrene
Naphthalene
Phenanthrene
Pyrene
Alkylated PAHs
1-Methylnaphthalene
2-Methylnaphthalene
C1-Anthracenes/ Phenanthrenes
C1-Chrysenes
C1-Fluoranthenes/ Pyrenes
C1-Fluorenes
C2-Anthracenes/ Phenanthrenes
C2-Chrysenes
C2-Fluorenes
C2-Napthalenes
C3-Anthracenes/ Phenanthrenes
C3-Chrysenes
C3-Fluorenes
C3-Napthalenes
C4-Anthracenes/ Phenanthrenes
C4-Chrysenes
C4-Napthalenes
Σ17PAH mg/kg, TU=1(b,c)Σ34PAH mg/kg, TU=1(b,d)
*TOCs are NOT representative of th
Table 5a: Sediment PAH Analysis Using USACE's 2007 Toxicity Testing Data (with TOC from the Study)
BH-18 RM 0.4 BH-22 Outside AOC BH-23 Outside AOC BH-24 Outside AOC BH-25 Outside AOC BH-26 Outside AOC1.6 % Organic Carbon 0.9 % Organic Carbon 1.2 % Organic Carbon 1.6 % Organic Carbon 1.3 % Organic Carbon 1.3 % Organic Carbon
PA
H C
once
ntra
tion
(mg/
kg)
PA
H C
once
ntra
tion
(µg/
goc)
Tox
ic U
nits
Con
cent
ratio
ns w
here
Σ
PA
H T
U =
1
PA
H C
once
ntra
tion
(µg/
goc)
Tox
ic U
nits
PA
H C
once
ntra
tion
(mg/
kg)
PA
H C
once
ntra
tion
(µg/
goc)
Tox
ic U
nits
PA
H C
once
ntra
tion
(mg/
kg)
PA
H C
once
ntra
tion
(µg/
goc)
Tox
ic U
nits
PA
H C
once
ntra
tion
(mg/
kg)
PA
H C
once
ntra
tion
(µg/
goc)
Tox
ic U
nits
PA
H C
once
ntra
tion
(mg/
kg)
PA
H C
once
ntra
tion
(µg/
goc)
Tox
ic U
nits
PA
H C
once
ntra
tion
(mg/
kg)
PA
H C
once
ntra
tion
(µg/
goc)
Tox
ic U
nits
2.4E-02 1.5E+00 3.0E-03 9.6E-02 5.9E+00 1.2E-02 3.0E-02 3.2E+00 6.6E-03 2.0E-02 1.6E+00 3.4E-03 3.9E-02 2.5E+00 5.0E-03 2.1E-01 1.6E+01 3.3E-02 3.2E-02 2.4E+00 4.8E-03
2.3E-02 1.4E+00 3.2E-03 9.3E-02 5.7E+00 1.3E-02 1.0E-01 1.1E+01 2.4E-02 5.9E-02 4.8E+00 1.1E-02 1.2E-01 7.4E+00 1.6E-02 4.7E-01 3.8E+01 8.3E-02 7.6E-02 5.7E+00 1.3E-02
6.7E-02 4.1E+00 7.0E-03 2.7E-01 1.6E+01 2.8E-02 1.6E-01 1.7E+01 2.8E-02 9.3E-02 7.5E+00 1.3E-02 1.9E-01 1.2E+01 2.0E-02 8.7E-01 7.0E+01 1.2E-01 1.5E-01 1.1E+01 1.9E-02
2.5E-01 1.5E+01 1.8E-02 9.9E-01 6.1E+01 7.3E-02 5.0E-01 5.3E+01 6.4E-02 2.7E-01 2.2E+01 2.6E-02 5.6E-01 3.5E+01 4.2E-02 2.3E+00 1.8E+02 2.1E-01 4.4E-01 3.3E+01 4.0E-02
2.0E-01 1.2E+01 1.3E-02 8.0E-01 4.9E+01 5.1E-02 4.5E-01 4.8E+01 4.9E-02 2.6E-01 2.1E+01 2.2E-02 4.9E-01 3.1E+01 3.2E-02 2.1E+00 1.7E+02 1.7E-01 3.5E-01 2.6E+01 2.7E-02
2.7E-01 1.7E+01 1.7E-02 1.1E+00 6.5E+01 6.7E-02 5.8E-01 6.2E+01 6.4E-02 3.4E-01 2.7E+01 2.8E-02 6.9E-01 4.3E+01 4.4E-02 2.6E+00 2.0E+02 2.1E-01 5.1E-01 3.8E+01 3.9E-02
0.0E+00 0.0E+00 0.0E+00 0.0E+00 0.0E+00 0.0E+00 0.0E+00 0.0E+00 0.0E+00 0.0E+00 0.0E+00 0.0E+00 0.0E+00 0.0E+00 0.0E+00
1.4E-01 8.6E+00 7.8E-03 5.5E-01 3.4E+01 3.1E-02 2.2E-01 2.3E+01 2.1E-02 5.8E-03 4.7E-01 4.3E-04 1.2E-02 7.5E-01 6.8E-04 1.0E+00 8.2E+01 7.5E-02 2.1E-01 1.5E+01 1.4E-02
2.0E-01 1.2E+01 1.2E-02 7.8E-01 4.8E+01 4.9E-02 2.1E-01 2.3E+01 2.3E-02 1.2E-01 9.9E+00 1.0E-02 2.0E-01 1.3E+01 1.3E-02 9.5E-01 7.6E+01 7.8E-02 1.5E-01 1.1E+01 1.2E-02
3.9E-01 2.4E+01 2.8E-02 1.5E+00 9.4E+01 1.1E-01 5.7E-01 6.1E+01 7.2E-02 3.6E-01 2.9E+01 3.4E-02 7.3E-01 4.6E+01 5.5E-02 2.7E+00 2.2E+02 2.6E-01 5.7E-01 4.3E+01 5.1E-02
2.6E-02 1.6E+00 1.4E-03 1.0E-01 6.3E+00 5.6E-03 5.9E-02 6.3E+00 5.6E-03 1.5E-02 1.2E+00 1.1E-03 3.0E-02 1.9E+00 1.7E-03 2.6E-01 2.1E+01 1.8E-02 2.2E-02 1.7E+00 1.5E-03
5.2E-01 3.2E+01 4.5E-02 2.0E+00 1.3E+02 1.8E-01 6.4E-01 6.9E+01 9.7E-02 4.1E-01 3.3E+01 4.7E-02 7.5E-01 4.7E+01 6.6E-02 3.3E+00 2.6E+02 3.7E-01 6.0E-01 4.5E+01 6.4E-02
4.2E-02 2.6E+00 4.8E-03 1.7E-01 1.0E+01 1.9E-02 7.4E-02 7.9E+00 1.5E-02 4.6E-02 3.7E+00 6.8E-03 7.7E-02 4.9E+00 9.0E-03 5.2E-01 4.1E+01 7.7E-02 6.6E-02 4.9E+00 9.2E-03
1.3E-01 8.0E+00 7.2E-03 5.1E-01 3.2E+01 2.8E-02 2.0E-01 2.1E+01 1.9E-02 1.5E-01 1.2E+01 1.1E-02 2.5E-01 1.6E+01 1.4E-02 9.6E-01 7.7E+01 6.9E-02 1.9E-01 1.5E+01 1.3E-02
3.8E-02 2.4E+00 6.2E-03 1.5E-01 9.4E+00 2.4E-02 2.4E-01 2.6E+01 6.8E-02 1.5E-01 1.2E+01 3.1E-02 3.4E-01 2.1E+01 5.5E-02 1.2E+00 9.5E+01 2.5E-01 2.2E-01 1.6E+01 4.3E-02
2.4E-01 1.5E+01 2.5E-02 9.4E-01 5.8E+01 9.8E-02 2.9E-01 3.1E+01 5.1E-02 2.0E-01 1.6E+01 2.7E-02 3.8E-01 2.4E+01 4.0E-02 2.1E+00 1.7E+02 2.8E-01 3.1E-01 2.3E+01 3.9E-02
5.6E-01 3.4E+01 4.9E-02 2.2E+00 1.4E+02 2.0E-01 7.2E-01 7.6E+01 1.1E-01 4.7E-01 3.8E+01 5.4E-02 8.3E-01 5.2E+01 7.5E-02 3.5E+00 2.8E+02 4.0E-01 6.6E-01 4.9E+01 7.1E-02
1.3E-02 8.2E-01 1.8E-03 5.3E-02 3.2E+00 7.3E-03 2.6E-02 2.8E+00 6.2E-03 1.8E-02 1.4E+00 3.2E-03 3.0E-02 1.9E+00 4.3E-03 1.3E-01 1.0E+01 2.3E-02 2.5E-02 1.8E+00 4.1E-03
1.8E-02 1.1E+00 2.4E-03 7.0E-02 4.3E+00 9.6E-03 2.4E-02 2.5E+00 5.6E-03 3.1E-02 2.5E+00 5.5E-03 6.3E-02 4.0E+00 8.9E-03 1.2E-01 9.9E+00 2.2E-02 4.7E-02 3.5E+00 7.9E-03
0.0E+00 0.0E+00 0.0E+00 0.0E+00 0.0E+00 0.0E+00 0.0E+00 0.0E+00 0.0E+00 0.0E+00 0.0E+00 0.0E+00 0.0E+00 0.0E+00 0.0E+00
0.0E+00 0.0E+00 0.0E+00 0.0E+00 0.0E+00 0.0E+00 0.0E+00 0.0E+00 0.0E+00 0.0E+00 0.0E+00 0.0E+00 0.0E+00 0.0E+00 0.0E+00
0.0E+00 0.0E+00 0.0E+00 0.0E+00 0.0E+00 0.0E+00 0.0E+00 0.0E+00 0.0E+00 0.0E+00 0.0E+00 0.0E+00 0.0E+00 0.0E+00 0.0E+00
0.0E+00 0.0E+00 0.0E+00 0.0E+00 0.0E+00 0.0E+00 0.0E+00 0.0E+00 0.0E+00 0.0E+00 0.0E+00 0.0E+00 0.0E+00 0.0E+00 0.0E+00
0.0E+00 0.0E+00 0.0E+00 0.0E+00 0.0E+00 0.0E+00 0.0E+00 0.0E+00 0.0E+00 0.0E+00 0.0E+00 0.0E+00 0.0E+00 0.0E+00 0.0E+00
0.0E+00 0.0E+00 0.0E+00 0.0E+00 0.0E+00 0.0E+00 0.0E+00 0.0E+00 0.0E+00 0.0E+00 0.0E+00 0.0E+00 0.0E+00 0.0E+00 0.0E+00
0.0E+00 0.0E+00 0.0E+00 0.0E+00 0.0E+00 0.0E+00 0.0E+00 0.0E+00 0.0E+00 0.0E+00 0.0E+00 0.0E+00 0.0E+00 0.0E+00 0.0E+00
0.0E+00 0.0E+00 0.0E+00 0.0E+00 0.0E+00 0.0E+00 0.0E+00 0.0E+00 0.0E+00 0.0E+00 0.0E+00 0.0E+00 0.0E+00 0.0E+00 0.0E+00
0.0E+00 0.0E+00 0.0E+00 0.0E+00 0.0E+00 0.0E+00 0.0E+00 0.0E+00 0.0E+00 0.0E+00 0.0E+00 0.0E+00 0.0E+00 0.0E+00 0.0E+00
0.0E+00 0.0E+00 0.0E+00 0.0E+00 0.0E+00 0.0E+00 0.0E+00 0.0E+00 0.0E+00 0.0E+00 0.0E+00 0.0E+00 0.0E+00 0.0E+00 0.0E+00
0.0E+00 0.0E+00 0.0E+00 0.0E+00 0.0E+00 0.0E+00 0.0E+00 0.0E+00 0.0E+00 0.0E+00 0.0E+00 0.0E+00 0.0E+00 0.0E+00 0.0E+00
0.0E+00 0.0E+00 0.0E+00 0.0E+00 0.0E+00 0.0E+00 0.0E+00 0.0E+00 0.0E+00 0.0E+00 0.0E+00 0.0E+00 0.0E+00 0.0E+00 0.0E+00
0.0E+00 0.0E+00 0.0E+00 0.0E+00 0.0E+00 0.0E+00 0.0E+00 0.0E+00 0.0E+00 0.0E+00 0.0E+00 0.0E+00 0.0E+00 0.0E+00 0.0E+00
0.0E+00 0.0E+00 0.0E+00 0.0E+00 0.0E+00 0.0E+00 0.0E+00 0.0E+00 0.0E+00 0.0E+00 0.0E+00 0.0E+00 0.0E+00 0.0E+00 0.0E+00
0.0E+00 0.0E+00 0.0E+00 0.0E+00 0.0E+00 0.0E+00 0.0E+00 0.0E+00 0.0E+00 0.0E+00 0.0E+00 0.0E+00 0.0E+00 0.0E+00 0.0E+00
Σ17PAH mg/kg Σ17PAH TU Σ17PAH TU Σ17PAH mg/kg Σ17PAH TU Σ17PAH mg/kg Σ17PAH TU Σ17PAH mg/kg Σ17PAH TU Σ17PAH mg/kg Σ17PAH TU Σ17PAH mg/kg Σ17PAH TU3.13 0.3 1 5.08 0.7 3.01 0.3 5.77 0.5 25.15 3 4.63 0.5
Σ34PAH mg/kg Σ34PAH mg/kg 1 Σ34PAH mg/kg Σ34PAH mg/kg Σ34PAH mg/kg Σ34PAH mg/kg4.19 0.3 6.80 0.97 4.02 0.4 7.73 0.7 33.64 4 6.19 0.6
9.3 5.2 6.8 8.6 6.8 7.312.4 7.0 9.0 11.5 9.2 9.8
TU ≤ 1 Toxic units (i.e., hazard quotients) less than one indicates toxicity from PAHs unlikely µg/gOC microgram per gram of organic carbon
TU >1 Toxic unit (i.e., hazard quotients) greater than 1 indicates toxicity from PAH is predicted, but no toxicity was observed in this chronic study µg/kg microgram per kilogram
TOC<2% PAH polycyclic aromatic hydrocarbon
TOC >2% RM river mile
CF conversion factor TOC total organic carbon
TPAH total polycyclic aromatic hydrocarbon
TU toxicity unit (i.e., hazard quotient); rounded to one significant figure
USACE US Army Corps of Engineers
BH-18ΣPAH TU = 1
2 of 5 ENVIRON
USACE 2007Buffalo River Conversion Factor (a)
Compound
Unsubstituted PAHs
Acenaphthene
Acenaphthylene
Anthracene
Benzo (a) anthracene
Benzo (a) pyrene
Benzo (b) fluoranthene
Benzo (e) pyrene
Benzo (g,h,i) perylene
Benzo (k) fluoranthene
Chrysene
Dibenz (a,h) anthracene
Fluoranthene
Fluorene
Indeno (1,2,3-cd) pyrene
Naphthalene
Phenanthrene
Pyrene
Alkylated PAHs
1-Methylnaphthalene
2-Methylnaphthalene
C1-Anthracenes/ Phenanthrenes
C1-Chrysenes
C1-Fluoranthenes/ Pyrenes
C1-Fluorenes
C2-Anthracenes/ Phenanthrenes
C2-Chrysenes
C2-Fluorenes
C2-Napthalenes
C3-Anthracenes/ Phenanthrenes
C3-Chrysenes
C3-Fluorenes
C3-Napthalenes
C4-Anthracenes/ Phenanthrenes
C4-Chrysenes
C4-Napthalenes
Σ17PAH mg/kg, TU=1(b,c)Σ34PAH mg/kg, TU=1(b,d)
*TOCs are NOT representative of th
Table 5a: Sediment PAH Analysis Using USACE's 2007 Toxicity Testing Data (with TOC from the Study)
BH-27 Outside AOC BH-28 Outside AOC BH-19 Outside AOC BH-20 Outside AOC BH-21 Outside AOC BH-13 SC BH-14 SC2.1 % Organic Carbon 2.0 % Organic Carbon 1.8 % Organic Carbon 1.6 % Organic Carbon 1.2 % Organic Carbon 1.8 % Organic Carbon 1.6 % Organic Carbon
PA
H C
once
ntra
tion
(mg/
kg)
PA
H C
once
ntra
tion
(µg/
goc)
Tox
ic U
nits
PA
H C
once
ntra
tion
(mg/
kg)
PA
H C
once
ntra
tion
(µg/
goc)
Tox
ic U
nits
PA
H C
once
ntra
tion
(mg/
kg)
PA
H C
once
ntra
tion
(µg/
goc)
Tox
ic U
nits
PA
H C
once
ntra
tion
(mg/
kg)
PA
H C
once
ntra
tion
(µg/
goc)
Tox
ic U
nits
PA
H C
once
ntra
tion
(mg/
kg)
PA
H C
once
ntra
tion
(µg/
goc)
Tox
ic U
nits
Con
cent
ratio
ns w
here
Σ
PA
H T
U =
1
PA
H C
once
ntra
tion
(µg/
goc)
Tox
ic U
nits
PA
H C
once
ntra
tion
(mg/
kg)
PA
H C
once
ntra
tion
(µg/
goc)
Tox
ic U
nits
PA
H C
once
ntra
tion
(mg/
kg)
PA
H C
once
ntra
tion
(µg/
goc)
Tox
ic U
nits
2.8E-02 1.3E+00 2.7E-03 3.4E-02 1.7E+00 3.4E-03 1.4E-02 7.7E-01 1.6E-03 1.9E-02 1.2E+00 2.4E-03 8.4E-03 6.9E-01 1.4E-03 3.5E-02 2.9E+00 5.8E-03 9.5E-03 5.3E-01 1.1E-03 8.1E-03 4.9E-01 1.0E-03
6.5E-02 3.1E+00 6.8E-03 6.5E-02 3.2E+00 7.1E-03 1.7E-02 9.5E-01 2.1E-03 2.9E-02 1.9E+00 4.1E-03 3.7E-02 3.0E+00 6.7E-03 1.5E-01 1.3E+01 2.8E-02 1.6E-02 9.2E-01 2.0E-03 1.2E-02 7.6E-01 1.7E-03
1.2E-01 5.7E+00 9.5E-03 1.4E-01 6.7E+00 1.1E-02 3.8E-02 2.1E+00 3.6E-03 6.5E-02 4.2E+00 7.0E-03 6.4E-02 5.3E+00 8.9E-03 2.6E-01 2.2E+01 3.7E-02 2.8E-02 1.6E+00 2.7E-03 2.8E-02 1.7E+00 2.9E-03
3.9E-01 1.8E+01 2.2E-02 3.8E-01 1.9E+01 2.2E-02 1.3E-01 7.2E+00 8.5E-03 2.5E-01 1.6E+01 1.9E-02 2.4E-01 2.0E+01 2.4E-02 1.0E+00 8.3E+01 9.9E-02 1.0E-01 5.6E+00 6.7E-03 1.3E-01 7.9E+00 9.4E-03
3.3E-01 1.6E+01 1.6E-02 3.0E-01 1.5E+01 1.5E-02 1.2E-01 6.5E+00 6.8E-03 2.4E-01 1.5E+01 1.6E-02 2.5E-01 2.1E+01 2.1E-02 1.0E+00 8.6E+01 8.9E-02 7.8E-02 4.4E+00 4.5E-03 1.1E-01 6.6E+00 6.9E-03
4.7E-01 2.2E+01 2.3E-02 4.3E-01 2.1E+01 2.1E-02 1.9E-01 1.1E+01 1.1E-02 4.1E-01 2.6E+01 2.7E-02 4.1E-01 3.4E+01 3.5E-02 1.7E+00 1.4E+02 1.5E-01 1.2E-01 6.5E+00 6.6E-03 1.8E-01 1.1E+01 1.1E-02
0.0E+00 0.0E+00 0.0E+00 0.0E+00 0.0E+00 0.0E+00 0.0E+00 0.0E+00 0.0E+00 0.0E+00 0.0E+00 0.0E+00 0.0E+00 0.0E+00 0.0E+00 0.0E+00 0.0E+00
2.1E-01 1.0E+01 9.2E-03 1.9E-01 9.2E+00 8.4E-03 8.1E-02 4.6E+00 4.2E-03 1.8E-01 1.2E+01 1.1E-02 1.7E-01 1.4E+01 1.3E-02 6.9E-01 5.7E+01 5.2E-02 4.2E-02 2.4E+00 2.2E-03 6.8E-02 4.2E+00 3.8E-03
1.3E-01 6.3E+00 6.4E-03 1.3E-01 6.5E+00 6.6E-03 6.9E-02 3.9E+00 4.0E-03 1.2E-01 7.6E+00 7.7E-03 1.4E-01 1.1E+01 1.1E-02 5.6E-01 4.6E+01 4.7E-02 4.7E-02 2.6E+00 2.7E-03 7.1E-02 4.3E+00 4.4E-03
4.9E-01 2.3E+01 2.8E-02 4.9E-01 2.4E+01 2.9E-02 2.1E-01 1.2E+01 1.4E-02 4.2E-01 2.7E+01 3.1E-02 1.2E-02 1.0E+00 1.2E-03 5.1E-02 4.2E+00 5.0E-03 1.2E-01 7.0E+00 8.3E-03 1.8E-01 1.1E+01 1.3E-02
2.2E-02 1.0E+00 9.2E-04 1.8E-02 8.7E-01 7.8E-04 6.6E-03 3.7E-01 3.3E-04 1.4E-02 9.2E-01 8.2E-04 4.4E-02 3.6E+00 3.2E-03 1.8E-01 1.5E+01 1.3E-02 1.4E-02 7.8E-01 7.0E-04 3.1E-02 1.9E+00 1.7E-03
5.3E-01 2.5E+01 3.5E-02 5.8E-01 2.8E+01 4.0E-02 2.6E-01 1.5E+01 2.1E-02 4.8E-01 3.0E+01 4.3E-02 4.4E-01 3.7E+01 5.2E-02 1.8E+00 1.5E+02 2.1E-01 1.5E-01 8.3E+00 1.2E-02 2.5E-01 1.5E+01 2.1E-02
5.8E-02 2.8E+00 5.1E-03 6.8E-02 3.4E+00 6.3E-03 2.9E-02 1.7E+00 3.1E-03 3.7E-02 2.3E+00 4.3E-03 2.8E-02 2.3E+00 4.3E-03 1.2E-01 9.5E+00 1.8E-02 1.4E-02 7.6E-01 1.4E-03 1.2E-02 7.3E-01 1.4E-03
2.0E-01 9.3E+00 8.4E-03 1.8E-01 8.6E+00 7.7E-03 7.3E-02 4.1E+00 3.7E-03 1.6E-01 1.0E+01 9.3E-03 1.5E-01 1.2E+01 1.1E-02 6.0E-01 5.0E+01 4.5E-02 4.3E-02 2.4E+00 2.2E-03 6.9E-02 4.2E+00 3.8E-03
1.7E-01 8.1E+00 2.1E-02 2.2E-01 1.1E+01 2.8E-02 1.4E-02 7.7E-01 2.0E-03 3.9E-02 2.5E+00 6.5E-03 4.5E-02 3.7E+00 9.6E-03 1.9E-01 1.5E+01 4.0E-02 1.6E-02 8.8E-01 2.3E-03 8.0E-03 4.8E-01 1.3E-03
2.7E-01 1.3E+01 2.1E-02 3.3E-01 1.6E+01 2.7E-02 1.3E-01 7.6E+00 1.3E-02 1.9E-01 1.2E+01 2.0E-02 1.3E-01 1.1E+01 1.8E-02 5.4E-01 4.5E+01 7.5E-02 5.1E-02 2.8E+00 4.8E-03 8.7E-02 5.3E+00 8.9E-03
6.1E-01 2.9E+01 4.1E-02 6.5E-01 3.2E+01 4.6E-02 2.9E-01 1.7E+01 2.4E-02 5.7E-01 3.6E+01 5.2E-02 1.5E-01 1.3E+01 1.8E-02 6.4E-01 5.3E+01 7.6E-02 1.4E-01 8.0E+00 1.1E-02 2.2E-01 1.4E+01 2.0E-02
2.2E-02 1.1E+00 2.4E-03 2.3E-02 1.1E+00 2.5E-03 8.7E-03 4.9E-01 1.1E-03 1.2E-02 7.3E-01 1.6E-03 8.0E-03 6.6E-01 1.5E-03 3.3E-02 2.7E+00 6.1E-03 7.6E-03 4.3E-01 9.5E-04 4.5E-03 2.8E-01 6.2E-04
3.9E-02 1.9E+00 4.2E-03 4.3E-02 2.1E+00 4.7E-03 1.1E-02 6.0E-01 1.3E-03 1.7E-02 1.1E+00 2.4E-03 7.0E-03 5.8E-01 1.3E-03 2.9E-02 2.4E+00 5.4E-03 9.9E-03 5.6E-01 1.2E-03 5.4E-03 3.3E-01 7.4E-04
0.0E+00 0.0E+00 0.0E+00 0.0E+00 0.0E+00 0.0E+00 0.0E+00 0.0E+00 0.0E+00 0.0E+00 0.0E+00 0.0E+00 0.0E+00 0.0E+00 0.0E+00 0.0E+00 0.0E+00
0.0E+00 0.0E+00 0.0E+00 0.0E+00 0.0E+00 0.0E+00 0.0E+00 0.0E+00 0.0E+00 0.0E+00 0.0E+00 0.0E+00 0.0E+00 0.0E+00 0.0E+00 0.0E+00 0.0E+00
0.0E+00 0.0E+00 0.0E+00 0.0E+00 0.0E+00 0.0E+00 0.0E+00 0.0E+00 0.0E+00 0.0E+00 0.0E+00 0.0E+00 0.0E+00 0.0E+00 0.0E+00 0.0E+00 0.0E+00
0.0E+00 0.0E+00 0.0E+00 0.0E+00 0.0E+00 0.0E+00 0.0E+00 0.0E+00 0.0E+00 0.0E+00 0.0E+00 0.0E+00 0.0E+00 0.0E+00 0.0E+00 0.0E+00 0.0E+00
0.0E+00 0.0E+00 0.0E+00 0.0E+00 0.0E+00 0.0E+00 0.0E+00 0.0E+00 0.0E+00 0.0E+00 0.0E+00 0.0E+00 0.0E+00 0.0E+00 0.0E+00 0.0E+00 0.0E+00
0.0E+00 0.0E+00 0.0E+00 0.0E+00 0.0E+00 0.0E+00 0.0E+00 0.0E+00 0.0E+00 0.0E+00 0.0E+00 0.0E+00 0.0E+00 0.0E+00 0.0E+00 0.0E+00 0.0E+00
0.0E+00 0.0E+00 0.0E+00 0.0E+00 0.0E+00 0.0E+00 0.0E+00 0.0E+00 0.0E+00 0.0E+00 0.0E+00 0.0E+00 0.0E+00 0.0E+00 0.0E+00 0.0E+00 0.0E+00
0.0E+00 0.0E+00 0.0E+00 0.0E+00 0.0E+00 0.0E+00 0.0E+00 0.0E+00 0.0E+00 0.0E+00 0.0E+00 0.0E+00 0.0E+00 0.0E+00 0.0E+00 0.0E+00 0.0E+00
0.0E+00 0.0E+00 0.0E+00 0.0E+00 0.0E+00 0.0E+00 0.0E+00 0.0E+00 0.0E+00 0.0E+00 0.0E+00 0.0E+00 0.0E+00 0.0E+00 0.0E+00 0.0E+00 0.0E+00
0.0E+00 0.0E+00 0.0E+00 0.0E+00 0.0E+00 0.0E+00 0.0E+00 0.0E+00 0.0E+00 0.0E+00 0.0E+00 0.0E+00 0.0E+00 0.0E+00 0.0E+00 0.0E+00 0.0E+00
0.0E+00 0.0E+00 0.0E+00 0.0E+00 0.0E+00 0.0E+00 0.0E+00 0.0E+00 0.0E+00 0.0E+00 0.0E+00 0.0E+00 0.0E+00 0.0E+00 0.0E+00 0.0E+00 0.0E+00
0.0E+00 0.0E+00 0.0E+00 0.0E+00 0.0E+00 0.0E+00 0.0E+00 0.0E+00 0.0E+00 0.0E+00 0.0E+00 0.0E+00 0.0E+00 0.0E+00 0.0E+00 0.0E+00 0.0E+00
0.0E+00 0.0E+00 0.0E+00 0.0E+00 0.0E+00 0.0E+00 0.0E+00 0.0E+00 0.0E+00 0.0E+00 0.0E+00 0.0E+00 0.0E+00 0.0E+00 0.0E+00 0.0E+00 0.0E+00
0.0E+00 0.0E+00 0.0E+00 0.0E+00 0.0E+00 0.0E+00 0.0E+00 0.0E+00 0.0E+00 0.0E+00 0.0E+00 0.0E+00 0.0E+00 0.0E+00 0.0E+00 0.0E+00 0.0E+00
0.0E+00 0.0E+00 0.0E+00 0.0E+00 0.0E+00 0.0E+00 0.0E+00 0.0E+00 0.0E+00 0.0E+00 0.0E+00 0.0E+00 0.0E+00 0.0E+00 0.0E+00 0.0E+00 0.0E+00
Σ17PAH mg/kg Σ17PAH TU Σ17PAH mg/kg Σ17PAH TU Σ17PAH mg/kg Σ17PAH TU Σ17PAH mg/kg Σ17PAH TU Σ17PAH mg/kg Σ17PAH TU Σ17PAH TU Σ17PAH mg/kg Σ17PAH TU Σ17PAH mg/kg Σ17PAH TU4.14 0.3 4.24 0.3 1.68 0.1 3.25 0.3 2.33 0.2 1 1.00 0.07 1.47 0.1
Σ34PAH mg/kg 0.4 Σ34PAH mg/kg Σ34PAH mg/kg Σ34PAH mg/kg Σ34PAH mg/kg Σ34PAH mg/kg Σ34PAH mg/kg5.53 0.35 5.67 0.4 2.25 0.2 4.35 0.4 3.12 0.3 1.34 0.1 1.96 0.2
11.7 11.1 10.1 9.2 7.2 10.2 9.715.7 14.8 13.5 12.3 9.7 13.7 13.0
BH-21ΣPAH TU = 1
3 of 5 ENVIRON
USACE 2007Buffalo River Conversion Factor (a)
Compound
Unsubstituted PAHs
Acenaphthene
Acenaphthylene
Anthracene
Benzo (a) anthracene
Benzo (a) pyrene
Benzo (b) fluoranthene
Benzo (e) pyrene
Benzo (g,h,i) perylene
Benzo (k) fluoranthene
Chrysene
Dibenz (a,h) anthracene
Fluoranthene
Fluorene
Indeno (1,2,3-cd) pyrene
Naphthalene
Phenanthrene
Pyrene
Alkylated PAHs
1-Methylnaphthalene
2-Methylnaphthalene
C1-Anthracenes/ Phenanthrenes
C1-Chrysenes
C1-Fluoranthenes/ Pyrenes
C1-Fluorenes
C2-Anthracenes/ Phenanthrenes
C2-Chrysenes
C2-Fluorenes
C2-Napthalenes
C3-Anthracenes/ Phenanthrenes
C3-Chrysenes
C3-Fluorenes
C3-Napthalenes
C4-Anthracenes/ Phenanthrenes
C4-Chrysenes
C4-Napthalenes
Σ17PAH mg/kg, TU=1(b,c)Σ34PAH mg/kg, TU=1(b,d)
*TOCs are NOT representative of th
Table 5a: Sediment PAH Analysis Using USACE's 2007 Toxicity Testing Data (with TOC from the Study)
BH-15 SC BH-10 RM 2.0 BH-11 RM 1.6 BH-12 RM 1.0 BH-5 RM 4.2 BH-6 RM 3.8 BH-7 RM 3.51.7 % Organic Carbon 2.4 % Organic Carbon 1.2 % Organic Carbon 1.4 % Organic Carbon 2.2 % Organic Carbon 1.9 % Organic Carbon 1.5 % Organic Carbon
PA
H C
once
ntra
tion
(mg/
kg)
PA
H C
once
ntra
tion
(µg/
goc)
Tox
ic U
nits
PA
H C
once
ntra
tion
(mg/
kg)
PA
H C
once
ntra
tion
(µg/
goc)
Tox
ic U
nits
PA
H C
once
ntra
tion
(mg/
kg)
PA
H C
once
ntra
tion
(µg/
goc)
Tox
ic U
nits
Con
cent
ratio
ns w
here
Σ
PA
H T
U =
1
PA
H C
once
ntra
tion
(µg/
goc)
Tox
ic U
nits
PA
H C
once
ntra
tion
(mg/
kg)
PA
H C
once
ntra
tion
(µg/
goc)
Tox
ic U
nits
PA
H C
once
ntra
tion
(mg/
kg)
PA
H C
once
ntra
tion
(µg/
goc)
Tox
ic U
nits
PA
H C
once
ntra
tion
(mg/
kg)
PA
H C
once
ntra
tion
(µg/
goc)
Tox
ic U
nits
PA
H C
once
ntra
tion
(mg/
kg)
PA
H C
once
ntra
tion
(µg/
goc)
Tox
ic U
nits
2.9E-03 1.7E-01 3.5E-04 5.9E-03 2.5E-01 5.1E-04 1.3E-02 1.1E+00 2.3E-03 7.1E-02 6.1E+00 1.2E-02 3.5E-02 2.5E+00 5.0E-03 2.2E-02 1.0E+00 2.1E-03 1.0E-03 5.6E-02 1.1E-04 2.2E-03 1.5E-01 3.0E-04
3.6E-03 2.1E-01 4.7E-04 7.2E-03 3.0E-01 6.7E-04 1.3E-02 1.1E+00 2.4E-03 7.1E-02 6.0E+00 1.3E-02 1.2E-02 8.5E-01 1.9E-03 2.0E-02 9.3E-01 2.1E-03 2.4E-03 1.3E-01 2.9E-04 3.6E-03 2.4E-01 5.3E-04
8.0E-03 4.7E-01 7.8E-04 1.9E-02 7.8E-01 1.3E-03 3.8E-02 3.2E+00 5.4E-03 2.1E-01 1.7E+01 2.9E-02 8.8E-02 6.1E+00 1.0E-02 5.3E-02 2.4E+00 4.1E-03 3.6E-03 1.9E-01 3.2E-04 6.3E-03 4.2E-01 7.0E-04
3.1E-02 1.8E+00 2.1E-03 8.1E-02 3.4E+00 4.0E-03 1.4E-01 1.2E+01 1.4E-02 7.7E-01 6.5E+01 7.8E-02 1.2E-01 8.5E+00 1.0E-02 2.1E-01 9.6E+00 1.1E-02 1.3E-02 6.7E-01 8.0E-04 3.0E-02 2.0E+00 2.4E-03
2.9E-02 1.7E+00 1.7E-03 7.6E-02 3.2E+00 3.3E-03 1.2E-01 9.9E+00 1.0E-02 6.4E-01 5.4E+01 5.6E-02 5.8E-02 4.0E+00 4.2E-03 1.8E-01 8.2E+00 8.5E-03 1.1E-02 5.7E-01 5.9E-04 2.9E-02 1.9E+00 2.0E-03
4.9E-02 2.8E+00 2.9E-03 1.1E-01 4.4E+00 4.5E-03 2.0E-01 1.7E+01 1.7E-02 1.1E+00 9.1E+01 9.3E-02 1.0E-01 7.2E+00 7.3E-03 2.8E-01 1.3E+01 1.3E-02 1.6E-02 8.8E-01 9.0E-04 4.7E-02 3.1E+00 3.2E-03
0.0E+00 0.0E+00 0.0E+00 0.0E+00 0.0E+00 0.0E+00 0.0E+00 0.0E+00 0.0E+00 0.0E+00 0.0E+00 0.0E+00 0.0E+00 0.0E+00 0.0E+00 0.0E+00 0.0E+00
1.8E-02 1.1E+00 9.7E-04 4.3E-02 1.8E+00 1.7E-03 7.5E-02 6.3E+00 5.8E-03 4.1E-01 3.4E+01 3.1E-02 2.8E-02 1.9E+00 1.8E-03 1.0E-01 4.7E+00 4.3E-03 6.0E-03 3.2E-01 3.0E-04 1.7E-02 1.1E+00 1.0E-03
1.8E-02 1.1E+00 1.1E-03 4.8E-02 2.0E+00 2.1E-03 6.7E-02 5.7E+00 5.8E-03 3.6E-01 3.1E+01 3.1E-02 2.8E-02 1.9E+00 2.0E-03 1.1E-01 5.0E+00 5.1E-03 5.9E-03 3.2E-01 3.2E-04 1.7E-02 1.2E+00 1.2E-03
2.7E-02 1.6E+00 1.9E-03 1.1E-01 4.5E+00 5.3E-03 1.9E-01 1.6E+01 1.9E-02 1.0E+00 8.8E+01 1.0E-01 2.2E-01 1.5E+01 1.8E-02 3.2E-01 1.5E+01 1.8E-02 5.5E-04 3.0E-02 3.5E-05 3.4E-02 2.2E+00 2.7E-03
4.0E-03 2.3E-01 2.1E-04 1.3E-02 5.7E-01 5.0E-04 3.3E-02 2.8E+00 2.5E-03 1.8E-01 1.5E+01 1.4E-02 9.1E-03 6.3E-01 5.6E-04 2.9E-02 1.3E+00 1.2E-03 8.8E-04 4.7E-02 4.2E-05 3.8E-03 2.5E-01 2.2E-04
6.5E-02 3.8E+00 5.3E-03 1.5E-01 6.2E+00 8.8E-03 2.8E-01 2.3E+01 3.3E-02 1.5E+00 1.3E+02 1.8E-01 2.3E-01 1.6E+01 2.2E-02 4.1E-01 1.9E+01 2.7E-02 2.5E-02 1.3E+00 1.9E-03 6.4E-02 4.2E+00 6.0E-03
6.3E-03 3.7E-01 6.8E-04 9.6E-03 4.0E-01 7.5E-04 2.0E-02 1.7E+00 3.1E-03 1.1E-01 9.2E+00 1.7E-02 8.9E-02 6.2E+00 1.1E-02 3.6E-02 1.6E+00 3.1E-03 2.1E-03 1.2E-01 2.1E-04 4.4E-03 2.9E-01 5.4E-04
1.5E-02 8.5E-01 7.7E-04 3.9E-02 1.6E+00 1.5E-03 7.5E-02 6.4E+00 5.7E-03 4.1E-01 3.5E+01 3.1E-02 2.4E-02 1.6E+00 1.5E-03 1.6E-02 7.3E-01 6.6E-04 5.0E-03 2.7E-01 2.4E-04 1.4E-02 9.3E-01 8.4E-04
2.9E-03 1.7E-01 4.4E-04 4.3E-03 1.8E-01 4.7E-04 1.1E-02 8.9E-01 2.3E-03 5.7E-02 4.9E+00 1.3E-02 9.3E-03 6.4E-01 1.7E-03 5.9E-02 2.7E+00 7.1E-03 1.8E-03 9.5E-02 2.5E-04 2.0E-03 1.3E-01 3.4E-04
3.1E-02 1.8E+00 3.1E-03 6.4E-02 2.7E+00 4.5E-03 1.4E-01 1.2E+01 2.0E-02 7.9E-01 6.7E+01 1.1E-01 1.5E-01 1.0E+01 1.7E-02 2.0E-01 9.1E+00 1.5E-02 1.3E-02 7.1E-01 1.2E-03 2.7E-02 1.8E+00 3.0E-03
5.9E-02 3.5E+00 5.0E-03 1.5E-01 6.2E+00 8.9E-03 2.6E-01 2.2E+01 3.2E-02 1.4E+00 1.2E+02 1.7E-01 3.2E-01 2.2E+01 3.2E-02 4.1E-01 1.9E+01 2.7E-02 1.3E-02 7.1E-01 1.0E-03 6.4E-02 4.3E+00 6.1E-03
2.3E-03 1.3E-01 3.0E-04 2.8E-03 1.2E-01 2.6E-04 4.7E-03 4.0E-01 8.9E-04 2.6E-02 2.2E+00 4.9E-03 1.2E-02 8.5E-01 1.9E-03 9.7E-03 4.5E-01 1.0E-03 1.2E-03 6.4E-02 1.4E-04 1.5E-03 9.7E-02 2.2E-04
1.6E-03 9.2E-02 2.1E-04 3.1E-03 1.3E-01 3.0E-04 5.8E-03 4.9E-01 1.1E-03 3.2E-02 2.7E+00 6.0E-03 1.2E-02 8.6E-01 1.9E-03 1.7E-02 7.6E-01 1.7E-03 9.7E-04 5.2E-02 1.2E-04 1.1E-03 7.2E-02 1.6E-04
0.0E+00 0.0E+00 0.0E+00 0.0E+00 0.0E+00 0.0E+00 0.0E+00 0.0E+00 0.0E+00 0.0E+00 0.0E+00 0.0E+00 0.0E+00 0.0E+00 0.0E+00 0.0E+00 0.0E+00
0.0E+00 0.0E+00 0.0E+00 0.0E+00 0.0E+00 0.0E+00 0.0E+00 0.0E+00 0.0E+00 0.0E+00 0.0E+00 0.0E+00 0.0E+00 0.0E+00 0.0E+00 0.0E+00 0.0E+00
0.0E+00 0.0E+00 0.0E+00 0.0E+00 0.0E+00 0.0E+00 0.0E+00 0.0E+00 0.0E+00 0.0E+00 0.0E+00 0.0E+00 0.0E+00 0.0E+00 0.0E+00 0.0E+00 0.0E+00
0.0E+00 0.0E+00 0.0E+00 0.0E+00 0.0E+00 0.0E+00 0.0E+00 0.0E+00 0.0E+00 0.0E+00 0.0E+00 0.0E+00 0.0E+00 0.0E+00 0.0E+00 0.0E+00 0.0E+00
0.0E+00 0.0E+00 0.0E+00 0.0E+00 0.0E+00 0.0E+00 0.0E+00 0.0E+00 0.0E+00 0.0E+00 0.0E+00 0.0E+00 0.0E+00 0.0E+00 0.0E+00 0.0E+00 0.0E+00
0.0E+00 0.0E+00 0.0E+00 0.0E+00 0.0E+00 0.0E+00 0.0E+00 0.0E+00 0.0E+00 0.0E+00 0.0E+00 0.0E+00 0.0E+00 0.0E+00 0.0E+00 0.0E+00 0.0E+00
0.0E+00 0.0E+00 0.0E+00 0.0E+00 0.0E+00 0.0E+00 0.0E+00 0.0E+00 0.0E+00 0.0E+00 0.0E+00 0.0E+00 0.0E+00 0.0E+00 0.0E+00 0.0E+00 0.0E+00
0.0E+00 0.0E+00 0.0E+00 0.0E+00 0.0E+00 0.0E+00 0.0E+00 0.0E+00 0.0E+00 0.0E+00 0.0E+00 0.0E+00 0.0E+00 0.0E+00 0.0E+00 0.0E+00 0.0E+00
0.0E+00 0.0E+00 0.0E+00 0.0E+00 0.0E+00 0.0E+00 0.0E+00 0.0E+00 0.0E+00 0.0E+00 0.0E+00 0.0E+00 0.0E+00 0.0E+00 0.0E+00 0.0E+00 0.0E+00
0.0E+00 0.0E+00 0.0E+00 0.0E+00 0.0E+00 0.0E+00 0.0E+00 0.0E+00 0.0E+00 0.0E+00 0.0E+00 0.0E+00 0.0E+00 0.0E+00 0.0E+00 0.0E+00 0.0E+00
0.0E+00 0.0E+00 0.0E+00 0.0E+00 0.0E+00 0.0E+00 0.0E+00 0.0E+00 0.0E+00 0.0E+00 0.0E+00 0.0E+00 0.0E+00 0.0E+00 0.0E+00 0.0E+00 0.0E+00
0.0E+00 0.0E+00 0.0E+00 0.0E+00 0.0E+00 0.0E+00 0.0E+00 0.0E+00 0.0E+00 0.0E+00 0.0E+00 0.0E+00 0.0E+00 0.0E+00 0.0E+00 0.0E+00 0.0E+00
0.0E+00 0.0E+00 0.0E+00 0.0E+00 0.0E+00 0.0E+00 0.0E+00 0.0E+00 0.0E+00 0.0E+00 0.0E+00 0.0E+00 0.0E+00 0.0E+00 0.0E+00 0.0E+00 0.0E+00
0.0E+00 0.0E+00 0.0E+00 0.0E+00 0.0E+00 0.0E+00 0.0E+00 0.0E+00 0.0E+00 0.0E+00 0.0E+00 0.0E+00 0.0E+00 0.0E+00 0.0E+00 0.0E+00 0.0E+00
0.0E+00 0.0E+00 0.0E+00 0.0E+00 0.0E+00 0.0E+00 0.0E+00 0.0E+00 0.0E+00 0.0E+00 0.0E+00 0.0E+00 0.0E+00 0.0E+00 0.0E+00 0.0E+00 0.0E+00
Σ17PAH mg/kg Σ17PAH TU Σ17PAH mg/kg Σ17PAH TU Σ17PAH mg/kg Σ17PAH TU Σ17PAH TU Σ17PAH mg/kg Σ17PAH TU Σ17PAH mg/kg Σ17PAH TU Σ17PAH mg/kg Σ17PAH TU Σ17PAH mg/kg Σ17PAH TU0.37 0.03 0.92 0.05 1.68 0.2 1 1.54 0.2 2.48 0.2 0.12 0.009 0.37 0.03
Σ34PAH mg/kg Σ34PAH mg/kg Σ34PAH mg/kg Σ34PAH mg/kg Σ34PAH mg/kg Σ34PAH mg/kg Σ34PAH mg/kg0.50 0.04 1.23 0.07 2.25 0.25 2.06 0.2 3.32 0.2 0.16 0.01 0.49 0.04
9.8 13.9 6.9 7.6 12.2 10.4 8.813.2 18.6 9.2 10.2 16.4 13.9 11.8
BH-11ΣPAH TU = 1
4 of 5 ENVIRON
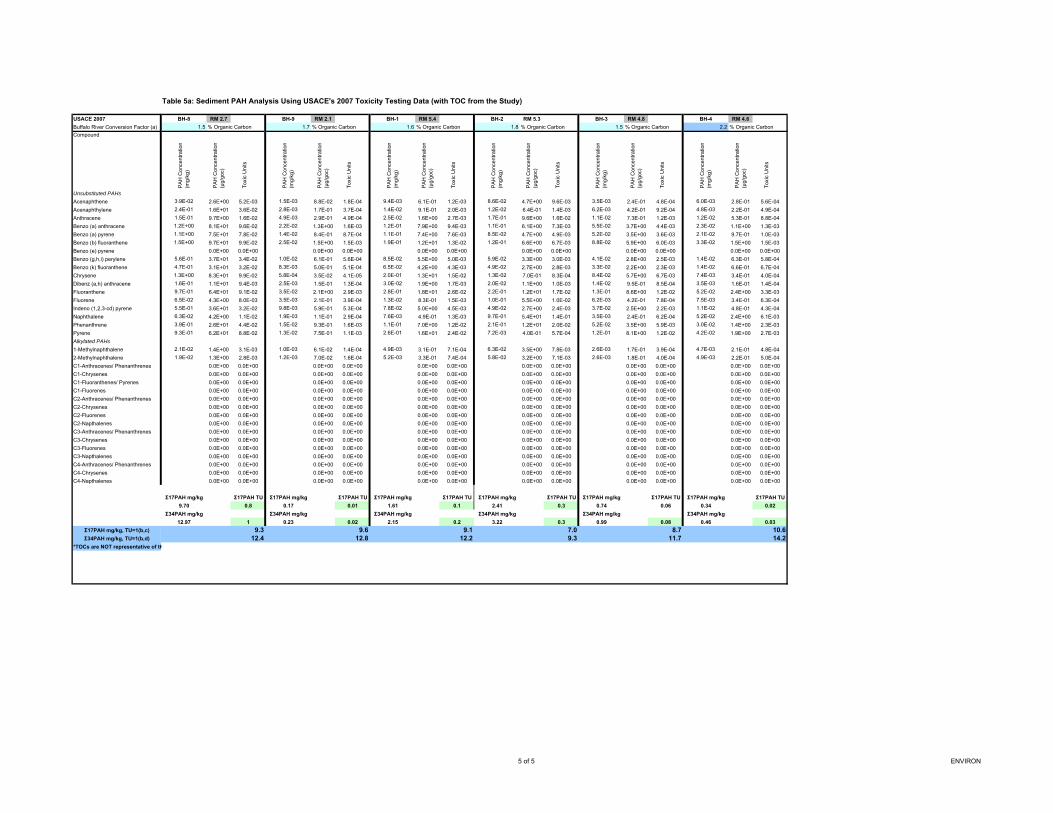
USACE 2007Buffalo River Conversion Factor (a)
Compound
Unsubstituted PAHs
Acenaphthene
Acenaphthylene
Anthracene
Benzo (a) anthracene
Benzo (a) pyrene
Benzo (b) fluoranthene
Benzo (e) pyrene
Benzo (g,h,i) perylene
Benzo (k) fluoranthene
Chrysene
Dibenz (a,h) anthracene
Fluoranthene
Fluorene
Indeno (1,2,3-cd) pyrene
Naphthalene
Phenanthrene
Pyrene
Alkylated PAHs
1-Methylnaphthalene
2-Methylnaphthalene
C1-Anthracenes/ Phenanthrenes
C1-Chrysenes
C1-Fluoranthenes/ Pyrenes
C1-Fluorenes
C2-Anthracenes/ Phenanthrenes
C2-Chrysenes
C2-Fluorenes
C2-Napthalenes
C3-Anthracenes/ Phenanthrenes
C3-Chrysenes
C3-Fluorenes
C3-Napthalenes
C4-Anthracenes/ Phenanthrenes
C4-Chrysenes
C4-Napthalenes
Σ17PAH mg/kg, TU=1(b,c)Σ34PAH mg/kg, TU=1(b,d)
*TOCs are NOT representative of th
Table 5a: Sediment PAH Analysis Using USACE's 2007 Toxicity Testing Data (with TOC from the Study)
BH-8 RM 2.7 BH-9 RM 2.1 BH-1 RM 5.4 BH-2 RM 5.3 BH-3 RM 4.8 BH-4 RM 4.61.5 % Organic Carbon 1.7 % Organic Carbon 1.6 % Organic Carbon 1.8 % Organic Carbon 1.5 % Organic Carbon 2.2 % Organic Carbon
PA
H C
once
ntra
tion
(mg/
kg)
PA
H C
once
ntra
tion
(µg/
goc)
Tox
ic U
nits
PA
H C
once
ntra
tion
(mg/
kg)
PA
H C
once
ntra
tion
(µg/
goc)
Tox
ic U
nits
PA
H C
once
ntra
tion
(mg/
kg)
PA
H C
once
ntra
tion
(µg/
goc)
Tox
ic U
nits
PA
H C
once
ntra
tion
(mg/
kg)
PA
H C
once
ntra
tion
(µg/
goc)
Tox
ic U
nits
PA
H C
once
ntra
tion
(mg/
kg)
PA
H C
once
ntra
tion
(µg/
goc)
Tox
ic U
nits
PA
H C
once
ntra
tion
(mg/
kg)
PA
H C
once
ntra
tion
(µg/
goc)
Tox
ic U
nits
3.9E-02 2.6E+00 5.2E-03 1.5E-03 8.8E-02 1.8E-04 9.4E-03 6.1E-01 1.2E-03 8.6E-02 4.7E+00 9.6E-03 3.5E-03 2.4E-01 4.8E-04 6.0E-03 2.8E-01 5.6E-04
2.4E-01 1.6E+01 3.6E-02 2.8E-03 1.7E-01 3.7E-04 1.4E-02 9.1E-01 2.0E-03 1.2E-02 6.4E-01 1.4E-03 6.2E-03 4.2E-01 9.2E-04 4.8E-03 2.2E-01 4.9E-04
1.5E-01 9.7E+00 1.6E-02 4.9E-03 2.9E-01 4.9E-04 2.5E-02 1.6E+00 2.7E-03 1.7E-01 9.6E+00 1.6E-02 1.1E-02 7.3E-01 1.2E-03 1.2E-02 5.3E-01 8.8E-04
1.2E+00 8.1E+01 9.6E-02 2.2E-02 1.3E+00 1.6E-03 1.2E-01 7.9E+00 9.4E-03 1.1E-01 6.1E+00 7.3E-03 5.5E-02 3.7E+00 4.4E-03 2.3E-02 1.1E+00 1.3E-03
1.1E+00 7.5E+01 7.8E-02 1.4E-02 8.4E-01 8.7E-04 1.1E-01 7.4E+00 7.6E-03 8.5E-02 4.7E+00 4.9E-03 5.2E-02 3.5E+00 3.6E-03 2.1E-02 9.7E-01 1.0E-03
1.5E+00 9.7E+01 9.9E-02 2.5E-02 1.5E+00 1.5E-03 1.9E-01 1.2E+01 1.3E-02 1.2E-01 6.6E+00 6.7E-03 8.8E-02 5.9E+00 6.0E-03 3.3E-02 1.5E+00 1.5E-03
0.0E+00 0.0E+00 0.0E+00 0.0E+00 0.0E+00 0.0E+00 0.0E+00 0.0E+00 0.0E+00 0.0E+00 0.0E+00 0.0E+00
5.6E-01 3.7E+01 3.4E-02 1.0E-02 6.1E-01 5.6E-04 8.5E-02 5.5E+00 5.0E-03 5.9E-02 3.3E+00 3.0E-03 4.1E-02 2.8E+00 2.5E-03 1.4E-02 6.3E-01 5.8E-04
4.7E-01 3.1E+01 3.2E-02 8.3E-03 5.0E-01 5.1E-04 6.5E-02 4.2E+00 4.3E-03 4.9E-02 2.7E+00 2.8E-03 3.3E-02 2.2E+00 2.3E-03 1.4E-02 6.6E-01 6.7E-04
1.3E+00 8.3E+01 9.9E-02 5.8E-04 3.5E-02 4.1E-05 2.0E-01 1.3E+01 1.5E-02 1.3E-02 7.0E-01 8.3E-04 8.4E-02 5.7E+00 6.7E-03 7.4E-03 3.4E-01 4.0E-04
1.6E-01 1.1E+01 9.4E-03 2.5E-03 1.5E-01 1.3E-04 3.0E-02 1.9E+00 1.7E-03 2.0E-02 1.1E+00 1.0E-03 1.4E-02 9.5E-01 8.5E-04 3.5E-03 1.6E-01 1.4E-04
9.7E-01 6.4E+01 9.1E-02 3.5E-02 2.1E+00 2.9E-03 2.8E-01 1.8E+01 2.6E-02 2.2E-01 1.2E+01 1.7E-02 1.3E-01 8.6E+00 1.2E-02 5.2E-02 2.4E+00 3.3E-03
6.5E-02 4.3E+00 8.0E-03 3.5E-03 2.1E-01 3.9E-04 1.3E-02 8.3E-01 1.5E-03 1.0E-01 5.5E+00 1.0E-02 6.2E-03 4.2E-01 7.8E-04 7.5E-03 3.4E-01 6.3E-04
5.5E-01 3.6E+01 3.2E-02 9.8E-03 5.9E-01 5.3E-04 7.8E-02 5.0E+00 4.5E-03 4.9E-02 2.7E+00 2.4E-03 3.7E-02 2.5E+00 2.2E-03 1.1E-02 4.8E-01 4.3E-04
6.3E-02 4.2E+00 1.1E-02 1.9E-03 1.1E-01 2.9E-04 7.6E-03 4.9E-01 1.3E-03 9.7E-01 5.4E+01 1.4E-01 3.5E-03 2.4E-01 6.2E-04 5.2E-02 2.4E+00 6.1E-03
3.9E-01 2.6E+01 4.4E-02 1.5E-02 9.3E-01 1.6E-03 1.1E-01 7.0E+00 1.2E-02 2.1E-01 1.2E+01 2.0E-02 5.2E-02 3.5E+00 5.9E-03 3.0E-02 1.4E+00 2.3E-03
9.3E-01 6.2E+01 8.8E-02 1.3E-02 7.5E-01 1.1E-03 2.6E-01 1.6E+01 2.4E-02 7.2E-03 4.0E-01 5.7E-04 1.2E-01 8.1E+00 1.2E-02 4.2E-02 1.9E+00 2.7E-03
2.1E-02 1.4E+00 3.1E-03 1.0E-03 6.1E-02 1.4E-04 4.9E-03 3.1E-01 7.1E-04 6.3E-02 3.5E+00 7.8E-03 2.6E-03 1.7E-01 3.9E-04 4.7E-03 2.1E-01 4.8E-04
1.9E-02 1.3E+00 2.8E-03 1.2E-03 7.0E-02 1.6E-04 5.2E-03 3.3E-01 7.4E-04 5.8E-02 3.2E+00 7.1E-03 2.6E-03 1.8E-01 4.0E-04 4.9E-03 2.2E-01 5.0E-04
0.0E+00 0.0E+00 0.0E+00 0.0E+00 0.0E+00 0.0E+00 0.0E+00 0.0E+00 0.0E+00 0.0E+00 0.0E+00 0.0E+00
0.0E+00 0.0E+00 0.0E+00 0.0E+00 0.0E+00 0.0E+00 0.0E+00 0.0E+00 0.0E+00 0.0E+00 0.0E+00 0.0E+00
0.0E+00 0.0E+00 0.0E+00 0.0E+00 0.0E+00 0.0E+00 0.0E+00 0.0E+00 0.0E+00 0.0E+00 0.0E+00 0.0E+00
0.0E+00 0.0E+00 0.0E+00 0.0E+00 0.0E+00 0.0E+00 0.0E+00 0.0E+00 0.0E+00 0.0E+00 0.0E+00 0.0E+00
0.0E+00 0.0E+00 0.0E+00 0.0E+00 0.0E+00 0.0E+00 0.0E+00 0.0E+00 0.0E+00 0.0E+00 0.0E+00 0.0E+00
0.0E+00 0.0E+00 0.0E+00 0.0E+00 0.0E+00 0.0E+00 0.0E+00 0.0E+00 0.0E+00 0.0E+00 0.0E+00 0.0E+00
0.0E+00 0.0E+00 0.0E+00 0.0E+00 0.0E+00 0.0E+00 0.0E+00 0.0E+00 0.0E+00 0.0E+00 0.0E+00 0.0E+00
0.0E+00 0.0E+00 0.0E+00 0.0E+00 0.0E+00 0.0E+00 0.0E+00 0.0E+00 0.0E+00 0.0E+00 0.0E+00 0.0E+00
0.0E+00 0.0E+00 0.0E+00 0.0E+00 0.0E+00 0.0E+00 0.0E+00 0.0E+00 0.0E+00 0.0E+00 0.0E+00 0.0E+00
0.0E+00 0.0E+00 0.0E+00 0.0E+00 0.0E+00 0.0E+00 0.0E+00 0.0E+00 0.0E+00 0.0E+00 0.0E+00 0.0E+00
0.0E+00 0.0E+00 0.0E+00 0.0E+00 0.0E+00 0.0E+00 0.0E+00 0.0E+00 0.0E+00 0.0E+00 0.0E+00 0.0E+00
0.0E+00 0.0E+00 0.0E+00 0.0E+00 0.0E+00 0.0E+00 0.0E+00 0.0E+00 0.0E+00 0.0E+00 0.0E+00 0.0E+00
0.0E+00 0.0E+00 0.0E+00 0.0E+00 0.0E+00 0.0E+00 0.0E+00 0.0E+00 0.0E+00 0.0E+00 0.0E+00 0.0E+00
0.0E+00 0.0E+00 0.0E+00 0.0E+00 0.0E+00 0.0E+00 0.0E+00 0.0E+00 0.0E+00 0.0E+00 0.0E+00 0.0E+00
0.0E+00 0.0E+00 0.0E+00 0.0E+00 0.0E+00 0.0E+00 0.0E+00 0.0E+00 0.0E+00 0.0E+00 0.0E+00 0.0E+00
Σ17PAH mg/kg Σ17PAH TU Σ17PAH mg/kg Σ17PAH TU Σ17PAH mg/kg Σ17PAH TU Σ17PAH mg/kg Σ17PAH TU Σ17PAH mg/kg Σ17PAH TU Σ17PAH mg/kg Σ17PAH TU9.70 0.8 0.17 0.01 1.61 0.1 2.41 0.3 0.74 0.06 0.34 0.02
Σ34PAH mg/kg Σ34PAH mg/kg Σ34PAH mg/kg Σ34PAH mg/kg Σ34PAH mg/kg Σ34PAH mg/kg12.97 1 0.23 0.02 2.15 0.2 3.22 0.3 0.99 0.08 0.46 0.03
9.3 9.6 9.1 7.0 8.7 10.612.4 12.8 12.2 9.3 11.7 14.2
5 of 5 ENVIRON
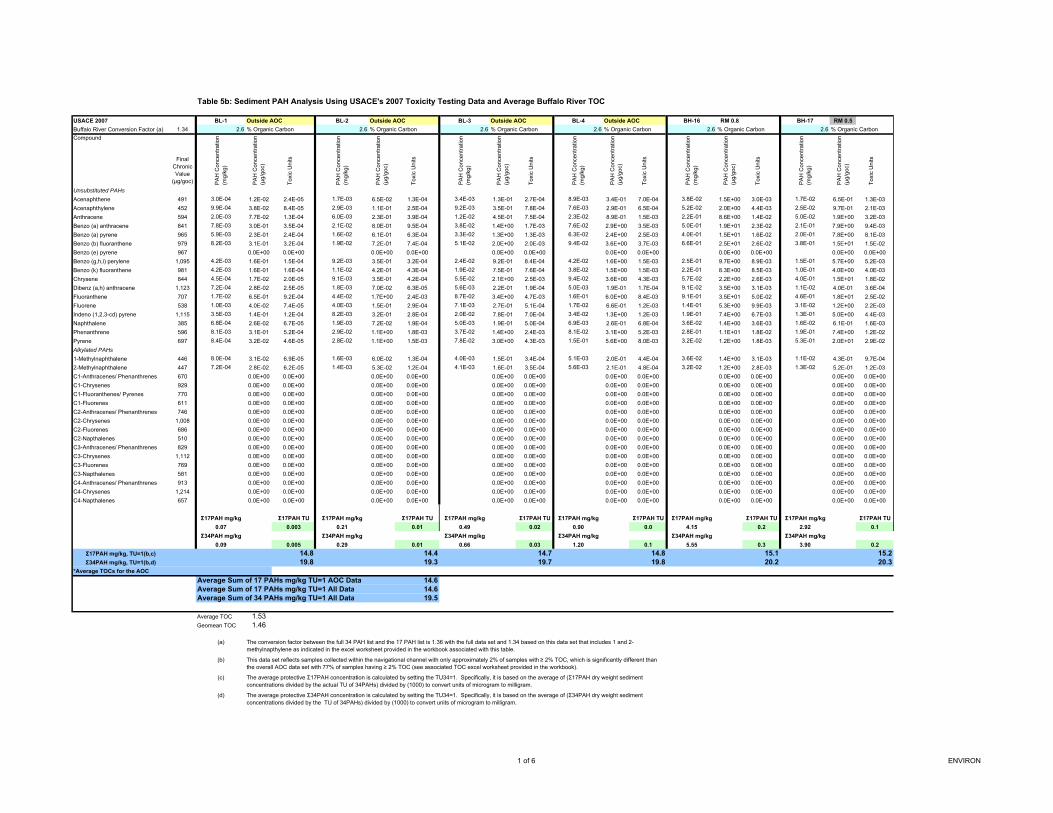
Table 5b: Sediment PAH Analysis Using USACE's 2007 Toxicity Testing Data and Average Buffalo River TOC
USACE 2007 BL-1 Outside AOC BL-2 Outside AOC BL-3 Outside AOC BL-4 Outside AOC BH-16 RM 0.8 BH-17 RM 0.5Buffalo River Conversion Factor (a) 1.34 2.6 % Organic Carbon 2.6 % Organic Carbon 2.6 % Organic Carbon 2.6 % Organic Carbon 2.6 % Organic Carbon 2.6 % Organic Carbon
Compound
Final Chronic Value
(µg/goc) PA
H C
once
ntra
tion
(mg/
kg)
PA
H C
once
ntra
tion
(µg/
goc)
Tox
ic U
nits
PA
H C
once
ntra
tion
(mg/
kg)
PA
H C
once
ntra
tion
(µg/
goc)
Tox
ic U
nits
PA
H C
once
ntra
tion
(mg/
kg)
PA
H C
once
ntra
tion
(µg/
goc)
Tox
ic U
nits
PA
H C
once
ntra
tion
(mg/
kg)
PA
H C
once
ntra
tion
(µg/
goc)
Tox
ic U
nits
PA
H C
once
ntra
tion
(mg/
kg)
PA
H C
once
ntra
tion
(µg/
goc)
Tox
ic U
nits
PA
H C
once
ntra
tion
(mg/
kg)
PA
H C
once
ntra
tion
(µg/
goc)
Tox
ic U
nits
Unsubstituted PAHs
Acenaphthene 491 3.0E-04 1.2E-02 2.4E-05 1.7E-03 6.5E-02 1.3E-04 3.4E-03 1.3E-01 2.7E-04 8.9E-03 3.4E-01 7.0E-04 3.8E-02 1.5E+00 3.0E-03 1.7E-02 6.5E-01 1.3E-03
Acenaphthylene 452 9.9E-04 3.8E-02 8.4E-05 2.9E-03 1.1E-01 2.5E-04 9.2E-03 3.5E-01 7.8E-04 7.6E-03 2.9E-01 6.5E-04 5.2E-02 2.0E+00 4.4E-03 2.5E-02 9.7E-01 2.1E-03
Anthracene 594 2.0E-03 7.7E-02 1.3E-04 6.0E-03 2.3E-01 3.9E-04 1.2E-02 4.5E-01 7.5E-04 2.3E-02 8.9E-01 1.5E-03 2.2E-01 8.6E+00 1.4E-02 5.0E-02 1.9E+00 3.2E-03
Benzo (a) anthracene 841 7.8E-03 3.0E-01 3.5E-04 2.1E-02 8.0E-01 9.5E-04 3.8E-02 1.4E+00 1.7E-03 7.6E-02 2.9E+00 3.5E-03 5.0E-01 1.9E+01 2.3E-02 2.1E-01 7.9E+00 9.4E-03
Benzo (a) pyrene 965 5.9E-03 2.3E-01 2.4E-04 1.6E-02 6.1E-01 6.3E-04 3.3E-02 1.3E+00 1.3E-03 6.3E-02 2.4E+00 2.5E-03 4.0E-01 1.5E+01 1.6E-02 2.0E-01 7.8E+00 8.1E-03
Benzo (b) fluoranthene 979 8.2E-03 3.1E-01 3.2E-04 1.9E-02 7.2E-01 7.4E-04 5.1E-02 2.0E+00 2.0E-03 9.4E-02 3.6E+00 3.7E-03 6.6E-01 2.5E+01 2.6E-02 3.8E-01 1.5E+01 1.5E-02
Benzo (e) pyrene 967 0.0E+00 0.0E+00 0.0E+00 0.0E+00 0.0E+00 0.0E+00 0.0E+00 0.0E+00 0.0E+00 0.0E+00 0.0E+00 0.0E+00
Benzo (g,h,i) perylene 1,095 4.2E-03 1.6E-01 1.5E-04 9.2E-03 3.5E-01 3.2E-04 2.4E-02 9.2E-01 8.4E-04 4.2E-02 1.6E+00 1.5E-03 2.5E-01 9.7E+00 8.9E-03 1.5E-01 5.7E+00 5.2E-03
Benzo (k) fluoranthene 981 4.2E-03 1.6E-01 1.6E-04 1.1E-02 4.2E-01 4.3E-04 1.9E-02 7.5E-01 7.6E-04 3.8E-02 1.5E+00 1.5E-03 2.2E-01 8.3E+00 8.5E-03 1.0E-01 4.0E+00 4.0E-03
Chrysene 844 4.5E-04 1.7E-02 2.0E-05 9.1E-03 3.5E-01 4.2E-04 5.5E-02 2.1E+00 2.5E-03 9.4E-02 3.6E+00 4.3E-03 5.7E-02 2.2E+00 2.6E-03 4.0E-01 1.5E+01 1.8E-02
Dibenz (a,h) anthracene 1,123 7.2E-04 2.8E-02 2.5E-05 1.8E-03 7.0E-02 6.3E-05 5.6E-03 2.2E-01 1.9E-04 5.0E-03 1.9E-01 1.7E-04 9.1E-02 3.5E+00 3.1E-03 1.1E-02 4.0E-01 3.6E-04
Fluoranthene 707 1.7E-02 6.5E-01 9.2E-04 4.4E-02 1.7E+00 2.4E-03 8.7E-02 3.4E+00 4.7E-03 1.6E-01 6.0E+00 8.4E-03 9.1E-01 3.5E+01 5.0E-02 4.6E-01 1.8E+01 2.5E-02
Fluorene 538 1.0E-03 4.0E-02 7.4E-05 4.0E-03 1.5E-01 2.9E-04 7.1E-03 2.7E-01 5.1E-04 1.7E-02 6.6E-01 1.2E-03 1.4E-01 5.3E+00 9.9E-03 3.1E-02 1.2E+00 2.2E-03
Indeno (1,2,3-cd) pyrene 1,115 3.5E-03 1.4E-01 1.2E-04 8.2E-03 3.2E-01 2.8E-04 2.0E-02 7.8E-01 7.0E-04 3.4E-02 1.3E+00 1.2E-03 1.9E-01 7.4E+00 6.7E-03 1.3E-01 5.0E+00 4.4E-03
Naphthalene 385 6.8E-04 2.6E-02 6.7E-05 1.9E-03 7.2E-02 1.9E-04 5.0E-03 1.9E-01 5.0E-04 6.9E-03 2.6E-01 6.8E-04 3.6E-02 1.4E+00 3.6E-03 1.6E-02 6.1E-01 1.6E-03
Phenanthrene 596 8.1E-03 3.1E-01 5.2E-04 2.9E-02 1.1E+00 1.8E-03 3.7E-02 1.4E+00 2.4E-03 8.1E-02 3.1E+00 5.2E-03 2.8E-01 1.1E+01 1.8E-02 1.9E-01 7.4E+00 1.2E-02
Pyrene 697 8.4E-04 3.2E-02 4.6E-05 2.8E-02 1.1E+00 1.5E-03 7.8E-02 3.0E+00 4.3E-03 1.5E-01 5.6E+00 8.0E-03 3.2E-02 1.2E+00 1.8E-03 5.3E-01 2.0E+01 2.9E-02
Alkylated PAHs
1-Methylnaphthalene 446 8.0E-04 3.1E-02 6.9E-05 1.6E-03 6.0E-02 1.3E-04 4.0E-03 1.5E-01 3.4E-04 5.1E-03 2.0E-01 4.4E-04 3.6E-02 1.4E+00 3.1E-03 1.1E-02 4.3E-01 9.7E-04
2-Methylnaphthalene 447 7.2E-04 2.8E-02 6.2E-05 1.4E-03 5.3E-02 1.2E-04 4.1E-03 1.6E-01 3.5E-04 5.6E-03 2.1E-01 4.8E-04 3.2E-02 1.2E+00 2.8E-03 1.3E-02 5.2E-01 1.2E-03
C1-Anthracenes/ Phenanthrenes 670 0.0E+00 0.0E+00 0.0E+00 0.0E+00 0.0E+00 0.0E+00 0.0E+00 0.0E+00 0.0E+00 0.0E+00 0.0E+00 0.0E+00
C1-Chrysenes 929 0.0E+00 0.0E+00 0.0E+00 0.0E+00 0.0E+00 0.0E+00 0.0E+00 0.0E+00 0.0E+00 0.0E+00 0.0E+00 0.0E+00
C1-Fluoranthenes/ Pyrenes 770 0.0E+00 0.0E+00 0.0E+00 0.0E+00 0.0E+00 0.0E+00 0.0E+00 0.0E+00 0.0E+00 0.0E+00 0.0E+00 0.0E+00
C1-Fluorenes 611 0.0E+00 0.0E+00 0.0E+00 0.0E+00 0.0E+00 0.0E+00 0.0E+00 0.0E+00 0.0E+00 0.0E+00 0.0E+00 0.0E+00
C2-Anthracenes/ Phenanthrenes 746 0.0E+00 0.0E+00 0.0E+00 0.0E+00 0.0E+00 0.0E+00 0.0E+00 0.0E+00 0.0E+00 0.0E+00 0.0E+00 0.0E+00
C2-Chrysenes 1,008 0.0E+00 0.0E+00 0.0E+00 0.0E+00 0.0E+00 0.0E+00 0.0E+00 0.0E+00 0.0E+00 0.0E+00 0.0E+00 0.0E+00
C2-Fluorenes 686 0.0E+00 0.0E+00 0.0E+00 0.0E+00 0.0E+00 0.0E+00 0.0E+00 0.0E+00 0.0E+00 0.0E+00 0.0E+00 0.0E+00
C2-Napthalenes 510 0.0E+00 0.0E+00 0.0E+00 0.0E+00 0.0E+00 0.0E+00 0.0E+00 0.0E+00 0.0E+00 0.0E+00 0.0E+00 0.0E+00
C3-Anthracenes/ Phenanthrenes 829 0.0E+00 0.0E+00 0.0E+00 0.0E+00 0.0E+00 0.0E+00 0.0E+00 0.0E+00 0.0E+00 0.0E+00 0.0E+00 0.0E+00
C3-Chrysenes 1,112 0.0E+00 0.0E+00 0.0E+00 0.0E+00 0.0E+00 0.0E+00 0.0E+00 0.0E+00 0.0E+00 0.0E+00 0.0E+00 0.0E+00
C3-Fluorenes 769 0.0E+00 0.0E+00 0.0E+00 0.0E+00 0.0E+00 0.0E+00 0.0E+00 0.0E+00 0.0E+00 0.0E+00 0.0E+00 0.0E+00
C3-Napthalenes 581 0.0E+00 0.0E+00 0.0E+00 0.0E+00 0.0E+00 0.0E+00 0.0E+00 0.0E+00 0.0E+00 0.0E+00 0.0E+00 0.0E+00
C4-Anthracenes/ Phenanthrenes 913 0.0E+00 0.0E+00 0.0E+00 0.0E+00 0.0E+00 0.0E+00 0.0E+00 0.0E+00 0.0E+00 0.0E+00 0.0E+00 0.0E+00
C4-Chrysenes 1,214 0.0E+00 0.0E+00 0.0E+00 0.0E+00 0.0E+00 0.0E+00 0.0E+00 0.0E+00 0.0E+00 0.0E+00 0.0E+00 0.0E+00
C4-Napthalenes 657 0.0E+00 0.0E+00 0.0E+00 0.0E+00 0.0E+00 0.0E+00 0.0E+00 0.0E+00 0.0E+00 0.0E+00 0.0E+00 0.0E+00
Σ17PAH mg/kg Σ17PAH TU Σ17PAH mg/kg Σ17PAH TU Σ17PAH mg/kg Σ17PAH TU Σ17PAH mg/kg Σ17PAH TU Σ17PAH mg/kg Σ17PAH TU Σ17PAH mg/kg Σ17PAH TU0.07 0.003 0.21 0.01 0.49 0.02 0.90 0.0 4.15 0.2 2.92 0.1
Σ34PAH mg/kg Σ34PAH mg/kg Σ34PAH mg/kg Σ34PAH mg/kg Σ34PAH mg/kg Σ34PAH mg/kg0.09 0.005 0.29 0.01 0.66 0.03 1.20 0.1 5.55 0.3 3.90 0.2
Σ17PAH mg/kg, TU=1(b,c) 14.8 14.4 14.7 14.8 15.1 15.2Σ34PAH mg/kg, TU=1(b,d) 19.8 19.3 19.7 19.8 20.2 20.3
*Average TOCs for the AOCAverage Sum of 17 PAHs mg/kg TU=1 AOC Data 14.6Average Sum of 17 PAHs mg/kg TU=1 All Data 14.6Average Sum of 34 PAHs mg/kg TU=1 All Data 19.5
Average TOC 1.53Geomean TOC 1.46
(a)
(b)
(c)
(d)
This data set reflects samples collected within the navigational channel with only approximately 2% of samples with ≥ 2% TOC, which is significantly different than the overall AOC data set with 77% of samples having ≥ 2% TOC (see associated TOC excel worksheet provided in the workbook).
The average protective Σ17PAH concentration is calculated by setting the TU34=1. Specifically, it is based on the average of (Σ17PAH dry weight sediment concentrations divided by the actual TU of 34PAHs) divided by (1000) to convert units of microgram to milligram.
The average protective Σ34PAH concentration is calculated by setting the TU34=1. Specifically, it is based on the average of (Σ34PAH dry weight sediment concentrations divided by the TU of 34PAHs) divided by (1000) to convert units of microgram to milligram.
The conversion factor between the full 34 PAH list and the 17 PAH list is 1.36 with the full data set and 1.34 based on this data set that includes 1 and 2-methylnapthylene as indicated in the excel worksheet provided in the workbook associated with this table.
1 of 6 ENVIRON
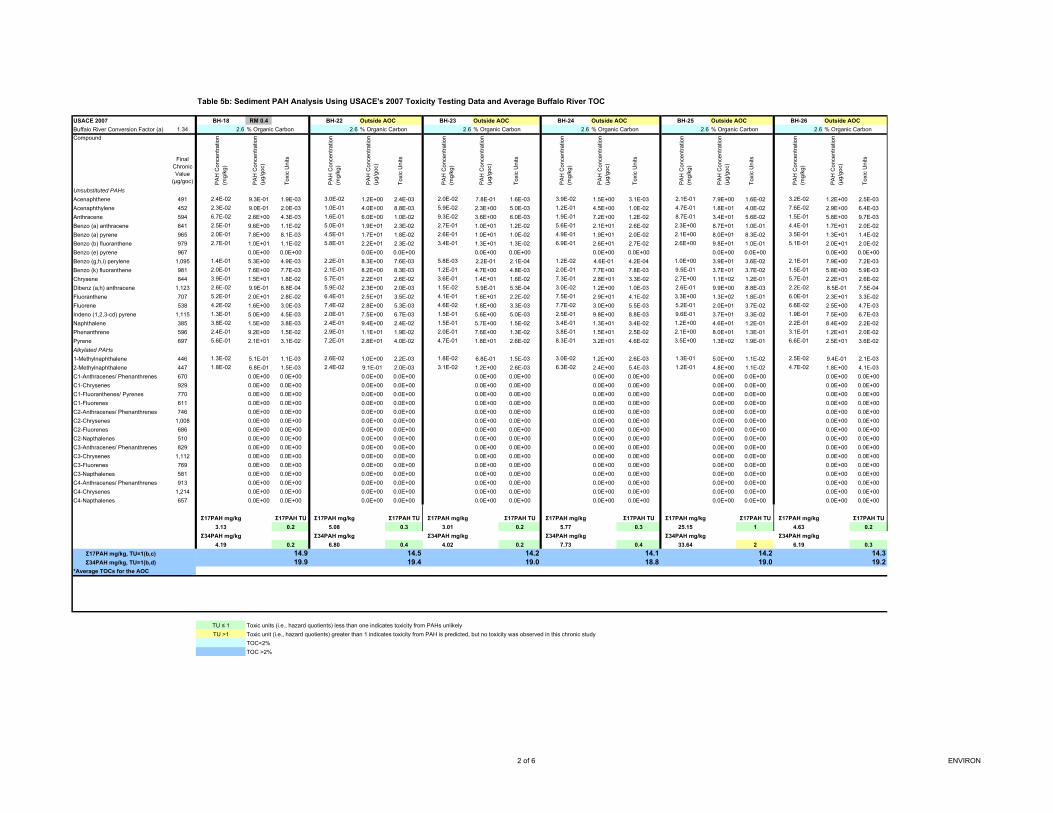
USACE 2007Buffalo River Conversion Factor (a) 1.34
Compound
Final Chronic Value
(µg/goc)
Unsubstituted PAHs
Acenaphthene 491
Acenaphthylene 452
Anthracene 594
Benzo (a) anthracene 841
Benzo (a) pyrene 965
Benzo (b) fluoranthene 979
Benzo (e) pyrene 967
Benzo (g,h,i) perylene 1,095
Benzo (k) fluoranthene 981
Chrysene 844
Dibenz (a,h) anthracene 1,123
Fluoranthene 707
Fluorene 538
Indeno (1,2,3-cd) pyrene 1,115
Naphthalene 385
Phenanthrene 596
Pyrene 697
Alkylated PAHs
1-Methylnaphthalene 446
2-Methylnaphthalene 447
C1-Anthracenes/ Phenanthrenes 670
C1-Chrysenes 929
C1-Fluoranthenes/ Pyrenes 770
C1-Fluorenes 611
C2-Anthracenes/ Phenanthrenes 746
C2-Chrysenes 1,008
C2-Fluorenes 686
C2-Napthalenes 510
C3-Anthracenes/ Phenanthrenes 829
C3-Chrysenes 1,112
C3-Fluorenes 769
C3-Napthalenes 581
C4-Anthracenes/ Phenanthrenes 913
C4-Chrysenes 1,214
C4-Napthalenes 657
Σ17PAH mg/kg, TU=1(b,c)Σ34PAH mg/kg, TU=1(b,d)
*Average TOCs for the AOC
Table 5b: Sediment PAH Analysis Using USACE's 2007 Toxicity Testing Data and Average Buffalo River TOC
BH-18 RM 0.4 BH-22 Outside AOC BH-23 Outside AOC BH-24 Outside AOC BH-25 Outside AOC BH-26 Outside AOC2.6 % Organic Carbon 2.6 % Organic Carbon 2.6 % Organic Carbon 2.6 % Organic Carbon 2.6 % Organic Carbon 2.6 % Organic Carbon
PA
H C
once
ntra
tion
(mg/
kg)
PA
H C
once
ntra
tion
(µg/
goc)
Tox
ic U
nits
PA
H C
once
ntra
tion
(mg/
kg)
PA
H C
once
ntra
tion
(µg/
goc)
Tox
ic U
nits
PA
H C
once
ntra
tion
(mg/
kg)
PA
H C
once
ntra
tion
(µg/
goc)
Tox
ic U
nits
PA
H C
once
ntra
tion
(mg/
kg)
PA
H C
once
ntra
tion
(µg/
goc)
Tox
ic U
nits
PA
H C
once
ntra
tion
(mg/
kg)
PA
H C
once
ntra
tion
(µg/
goc)
Tox
ic U
nits
PA
H C
once
ntra
tion
(mg/
kg)
PA
H C
once
ntra
tion
(µg/
goc)
Tox
ic U
nits
2.4E-02 9.3E-01 1.9E-03 3.0E-02 1.2E+00 2.4E-03 2.0E-02 7.8E-01 1.6E-03 3.9E-02 1.5E+00 3.1E-03 2.1E-01 7.9E+00 1.6E-02 3.2E-02 1.2E+00 2.5E-03
2.3E-02 9.0E-01 2.0E-03 1.0E-01 4.0E+00 8.8E-03 5.9E-02 2.3E+00 5.0E-03 1.2E-01 4.5E+00 1.0E-02 4.7E-01 1.8E+01 4.0E-02 7.6E-02 2.9E+00 6.4E-03
6.7E-02 2.6E+00 4.3E-03 1.6E-01 6.0E+00 1.0E-02 9.3E-02 3.6E+00 6.0E-03 1.9E-01 7.2E+00 1.2E-02 8.7E-01 3.4E+01 5.6E-02 1.5E-01 5.8E+00 9.7E-03
2.5E-01 9.6E+00 1.1E-02 5.0E-01 1.9E+01 2.3E-02 2.7E-01 1.0E+01 1.2E-02 5.6E-01 2.1E+01 2.6E-02 2.3E+00 8.7E+01 1.0E-01 4.4E-01 1.7E+01 2.0E-02
2.0E-01 7.8E+00 8.1E-03 4.5E-01 1.7E+01 1.8E-02 2.6E-01 1.0E+01 1.0E-02 4.9E-01 1.9E+01 2.0E-02 2.1E+00 8.0E+01 8.3E-02 3.5E-01 1.3E+01 1.4E-02
2.7E-01 1.0E+01 1.1E-02 5.8E-01 2.2E+01 2.3E-02 3.4E-01 1.3E+01 1.3E-02 6.9E-01 2.6E+01 2.7E-02 2.6E+00 9.8E+01 1.0E-01 5.1E-01 2.0E+01 2.0E-02
0.0E+00 0.0E+00 0.0E+00 0.0E+00 0.0E+00 0.0E+00 0.0E+00 0.0E+00 0.0E+00 0.0E+00 0.0E+00 0.0E+00
1.4E-01 5.3E+00 4.9E-03 2.2E-01 8.3E+00 7.6E-03 5.8E-03 2.2E-01 2.1E-04 1.2E-02 4.6E-01 4.2E-04 1.0E+00 3.9E+01 3.6E-02 2.1E-01 7.9E+00 7.2E-03
2.0E-01 7.6E+00 7.7E-03 2.1E-01 8.2E+00 8.3E-03 1.2E-01 4.7E+00 4.8E-03 2.0E-01 7.7E+00 7.8E-03 9.5E-01 3.7E+01 3.7E-02 1.5E-01 5.8E+00 5.9E-03
3.9E-01 1.5E+01 1.8E-02 5.7E-01 2.2E+01 2.6E-02 3.6E-01 1.4E+01 1.6E-02 7.3E-01 2.8E+01 3.3E-02 2.7E+00 1.1E+02 1.2E-01 5.7E-01 2.2E+01 2.6E-02
2.6E-02 9.9E-01 8.8E-04 5.9E-02 2.3E+00 2.0E-03 1.5E-02 5.9E-01 5.3E-04 3.0E-02 1.2E+00 1.0E-03 2.6E-01 9.9E+00 8.8E-03 2.2E-02 8.5E-01 7.5E-04
5.2E-01 2.0E+01 2.8E-02 6.4E-01 2.5E+01 3.5E-02 4.1E-01 1.6E+01 2.2E-02 7.5E-01 2.9E+01 4.1E-02 3.3E+00 1.3E+02 1.8E-01 6.0E-01 2.3E+01 3.3E-02
4.2E-02 1.6E+00 3.0E-03 7.4E-02 2.8E+00 5.3E-03 4.6E-02 1.8E+00 3.3E-03 7.7E-02 3.0E+00 5.5E-03 5.2E-01 2.0E+01 3.7E-02 6.6E-02 2.5E+00 4.7E-03
1.3E-01 5.0E+00 4.5E-03 2.0E-01 7.5E+00 6.7E-03 1.5E-01 5.6E+00 5.0E-03 2.5E-01 9.8E+00 8.8E-03 9.6E-01 3.7E+01 3.3E-02 1.9E-01 7.5E+00 6.7E-03
3.8E-02 1.5E+00 3.8E-03 2.4E-01 9.4E+00 2.4E-02 1.5E-01 5.7E+00 1.5E-02 3.4E-01 1.3E+01 3.4E-02 1.2E+00 4.6E+01 1.2E-01 2.2E-01 8.4E+00 2.2E-02
2.4E-01 9.2E+00 1.5E-02 2.9E-01 1.1E+01 1.9E-02 2.0E-01 7.6E+00 1.3E-02 3.8E-01 1.5E+01 2.5E-02 2.1E+00 8.0E+01 1.3E-01 3.1E-01 1.2E+01 2.0E-02
5.6E-01 2.1E+01 3.1E-02 7.2E-01 2.8E+01 4.0E-02 4.7E-01 1.8E+01 2.6E-02 8.3E-01 3.2E+01 4.6E-02 3.5E+00 1.3E+02 1.9E-01 6.6E-01 2.5E+01 3.6E-02
1.3E-02 5.1E-01 1.1E-03 2.6E-02 1.0E+00 2.2E-03 1.8E-02 6.8E-01 1.5E-03 3.0E-02 1.2E+00 2.6E-03 1.3E-01 5.0E+00 1.1E-02 2.5E-02 9.4E-01 2.1E-03
1.8E-02 6.8E-01 1.5E-03 2.4E-02 9.1E-01 2.0E-03 3.1E-02 1.2E+00 2.6E-03 6.3E-02 2.4E+00 5.4E-03 1.2E-01 4.8E+00 1.1E-02 4.7E-02 1.8E+00 4.1E-03
0.0E+00 0.0E+00 0.0E+00 0.0E+00 0.0E+00 0.0E+00 0.0E+00 0.0E+00 0.0E+00 0.0E+00 0.0E+00 0.0E+00
0.0E+00 0.0E+00 0.0E+00 0.0E+00 0.0E+00 0.0E+00 0.0E+00 0.0E+00 0.0E+00 0.0E+00 0.0E+00 0.0E+00
0.0E+00 0.0E+00 0.0E+00 0.0E+00 0.0E+00 0.0E+00 0.0E+00 0.0E+00 0.0E+00 0.0E+00 0.0E+00 0.0E+00
0.0E+00 0.0E+00 0.0E+00 0.0E+00 0.0E+00 0.0E+00 0.0E+00 0.0E+00 0.0E+00 0.0E+00 0.0E+00 0.0E+00
0.0E+00 0.0E+00 0.0E+00 0.0E+00 0.0E+00 0.0E+00 0.0E+00 0.0E+00 0.0E+00 0.0E+00 0.0E+00 0.0E+00
0.0E+00 0.0E+00 0.0E+00 0.0E+00 0.0E+00 0.0E+00 0.0E+00 0.0E+00 0.0E+00 0.0E+00 0.0E+00 0.0E+00
0.0E+00 0.0E+00 0.0E+00 0.0E+00 0.0E+00 0.0E+00 0.0E+00 0.0E+00 0.0E+00 0.0E+00 0.0E+00 0.0E+00
0.0E+00 0.0E+00 0.0E+00 0.0E+00 0.0E+00 0.0E+00 0.0E+00 0.0E+00 0.0E+00 0.0E+00 0.0E+00 0.0E+00
0.0E+00 0.0E+00 0.0E+00 0.0E+00 0.0E+00 0.0E+00 0.0E+00 0.0E+00 0.0E+00 0.0E+00 0.0E+00 0.0E+00
0.0E+00 0.0E+00 0.0E+00 0.0E+00 0.0E+00 0.0E+00 0.0E+00 0.0E+00 0.0E+00 0.0E+00 0.0E+00 0.0E+00
0.0E+00 0.0E+00 0.0E+00 0.0E+00 0.0E+00 0.0E+00 0.0E+00 0.0E+00 0.0E+00 0.0E+00 0.0E+00 0.0E+00
0.0E+00 0.0E+00 0.0E+00 0.0E+00 0.0E+00 0.0E+00 0.0E+00 0.0E+00 0.0E+00 0.0E+00 0.0E+00 0.0E+00
0.0E+00 0.0E+00 0.0E+00 0.0E+00 0.0E+00 0.0E+00 0.0E+00 0.0E+00 0.0E+00 0.0E+00 0.0E+00 0.0E+00
0.0E+00 0.0E+00 0.0E+00 0.0E+00 0.0E+00 0.0E+00 0.0E+00 0.0E+00 0.0E+00 0.0E+00 0.0E+00 0.0E+00
0.0E+00 0.0E+00 0.0E+00 0.0E+00 0.0E+00 0.0E+00 0.0E+00 0.0E+00 0.0E+00 0.0E+00 0.0E+00 0.0E+00
Σ17PAH mg/kg Σ17PAH TU Σ17PAH mg/kg Σ17PAH TU Σ17PAH mg/kg Σ17PAH TU Σ17PAH mg/kg Σ17PAH TU Σ17PAH mg/kg Σ17PAH TU Σ17PAH mg/kg Σ17PAH TU3.13 0.2 5.08 0.3 3.01 0.2 5.77 0.3 25.15 1 4.63 0.2
Σ34PAH mg/kg Σ34PAH mg/kg Σ34PAH mg/kg Σ34PAH mg/kg Σ34PAH mg/kg Σ34PAH mg/kg4.19 0.2 6.80 0.4 4.02 0.2 7.73 0.4 33.64 2 6.19 0.3
14.9 14.5 14.2 14.1 14.2 14.319.9 19.4 19.0 18.8 19.0 19.2
TU ≤ 1 Toxic units (i.e., hazard quotients) less than one indicates toxicity from PAHs unlikely
TU >1 Toxic unit (i.e., hazard quotients) greater than 1 indicates toxicity from PAH is predicted, but no toxicity was observed in this chronic study
TOC<2%
TOC >2%
2 of 6 ENVIRON
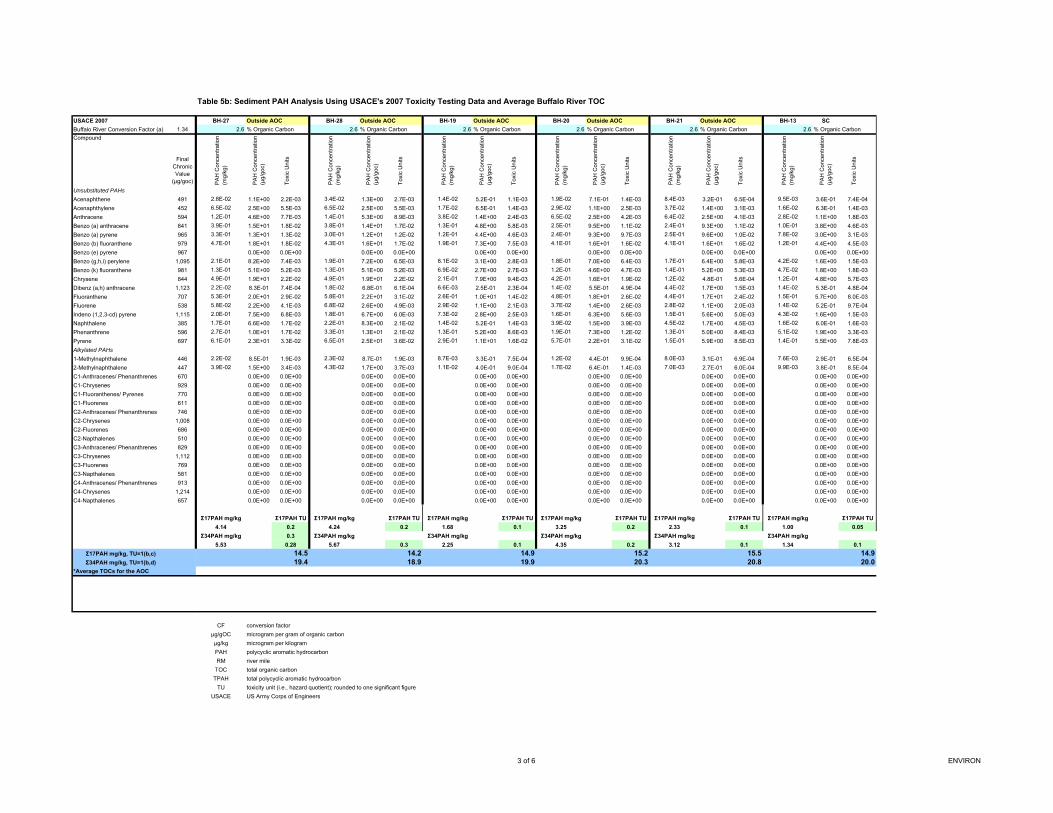
USACE 2007Buffalo River Conversion Factor (a) 1.34
Compound
Final Chronic Value
(µg/goc)
Unsubstituted PAHs
Acenaphthene 491
Acenaphthylene 452
Anthracene 594
Benzo (a) anthracene 841
Benzo (a) pyrene 965
Benzo (b) fluoranthene 979
Benzo (e) pyrene 967
Benzo (g,h,i) perylene 1,095
Benzo (k) fluoranthene 981
Chrysene 844
Dibenz (a,h) anthracene 1,123
Fluoranthene 707
Fluorene 538
Indeno (1,2,3-cd) pyrene 1,115
Naphthalene 385
Phenanthrene 596
Pyrene 697
Alkylated PAHs
1-Methylnaphthalene 446
2-Methylnaphthalene 447
C1-Anthracenes/ Phenanthrenes 670
C1-Chrysenes 929
C1-Fluoranthenes/ Pyrenes 770
C1-Fluorenes 611
C2-Anthracenes/ Phenanthrenes 746
C2-Chrysenes 1,008
C2-Fluorenes 686
C2-Napthalenes 510
C3-Anthracenes/ Phenanthrenes 829
C3-Chrysenes 1,112
C3-Fluorenes 769
C3-Napthalenes 581
C4-Anthracenes/ Phenanthrenes 913
C4-Chrysenes 1,214
C4-Napthalenes 657
Σ17PAH mg/kg, TU=1(b,c)Σ34PAH mg/kg, TU=1(b,d)
*Average TOCs for the AOC
Table 5b: Sediment PAH Analysis Using USACE's 2007 Toxicity Testing Data and Average Buffalo River TOC
BH-27 Outside AOC BH-28 Outside AOC BH-19 Outside AOC BH-20 Outside AOC BH-21 Outside AOC BH-13 SC2.6 % Organic Carbon 2.6 % Organic Carbon 2.6 % Organic Carbon 2.6 % Organic Carbon 2.6 % Organic Carbon 2.6 % Organic Carbon
PA
H C
once
ntra
tion
(mg/
kg)
PA
H C
once
ntra
tion
(µg/
goc)
Tox
ic U
nits
PA
H C
once
ntra
tion
(mg/
kg)
PA
H C
once
ntra
tion
(µg/
goc)
Tox
ic U
nits
PA
H C
once
ntra
tion
(mg/
kg)
PA
H C
once
ntra
tion
(µg/
goc)
Tox
ic U
nits
PA
H C
once
ntra
tion
(mg/
kg)
PA
H C
once
ntra
tion
(µg/
goc)
Tox
ic U
nits
PA
H C
once
ntra
tion
(mg/
kg)
PA
H C
once
ntra
tion
(µg/
goc)
Tox
ic U
nits
PA
H C
once
ntra
tion
(mg/
kg)
PA
H C
once
ntra
tion
(µg/
goc)
Tox
ic U
nits
2.8E-02 1.1E+00 2.2E-03 3.4E-02 1.3E+00 2.7E-03 1.4E-02 5.2E-01 1.1E-03 1.9E-02 7.1E-01 1.4E-03 8.4E-03 3.2E-01 6.5E-04 9.5E-03 3.6E-01 7.4E-04
6.5E-02 2.5E+00 5.5E-03 6.5E-02 2.5E+00 5.5E-03 1.7E-02 6.5E-01 1.4E-03 2.9E-02 1.1E+00 2.5E-03 3.7E-02 1.4E+00 3.1E-03 1.6E-02 6.3E-01 1.4E-03
1.2E-01 4.6E+00 7.7E-03 1.4E-01 5.3E+00 8.9E-03 3.8E-02 1.4E+00 2.4E-03 6.5E-02 2.5E+00 4.2E-03 6.4E-02 2.5E+00 4.1E-03 2.8E-02 1.1E+00 1.8E-03
3.9E-01 1.5E+01 1.8E-02 3.8E-01 1.4E+01 1.7E-02 1.3E-01 4.8E+00 5.8E-03 2.5E-01 9.5E+00 1.1E-02 2.4E-01 9.3E+00 1.1E-02 1.0E-01 3.8E+00 4.6E-03
3.3E-01 1.3E+01 1.3E-02 3.0E-01 1.2E+01 1.2E-02 1.2E-01 4.4E+00 4.6E-03 2.4E-01 9.3E+00 9.7E-03 2.5E-01 9.6E+00 1.0E-02 7.8E-02 3.0E+00 3.1E-03
4.7E-01 1.8E+01 1.8E-02 4.3E-01 1.6E+01 1.7E-02 1.9E-01 7.3E+00 7.5E-03 4.1E-01 1.6E+01 1.6E-02 4.1E-01 1.6E+01 1.6E-02 1.2E-01 4.4E+00 4.5E-03
0.0E+00 0.0E+00 0.0E+00 0.0E+00 0.0E+00 0.0E+00 0.0E+00 0.0E+00 0.0E+00 0.0E+00 0.0E+00 0.0E+00
2.1E-01 8.2E+00 7.4E-03 1.9E-01 7.2E+00 6.5E-03 8.1E-02 3.1E+00 2.8E-03 1.8E-01 7.0E+00 6.4E-03 1.7E-01 6.4E+00 5.8E-03 4.2E-02 1.6E+00 1.5E-03
1.3E-01 5.1E+00 5.2E-03 1.3E-01 5.1E+00 5.2E-03 6.9E-02 2.7E+00 2.7E-03 1.2E-01 4.6E+00 4.7E-03 1.4E-01 5.2E+00 5.3E-03 4.7E-02 1.8E+00 1.8E-03
4.9E-01 1.9E+01 2.2E-02 4.9E-01 1.9E+01 2.2E-02 2.1E-01 7.9E+00 9.4E-03 4.2E-01 1.6E+01 1.9E-02 1.2E-02 4.8E-01 5.6E-04 1.2E-01 4.8E+00 5.7E-03
2.2E-02 8.3E-01 7.4E-04 1.8E-02 6.8E-01 6.1E-04 6.6E-03 2.5E-01 2.3E-04 1.4E-02 5.5E-01 4.9E-04 4.4E-02 1.7E+00 1.5E-03 1.4E-02 5.3E-01 4.8E-04
5.3E-01 2.0E+01 2.9E-02 5.8E-01 2.2E+01 3.1E-02 2.6E-01 1.0E+01 1.4E-02 4.8E-01 1.8E+01 2.6E-02 4.4E-01 1.7E+01 2.4E-02 1.5E-01 5.7E+00 8.0E-03
5.8E-02 2.2E+00 4.1E-03 6.8E-02 2.6E+00 4.9E-03 2.9E-02 1.1E+00 2.1E-03 3.7E-02 1.4E+00 2.6E-03 2.8E-02 1.1E+00 2.0E-03 1.4E-02 5.2E-01 9.7E-04
2.0E-01 7.5E+00 6.8E-03 1.8E-01 6.7E+00 6.0E-03 7.3E-02 2.8E+00 2.5E-03 1.6E-01 6.3E+00 5.6E-03 1.5E-01 5.6E+00 5.0E-03 4.3E-02 1.6E+00 1.5E-03
1.7E-01 6.6E+00 1.7E-02 2.2E-01 8.3E+00 2.1E-02 1.4E-02 5.2E-01 1.4E-03 3.9E-02 1.5E+00 3.9E-03 4.5E-02 1.7E+00 4.5E-03 1.6E-02 6.0E-01 1.6E-03
2.7E-01 1.0E+01 1.7E-02 3.3E-01 1.3E+01 2.1E-02 1.3E-01 5.2E+00 8.6E-03 1.9E-01 7.3E+00 1.2E-02 1.3E-01 5.0E+00 8.4E-03 5.1E-02 1.9E+00 3.3E-03
6.1E-01 2.3E+01 3.3E-02 6.5E-01 2.5E+01 3.6E-02 2.9E-01 1.1E+01 1.6E-02 5.7E-01 2.2E+01 3.1E-02 1.5E-01 5.9E+00 8.5E-03 1.4E-01 5.5E+00 7.8E-03
2.2E-02 8.5E-01 1.9E-03 2.3E-02 8.7E-01 1.9E-03 8.7E-03 3.3E-01 7.5E-04 1.2E-02 4.4E-01 9.9E-04 8.0E-03 3.1E-01 6.9E-04 7.6E-03 2.9E-01 6.5E-04
3.9E-02 1.5E+00 3.4E-03 4.3E-02 1.7E+00 3.7E-03 1.1E-02 4.0E-01 9.0E-04 1.7E-02 6.4E-01 1.4E-03 7.0E-03 2.7E-01 6.0E-04 9.9E-03 3.8E-01 8.5E-04
0.0E+00 0.0E+00 0.0E+00 0.0E+00 0.0E+00 0.0E+00 0.0E+00 0.0E+00 0.0E+00 0.0E+00 0.0E+00 0.0E+00
0.0E+00 0.0E+00 0.0E+00 0.0E+00 0.0E+00 0.0E+00 0.0E+00 0.0E+00 0.0E+00 0.0E+00 0.0E+00 0.0E+00
0.0E+00 0.0E+00 0.0E+00 0.0E+00 0.0E+00 0.0E+00 0.0E+00 0.0E+00 0.0E+00 0.0E+00 0.0E+00 0.0E+00
0.0E+00 0.0E+00 0.0E+00 0.0E+00 0.0E+00 0.0E+00 0.0E+00 0.0E+00 0.0E+00 0.0E+00 0.0E+00 0.0E+00
0.0E+00 0.0E+00 0.0E+00 0.0E+00 0.0E+00 0.0E+00 0.0E+00 0.0E+00 0.0E+00 0.0E+00 0.0E+00 0.0E+00
0.0E+00 0.0E+00 0.0E+00 0.0E+00 0.0E+00 0.0E+00 0.0E+00 0.0E+00 0.0E+00 0.0E+00 0.0E+00 0.0E+00
0.0E+00 0.0E+00 0.0E+00 0.0E+00 0.0E+00 0.0E+00 0.0E+00 0.0E+00 0.0E+00 0.0E+00 0.0E+00 0.0E+00
0.0E+00 0.0E+00 0.0E+00 0.0E+00 0.0E+00 0.0E+00 0.0E+00 0.0E+00 0.0E+00 0.0E+00 0.0E+00 0.0E+00
0.0E+00 0.0E+00 0.0E+00 0.0E+00 0.0E+00 0.0E+00 0.0E+00 0.0E+00 0.0E+00 0.0E+00 0.0E+00 0.0E+00
0.0E+00 0.0E+00 0.0E+00 0.0E+00 0.0E+00 0.0E+00 0.0E+00 0.0E+00 0.0E+00 0.0E+00 0.0E+00 0.0E+00
0.0E+00 0.0E+00 0.0E+00 0.0E+00 0.0E+00 0.0E+00 0.0E+00 0.0E+00 0.0E+00 0.0E+00 0.0E+00 0.0E+00
0.0E+00 0.0E+00 0.0E+00 0.0E+00 0.0E+00 0.0E+00 0.0E+00 0.0E+00 0.0E+00 0.0E+00 0.0E+00 0.0E+00
0.0E+00 0.0E+00 0.0E+00 0.0E+00 0.0E+00 0.0E+00 0.0E+00 0.0E+00 0.0E+00 0.0E+00 0.0E+00 0.0E+00
0.0E+00 0.0E+00 0.0E+00 0.0E+00 0.0E+00 0.0E+00 0.0E+00 0.0E+00 0.0E+00 0.0E+00 0.0E+00 0.0E+00
0.0E+00 0.0E+00 0.0E+00 0.0E+00 0.0E+00 0.0E+00 0.0E+00 0.0E+00 0.0E+00 0.0E+00 0.0E+00 0.0E+00
Σ17PAH mg/kg Σ17PAH TU Σ17PAH mg/kg Σ17PAH TU Σ17PAH mg/kg Σ17PAH TU Σ17PAH mg/kg Σ17PAH TU Σ17PAH mg/kg Σ17PAH TU Σ17PAH mg/kg Σ17PAH TU4.14 0.2 4.24 0.2 1.68 0.1 3.25 0.2 2.33 0.1 1.00 0.05
Σ34PAH mg/kg 0.3 Σ34PAH mg/kg Σ34PAH mg/kg Σ34PAH mg/kg Σ34PAH mg/kg Σ34PAH mg/kg5.53 0.28 5.67 0.3 2.25 0.1 4.35 0.2 3.12 0.1 1.34 0.1
14.5 14.2 14.9 15.2 15.5 14.919.4 18.9 19.9 20.3 20.8 20.0
CF conversion factor
µg/gOC microgram per gram of organic carbon
µg/kg microgram per kilogram
PAH polycyclic aromatic hydrocarbon
RM river mile
TOC total organic carbon
TPAH total polycyclic aromatic hydrocarbon
TU toxicity unit (i.e., hazard quotient); rounded to one significant figure
USACE US Army Corps of Engineers
3 of 6 ENVIRON
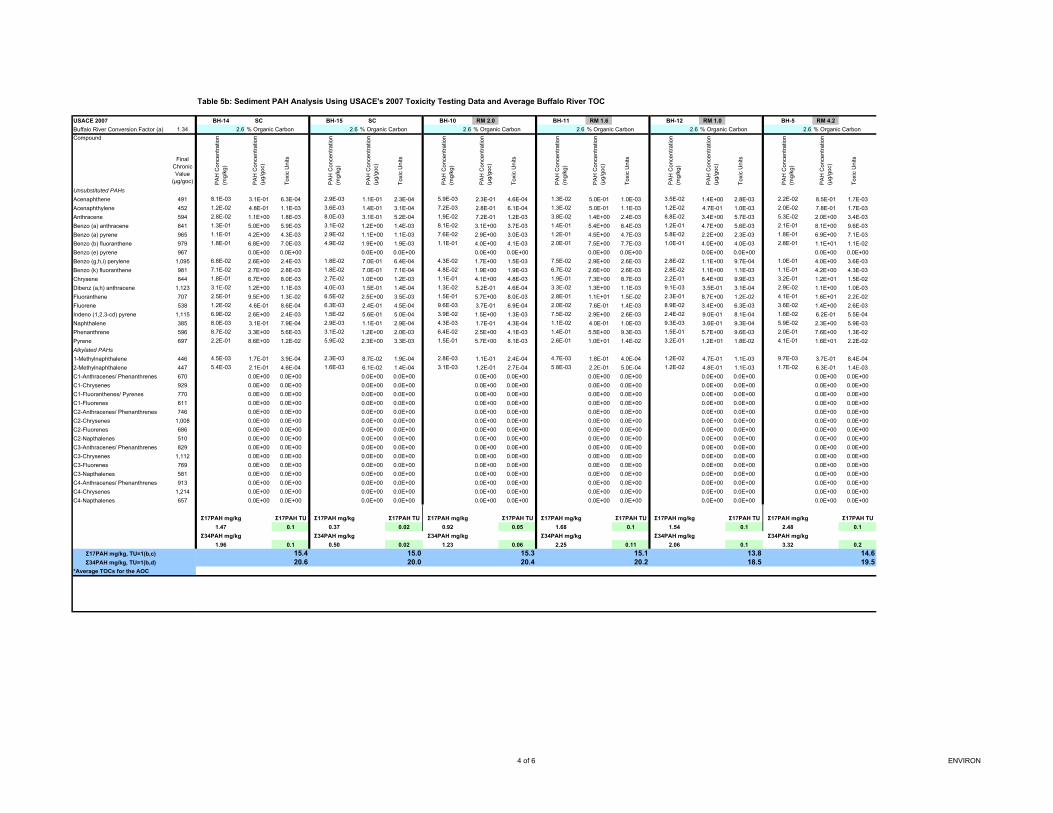
USACE 2007Buffalo River Conversion Factor (a) 1.34
Compound
Final Chronic Value
(µg/goc)
Unsubstituted PAHs
Acenaphthene 491
Acenaphthylene 452
Anthracene 594
Benzo (a) anthracene 841
Benzo (a) pyrene 965
Benzo (b) fluoranthene 979
Benzo (e) pyrene 967
Benzo (g,h,i) perylene 1,095
Benzo (k) fluoranthene 981
Chrysene 844
Dibenz (a,h) anthracene 1,123
Fluoranthene 707
Fluorene 538
Indeno (1,2,3-cd) pyrene 1,115
Naphthalene 385
Phenanthrene 596
Pyrene 697
Alkylated PAHs
1-Methylnaphthalene 446
2-Methylnaphthalene 447
C1-Anthracenes/ Phenanthrenes 670
C1-Chrysenes 929
C1-Fluoranthenes/ Pyrenes 770
C1-Fluorenes 611
C2-Anthracenes/ Phenanthrenes 746
C2-Chrysenes 1,008
C2-Fluorenes 686
C2-Napthalenes 510
C3-Anthracenes/ Phenanthrenes 829
C3-Chrysenes 1,112
C3-Fluorenes 769
C3-Napthalenes 581
C4-Anthracenes/ Phenanthrenes 913
C4-Chrysenes 1,214
C4-Napthalenes 657
Σ17PAH mg/kg, TU=1(b,c)Σ34PAH mg/kg, TU=1(b,d)
*Average TOCs for the AOC
Table 5b: Sediment PAH Analysis Using USACE's 2007 Toxicity Testing Data and Average Buffalo River TOC
BH-14 SC BH-15 SC BH-10 RM 2.0 BH-11 RM 1.6 BH-12 RM 1.0 BH-5 RM 4.22.6 % Organic Carbon 2.6 % Organic Carbon 2.6 % Organic Carbon 2.6 % Organic Carbon 2.6 % Organic Carbon 2.6 % Organic Carbon
PA
H C
once
ntra
tion
(mg/
kg)
PA
H C
once
ntra
tion
(µg/
goc)
Tox
ic U
nits
PA
H C
once
ntra
tion
(mg/
kg)
PA
H C
once
ntra
tion
(µg/
goc)
Tox
ic U
nits
PA
H C
once
ntra
tion
(mg/
kg)
PA
H C
once
ntra
tion
(µg/
goc)
Tox
ic U
nits
PA
H C
once
ntra
tion
(mg/
kg)
PA
H C
once
ntra
tion
(µg/
goc)
Tox
ic U
nits
PA
H C
once
ntra
tion
(mg/
kg)
PA
H C
once
ntra
tion
(µg/
goc)
Tox
ic U
nits
PA
H C
once
ntra
tion
(mg/
kg)
PA
H C
once
ntra
tion
(µg/
goc)
Tox
ic U
nits
8.1E-03 3.1E-01 6.3E-04 2.9E-03 1.1E-01 2.3E-04 5.9E-03 2.3E-01 4.6E-04 1.3E-02 5.0E-01 1.0E-03 3.5E-02 1.4E+00 2.8E-03 2.2E-02 8.5E-01 1.7E-03
1.2E-02 4.8E-01 1.1E-03 3.6E-03 1.4E-01 3.1E-04 7.2E-03 2.8E-01 6.1E-04 1.3E-02 5.0E-01 1.1E-03 1.2E-02 4.7E-01 1.0E-03 2.0E-02 7.8E-01 1.7E-03
2.8E-02 1.1E+00 1.8E-03 8.0E-03 3.1E-01 5.2E-04 1.9E-02 7.2E-01 1.2E-03 3.8E-02 1.4E+00 2.4E-03 8.8E-02 3.4E+00 5.7E-03 5.3E-02 2.0E+00 3.4E-03
1.3E-01 5.0E+00 5.9E-03 3.1E-02 1.2E+00 1.4E-03 8.1E-02 3.1E+00 3.7E-03 1.4E-01 5.4E+00 6.4E-03 1.2E-01 4.7E+00 5.6E-03 2.1E-01 8.1E+00 9.6E-03
1.1E-01 4.2E+00 4.3E-03 2.9E-02 1.1E+00 1.1E-03 7.6E-02 2.9E+00 3.0E-03 1.2E-01 4.5E+00 4.7E-03 5.8E-02 2.2E+00 2.3E-03 1.8E-01 6.9E+00 7.1E-03
1.8E-01 6.8E+00 7.0E-03 4.9E-02 1.9E+00 1.9E-03 1.1E-01 4.0E+00 4.1E-03 2.0E-01 7.5E+00 7.7E-03 1.0E-01 4.0E+00 4.0E-03 2.8E-01 1.1E+01 1.1E-02
0.0E+00 0.0E+00 0.0E+00 0.0E+00 0.0E+00 0.0E+00 0.0E+00 0.0E+00 0.0E+00 0.0E+00 0.0E+00 0.0E+00
6.8E-02 2.6E+00 2.4E-03 1.8E-02 7.0E-01 6.4E-04 4.3E-02 1.7E+00 1.5E-03 7.5E-02 2.9E+00 2.6E-03 2.8E-02 1.1E+00 9.7E-04 1.0E-01 4.0E+00 3.6E-03
7.1E-02 2.7E+00 2.8E-03 1.8E-02 7.0E-01 7.1E-04 4.8E-02 1.9E+00 1.9E-03 6.7E-02 2.6E+00 2.6E-03 2.8E-02 1.1E+00 1.1E-03 1.1E-01 4.2E+00 4.3E-03
1.8E-01 6.7E+00 8.0E-03 2.7E-02 1.0E+00 1.2E-03 1.1E-01 4.1E+00 4.8E-03 1.9E-01 7.3E+00 8.7E-03 2.2E-01 8.4E+00 9.9E-03 3.2E-01 1.2E+01 1.5E-02
3.1E-02 1.2E+00 1.1E-03 4.0E-03 1.5E-01 1.4E-04 1.3E-02 5.2E-01 4.6E-04 3.3E-02 1.3E+00 1.1E-03 9.1E-03 3.5E-01 3.1E-04 2.9E-02 1.1E+00 1.0E-03
2.5E-01 9.5E+00 1.3E-02 6.5E-02 2.5E+00 3.5E-03 1.5E-01 5.7E+00 8.0E-03 2.8E-01 1.1E+01 1.5E-02 2.3E-01 8.7E+00 1.2E-02 4.1E-01 1.6E+01 2.2E-02
1.2E-02 4.6E-01 8.6E-04 6.3E-03 2.4E-01 4.5E-04 9.6E-03 3.7E-01 6.9E-04 2.0E-02 7.6E-01 1.4E-03 8.9E-02 3.4E+00 6.3E-03 3.6E-02 1.4E+00 2.6E-03
6.9E-02 2.6E+00 2.4E-03 1.5E-02 5.6E-01 5.0E-04 3.9E-02 1.5E+00 1.3E-03 7.5E-02 2.9E+00 2.6E-03 2.4E-02 9.0E-01 8.1E-04 1.6E-02 6.2E-01 5.5E-04
8.0E-03 3.1E-01 7.9E-04 2.9E-03 1.1E-01 2.9E-04 4.3E-03 1.7E-01 4.3E-04 1.1E-02 4.0E-01 1.0E-03 9.3E-03 3.6E-01 9.3E-04 5.9E-02 2.3E+00 5.9E-03
8.7E-02 3.3E+00 5.6E-03 3.1E-02 1.2E+00 2.0E-03 6.4E-02 2.5E+00 4.1E-03 1.4E-01 5.5E+00 9.3E-03 1.5E-01 5.7E+00 9.6E-03 2.0E-01 7.6E+00 1.3E-02
2.2E-01 8.6E+00 1.2E-02 5.9E-02 2.3E+00 3.3E-03 1.5E-01 5.7E+00 8.1E-03 2.6E-01 1.0E+01 1.4E-02 3.2E-01 1.2E+01 1.8E-02 4.1E-01 1.6E+01 2.2E-02
4.5E-03 1.7E-01 3.9E-04 2.3E-03 8.7E-02 1.9E-04 2.8E-03 1.1E-01 2.4E-04 4.7E-03 1.8E-01 4.0E-04 1.2E-02 4.7E-01 1.1E-03 9.7E-03 3.7E-01 8.4E-04
5.4E-03 2.1E-01 4.6E-04 1.6E-03 6.1E-02 1.4E-04 3.1E-03 1.2E-01 2.7E-04 5.8E-03 2.2E-01 5.0E-04 1.2E-02 4.8E-01 1.1E-03 1.7E-02 6.3E-01 1.4E-03
0.0E+00 0.0E+00 0.0E+00 0.0E+00 0.0E+00 0.0E+00 0.0E+00 0.0E+00 0.0E+00 0.0E+00 0.0E+00 0.0E+00
0.0E+00 0.0E+00 0.0E+00 0.0E+00 0.0E+00 0.0E+00 0.0E+00 0.0E+00 0.0E+00 0.0E+00 0.0E+00 0.0E+00
0.0E+00 0.0E+00 0.0E+00 0.0E+00 0.0E+00 0.0E+00 0.0E+00 0.0E+00 0.0E+00 0.0E+00 0.0E+00 0.0E+00
0.0E+00 0.0E+00 0.0E+00 0.0E+00 0.0E+00 0.0E+00 0.0E+00 0.0E+00 0.0E+00 0.0E+00 0.0E+00 0.0E+00
0.0E+00 0.0E+00 0.0E+00 0.0E+00 0.0E+00 0.0E+00 0.0E+00 0.0E+00 0.0E+00 0.0E+00 0.0E+00 0.0E+00
0.0E+00 0.0E+00 0.0E+00 0.0E+00 0.0E+00 0.0E+00 0.0E+00 0.0E+00 0.0E+00 0.0E+00 0.0E+00 0.0E+00
0.0E+00 0.0E+00 0.0E+00 0.0E+00 0.0E+00 0.0E+00 0.0E+00 0.0E+00 0.0E+00 0.0E+00 0.0E+00 0.0E+00
0.0E+00 0.0E+00 0.0E+00 0.0E+00 0.0E+00 0.0E+00 0.0E+00 0.0E+00 0.0E+00 0.0E+00 0.0E+00 0.0E+00
0.0E+00 0.0E+00 0.0E+00 0.0E+00 0.0E+00 0.0E+00 0.0E+00 0.0E+00 0.0E+00 0.0E+00 0.0E+00 0.0E+00
0.0E+00 0.0E+00 0.0E+00 0.0E+00 0.0E+00 0.0E+00 0.0E+00 0.0E+00 0.0E+00 0.0E+00 0.0E+00 0.0E+00
0.0E+00 0.0E+00 0.0E+00 0.0E+00 0.0E+00 0.0E+00 0.0E+00 0.0E+00 0.0E+00 0.0E+00 0.0E+00 0.0E+00
0.0E+00 0.0E+00 0.0E+00 0.0E+00 0.0E+00 0.0E+00 0.0E+00 0.0E+00 0.0E+00 0.0E+00 0.0E+00 0.0E+00
0.0E+00 0.0E+00 0.0E+00 0.0E+00 0.0E+00 0.0E+00 0.0E+00 0.0E+00 0.0E+00 0.0E+00 0.0E+00 0.0E+00
0.0E+00 0.0E+00 0.0E+00 0.0E+00 0.0E+00 0.0E+00 0.0E+00 0.0E+00 0.0E+00 0.0E+00 0.0E+00 0.0E+00
0.0E+00 0.0E+00 0.0E+00 0.0E+00 0.0E+00 0.0E+00 0.0E+00 0.0E+00 0.0E+00 0.0E+00 0.0E+00 0.0E+00
Σ17PAH mg/kg Σ17PAH TU Σ17PAH mg/kg Σ17PAH TU Σ17PAH mg/kg Σ17PAH TU Σ17PAH mg/kg Σ17PAH TU Σ17PAH mg/kg Σ17PAH TU Σ17PAH mg/kg Σ17PAH TU1.47 0.1 0.37 0.02 0.92 0.05 1.68 0.1 1.54 0.1 2.48 0.1
Σ34PAH mg/kg Σ34PAH mg/kg Σ34PAH mg/kg Σ34PAH mg/kg Σ34PAH mg/kg Σ34PAH mg/kg1.96 0.1 0.50 0.02 1.23 0.06 2.25 0.11 2.06 0.1 3.32 0.2
15.4 15.0 15.3 15.1 13.8 14.620.6 20.0 20.4 20.2 18.5 19.5
4 of 6 ENVIRON
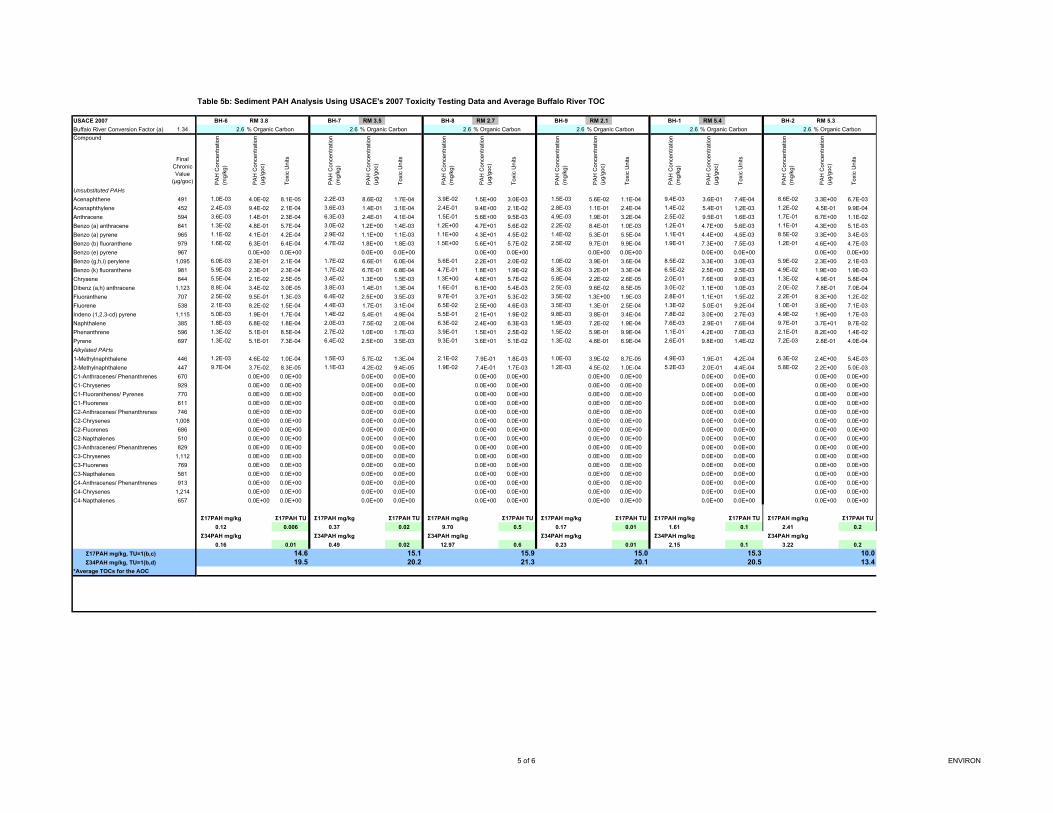
USACE 2007Buffalo River Conversion Factor (a) 1.34
Compound
Final Chronic Value
(µg/goc)
Unsubstituted PAHs
Acenaphthene 491
Acenaphthylene 452
Anthracene 594
Benzo (a) anthracene 841
Benzo (a) pyrene 965
Benzo (b) fluoranthene 979
Benzo (e) pyrene 967
Benzo (g,h,i) perylene 1,095
Benzo (k) fluoranthene 981
Chrysene 844
Dibenz (a,h) anthracene 1,123
Fluoranthene 707
Fluorene 538
Indeno (1,2,3-cd) pyrene 1,115
Naphthalene 385
Phenanthrene 596
Pyrene 697
Alkylated PAHs
1-Methylnaphthalene 446
2-Methylnaphthalene 447
C1-Anthracenes/ Phenanthrenes 670
C1-Chrysenes 929
C1-Fluoranthenes/ Pyrenes 770
C1-Fluorenes 611
C2-Anthracenes/ Phenanthrenes 746
C2-Chrysenes 1,008
C2-Fluorenes 686
C2-Napthalenes 510
C3-Anthracenes/ Phenanthrenes 829
C3-Chrysenes 1,112
C3-Fluorenes 769
C3-Napthalenes 581
C4-Anthracenes/ Phenanthrenes 913
C4-Chrysenes 1,214
C4-Napthalenes 657
Σ17PAH mg/kg, TU=1(b,c)Σ34PAH mg/kg, TU=1(b,d)
*Average TOCs for the AOC
Table 5b: Sediment PAH Analysis Using USACE's 2007 Toxicity Testing Data and Average Buffalo River TOC
BH-6 RM 3.8 BH-7 RM 3.5 BH-8 RM 2.7 BH-9 RM 2.1 BH-1 RM 5.4 BH-2 RM 5.32.6 % Organic Carbon 2.6 % Organic Carbon 2.6 % Organic Carbon 2.6 % Organic Carbon 2.6 % Organic Carbon 2.6 % Organic Carbon
PA
H C
once
ntra
tion
(mg/
kg)
PA
H C
once
ntra
tion
(µg/
goc)
Tox
ic U
nits
PA
H C
once
ntra
tion
(mg/
kg)
PA
H C
once
ntra
tion
(µg/
goc)
Tox
ic U
nits
PA
H C
once
ntra
tion
(mg/
kg)
PA
H C
once
ntra
tion
(µg/
goc)
Tox
ic U
nits
PA
H C
once
ntra
tion
(mg/
kg)
PA
H C
once
ntra
tion
(µg/
goc)
Tox
ic U
nits
PA
H C
once
ntra
tion
(mg/
kg)
PA
H C
once
ntra
tion
(µg/
goc)
Tox
ic U
nits
PA
H C
once
ntra
tion
(mg/
kg)
PA
H C
once
ntra
tion
(µg/
goc)
Tox
ic U
nits
1.0E-03 4.0E-02 8.1E-05 2.2E-03 8.6E-02 1.7E-04 3.9E-02 1.5E+00 3.0E-03 1.5E-03 5.6E-02 1.1E-04 9.4E-03 3.6E-01 7.4E-04 8.6E-02 3.3E+00 6.7E-03
2.4E-03 9.4E-02 2.1E-04 3.6E-03 1.4E-01 3.1E-04 2.4E-01 9.4E+00 2.1E-02 2.8E-03 1.1E-01 2.4E-04 1.4E-02 5.4E-01 1.2E-03 1.2E-02 4.5E-01 9.9E-04
3.6E-03 1.4E-01 2.3E-04 6.3E-03 2.4E-01 4.1E-04 1.5E-01 5.6E+00 9.5E-03 4.9E-03 1.9E-01 3.2E-04 2.5E-02 9.5E-01 1.6E-03 1.7E-01 6.7E+00 1.1E-02
1.3E-02 4.8E-01 5.7E-04 3.0E-02 1.2E+00 1.4E-03 1.2E+00 4.7E+01 5.6E-02 2.2E-02 8.4E-01 1.0E-03 1.2E-01 4.7E+00 5.6E-03 1.1E-01 4.3E+00 5.1E-03
1.1E-02 4.1E-01 4.2E-04 2.9E-02 1.1E+00 1.1E-03 1.1E+00 4.3E+01 4.5E-02 1.4E-02 5.3E-01 5.5E-04 1.1E-01 4.4E+00 4.5E-03 8.5E-02 3.3E+00 3.4E-03
1.6E-02 6.3E-01 6.4E-04 4.7E-02 1.8E+00 1.8E-03 1.5E+00 5.6E+01 5.7E-02 2.5E-02 9.7E-01 9.9E-04 1.9E-01 7.3E+00 7.5E-03 1.2E-01 4.6E+00 4.7E-03
0.0E+00 0.0E+00 0.0E+00 0.0E+00 0.0E+00 0.0E+00 0.0E+00 0.0E+00 0.0E+00 0.0E+00 0.0E+00 0.0E+00
6.0E-03 2.3E-01 2.1E-04 1.7E-02 6.6E-01 6.0E-04 5.6E-01 2.2E+01 2.0E-02 1.0E-02 3.9E-01 3.6E-04 8.5E-02 3.3E+00 3.0E-03 5.9E-02 2.3E+00 2.1E-03
5.9E-03 2.3E-01 2.3E-04 1.7E-02 6.7E-01 6.8E-04 4.7E-01 1.8E+01 1.9E-02 8.3E-03 3.2E-01 3.3E-04 6.5E-02 2.5E+00 2.5E-03 4.9E-02 1.9E+00 1.9E-03
5.5E-04 2.1E-02 2.5E-05 3.4E-02 1.3E+00 1.5E-03 1.3E+00 4.8E+01 5.7E-02 5.8E-04 2.2E-02 2.6E-05 2.0E-01 7.6E+00 9.0E-03 1.3E-02 4.9E-01 5.8E-04
8.8E-04 3.4E-02 3.0E-05 3.8E-03 1.4E-01 1.3E-04 1.6E-01 6.1E+00 5.4E-03 2.5E-03 9.6E-02 8.5E-05 3.0E-02 1.1E+00 1.0E-03 2.0E-02 7.8E-01 7.0E-04
2.5E-02 9.5E-01 1.3E-03 6.4E-02 2.5E+00 3.5E-03 9.7E-01 3.7E+01 5.3E-02 3.5E-02 1.3E+00 1.9E-03 2.8E-01 1.1E+01 1.5E-02 2.2E-01 8.3E+00 1.2E-02
2.1E-03 8.2E-02 1.5E-04 4.4E-03 1.7E-01 3.1E-04 6.5E-02 2.5E+00 4.6E-03 3.5E-03 1.3E-01 2.5E-04 1.3E-02 5.0E-01 9.2E-04 1.0E-01 3.8E+00 7.1E-03
5.0E-03 1.9E-01 1.7E-04 1.4E-02 5.4E-01 4.9E-04 5.5E-01 2.1E+01 1.9E-02 9.8E-03 3.8E-01 3.4E-04 7.8E-02 3.0E+00 2.7E-03 4.9E-02 1.9E+00 1.7E-03
1.8E-03 6.8E-02 1.8E-04 2.0E-03 7.5E-02 2.0E-04 6.3E-02 2.4E+00 6.3E-03 1.9E-03 7.2E-02 1.9E-04 7.6E-03 2.9E-01 7.6E-04 9.7E-01 3.7E+01 9.7E-02
1.3E-02 5.1E-01 8.5E-04 2.7E-02 1.0E+00 1.7E-03 3.9E-01 1.5E+01 2.5E-02 1.5E-02 5.9E-01 9.9E-04 1.1E-01 4.2E+00 7.0E-03 2.1E-01 8.2E+00 1.4E-02
1.3E-02 5.1E-01 7.3E-04 6.4E-02 2.5E+00 3.5E-03 9.3E-01 3.6E+01 5.1E-02 1.3E-02 4.8E-01 6.9E-04 2.6E-01 9.8E+00 1.4E-02 7.2E-03 2.8E-01 4.0E-04
1.2E-03 4.6E-02 1.0E-04 1.5E-03 5.7E-02 1.3E-04 2.1E-02 7.9E-01 1.8E-03 1.0E-03 3.9E-02 8.7E-05 4.9E-03 1.9E-01 4.2E-04 6.3E-02 2.4E+00 5.4E-03
9.7E-04 3.7E-02 8.3E-05 1.1E-03 4.2E-02 9.4E-05 1.9E-02 7.4E-01 1.7E-03 1.2E-03 4.5E-02 1.0E-04 5.2E-03 2.0E-01 4.4E-04 5.8E-02 2.2E+00 5.0E-03
0.0E+00 0.0E+00 0.0E+00 0.0E+00 0.0E+00 0.0E+00 0.0E+00 0.0E+00 0.0E+00 0.0E+00 0.0E+00 0.0E+00
0.0E+00 0.0E+00 0.0E+00 0.0E+00 0.0E+00 0.0E+00 0.0E+00 0.0E+00 0.0E+00 0.0E+00 0.0E+00 0.0E+00
0.0E+00 0.0E+00 0.0E+00 0.0E+00 0.0E+00 0.0E+00 0.0E+00 0.0E+00 0.0E+00 0.0E+00 0.0E+00 0.0E+00
0.0E+00 0.0E+00 0.0E+00 0.0E+00 0.0E+00 0.0E+00 0.0E+00 0.0E+00 0.0E+00 0.0E+00 0.0E+00 0.0E+00
0.0E+00 0.0E+00 0.0E+00 0.0E+00 0.0E+00 0.0E+00 0.0E+00 0.0E+00 0.0E+00 0.0E+00 0.0E+00 0.0E+00
0.0E+00 0.0E+00 0.0E+00 0.0E+00 0.0E+00 0.0E+00 0.0E+00 0.0E+00 0.0E+00 0.0E+00 0.0E+00 0.0E+00
0.0E+00 0.0E+00 0.0E+00 0.0E+00 0.0E+00 0.0E+00 0.0E+00 0.0E+00 0.0E+00 0.0E+00 0.0E+00 0.0E+00
0.0E+00 0.0E+00 0.0E+00 0.0E+00 0.0E+00 0.0E+00 0.0E+00 0.0E+00 0.0E+00 0.0E+00 0.0E+00 0.0E+00
0.0E+00 0.0E+00 0.0E+00 0.0E+00 0.0E+00 0.0E+00 0.0E+00 0.0E+00 0.0E+00 0.0E+00 0.0E+00 0.0E+00
0.0E+00 0.0E+00 0.0E+00 0.0E+00 0.0E+00 0.0E+00 0.0E+00 0.0E+00 0.0E+00 0.0E+00 0.0E+00 0.0E+00
0.0E+00 0.0E+00 0.0E+00 0.0E+00 0.0E+00 0.0E+00 0.0E+00 0.0E+00 0.0E+00 0.0E+00 0.0E+00 0.0E+00
0.0E+00 0.0E+00 0.0E+00 0.0E+00 0.0E+00 0.0E+00 0.0E+00 0.0E+00 0.0E+00 0.0E+00 0.0E+00 0.0E+00
0.0E+00 0.0E+00 0.0E+00 0.0E+00 0.0E+00 0.0E+00 0.0E+00 0.0E+00 0.0E+00 0.0E+00 0.0E+00 0.0E+00
0.0E+00 0.0E+00 0.0E+00 0.0E+00 0.0E+00 0.0E+00 0.0E+00 0.0E+00 0.0E+00 0.0E+00 0.0E+00 0.0E+00
0.0E+00 0.0E+00 0.0E+00 0.0E+00 0.0E+00 0.0E+00 0.0E+00 0.0E+00 0.0E+00 0.0E+00 0.0E+00 0.0E+00
Σ17PAH mg/kg Σ17PAH TU Σ17PAH mg/kg Σ17PAH TU Σ17PAH mg/kg Σ17PAH TU Σ17PAH mg/kg Σ17PAH TU Σ17PAH mg/kg Σ17PAH TU Σ17PAH mg/kg Σ17PAH TU0.12 0.006 0.37 0.02 9.70 0.5 0.17 0.01 1.61 0.1 2.41 0.2
Σ34PAH mg/kg Σ34PAH mg/kg Σ34PAH mg/kg Σ34PAH mg/kg Σ34PAH mg/kg Σ34PAH mg/kg0.16 0.01 0.49 0.02 12.97 0.6 0.23 0.01 2.15 0.1 3.22 0.2
14.6 15.1 15.9 15.0 15.3 10.019.5 20.2 21.3 20.1 20.5 13.4
5 of 6 ENVIRON
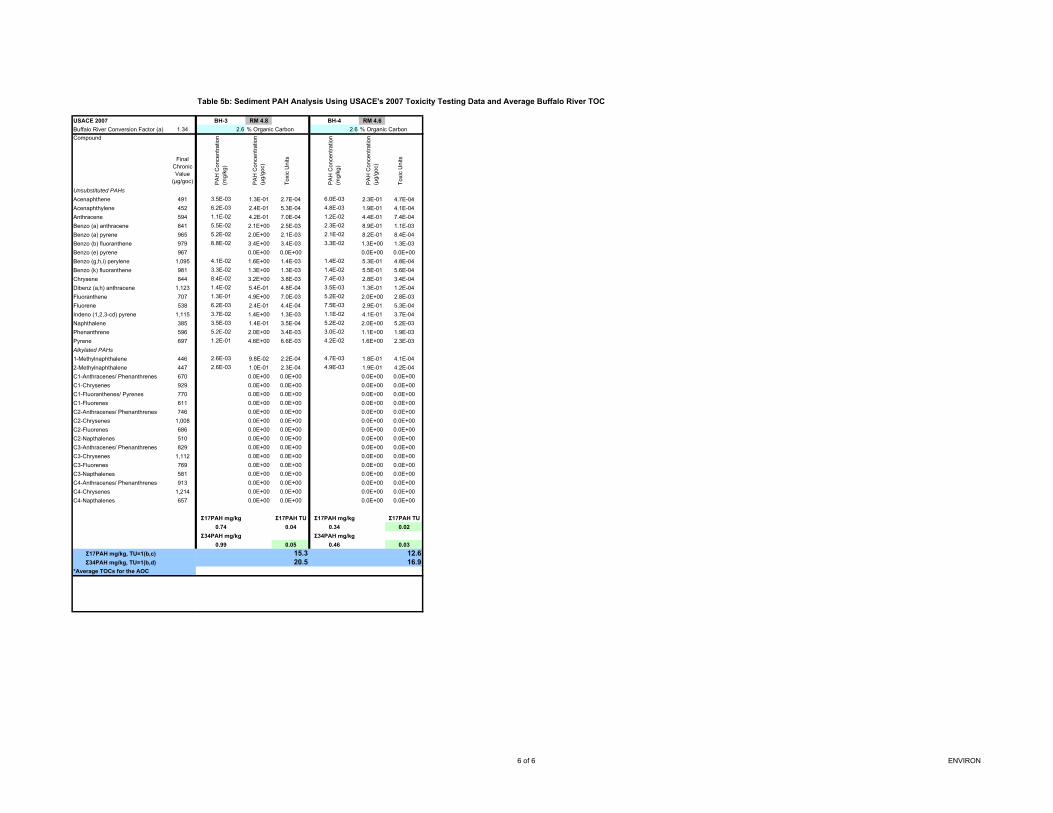
USACE 2007Buffalo River Conversion Factor (a) 1.34
Compound
Final Chronic Value
(µg/goc)
Unsubstituted PAHs
Acenaphthene 491
Acenaphthylene 452
Anthracene 594
Benzo (a) anthracene 841
Benzo (a) pyrene 965
Benzo (b) fluoranthene 979
Benzo (e) pyrene 967
Benzo (g,h,i) perylene 1,095
Benzo (k) fluoranthene 981
Chrysene 844
Dibenz (a,h) anthracene 1,123
Fluoranthene 707
Fluorene 538
Indeno (1,2,3-cd) pyrene 1,115
Naphthalene 385
Phenanthrene 596
Pyrene 697
Alkylated PAHs
1-Methylnaphthalene 446
2-Methylnaphthalene 447
C1-Anthracenes/ Phenanthrenes 670
C1-Chrysenes 929
C1-Fluoranthenes/ Pyrenes 770
C1-Fluorenes 611
C2-Anthracenes/ Phenanthrenes 746
C2-Chrysenes 1,008
C2-Fluorenes 686
C2-Napthalenes 510
C3-Anthracenes/ Phenanthrenes 829
C3-Chrysenes 1,112
C3-Fluorenes 769
C3-Napthalenes 581
C4-Anthracenes/ Phenanthrenes 913
C4-Chrysenes 1,214
C4-Napthalenes 657
Σ17PAH mg/kg, TU=1(b,c)Σ34PAH mg/kg, TU=1(b,d)
*Average TOCs for the AOC
Table 5b: Sediment PAH Analysis Using USACE's 2007 Toxicity Testing Data and Average Buffalo River TOC
BH-3 RM 4.8 BH-4 RM 4.62.6 % Organic Carbon 2.6 % Organic Carbon
PA
H C
once
ntra
tion
(mg/
kg)
PA
H C
once
ntra
tion
(µg/
goc)
Tox
ic U
nits
PA
H C
once
ntra
tion
(mg/
kg)
PA
H C
once
ntra
tion
(µg/
goc)
Tox
ic U
nits
3.5E-03 1.3E-01 2.7E-04 6.0E-03 2.3E-01 4.7E-04
6.2E-03 2.4E-01 5.3E-04 4.8E-03 1.9E-01 4.1E-04
1.1E-02 4.2E-01 7.0E-04 1.2E-02 4.4E-01 7.4E-04
5.5E-02 2.1E+00 2.5E-03 2.3E-02 8.9E-01 1.1E-03
5.2E-02 2.0E+00 2.1E-03 2.1E-02 8.2E-01 8.4E-04
8.8E-02 3.4E+00 3.4E-03 3.3E-02 1.3E+00 1.3E-03
0.0E+00 0.0E+00 0.0E+00 0.0E+00
4.1E-02 1.6E+00 1.4E-03 1.4E-02 5.3E-01 4.8E-04
3.3E-02 1.3E+00 1.3E-03 1.4E-02 5.5E-01 5.6E-04
8.4E-02 3.2E+00 3.8E-03 7.4E-03 2.8E-01 3.4E-04
1.4E-02 5.4E-01 4.8E-04 3.5E-03 1.3E-01 1.2E-04
1.3E-01 4.9E+00 7.0E-03 5.2E-02 2.0E+00 2.8E-03
6.2E-03 2.4E-01 4.4E-04 7.5E-03 2.9E-01 5.3E-04
3.7E-02 1.4E+00 1.3E-03 1.1E-02 4.1E-01 3.7E-04
3.5E-03 1.4E-01 3.5E-04 5.2E-02 2.0E+00 5.2E-03
5.2E-02 2.0E+00 3.4E-03 3.0E-02 1.1E+00 1.9E-03
1.2E-01 4.6E+00 6.6E-03 4.2E-02 1.6E+00 2.3E-03
2.6E-03 9.8E-02 2.2E-04 4.7E-03 1.8E-01 4.1E-04
2.6E-03 1.0E-01 2.3E-04 4.9E-03 1.9E-01 4.2E-04
0.0E+00 0.0E+00 0.0E+00 0.0E+00
0.0E+00 0.0E+00 0.0E+00 0.0E+00
0.0E+00 0.0E+00 0.0E+00 0.0E+00
0.0E+00 0.0E+00 0.0E+00 0.0E+00
0.0E+00 0.0E+00 0.0E+00 0.0E+00
0.0E+00 0.0E+00 0.0E+00 0.0E+00
0.0E+00 0.0E+00 0.0E+00 0.0E+00
0.0E+00 0.0E+00 0.0E+00 0.0E+00
0.0E+00 0.0E+00 0.0E+00 0.0E+00
0.0E+00 0.0E+00 0.0E+00 0.0E+00
0.0E+00 0.0E+00 0.0E+00 0.0E+00
0.0E+00 0.0E+00 0.0E+00 0.0E+00
0.0E+00 0.0E+00 0.0E+00 0.0E+00
0.0E+00 0.0E+00 0.0E+00 0.0E+00
0.0E+00 0.0E+00 0.0E+00 0.0E+00
Σ17PAH mg/kg Σ17PAH TU Σ17PAH mg/kg Σ17PAH TU0.74 0.04 0.34 0.02
Σ34PAH mg/kg Σ34PAH mg/kg0.99 0.05 0.46 0.03
15.3 12.620.5 16.9
6 of 6 ENVIRON

Buffalo River Feasibility Study
D R A F T F I N A L
November 19, 2010
Appendix A3 PCB PRG Information
A3a: PCB PRG Memorandum and Attachments
A3b: PCB USACE Theoretical Bioaccumulation Potential

Buffalo River Feasibility Study
D R A F T F I N A L
November 19, 2010
Appendix A3a PCB PRG Memorandum
PCB Attachment 1
Page 1 of 7
March 13, 2009 MEMORANDUM To: Ecology Technical Subgroup From: Mary Sorensen, Darrel Lauren, and Jen Lyndall Re: Preliminary Remedial Goal (PRG) for PCBs and Streamlined Risk Evaluation for
PCB-Exposed Wildlife at the Buffalo River AOC
Executive Summary The Ecology Subgroup (Eco-Group) of the Great Lakes Legacy Act Buffalo River Project Coordination Team has collaborated on efforts to identify preliminary remedial goals (PRGs)1 of contaminants in sediments for use in the Buffalo River Feasibility Study (FS). This memorandum (memo) is focused on polychlorinated biphenyls (PCBs) and the fish tissue concentrations considered relevant as a basis of PRGs for Buffalo River. This memo briefly describes the approach used for the development of sediment PRGs estimated based on target fish tissue concentrations that are protective of fish eating wildlife. The approach described herein is consistent with approaches discussed during weekly Eco-Group calls, including modifications made based on improvements identified during the February 2nd Eco-Group call. Several tables are provided to support this memo and Attachment 1 provides the electronic excel workbook of these tables in a calculational format. All supporting data used in the calculations are provided as linked worksheets to facilitate review by the Eco-Group. Upon final agreement of PRGs, a final version of this memo will be submitted from the Eco-Group as an appendix to the Buffalo River FS report. A range of sediment PCB PRGs is identified herein for consideration in the Buffalo River FS. This approach is similar to that provided for the PAH PRG (memorandum dated February 11) where multiple lines of evidence were used to support the final proposed PRG. It was decided by the Eco-Group during the February 2nd conference call that a range of PCB PRGs was appropriate because it allowed consideration of multiple risk-based criteria valued by the Eco-Group. Four biological exposure “scenarios” based on the natural history of the most sensitive wildlife receptor, the mink, were developed. These were used to evaluate the influence of biologically important variables on the PRGs. These variables are briefly listed below (discussed in greater detail in the PRG Development and Streamlined Risk Evaluation sections of this memo). Fish tissue PCB concentration Area use factors (AUF) Percent of fish in mink diet
1 The acronym PRG may be used interchangeably with remedial target concentration (RTC) indicating the targets being evaluated for use in the FS. Actual remedial goals will be identified in the FS.
Page 2 of 7
Biota-sediment accumulation factor (BSAFs) Toxicity reference values (TRVs)
Table 1 shows the sediment PCB PRGs proposed for the Buffalo River FS range from 0.048 mg/kg to 1.3 mg/kg, with average values ranging from 0.44 mg/kg for all scenarios to 0.45 mg/kg for biologically relevant scenarios. The remainder of this memo describes the: PRG development approach, including tabular summary of PRG calculations, and Streamlined risk evaluation, including formulae used to derive the PRGs where HQs
were set equal to 1
PRG Development Approach The PRGs presented in Table 1 are based on the calculations provided in Table 2. As identified in Table 2, four “scenarios” were developed to evaluate the PRGs for mink that varied based on consideration of the following elements: The basis of fish tissue concentrations used in the analysis: The basis of fish tissue
concentrations were set equal to the fish tissue criterion identified by NYSDEC for the Niagara River mink or estimated values where the hazard quotient (HQ) was set equal to the value of 1 (i.e., an HQ ≤ 1 indicates that chemical concentrations do not pose an unacceptable risk to wildlife). Note that separately from PRG development, sediment, worm, and fish tissues for Buffalo River were evaluated to demonstrate the risks posed by current conditions in the river, so that as part of the FS, risk reduction can be evaluated.
AUFs, based on either 100% or 60% AUF: Habitat characteristics of the Buffalo River which will govern the use of the river by mink were estimated based on the US Fish and Wildlife Service Habitat Suitability Index (USFWS 1989) and consideration of mink exposure to fish tissue as described by NYSDEC in the wildlife narratives provided in the Niagara River report (1987). An estimate of 60% AUF is the maximum AUF that could reasonably be expected for individual mink in the Buffalo River given habitat requirements and conditions present in the Buffalo River, even considering high quality habitat restoration options that are being considered in the FS.
Mink exposure based on 90%, 50%, or 60% fish in the diet: The 90% estimate was based on NYSDEC request. This is a highly conservative estimate because the NYSDEC (1987) wildlife narrative for mink indicates that “While other authors also suggest the diet is almost 100% aquatic food depending on season and feeding location, normal fish content in the diet is deemed closer to 30% than 50% (Aulerich 1973; Linscombe et al. 1982). Aulerich et al. (1973) used 30% fish in their mink feeding studies because it is the percentage used in mink ranching to yield optimal development.” The 50% to 60% estimates used for the PRG development were considered a reasonable compromise between the NYSDEC request for 90% and the NYSDEC (1987) statements of 30% being appropriate.
BSAFs reflective of sediment to fish uptake calculated by the US Army Corps of Engineers (USACE) were used (Attachment 1). The scenarios varied between values
Page 3 of 7
identified for the AOC as a whole (including the Ship Canal) or the BSAF for the Buffalo River.
HQs were set equal to 1 with the exception of when the NYSDEC fish tissue criterion was used. The HQ generated using the NYSDEC criterion was 0.3 to 0.5 (unitless), which are values typically below those used to establish remedial goals. However, this information is included in the range of PRGs because it provides necessary consideration of fish tissue criteria valued by NYSDEC.
TRVs were based on the no adverse effects level (NOAEL) fish tissue criteria toxicity reference values (TRVs) described in Attachment 2 which consider both the criteria identified by New York State Department of Environmental Conservation (NYSDEC 1987), and the US Environmental Protection Agency (USEPA) Great Lakes Initiative (GLI) (1995). For the PRG development, TRVs were consistently set to the USEPA GLI, with only one scenario with the exception where the TRV used by USEPA for the remediation of PCBs in Housatonic River sediments was considered (Bursian et al. 2003; USEPA 2004). These Michigan State University researchers (Bursian et al. 2003) performed studies on mink ingestion of PCBs that provide an updated insight of the base studies described in Attachment 2. An important consideration in the Bursian et al. 2003 study is that fish like carp are high in thiaminase, which metabolizes thiamine. Thiamine deficiency has many of the characteristics of PCB poisoning. More recent studies, such as Bursian et al. (2003) recognized this and added thiamine to the diet of mink fed fish with elevated thiaminase. Previous studies did not report the influence of thiaminase on the toxicity observed. It is also important to note that the study selected by USEPA GLI was Aulerich and Ringer (1977); and, Dr. Aulerich is Dr. Bursian’s coauthor on the 2003 study.
Four scenarios for mink were developed, with an overview of these scenarios provided in Table 1. Generally, the four scenarios fell into three categories, as follows: Scenarios 1 and 2: Sediment PRGs Estimated Based on Mink Consumption of Fish
Tissue Concentrations That Yield an HQ = 1 o Scenarios 1 and 2 were essentially identical with the difference being
consideration of the USACE BSAFs. Scenario 1 used the AOC wide BSAFs (i.e., those including the Ship Canal) and Scenario 2 used the Buffalo River (BR) BSAFs. As seen on Tables 1 and 2, there was little difference between these approaches.
Scenario 3: Sediment PRGs Estimated Based on Mink Consumption of Fish Tissue Concentrations Equal to NYSDEC Criteria (HQs <1)
Scenario 4: Sediment PRGs Estimated Based on Mink Consumption of Fish Tissue Concentrations That Yield an HQ = 1; Bursian et al. 2003 TRV (USEPA Housatonic 2004, 2006)
As seen in Tables 1 and 2, there are several iterations of each scenario (notated as Scenario 1a, 1b, 1c; 2a, 2b, 2c; 3a, 3b, 3c; and 4a, 4b, 4c). The differences between each are focused so that key elements of consideration could be quantified. Specifically, the following iterations were provided: Scenarios 1 and 2 a, b, c iterations vary based on AUF (100%, 60%, and 60%) and the
percent of fish in diet (50%, 50%, and 90%). The AUF variation allowed fish tissue
Page 4 of 7
estimates (and thus back-calculated PRGs) to be based on consideration of both worst case HQ=1 and most biologically relevant HQ=1.
Scenario 3 focused on iterations focused on the most biologically relevant AUF (60%) and included variations in percent of fish in diet (50%, 50%, and 90%), and variations in BSAF (AOC, BR, and BR).
Scenario 4 is the only case where the USEPA GLI TRV was substituted with another study used by USEPA, the Bursian et al. 2003 study used as the basis of the remedial goals selected for the Housatonic River (USEPA 2004, 2006). The iterations within the scenario were kept at 100% AUF in efforts to keep the evaluation conservative for the benefit of the stakeholder group, the fish in diet was consistent with that from Scenarios 1, 2, and 3. The BSAFs were consistent with that from Scenario 3 (i.e., both AOC and BR were considered).
The estimated (Scenarios 1, 2, and 4) and designated (Scenario 3) fish tissue concentrations were used to back calculate a sediment PCB PRG (in mg/kg) as follows: Dry weight fish tissue concentrations (i.e., those needed to calculate HQs) were
converted to wet weight by assuming fish are comprised of 75% water (i.e., dry weight values were divided by four).
Wet weight fish tissues were lipid normalized so that they could be used with BSAFs that were organic carbon normalized. An average of 3% lipids and 2.6% total organic carbon (TOC) were used based on fish tissue data (Table 1 and linked data sources in Attachment 1).
Streamlined Risk Evaluation A streamlined risk evaluation was also provided as part of this PRG effort because: Identification of baseline risks to mammalian and avian fish-eating receptors provides a
basis to evaluate risk reduction in the FS concerns were raised during the January 16th Eco-Group meeting in Buffalo, NY about
the potential risks for not only fish eating wildlife but also those avian receptors that may incidentally ingest sediment during foraging.
This streamlined risk evaluation was conducted in a manner consistent with the USEPA Ecological Risk Assessment Guidance for Superfund (1997) and the NYSDEC Fish and Wildlife Impact Assessment (1994). The wildlife species selected for this purpose were the mink, the belted kingfisher, and the semipalmated sandpiper. Mink and kingfisher were selected because they obtain a large percentage of their caloric requirements for fish consumption. The sandpiper was selected as a representative of a feeding guild that obtains its caloric requirements from benthic invertebrates and also incidentally ingests a large amount of sediment. The remainder of this memo briefly describes the formulae and data sources.
Formulae The following general formula was used to estimate exposures for mink and kingfisher:
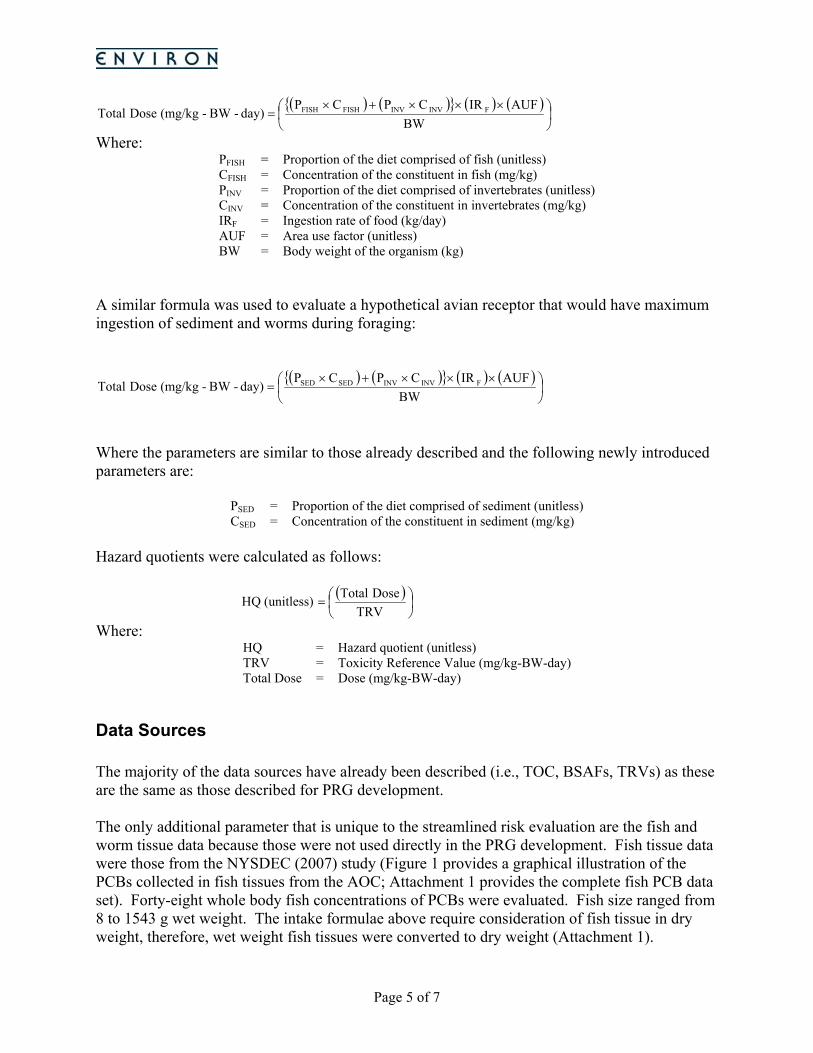
Page 5 of 7
BW
AUFIRCPCP day)-BW-(mg/kg DoseTotal FINVINVFISHFISH
Where: PFISH = Proportion of the diet comprised of fish (unitless) CFISH = Concentration of the constituent in fish (mg/kg) PINV = Proportion of the diet comprised of invertebrates (unitless) CINV = Concentration of the constituent in invertebrates (mg/kg) IRF = Ingestion rate of food (kg/day) AUF = Area use factor (unitless) BW = Body weight of the organism (kg)
A similar formula was used to evaluate a hypothetical avian receptor that would have maximum ingestion of sediment and worms during foraging:
BW
AUFIRCPCP day)-BW-(mg/kg DoseTotal FINVINVSEDSED
Where the parameters are similar to those already described and the following newly introduced parameters are:
PSED = Proportion of the diet comprised of sediment (unitless) CSED = Concentration of the constituent in sediment (mg/kg)
Hazard quotients were calculated as follows:
TRV
DoseTotal (unitless) HQ
Where: HQ = Hazard quotient (unitless) TRV = Toxicity Reference Value (mg/kg-BW-day) Total Dose = Dose (mg/kg-BW-day)
Data Sources The majority of the data sources have already been described (i.e., TOC, BSAFs, TRVs) as these are the same as those described for PRG development. The only additional parameter that is unique to the streamlined risk evaluation are the fish and worm tissue data because those were not used directly in the PRG development. Fish tissue data were those from the NYSDEC (2007) study (Figure 1 provides a graphical illustration of the PCBs collected in fish tissues from the AOC; Attachment 1 provides the complete fish PCB data set). Forty-eight whole body fish concentrations of PCBs were evaluated. Fish size ranged from 8 to 1543 g wet weight. The intake formulae above require consideration of fish tissue in dry weight, therefore, wet weight fish tissues were converted to dry weight (Attachment 1).
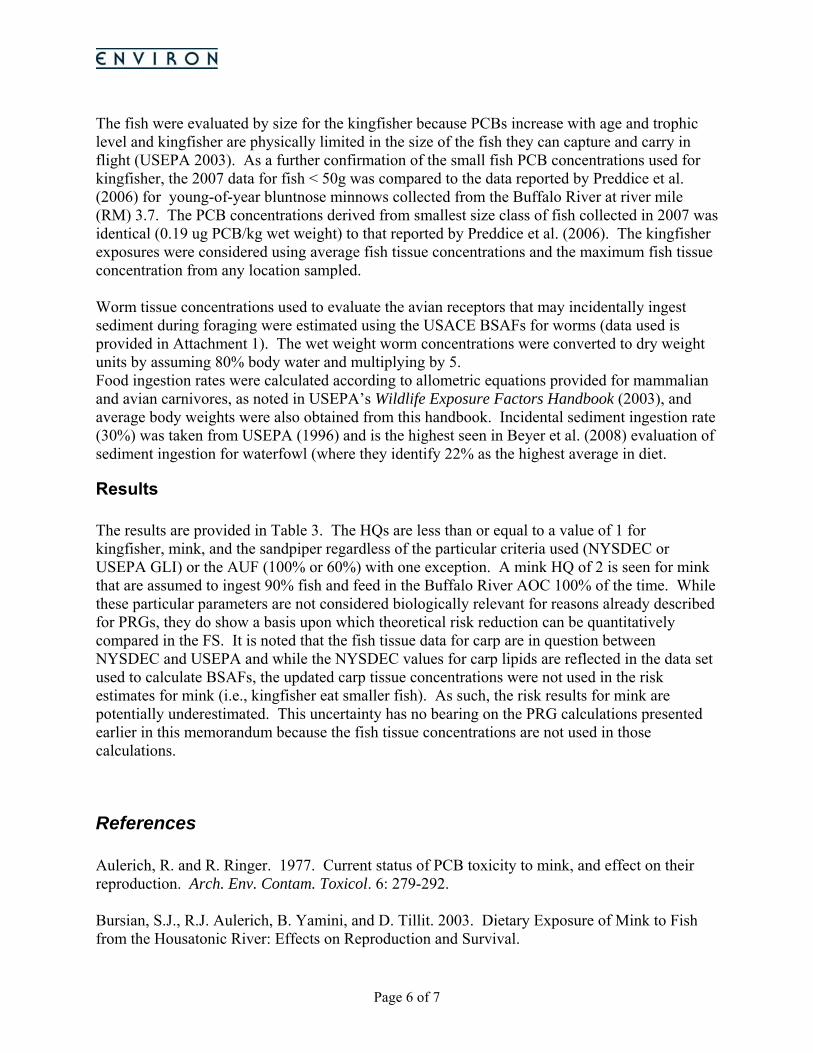
Page 6 of 7
The fish were evaluated by size for the kingfisher because PCBs increase with age and trophic level and kingfisher are physically limited in the size of the fish they can capture and carry in flight (USEPA 2003). As a further confirmation of the small fish PCB concentrations used for kingfisher, the 2007 data for fish < 50g was compared to the data reported by Preddice et al. (2006) for young-of-year bluntnose minnows collected from the Buffalo River at river mile (RM) 3.7. The PCB concentrations derived from smallest size class of fish collected in 2007 was identical (0.19 ug PCB/kg wet weight) to that reported by Preddice et al. (2006). The kingfisher exposures were considered using average fish tissue concentrations and the maximum fish tissue concentration from any location sampled. Worm tissue concentrations used to evaluate the avian receptors that may incidentally ingest sediment during foraging were estimated using the USACE BSAFs for worms (data used is provided in Attachment 1). The wet weight worm concentrations were converted to dry weight units by assuming 80% body water and multiplying by 5. Food ingestion rates were calculated according to allometric equations provided for mammalian and avian carnivores, as noted in USEPA’s Wildlife Exposure Factors Handbook (2003), and average body weights were also obtained from this handbook. Incidental sediment ingestion rate (30%) was taken from USEPA (1996) and is the highest seen in Beyer et al. (2008) evaluation of sediment ingestion for waterfowl (where they identify 22% as the highest average in diet.
Results The results are provided in Table 3. The HQs are less than or equal to a value of 1 for kingfisher, mink, and the sandpiper regardless of the particular criteria used (NYSDEC or USEPA GLI) or the AUF (100% or 60%) with one exception. A mink HQ of 2 is seen for mink that are assumed to ingest 90% fish and feed in the Buffalo River AOC 100% of the time. While these particular parameters are not considered biologically relevant for reasons already described for PRGs, they do show a basis upon which theoretical risk reduction can be quantitatively compared in the FS. It is noted that the fish tissue data for carp are in question between NYSDEC and USEPA and while the NYSDEC values for carp lipids are reflected in the data set used to calculate BSAFs, the updated carp tissue concentrations were not used in the risk estimates for mink (i.e., kingfisher eat smaller fish). As such, the risk results for mink are potentially underestimated. This uncertainty has no bearing on the PRG calculations presented earlier in this memorandum because the fish tissue concentrations are not used in those calculations.
References Aulerich, R. and R. Ringer. 1977. Current status of PCB toxicity to mink, and effect on their reproduction. Arch. Env. Contam. Toxicol. 6: 279-292. Bursian, S.J., R.J. Aulerich, B. Yamini, and D. Tillit. 2003. Dietary Exposure of Mink to Fish from the Housatonic River: Effects on Reproduction and Survival.
Page 7 of 7
http://epa.gov/region1/ge/thesite/restofriver/reports/final_era/SupportingInformation%20and%20Studies%20for%20the%20HousatonicRiverProject/Dietary%20Exposure%20of%20Mink.pdf; also published in Environmental Toxicology and Chemistry. NYSDEC. 1987. Niagara River Biota Contamination Project: Fish Flesh Criteria for Piscivorous Wildlife. Tech. Rpt 87-3, Div. Fish Wildlife. pp. 136. NYSEC. 1994. Fish and Wildlife Impact Analysis (FWIA) for Inactive Hazardous Waste Sites. Division of Fish and Wildlife. October. NYSDEC. 2007. Fish Tissue Collection for the Buffalo River AOC. Preddice, T., L. Skinner, and A. Gudlewski. 2006. PCBs and Organochorine Pesticide Residue in Young-of-Year Fish from Traditional Near-Shore Sampling Areas, NYS’s Great Lakes Basin, 2003. USACE. 2003. Sediment sampling, biological analyses, and chemical analyses for Buffalo River area of concern, Buffalo, New York. Vol. 1 and 2. Vicksburg, MS. USEPA. 1993. Wildlife Exposure Factors Handbook. Office of Research and Development. EPA/600/R-93/187. http://cfpub.epa.gov/ncea/cfm/wefh.cfm USEPA. 1995. Great Lakes Water Quality Initiative Criteria Documents for the Protection of Wildlife. EPA-82-B-95-008.
USEPA. 1997. Ecological Risk Assessment Guidance for Superfund: Process for Designing and Conducting Ecological Risk Assessments. Interim Final. Solid Waste and Emergency Response. EPA 540-R-97-006.
USEPA. 2004. Hudson River PCB Site New York: Second Record of Decision. www.epa.gov/hudson/RecordofDecision-text.pdf USEPA. 2006. USEPA. 2006. Interim media protection goals proposal for the Housatonic River, rest of river. March 9, 2006. http://www.epa.gov/region01/ge/thesite/restofriver/reports/impg/248143.pdf USFWS. 1984. Habitat Suitability Index Model: Mink. FWS/OBS-88/10.61 Revised. May.
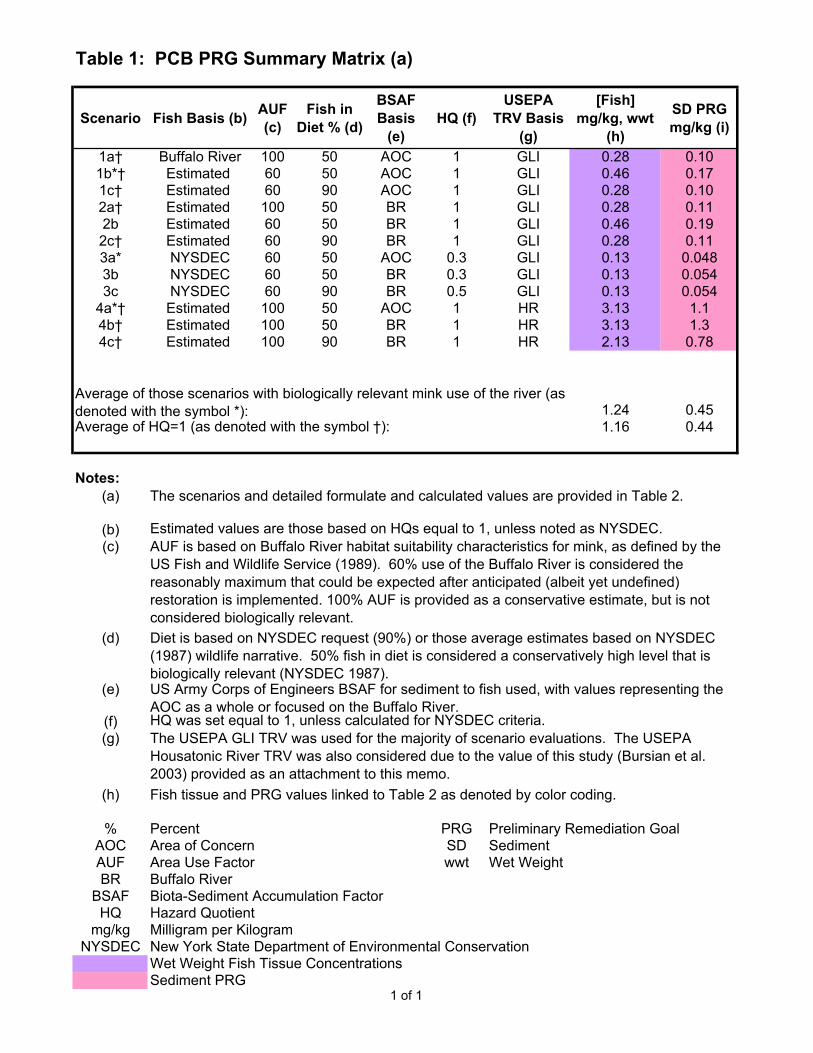
Table 1: PCB PRG Summary Matrix (a)
Scenario Fish Basis (b) AUF (c)
Fish in Diet % (d)
BSAF Basis
(e)HQ (f)
USEPA TRV Basis
(g)
[Fish] mg/kg, wwt
(h)
SD PRG mg/kg (i)
1a† Buffalo River 100 50 AOC 1 GLI 0.28 0.101b*† Estimated 60 50 AOC 1 GLI 0.46 0.171c† Estimated 60 90 AOC 1 GLI 0.28 0.102a† Estimated 100 50 BR 1 GLI 0.28 0.112b Estimated 60 50 BR 1 GLI 0.46 0.192c† Estimated 60 90 BR 1 GLI 0.28 0.113a* NYSDEC 60 50 AOC 0.3 GLI 0.13 0.0483b NYSDEC 60 50 BR 0.3 GLI 0.13 0.0543c NYSDEC 60 90 BR 0.5 GLI 0.13 0.054
4a*† Estimated 100 50 AOC 1 HR 3.13 1.14b† Estimated 100 50 BR 1 HR 3.13 1.34c† Estimated 100 90 BR 1 HR 2.13 0.78
1.24 0.45Average of HQ=1 (as denoted with the symbol †): 1.16 0.44
Notes:(a)
(b) Estimated values are those based on HQs equal to 1, unless noted as NYSDEC.(c)
(d)
(e)
(f) HQ was set equal to 1, unless calculated for NYSDEC criteria.(g)
(h)
% Percent PRG Preliminary Remediation GoalAOC Area of Concern SD SedimentAUF Area Use Factor wwt Wet WeightBR Buffalo River
BSAF Biota-Sediment Accumulation FactorHQ Hazard Quotient
mg/kg Milligram per KilogramNYSDEC New York State Department of Environmental Conservation
Wet Weight Fish Tissue ConcentrationsSediment PRG
Fish tissue and PRG values linked to Table 2 as denoted by color coding.
US Army Corps of Engineers BSAF for sediment to fish used, with values representing the AOC as a whole or focused on the Buffalo River.
The USEPA GLI TRV was used for the majority of scenario evaluations. The USEPA Housatonic River TRV was also considered due to the value of this study (Bursian et al. 2003) provided as an attachment to this memo.
Average of those scenarios with biologically relevant mink use of the river (as denoted with the symbol *):
The scenarios and detailed formulate and calculated values are provided in Table 2.
Diet is based on NYSDEC request (90%) or those average estimates based on NYSDEC (1987) wildlife narrative. 50% fish in diet is considered a conservatively high level that is biologically relevant (NYSDEC 1987).
AUF is based on Buffalo River habitat suitability characteristics for mink, as defined by the US Fish and Wildlife Service (1989). 60% use of the Buffalo River is considered the reasonably maximum that could be expected after anticipated (albeit yet undefined) restoration is implemented. 100% AUF is provided as a conservative estimate, but is not considered biologically relevant.
1 of 1
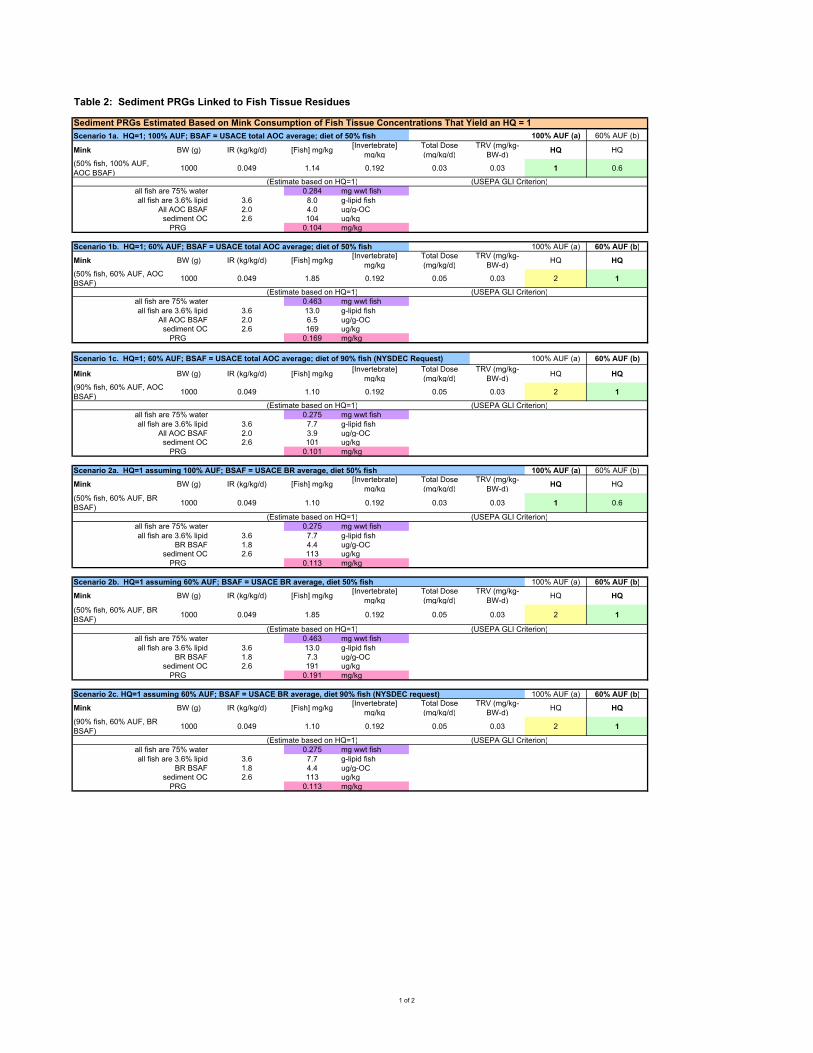
Table 2: Sediment PRGs Linked to Fish Tissue Residues
Scenario 1a. HQ=1; 100% AUF; BSAF = USACE total AOC average; diet of 50% fish 100% AUF (a) 60% AUF (b)
Mink BW (g) IR (kg/kg/d) [Fish] mg/kg[Invertebrate]
mg/kgTotal Dose (mg/kg/d)
TRV (mg/kg-BW-d)
HQ HQ
(50% fish, 100% AUF, AOC BSAF)
1000 0.049 1.14 0.192 0.03 0.03 1 0.6
(Estimate based on HQ=1) (USEPA GLI Criterion)all fish are 75% water 0.284 mg wwt fishall fish are 3.6% lipid 3.6 8.0 g-lipid fish
All AOC BSAF 2.0 4.0 ug/g-OCsediment OC 2.6 104 ug/kg
PRG 0.104 mg/kg
Scenario 1b. HQ=1; 60% AUF; BSAF = USACE total AOC average; diet of 50% fish 100% AUF (a) 60% AUF (b)
Mink BW (g) IR (kg/kg/d) [Fish] mg/kg[Invertebrate]
mg/kgTotal Dose (mg/kg/d)
TRV (mg/kg-BW-d)
HQ HQ
(50% fish, 60% AUF, AOC BSAF)
1000 0.049 1.85 0.192 0.05 0.03 2 1
(Estimate based on HQ=1) (USEPA GLI Criterion)all fish are 75% water 0.463 mg wwt fishall fish are 3.6% lipid 3.6 13.0 g-lipid fish
All AOC BSAF 2.0 6.5 ug/g-OCsediment OC 2.6 169 ug/kg
PRG 0.169 mg/kg
Scenario 1c. HQ=1; 60% AUF; BSAF = USACE total AOC average; diet of 90% fish (NYSDEC Request) 100% AUF (a) 60% AUF (b)
Mink BW (g) IR (kg/kg/d) [Fish] mg/kg[Invertebrate]
mg/kgTotal Dose (mg/kg/d)
TRV (mg/kg-BW-d)
HQ HQ
(90% fish, 60% AUF, AOC BSAF)
1000 0.049 1.10 0.192 0.05 0.03 2 1
(Estimate based on HQ=1) (USEPA GLI Criterion)all fish are 75% water 0.275 mg wwt fishall fish are 3.6% lipid 3.6 7.7 g-lipid fish
All AOC BSAF 2.0 3.9 ug/g-OCsediment OC 2.6 101 ug/kg
PRG 0.101 mg/kg
Scenario 2a. HQ=1 assuming 100% AUF; BSAF = USACE BR average, diet 50% fish 100% AUF (a) 60% AUF (b)
Mink BW (g) IR (kg/kg/d) [Fish] mg/kg[Invertebrate]
mg/kgTotal Dose (mg/kg/d)
TRV (mg/kg-BW-d)
HQ HQ
(50% fish, 60% AUF, BR BSAF)
1000 0.049 1.10 0.192 0.03 0.03 1 0.6
(Estimate based on HQ=1) (USEPA GLI Criterion)all fish are 75% water 0.275 mg wwt fishall fish are 3.6% lipid 3.6 7.7 g-lipid fish
BR BSAF 1.8 4.4 ug/g-OCsediment OC 2.6 113 ug/kg
PRG 0.113 mg/kg
Scenario 2b. HQ=1 assuming 60% AUF; BSAF = USACE BR average, diet 50% fish 100% AUF (a) 60% AUF (b)
Mink BW (g) IR (kg/kg/d) [Fish] mg/kg[Invertebrate]
mg/kgTotal Dose (mg/kg/d)
TRV (mg/kg-BW-d)
HQ HQ
(50% fish, 60% AUF, BR BSAF)
1000 0.049 1.85 0.192 0.05 0.03 2 1
(Estimate based on HQ=1) (USEPA GLI Criterion)all fish are 75% water 0.463 mg wwt fishall fish are 3.6% lipid 3.6 13.0 g-lipid fish
BR BSAF 1.8 7.3 ug/g-OCsediment OC 2.6 191 ug/kg
PRG 0.191 mg/kg
Scenario 2c. HQ=1 assuming 60% AUF; BSAF = USACE BR average, diet 90% fish (NYSDEC request) 100% AUF (a) 60% AUF (b)
Mink BW (g) IR (kg/kg/d) [Fish] mg/kg[Invertebrate]
mg/kgTotal Dose (mg/kg/d)
TRV (mg/kg-BW-d)
HQ HQ
(90% fish, 60% AUF, BR BSAF)
1000 0.049 1.10 0.192 0.05 0.03 2 1
(Estimate based on HQ=1) (USEPA GLI Criterion)all fish are 75% water 0.275 mg wwt fishall fish are 3.6% lipid 3.6 7.7 g-lipid fish
BR BSAF 1.8 4.4 ug/g-OCsediment OC 2.6 113 ug/kg
PRG 0.113 mg/kg
Sediment PRGs Estimated Based on Mink Consumption of Fish Tissue Concentrations That Yield an HQ = 1
1 of 2
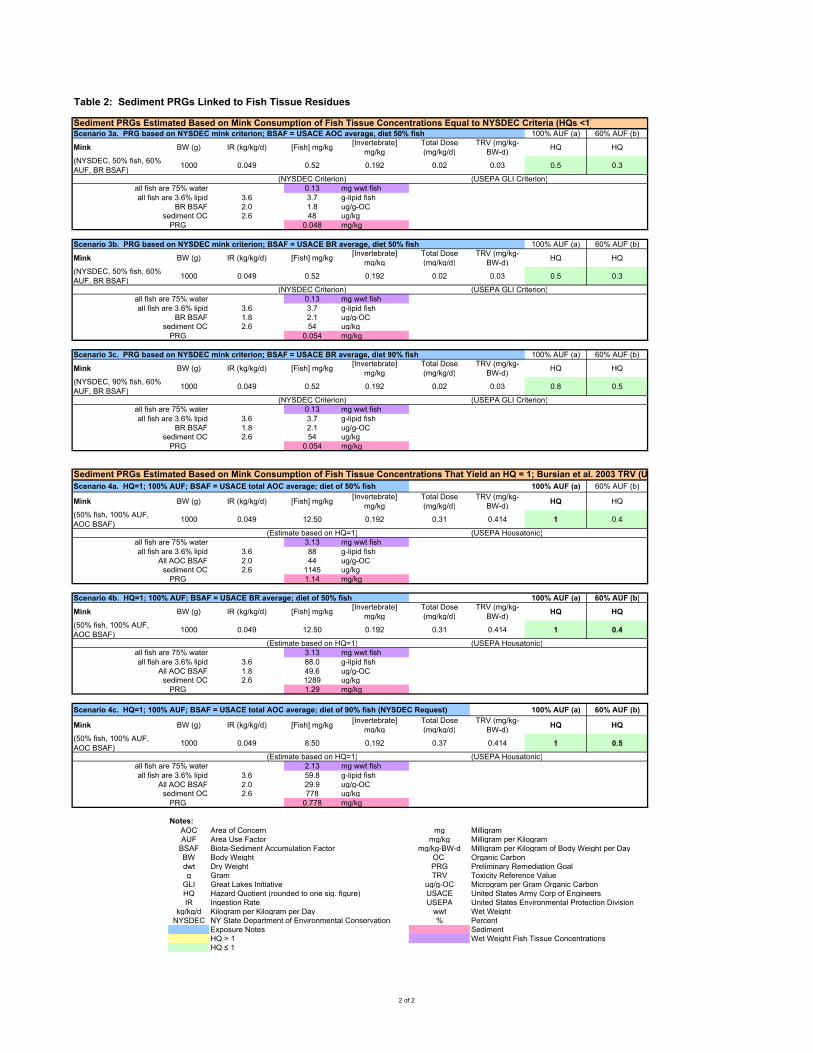
Table 2: Sediment PRGs Linked to Fish Tissue Residues
Scenario 3a. PRG based on NYSDEC mink criterion; BSAF = USACE AOC average, diet 50% fish 100% AUF (a) 60% AUF (b)
Mink BW (g) IR (kg/kg/d) [Fish] mg/kg[Invertebrate]
mg/kgTotal Dose (mg/kg/d)
TRV (mg/kg-BW-d)
HQ HQ
(NYSDEC, 50% fish, 60% AUF, BR BSAF)
1000 0.049 0.52 0.192 0.02 0.03 0.5 0.3
(NYSDEC Criterion) (USEPA GLI Criterion)all fish are 75% water 0.13 mg wwt fishall fish are 3.6% lipid 3.6 3.7 g-lipid fish
BR BSAF 2.0 1.8 ug/g-OCsediment OC 2.6 48 ug/kg
PRG 0.048 mg/kg
Scenario 3b. PRG based on NYSDEC mink criterion; BSAF = USACE BR average, diet 50% fish 100% AUF (a) 60% AUF (b)
Mink BW (g) IR (kg/kg/d) [Fish] mg/kg[Invertebrate]
mg/kgTotal Dose (mg/kg/d)
TRV (mg/kg-BW-d)
HQ HQ
(NYSDEC, 50% fish, 60% AUF, BR BSAF)
1000 0.049 0.52 0.192 0.02 0.03 0.5 0.3
(NYSDEC Criterion) (USEPA GLI Criterion)all fish are 75% water 0.13 mg wwt fishall fish are 3.6% lipid 3.6 3.7 g-lipid fish
BR BSAF 1.8 2.1 ug/g-OCsediment OC 2.6 54 ug/kg
PRG 0.054 mg/kg
Scenario 3c. PRG based on NYSDEC mink criterion; BSAF = USACE BR average, diet 90% fish 100% AUF (a) 60% AUF (b)
Mink BW (g) IR (kg/kg/d) [Fish] mg/kg[Invertebrate]
mg/kgTotal Dose (mg/kg/d)
TRV (mg/kg-BW-d)
HQ HQ
(NYSDEC, 90% fish, 60% AUF, BR BSAF)
1000 0.049 0.52 0.192 0.02 0.03 0.8 0.5
(NYSDEC Criterion) (USEPA GLI Criterion)all fish are 75% water 0.13 mg wwt fishall fish are 3.6% lipid 3.6 3.7 g-lipid fish
BR BSAF 1.8 2.1 ug/g-OCsediment OC 2.6 54 ug/kg
PRG 0.054 mg/kg
Scenario 4a. HQ=1; 100% AUF; BSAF = USACE total AOC average; diet of 50% fish 100% AUF (a) 60% AUF (b)
Mink BW (g) IR (kg/kg/d) [Fish] mg/kg[Invertebrate]
mg/kgTotal Dose (mg/kg/d)
TRV (mg/kg-BW-d)
HQ HQ
(50% fish, 100% AUF, AOC BSAF)
1000 0.049 12.50 0.192 0.31 0.414 1 0.4
(Estimate based on HQ=1) (USEPA Housatonic)all fish are 75% water 3.13 mg wwt fishall fish are 3.6% lipid 3.6 88 g-lipid fish
All AOC BSAF 2.0 44 ug/g-OCsediment OC 2.6 1145 ug/kg
PRG 1.14 mg/kg
Scenario 4b. HQ=1; 100% AUF; BSAF = USACE BR average; diet of 50% fish 100% AUF (a) 60% AUF (b)
Mink BW (g) IR (kg/kg/d) [Fish] mg/kg[Invertebrate]
mg/kgTotal Dose (mg/kg/d)
TRV (mg/kg-BW-d)
HQ HQ
(50% fish, 100% AUF, AOC BSAF)
1000 0.049 12.50 0.192 0.31 0.414 1 0.4
(Estimate based on HQ=1) (USEPA Housatonic)all fish are 75% water 3.13 mg wwt fishall fish are 3.6% lipid 3.6 88.0 g-lipid fish
All AOC BSAF 1.8 49.6 ug/g-OCsediment OC 2.6 1289 ug/kg
PRG 1.29 mg/kg
Scenario 4c. HQ=1; 100% AUF; BSAF = USACE total AOC average; diet of 90% fish (NYSDEC Request) 100% AUF (a) 60% AUF (b)
Mink BW (g) IR (kg/kg/d) [Fish] mg/kg[Invertebrate]
mg/kgTotal Dose (mg/kg/d)
TRV (mg/kg-BW-d)
HQ HQ
(50% fish, 100% AUF, AOC BSAF)
1000 0.049 8.50 0.192 0.37 0.414 1 0.5
(Estimate based on HQ=1) (USEPA Housatonic)all fish are 75% water 2.13 mg wwt fishall fish are 3.6% lipid 3.6 59.8 g-lipid fish
All AOC BSAF 2.0 29.9 ug/g-OCsediment OC 2.6 778 ug/kg
PRG 0.778 mg/kg
Notes:AOC Area of Concern mg MilligramAUF Area Use Factor mg/kg Milligram per Kilogram
BSAF Biota-Sediment Accumulation Factor mg/kg-BW-d Milligram per Kilogram of Body Weight per DayBW Body Weight OC Organic Carbondwt Dry Weight PRG Preliminary Remediation Goalg Gram TRV Toxicity Reference Value
GLI Great Lakes Initiative ug/g-OC Microgram per Gram Organic CarbonHQ Hazard Quotient (rounded to one sig. figure) USACE United States Army Corp of EngineersIR Ingestion Rate USEPA United States Environmental Protection Division
kg/kg/d Kilogram per Kilogram per Day wwt Wet WeightNYSDEC NY State Department of Environmental Conservation % Percent
Exposure Notes SedimentHQ > 1 Wet Weight Fish Tissue ConcentrationsHQ ≤ 1
Sediment PRGs Estimated Based on Mink Consumption of Fish Tissue Concentrations Equal to NYSDEC Criteria (HQs <1)
Sediment PRGs Estimated Based on Mink Consumption of Fish Tissue Concentrations That Yield an HQ = 1; Bursian et al. 2003 TRV (U
2 of 2
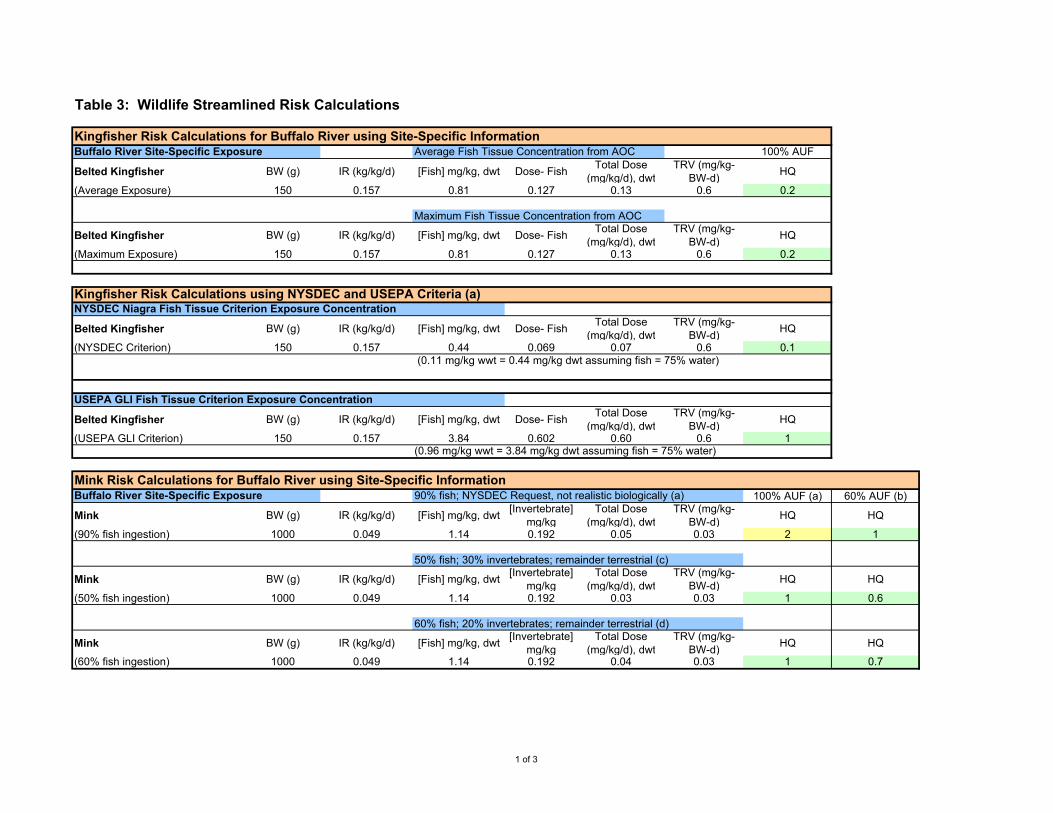
Table 3: Wildlife Streamlined Risk Calculations
Buffalo River Site-Specific Exposure Average Fish Tissue Concentration from AOC 100% AUF
Belted Kingfisher BW (g) IR (kg/kg/d) [Fish] mg/kg, dwt Dose- FishTotal Dose
(mg/kg/d), dwtTRV (mg/kg-
BW-d)HQ
(Average Exposure) 150 0.157 0.81 0.127 0.13 0.6 0.2
Maximum Fish Tissue Concentration from AOC
Belted Kingfisher BW (g) IR (kg/kg/d) [Fish] mg/kg, dwt Dose- FishTotal Dose
(mg/kg/d), dwtTRV (mg/kg-
BW-d)HQ
(Maximum Exposure) 150 0.157 0.81 0.127 0.13 0.6 0.2
NYSDEC Niagra Fish Tissue Criterion Exposure Concentration
Belted Kingfisher BW (g) IR (kg/kg/d) [Fish] mg/kg, dwt Dose- FishTotal Dose
(mg/kg/d), dwtTRV (mg/kg-
BW-d)HQ
(NYSDEC Criterion) 150 0.157 0.44 0.069 0.07 0.6 0.1(0.11 mg/kg wwt = 0.44 mg/kg dwt assuming fish = 75% water)
USEPA GLI Fish Tissue Criterion Exposure Concentration
Belted Kingfisher BW (g) IR (kg/kg/d) [Fish] mg/kg, dwt Dose- FishTotal Dose
(mg/kg/d), dwtTRV (mg/kg-
BW-d)HQ
(USEPA GLI Criterion) 150 0.157 3.84 0.602 0.60 0.6 1(0.96 mg/kg wwt = 3.84 mg/kg dwt assuming fish = 75% water)
Buffalo River Site-Specific Exposure 90% fish; NYSDEC Request, not realistic biologically (a) 100% AUF (a) 60% AUF (b)
Mink BW (g) IR (kg/kg/d) [Fish] mg/kg, dwt[Invertebrate]
mg/kgTotal Dose
(mg/kg/d), dwtTRV (mg/kg-
BW-d)HQ HQ
(90% fish ingestion) 1000 0.049 1.14 0.192 0.05 0.03 2 1
50% fish; 30% invertebrates; remainder terrestrial (c)
Mink BW (g) IR (kg/kg/d) [Fish] mg/kg, dwt[Invertebrate]
mg/kgTotal Dose
(mg/kg/d), dwtTRV (mg/kg-
BW-d)HQ HQ
(50% fish ingestion) 1000 0.049 1.14 0.192 0.03 0.03 1 0.6
60% fish; 20% invertebrates; remainder terrestrial (d)
Mink BW (g) IR (kg/kg/d) [Fish] mg/kg, dwt[Invertebrate]
mg/kgTotal Dose
(mg/kg/d), dwtTRV (mg/kg-
BW-d)HQ HQ
(60% fish ingestion) 1000 0.049 1.14 0.192 0.04 0.03 1 0.7
Kingfisher Risk Calculations for Buffalo River using Site-Specific Information
Kingfisher Risk Calculations using NYSDEC and USEPA Criteria (a)
Mink Risk Calculations for Buffalo River using Site-Specific Information
1 of 3
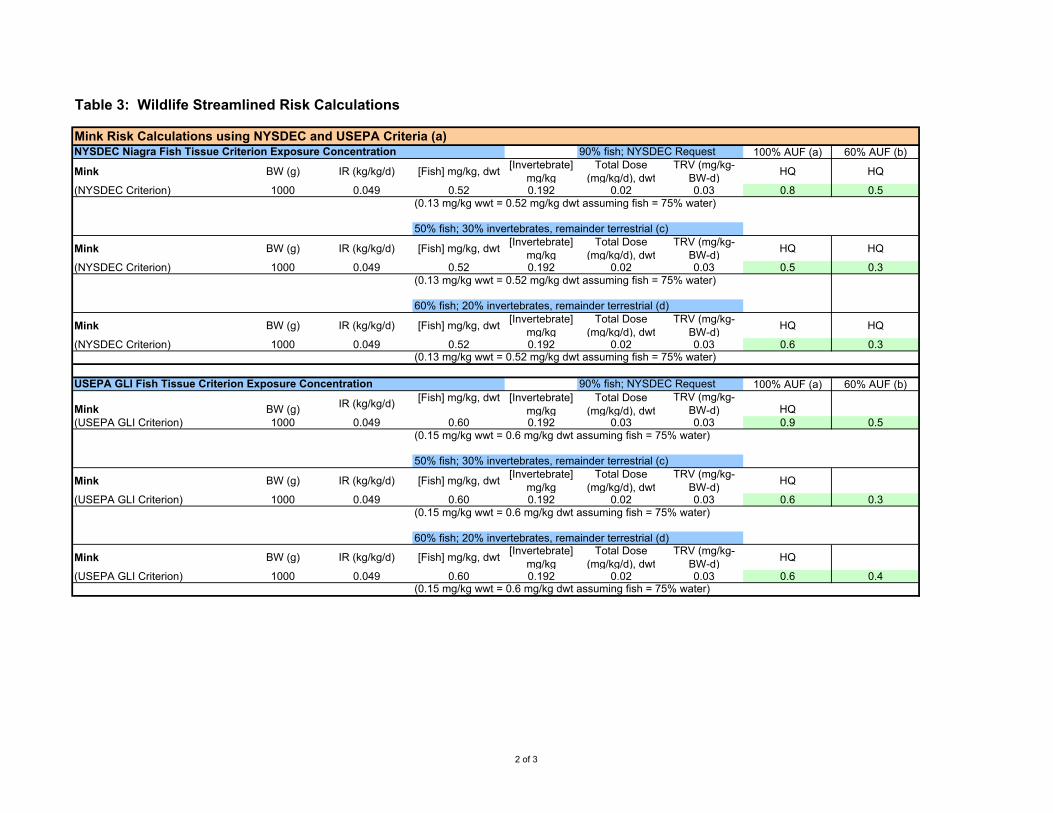
Table 3: Wildlife Streamlined Risk Calculations
NYSDEC Niagra Fish Tissue Criterion Exposure Concentration 90% fish; NYSDEC Request 100% AUF (a) 60% AUF (b)
Mink BW (g) IR (kg/kg/d) [Fish] mg/kg, dwt[Invertebrate]
mg/kgTotal Dose
(mg/kg/d), dwtTRV (mg/kg-
BW-d)HQ HQ
(NYSDEC Criterion) 1000 0.049 0.52 0.192 0.02 0.03 0.8 0.5(0.13 mg/kg wwt = 0.52 mg/kg dwt assuming fish = 75% water)
50% fish; 30% invertebrates, remainder terrestrial (c)
Mink BW (g) IR (kg/kg/d) [Fish] mg/kg, dwt[Invertebrate]
mg/kgTotal Dose
(mg/kg/d), dwtTRV (mg/kg-
BW-d)HQ HQ
(NYSDEC Criterion) 1000 0.049 0.52 0.192 0.02 0.03 0.5 0.3(0.13 mg/kg wwt = 0.52 mg/kg dwt assuming fish = 75% water)
60% fish; 20% invertebrates, remainder terrestrial (d)
Mink BW (g) IR (kg/kg/d) [Fish] mg/kg, dwt[Invertebrate]
mg/kgTotal Dose
(mg/kg/d), dwtTRV (mg/kg-
BW-d)HQ HQ
(NYSDEC Criterion) 1000 0.049 0.52 0.192 0.02 0.03 0.6 0.3(0.13 mg/kg wwt = 0.52 mg/kg dwt assuming fish = 75% water)
USEPA GLI Fish Tissue Criterion Exposure Concentration 90% fish; NYSDEC Request 100% AUF (a) 60% AUF (b)
Mink BW (g) IR (kg/kg/d)[Fish] mg/kg, dwt [Invertebrate]
mg/kgTotal Dose
(mg/kg/d), dwtTRV (mg/kg-
BW-d) HQ(USEPA GLI Criterion) 1000 0.049 0.60 0.192 0.03 0.03 0.9 0.5
(0.15 mg/kg wwt = 0.6 mg/kg dwt assuming fish = 75% water)
50% fish; 30% invertebrates, remainder terrestrial (c)
Mink BW (g) IR (kg/kg/d) [Fish] mg/kg, dwt[Invertebrate]
mg/kgTotal Dose
(mg/kg/d), dwtTRV (mg/kg-
BW-d)HQ
(USEPA GLI Criterion) 1000 0.049 0.60 0.192 0.02 0.03 0.6 0.3(0.15 mg/kg wwt = 0.6 mg/kg dwt assuming fish = 75% water)
60% fish; 20% invertebrates, remainder terrestrial (d)
Mink BW (g) IR (kg/kg/d) [Fish] mg/kg, dwt[Invertebrate]
mg/kgTotal Dose
(mg/kg/d), dwtTRV (mg/kg-
BW-d)HQ
(USEPA GLI Criterion) 1000 0.049 0.60 0.192 0.02 0.03 0.6 0.4(0.15 mg/kg wwt = 0.6 mg/kg dwt assuming fish = 75% water)
Mink Risk Calculations using NYSDEC and USEPA Criteria (a)
2 of 3
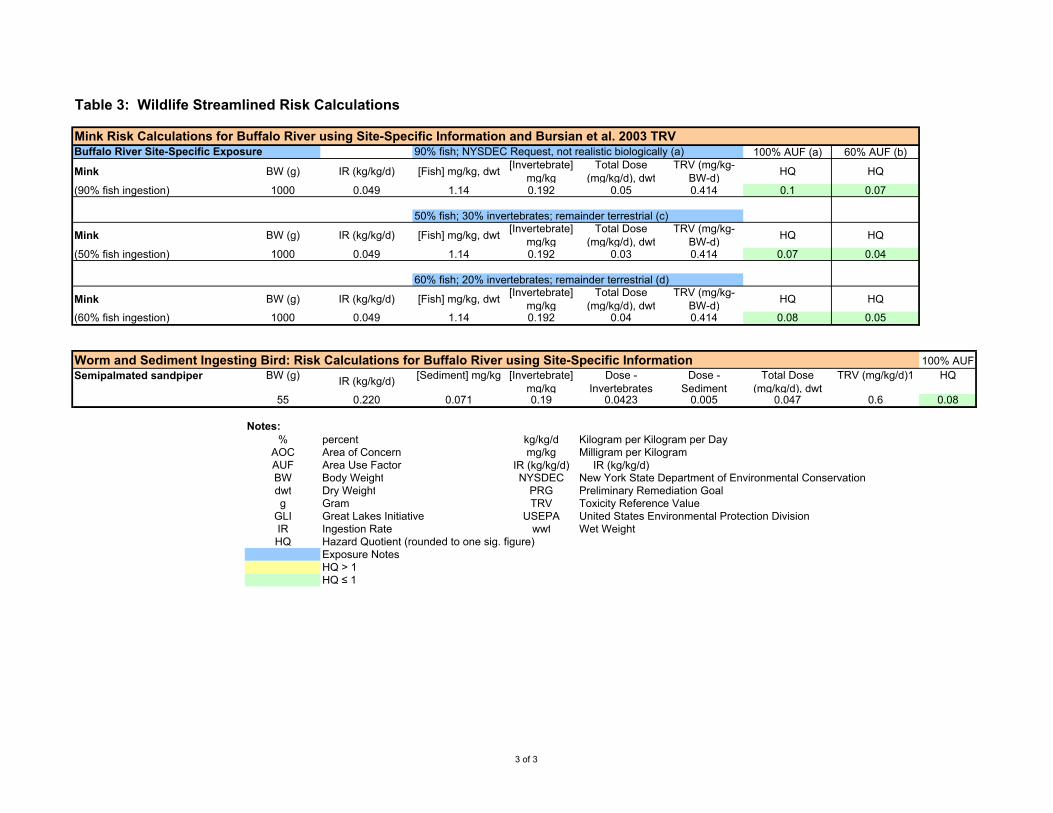
Table 3: Wildlife Streamlined Risk Calculations
Buffalo River Site-Specific Exposure 90% fish; NYSDEC Request, not realistic biologically (a) 100% AUF (a) 60% AUF (b)
Mink BW (g) IR (kg/kg/d) [Fish] mg/kg, dwt[Invertebrate]
mg/kgTotal Dose
(mg/kg/d), dwtTRV (mg/kg-
BW-d)HQ HQ
(90% fish ingestion) 1000 0.049 1.14 0.192 0.05 0.414 0.1 0.07
50% fish; 30% invertebrates; remainder terrestrial (c)
Mink BW (g) IR (kg/kg/d) [Fish] mg/kg, dwt[Invertebrate]
mg/kgTotal Dose
(mg/kg/d), dwtTRV (mg/kg-
BW-d)HQ HQ
(50% fish ingestion) 1000 0.049 1.14 0.192 0.03 0.414 0.07 0.04
60% fish; 20% invertebrates; remainder terrestrial (d)
Mink BW (g) IR (kg/kg/d) [Fish] mg/kg, dwt[Invertebrate]
mg/kgTotal Dose
(mg/kg/d), dwtTRV (mg/kg-
BW-d)HQ HQ
(60% fish ingestion) 1000 0.049 1.14 0.192 0.04 0.414 0.08 0.05
Worm and Sediment Ingesting Bird: Risk Calculations for Buffalo River using Site-Specific Information 100% AUFSemipalmated sandpiper BW (g)
IR (kg/kg/d)[Sediment] mg/kg [Invertebrate]
mg/kgDose -
InvertebratesDose -
SedimentTotal Dose
(mg/kg/d), dwtTRV (mg/kg/d)1 HQ
55 0.220 0.071 0.19 0.0423 0.005 0.047 0.6 0.08
Notes:% percent kg/kg/d Kilogram per Kilogram per Day
AOC Area of Concern mg/kg Milligram per KilogramAUF Area Use Factor IR (kg/kg/d) IR (kg/kg/d)BW Body Weight NYSDEC New York State Department of Environmental Conservationdwt Dry Weight PRG Preliminary Remediation Goalg Gram TRV Toxicity Reference Value
GLI Great Lakes Initiative USEPA United States Environmental Protection DivisionIR Ingestion Rate wwt Wet WeightHQ Hazard Quotient (rounded to one sig. figure)
Exposure NotesHQ > 1HQ ≤ 1
Mink Risk Calculations for Buffalo River using Site-Specific Information and Bursian et al. 2003 TRV
3 of 3
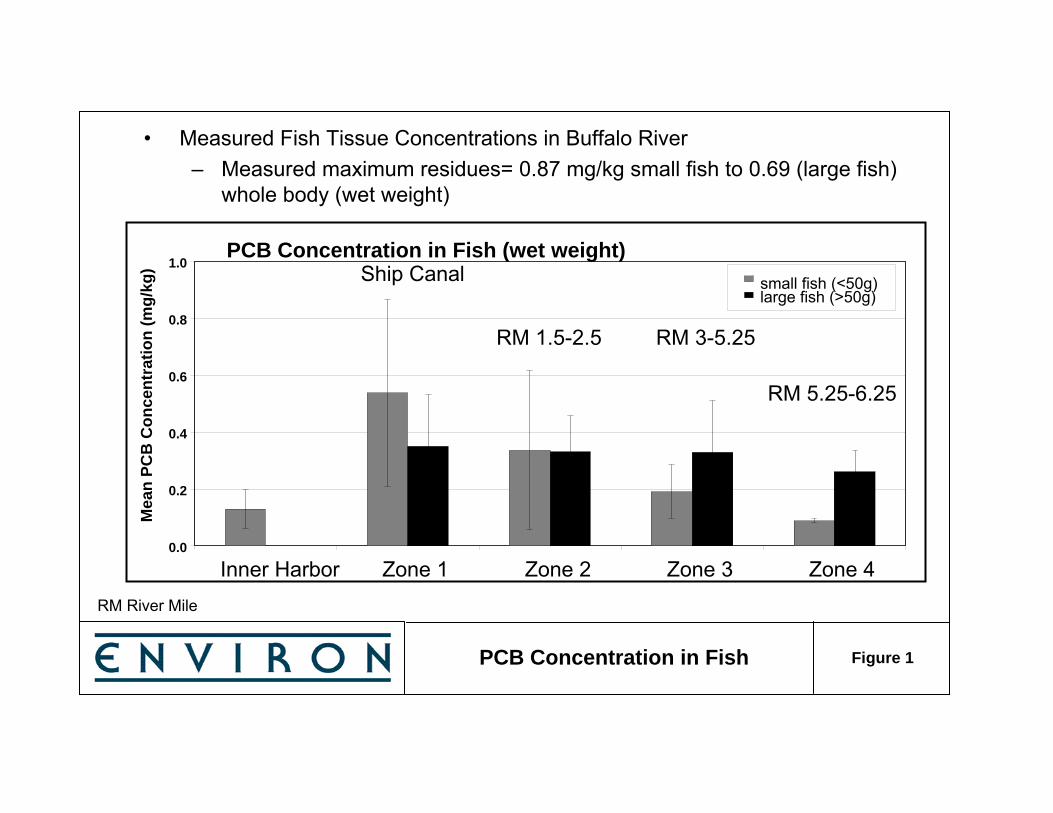
Figure 1PCB Concentration in Fish
PCB Concentration in Fish (wet weight)
0.0
0.2
0.4
0.6
0.8
1.0
Inner Harbor Zone 1 Zone 2 Zone 3 Zone 4
Mea
n P
CB
Co
nce
ntr
atio
n (
mg
/kg
)
small fish (<50g)large fish (>50g)
• Measured Fish Tissue Concentrations in Buffalo River– Measured maximum residues= 0.87 mg/kg small fish to 0.69 (large fish)
whole body (wet weight)
Ship Canal
RM 3-5.25
RM 5.25-6.25
RM 1.5-2.5
RM River Mile

Buffalo River Feasibility Study
D R A F T F I N A L
November 19, 2010
Appendix A3a PCB PRG Memorandum
Attachment 2
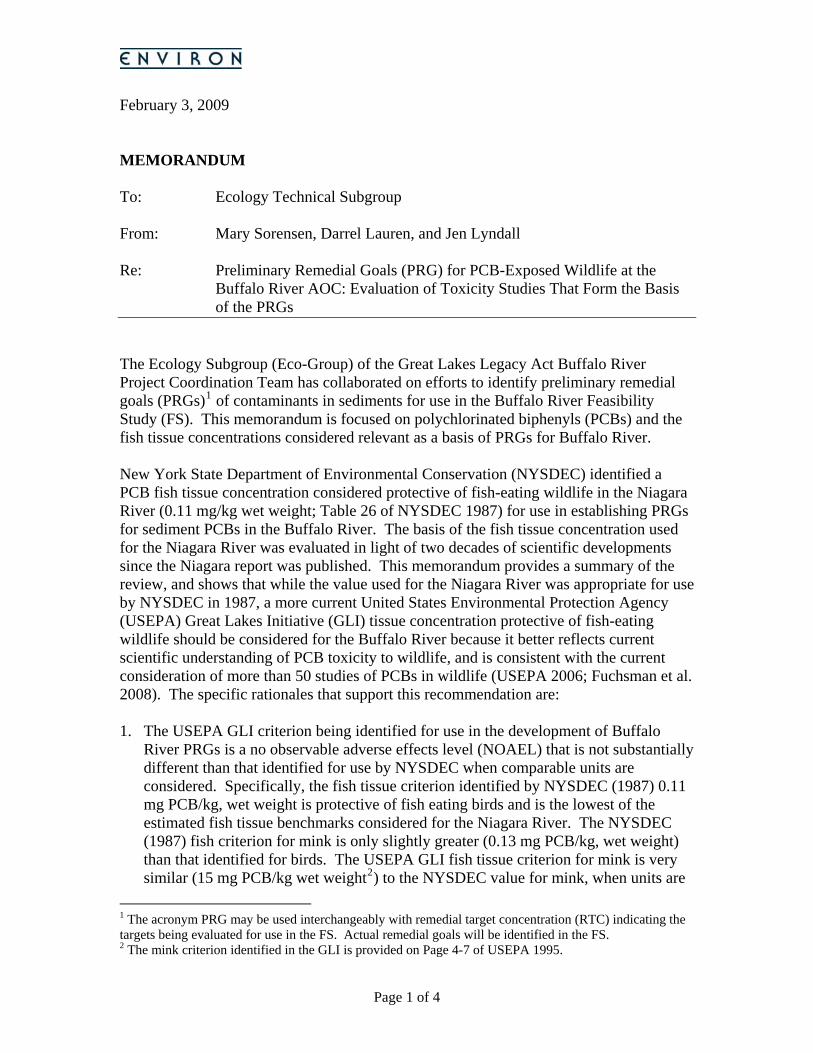
February 3, 2009 MEMORANDUM To: Ecology Technical Subgroup From: Mary Sorensen, Darrel Lauren, and Jen Lyndall Re: Preliminary Remedial Goals (PRG) for PCB-Exposed Wildlife at the
Buffalo River AOC: Evaluation of Toxicity Studies That Form the Basis of the PRGs
The Ecology Subgroup (Eco-Group) of the Great Lakes Legacy Act Buffalo River Project Coordination Team has collaborated on efforts to identify preliminary remedial goals (PRGs)1 of contaminants in sediments for use in the Buffalo River Feasibility Study (FS). This memorandum is focused on polychlorinated biphenyls (PCBs) and thefish tissue concentrations considered relevant as a basis of PRGs for Buffalo Rive
r.
New York State Department of Environmental Conservation (NYSDEC) identified a PCB fish tissue concentration considered protective of fish-eating wildlife in the Niagara River (0.11 mg/kg wet weight; Table 26 of NYSDEC 1987) for use in establishing PRGs for sediment PCBs in the Buffalo River. The basis of the fish tissue concentration used for the Niagara River was evaluated in light of two decades of scientific developments since the Niagara report was published. This memorandum provides a summary of the review, and shows that while the value used for the Niagara River was appropriate for use by NYSDEC in 1987, a more current United States Environmental Protection Agency (USEPA) Great Lakes Initiative (GLI) tissue concentration protective of fish-eating wildlife should be considered for the Buffalo River because it better reflects current scientific understanding of PCB toxicity to wildlife, and is consistent with the current consideration of more than 50 studies of PCBs in wildlife (USEPA 2006; Fuchsman et al. 2008). The specific rationales that support this recommendation are: 1. The USEPA GLI criterion being identified for use in the development of Buffalo
River PRGs is a no observable adverse effects level (NOAEL) that is not substantially different than that identified for use by NYSDEC when comparable units are considered. Specifically, the fish tissue criterion identified by NYSDEC (1987) 0.11 mg PCB/kg, wet weight is protective of fish eating birds and is the lowest of the estimated fish tissue benchmarks considered for the Niagara River. The NYSDEC (1987) fish criterion for mink is only slightly greater (0.13 mg PCB/kg, wet weight) than that identified for birds. The USEPA GLI fish tissue criterion for mink is very similar (15 mg PCB/kg wet weight2) to the NYSDEC value for mink, when units are
1 The acronym PRG may be used interchangeably with remedial target concentration (RTC) indicating the targets being evaluated for use in the FS. Actual remedial goals will be identified in the FS. 2 The mink criterion identified in the GLI is provided on Page 4-7 of USEPA 1995.
Page 1 of 4
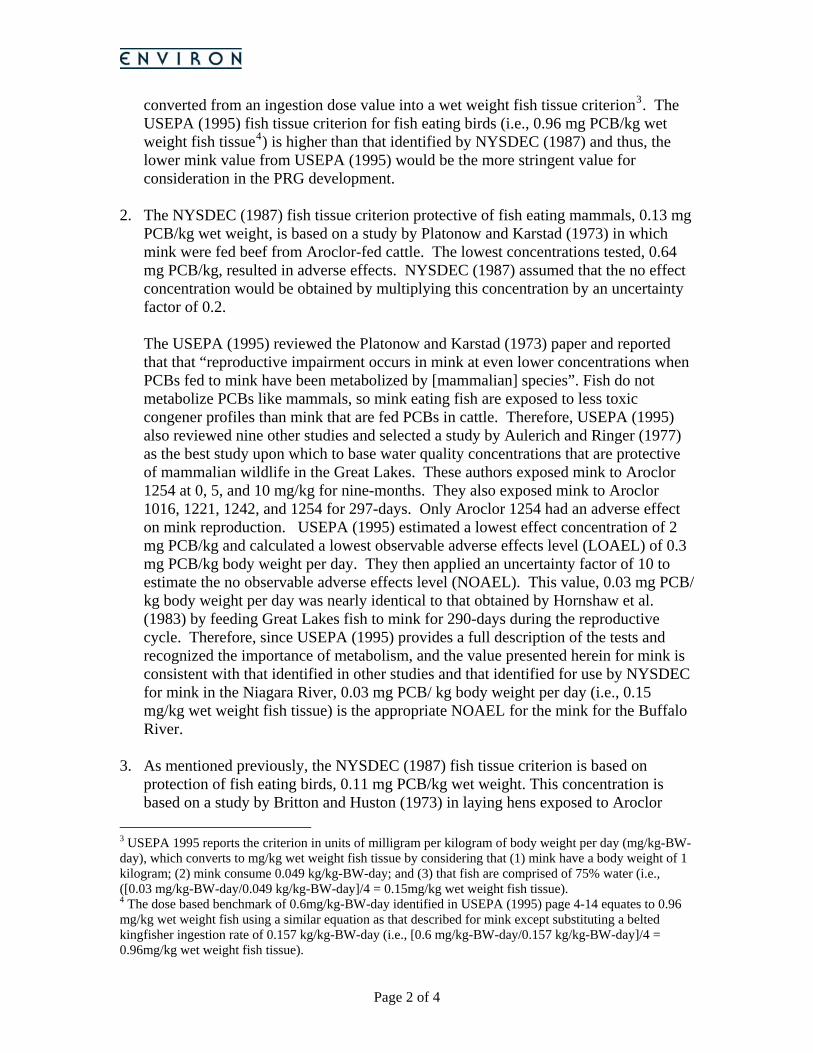
converted from an ingestion dose value into a wet weight fish tissue criterion3. The USEPA (1995) fish tissue criterion for fish eating birds (i.e., 0.96 mg PCB/kg wet weight fish tissue4) is higher than that identified by NYSDEC (1987) and thus, the lower mink value from USEPA (1995) would be the more stringent value for consideration in the PRG development.
2. The NYSDEC (1987) fish tissue criterion protective of fish eating mammals, 0.13 mg
PCB/kg wet weight, is based on a study by Platonow and Karstad (1973) in which mink were fed beef from Aroclor-fed cattle. The lowest concentrations tested, 0.64 mg PCB/kg, resulted in adverse effects. NYSDEC (1987) assumed that the no effect concentration would be obtained by multiplying this concentration by an uncertainty factor of 0.2.
The USEPA (1995) reviewed the Platonow and Karstad (1973) paper and reported that that “reproductive impairment occurs in mink at even lower concentrations when PCBs fed to mink have been metabolized by [mammalian] species”. Fish do not metabolize PCBs like mammals, so mink eating fish are exposed to less toxic congener profiles than mink that are fed PCBs in cattle. Therefore, USEPA (1995) also reviewed nine other studies and selected a study by Aulerich and Ringer (1977) as the best study upon which to base water quality concentrations that are protective of mammalian wildlife in the Great Lakes. These authors exposed mink to Aroclor 1254 at 0, 5, and 10 mg/kg for nine-months. They also exposed mink to Aroclor 1016, 1221, 1242, and 1254 for 297-days. Only Aroclor 1254 had an adverse effect on mink reproduction. USEPA (1995) estimated a lowest effect concentration of 2 mg PCB/kg and calculated a lowest observable adverse effects level (LOAEL) of 0.3 mg PCB/kg body weight per day. They then applied an uncertainty factor of 10 to estimate the no observable adverse effects level (NOAEL). This value, 0.03 mg PCB/ kg body weight per day was nearly identical to that obtained by Hornshaw et al. (1983) by feeding Great Lakes fish to mink for 290-days during the reproductive cycle. Therefore, since USEPA (1995) provides a full description of the tests and recognized the importance of metabolism, and the value presented herein for mink is consistent with that identified in other studies and that identified for use by NYSDEC for mink in the Niagara River, 0.03 mg PCB/ kg body weight per day (i.e., 0.15 mg/kg wet weight fish tissue) is the appropriate NOAEL for the mink for the Buffalo River.
3. As mentioned previously, the NYSDEC (1987) fish tissue criterion is based on
protection of fish eating birds, 0.11 mg PCB/kg wet weight. This concentration is based on a study by Britton and Huston (1973) in laying hens exposed to Aroclor
3 USEPA 1995 reports the criterion in units of milligram per kilogram of body weight per day (mg/kg-BW-day), which converts to mg/kg wet weight fish tissue by considering that (1) mink have a body weight of 1 kilogram; (2) mink consume 0.049 kg/kg-BW-day; and (3) that fish are comprised of 75% water (i.e., ([0.03 mg/kg-BW-day/0.049 kg/kg-BW-day]/4 = 0.15mg/kg wet weight fish tissue). 4 The dose based benchmark of 0.6mg/kg-BW-day identified in USEPA (1995) page 4-14 equates to 0.96 mg/kg wet weight fish using a similar equation as that described for mink except substituting a belted kingfisher ingestion rate of 0.157 kg/kg-BW-day (i.e., [0.6 mg/kg-BW-day/0.157 kg/kg-BW-day]/4 = 0.96mg/kg wet weight fish tissue).
Page 2 of 4
1242. NYSDEC (1987) report a NOAEL of 0.224 mg PCB/kg body weight per day and then divided this value by ten to account for the possibility that the kingfisher might be more sensitive than the chicken. This equates to an estimated fish tissue concentration of 0.11 mg PCB/kg wet weight.
USEPA (1995) reviewed chronic studies with birds but selected the study by Dahlgren et al. (1972) as the best study upon which to base water quality concentrations that are protective of avian wildlife in the Great Lakes. Dahlgren et al. (1972) administered Aroclor 1254 at 12.5 of 50 mg once a week by gelatin capsule to ring-necked pheasant for sixteen-weeks during the reproductive cycle. USEPA (1995) reported that no effects were found on egg fertility or chick growth at 12.5 mg/week. This study was selected in part because preference was given to studies with wildlife species, rather than chickens. USEPA (1995) calculated a LOAEL of 1.8 mg Aroclor 1254/kg body weight per day and used a 3-fold application factor because they considered that kingfisher may be more sensitive than pheasant, and an additional uncertainty factor of 3 to convert the LOAEL to a NOAEL of 0.2 mg Aroclor 1254/kg body weight per day. USEPA (1995) provides a description of these studies and calculated a NOAEL of 3.4 mg PCB/kg body weight per day. In 1987 and 1995, it was not known that Gallinaceous birds such as the chicken are the most sensitive species of birds tested (Karchner et al. 2006; Head 2008) and current practice does not add an additional application factor when applying these NOAELs to other avian species. For example, Head et al. (2008) reported that common tern are 260-fold less sensitive than chicken and American kestrel are 122 to 163-fold less sensitive chicken. Wood duck are >46-fold less sensitive than chicken. Therefore, no additional uncertainty factors should be applied to the avian NOAELs discussed above. This means that the NYSDEC (1987) LOAEL should have been 0.22 mg Aroclor 1254/kg body weight per day and the USEPA (1995) NOAEL should be 0.6 mg Aroclor 1254/kg body weight per day. Since USEPA (1995) provides a full description of these experiments, ENVIRON believes that 0.6 mg Aroclor 1254/kg body weight per day is the appropriate NOAEL for avian receptors. This value equates to 0.96 mg PCB/kg wet weight. It is worthy of note that the NYSDEC value of 0.22 mg Aroclor 1254/kg body weight per day equates to 0.35 mg/kg wet weight fish tissue (refer to previous footnotes for conversion factors and approaches), and thus is higher than the mink fish tissue criterion discussed earlier in this memo. Conclusions
Appropriate PRGs for the Buffalo River should be based on scientifically valid approaches, with consideration of regulatory precedent to the extent that such approaches used in the past reflect our current understanding of physical, chemical, and biological environment. This memorandum provides a detailed description of the rationales that support the use of mammalian and avian fish tissue criteria of 0.15 mg/kg and 0.96 mg/kg wet weight fish, respectively, for consideration of PRG development. The mink value in particular is very similar to that identified by NYSDEC for use in the Niagara River.
Page 3 of 4
Page 4 of 4
These values are based on studies cited for use in the Great Lakes (USEPA 1995) and reflect concentrations consistent with those being used as remedial targets in the Hudson and Housatonic Rivers (USEPA 2004; 2006). In addition, because the mixture of PCBs in the Buffalo River small fish most resembles 1242/1248 (i.e., 97% total PCB in small fish) and is approximately equally split in all fish (i.e., 54% of total PCBs), these fish tissue targets are considered highly conservative for both mammals and birds. The values described herein for mink and fish eating birds, will be considered for use in development of PRGs within a risk-based context. References Aulerich, R. and R. Ringer. 1977. Current status of PCB toxicity to mink, and effect on their reproduction. Arch. Env. Contam. Toxicol. 6: 279-292. Briton, W. and T. Huston. 1973. Influence of polychlorinated biphenyls in the laying hen. Poult. Sci. 52: 1620-1624. Dahlgren, R., R. Linder, and C. Carlson. 1972. Polychlorinated biphenyls: their effects on penned pheasants. Env. Hlth. Persps. 1: 89-101. Fuchsman, P.C., T.R. Barber, and M.J. Bock. 2008. Effectiveness of various exposure metrics in defining dose-response relationships for mink (mustela vison) exposed to polychlorinated biphenyls. AECT (2008) 54:130-144. Head, J., M. Hahn, and S. Kennedy. 2008. Key amino acids in aryl hydrocarbon receptor predict dioxin sensitivity in avian species. Env. Sci. Technol. 42: 7535-7541. Karchner, S., D. Franks, S. Kennedy, and M. Hahn. 2006. The molecular basis for differential dioxin sensitivity in birds: Role of the aryl hydrocarbon receptor. PNAS. 103: 6252-6257. NYSDEC. 1987. Niagara River Biota Contamination Project: Fish Flesh Criteria for Piscivorous Wildlife. Tech. Rpt 87-3, Div. Fish Wildlife. pp. 136. Platonow, N. and L. Karstad. 1973. Dietary effects of polychlorinated biphenyls on mink. Can. J. Comp. Med. 37: 391-400. USEPA. 1995. Great Lakes Water Quality Initiative Criteria Documents for the Protection of Wildlife. EPA-82-B-95-008. USEPA. 2004. Hudson River PCB Site New York: Second Record of Decision. www.epa.gov/hudson/RecordofDecision-text.pdf USEPA. 2006. USEPA. 2006. Interim media protection goals proposal for the Housatonic River, rest of river. March 9, 2006. http://www.epa.gov/region01/ge/thesite/restofriver/reports/impg/248143.pdf
Buffalo River Feasibility Study
D R A F T F I N A L
November 19, 2010
Appendix A3b PCB USACE Theoretical Bioaccumulation Potential
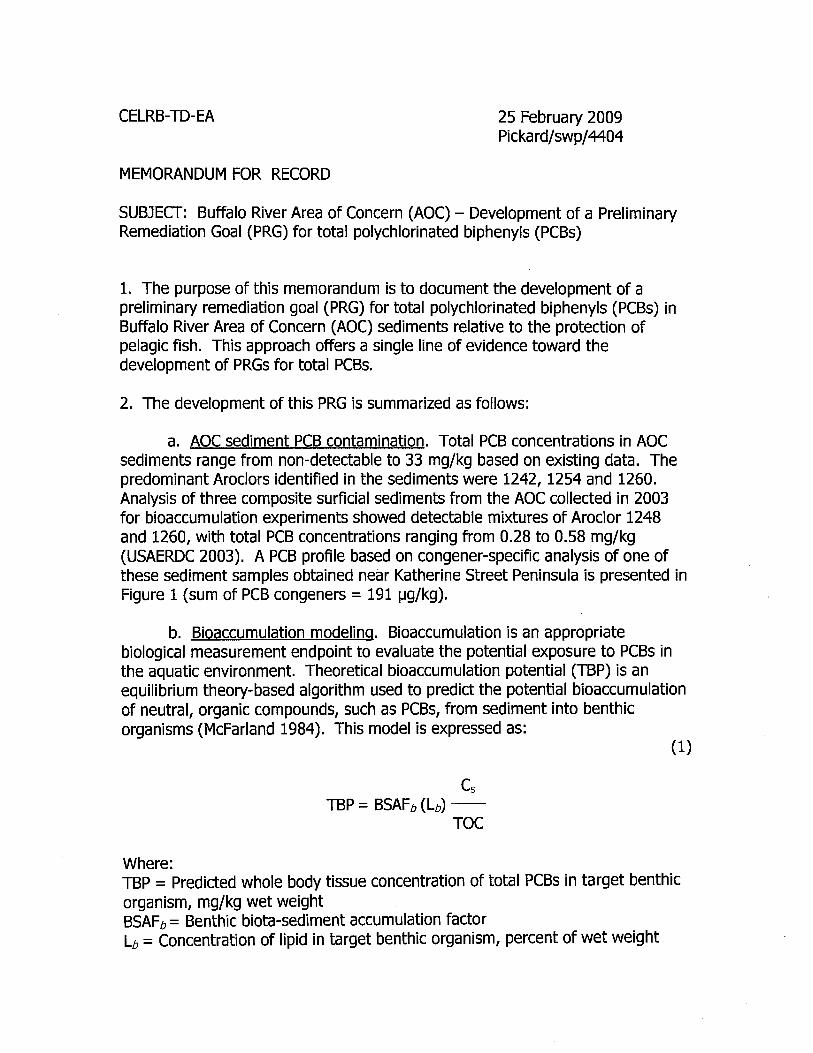
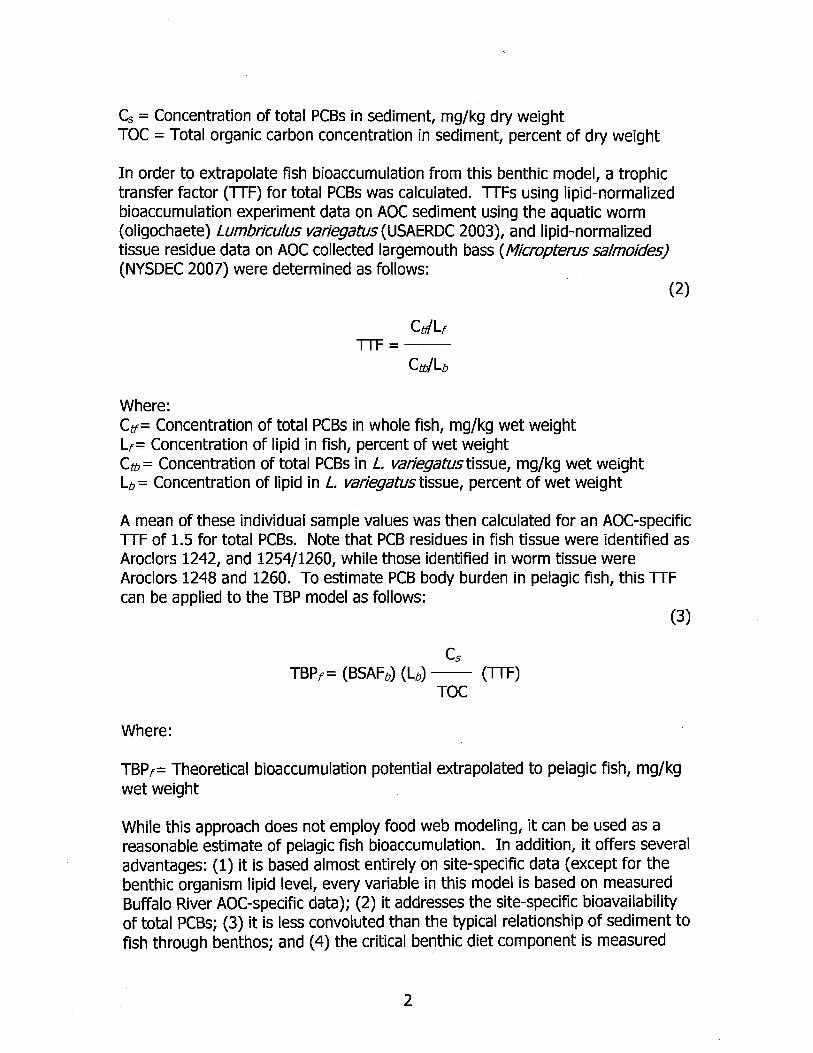

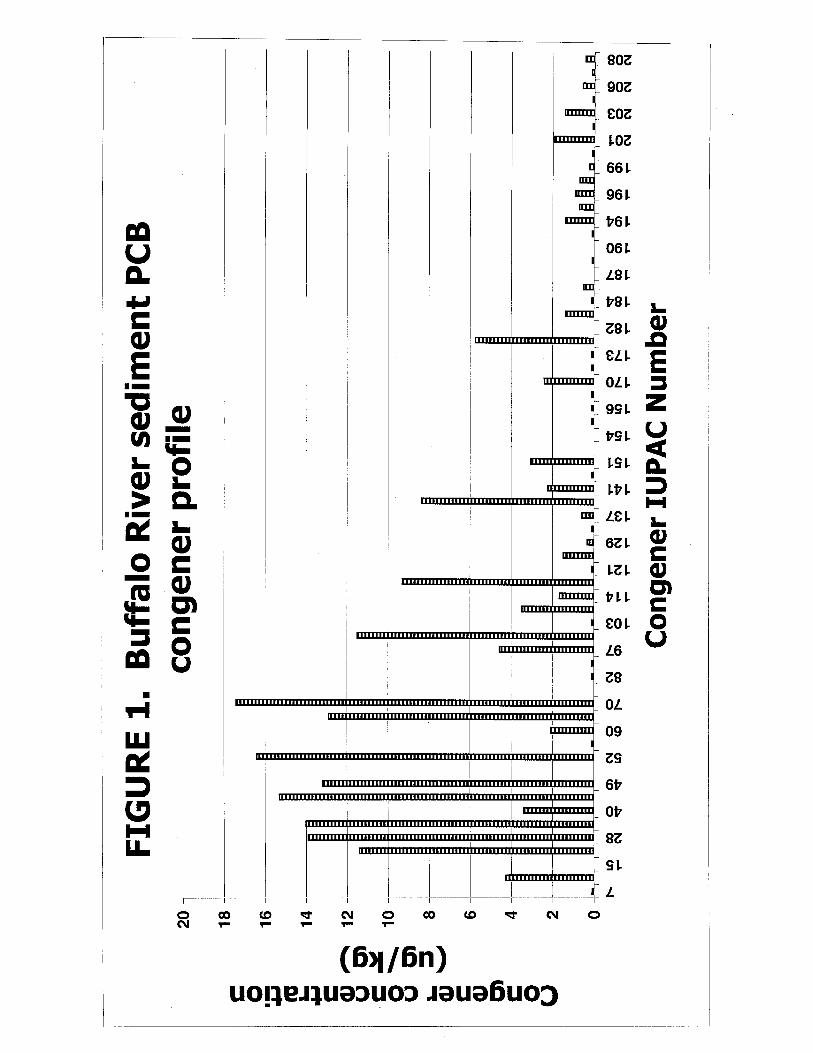
Buffalo River Feasibility Study
D R A F T F I N A L
November 19, 2010
Appendix A4 Mercury and Lead PRG Memorandum
Page 1 of 5
March 12, 2009 MEMORANDUM To: Ecology Technical Subgroup From: Mary Sorensen, Darrel Lauren, and Jen Lyndall Re: Preliminary Remedial Goals (PRGs) for Mercury and Lead with a Streamlined
Risk Evaluation for Exposed Wildlife at the Buffalo River AOC
Executive Summary The Ecology Subgroup (Eco-Group) of the Great Lakes Legacy Act Buffalo River Project Coordination Team has collaborated on efforts to identify preliminary remedial goals (PRGs)1 of contaminants in sediments for use in the Buffalo River Feasibility Study (FS). This memorandum (memo) is focused on mercury and lead and the fish tissue concentrations considered relevant as a basis of PRGs for Buffalo River. This memo briefly describes the approach used for the development of sediment PRGs for mercury and lead based on target fish tissue and sediment concentrations that are protective of wildlife. The approach described herein is conservative but consistent with approaches discussed during weekly Eco-Group calls, including those already presented for polychlorinated biphenyls (PCBs) (ENVIRON 2009a). Several tables are provided to support this memo and Attachment 1 provides the electronic excel workbook of these tables in a calculational format. Supporting data used in the calculations are provided as linked worksheets to facilitate review by the Eco-Group. This memo will be included as an appendix to the Buffalo River FS report, along with supporting documentation. Risk-based assessments were done to demonstrate that current average sediment mercury and lead concentrations in surface sediment throughout most of the Buffalo River are likely to be below levels that would result in adverse impacts to wildlife. Sediment toxicity testing results from 2005 and 2007 were also included in this analysis (USACE 2009 and CSC 2009). Based on the evaluation of data, the PRGs for mercury and lead reflect the current surface-weighted average mercury sediment concentrations so that average concentrations following the remedial action do not results in significant long term increases in surficial concentrations of mercury and lead. The ranges of mercury and lead PRGs described herein are as follows: Mercury: 0.41 mg/kg to 0.54 mg/kg based on average conditions which are well below
the USEPA and NYSDEC fish tissue criterion Lead: 73 mg/kg to 103 mg/kg based on average conditions and 320 mg/kg for protective
estimates of average exposures to avian species that may incidentally ingest sediment.
1 The acronym PRG may be used interchangeably with remedial target concentration (RTC) indicating the targets being evaluated for use in the FS. Actual remedial goals will be identified in the FS.
Page 2 of 5
Mercury PRG Development Approach The lines of evidence considered by the Eco-Group to establish the Buffalo River mercury PRG were:
NYSDEC 2007 fish tissue study showing maximum and average fish tissue concentrations at or below the USEPA and NYSDEC fish tissue criterion of 0.5 and 0.3 mg mercury/kg (wet weight), respectively
Buffalo River sediment toxicity testing showing a no effects concentration (NOEC) at 0.43 mg mercury/kg sediment
Current Buffalo River sediment mercury concentrations, as reflected by the 95 percent upper confidence limits (UCLs)
Mercury Fish Tissue Residues in the Buffalo River NYSDEC (Pers. Comm. 2009) has identified USEPA’s (1995) fish tissue criterion of 0.5 mg/kg wet weight as the criterion for consideration of PRGs for the Buffalo River. The available whole fish tissue concentrations of mercury collected by NYSDEC in 2007 are presented in Figure 1. Fish species collected included blunt-nose minnow, round goby, pumpkinseed sunfish, yellow perch, brown bullhead, large mouth bass, and carp. Fish sizes ranged from 8 to 7,350 grams (wet weight). Small fish (i.e., less than 50 g), and all fish had geometric mean mercury contents of 0.034, and 0.06 mg/kg wet weight, respectively (Table 1). The maximum mercury fish tissue concentration from any size fish was 0.24 mg/kg. These results show that the maximum tissue concentrations seen in the Buffalo River are lower than the NYSDEC and USEPA fish tissue criterion identified for Buffalo River (0.5 mg/kg wet weight based on USEPA Great Lakes Initiative, 1995). Given that the maximum fish tissue concentration is half the NYSDEC value and that the average mercury fish tissue concentrations are more than an order of magnitude below the fish tissue concentration, these results indicate that current conditions in the surface sediment of Buffalo River are on average below levels that would pose an adverse impact to wildlife.
Sediment Toxicity Testing Study Sediment toxicity testing results from 2005 and 2007 were included in this analysis (USACE 2009 and CSC 2009). The USACE reported an unbounded NOEC of 0.43 mg total mercury/kg sediment on the basis of bioassays conducted in 2005 with Hyalella azteca and Chironomus tentans. Several higher NOECs from controlled and field toxicity tests have also been reported in the literature as was discussed in detail in the Sediment Remedial Investigation Report [SRIR] (ENVIRON and MacTec 2009). In the only study of mercury toxicity alone, Sferra et al. (1999) reported an NOEC of 3.8 mg total mercury/kg in spiked sediment bioassays with H. azteca. These additional studies support the conclusion that the USACE NOEC is an appropriate and conservative PRG for the Buffalo River. Toxicity testing conducted in 2007 indicated benthic impairment due to sediment mercury concentrations is possible; however, it was noted that the highest concentrations of mercury from this analysis were based on samples collected deep in the sediment column, below the average current depth where exposures might be expected for wildlife. The concentrations seen in the 2007 toxicity testing samples were well above those no effect concentrations identified in the SRIR. CSC performed a concentration-response analysis and reported that mercury PRGs ranged from 0.33 mg/kg to 0.85 mg/kg.
Page 3 of 5
Buffalo River Mercury 95% Upper Confidence Limits Surface-weighted average mercury sediment concentrations were used to identify current conditions in the Buffalo River. Average conditions were defined as the upper confidence limit of the mean (i.e., 95% UCL). Figure 2 shows data distributions and average estimates using the full data set organized by river mile (Figure 2a) and by decreasing concentrations (Figure 2b). Figure 2c shows the data frequency distribution in increasing concentrations wherein the 95% UCL estimates are based on values excluded from the database if they exceeded the 75th percentile or 95% UCL. The adjusted mercury UCLs, which reflect current conditions of fish tissue concentrations in a range that do not pose adverse effects to wildlife, range from 0.41 mg/kg to 0.54 mg/kg.
Lead PRG Development Approach Three lines of evidence are available to establish the Buffalo River lead PRG:
Buffalo River sediment toxicity testing showing a NOEC at 0.85 mg mercury/kg sediment
Current Buffalo River sediment lead concentrations, as reflected by the 95% UCL A risk-based evaluation of fish ingestion for mink and kingfisher A risk-based evaluation of worm and incidental sediment ingestion for ducks
Sediment Toxicity Testing Study NOEC The USACE 2009 reported an unbounded NOEC of 85 mg lead/kg sediment on the basis of bioassays conducted in 2005 with Hyalella azteca and Chironomus tentans. Several higher no effect concentrations from controlled toxicity tests have also been reported in the literature as was discussed in detail in the SRIR (ENVIRON and MacTec 2009). These additional studies support the conclusion that the USACE designated NOEC is a conservative but appropriatevalue that can be considered a PRG for the Buffalo River.
Buffalo River Lead 95% Upper Confidence Limits Surface-weighted average lead sediment concentrations were used to identify current conditions in the Buffalo River in a manner consistent with that described for mercury. Figure 3 shows data distributions and average estimates using the full data set organized by river mile (Figure 3a) and by decreasing concentrations (Figure 3b). Figure 3c shows the data frequency distribution in increasing concentrations wherein 95% UCL estimates are based values excluded from the database if the exceeded the 75th percentile or 95% UCL. The adjusted lead 95% UCLs range from 73 mg/kg to 103 mg/kg.
Page 4 of 5
Risk-Based Evaluation of Fish Ingestion for Mink and Kingfisher The risk-based evaluation focused on the ingestion of fish by mink and kingfishers is consistent with the formulae and approaches presented in the PCB PRG memorandum (ENVIRON 2009a). Each of the exposure parameter estimates are identical to those already described in the PCB memo, and thus this detail is not repeated herein. The difference in the evaluation is based on site-specific exposure concentrations for lead measured in fish tissues (Table 2) and the toxicity reference value (TRVs) for lead. Associated data and spreadsheets used in the calculations are provided in Attachment 1. The two TRVs used in the analyss are those identified by NYSDEC (Pers. Comm. 2009) and USEPA (2005). Because lead does not bioaccumulate in fish tissues, the PRGs associated with mink and kingfisher are greater than 500 mg/kg of lead (Table 3) based on estimates identified in Table 4. Table 5 provides a risk-based evaluation of current conditions in the Buffalo River and shows that hazard quotient (HQs) are well below the USEPA threshold value of 1 considered protective of wildlife.
Risk-Based Evaluation of Worm and Incidental Sediment Ingestion for Ducks Due to concerns raised by stakeholders at the Eco-Group meeting in Buffalo NY on January 16, 2009, consideration was given to potential receptors more likely to come in direct contact to sediment, such as an American wood duck. While much of the Buffalo River is beyond a depth that dabbling ducks might be exposed, this analysis was considered because concerns were raised about such hypothetical receptors. Results are presented in Tables 3, 4, and 5 showing that current conditions yield HQ below the USEPA threshold value of 1 considered protective of wildlife. PRGs were calculated using a variety of scenarios that reflect the use of NYSDEC and USEPA TRVs and various calculational methods, as described in the tables and Attachment 1. The primary difference among methods was consideration of 100% bioavailablity of sediment ingested versus a more realistic bioavailability estimate of 35% (this applies to incidental sediment ingestion and assimilation which is well documented to be less than 100%). The range of PRGs derived using these estimates and the USACE defined approach for linking sediment and worms via a bioaccumulation model presented in Attachment 1 is 185 mg/kg to 495 mg/kg with an average of 185 mg/kg.
References CSC. 2009. Concentration Response Report. Submitted to USEPA Great Lakes National Program Office. Revised March 6. ENVIRON and MacTec. 2009. Sediment Remedial Investigation Report for the Buffalo River, New York. ENVIRON. 2009a. Memorandum: Preliminary Remedial Goal (PRG) for PCBs and Streamlined Risk Evaluation for PCB-Exposed Wildlife at the Buffalo River AOC. 14 February 2009.
Page 5 of 5
NYSDEC. 2007. Data Report for residues of organic chemicals and four metals in edible issues and whole fish for fish taken from the Buffalo River, New York. Skinner, L., B. Trometer, A. Gudlewski and J. Bourbon. NYSDEC and USEPA. Pers. Comm. 2009. Personal Communication from Mary Jo Crance to Ecology Subgroup re: lead LOAELs for wildlife and mercury fish tissue criterion. Dated 13 February 2009. USACE. 2003. Sediment sampling, biological analyses, and chemical analyses for Buffalo River area of concern, Buffalo, New York. Vol. 1 and 2. Vicksburg, MS. USACE. 2009. Use of 2005 Toxicity Test on Upper Buffalo River for PRG Development for Protection of Benthic Macroinvertebrates. Power Point presentation to the Ecology Subgroup, January 16, 2009, Buffalo, NY. USEPA. 1995. Great Lakes Water Quality Initiative Criteria Documents for the Protection of Wildlife. EPA-82-B-95-008.
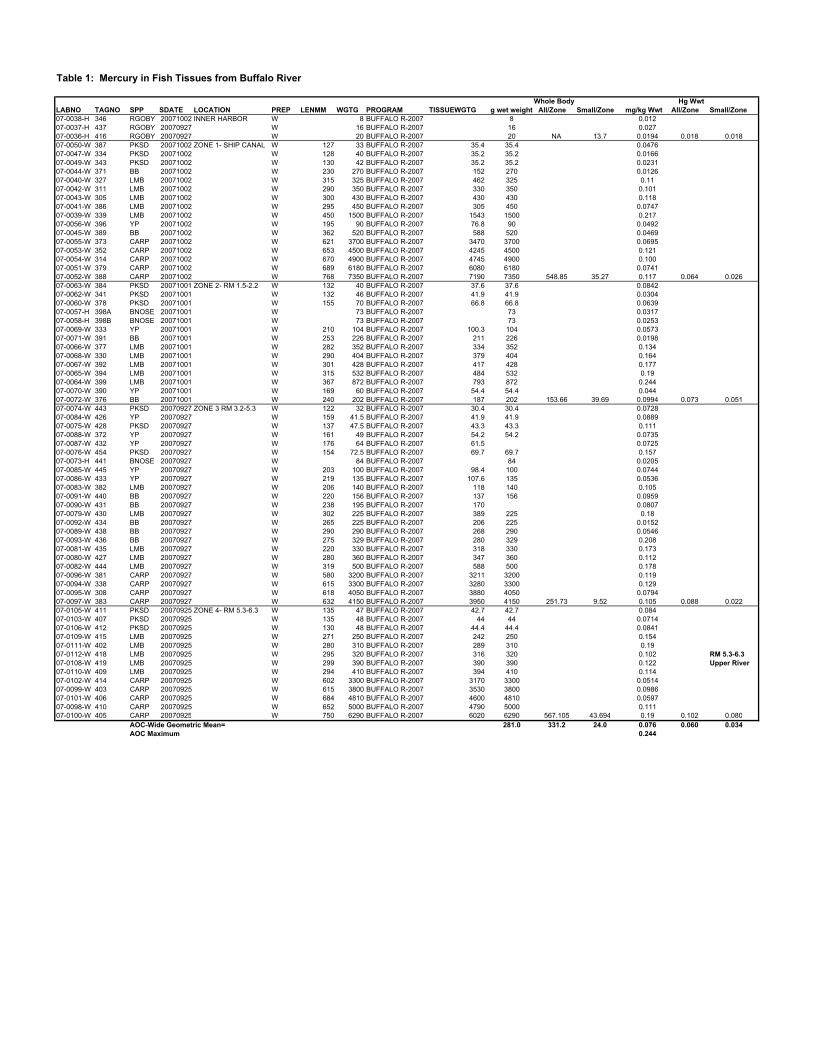
Table 1: Mercury in Fish Tissues from Buffalo River
LABNO TAGNO SPP SDATE LOCATION PREP LENMM WGTG PROGRAM TISSUEWGTG g wet weight All/Zone Small/Zone mg/kg Wwt All/Zone Small/Zone07-0038-H 346 RGOBY 20071002 INNER HARBOR W 8 BUFFALO R-2007 8 0.01207-0037-H 437 RGOBY 20070927 W 16 BUFFALO R-2007 16 0.02707-0036-H 416 RGOBY 20070927 W 20 BUFFALO R-2007 20 NA 13.7 0.0194 0.018 0.01807-0050-W 387 PKSD 20071002 ZONE 1- SHIP CANAL W 127 33 BUFFALO R-2007 35.4 35.4 0.047607-0047-W 334 PKSD 20071002 W 128 40 BUFFALO R-2007 35.2 35.2 0.016607-0049-W 343 PKSD 20071002 W 130 42 BUFFALO R-2007 35.2 35.2 0.023107-0044-W 371 BB 20071002 W 230 270 BUFFALO R-2007 152 270 0.012607-0040-W 327 LMB 20071002 W 315 325 BUFFALO R-2007 462 325 0.1107-0042-W 311 LMB 20071002 W 290 350 BUFFALO R-2007 330 350 0.10107-0043-W 305 LMB 20071002 W 300 430 BUFFALO R-2007 430 430 0.11807-0041-W 386 LMB 20071002 W 295 450 BUFFALO R-2007 305 450 0.074707-0039-W 339 LMB 20071002 W 450 1500 BUFFALO R-2007 1543 1500 0.21707-0056-W 396 YP 20071002 W 195 90 BUFFALO R-2007 76.8 90 0.049207-0045-W 389 BB 20071002 W 362 520 BUFFALO R-2007 588 520 0.046907-0055-W 373 CARP 20071002 W 621 3700 BUFFALO R-2007 3470 3700 0.069507-0053-W 352 CARP 20071002 W 653 4500 BUFFALO R-2007 4245 4500 0.12107-0054-W 314 CARP 20071002 W 670 4900 BUFFALO R-2007 4745 4900 0.10007-0051-W 379 CARP 20071002 W 689 6180 BUFFALO R-2007 6080 6180 0.074107-0052-W 388 CARP 20071002 W 768 7350 BUFFALO R-2007 7190 7350 548.85 35.27 0.117 0.064 0.02607-0063-W 384 PKSD 20071001 ZONE 2- RM 1.5-2.2 W 132 40 BUFFALO R-2007 37.6 37.6 0.084207-0062-W 341 PKSD 20071001 W 132 46 BUFFALO R-2007 41.9 41.9 0.030407-0060-W 378 PKSD 20071001 W 155 70 BUFFALO R-2007 66.8 66.8 0.063907-0057-H 398A BNOSE 20071001 W 73 BUFFALO R-2007 73 0.031707-0058-H 398B BNOSE 20071001 W 73 BUFFALO R-2007 73 0.025307-0069-W 333 YP 20071001 W 210 104 BUFFALO R-2007 100.3 104 0.057307-0071-W 391 BB 20071001 W 253 226 BUFFALO R-2007 211 226 0.019807-0066-W 377 LMB 20071001 W 282 352 BUFFALO R-2007 334 352 0.13407-0068-W 330 LMB 20071001 W 290 404 BUFFALO R-2007 379 404 0.16407-0067-W 392 LMB 20071001 W 301 428 BUFFALO R-2007 417 428 0.17707-0065-W 394 LMB 20071001 W 315 532 BUFFALO R-2007 484 532 0.1907-0064-W 399 LMB 20071001 W 367 872 BUFFALO R-2007 793 872 0.24407-0070-W 390 YP 20071001 W 169 60 BUFFALO R-2007 54.4 54.4 0.04407-0072-W 376 BB 20071001 W 240 202 BUFFALO R-2007 187 202 153.66 39.69 0.0994 0.073 0.05107-0074-W 443 PKSD 20070927 ZONE 3 RM 3.2-5.3 W 122 32 BUFFALO R-2007 30.4 30.4 0.072807-0084-W 426 YP 20070927 W 159 41.5 BUFFALO R-2007 41.9 41.9 0.088907-0075-W 428 PKSD 20070927 W 137 47.5 BUFFALO R-2007 43.3 43.3 0.11107-0088-W 372 YP 20070927 W 161 49 BUFFALO R-2007 54.2 54.2 0.073507-0087-W 432 YP 20070927 W 176 64 BUFFALO R-2007 61.5 0.072507-0076-W 454 PKSD 20070927 W 154 72.5 BUFFALO R-2007 69.7 69.7 0.15707-0073-H 441 BNOSE 20070927 W 84 BUFFALO R-2007 84 0.020507-0085-W 445 YP 20070927 W 203 100 BUFFALO R-2007 98.4 100 0.074407-0086-W 433 YP 20070927 W 219 135 BUFFALO R-2007 107.6 135 0.053607-0083-W 382 LMB 20070927 W 206 140 BUFFALO R-2007 118 140 0.10507-0091-W 440 BB 20070927 W 220 156 BUFFALO R-2007 137 156 0.095907-0090-W 431 BB 20070927 W 238 195 BUFFALO R-2007 170 0.080707-0079-W 430 LMB 20070927 W 302 225 BUFFALO R-2007 389 225 0.1807-0092-W 434 BB 20070927 W 265 225 BUFFALO R-2007 206 225 0.015207-0089-W 438 BB 20070927 W 290 290 BUFFALO R-2007 268 290 0.054607-0093-W 436 BB 20070927 W 275 329 BUFFALO R-2007 280 329 0.20807-0081-W 435 LMB 20070927 W 220 330 BUFFALO R-2007 318 330 0.17307-0080-W 427 LMB 20070927 W 280 360 BUFFALO R-2007 347 360 0.11207-0082-W 444 LMB 20070927 W 319 500 BUFFALO R-2007 588 500 0.17807-0096-W 381 CARP 20070927 W 580 3200 BUFFALO R-2007 3211 3200 0.11907-0094-W 338 CARP 20070927 W 615 3300 BUFFALO R-2007 3280 3300 0.12907-0095-W 308 CARP 20070927 W 618 4050 BUFFALO R-2007 3880 4050 0.079407-0097-W 383 CARP 20070927 W 632 4150 BUFFALO R-2007 3950 4150 251.73 9.52 0.105 0.088 0.02207-0105-W 411 PKSD 20070925 ZONE 4- RM 5.3-6.3 W 135 47 BUFFALO R-2007 42.7 42.7 0.08407-0103-W 407 PKSD 20070925 W 135 48 BUFFALO R-2007 44 44 0.071407-0106-W 412 PKSD 20070925 W 130 48 BUFFALO R-2007 44.4 44.4 0.084107-0109-W 415 LMB 20070925 W 271 250 BUFFALO R-2007 242 250 0.15407-0111-W 402 LMB 20070925 W 280 310 BUFFALO R-2007 289 310 0.1907-0112-W 418 LMB 20070925 W 295 320 BUFFALO R-2007 316 320 0.102 RM 5.3-6.307-0108-W 419 LMB 20070925 W 299 390 BUFFALO R-2007 390 390 0.122 Upper River07-0110-W 409 LMB 20070925 W 294 410 BUFFALO R-2007 394 410 0.11407-0102-W 414 CARP 20070925 W 602 3300 BUFFALO R-2007 3170 3300 0.051407-0099-W 403 CARP 20070925 W 615 3800 BUFFALO R-2007 3530 3800 0.098607-0101-W 406 CARP 20070925 W 684 4810 BUFFALO R-2007 4600 4810 0.059707-0098-W 410 CARP 20070925 W 652 5000 BUFFALO R-2007 4790 5000 0.11107-0100-W 405 CARP 20070925 W 750 6290 BUFFALO R-2007 6020 6290 567.105 43.694 0.19 0.102 0.080
AOC-Wide Geometric Mean= 281.0 331.2 24.0 0.076 0.060 0.034AOC Maximum 0.244
Whole Body Hg Wwt
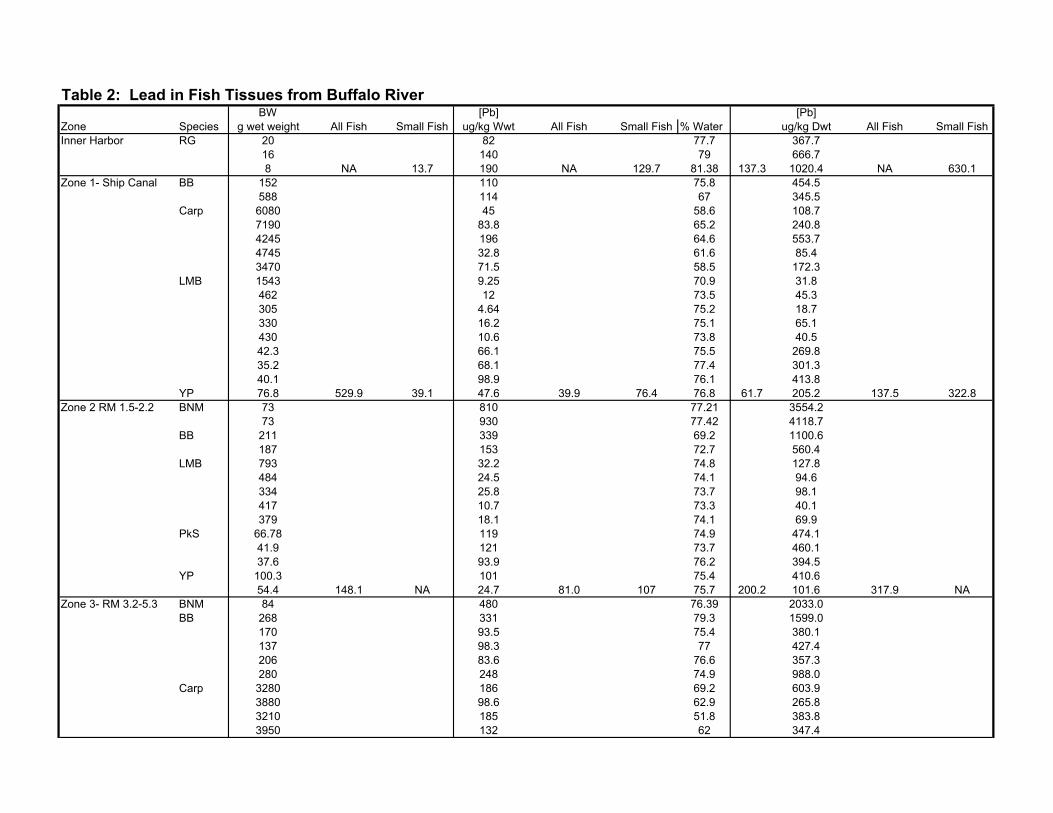
Table 2: Lead in Fish Tissues from Buffalo RiverBW [Pb] [Pb]
Zone Species g wet weight All Fish Small Fish ug/kg Wwt All Fish Small Fish % Water ug/kg Dwt All Fish Small FishInner Harbor RG 20 82 77.7 367.7
16 140 79 666.78 NA 13.7 190 NA 129.7 81.38 137.3 1020.4 NA 630.1
Zone 1- Ship Canal BB 152 110 75.8 454.5588 114 67 345.5
Carp 6080 45 58.6 108.77190 83.8 65.2 240.84245 196 64.6 553.74745 32.8 61.6 85.43470 71.5 58.5 172.3
LMB 1543 9.25 70.9 31.8462 12 73.5 45.3305 4.64 75.2 18.7330 16.2 75.1 65.1430 10.6 73.8 40.542.3 66.1 75.5 269.835.2 68.1 77.4 301.340.1 98.9 76.1 413.8
YP 76.8 529.9 39.1 47.6 39.9 76.4 76.8 61.7 205.2 137.5 322.8Zone 2 RM 1.5-2.2 BNM 73 810 77.21 3554.2
73 930 77.42 4118.7BB 211 339 69.2 1100.6
187 153 72.7 560.4LMB 793 32.2 74.8 127.8
484 24.5 74.1 94.6334 25.8 73.7 98.1417 10.7 73.3 40.1379 18.1 74.1 69.9
PkS 66.78 119 74.9 474.141.9 121 73.7 460.137.6 93.9 76.2 394.5
YP 100.3 101 75.4 410.654.4 148.1 NA 24.7 81.0 107 75.7 200.2 101.6 317.9 NA
Zone 3- RM 3.2-5.3 BNM 84 480 76.39 2033.0BB 268 331 79.3 1599.0
170 93.5 75.4 380.1137 98.3 77 427.4206 83.6 76.6 357.3280 248 74.9 988.0
Carp 3280 186 69.2 603.93880 98.6 62.9 265.83210 185 51.8 383.83950 132 62 347.4
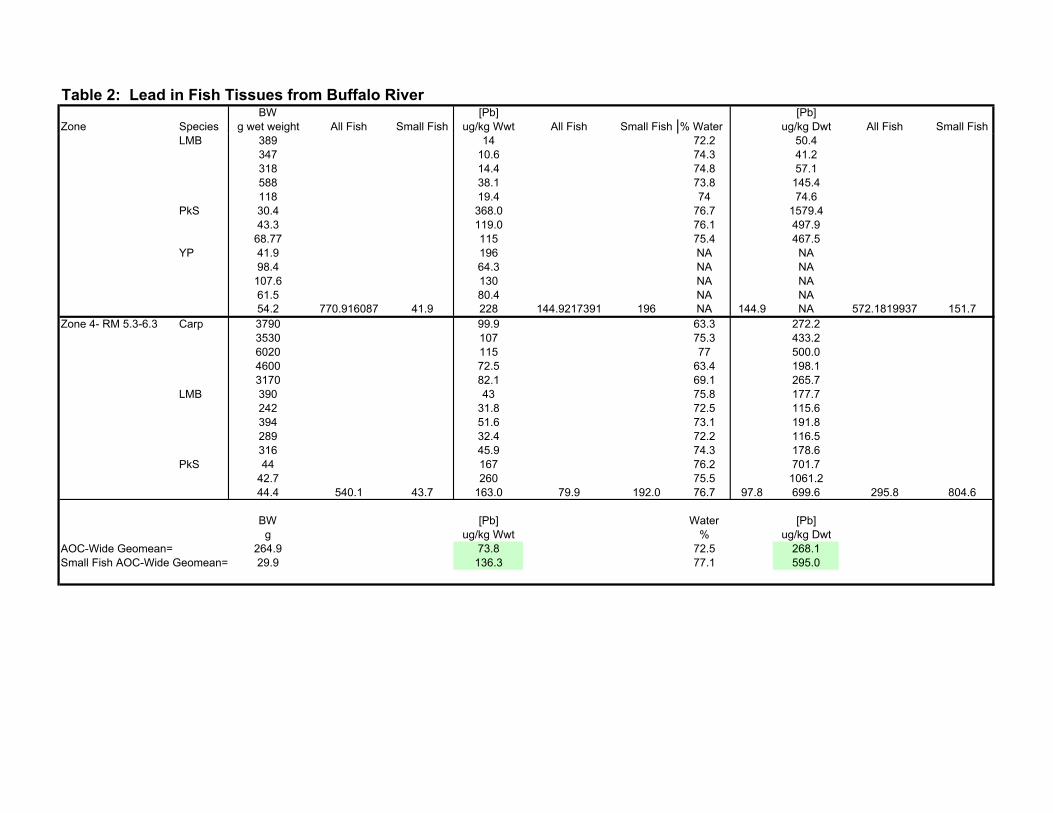
Table 2: Lead in Fish Tissues from Buffalo RiverBW [Pb] [Pb]
Zone Species g wet weight All Fish Small Fish ug/kg Wwt All Fish Small Fish % Water ug/kg Dwt All Fish Small FishLMB 389 14 72.2 50.4
347 10.6 74.3 41.2318 14.4 74.8 57.1588 38.1 73.8 145.4118 19.4 74 74.6
PkS 30.4 368.0 76.7 1579.443.3 119.0 76.1 497.9
68.77 115 75.4 467.5YP 41.9 196 NA NA
98.4 64.3 NA NA107.6 130 NA NA61.5 80.4 NA NA54.2 770.916087 41.9 228 144.9217391 196 NA 144.9 NA 572.1819937 151.7
Zone 4- RM 5.3-6.3 Carp 3790 99.9 63.3 272.23530 107 75.3 433.26020 115 77 500.04600 72.5 63.4 198.13170 82.1 69.1 265.7
LMB 390 43 75.8 177.7242 31.8 72.5 115.6394 51.6 73.1 191.8289 32.4 72.2 116.5316 45.9 74.3 178.6
PkS 44 167 76.2 701.742.7 260 75.5 1061.244.4 540.1 43.7 163.0 79.9 192.0 76.7 97.8 699.6 295.8 804.6
BW [Pb] Water [Pb]g ug/kg Wwt % ug/kg Dwt
AOC-Wide Geomean= 264.9 73.8 72.5 268.1Small Fish AOC-Wide Geomean= 29.9 136.3 77.1 595.0
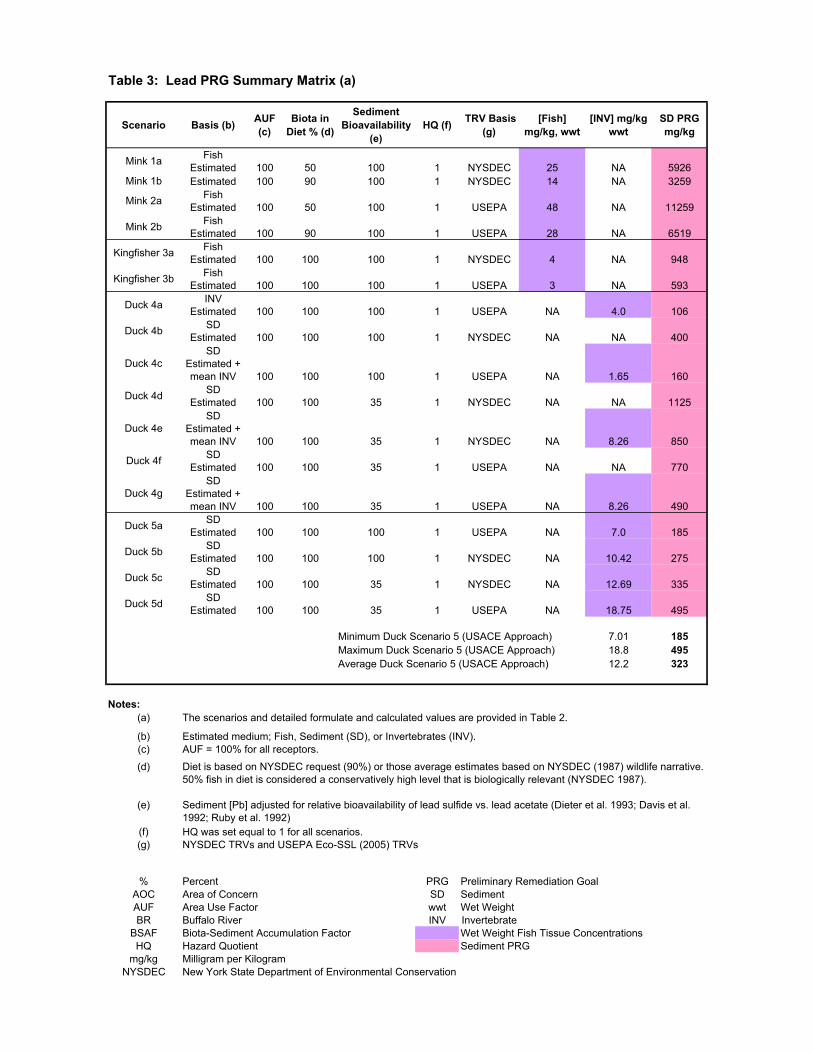
Table 3: Lead PRG Summary Matrix (a)
Scenario Basis (b) AUF (c)
Biota in Diet % (d)
Sediment Bioavailability
(e)HQ (f) TRV Basis
(g)[Fish]
mg/kg, wwt [INV] mg/kg
wwtSD PRG mg/kg
Mink 1a Fish Estimated 100 50 100 1 NYSDEC 25 NA 5926
Mink 1b Estimated 100 90 100 1 NYSDEC 14 NA 3259
Mink 2a Fish Estimated 100 50 100 1 USEPA 48 NA 11259
Mink 2b Fish Estimated 100 90 100 1 USEPA 28 NA 6519
Kingfisher 3a Fish Estimated 100 100 100 1 NYSDEC 4 NA 948
Kingfisher 3b Fish Estimated 100 100 100 1 USEPA 3 NA 593
Duck 4a INV Estimated 100 100 100 1 USEPA NA 4.0 106
Duck 4b SD Estimated 100 100 100 1 NYSDEC NA NA 400
Duck 4cSD
Estimated + mean INV 100 100 100 1 USEPA NA 1.65 160
Duck 4d SD Estimated 100 100 35 1 NYSDEC NA NA 1125
Duck 4eSD
Estimated + mean INV 100 100 35 1 NYSDEC NA 8.26 850
Duck 4f SD Estimated 100 100 35 1 USEPA NA NA 770
Duck 4gSD
Estimated + mean INV 100 100 35 1 USEPA NA 8.26 490
Duck 5a SD Estimated 100 100 100 1 USEPA NA 7.0 185
Duck 5b SD Estimated 100 100 100 1 NYSDEC NA 10.42 275
Duck 5c SD Estimated 100 100 35 1 NYSDEC NA 12.69 335
Duck 5d SD Estimated 100 100 35 1 USEPA NA 18.75 495
Minimum Duck Scenario 5 (USACE Approach) 7.01 185Maximum Duck Scenario 5 (USACE Approach) 18.8 495Average Duck Scenario 5 (USACE Approach) 12.2 323
Notes:(a)
(b) Estimated medium; Fish, Sediment (SD), or Invertebrates (INV).(c)
(d)
(e)
(f) HQ was set equal to 1 for all scenarios.(g)
% Percent PRG Preliminary Remediation GoalAOC Area of Concern SD SedimentAUF Area Use Factor wwt Wet WeightBR Buffalo River INV Invertebrate
BSAF Biota-Sediment Accumulation Factor Wet Weight Fish Tissue ConcentrationsHQ Hazard Quotient Sediment PRG
mg/kg Milligram per KilogramNYSDEC New York State Department of Environmental Conservation
Sediment [Pb] adjusted for relative bioavailability of lead sulfide vs. lead acetate (Dieter et al. 1993; Davis et al. 1992; Ruby et al. 1992)
NYSDEC TRVs and USEPA Eco-SSL (2005) TRVs
The scenarios and detailed formulate and calculated values are provided in Table 2.
Diet is based on NYSDEC request (90%) or those average estimates based on NYSDEC (1987) wildlife narrative. 50% fish in diet is considered a conservatively high level that is biologically relevant (NYSDEC 1987).
AUF = 100% for all receptors.
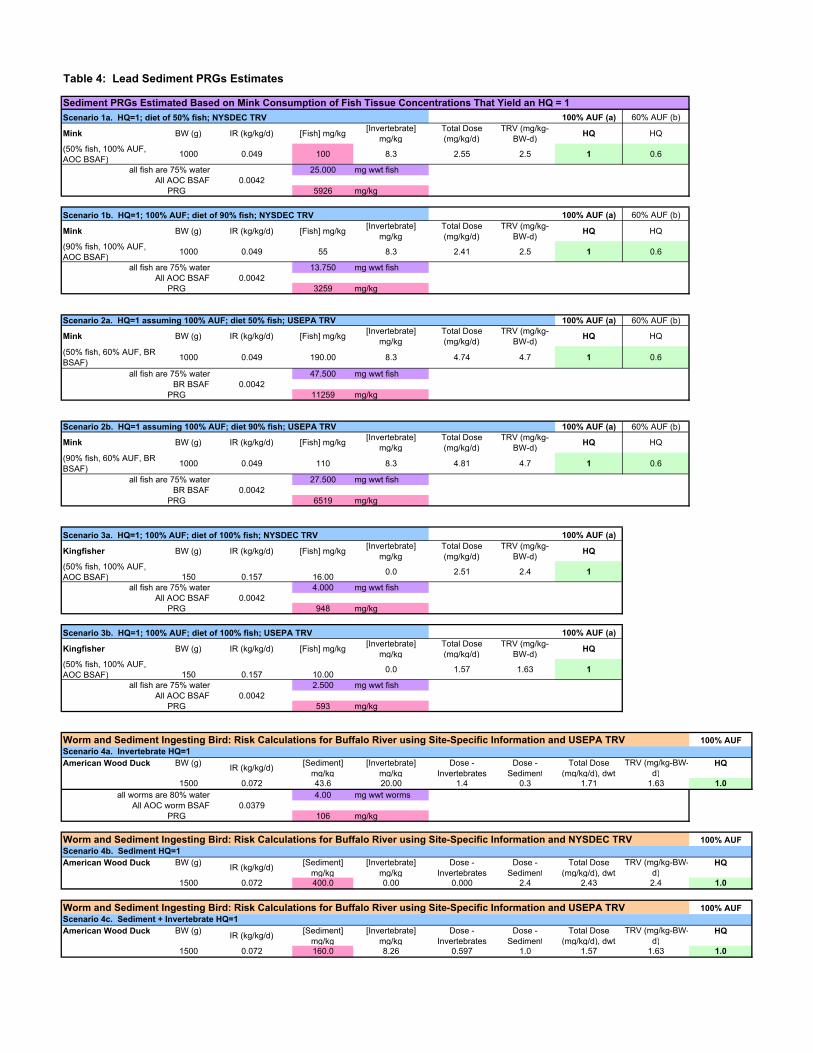
Table 4: Lead Sediment PRGs Estimates
Scenario 1a. HQ=1; diet of 50% fish; NYSDEC TRV 100% AUF (a) 60% AUF (b)
Mink BW (g) IR (kg/kg/d) [Fish] mg/kg[Invertebrate]
mg/kgTotal Dose (mg/kg/d)
TRV (mg/kg-BW-d)
HQ HQ
(50% fish, 100% AUF, AOC BSAF)
1000 0.049 100 8.3 2.55 2.5 1 0.6
all fish are 75% water 25.000 mg wwt fishAll AOC BSAF 0.0042
PRG 5926 mg/kg
Scenario 1b. HQ=1; 100% AUF; diet of 90% fish; NYSDEC TRV 100% AUF (a) 60% AUF (b)
Mink BW (g) IR (kg/kg/d) [Fish] mg/kg[Invertebrate]
mg/kgTotal Dose (mg/kg/d)
TRV (mg/kg-BW-d)
HQ HQ
(90% fish, 100% AUF, AOC BSAF)
1000 0.049 55 8.3 2.41 2.5 1 0.6
all fish are 75% water 13.750 mg wwt fishAll AOC BSAF 0.0042
PRG 3259 mg/kg
Scenario 2a. HQ=1 assuming 100% AUF; diet 50% fish; USEPA TRV 100% AUF (a) 60% AUF (b)
Mink BW (g) IR (kg/kg/d) [Fish] mg/kg[Invertebrate]
mg/kgTotal Dose (mg/kg/d)
TRV (mg/kg-BW-d)
HQ HQ
(50% fish, 60% AUF, BR BSAF)
1000 0.049 190.00 8.3 4.74 4.7 1 0.6
all fish are 75% water 47.500 mg wwt fishBR BSAF 0.0042
PRG 11259 mg/kg
Scenario 2b. HQ=1 assuming 100% AUF; diet 90% fish; USEPA TRV 100% AUF (a) 60% AUF (b)
Mink BW (g) IR (kg/kg/d) [Fish] mg/kg[Invertebrate]
mg/kgTotal Dose (mg/kg/d)
TRV (mg/kg-BW-d)
HQ HQ
(90% fish, 60% AUF, BR BSAF)
1000 0.049 110 8.3 4.81 4.7 1 0.6
all fish are 75% water 27.500 mg wwt fishBR BSAF 0.0042
PRG 6519 mg/kg
Scenario 3a. HQ=1; 100% AUF; diet of 100% fish; NYSDEC TRV 100% AUF (a)
Kingfisher BW (g) IR (kg/kg/d) [Fish] mg/kg[Invertebrate]
mg/kgTotal Dose (mg/kg/d)
TRV (mg/kg-BW-d)
HQ
(50% fish, 100% AUF, AOC BSAF) 150 0.157 16.00
0.0 2.51 2.4 1
all fish are 75% water 4.000 mg wwt fishAll AOC BSAF 0.0042
PRG 948 mg/kg
Scenario 3b. HQ=1; 100% AUF; diet of 100% fish; USEPA TRV 100% AUF (a)
Kingfisher BW (g) IR (kg/kg/d) [Fish] mg/kg[Invertebrate]
mg/kgTotal Dose (mg/kg/d)
TRV (mg/kg-BW-d)
HQ
(50% fish, 100% AUF, AOC BSAF) 150 0.157 10.00
0.0 1.57 1.63 1
all fish are 75% water 2.500 mg wwt fishAll AOC BSAF 0.0042
PRG 593 mg/kg
Worm and Sediment Ingesting Bird: Risk Calculations for Buffalo River using Site-Specific Information and USEPA TRV 100% AUFScenario 4a. Invertebrate HQ=1American Wood Duck BW (g)
IR (kg/kg/d)[Sediment]
mg/kg[Invertebrate]
mg/kgDose -
InvertebratesDose -
SedimentTotal Dose
(mg/kg/d), dwtTRV (mg/kg-BW-
d)HQ
1500 0.072 43.6 20.00 1.4 0.3 1.71 1.63 1.0all worms are 80% water 4.00 mg wwt worms
All AOC worm BSAF 0.0379PRG 106 mg/kg
Worm and Sediment Ingesting Bird: Risk Calculations for Buffalo River using Site-Specific Information and NYSDEC TRV 100% AUFScenario 4b. Sediment HQ=1American Wood Duck BW (g)
IR (kg/kg/d)[Sediment]
mg/kg[Invertebrate]
mg/kgDose -
InvertebratesDose -
SedimentTotal Dose
(mg/kg/d), dwtTRV (mg/kg-BW-
d)HQ
1500 0.072 400.0 0.00 0.000 2.4 2.43 2.4 1.0
Worm and Sediment Ingesting Bird: Risk Calculations for Buffalo River using Site-Specific Information and USEPA TRV 100% AUFScenario 4c. Sediment + Invertebrate HQ=1American Wood Duck BW (g)
IR (kg/kg/d)[Sediment]
mg/kg[Invertebrate]
mg/kgDose -
InvertebratesDose -
SedimentTotal Dose
(mg/kg/d), dwtTRV (mg/kg-BW-
d)HQ
1500 0.072 160.0 8.26 0.597 1.0 1.57 1.63 1.0
Sediment PRGs Estimated Based on Mink Consumption of Fish Tissue Concentrations That Yield an HQ = 1
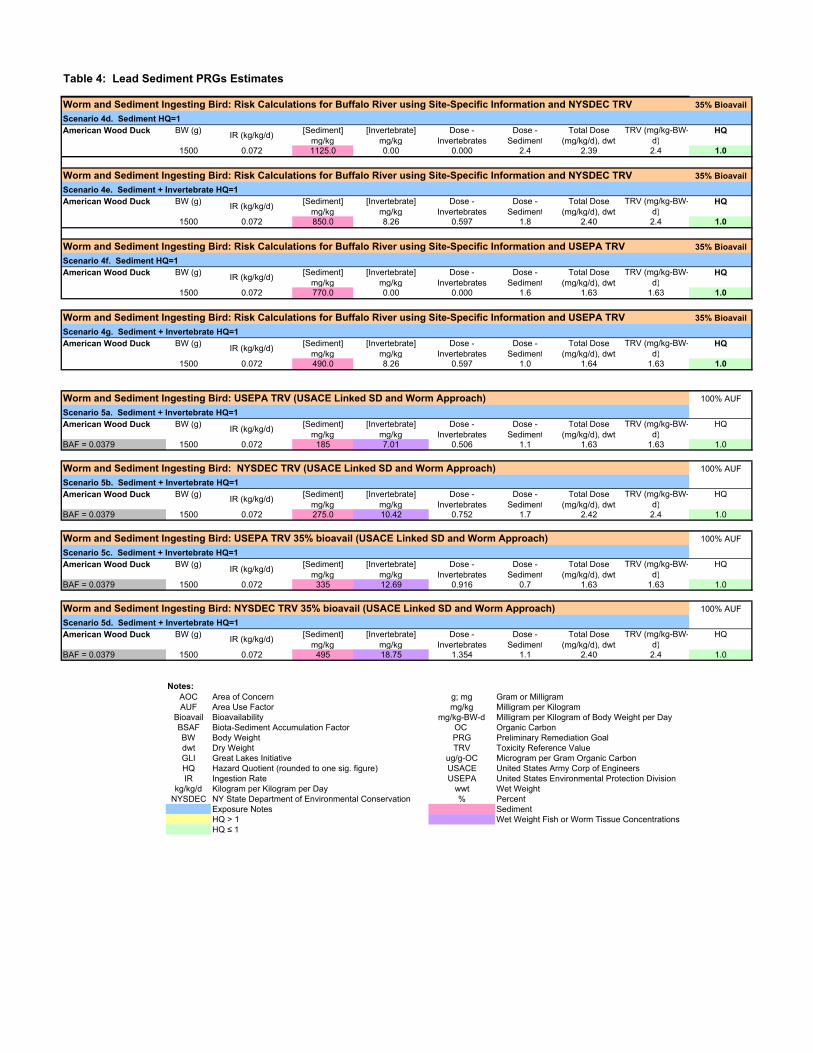
Table 4: Lead Sediment PRGs Estimates
Worm and Sediment Ingesting Bird: Risk Calculations for Buffalo River using Site-Specific Information and NYSDEC TRV 35% BioavailScenario 4d. Sediment HQ=1American Wood Duck BW (g)
IR (kg/kg/d)[Sediment]
mg/kg[Invertebrate]
mg/kgDose -
InvertebratesDose -
SedimentTotal Dose
(mg/kg/d), dwtTRV (mg/kg-BW-
d)HQ
1500 0.072 1125.0 0.00 0.000 2.4 2.39 2.4 1.0
Worm and Sediment Ingesting Bird: Risk Calculations for Buffalo River using Site-Specific Information and NYSDEC TRV 35% BioavailScenario 4e. Sediment + Invertebrate HQ=1American Wood Duck BW (g)
IR (kg/kg/d)[Sediment]
mg/kg[Invertebrate]
mg/kgDose -
InvertebratesDose -
SedimentTotal Dose
(mg/kg/d), dwtTRV (mg/kg-BW-
d)HQ
1500 0.072 850.0 8.26 0.597 1.8 2.40 2.4 1.0
Worm and Sediment Ingesting Bird: Risk Calculations for Buffalo River using Site-Specific Information and USEPA TRV 35% BioavailScenario 4f. Sediment HQ=1American Wood Duck BW (g)
IR (kg/kg/d)[Sediment]
mg/kg[Invertebrate]
mg/kgDose -
InvertebratesDose -
SedimentTotal Dose
(mg/kg/d), dwtTRV (mg/kg-BW-
d)HQ
1500 0.072 770.0 0.00 0.000 1.6 1.63 1.63 1.0
Worm and Sediment Ingesting Bird: Risk Calculations for Buffalo River using Site-Specific Information and USEPA TRV 35% BioavailScenario 4g. Sediment + Invertebrate HQ=1American Wood Duck BW (g)
IR (kg/kg/d)[Sediment]
mg/kg[Invertebrate]
mg/kgDose -
InvertebratesDose -
SedimentTotal Dose
(mg/kg/d), dwtTRV (mg/kg-BW-
d)HQ
1500 0.072 490.0 8.26 0.597 1.0 1.64 1.63 1.0
Worm and Sediment Ingesting Bird: USEPA TRV (USACE Linked SD and Worm Approach) 100% AUF
Scenario 5a. Sediment + Invertebrate HQ=1American Wood Duck BW (g)
IR (kg/kg/d)[Sediment]
mg/kg[Invertebrate]
mg/kgDose -
InvertebratesDose -
SedimentTotal Dose
(mg/kg/d), dwtTRV (mg/kg-BW-
d)HQ
BAF = 0.0379 1500 0.072 185 7.01 0.506 1.1 1.63 1.63 1.0
Worm and Sediment Ingesting Bird: NYSDEC TRV (USACE Linked SD and Worm Approach) 100% AUF
Scenario 5b. Sediment + Invertebrate HQ=1American Wood Duck BW (g)
IR (kg/kg/d)[Sediment]
mg/kg[Invertebrate]
mg/kgDose -
InvertebratesDose -
SedimentTotal Dose
(mg/kg/d), dwtTRV (mg/kg-BW-
d)HQ
BAF = 0.0379 1500 0.072 275.0 10.42 0.752 1.7 2.42 2.4 1.0
Worm and Sediment Ingesting Bird: USEPA TRV 35% bioavail (USACE Linked SD and Worm Approach) 100% AUF
Scenario 5c. Sediment + Invertebrate HQ=1American Wood Duck BW (g)
IR (kg/kg/d)[Sediment]
mg/kg[Invertebrate]
mg/kgDose -
InvertebratesDose -
SedimentTotal Dose
(mg/kg/d), dwtTRV (mg/kg-BW-
d)HQ
BAF = 0.0379 1500 0.072 335 12.69 0.916 0.7 1.63 1.63 1.0
Worm and Sediment Ingesting Bird: NYSDEC TRV 35% bioavail (USACE Linked SD and Worm Approach) 100% AUF
Scenario 5d. Sediment + Invertebrate HQ=1American Wood Duck BW (g)
IR (kg/kg/d)[Sediment]
mg/kg[Invertebrate]
mg/kgDose -
InvertebratesDose -
SedimentTotal Dose
(mg/kg/d), dwtTRV (mg/kg-BW-
d)HQ
BAF = 0.0379 1500 0.072 495 18.75 1.354 1.1 2.40 2.4 1.0
Notes:AOC Area of Concern g; mg Gram or MilligramAUF Area Use Factor mg/kg Milligram per Kilogram
Bioavail Bioavailability mg/kg-BW-d Milligram per Kilogram of Body Weight per DayBSAF Biota-Sediment Accumulation Factor OC Organic CarbonBW Body Weight PRG Preliminary Remediation Goaldwt Dry Weight TRV Toxicity Reference ValueGLI Great Lakes Initiative ug/g-OC Microgram per Gram Organic CarbonHQ Hazard Quotient (rounded to one sig. figure) USACE United States Army Corp of EngineersIR Ingestion Rate USEPA United States Environmental Protection Division
kg/kg/d Kilogram per Kilogram per Day wwt Wet WeightNYSDEC NY State Department of Environmental Conservation % Percent
Exposure Notes SedimentHQ > 1 Wet Weight Fish or Worm Tissue ConcentrationsHQ ≤ 1
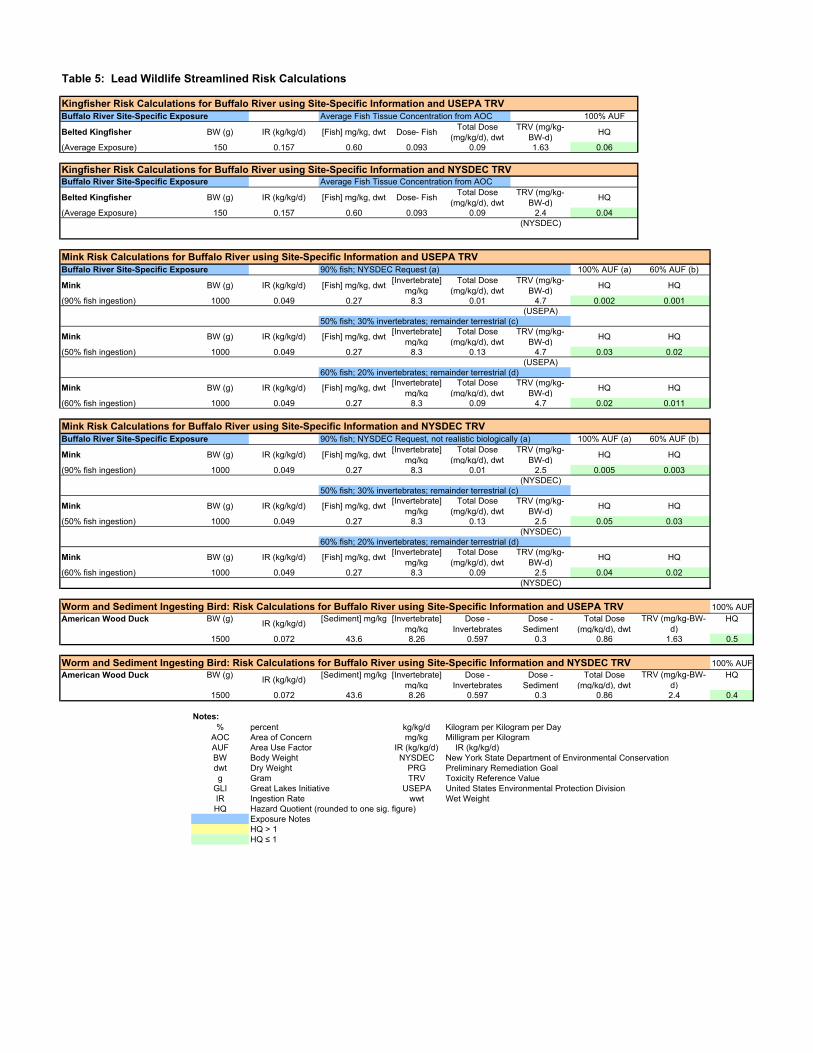
Table 5: Lead Wildlife Streamlined Risk Calculations
Buffalo River Site-Specific Exposure Average Fish Tissue Concentration from AOC 100% AUF
Belted Kingfisher BW (g) IR (kg/kg/d) [Fish] mg/kg, dwt Dose- FishTotal Dose
(mg/kg/d), dwtTRV (mg/kg-
BW-d)HQ
(Average Exposure) 150 0.157 0.60 0.093 0.09 1.63 0.06
Buffalo River Site-Specific Exposure Average Fish Tissue Concentration from AOC
Belted Kingfisher BW (g) IR (kg/kg/d) [Fish] mg/kg, dwt Dose- FishTotal Dose
(mg/kg/d), dwtTRV (mg/kg-
BW-d)HQ
(Average Exposure) 150 0.157 0.60 0.093 0.09 2.4 0.04(NYSDEC)
Buffalo River Site-Specific Exposure 90% fish; NYSDEC Request (a) 100% AUF (a) 60% AUF (b)
Mink BW (g) IR (kg/kg/d) [Fish] mg/kg, dwt[Invertebrate]
mg/kgTotal Dose
(mg/kg/d), dwtTRV (mg/kg-
BW-d)HQ HQ
(90% fish ingestion) 1000 0.049 0.27 8.3 0.01 4.7 0.002 0.001(USEPA)
50% fish; 30% invertebrates; remainder terrestrial (c)
Mink BW (g) IR (kg/kg/d) [Fish] mg/kg, dwt[Invertebrate]
mg/kgTotal Dose
(mg/kg/d), dwtTRV (mg/kg-
BW-d)HQ HQ
(50% fish ingestion) 1000 0.049 0.27 8.3 0.13 4.7 0.03 0.02(USEPA)
60% fish; 20% invertebrates; remainder terrestrial (d)
Mink BW (g) IR (kg/kg/d) [Fish] mg/kg, dwt[Invertebrate]
mg/kgTotal Dose
(mg/kg/d), dwtTRV (mg/kg-
BW-d)HQ HQ
(60% fish ingestion) 1000 0.049 0.27 8.3 0.09 4.7 0.02 0.011
Buffalo River Site-Specific Exposure 90% fish; NYSDEC Request, not realistic biologically (a) 100% AUF (a) 60% AUF (b)
Mink BW (g) IR (kg/kg/d) [Fish] mg/kg, dwt[Invertebrate]
mg/kgTotal Dose
(mg/kg/d), dwtTRV (mg/kg-
BW-d)HQ HQ
(90% fish ingestion) 1000 0.049 0.27 8.3 0.01 2.5 0.005 0.003(NYSDEC)
50% fish; 30% invertebrates; remainder terrestrial (c)
Mink BW (g) IR (kg/kg/d) [Fish] mg/kg, dwt[Invertebrate]
mg/kgTotal Dose
(mg/kg/d), dwtTRV (mg/kg-
BW-d)HQ HQ
(50% fish ingestion) 1000 0.049 0.27 8.3 0.13 2.5 0.05 0.03(NYSDEC)
60% fish; 20% invertebrates; remainder terrestrial (d)
Mink BW (g) IR (kg/kg/d) [Fish] mg/kg, dwt[Invertebrate]
mg/kgTotal Dose
(mg/kg/d), dwtTRV (mg/kg-
BW-d)HQ HQ
(60% fish ingestion) 1000 0.049 0.27 8.3 0.09 2.5 0.04 0.02(NYSDEC)
Worm and Sediment Ingesting Bird: Risk Calculations for Buffalo River using Site-Specific Information and USEPA TRV 100% AUFAmerican Wood Duck BW (g)
IR (kg/kg/d)[Sediment] mg/kg [Invertebrate]
mg/kgDose -
InvertebratesDose -
SedimentTotal Dose
(mg/kg/d), dwtTRV (mg/kg-BW-
d)HQ
1500 0.072 43.6 8.26 0.597 0.3 0.86 1.63 0.5
Worm and Sediment Ingesting Bird: Risk Calculations for Buffalo River using Site-Specific Information and NYSDEC TRV 100% AUFAmerican Wood Duck BW (g)
IR (kg/kg/d)[Sediment] mg/kg [Invertebrate]
mg/kgDose -
InvertebratesDose -
SedimentTotal Dose
(mg/kg/d), dwtTRV (mg/kg-BW-
d)HQ
1500 0.072 43.6 8.26 0.597 0.3 0.86 2.4 0.4
Notes:% percent kg/kg/d Kilogram per Kilogram per Day
AOC Area of Concern mg/kg Milligram per KilogramAUF Area Use Factor IR (kg/kg/d) IR (kg/kg/d)BW Body Weight NYSDEC New York State Department of Environmental Conservationdwt Dry Weight PRG Preliminary Remediation Goalg Gram TRV Toxicity Reference Value
GLI Great Lakes Initiative USEPA United States Environmental Protection DivisionIR Ingestion Rate wwt Wet WeightHQ Hazard Quotient (rounded to one sig. figure)
Exposure NotesHQ > 1HQ ≤ 1
Kingfisher Risk Calculations for Buffalo River using Site-Specific Information and USEPA TRV
Kingfisher Risk Calculations for Buffalo River using Site-Specific Information and NYSDEC TRV
Mink Risk Calculations for Buffalo River using Site-Specific Information and USEPA TRV
Mink Risk Calculations for Buffalo River using Site-Specific Information and NYSDEC TRV
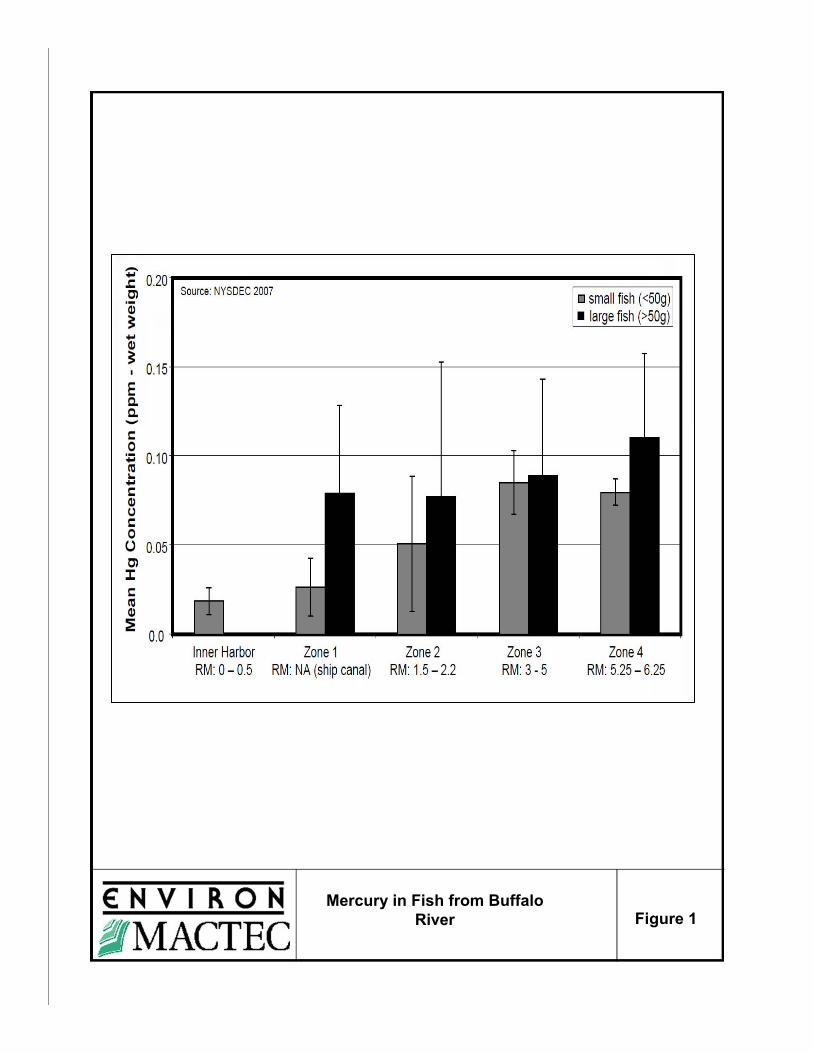
Mercury in Fish from Buffalo River Figure 1
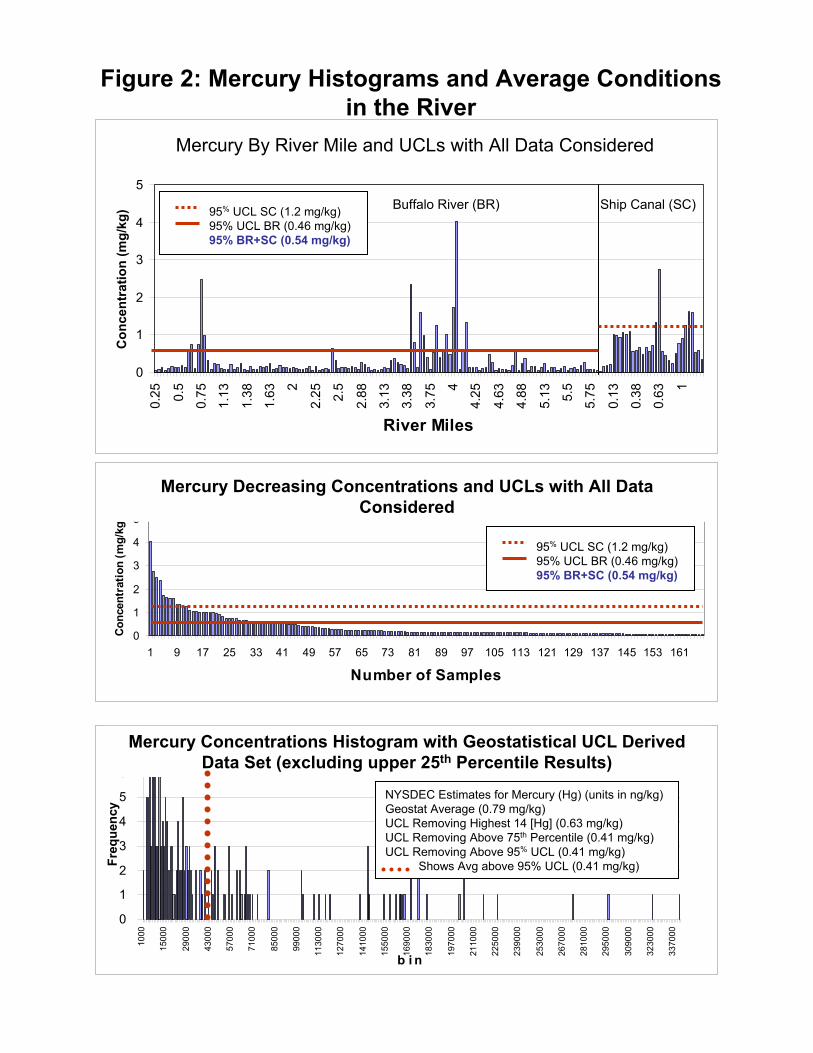
H g H is to g r a m
0
1
2
3
4
5
6
7
1000
1500
0
2900
0
4300
0
5700
0
7100
0
8500
0
9900
0
1130
00
1270
00
1410
00
1550
00
1690
00
1830
00
1970
00
2110
00
2250
00
2390
00
2530
00
2670
00
2810
00
2950
00
3090
00
3230
00
3370
00
b i n
Freq
uenc
y
Figure 2: Mercury Histograms and Average Conditions in the River
Mercury Concentrations Histogram with Geostatistical UCL Derived Data Set (excluding upper 25th Percentile Results)
NYSDEC Estimates for Mercury (Hg) (units in ng/kg)Geostat Average (0.79 mg/kg)UCL Removing Highest 14 [Hg] (0.63 mg/kg)UCL Removing Above 75th Percentile (0.41 mg/kg)UCL Removing Above 95% UCL (0.41 mg/kg)
Shows Avg above 95% UCL (0.41 mg/kg)
Mercury By Decending Concentrations
0
1
2
3
4
5
1 9 17 25 33 41 49 57 65 73 81 89 97 105 113 121 129 137 145 153 161
Number of Samples
Con
cent
ratio
n (m
g/kg
)
Mercury Decreasing Concentrations and UCLs with All Data Considered
95% UCL SC (1.2 mg/kg) 95% UCL BR (0.46 mg/kg)95% BR+SC (0.54 mg/kg)
Mercury By River Mile
0
1
2
3
4
5
0.25 0.
5
0.75
1.13
1.38
1.63 2
2.25 2.
5
2.88
3.13
3.38
3.75 4
4.25
4.63
4.88
5.13 5.
5
5.75
0.13
0.38
0.63 1
River Miles
Con
cent
ratio
n (m
g/kg
) Ship Canal (SC)
Mercury By River Mile and UCLs with All Data Considered
Buffalo River (BR)95% UCL SC (1.2 mg/kg) 95% UCL BR (0.46 mg/kg)95% BR+SC (0.54 mg/kg)
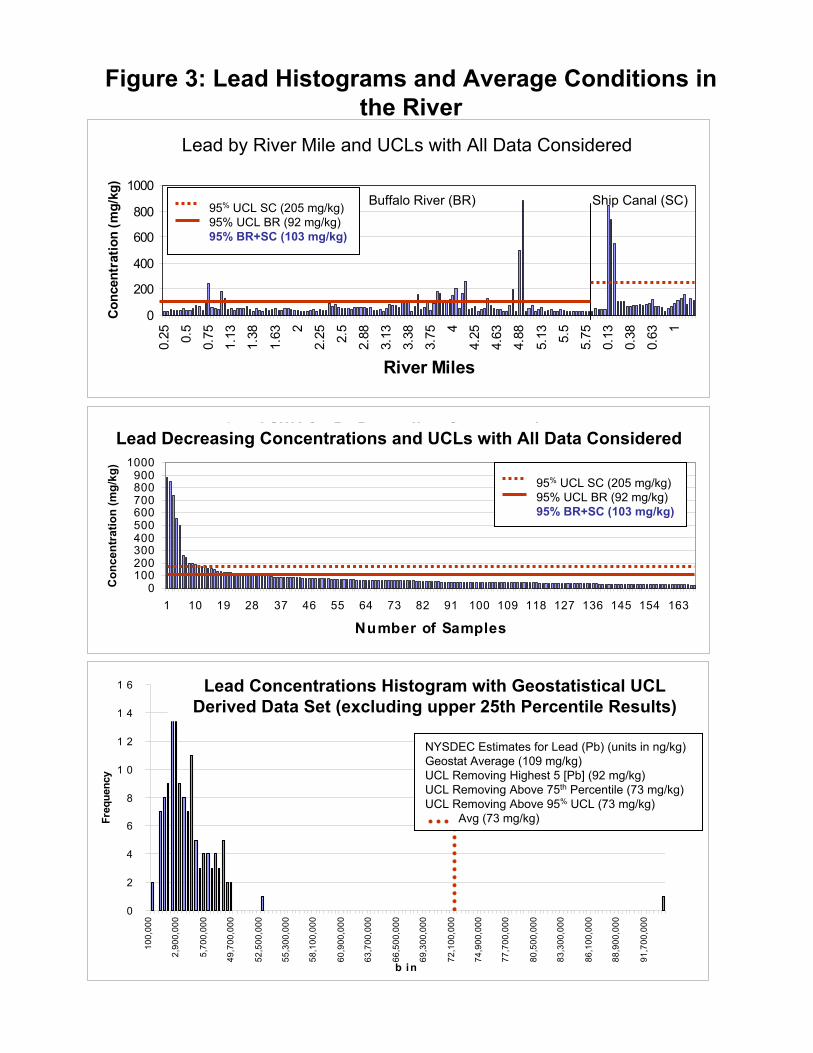
Figure 3: Lead Histograms and Average Conditions in the River
L e a d H is t o g r a m
0
2
4
6
8
1 0
1 2
1 4
1 6
100,
000
2,90
0,00
0
5,70
0,00
0
49,7
00,0
00
52,5
00,0
00
55,3
00,0
00
58,1
00,0
00
60,9
00,0
00
63,7
00,0
00
66,5
00,0
00
69,3
00,0
00
72,1
00,0
00
74,9
00,0
00
77,7
00,0
00
80,5
00,0
00
83,3
00,0
00
86,1
00,0
00
88,9
00,0
00
91,7
00,0
00
b in
Freq
uenc
y
F r e q u e n c y
Lead Concentrations Histogram with Geostatistical UCL Derived Data Set (excluding upper 25th Percentile Results)
NYSDEC Estimates for Lead (Pb) (units in ng/kg)Geostat Average (109 mg/kg)UCL Removing Highest 5 [Pb] (92 mg/kg)UCL Removing Above 75th Percentile (73 mg/kg)UCL Removing Above 95% UCL (73 mg/kg)
Avg (73 mg/kg)
Lead SWACs By Decending Concentrations
0100200300400500600700800900
1000
1 10 19 28 37 46 55 64 73 82 91 100 109 118 127 136 145 154 163
Number of Samples
Con
cent
ratio
n (m
g/kg
)
Lead Decreasing Concentrations and UCLs with All Data Considered
95% UCL SC (205 mg/kg) 95% UCL BR (92 mg/kg)95% BR+SC (103 mg/kg)
Lead By River Mile
0
200
400
600
800
10000.
25 0.5
0.75
1.13
1.38
1.63 2
2.25 2.5
2.88
3.13
3.38
3.75 4
4.25
4.63
4.88
5.13 5.5
5.75
0.13
0.38
0.63 1
River Miles
Con
cent
ratio
n (m
g/kg
)
Ship Canal (SC)
Lead by River Mile and UCLs with All Data Considered
Buffalo River (BR)95% UCL SC (205 mg/kg) 95% UCL BR (92 mg/kg)95% BR+SC (103 mg/kg)