AIR POLLUTION and PUBLIC HEALTH - legco.gov.hk · particulates (PM10), nitrogen dioxide (NO2),...
66
AIR POLLUTION and PUBLIC HEALTH The current avoidable burden of health problems, community costs and harm to future generations Anthony J Hedley Department of Community Medicine School of Public Health Li Ka Shing Faculty of Medicine The University of Hong Kong 5F William MW Mong Block 21 Sassoon Road Pokfulam Hong Kong Email: [email protected] Tel: 2819 9282; Fax: 2855 9528 February 2009 CB(1) 733/08-09(02)
Transcript of AIR POLLUTION and PUBLIC HEALTH - legco.gov.hk · particulates (PM10), nitrogen dioxide (NO2),...

AIR POLLUTION and PUBLIC HEALTH
The current avoidable burden of health problems, community costs and harm to future generations
Anthony J Hedley
Department of Community Medicine
School of Public Health Li Ka Shing Faculty of Medicine
The University of Hong Kong
5F William MW Mong Block 21 Sassoon Road
Pokfulam Hong Kong
Email: [email protected] Tel: 2819 9282; Fax: 2855 9528
February 2009
CB(1) 733/08-09(02)

Contents Executive Summary 1.0 Air pollution: a global problem
1.1 A brief history of air pollution
1.1.1 The Meuse Valley fog 1.1.2 The Donora, Pennsylvania, poisonous cloud 1.1.3 The Great London smog
1.2 Recent history of air pollution epidemiology and public health analysis
1.2.1 New research and understanding 1.2.2 What is the current threat to health?
2.0 Which air pollutants are a threat to public health?
2.1 The criteria pollutants 2.2 Particulates 2.3 Volatile Organic Compounds 2.4 Gases 2.5 Seasonal and annual risks
3.0 How do air pollution exposures lead to bad health outcomes?
3.1 Inflammation 3.2 The pyramid of effects 3.3 Making the diagnosis 3.4 Which health problems are definitely or probably associated with air pollution
exposure? 3.5 Air pollution and life-expectancy
4.0 How are the public health risks of air pollution estimated in Hong Kong?
4.1 Association between air pollution and general practitioner visits for respiratory disease in Hong Kong
4.2 Effects of air pollution on hospital admissions in Hong Kong and London 4.3 Effects of air pollution on mortality 4.4 Effects of air pollution on mortality in socially deprived urban areas
5.0 What is the best evidence that pollution abatement protects health?
5.1 The Utah Valley steel mill 5.2 Coal sale bans in Dublin 5.3 Fuel sulphur restriction in Hong Kong 5.4 California Children’s Health Study (CHS) 5.5 Traffic pollution during the Atlanta Olympics 1996
2

6.0 Who are most vulnerable to air pollution? 6.1 High risk groups 6.2 Social inequity; the poor and disadvantaged
7.0 How preventable is harm to health from air pollution? 7.1 Protection is difficult to achieve 7.2 Lifestyle 7.3 Indoor environments 7.4 High pollution alerts
8.0 Monitoring pollution levels, assessing the risks and counting the costs: the need for accountability 8.1 The Hedley Environmental Index (HEI) 8.2 What does the HEI provide? 8.3 Visibility and the avoidable events caused by pollution, including doctor
visits, hospital bed-days, deaths and dollar values 8.4 How valid are the estimates of disease burden and community costs generated
by the Hedley Index?
9.0 Is air quality in Hong Kong improving? 9.1 Respirable Suspended Particulates (PM10) 9.2 Nitrogen dioxide 9.3 Sulphur dioxide, nickel and vanadium
10.0 Should Hong Kong adopt the WHO Guidelines as a formal step toward exposure
reduction? 10.1 Key points in the introduction to WHO AQG 10.2 Interpretation of the WHO advisory by HKSAR government 10.3 The HKSAR present position on WHO AQG 10.4 What can we contribute to this argument?
11.0 How can risks to population health from air pollution be reduced? 11.1 An issue of human rights 11.2 Exposure reduction must become an urgent and achievable goal 11.3 The public health viewpoint
References and Bibliography Key References Bibliography
3

Executive Summary • There is incontrovertible evidence that pollution levels currently experienced throughout
the year in Hong Kong are causing an epidemic of health problems arising from damage to lungs, heart and blood vessels. Hong Kong’s pollution is a significant cause of premature death from cardiopulmonary disorders.
• Present levels of pollution cause injury to the immature developing lungs of children and
adolescents. This damage will lead to life-long health problems in many and a reduction in life-expectancy.
• There is no convincing evidence from analyses of trends in pollutants that pollution
mitigation measures in recent years have reduced ambient pollutant concentrations in a way which will benefit public health. There are clear indications that for some pollutants the problem is worsening. Extrapolation of any potential downward trends suggest it will be at least several decades before we achieve safer air quality.
• The government has not given the necessary priority to the protection of public health and
there is as yet no strategy in place which will predictably lead to a rapid resolution of regional pollution and the public health threat in the HKSAR.
• The government’s review of the “Air Quality Objectives” apparently lacks both
transparency and an evidence-based approach as indicated by the adoption of the lowest level WHO Interim Target-1. There is no evidence that it will lead to any reduction in particulate pollution or public health benefit.
• The proposed use of Interim Target-1 should be abandoned because it will delay effective
protection of public health. The HKSAR should adopt and use the World Health Organisation Air Quality Guidelines as a basis for rapidly developing enforceable air quality standards and caps on maximum permissible levels. At the same time it is essential that a programme of Emission Reduction Targets (ERT) are implemented in a mandatory fail-safe approach to health protection.
• Hong Kong needs an effective system of audit and accountability to address the current
crisis in air quality management. A new environmental index developed from research on air pollution and health in The University of Hong Kong and the Chinese University of Hong Kong, and presented and promoted by Civic Exchange demonstrates on an hourly basis the burden of disease and external costs to the whole community incurred from the harm caused by pollution.
• Air pollution is Hong Kong’s biggest cause of social and environmental injustice. It
harms not only citizens today but, because of its transgenerational effects on the unborn and youngest members of the community, it will project its ill health effects well into the later years of this century unless a radically different approach is taken to air quality management
4

1.0 Air pollution: a global problem 1.1 A brief history of air pollution
Human activities have created forms of air pollution for millennia and the inhalation of products of combustion, as particles and gases from fuels, has long been recognized as a cause of ill health and premature death. In modern history several dramatic pollution incidents led to public health action to protect populations against uncontrolled combustion and emissions from fossil fuels and other chemical sources.
1.1.2 The Meuse Valley fog In December 1930 a dense fog affected the Meuse Valley in Belgium. Beginning on December 3 the fog intensified over three days and was associated with laryngeal symptoms, chest pain, coughing and breathlessness. Some patients showed signs of pulmonary oedema. Overall 60 deaths were attributed to the episode. After a long investigation the cause was considered to be emissions from high sulphur fuels, including sulphur dioxide and sulphuric acid.
1.1.3 The Donora, Pennsylvania, poisonous cloud In October 1948 in the town of Donora, Pennsylvania, USA an air inversion layer trapped emissions from steel and zinc works. The levels of pollution plunged the town into darkness. The health impacts were considered to include 20 deaths in the first three days; another 50 deaths after the inversion lifted and several hundred with long term respiratory and cardiovascular damage. The Donora Smog Museum holds archives of the event and describes the actions taken to improve air quality, leading to the Air Pollution Control Act (1955) and the Clean Air Act (1963).
1.1.4 The Great London Smog In 1952 the best known and most catastrophic air pollution episode occurred in the city of London UK between 5 to 9 December. A cold winter spell associated with fog led to a marked increase in domestic consumption of coal. The coal sold for domestic use had a high sulphur content. The loss of visibility extended down to only a few metres so that it was not possible to navigate streets either on foot or in vehicles. It is estimated that about 4,000 deaths were caused in five days by high levels of particulates and SO2 with concentrations estimated at thousands of micrograms per cubic metre (Figure 1). Most of the deaths were in middle life or the elderly, with infants and children also affected. There is evidence to suggest that the distribution of deaths continued to be relatively high for several more months after the pollution episode with possibly an additional 8,000 deaths. The principal causes of death were lung infections and heart disease. The
Figure 1: The epidemic of deaths from heart and lung disease began when the levels of particulates and SO2 rose sharply
5

victims died quickly so that the impact was mostly recognised by funeral directors, coffin manufacturers and florists rather than general practitioners and hospitals.
1.2 Recent history of air pollution epidemiology and public health analysis
1.2.1 New research and understanding: In the late 1980s research on the health effects of air pollution underwent a transformation. Greater insights into the biological action of pollutants on animal and human cells, together with clinical and population studies of health outcomes and new methods for statistical analysis led to a marked increase in the quality and quantity of reports about the influence of air pollutants on health, health care utilization and premature deaths.
1.2.2 What is the current threat to health?: The mitigation of air pollution following the introduction of clean air legislation has been followed by a period of unprecedented economic development creating new forms of pollution from the combustion of fossil fuels. The reduced levels of air pollution achieved in the 1970s and early 1980s was originally thought to be an unlikely cause of heart and lung disease. However public health and environmental science has since demonstrated that the present mix of particulate and gaseous pollutants is in fact highly toxic. There are probably several reasons for this. For example, in contrast to the relatively large tar laden particulates from burning dirty coal which caused episodes like the London Smog, traffic pollution now generates fine particles with a different size and composition, and gases such as NO2 which may cause injury to the respiratory system and amplify the effects of other pollutants such as particulates and drive the formation of the secondary pollutant ozone.
2.0 Which air pollutants are a threat to public health?
2.1 The criteria pollutants: The World Health Organisation identifies five pollutants, particulates (PM10), nitrogen dioxide (NO2), sulphur dioxide (SO2), ozone (O3) and carbon monoxide, as important (“criteria”) pollutants relevant to health protection. Although carbon monoxide at present urban levels is a potentially important cause of health problems such as cardiovascular disease, the current research focus is mainly on the other four pollutants PM10 (also referred to as Respirable Suspended Particulates (RSP)), NO2, SO2 and O3.
2.2 Particulates: Particulates which are involved in causing health effects are sized in millionths of a metre (microns). The diameter of a human hair is approximately 70 microns while particulate matter of prime environmental interest is estimated to be 10 microns or less (PM10). Fine (2.5 microns) or ultra-fine (0.1 microns) particulates are probably the most hazardous because of their ability to penetrate the airways of the lung and gain access to other body tissues. Ultra fine particles, which are approaching the size of viruses, have very low mass but are present in very large numbers. Their large surface area may be the most significant factor in their ability to deliver toxic chemicals to respiratory and circulatory systems. They remain suspended in the air for long periods prolonging the period of exposure to anyone breathing polluted air. However all fractions of PM10 should be regarded as hazardous and there is substantial evidence that PM2.5 – PM10 (the so-called “coarse fraction”) causes inflammatory changes in body tissues.
6

2.3 Volatile Organic Compounds: Urban pollutant emissions from road vehicles and industrial processes include volatile organic compounds (VOCs) such as benzene, 1:3 butadiene and benzo(a)pyrene and many others, which are implicated in the causation of cancers including leukaemia, and damage to embryos in the uterus of a pregnant mother.
2.4 Gases: Primary combustion sources such as power generation, manufacturing, traffic,
marine and port activities are responsible for emissions of particulates, NO2 and SO2, while ozone is formed from a complex series of reactions involving NO2 and VOCs under the action of ultra violet light. There is a strong interaction between ozone and oxides of nitrogen. Nitric oxide which is a principal emission from traffic exhausts scavenges ozone, reducing its ambient levels. One possible implication of this is that initial reductions in traffic emissions may lead to higher street levels of ozone in a relatively high overall pollution environment. Gases are important pollutants because they may cause injury to sensitive tissues and also generate secondary particles, typically in the ultra fine range. In studies of air pollution health effects in Hong Kong and mainland China gases consistently show strong effects on bad health outcomes.
2.5 Seasonal and annual risks: Pollutants follow a strong seasonal pattern in Hong Kong with peaks in the distribution of PM10, NO2 and ozone occurring in the cool season (approximately October to March) and a smaller peak for SO2 in the warm season.
Figure 2: Seasonal patterns of pollutants in Hong Kong showing that even the lowest warm season levels are well above the WHO guidelines (downloaded from EPD and the Hedley Index http://147.8.71.207/pollution/home.php#s) The months of July and August represent the lowest average pollutant levels in Hong Kong but these are currently still high in terms of harm to public health, as indicated by the WHO Air Quality Guidelines.
7

3.0 How do air pollution exposures lead to bad health outcomes? 3.1 Inflammation: The mechanism by which air pollutants may damage healthy tissues is
an extensive, complex and evolving subject. The current laboratory and clinical evidence strongly suggests that exposures to pollution generate inflammation throughout the body and disrupt or destroy many normal physiological processes which are essential for health. The effects of pollution will therefore to some extent reflect the predisposition (genetic, environmental lifestyle and behavioural factors) to develop these diseases in a population together with the existing prevalence of diseases which may be exacerbated by pollution. Living in polluted urban environments is associated with increased levels of biological markers of inflammation compared with residence in a clean air environment. A move from a polluted to a cleaner environment is associated with a reduction in inflammatory markers in body tissues.
3.2 The pyramid of effects: Investigations into the causation of health problems and health care utilisation can be summarized in the form of a pyramid (Figure 3). At the base of the pyramid we can identify the earliest pathological inflammatory changes as biological markers.
At the next level the previously “silent injury” becomes symptomatic. Health care utilization increases Self-medication and use of traditional medicine may precede or take place concurrently with formal Western medicine at the primary care level.
Proportion of the population affected
Silent injury detected by biological testing but largely unmeasured in populations
Evidence of adverse health effects from clinical studiesandpopulation surveys
function, or damage toindividual organs or body systems
Disturbed physiological
Morbidity &increased healthcare utilisation
Mortality
Pollutant Exposure
Those with serious disease may require hospitalisation and continuing specialist care.
i
Figure 3: The burden of ill-health and the risks of future llnesses can be represented as a pyramid
The tip of the pyramid comprises the premature deaths caused by health problems which are initiated or exacerbated by exposures to air pollutants. This graphical view of the impact of pollution on health and the health care system can also be viewed as an “iceberg”. The bad health outcomes which are most visible are only the tip of the iceberg and much of the burden placed on the future of community health and the economy is hidden.
3.3 Making the diagnosis: One important difficulty in assessing both the causal relationships between air pollution and health, and the specific health outcomes, is that the air pollution injury is not labelled with a specific medical diagnosis, such as an International Classification of Disease diagnostic rubric. This can be contrasted with infectious diseases such as influenza or severe acute respiratory syndrome
8

(SARS) caused by specific viruses where the agent causing the disease can be isolated and recovered from body tissues.
The damage caused by air pollution inevitably manifests itself through a variety of common and recognised health problems such as upper respiratory complaints heart and lung disease. Because of this we can use epidemiological and statistical methods as well as clinical studies to detect the “signal” of changes in health problems and increased health care demands in the population caused on a daily basis by air pollution. It is worth reflecting that if the several thousand serious illnesses and deaths associated with pollution annually in Hong Kong carried a diagnostic label of Air Pollution then official recognition of the serious detriment to population health might conceivably be on a different level today.
3.4 Which health problems are definitely or probably associated with air pollution exposures?: Based on different levels of evidence, the number of reliable studies and biological plausibility the following list provides an indication of the systemic multi-organ involvement in the injuries caused by breathing polluted air. Cardiovascular disease Formation of arterial plaques (atherosclerosis) Coronary artery disease Heart attacks (myocardial infarction) Irregular heart rhythm (arrythmias) Loss of heart rate variability Stiffening of arterial walls (arteriosclerosis) High blood pressure (hypertension) Alteration of clotting factors increasing the coagulability of blood Stroke (cerebral thrombosis) Respiratory disease Inflammation of nasal, sinus, throat and tracheal airways with acute or chronic
symptoms Lower respiratory tract inflammation and infection causing bronchitis and pneumonia Chronic airways damage causing chronic obstructive pulmonary disease (chronic
bronchitis and emphysema of COPD) Initiation and/or exacerbation of asthma Reduction lung growth and function in young people Interactions between inflammation, respiratory and vascular effects from air pollution Exposure to particulates and other air pollutants causes a specific decline in lung function which can, for example, be measured as a test of the forced expiratory volume of air achieved in one second (FEV1). There is a strong association between reduced lung function based on this type of measurement and cerebrovascular disease measured as stroke. The possible mechanism for this association is an active area of research but there are several strong indicators. Following exposure to air pollutants there is an increase in
9
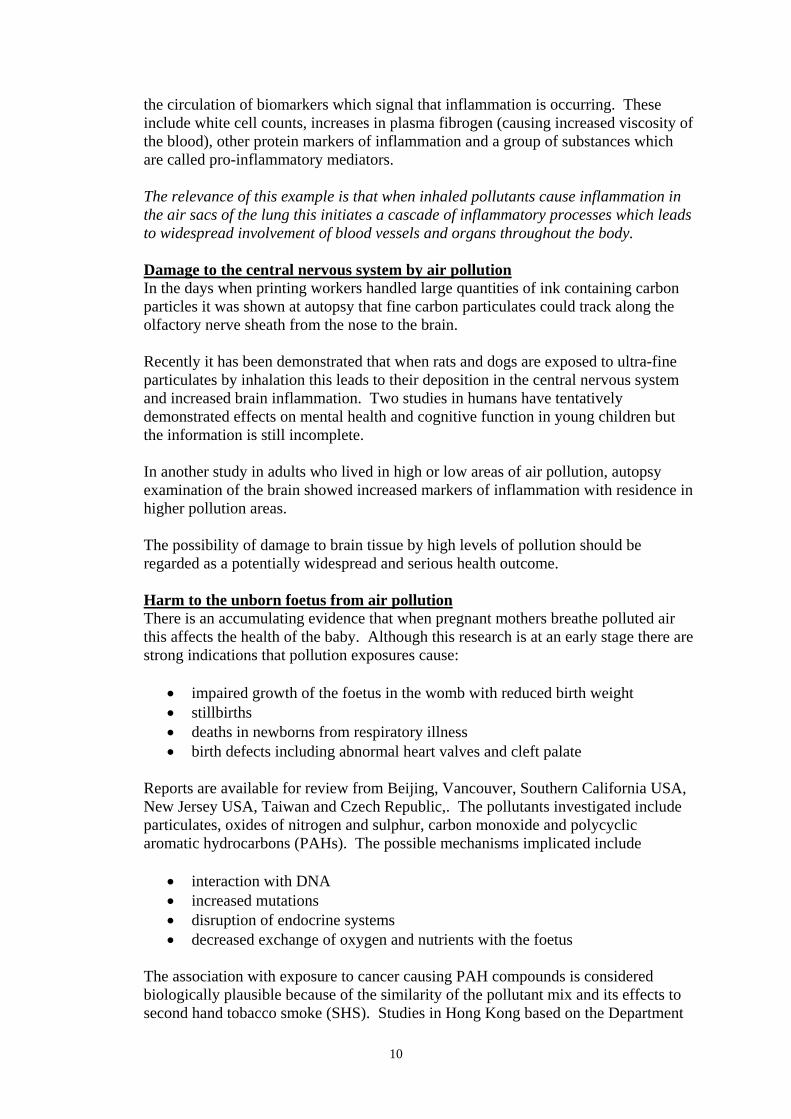
the circulation of biomarkers which signal that inflammation is occurring. These include white cell counts, increases in plasma fibrogen (causing increased viscosity of the blood), other protein markers of inflammation and a group of substances which are called pro-inflammatory mediators. The relevance of this example is that when inhaled pollutants cause inflammation in the air sacs of the lung this initiates a cascade of inflammatory processes which leads to widespread involvement of blood vessels and organs throughout the body. Damage to the central nervous system by air pollution In the days when printing workers handled large quantities of ink containing carbon particles it was shown at autopsy that fine carbon particulates could track along the olfactory nerve sheath from the nose to the brain. Recently it has been demonstrated that when rats and dogs are exposed to ultra-fine particulates by inhalation this leads to their deposition in the central nervous system and increased brain inflammation. Two studies in humans have tentatively demonstrated effects on mental health and cognitive function in young children but the information is still incomplete. In another study in adults who lived in high or low areas of air pollution, autopsy examination of the brain showed increased markers of inflammation with residence in higher pollution areas. The possibility of damage to brain tissue by high levels of pollution should be regarded as a potentially widespread and serious health outcome. Harm to the unborn foetus from air pollution There is an accumulating evidence that when pregnant mothers breathe polluted air this affects the health of the baby. Although this research is at an early stage there are strong indications that pollution exposures cause:
• impaired growth of the foetus in the womb with reduced birth weight • stillbirths • deaths in newborns from respiratory illness • birth defects including abnormal heart valves and cleft palate
Reports are available for review from Beijing, Vancouver, Southern California USA, New Jersey USA, Taiwan and Czech Republic,. The pollutants investigated include particulates, oxides of nitrogen and sulphur, carbon monoxide and polycyclic aromatic hydrocarbons (PAHs). The possible mechanisms implicated include
• interaction with DNA • increased mutations • disruption of endocrine systems • decreased exchange of oxygen and nutrients with the foetus
The association with exposure to cancer causing PAH compounds is considered biologically plausible because of the similarity of the pollutant mix and its effects to second hand tobacco smoke (SHS). Studies in Hong Kong based on the Department
10
of Health birth cohort have shown reduced birth weights in babies born to mothers exposed to SHS (Leung et al 2003; Leung et al 2004).
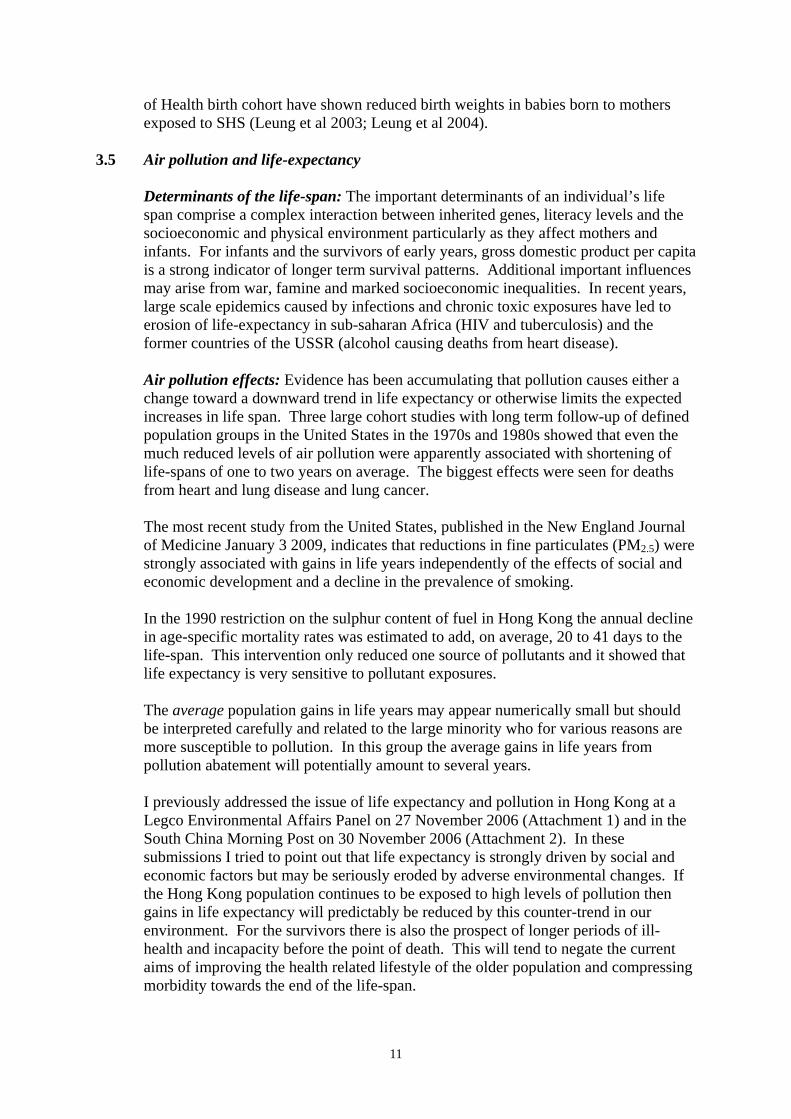
3.5 Air pollution and life-expectancy Determinants of the life-span: The important determinants of an individual’s life span comprise a complex interaction between inherited genes, literacy levels and the socioeconomic and physical environment particularly as they affect mothers and infants. For infants and the survivors of early years, gross domestic product per capita is a strong indicator of longer term survival patterns. Additional important influences may arise from war, famine and marked socioeconomic inequalities. In recent years, large scale epidemics caused by infections and chronic toxic exposures have led to erosion of life-expectancy in sub-saharan Africa (HIV and tuberculosis) and the former countries of the USSR (alcohol causing deaths from heart disease). Air pollution effects: Evidence has been accumulating that pollution causes either a change toward a downward trend in life expectancy or otherwise limits the expected increases in life span. Three large cohort studies with long term follow-up of defined population groups in the United States in the 1970s and 1980s showed that even the much reduced levels of air pollution were apparently associated with shortening of life-spans of one to two years on average. The biggest effects were seen for deaths from heart and lung disease and lung cancer. The most recent study from the United States, published in the New England Journal of Medicine January 3 2009, indicates that reductions in fine particulates (PM2.5) were strongly associated with gains in life years independently of the effects of social and economic development and a decline in the prevalence of smoking. In the 1990 restriction on the sulphur content of fuel in Hong Kong the annual decline in age-specific mortality rates was estimated to add, on average, 20 to 41 days to the life-span. This intervention only reduced one source of pollutants and it showed that life expectancy is very sensitive to pollutant exposures. The average population gains in life years may appear numerically small but should be interpreted carefully and related to the large minority who for various reasons are more susceptible to pollution. In this group the average gains in life years from pollution abatement will potentially amount to several years. I previously addressed the issue of life expectancy and pollution in Hong Kong at a Legco Environmental Affairs Panel on 27 November 2006 (Attachment 1) and in the South China Morning Post on 30 November 2006 (Attachment 2). In these submissions I tried to point out that life expectancy is strongly driven by social and economic factors but may be seriously eroded by adverse environmental changes. If the Hong Kong population continues to be exposed to high levels of pollution then gains in life expectancy will predictably be reduced by this counter-trend in our environment. For the survivors there is also the prospect of longer periods of ill-health and incapacity before the point of death. This will tend to negate the current aims of improving the health related lifestyle of the older population and compressing morbidity towards the end of the life-span.
11

4.0 How are the public health risks of air pollution estimated in Hong Kong?
The work on the population health risks arising from air pollution has been carried out principally by two teams in the Chinese University of Hong Kong (Professor TW Wong) and in The University of Hong Kong (Dr CM Wong).
Hong Kong has some excellent information systems which can be used to support epidemiological and public health research at the population level. These include:
• The Environmental Protection Department air quality monitoring network in 10
districts with 3 additional roadside stations. • The Census and Statistics Department and the Department of Health register of
deaths labeled by WHO (ICD) diagnostic rubrics. • The Hospital Authority Clinical Medical System which provides discharge
diagnoses on all patients admitted to the public hospital system.
Access to information in the private sector is much more limited and this is an important deficiency particularly if we need to study primary medical care where most of the daily medical work occurs in the HKSAR. For this reason special studies have had to be designed and implemented in primary care. Three reports can be reviewed to illustrate the methodology applied to study pollution and health outcomes.
4.1 Association between air pollution and general practitioner visits for respiratory
diseases in Hong Kong (Wong TW et al 2006) Clinic attendance data from a network of GPs was analyzed to derive the relationship between air pollution and daily doctor visits for respiratory problems. Significant associations were observed for first time attendances and increases in concentrations of PM2.5, PM10, NO2 and O3. Increased risks were found for both upper respiratory tract infections (URTI) and for other respiratory problems. The highest excess risk per 10 micrograms/cubic metre (m3) of pollutant (3.0%) was observed for NO2.
4.2 Effects of air pollution on hospital admissions in Hong Kong and London (Wong CM et al 2002)
This enquiry was conducted using the same standardized methodology and similar data in two populations in Hong Kong and the United Kingdom. We hypothesized that similar results in the two locations would strengthen the evidence for a causal association between air pollution and the need for treatment at a high level of the health care system. Using data for admissions over a two year period we found similar risks for most pollutants and medical conditions in the two cities despite the considerable differences in ethnicity, social, life-style and environmental conditions.
The associations between cardiac admissions and PM10, NO2 and SO2 were similar in Hong Kong and London as were patterns of association specifically for ischaemic heart disease.
12

The strongest associations were found in the periods of lowest humidity: the cool season for Hong Kong and warm season for London. The highest excess risks for hospital admission per 10 micrograms/m3 of pollutant in Hong Kong were for NO2 and SO2 for both heart and lung diseases. PM10 also exerted a strong effect.
4.3 Effect of air pollution on mortality (Wong CM et al 2001)
In this study the effects of four air pollutants on mortality in both cool and warm seasons were studied. Again the oxidant gases NO2 and SO2 showed a strong cool season effect on mortality in addition to the effects of particulates.
Typically the short term excess risks for air pollution effects on morbidity and mortality range from 0.5% to 3.0% for each pollutant. When applied to the whole population these additional risks lead to large cumulative number of avoidable illnesses and deaths.
4.4 Effects of air pollution on mortality in socially deprived urban areas (Wong CM et al 2008)
We examined the interaction between social deprivation (including unemployment; household income; schooling; one-person household; marital status) on information derived from a six year period in 209 Tertiary Planning Units. We found significant associations between NO2, SO2, PM10 and ozone with all non-trauma and cardiovascular deaths in areas of middle or high deprivation.
In areas categorized as high deprivation, cardiovascular and respiratory mortality was strongly associated with NO2 and SO2 compared with other less deprived areas. We have been able to consistently demonstrate the risks to health from air pollution, at different times, in different population samples and at different levels of the health care system. The risk estimates are a reliable and important tool in the estimation of the avoidable health problems caused by pollution.
5.0 What is the best evidence that pollution abatement protects health? This question concerns the level of evidence and its interpretation. The majority of studies rely on observations of daily changes in health outcomes with daily variations in ambient pollution (time series studies) and cohort follow-up studies which identify gradients in health experience with different exposures over varying periods of time from days to years. While true experiments in the allocation of different groups to high or low pollution are neither feasible nor desirable, several interventions which can be regarded as natural experiments can now be analyzed. The following five interventions could be said to have created a defining moment from which the impact on both air quality and health outcomes could be analyzed.
5.1 The Utah Valley steel mill (CA Pope III 1989) From August 1986 to September 1987 a worker’s strike closed a Utah steel mill which was known to generate large amounts of particulate pollution. The periods before, during and after closure of the mill provided a series of baseline and
13

intervention data on both air quality and the impact on child health. During closure of the mill the investigators found benefits to child and adult health in terms of reductions in:
• Elementary school absences • Abnormalities of lung function • Hospital admissions for bronchitis and asthma for pre-school children • Hospital admissions for pneumonia, pleurisy, bronchitis and asthma • Daily mortality • Age adjusted deaths for malignant and non-malignant respiratory disease • Pre-term births
The chemistry of the emissions from the mill includes the presence of the metals Iron, Copper, Zinc, Lead and Nickel. During the mill closure there were no further exceedances of the then 24 hour PM10 standard of 150 µg/m3 and child hospital admissions were about 3 times lower than the period before closure.
5.2 Coal sale bans in Dublin (Clancy L et al 2002) On September 1st 1990 the Irish government banned the marketing, sale and distribution of soft coal in Dublin city. An analysis of ambient air pollution and death rates showed that particulates (“black smoke”) fell by about 66% and SO2 by 33%. In a comparison of trends in death rates before and after the coal ban they found an overall 6% decrease in all non-trauma deaths, with a 10% to 16% reduction in fatal heart and lung diseases.
5.3 Fuel sulphur restriction in Hong Kong (Hedley AJ et al 2002) On July 1st 1990 all power plants and road vehicles were restricted to the use of fuel oil with not more than 0.5% sulphur by weight. This relatively small restriction led to an immediate and large reduction in ambient SO2, 45% on average and up to 80% in high pollution areas (Figure 4), and reductions in two metals Nickel and Vanadium (Figure 5).
1988 1989 1990 1991 1992 1993 1994 1995
020
4060
80
NO2
SO2
O3
PM10
Mic
rogr
ams
per c
ubic
met
re
Year
Fuel restriction on sulphur
50% reduction in SO2after the intervention
No change in other pollutants
Nickel Vanadium
Intervention Intervention
07/85 07/90 07/96 07/85 07/90 07/96
Years 1985-96 Years 1985-96
30
20
10
0
60
40
20
0
Nan
o gra
mpe
r cu b
ic m
e ter
Figure 4: Air pollutant concentrations in Hong Kong 1988-95: half yearly mean levels showing effect of fuel sulphur restriction
Figure 5: Effects of conversion to low sulphur fuel (0.5%) on transition metal concentrations in Hong Kong
14

In the two years following the intervention we found several health benefits including significant reductions in:
• chronic bronchitic symptoms • bronchial hyper-responsiveness
in primary school children aged mainly 8 to 10 years, and also in bronchitic symptoms in their mothers. In a separate analysis we found a significant decline (2.1%) in the average annual trend in deaths from all non-trauma causes with greater declines for respiratory deaths (3.9%) and in the elderly from cardiopulmonary causes (>4.0%). There was no sustained downward change in particulates, NO2 or O3, so this analysis provides evidence that emissions from sulphur rich fuels (including SO2, Nickel and Vanadium) are the probable cause of respiratory disease in children and cardiopulmonary deaths in adults. This modest restriction of sulphur emissions reduced bronchitic problems in thousands of children, and cardiopulmonary deaths by 600 annually in people aged 46 and older. It is notable that the Hong Kong 1990 fuel sulphur intervention stands as one of the definitive pieces of evidence which guided decisions on the World Health Organisation Air Quality Guidelines.
5.4 California Children’s Health Study (CHS) (Avol et al 2001) The CHS provides us with an interesting and important set of observations on the effect of changing exposures in a vulnerable group. The main study is a large scale long term analysis of chronic air pollution exposures on child health. In one sub-study they followed 110 children who moved residence to lower or higher levels of pollution. Those who moved to lower PM10 pollution showed improved lung growth and development while the converse applied to those moving to higher PM10 areas.
5.5 Traffic pollution during the Atlanta Olympics 1996 (Friedman et al 2001) During the 17 days of the 1996 Olympics, traffic patterns were changed leading to reductions in exposures from mobile emissions. Across the four weeks before and after the games ozone, PM10 and carbon monoxide levels declined. Hospital admissions for childhood asthma declined by about 40% during the games while there was no change in other illness patterns. These five examples clearly demonstrate, in a way which satisfies the criteria for establishing causality, how appropriate, practicable and economically viable interventions can quickly yield very large health gains among those most vulnerable to environmental pollution.
6.0 Who are most vulnerable to air pollution?
6.1 High risk groups: Air pollution potentially affects everyone but on different time scales, and some are much more vulnerable than others. As with any health problem arising from environmental or behavioural risks there may be important interactions with an individual’s genetic make-up or previous and current medical problems.
15

Those most sensitive to air pollution health effects include
• the very young • the elderly • those with either asymptomatic or established morbidity • those with lifestyle risk factors for chronic disease including
* sedentary life-style * active or passive smoking * poor nutrition, especially a lack of anti-oxidant rich foods
Particular disease groups or health states have been identified as especially at-risk from chronic air pollution exposures; they include
• heart and blood vessel disease • lung disease and those with other exposures which may cause or aggravate
lung disease • diabetes • other inflammatory conditions such as rheumatoid arthritis • overweight/obesity
Air pollution may initiate a disease process or independently aggravate it in a way which causes a serious illness. An example would be the development of atherosclerosis. The formation of atherosclerotic plaques through the deposition of lipids in the arterial wall is promoted by the action of pollutants on the endothelial or lining cells of the arterial wall. In an episode of inflammation caused by pollution the plaque may rupture causing blood clots to form and resulting in a heart attack or stroke.
6.2 Social inequity; the poor and disadvantaged: Evidence is emerging from studies in different countries that the impact of pollution on those who are most disadvantaged in the community may be very marked. In Hong Kong we have shown that those with lower socio-economic status or living in more deprived areas have higher pollution related mortality risks than those who are better off and living in better conditions (Ou CQ et al 2008; Wong CM et al 2008). Air pollution exposures are likely to be higher in more deprived areas and those who reside there are more susceptible to health problems and less able to maintain good health. The underlying causes of this source of social inequity may include lifestyle (housing, nutrition, smoking, recreational exercise) and access to and affordability of medical care.
7.0 How preventable is harm to health from air pollution?
7.1 Protection is difficult to achieve: It is very difficult to envisage any form of individual protection from ambient air pollution. Outdoors the exposure of the population to pollutants approximates to 100%. The wearing of ordinary surgical masks will make no difference to inhalation of gases or fine particles. The use of carbon filter masks and other new biotechnology masks could offer some degree of
16

protection. Those at high risk, for example with asthma, may possibly achieve protection for several hours a day especially in highly polluted environments. There is some evidence however that many people would find the wearing of close fitting masks unacceptable. It should also be stressed that there is as yet no formal evidence of overall health benefit in the context of normal activities of daily living.
7.2 Lifestyle: Lifestyle including nutrition are potentially important factors determining either susceptibility to or protection from pollution. There is evidence, of varying strengths, that the following would offer benefit:
• Nutrition: a diet rich in antioxidant foods (Because of the strong accumulating evidence on the neutral or even harmful effects of vitamin supplements we emphasise the need to base protection on diet and not medication).
• Smoking: smoking cessation and protection from second-hand smoke inhalation will make an important contribution to protection from ambient pollutant exposures. Active and passive smoking cause severe inflammatory changes in the lung.
• Physical fitness: good physical fitness, for example maintained by walking or other light to moderate exercise may protect against cardiopulmonary effects of pollutants and higher mortality risks (Wong CM et al 2007). More vigorous and prolonged exercise is likely to be associated with higher exposures and the risk of health problems. Training for competitive endurance events may be a particular hazard. There are many uncertainties associated with striking a balance between the health benefits of exercise and the risks of pollution exposures.
• Hot spots: avoidance of intense pollution exposures, for example at street level, would be advisable especially in children and those at-risk from heart and lung disease. However the average daily exposures in high pollution environments will be the main determinant of risk.
7.3 Indoor environments: Indoor pollution levels are usually largely determined by
outdoor concentrations of pollutants. Some mitigation can be expected by adsorption of pollutants onto furniture and fittings, however in relative terms the difference in overall daily exposure indoors may be small. Fresh air intakes on air conditioners will inevitably add outdoor pollution to the indoor environment and in residences close to busy roads this will make a significant contribution to exposures, as will open windows. Air filters within the indoor air space can reduce gases and particulates in a way which may benefit health. However they are costly in terms of average incomes and for that reason would not be available to a majority of the population. While there are sound reasons for trying to reduce exposure by any means available, and that would be particularly true for those most susceptible, there is as yet no formal scientific evidence that using air filters in the home prevents the cardiopulmonary problems which characterize populations living in a high pollution environment. Given the serious risks for health associated with indoor pollutants there should be the highest possible legal protection for indoor air quality, especially in terms of smoke free policies (Hedley et al 2006) The combination of outdoor pollution and indoor tobacco smoke has led to intense contamination of hospitality venues exempted from the Smoking (Public Health) (Amendment) Ordinance 2006.
17

7.4 High pollution alerts: The concept of an early warning system, based on a prediction
of high air pollution levels, has been popular and is still being advocated. There are many fallacies associated with this and we have written an extensive critique of the proposal for a “High Air Pollution (HAP) Day” alert (attachment 3). In summary our reasons for rejecting this approach include the following:
• the lack of any threshold level for pollutant-health effects means that any advisory to the public would be associated with a very high level of uncertainty.
• The current advisories associated with the Environment Protection
Department’s API levels are arguably totally meaningless and misleading because they are scaled using outdated information and air quality objectives which cannot protect health.
• While the adoption of the World Health Organisation guidelines for safer air
quality would provide a more valid indicator of risk, Hong Kong’s daily pollutant levels are so high that offering any advice on gradation or restriction of activities on a particular day is likely to be either invalid or, if precautionary, would probably have to be offered on more than 300 days of the year. That would certainly be the case through the cool season from October to March. This would understandably be unacceptable and unaffordable. People have to be able to get on with their lives and earning a living almost whatever the detriment to their health.
• Given Hong Kong’s present very high ambient levels of pollution a system of
HAP day alerts would create economic losses comparable to a very long series of typhoon signals across the year costing billions of dollars but without health benefits.
• Even if restriction of activities for some is feasible, it is unlikely that pollutant
levels can be predicted reliably and in a way which will prevent involuntary exposures. Sudden and large shifts in pollutants occur frequently in Hong Kong and would negate any possibility that people could plan their day to minimize exposures.
• It is important that those responsible for dealing with air quality management
or proposing community wide interventions to reduce exposures, fully understand the relationship between air pollutant concentrations, exposures and health risks. Again, it need to be emphasised that Hong Kong’s average levels of pollution and not simply exceptionally high days are the main drivers of morbidity and mortality. We should be cautious about recommending actions which carry the implied promise of benefit, when the evidence for benefit is uncertain.
• Given the public desire for advice we can continue to examine possible
approaches to daily air pollution advisories which might be helpful to individual decision making, providing the limitations are understood.
18

8.0 Monitoring pollution levels, assessing the risks and counting the costs: the need for accountability
8.1 The Hedley Environmental Index (HEI) (http://147.8.71.207/pollution/home.php#s): We have worked to bring together a comprehensive picture of air pollution as it affects
Hong Kong on an hourly basis. The HEI was developed by the air pollution research group at the Department of Community Medicine, School of Public Health, University of Hong Kong with funding, design and presentation support by Civic Exchange (www.civic-exchange.org) in collaboration with Fu Tak Iam Foundation and ADM Capital Foundation. The Index site uses the daily air monitoring data provided by the EPD and the Hong Kong Observatory webcam to provide an indication of current visibility in relation to air pollution levels. The real-time pollution surveillance system implemented and maintained by the Environmental Protection Department, using 10 general and 3 roadside monitors, is a valuable asset which has been adapted to provide the basis of an accountability system.
8.2 What does the HEI provide?: • Pollutants: The hourly, daily and annual levels of pollutants can be viewed
continuously in a Pollution Tracker scaled in relation to the World Health Organisation Air Quality Guidelines providing an immediate and continuous picture of the exceedances of the WHO indicators of safer air quality. The evidence from studies in Hong Kong and mainland China is that each pollutant has the potential to harm health. The new HEI allows the pattern of each of the four common pollutants and its potential health risks to be interpreted individually.
• Total Excess Risks: The total concentrations of pollutants are continuously
translated into excess risks using data from the studies on primary care utilisation, hospital admissions and deaths reported by the University of Hong Kong and Chinese University of Hong Kong research groups (see section 4.0).
• Burden of illness: Application of these excess risks allows us to derive estimates
of the avoidable burden of health problems if pollution levels were reduced from those being observed to the levels of the WHO guidelines.
• Cumulative displays: We have proposed a method for combining the risks of the
four pollutants and this is used to calculate the rate at which health care utilisation, premature deaths and costs are being incurred. These health events and dollar values are continuously displayed on digital clocks together with historical data and cumulative figures for any defined period of time (Figures 6 and 7).
• Dollar costs: The index shows the direct health care costs; the indirect costs of lost
productivity. We also present the intangible costs derived from the population’s willingness to pay to avoid a day of symptoms, an admission to hospital and a premature death which gives us a value of the lives lost due to pollution.
19

• A focus for accountability: We believe the index and its future development will help to provide a new focus for discussions and effective decision making on Hong Kong’s major threat to environmental health and the costs which are being paid by the whole community, including government, public and private sector services, employers and each individual.
Figure 6: The clock displays in this example are counting from 00:00 on 22 Jan to 23:50 on 22 Jan and show that at the time viewed (evening) the estimated number of doctor visits and the costs on that day
Figure 7: In 2008 the cumulative cost of air pollution was estimated at $2,317 billion for health care and lost productivity and $16.5 billion for pain and suffering and the value of lives lost
8.3 Visibility and the avoidable events caused by pollution, including doctor visits, hospital bed-days, deaths and dollar values: The HEI presents a cumulative record of the daily burden of disease and costs due to pollution. Reducing Hong Kong’s average annual levels of pollution to the WHO guideline level would avoid about 7 million doctor visits, 64,000 – 80,000 hospital bed-days for cardiopulmonary disease and 1,300 – 1,600 deaths each year. The direct and indirect costs of health care and
20
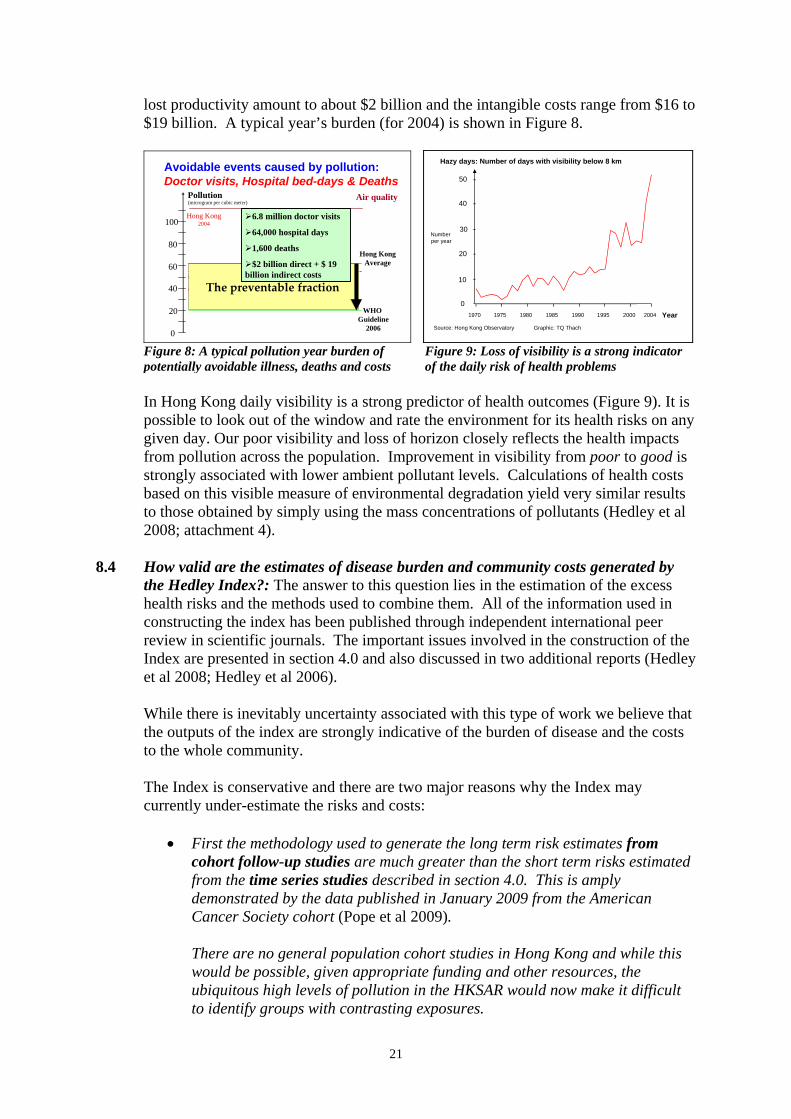
lost productivity amount to about $2 billion and the intangible costs range from $16 to $19 billion. A typical year’s burden (for 2004) is shown in Figure 8.
$2 Billion6.8M doctor visits64000 bed-days1600 deaths
Avoidable events caused by pollution: Doctor visits, Hospital bed-days & Deaths
0
20
40
60
80
100
(microgram per cubic meter)Pollution
Hong Kong2004
Air quality
WHO Guideline
2006
Hong KongAverage
The preventable fraction
6.8 million doctor visits
64,000 hospital days
1,600 deaths
$2 billion direct + $ 19 billion indirect costs
1970
0
20
40
50
Hazy days: Number of days with visibility below 8 km
Number per year
10
30
1975 1980 1985 1990 1995 2000 2004 YearSource: Hong Kong Observatory Graphic: TQ Thach
Figure 8: A typical pollution year burden of potentially avoidable illness, deaths and costs
Figure 9: Loss of visibility is a strong indicator of the daily risk of health problems
In Hong Kong daily visibility is a strong predictor of health outcomes (Figure 9). It is possible to look out of the window and rate the environment for its health risks on any given day. Our poor visibility and loss of horizon closely reflects the health impacts from pollution across the population. Improvement in visibility from poor to good is strongly associated with lower ambient pollutant levels. Calculations of health costs based on this visible measure of environmental degradation yield very similar results to those obtained by simply using the mass concentrations of pollutants (Hedley et al 2008; attachment 4).
8.4 How valid are the estimates of disease burden and community costs generated by
the Hedley Index?: The answer to this question lies in the estimation of the excess health risks and the methods used to combine them. All of the information used in constructing the index has been published through independent international peer review in scientific journals. The important issues involved in the construction of the Index are presented in section 4.0 and also discussed in two additional reports (Hedley et al 2008; Hedley et al 2006). While there is inevitably uncertainty associated with this type of work we believe that the outputs of the index are strongly indicative of the burden of disease and the costs to the whole community. The Index is conservative and there are two major reasons why the Index may currently under-estimate the risks and costs:
• First the methodology used to generate the long term risk estimates from cohort follow-up studies are much greater than the short term risks estimated from the time series studies described in section 4.0. This is amply demonstrated by the data published in January 2009 from the American Cancer Society cohort (Pope et al 2009).
There are no general population cohort studies in Hong Kong and while this would be possible, given appropriate funding and other resources, the ubiquitous high levels of pollution in the HKSAR would now make it difficult to identify groups with contrasting exposures.
21

• The second major reason why detriment to health is likely to be under-
estimated concerns the incompleteness of studies on health outcomes in Hong Kong. Several should be mentioned to illustrate this point:
o Intra-uterine growth retardation in the foetus o Psychomotor development in infants and children o The future long term effect on health related quality of life in children
whose lung function is being damaged by pollution o The additional impairment of health and health care costs in patients with
chronic disease including for example: * diabetes * coronary heart disease * asthma and chronic obstructive pulmonary disease
We should take special note of the study of 10 to 18 year old adolescents in southern California reported in 2004 (Gauderman et al 2004). Over an 8 year period of follow-up they found that exposures to NO2 and PM2.5 were strongly associated with deficits in lung function by age 18. This impairment of lung growth and development at entry to adulthood will predictably be a cause of poorer health related quality of life and reduced life expectancy. The average levels of NO2 experienced by this cohort of children were much lower than current average annual levels in Hong Kong.
9.0 Is air quality in Hong Kong improving? Our emphatic response to this question, from a public health viewpoint, is no. In a report published in the South China Morning Post on January 3, 2009 it is stated that an Environmental Protection Department spokeswoman said “concentrations of individual pollutants were a better means than the API to assess long term air quality trend and had been decreasing over the past 10 years.” While the first part of the statement is unquestionably true, the second part is open to serious doubt in terms of trends, their magnitude and relevance to health protection. It is important that appropriate statistical methodology is used to estimate and represent trends in pollutants, especially over the relatively short periods such as a few years. There is clearly considerable random variation in the data available and it would, for example, be extremely misleading to pick two points at the beginning or end of an arbitrary period of time and use the simple arithmetic difference in the data to infer that a significant trend had occurred. We would wish to emphasise the importance and public health impact of high roadside levels of pollution. Conservatively about 50% of the population live and/or work close to heavy traffic movements. In practice it is likely that a majority of the population is exposed to roadside pollution on most days of the week. A second important issue relates to the marked seasonal variation in pollutant levels. We should be cautious in using average annual levels of pollutants as the only indicator of exposure. Cool season pollutants are extremely high in Hong Kong and
22

there are important seasonal and pollutant interactions which give rise to the excess risks for health problems in Hong Kong. The following preliminary analysis for data from 1997-2008 and 2003-2008 provides strong indications of current trends and their implications for public health.*
9.1 Respirable Suspended Particulates (PM10) 1997-2008: RSP levels showed marked differences between general and roadside stations. In the period 1997-2008 the roadside levels, based on annual means, show an estimated 12% decline but this shallow slope if extrapolated will not approach the annual WHO guideline for several decades. At general stations the trend is stable or upwards (+4.0%) (Figure 9). An extrapolation of the past 10 years annual means for RSP indicates they would not reach WHO AQG until around year 2120. 1997-2008 cool season: An examination of the 1997-2008 cool season trends show an 84.5% increase at roadside stations and a stable or non-significant 15.4% increase at general stations (Figure 10). 2003-2008: In the period 2003-08 roadside quarterly means show a steep upward slope (33%) which is slightly accentuated (37%) when data for year 2004 (a particularly high pollution period) is omitted. At the general stations the levels are stable with the slope at present (–1.8% to –6.6%) and not significantly different from zero (Figure 11). There is clearly no indication that either curve would begin to approach the WHO guideline within the foreseeable future.
Figure 9: Trends for RSP in 1997-2008 show little change of public health relevance
1995 2000 2005 2010
020
4060
8010
0
Year
mic
rogr
ams
per c
ubic
met
er
General stationsRoadside stationsWithout 2004
Respirable suspended particulates (1997-2008)
WHO AQG (one year) =20
+4.0% (p>0.05)
+2.1% (p>0.05)
-12.3% (p<0.05)
-12.7% (p<0.05) (RS)
(GS)
* Technical note: We fitted a log-linear model on the quarterly mean pollutant data against the time trend from
year 2003 to 2008. We obtained the expected values of the model and predicted up to the end of year 2012 to obtain the estimated slope.
We also estimated the percentage change during the period, by the difference in the expected values between the last quarter of 2008 and the first quarter of 2003.
23

Figure 10: Cool season RSP trends show a marked upward trend at roadside stations
1995 2000 2005 2010
020
4060
8010
0
Year
mic
rogr
ams
per c
ubic
met
er
General stationsRoadside stations
Respirable suspended particulates (1997-2008 cool season)
WHO AQG (one year) =20
+84.5% (p<0.01)
(RS)
(GS)+15.4% (p>0.05)
Figure 11: Recent years show a clear upward trend for RSP at roadside stations
2003 2005 2007 2009 2011 2013
020
4060
8010
012
0
Year
mic
rogr
ams
per c
ubic
met
er
General stations (GS)Roadside stations (RS)Without 2004
Respirable suspended particulates (2003-2008)
WHO AQG (one year) =20
-6.6% (p>0.05)(G
+33.4% (p<0.01)
-1.8% (p>0.05)
+37.4% (p<0.01)
S)
(RS)
9.2 Nitrogen dioxide
1997-2008: Roadside station levels are stable or increasing (5.5%) (not significant); and general stations similarly show an essentially flat curve with a non-significant downward slope of –4.5% (Figure 12). 1997-2008: Cool season NO2 is very high and stable at both roadside and general stations. The slope at general stations (–7.5%) is not significant (Figure 13). Extrapolation of the cool season slope indicates that the WHO guideline would probably only be achieved sometime beyond year 2080. 2003-2008: The pattern is essentially the same over this shorter period with no significant change in high roadside levels. The estimate of –1.5% is modified to +2.2% with omission of year 2004. The apparent downward trend at general stations is markedly attenuated from –10.1% to –5.8% if the year 2004 is omitted (Figure 14).
24

Figure 12: The curves for NO are statistically flat and show no trend likely to benefit public health
1995 2000 2005 201040
6080
100
120
Year
mic
rogr
ams
per c
ubic
met
er
General stationsRoadside stationsWithout 2004
Nitrogen dioxide (1997-2008)
WHO AQG (one year) =40
-3.3% (p>0.05)
-4.5% (p>0.05)
+5.5% (p>0.05)
+5.2% (p>0.05)
Figure 13: Annual cool season NO2 levels are very high and show no significant change over the last ten years
1995 2000 2005 2010
4060
8010
012
0
Year
mic
rogr
ams
per c
ubic
met
er
General stationsRoadside stations
Nitrogen dioxide (1997-2008 cool season)
WHO AQG (one year) =40
-3.8% (p>0.05)
-7.5% (p>0.05)
Figure 14: Based on quarterly means high roadside levels show no change over the 5 years period. The apparent downward trend for general stations is unstable and strongly influenced by year on year variations.
Nitrogen dioxide (2003-2008)
WHO AQG (one year) =40
-10.1% (p>0.05)
-1.5% (p>0.05)
-5.8% (p>0.05)
+2.2% (p>0.05)
(GS)
(RS)
2003 2005 2007 2009 2011 2013
2040
6080
100
120
140
Year
mic
rogr
ams
per c
ubic
met
er
General stations (GS)Roadside stations (RS)Without 2004
25

9.3 Sulphur dioxide, nickel and vanadium 1990-2007: The early years of this period were subject to progressive restrictions on sulphur fuel content in Hong Kong with important reductions in ambient annual means. However around 1998 there is an apparent turning point leading to progressive degradation of air quality in terms of these pollutants which are strongly related to health impacts (Figure 15). These trends indicate that the benefits gained by the sulphur fuel restrictions in 1990 and beyond are being eroded. 2003-2008: At the general stations there was considerable variation of SO2 levels in several years. Estimates of trends are upwards though currently non-significant (Figure 16). However omission of the 2004 data indicates an increasing upward slope of 17.8%. At the roadside there is a clear significant increasing trend of 22% to 34.8% which is sensitive to the 2004 data. Overall there is concern that the gains made in abatement of SO2 and related emissions are being lost. The public health implications should be viewed as serious given the evidence from Hong Kong and elsewhere for its causal relationship with heart and lung disease.
Figure 15: The reduction in emissions from sulphur rich fuels in the early 1990s is now being negated by counter trends for SO2,Nickel and Vanadium
0
5
10
15
20
25
30
35
1990 1992 1994 1996 1998 2000 2002 2004 2006
Ni V SO2
Year
Con
cent
ratio
n (S
O2
in μ
g/m
3 ; N
i and
V in
ng/
m3 )
Sulphur dioxide, Nickel and Vanadium trends: 1990-2007
p=0.010
p=0.038
p<0.000
Source: EPD Air Quality in Hong Kong
Figure 16: There are strong indications that SO2 concentrations are rising at both general and roadside stations
2003 2005 2007 2009 2011 2013
010
2030
40
Year
General stationsWithout 2004
2003 2005 2007 2009 2011 2013
010
2030
40
Year
mic
rogr
ams
per c
ubic
met
er
Roadside stationsWithout 2004
Sulphur dioxide (2003-2008)
WHO AQG (24 hours) =20
+6.6% (p>0.05)
+22.0% (p>0.05)
+17.8% (p>0.05)
+34.8% (p<0.05)
26

10.0 Should Hong Kong adopt the WHO Guidelines as a formal step toward exposure reduction?
10.1 Key points in the introduction to WHO AQG: The 2005 WHO Guidelines were
based on a comprehensive review of the best available evidence on the health effects of the criteria pollutants RSP (PM10), NO2, SO2 and O3. The Air Quality Guidelines Global Update 2005 states
“The guidelines are written for worldwide use, and are intended to support actions aiming for the optimal (my emphasis) achievable level of air quality in order to protect public health in different contexts”
This is the first statement in the advice offered on the use of the “Updated guidelines and air quality management”. It goes on to emphasise that Statement (1) “Air quality standards are an important instrument of risk
management and environmental policy, and should be set by each country to protect the health of its citizens.”
Statement (2) “The standards set in each country will vary according to specific approaches to balancing risks to health, technological feasibility, economic considerations and other political and social factors.”
Statement (3) “This variability will depend on the country’s level of development, capability in air quality management and other factors.”
10.2 Interpretation of the WHO advisory by HKSAR government
Statement (3) is a classical piece of diplomatic phraseology which is an obligatory part of any report from an agency of the United Nations. However it is susceptible to misappropriation as a justification for inadequate action on air quality management. The inclusion of a phrase on “economic considerations” perhaps makes it particularly prone to misunderstanding or manipulation. In Hong Kong official statements on air pollution virtually never refer to the primacy of health protection. On the other hand the HKSAR government repeatedly refers to Statement (2) and (3). There is no reference by government to the collective strengths in Hong Kong in environmental science and economics, public health and community based advocacy which could form a powerful advisory body with the capability to help the government initiate and expedite exposure reduction. The substantial international track record of three universities, NGOs, and some professionals working in EPD, is largely being ignored.
27

When academics and others with expertise and experience were invited to join an “Advisory Panel” on the current “Review of Air Quality Objectives” they, along with other members, were apparently ignored and by-passed over the decision on adoption of WHO IT-1.
10.3 The HKSAR present position on WHO AQG The recent adoption of Interim Target-1 (IT-1) The government has now apparently adopted the low level Interim Target-1 criterion as its main definitive strategy, at least in the short term. Several points should be made:
• the Interim Targets are in the WHO AQG report to provide an entry level
approach for countries with a serious lack of resources and expertise. They are not intended as a mechanism for inaction in a very high GDP per capita environment with the potential to act quickly and decisively.
• If the IT-1 is applied in Hong Kong it will predictably make no difference to
pollutants originating in Hong Kong
The introduction of IT-1 will influence and colour the entire policy, and the audit and evaluation of any interventions. It will likely delay any prospect of achieving the necessary major reductions in pollutants. The IT-1 is more permissive than the present HKAQO in terms of the annual level (70µg/m3) and the same as the current mainland lax 24 hour level of 150µg/m3. If it is implemented, even with our current very high levels of pollution we will achieve about 98% or greater compliance with IT-1, even in the cool season at the roadside, according to the EPD daily RSP readings. In 1997 to 1999 the 99th percentiles of 24 hour cool season roadside RSP were 145, 131 and 144 µg/m3 respectively, and therefore below the IT-1 24 hour level. There is therefore apparently no mechanism whereby adoption of IT-1 is going to make any impact on Hong Kong’s annual particulate levels of pollution.
10.4 What can we contribute to this argument? The government’s often repeated justification for inaction is that “no other jurisdiction has so far adopted the AQG”. The senior officials in the Environment Bureau refer to pollution mitigation as a “long term aspirational goal”. This viewpoint, together with repetition of the diplomatic caveats from the WHO report have led to a spurious line of reasoning which will have serious public health consequences in Hong Kong. It may be helpful if we can define the principal arguments against the adoption of a low key approach to the obvious and urgent targets for pollution abatement. As a possible primer, the following points have been made by our Air Quality Objective Concern Group (AQOCG) coordinated by Civic Exchange:
28

(i) We are talking about the need for public health protection in Hong Kong, not
other jurisdictions. We do not know of any similar socially and economically developed region which has the same sustained, widespread and serious degradation of air quality. Other jurisdictions with much lower levels of pollution are not so challenged, but nevertheless are moving towards tighter standards and progressive interventions to reduce exposures. The European Commission is taking legal action against member countries (such as the United Kingdom) with much lower levels of pollution than Hong Kong, for non-compliance with EU standards.
(ii) Other jurisdictions already have in place mechanisms for regular assessments and
reviews, as part of an evidence-based regulatory procedure. So we can expect these overseas regulations to move forward along predictable time-lines.
(iii)Hong Kong’s air quality objectives have remained unchanged for 21 years. The
science base today bears no relation whatever to the situation in the early to mid-1980’s when the USEPA formulated the standards on which the HKAQO was eventually based. From this perspective Hong Kong has no valid regulatory framework at present, within which we might be able to work to reduce emissions in a way which reduces pollutant concentrations to safer levels.
(iv) Despite the serious environmental situation, public confidence and health
protection would be bolstered by the adoption of an evidence based strategy and a transparent and valid framework for audit and evaluation, with clear evidence for the achievement of benefits.
(v) We need to oppose any argument which involves the cost of a clean-up, without
reference to both the monetised and non-monetised external costs of the present damage caused by pollution. The United States Environmental Protection Agency has made a statement which makes very clear the health protection imperatives rather than a cost based approach.
(vi) Senior officials in the Hong Kong Environment Bureau have repeatedly stated
that clean air and blue skies will have to be paid for. Our analyses of pollution related costs clearly show that the whole community is now paying a very high price for dirty air.
11.0 How can risks to population health from air pollution be reduced?
11.1 An issue of human rights: Clean air must be regarded as a human right along with
clean food and water. While public health action on food which is a vector for disease and unfit for consumption has been largely swift and comprehensive, no such imperatives have been accepted for the achievement of clean air. The demonstration of environmental injustice, with the more disadvantaged sectors of the community bearing a greater burden of the pollution epidemic provides clear grounds for government to accept responsibility and ensure effective action.
29

The primacy of child health protection should at the very least be regarded as immutable by government. The evidence provided by the EPD high quality monitoring network clearly shows (through diurnal, seasonal and other spatial variations) the avoidable fraction of air pollution (which will reflect individual exposures) which results from emissions in Hong Kong. In addition a detailed analysis of pollution sources by Dr Alexis Lau of the University of Science and Technology demonstrated that about 53% of the annual time-related exposure was dominated by pollutants originating in Hong Kong (Relative Significance of Local vs. Regional Sources: Hong Kong’s Air Pollution www.civic-exchange.org). This is an important finding for public health because it points to important cost-effective solutions to avoidable morbidity and mortality within the HKSAR. Hong Kong needs to devise and implement a series of effective multisector interventions on a much shorter timescale than is apparently currently envisaged to avoid or at least lessen the creation of a large long term epidemic of pollution induced ill-health in young people. Hong Kong needs a rational radical evidence-based strategy which will address the large and growing threat to public health as a matter of urgency.
11.2 Exposure reduction must become an urgent and achievable goal: While we strongly support the adoption of the WHO Guidelines as a basis for formulating air quality standards and creating “caps”, these single limit values should not be misinterpreted or misused. Lessons must be learned from the disastrous application of the Hong Kong Air Quality Objectives under the Environment Impact Assessment Ordinance. The HKAQOs became an instrument whereby pollution in a given location, from a new development, could legally be increased. That remains the situation today and it is inevitable that this mechanism has contributed to the population burden of ill-health caused by pollution. It bears repeating that current scientific studies suggest there is no threshold for health effects from a pollutant such as PM2.5. The European Commission has proposed the concept of Exposure Reduction Targets (ERT). The introduction of ERT would be the principal strategy for protecting public health in that it would require that pollutant concentrations are reduced even in relatively clean areas. If limit values are the sole instrument for pollution abatement then as air quality improves smaller proportions will be affected by exceedances. However these individuals are likely to be the most vulnerable and therefore achievement of the public health objectives will be compromised. Emission Reduction Targets should be focussed on areas of greatest need in a fail-safe strategy to protect health and not simply, as previously stated by the Environment Bureau, “on a best endeavour basis”. Limit values should be rigorous to ensure that any individual’s risk is minimized while coverage of the whole population, in terms of exposure reduction, ensures that opportunities to maximize the avoidable fraction are achieved.
30

In the process of air quality management in Hong Kong there should be greater emphasis on the ambient pollutant concentrations as a proxy for exposures. Repetitious statements about emission reductions may reflect attempts to mitigate pollution but they have little public health relevance if they do not lead to improvements in air quality measured as concentrations per cubic metre of air. Finally we need a better translation of public health research, on air pollution effects, into policy, practice and enforcement.
11.3 The public health viewpoint: The lack of any formal authority or responsibility for air pollution related environmental health problems among the public sector health authorities, including public health physicians and other disciplines, should be remedied without further delay. At the present time the only public health research and advocacy on air pollution takes place among non-governmental organisations. We need better data on lifetime exposures and their relationship to health experience and given the magnitude and seriousness of the problem there should be substantive additional resource allocation for high quality multisectoral work on the impact of pollution on population health and the economy. The World Health Organisation Air Quality Guidelines should be adopted without further delay. At the same time the purpose of the guidelines should not be misinterpreted.
31
References and Bibliography Key References Avol EL, Gauderman WJ, Tan SM, London SJ, Peters JM. Respiratory effects of relocating to areas of differing air pollution levels. American Journal of Respiratory and Critical Care Medicine 2001; 164:2067-72. Clancy L, Goodman P, Sinclair H, Dockery DW. Effect of air-pollution control on death rates in Dublin: Ireland: an intervention study. Lancet 2002; 360:1210-4. Impact of changes in transportation and commuting ehaviours during the 1996 Summer Olympic Games in Atlanta on air quality and childhood asthma. The Journal of the American Medical Association 2001; 285:897-905. Gauderman WJ, Avol E, Gilliland F, Vora H, Thomas D, Berhane K, McConnell R, Kuenzli N, Lurmann F, Rappaport E, Margolis H, Bates D, Peters J. The effect of air pollution on lung development from 10 to 18 years of age. New England Journal of Medicine 2004; 351:1057-67. Hedley AJ, McGhee SM, Barron B, Chau YK, Chau J, Thach TQ, Wong TW, Loh C, Wong CM. Air pollution: costs and paths to a solution in Hong Kong – understanding the connections among visibility, air pollution and health costs in pursuit of accountability, environmental justice and health protection. Journal of Toxicology and Environmental Health A 2008; 71:544-54. Hedley AJ, McGhee SM, Wong CM, Barron B, Chau YK, Chau J, Thach TQ, Wong TW, Loh C. Air pollution: costs and paths to a solution. Department of Community Medicine University of Hong Kong, 2006. http://www.civic-exchange.org/eng/upload/files/200606_AirPollutionSolution.pdf Hedley AJ, McGhee SM, Repace JL, Wong LC, Yu MY, Wong TW, Lam TH. Risks for heart disease and lung cancer from passive smoking by workers in the catering industry. Toxicological Sciences 2006; 90: 539-48. Hedley AJ, Wong CM, Thach TQ, Ma S, Lam TH, Anderson HR. Cardiorespiratory and all-cause mortality after restrictions on sulphur content of fuel in Hong Kong: an intervention study. Lancet 2002; 360:1646-52. Leung GM, Ho LM, Lam TH. Secondhand smoke exposure, smoking hygiene, and hospitalization in the first 18 months of life. Archives of Pediatrics & Adolescent Medicine 2004; 158:687-93. Leung GM, Ho LM, Lam TH. The economic burden of environmental tobacco smoke in the first year of life. Archives of Disease in Childhood 2003; 88:767-71. Ou CQ, Hedley AJ, Chung RY, Thach TQ, Chau YK, Chan KP, Yang L, Ho SY, Wong CM, Lam TH Socioeconomic disparities in air pollution-associated mortality. Environmental Research 2008; 107:237-44. Pope CA 3rd, Renlund DG, Kfoury AG, May HT, Horne BD. Relation of heart failure hospitalization to exposure to fine particulate air pollution. American Journal of Cardiology 2008; 102:1230-4. Pope CA 3rd. Respiratory disease associated with community air pollution and a steel mill, Utah Valley. American Journal of Public Health 1989; 79:623-8.
32

Wong CM, Ou CQ, Chan KP, Chau YK, Thach TQ, Yang L, Chung RYN, Thomas GN, Peiris JSM, Wong TW, Hedley AJ, Lam TH. The effects of air pollution on mortality in socially deprived urban areas in Hong Kong. Environmental Health Perspectives 2008; 116:1189-94. Wong CM, Ou CQ, Thach TQ, Chau YK, Chan KP, Ho SY, Chung RY, Hedley AJ, Lam TH. Does regular exercise protect against air pollution-associated mortality? Preventive Medicine 2007; 44:386-92. Wong CM, Atkinson R, HR Anderson, Hedley AJ, Ma S, Chau PYK, Lam TH. A tale of two cities: effects of air pollution on hospital admissions in Hong Kong and London compared. Environmental Health Perspectives 2002; 110:67-76. Wong CM, Ma S, Hedley AJ, Lam TH. Effect of air pollution on daily mortality in Hong Kong. Environmental Health Perspectives 2001; 109:335-340. Wong TW, Tam W, Yu ITS, Wun YT, Wong AHS, Wong CM. The Association between Air Pollution and General Practitioner Visits for Respiratory Diseases in Hong Kong. Thorax 2006; 61:585-591. Bibliography The University of Hong Kong 1. Zhang ZH, Lai HK, Chau YK, Wong CM. A review of the effects of particulate matter-
associated nickel and vanadium species on cardiovascular and respiratory system. International Journal of Environmental Health Research (in press).
2. Wong CM, Vichit-Vadakan N, Kan H, Qian Z. Public health and Air Pollution in Asia (PAPA): a multicity study of short-term effects of air pollution on mortality. . Environmental Health Perspectives 2008; 116:1195-202.
3. Wong CM, Ou CQ, Chan KP, Chau YK, Thach TQ, Yang L, Chung RYN, Thomas GN, Peiris JSM, Wong TW, Hedley AJ, Lam TH. The effects of air pollution on mortality in socially deprived urban areas in Hong Kong. Environmental Health Perspectives 2008; 116:1189-94.
4. Wong CM, Thach TQ, Chau YK, Chan KP, Chung RYN, Ou CQ, Yang L, Peiris JSM, Thomas GN, Lam TH, Wong TW, Hedley AJ and PAPA project teams: Bangkok, Shanghai Wuhan. Public Health and Air Pollution in Asia (PAPA): A multi-city study for short-term effects of air pollution on mortality. Environmental Health Perspectives 2008; 116:1195-202.
5. Ou CQ, Hedley AJ, Chung RY, Thach TQ, Chau YK, Chan KP, Yang L, Ho SY, Wong CM, Lam TH. Socioeconomic disparities in air pollution-associated mortality. Environmental Research 2008; 107:237-44.
6. Hedley AJ, McGhee SM, Barron B, Chau YK, Chau J, Thach TQ, Wong TW, Loh C, Wong CM. Air pollution: costs and paths to a solution in Hong Kong – understanding the connections among visibility, air pollution and health costs in pursuit of accountability, environmental justice and health protection. Journal of Toxicology and Environmental Health A 2008; 71:544-54.
7. Wong CM, Ou CQ, Lee NW, Chan KP, Thach TQ, Chau YK, Ho SY, Hedley AJ, Lam TH. Short-term effects of particulate air pollution on male smokers and never-smokers. Epidemiology 2007; 18:593-8.
8. Wong CM, Ou CQ, Thach TQ, Chau YK, Chan KP, Ho SY, Chung RY, Lam TH, Hedley AJ. Does regular exercise protect against air pollution-associated mortality? Preventive Medicine 2007; 44:386-92.
9. Hu ZG, Wong CM, Thach TQ, Lam TH, Hedley AJ. Binary latent variable modelling and its application in the study of air pollution in Hong Kong. Statistics in Medicine 2004; 23:667-84.
33

10. Hedley AJ, Wong CM, Thach TQ, Ma S, Lam TH, Anderson HR. Cardiorespiratory and all-cause mortality after restrictions on sulphur content of fuel in Hong Kong: an intervention study. The Lancet 2002; 360:1646-52.
11. Wong CM, Atkinson RW, Anderson HR, Hedley AJ, Ma S, Chau PYK, Lam TH. A tale of two cities: Effects of air pollution on hospital admissions in Hong Kong and London compared. Environmental Health Perspectives 2002; 110:67-77.
12. Wong CM, Ma S, Hedley AJ, Lam TH. Effect of air pollution on daily mortality in Hong Kong. Environmental Health Perspectives 2001; 109: 335-40.
13. Wong CM, Hu ZG, Lam TH, Hedley AJ, Peters J. Effects of ambient air pollution and environmental tobacco smoke on respiratory health of non-smoking women in Hong Kong. International Journal of Epidemiology 1999; 28:859-64.
14. Wong CM, Ma S, Hedley AJ, Lam TH. Does ozone have any effect on daily hospital admissions for circulatory diseases? Journal of Epidemiology and Community Health 1999; 53:580-1.
15. Wong CM, Lam TH, Peters J, Hedley AJ, Ong SG, Tam AYC, Liu J, Spiegelhalter DJ. Comparison between two districts of the effects of an air pollution intervention on bronchial responsiveness in primary school children in Hong Kong. Journal of Epidemiology and Community Health 1998; 52:571-8.
16. Peters J, Hedley AJ, Lam TH, Betson CL, Wong CM. A comprehensive study of smoking in primary school children in Hong Kong: implications for prevention. Journal of Epidemiology and Community Health 1997; 51:239-45.
17. Peters J, Hedley AJ, Wong CM, Lam TH, Ong SG, Liu J, Spiegelhalter DJ. Effects of an ambient air pollution intervention and environmental tobacco smoke on children’s respiratory health in Hong Kong. International Journal of Epidemiology 1996; 25:821-8.
18. Barron WF, Liu J, Lam TH, Wong CM, Peters J, Hedley AJ. Costs and benefits of air quality improvement in Hong Kong. Contemporary Economic Policy 1995; XIII:105-17.
19. Tam AYC, Wong CM, Lam TH, Ong SG, Peters J, Hedley AJ. Bronchial responsiveness in children exposed to atmospheric pollution in Hong Kong. Chest 1994; 106:1058-60.
20. Ong SG, Liu J, Wong CM, Tam AYC, Daniel L, Hedley AJ. Studies on the respiratory health of primary school children in urban communities of Hong Kong. The Science of the Total Environment 1991; 106:121-35.
The Chinese University of Hong Kong 1. Ko FWS, Tam WS, Wong TW, Lai CKW, Wong GWK, Leung TF, Ng S, Hui DSC. Effects of air
pollution on asthma hospitalization rates in different age groups in Kong Hong. Clinical and Experimental Allergy. 2007;37:1312-9.
2. Ko FWS, Tam W, Chan DPS, Wong TW, Tung AH, Lai CKW, Hui DSC. The temporal relationship between air pollutants and hospital admissions for chronic obstructive pulmonary disease in Hong Kong. Thorax 2007;62:780-5.
3. Yu ITS, Chiu YL, Au SK, Wong TW, Tang JL. Dose-response relationship between cooking fumes exposures and lung cancer among Chinese non-smoking women. Cancer Research 2006;66(9):4961-7.
4. Wong TW, Tam W, Yu ITS, Wun YT, Wong AHS, Wong CM. The Association between Air Pollution and General Practitioner Visits for Respiratory Diseases in Hong Kong. Thorax 2006; 61:585-591.
5. Yu TS, Wong TW, Liu HJ. Impact of air pollution on cardiopulmonary fitness in schoolchildren. Journal of Occupational and Environmental Medicine 2004; 46:946-52.
34

6. Wong TW, Yu TS, Liu HJ, Wong AHS. Household gas cooking: a risk factor for respiratory illnesses in pre-school children. Archives of Disease in Childhood 2004;89 631-636.
7. Wong TW, Wun YT, Yu TS, Tam WS, Wong CM, Wong AHS. Air pollution and GP consultations for respiratory illnesses. Journal of Epidemiology and Community Health 2002; 56:949-50.
8. Wong TW, Tam WS, Yu TS, Wong AHS. Associations of daily respiratory and cardiovascular mortalities and air pollution in Hong Kong, China. Occup Environ Med 2002;59:30-35.
9. Yu TS, Wong TW, Wang XR, Song H, Wong SL, Tang JL. Adverse effects of low-level air pollution on respiratory health of school children in Hong Kong. Journal of Occupational and Environmental Medicine 2001;43:310-16.
10. Wong TW, Yu TS, Wang XR, Robinson P. Predicted maximal oxygen uptake in normal Hong Kong Chinese schoolchildren and those with respiratory diseases. Pediatric Pulmonology 2001;31(2):126-132.
11. Wong TW, Yu TS, Tam W. Research on air pollution and health in Hong Kong. Asia-Pacific Journal of Public Health 2000;12(Suppl):S45-47.
12. Wong TW, Lau TS, Yu TS, Neller A, Wong SL, Tam W, Pang SW. Air pollution and hospital admissions for respiratory and cardiovascular diseases in Hong Kong. Occupational and Environmental Medicine 1999;56(10): 679-683.
35

Attachment 1
Legco 27 November 2006 Environmental Affairs Panel Anthony J Hedley Department of Community Medicine, School of Public Health, University of Hong Kong 1. I understand that the Chief Executive has said that because Hong Kong life expectancy is
one of the highest in the world, Hong Kong is therefore the most environmentally friendly place for executives. As a public health physician I am totally dismayed to hear such a naïve, misleading and fallacious statement from our Chief Executive. It is clear that the CE has been very badly advised on our current population health issues. It appears to show a serious misunderstanding of the complex determinants of health and survival.
2. First it is important to realise that overall population high life expectancy is driven by
employment, and income and reflected in high GDP per capita, whereas poverty would have a negative effect. Whereas air pollution would be unlikely to reverse our overall life expectancy it would certainly slow the progression of gains in longevity. For a reversal of life expectancy trends there would have to be a complete breakdown of social structures, or war, famine and widespread fatal infectious disease; examples would include the turmoil and massive increase in alcohol consumption which followed the breakup of the Soviet Union, or the HIV/AIDS epidemic in Africa.
3. Our high life expectancy in Hong Kong is also attributable to
• Our very low infant mortality rate (a tribute to the reproductive performance of Chinese mothers)
• High quality maternal and child health services • The healthy migrant effect given the high proportion of older people who were
mainland migrants. Migrants are fitter and generally better survivors.
The Chief Executive should not confuse contemporary effects with cohort effects. 4. Hong Kong has the best data worldwide on the impact of pollution on survival and there
is no question that air pollution causes premature deaths and shortens the lives of hundreds if not thousands in Hong Kong. The 1990 sulphur restriction in fuel was a very modest single intervention; we have demonstrated for the Government’s benefit that it reduced age specific mortality rates, mainly from lung and heart diseases.
But beneath the tip of the iceberg of deaths is a huge burden of ill health. In polluted environments many more people become sick for longer periods before the point at which they die. The Chief Executive should be aware that delays in cleaning up the air will cause large scale impairment to health-related quality of life, including illness days, hospital admissions and time off school and work. Pollution damages people with existing disease such as heart and lung problems and diabetes, and also otherwise healthy individuals both now and in their future health experience.
5. Merrill Lynch did not put a sell notice on property investment just because of reduction in
life expectancy; I believe they were concerned about healthy life expectancy.
The executives which the Chief Executive refers to will only be as good as their work force and the next generation of workers in Hong Kong. One of the questions Mr Tsang
36

37
should be asking is “What will be the impact on young people of growing up in dirty air?”. The answer to that is unfortunately for many of them their lungs will fail to mature properly by the time they are about 18 years old. Poor lung growth in childhood is a major predictor of shortened life expectancy.

Attachment 2

Amended version: 15 October 2007
The Sustainable Development Council Invitation and Response Document: Clean Air-Clear Choices
Will High Air Pollution Alert Days provide an efficient path to health protection?
Anthony J Hedley, Patsy YK Chau, Hak Kan Lai, Thuan Q Thach,
Eric KP Chan, Chit Ming Wong, Sarah M McGhee
Department of Community Medicine School of Public Health
The University of Hong Kong
in association with
The Air Quality Objective Concern Group (http://www.civic-exchange.org/)
October 2007
marie
Typewritten Text
Attachment 3

Background The Air Quality Objective Concern Group has submitted separately a comprehensive set of comments on the Council for Sustainable Development’s (CSD) three proposals. Here we address in more detail the proposal for High Air Pollution alert days (HAP alerts) made by the CSD in its public consultation. Any appraisal of this proposal needs to focus on its validity and utility and these concepts need to be disclosed and explained to potential respondents before any informed forced choices or comparisons can be made, or would have any value for decision makers. The fundamental problem is that the definition of the HAP needs to be based on health outcomes which in turn requires the adoption of evidence-based criteria for harm reduction which can be derived from the best science currently available. The government asserts that we are not yet in a position to adopt current science based air standards in Hong Kong and this will remain a major rate limiting factor in air quality control for at least two more years. The proposal to create an alert system for high air pollution days (HAPs) is based on the assumption that exposures to air pollutants can be significantly reduced and bad health outcomes avoided. There is no strong empirical evidence available from any studies to show that modification of usual activities of daily living (ADL) will make a major difference to the harm caused to population health by air pollution at the uniformly high levels generally experienced in Hong Kong. The loss of visibility and our horizon over 20 years is the most visible evidence of our poor air quality. This trend (Figure 1) is also the curve for an epidemic of heart and lung disease in the HKSAR. It is a reminder than a large proportion of the complex gases and chemical particulates (comprising highly penetrating nano-sized material which does not settle, creates a pollutant “blanket” which simply cannot be avoided if the air is breathed.
Figure 1: Poor visibility in Hong Kong is directly related to trends and episodes in air pollution. Loss of visibility is also a direct measure of illness and deaths caused by air pollution What is the possible significance of HAP alert days? The primary objective of a strategy and special interventions to improve air quality should be health protection, and all sectors of the community will expect any approach to be demonstrably evidence-based and cost-effective. Although it is mainly the current trends in loss of visibility which have driven arguments for urgent pollution abatement measures, we need to remember that it is the unseen and silent injuries caused by the average annual
1970 1975 1980 1985 1990 1995 2000 20050
10
20
30
40
50
Hazy daysNumber per year
YearSource: Hong Kong Observatory
We are looking at the emergence of a long term epidemic of heart and lung disease
Loss of visibility is a serious health hazard
This is typical
This is atypical
We are losing our horizon
Photographs: W Barron, HKUST and Air Quality Objective Concern Group
2

levels of pollutants which are responsible for most of the burden of pollution related illness and deaths in the HKSAR. The very high pollution days will certainly make an additional contribution to the illness experience of many people, but they will be a relative minority of all days which are hazardous for health. Furthermore we cannot assume that we can do much to avoid the risks of the very high pollutant days. It is important to remember that apart from the acute health effects which lead to increased daily doctor visits, hospital admissions and premature deaths, we should be deeply concerned about the long term impact on the growth and development of children’s lungs. This is the site of a potentially irreversible injury at the most formative stage of a young person’s development. It would not be prevented by calling occasional HAP alert days.1
One recent newspaper headline about the Council’s public consultation told us that “Now, it’s up to you”.2 At this stage we would like to pose the question as to why it should be up to the general public to determine and decide how and when a major epidemic of disease (affecting heart, lungs and blood vessels and the lifelong health experience of children) should be prevented? We believe that the solutions are manifestly obvious and need to be applied through coordinated government action at the highest level and on an intersectoral basis.
Health protection: the most important reason for air quality control
There are important social and ethical issues to be considered here because the HAP alert
proposal carries with it the implied promise of benefit and is likely to raise expectations that personal commitment, lifestyle change and probably inconvenience and privation will be rewarded with better health protection. This may not be true.
Figure 2: Children are among the groups most sensitive to air pollutions. Damage to young growing lungs may be permanent and have lifelong effects on respiratory health and life expectancy.
We need timely and effective interventions There is no question that the only real hope for a timely and effective improvement in regional air quality will come from legislation and mandatory comprehensive interventions on emissions in all sectors, in a way which actually reduces the pollutant concentrations of the air we breathe. The first place this must happen for protection of the Hong Kong population is within the boundaries of the HKSAR. From a public health viewpoint we suggest that the battle against pollution is currently being lost in terms of the daily threat to health and longer term environmental degradation. We have previously pointed to the avoidable community costs of pollution resulting from direct costs of health care needs and lost productivity. There needs to be clear recognition of the external costs of air pollution and a focus on approaches which will reduce it, rather than additional costly actions which will not do so.
3

Air quality standards are key to all interventions The daily and annual average levels of all pollutants in Hong Kong are well above the guidelines agreed by the World Health Organization in 2005 and promulgated in a global promotion in 2006. A member of the HKSAR government Environmental Protection Department attended and contributed to the final WHO review meeting in Bonn in October 2005, so the government would have been well acquainted with the detailed evidence considered by the WHO Working Group on Air Quality Guidelines. The review was steered by experts in epidemiology, toxicology, air quality exposure assessment, air quality management and public policy. It is unquestionably a high quality state-of-the-art review.
Nevertheless the Hong Kong government believes it does not have sufficient evidence or guidance to implement new air quality standards or comprehensive strategies with explicit timelines to achieve abatement of the current high levels of pollution. The government’s own review did not begin until mid 2007 and will not report until end 2008. Any meaningful action beyond that point will take a further indeterminate period. This delay needs to be viewed in terms of the unaddressed avoidable short term effects on illness and premature deaths, huge external costs to all sectors of the community and permanent long term damage to generations of young children and adolescents. The adoption and use of meaningful criteria for air quality would be central to the establishment of any HAP alert system.
We need to be able to translate excess risks of air pollution and effects of mitigation measures into monetary values and measures of utility in an attempt to drive policy
June 2006
The community burden of the costs of air pollution We need to continue to translate the excess risks of breathing dirty air into monetary values and measures of quality of life in an attempt to drive policies on the environment. It is now clear that simply calculating the large burden of disease – for example in terms of chest symptoms, hospital admissions and deaths – has not made any material difference to the government’s approach.
Figure 3: The World Health Organization Air Quality Guidelines (AQG) provide the best interpretation and synthesis of the current global evidence on health effects of air pollution. The guidelines are based on a precautionary approach to health protection.
Figure 4: The current position of both government and vested interests in the business sector is to ignore the external costs of pollution including the burden of illness across the whole community. We need to move to an evidence-based assessment of the impact of pollution on health which includes measures of quality of life impacts on the Hong Kong population.
We introduced the issue of external costs together with clear options for urgent action in our June 2006 report from the Air Quality Objective Concern Group.3,4 The preventable fraction of the illnesses and premature deaths which could be achieved by reducing Hong Kong’s air pollution is very large indeed. For example a reduction of our average annual pollutant levels, as measured at general monitoring stations,
4

down to the levels of the WHO guidelines, would avoid nearly 7 million doctor visits, over 60,000 hospital bed-days and up to 1600 deaths each year. The attributable direct cost of health care and lost productivity is about $2 billion per annum. About 50% of the population live within 100 metres of busy roadways. If we rate the health impact and costs using road-side pollution the benefits of mitigation are much greater. A question relevant to the HAP alert proposal is therefore, what difference will HAP alerts make to the community burden of disease and costs. The CSD has claimed that we do not know what the public responses are to questions about willingness to pay for cleaner air, to prevent illness or deaths attributable to pollution. We would argue that this not true. There are now several sources of data which indicate the general scale of values which the public places on their preferences related to health protection from pollution. We have specifically reported on the intangible costs of pollution from our surveys on willingness-to-pay, to avoid a day of respiratory symptoms such as cough, a hospital admission for heart or lung problems and a premature death, all caused by breathing pollutants. The value of this is around $20 billion each year. The government’s response to our report was muted or frankly negative and dismissive. The then acting director of the Environmental Protection Department, referring to our estimate of the overall economic burden of pollution “…noted that the health care expenditure attributable to air pollution was indirect…”.5 Again this isn’t true, but it also shows how both government and vested interests may place a very different value on the health threat caused by pollution compared with the lay public. Whether HAP alerts would work for health benefit or not we can expect that there will be many different viewpoints on their value.
$2 Billion6.8M doctor visits64000 bed-days1600 deaths
Poor
Avoidable events caused by pollution: Doctor visits, Hospital bed-days & Deaths
0
20
40
60
80
100
(microgram per cubic meter)Pollution
Hong Kong2004
Air quality
WHO Guideline
2006
Hong KongAverage
Hong KongObjective
Figure 5: The reduction in doctor visits for health problems caused by pollution, hospital admissions for serious acute and chronic disease. The estimates for reduction in morbidity and mortality through air quality improvement do not yet include many bad health outcomes, such as the effects on the unborn foetus and long term effects on child health. The estimates are also conservative in that they are based on general monitoring station levels. It is possible that the health impacts are greater on those who live and work near busy roadways, estimated to be about 50% of the population. There is no evidence of a safe threshold for air pollutants and the upper limits of the WHO guidelines should not be regarded as safe.
The preventable fraction of illness and death is not simply a medical statistic but an issue of social justice and inequity for Hong Kong. What is the value of the questions posed by the SDC questionnaire? We would certainly agree that there is scope for further good quality surveys of public perceptions of the risks of air pollution and the monetary value of the penalties we pay. However we are disappointed with the structure and content of the SDC questionnaire. The questions posed in the survey are leading and tendentious. We do not think that they will give any indication of the uncertainty associated with a respondent’s understanding of the issues or their choice of response. This is important because many questions, which are represented simplistically, are highly technical in nature or associated with other complex issues to such an extent that they either cannot be answered or are implausible as potential solutions to the hazard of air pollution.
5

Two key examples of poorly thought out questions would be: Q8 “How long before a high air pollution alert day should a notice be issued? Q12 “Should we require employers to allow staff … with respiratory or heart disease to work from home?” We discuss these issues in later sections of this paper. Our June 2006 report was a very conservative estimate of the burden of disease and costs, based on the best available local scientific evidence. The question therefore arises as to what the government will do with any pleas from the public for immediate and radical action to mitigate daily pollutant exposures which are likely to arise in this consultation – and have already been expressed for several years. Government reactions to public views submitted in other public health consultations have been the subject of concern and criticism. A clearer exposition of how responses from the public will be handled would create greater transparency and clarify the potential usefulness of the whole exercise. Principles of efficient health care programmes So bearing in mind that the principal force of morbidity and mortality is probably the average annual exposure to air pollution, what impact would HAP alert days make on the burden of disease and community costs? Ideally in an efficient preventive health strategy, for example a screening test, we need to be able to identify the maximum amount of risk in the smallest number of people. If we relate this to air pollution alerts we need to try and maximize population health gains by intervening in the smallest number of days each year. There are two main problems here. First Hong Kong’s levels of pollution for most of the year are generally uniformly high in terms of health risks throughout the year. It follows that any reduction in harm and benefit to health achieved by any single alert will be very low, in comparison to the overall risk. In order to have a chance of making a large difference we would have to call multiple HAP alerts across the year. We also need to remember that the pollutant threshold level for health protection (for example as indicated by WHO guidelines) is very low compared with Hong Kong’s average levels. We need cost-effectiveness affordability curves to assess the proposed HAP alert system. Put simply, we are talking about the three ‘A’s:
• Achievability • Acceptability • Affordability
Can we reliably predict HAP days? The CSDC questionnaire asks the question
“How long before a high air pollution alert day should a notice be issued?”
6
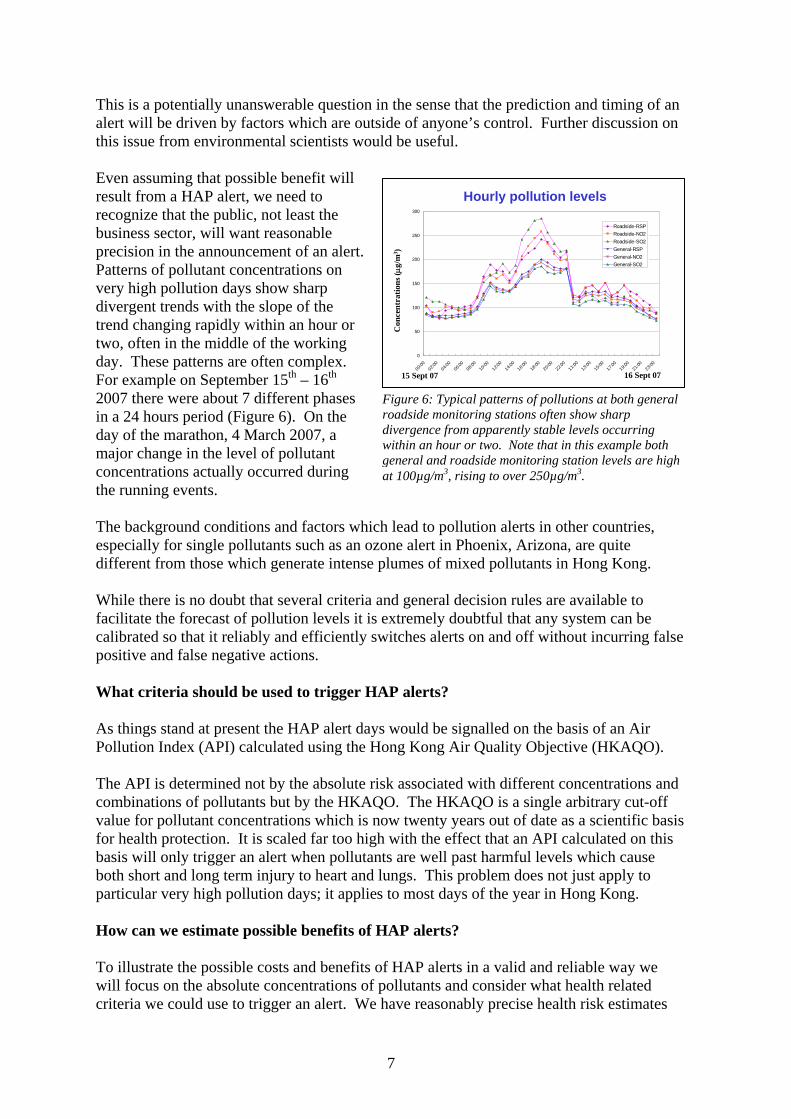
This is a potentially unanswerable question in the sense that the prediction and timing of an alert will be driven by factors which are outside of anyone’s control. Further discussion on this issue from environmental scientists would be useful. Even assuming that possible benefit will result from a HAP alert, we need to recognize that the public, not least the business sector, will want reasonable precision in the announcement of an alert. Patterns of pollutant concentrations on very high pollution days show sharp divergent trends with the slope of the trend changing rapidly within an hour or two, often in the middle of the working day. These patterns are often complex. For example on September 15th – 16th 2007 there were about 7 different phases in a 24 hours period (Figure 6). On the day of the marathon, 4 March 2007, a major change in the level of pollutant concentrations actually occurred during the running events.
Hourly pollution levels
0
50
100
150
200
250
300
00:00
02:00
04:00
06:00
08:00
10:00
12:00
14:00
16:00
18:00
20:00
22:00
11:00
13:00
15:00
17:00
19:00
21:00
23:00
Roadside-RSPRoadside-NO2Roadside-SO2General-RSPGeneral-NO2General-SO2
Con
cent
ratio
ns (μ
g/m
3 )
15 Sept 07 16 Sept 07
Figure 6: Typical patterns of pollutions at both general roadside monitoring stations often show sharp divergence from apparently stable levels occurring within an hour or two. Note that in this example both general and roadside monitoring station levels are high at 100µg/m3, rising to over 250µg/m3.
The background conditions and factors which lead to pollution alerts in other countries, especially for single pollutants such as an ozone alert in Phoenix, Arizona, are quite different from those which generate intense plumes of mixed pollutants in Hong Kong. While there is no doubt that several criteria and general decision rules are available to facilitate the forecast of pollution levels it is extremely doubtful that any system can be calibrated so that it reliably and efficiently switches alerts on and off without incurring false positive and false negative actions. What criteria should be used to trigger HAP alerts? As things stand at present the HAP alert days would be signalled on the basis of an Air Pollution Index (API) calculated using the Hong Kong Air Quality Objective (HKAQO). The API is determined not by the absolute risk associated with different concentrations and combinations of pollutants but by the HKAQO. The HKAQO is a single arbitrary cut-off value for pollutant concentrations which is now twenty years out of date as a scientific basis for health protection. It is scaled far too high with the effect that an API calculated on this basis will only trigger an alert when pollutants are well past harmful levels which cause both short and long term injury to heart and lungs. This problem does not just apply to particular very high pollution days; it applies to most days of the year in Hong Kong. How can we estimate possible benefits of HAP alerts? To illustrate the possible costs and benefits of HAP alerts in a valid and reliable way we will focus on the absolute concentrations of pollutants and consider what health related criteria we could use to trigger an alert. We have reasonably precise health risk estimates
7
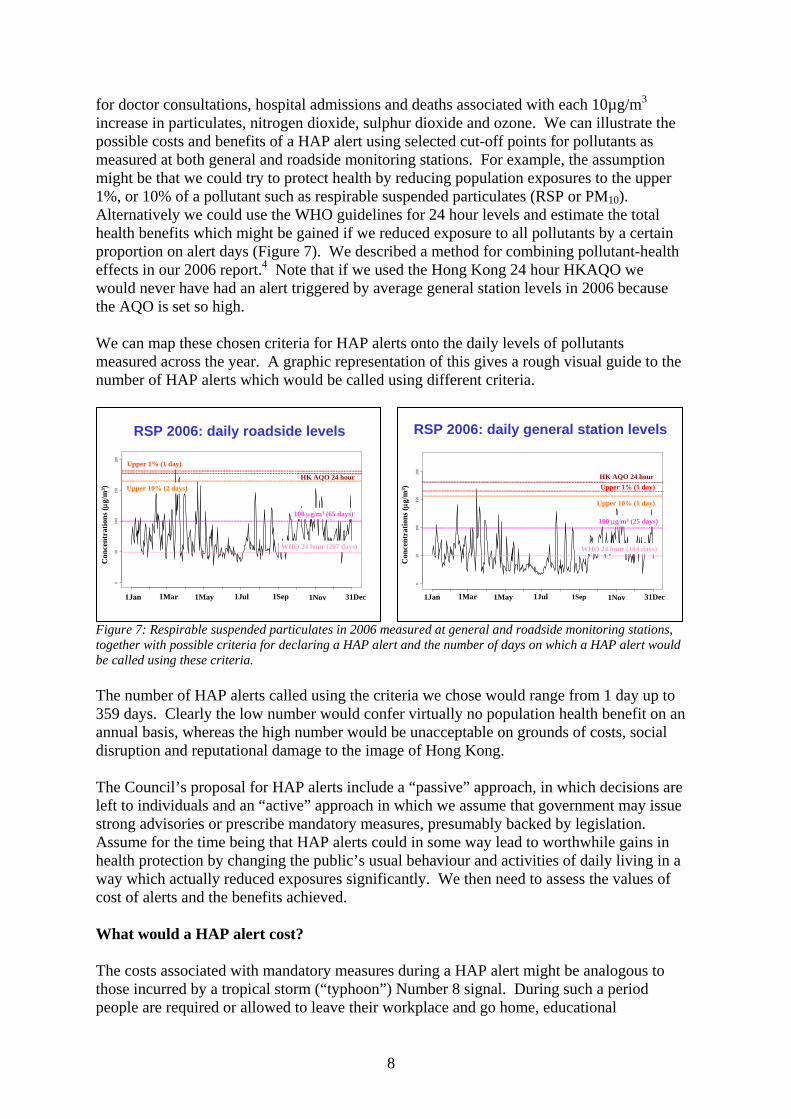
for doctor consultations, hospital admissions and deaths associated with each 10µg/m3 increase in particulates, nitrogen dioxide, sulphur dioxide and ozone. We can illustrate the possible costs and benefits of a HAP alert using selected cut-off points for pollutants as measured at both general and roadside monitoring stations. For example, the assumption might be that we could try to protect health by reducing population exposures to the upper 1%, or 10% of a pollutant such as respirable suspended particulates (RSP or PM10). Alternatively we could use the WHO guidelines for 24 hour levels and estimate the total health benefits which might be gained if we reduced exposure to all pollutants by a certain proportion on alert days (Figure 7). We described a method for combining pollutant-health effects in our 2006 report.4 Note that if we used the Hong Kong 24 hour HKAQO we would never have had an alert triggered by average general station levels in 2006 because the AQO is set so high. We can map these chosen criteria for HAP alerts onto the daily levels of pollutants measured across the year. A graphic representation of this gives a rough visual guide to the number of HAP alerts which would be called using different criteria.
Figure 7: Respirable suspended particulates in 2006 measured at general and roadside monitoring stations, together with possible criteria for declaring a HAP alert and the number of days on which a HAP alert would be called using these criteria. The number of HAP alerts called using the criteria we chose would range from 1 day up to 359 days. Clearly the low number would confer virtually no population health benefit on an annual basis, whereas the high number would be unacceptable on grounds of costs, social disruption and reputational damage to the image of Hong Kong. The Council’s proposal for HAP alerts include a “passive” approach, in which decisions are left to individuals and an “active” approach in which we assume that government may issue strong advisories or prescribe mandatory measures, presumably backed by legislation. Assume for the time being that HAP alerts could in some way lead to worthwhile gains in health protection by changing the public’s usual behaviour and activities of daily living in a way which actually reduced exposures significantly. We then need to assess the values of cost of alerts and the benefits achieved. What would a HAP alert cost? The costs associated with mandatory measures during a HAP alert might be analogous to those incurred by a tropical storm (“typhoon”) Number 8 signal. During such a period people are required or allowed to leave their workplace and go home, educational
050
100
150
200
RSP 2006: daily roadside levels
Con
cent
ratio
ns (μ
g/m
3 )
1Jan 1Mar 1May 1Jul 1Sep 1Nov 31Dec
Upper 1% (1 day)
100 μg/m3 (65 days)
WHO 24 hour (297 days)
HK AQO 24 hourUpper 10% (2 days)
050
100
150
200
RSP 2006: daily general station levels
Con
cent
ratio
ns (μ
g/m
3 )
1Jan 1Mar 1May 1Jul 1Sep 1Nov 31Dec
HK AQO 24 hourUpper 1% (1 day)
Upper 10% (1 day)
100 μg/m3 (25 days)
WHO 24 hour (184 days)
8

institutions and many businesses close. The Labour Department has issued a detailed advisory directed to both employers and employees.6 Employers are urged to “make realistic and critical assessment of the essential staff requirements so that only the absolutely essential staff are required to report for duty under adverse weather conditions” and “when a typhoon signal No. 8 or above is issued employers should not require their employees to report for work for the sake of safety unless prior agreement to the contrary has been made”. In the past the issue of a Typhoon No. 8 has caused concern about its effect on the economy, especially because predicting the impact of an approaching storm is an uncertain business. Legislator, The Hon. James Tien in 20017 estimated that the value of a GDP working day, about $1 Billion, was at risk because of the impact on businesses which lost productivity and revenue but still had to pay salaries and costs. Another legislator The Hon. Fred Li estimated that 300,000 SMEs lost between $50,000 to $100,000 because of a Typhoon No. 8 signal.7 Is it likely that many sectors of the community will be prepared to accept another general warning system, which will be difficult to apply, disrupt essential services and harm businesses and the wider image of Hong Kong as a tourism destination, finance centre and business hub? SARS created another kind of alert which reduced mobility, emptied restaurants, other leisure venues, airports, transportation systems. We note that SARS changed the forecast for GDP growth from about +2% to -2% because of government and WHO advisories over a period of about 3 months.8,9,10,11 We believe that even if HAP alerts were cost-effective in health terms, the business sector, the government and the wider public would see them as a source of reputational damage to the HKSAR in the Asia Pacific region.
HAP Alert Days: Costs and BenefitsWhat are our expectations for a balanced equation?
Cost Benefit
The net gains to the community will be dependent on minimisation of the impact on GDP and maximisation of health protection.
Both will be difficult to achieve.
⎟⎞
⎜⎛
GDPin
Reduction
⎢⎢⎢
⎣
⎡
⎟⎟⎟
⎠
⎞
⎜⎜⎜
⎝
⎛
Deaths &Illness in
Reduction
⎢⎢⎢
⎣
⎡
⎟⎟⎠
⎜⎜⎝ ⎥
⎥⎥
⎦
⎤
⎟⎟⎟
⎠
⎞
⎜⎜⎜
⎝
⎛
GDPto
Benefits
⎥⎥⎥
⎦
⎤
⎟⎟⎟
⎠
⎞
⎜⎜⎜
⎝
⎛
harm &exposuresIncreased
– – –Reduction
inGDP
ReductionIn Illness& Deaths
A basic cost-benefit equation, to indicate the net value of a HAP alert day, would include the cost incurred by reduced human activity; less any possible economic benefits of a HAP day arising from business (eg patronage of cinemas and restaurants) which would not otherwise have occurred. The benefits include all the potential reductions in direct health costs and lost productivity, which in turn may be reduced if increased harm results from actions taken during a HAP alert (Figure 8).
So what are our expectations for a balanced cost-benefit equation from a HAP alert?
Figure 8: A basic assessment of net costs (cost minus benefits) from HAP alert days.
What would the cost be in terms of the value of a GDP day? • We have conservatively estimated the potential annual impact on GDP from repeated
HAP alerts at only 0.5%, one quarter of the change in GDP forecast associated with the SARS impact.
9

• We optimistically rate the benefits of a HAP alert at about 25% reduction of the harm associated with the identified upper fraction of the daily pollution level which triggers the alert.
• At this stage, for simplicity, we have omitted any estimates of the relatively smaller values associated with economic benefits of a HAP alert or the additional harm to health which might result. They are unlikely to change the overall cost-benefit equation.
Table 1 shows that, in 2006, if we choose the upper 1%, or 10% of the annual pollutant range or, alternatively, cut-off values for RSP or NO2 of 100µg/m3, 75µg/m3, or 50µg/m3 (ie 100% above, 50% above, or the actual 2006 WHO 24 hour air quality guideline), then we would call HAP alerts on between 1 day and 226 days a year. The most parsimonious option, using only the upper 1% of the annual pollutant distribution at general monitoring stations (Table 1; Scenario 1), leads to only 1 HAP alert day, costing $5 million but yielding only $30,000 in benefits, a cost benefit ratio of 167:1. If we select an alert cut-off of 100µg/m3 benefits rise to $8 million but at a cost of $125 million and cost-benefit ratio of 16:1. Adopting the WHO 24 hour guideline would push benefits to about $100 million and the cost benefit ratio improves to almost 10:1, but the total cost is $1.1 billion.
Table 1: Possible scenarios for estimating the costs and benefits of HAP alert days. Increasing the number of HAP alerts might possibly increase benefit, but at costs which will be very much higher than the value of these benefits.
Scenario 1:RSP general level + NO2 general level
as the basis for an alert
375(14:1)
30
405
75 μg/m3
(81 days)
9.64(28:1)
0.36
10
10%(2 days)
4.97(167:1)
0.03
5
1% (1 days)
HAP Criteria (Number of HAP alert days)
1,031(11:1)
117(16:1)
Total = Costs – Benefits(Costs : Benefits)
998Benefits (25% exposure redn.)
1,130125Costs (0.5% GDP ~ )
50 μg/m3
(226 days)100 μg/m3
(25 days)(Million HK$)
Note: Benefit = RSP + 0.41*NO2Days = maximum number of exceedance days for RSP and NO2
Scenario 2:RSP roadside level + NO2 roadside level
as the basis for an alert
1,205(11:1)
120
1,325
75 μg/m3
(265 days)
9.58(24:1)
0.42
10
10%(2 days)
4.97(167:1)
0.03
5
1% (1 days)
HAP Criteria (Number of HAP alert days)
1,543(7:1)
771(19:1)
Total = Costs – Benefits(Costs : Benefits)
25244Benefits (25% exposure redn.)
1,795815Costs (0.5% GDP ~ )
50 μg/m3
(359 days)100 μg/m3
(163 days)(Million HK$)
If we rate costs and benefits by the much higher roadside levels it would be possible (under the doubtful assumption that significant benefits could be achieved) to improve the cost benefit ratio. But the costs would be prohibitive and the HKSAR would be paralyzed by pollution alerts (Table 1; Scenario 2).
It is worth noting again that the new WHO 24 hour guideline should not be exceeded on more than 3 days in a year. However applying this criterion in Hong Kong would result in alerts being called on 226 up to 359 days a year.
What will be the economic impact and cost of a HAP alert?
It will depend on:• perceived seriousness of the hazard• frequency of alerts• increased harm • health benefits • the sectors of the economy affected• The cumulative effect on Hong Kong’s
image as a centre for business, finance, and tourism destination
These data may be manipulated under a range of different assumptions, but because of Hong Kong’s high pollution levels it is again highly
Table 2: The economic impact of HAP alerts will depend on several factors in many different sectors.
10

unlikely that the public, legislators or government will find that the intervention of a HAP alert day is value for money. Further detailed consideration should be given to the complex issues associated with evaluation of HAP alerts (Table 2). Will an alert do more harm than good? We have no empirical evidence applicable to Hong Kong that it is possible to reduce exposure (as measured by the “intake fraction” of pollutants) by issuing a general alert to the population. On the other hand exposures to ambient pollution are likely to be higher in those who take public transport as opposed to riding in the sealed environment of a private car. The vast majority take public transport but if an alert moved further significant numbers of people from private vehicles while air pollutants remain high then harm is likely to increase overall rather than decrease. Reduction in the vehicle kilometers contributed by private cars may not make much difference to roadside pollutants. Beijing has discovered that arbitrary restrictions on cars do not lead to significant reductions in regional pollutants. Although we might expect some mitigation of roadside pollution, the same is likely to be true in the HKSAR where major emission sources are marine, commercial vehicles (especially those using mainland diesel) and power generation. HAP alerts are not designed to reduce these sources. In fact if HAP alerts tend to keep more people indoors power consumption may increase. Modern private cars contribute less pollution than outdated (pre-Euro, Euro I) commercial vehicles but have increased by 23% since 1995, while taxi numbers remain static. On the other hand heavy and medium goods vehicles have increased by 80% and 13% respectively, but the cleaner transportation provided by cargo trains has declined by 15%. One suggestion is that exposures would be reduced by staying at home, including “working from home”. Those who stay more at home might include infants and the elderly but their exposures are unlikely to be significantly reduced in a way which would protect their health. A systematic study of the relationship between indoor and outdoor air pollutant concentrations will provide more information but, in general, indoor levels are determined by the outdoor environment. This is clearly shown by the example of measurements made at a Heng Fa Chuen 13th floor apartment on Friday 5th October (Figure 9). Closing windows and using extractors and air conditioners may reduce pollutants but the levels remain extremely high and a clear hazard to health. Particulates were measured with a portable meter, the Sidepak (TSI Inc.). Changes in indoor respirable suspended particulates (PM10) in the apartment during a 5 hour period with windows open and closed were compared with outdoor levels. Note that the scale in Figure 9(a) is in milligrams/cubic metre. The lowest pollutant level recorded with the windows closed is about 190µg/m3 which is 10µg/m3 above the 24 hour HKAQO and 140µg/m3 above the WHO 24 hour guideline of 50µg/m3. We acknowledge the issues about comparability between hand-held types of particulate meter, such as the Sidepak (TSI Inc.), and the TEOM (Tapered Element Oscillating Microbalance) system used in the EPD fixed monitoring stations in Hong Kong. These
11

issues are highly technical and apply to the performance of both portable equipment and TEOM.* 12,13
Environmental Protection Department estimates of outdoor hourly ambient RSP concentration
5 Oct 2007 4pm to 9pm
100
120
140
160
180
200
220
240
260
16:00 17:00 18:00 19:00 20:00 21:00Hour
Conc
entra
tion
(ug/
m3)
RoadsideGeneralEasternCauseway Bay
Figure 9: Outdoor and indoor RSP (PM10) levels tracked closely together in a Heng Fa Chuen apartment, when windows were open. Closing windows did not reduce RSP to safer levels. RSP levels reported by the Environmental Protection Department at Causeway Bay, show very high levels of particulates across the monitoring period 4pm to 9pm. Mean roadside levels (Causeway Bay, Central, Mongkok) were more or less stable, with a slight downward trend, between 190-180µg/m3 across the period. Mean levels at general stations varied between 150-160µg/m3 with a slight upward trend. Causeway Bay, the station with possibly the most relevance to the Heng Fa Chuen area, showed RSP ranging from 200µg up to 240µg/m3. The Sidepak monitor estimate of outdoor RSP at 6pm was 250µg/m3
compared with the EPD Causeway Bay level of 240µg/m3.
In our single illustration of indoor levels we simply demonstrate that the portable meter recorded outdoor particulate levels of very similar magnitude to those recorded by the Environmental Protection Department during the same time period. The indoor levels tracked the outdoor levels very closely. In these findings reflect the general relationship between indoor and outdoor pollutant levels, the conclusion must be that staying at home is unlikely to confer any worthwhile health benefit for the majority during a very high pollution episode. For the fortunate minority of workers who enjoy the advantages of a sophisticated air filtration system in their workplace, a day at home would probably be an extra hazard.
Who could try to benefit?By “working at home”, walking to work,
taking public transport…………..Potential Possibletarget groups consequences
• Civil servants: Close public offices• Children/teachers: Close schools• Health care staff: Close clinics• Retail trade: Close shops• Port activities: Close terminals• Taxi drivers Shutdown public transport
Bus driversTrain drivers
• Delivery services Close wholesale industryVan driversPorters
The idea of “working from home” is an unrealistic proposition for the majority of workers. A list of common occupations clearly indicates that those at greatest risk of pollution related health effects, because of their disadvantaged socio-economic status would be least able to protect themselves even if staying off work did confer any benefit (Table 3). If any benefit did result from staying at home then those most likely to gain would probably be excluded from work this opportunity. Furthermore they may be penalised unless they were compensated for staying away from work and some of the
Table 3: Those who might benefit most by "working at home" are those least able to leave their worksites * There are reasons why portable meters may either under or overestimate inhalable particulate levels. The Sidepak is one of the instruments which may overestimate. However all portable monitors usually show good linearity, when measuring particles in the respirable range, compared with standard reference samplers. TEOM systems may underestimate levels of particles which are of relevance to health risk exposures because of loss of volatile and other fractions in the mix of particulates.
12

priority business activities of the HKSAR were disrupted as a result. There are important interactions between outdoor pollution exposures and life-style factors such as smoking,14 exposures during exercise15 and probably the nutritional value of diets. Investment in effective lifestyle modification programmes may be one beneficial approach to partial protection against pollution effects. However the issue of exercise is particularly difficult to address. In the 1998 Hong Kong lifestyle and mortality study those who took no exercise had the highest mortality risks16 and when we examined the pollution effects those with the lowest and highest exercise levels had the highest pollution related mortality risks after adjustment for other health risks. Those who, by chance, calibrated their exercise to intermediate levels had lower risks of an exercise-pollution mortality interaction.15 These findings relate to the lifestyles of adults 10 years before they died.
Can we reliably identify those at high risk? The question as to whether employers should be required to allow employees with respiratory or heart disease to work from home raises many additional problems. The question is naïve in terms of the issues we have raised about levels of indoor air pollutants in domestic settings and the lack of opportunity for many workers to take their service jobs to their homes. A major issue would be the identification of high risk groups in a way which is medically sound, ethical and protects privacy. People who are susceptible to pollution do not wear this label on their chest. For some the status of their cardiovascular risk factors is known, for others it is not. Some have established diagnoses and treatment, others do not. We know that pollution causes illness and premature death but those events occur in groups which are heterogeneous in terms of their past medical history. For everyone concerned this information is usually sensitive and often confidential. It is simply not feasible that a sophisticated, valid, privacy protected system could be implemented which classifies the entire working population in terms of its daily susceptibility to pollution. Although those with severe chronic established medical problems would be eligible it is likely that any high risk labelling scheme would incur many false negatives and therefore be inefficient and inequitable. Labelling individuals as being at high risk is likely to be stigmatizing, may lead to prejudice and put the jobs of some at risk. Even if such a scheme was remotely feasible and people were willing to join it, it is not clear where the resources would come from to fund the certification process which presumably would be required. Can we protect child health with HAP alerts? The community is now increasingly aware and concerned about the threat to both short and long term health of children. The incontrovertible evidence from Hong Kong surveys and longer term follow-up in other countries shows that growing up in pollution, even at levels well below those experienced in Hong Kong, will cause permanent impairment of lung growth and development in children and adolescents. There is a demand for guidance on many issues, including how to manage school sports events.17 We believe this is a difficult and perhaps impossible dilemma to resolve through simple advisories. The evidence from cohort studies in the United States points to
13

impairment of lung development in some adolescents incurred by living in pollution levels which are associated with proximity to busy roadways.1
The principal cause of damage to children is caused by average daily high levels not simply the less common very high pollution days. There is no question that we should try to avoid exposing children and adolescents to extremely high pollutant levels, especially during sporting events, but parents should not be misled into thinking that a HAP alert, or moving events indoors, at any level of pollution, will influence long term respiratory and other health problems which may result from usual daily exposures in Hong Kong. The biggest health impact of pollutants will occur over the larger number of near average pollution days. This includes those when endurance training takes place, at lower pollutant levels than those which might lead to cancellation of sports events. When is it safe to exercise? The lack of practical usefulness of the HKAPI and likely failure of an alert in relation to sports events is demonstrated by the pattern of pollutants on the day of the Hong Kong (Standard Chartered) Marathon on 4 Marathon on 4 March 2007 (Figure 10). If we based the alert on the WHO 24 hour guideline then we would just accept the early morning levels as permissible and no alert would be issued. However during the period of the running events general and roadside particulates rose to 60% above this level.
0
20
40
60
80
100
120
140
0 2 4 6 8 10 12
Hours am
Conc
entr
atio
n (u
g/m
3)
NO2 (11Mar)RSP (11Mar)RSP (4Mar)NO2 (4Mar)
Standard Chartered Running events
12
PM10 24 hr
PM2.5 24 hr
NO2 annual
How can we promote exercise in a polluted Hong Kong?
The Hong Kong MarathonAir pollution: Sunday 4 March 2007
Figure 10: The rapidly changing nature of hourly pollutant levels emphasises the difficulty of "predicting" HAP which would trigger an alert. On 4 March the early morning levels would justify an alert; at the start of the running events particulate levels just approximated to the upper bound of the WHO 24 hour guide, but within an hour were rising sharply and reached very high levels before completion of the events.
If the races had been run the following weekend the runners would have faced RSP levels which reached 140% (120µg/m3) above
the WHO 24 hour guideline. The Environmental Protection Department has advised that an API of 200 is an appropriate level for schools to abandon sports events we believe that this is advisory is unsafe. However the HKAQO 24 hour level for particulates is 180µg/m3 so on neither of these days would an API based on the HKAQO have triggered an alert. However the levels recorded during the marathon would predictably have adverse effects on the normal physiological functioning of even young fit healthy individuals. What are current trends in Hong Kong’s pollutants? The levels of pollution in Hong Kong, based on general and roadside levels of particulates and nitrogen dioxide, are very high and more or less stable on an annual basis. We have repeatedly pointed out that, because of yearly random fluctuations in pollutants, government claims (based on selecting two data points) that there have been significant reductions, are invalid. There is no reliable current evidence that pollution trends are improving.
14

Statistically fitted curves to particulate data during the past nine years show no significant trend. The curves are essentially flat (Figure 11). Even if the government claims were true and small reductions have been achieved, albeit difficult to measure, the health protection offered by these small changes would be negligible compared with the burden of disease created by average levels.
Year
mic
rogr
ams
per c
ubic
met
er
Roadside stationsGeneral stations
1995 2000 2005 2010
020
4060
8010
0
Respirable suspended particulates (1997-2006)Where is air quality heading?
New WHO guideline (one year) =20
Figure 11: Changes in average ambient annual levels of pollutants such as particulates cannot be reliably assessed by selecting two points on the timescale. Appropriate numerical methods should be used to take account of uncertainty associated with the underlying trends. The curves in this figure are derived from a log linear regression model. They show that there is no significant downturn in particulate pollution and no trend which would reach WHO guidelines within the foreseeable future. For sulphur dioxide (SO2) levels, the gains in abatement made in the early 1990s are now being lost. Recent hourly levels of SO2 in
many sites in Hong Kong have been well over 100µg/m3 compared with the WHO 24 hour guideline of 20µg/m3. Until and unless we can demonstrate a marked statistically significant downturn in the trends of all pollutants, which has a clear relationship to health protection, there should be a moratorium on statements which mislead the public. HAP alerts will not make any material difference to the trends illustrated here. Conclusions For discussion and debate, we suggest that: • HAP alert days in Hong Kong would be a highly inefficient use of scarce resources. • The estimated costs of any HAP alert system and the low level of benefits clearly
indicate that these resources should be re-allocated to efficient pollution abatement strategies. They should particularly be allocated to mandatory actions on clean transportation and fuels and other interventions which need to be part of a comprehensive air quality strategy.
• HAP alert days will not work and will be rejected by an informed public, legislature and government when they understand the implications of the cost-benefit equation.
References 1. Gauderman WJ, Vora H, McConnell R, Berhane K, Gilliland F, Thomas D, Lurmann F, Avol E, Kunzli N,
Jerrett M, Peters J. Effect of exposure to traffic on lung development from 10 to 18 years of age: a cohort study. Lancet 2007; 369:571-7.
2. Benitez MA, Yung C. Clean air options? Now, it’s up to you. Sunday Morning Post, 3 June 2007. 3. Air Quality Objective Concern Group (http://www.civic-exchange.org/publications/2006/AQO13102006.pdf) 4. Hedley AJ, McGhee SM, Barron B, Chau YK, Chau J, Thach TQ, Wong TW, Loh C, Wong CM. Air
pollution: Costs and paths to a solution. Understanding the connection between visibility, air pollution and health costs in pursuit of accountability, environmental justice and health. Journal of Toxicology and Environmental Health (in press).
5. Environmental Protection Department responses to report on air pollution, 8 June 2006. (http://www.epd.gov.hk/epd/english/news_events/press/press_060608a.html)
15

6. Labour Department. Employers should set work arrangements for rainstorms and typhoons. (http://www.info.gov.hk/gia/general/200703/26/P200703260168.htm).
7. The Hon. James Tien. 商界議員斥預測水平走下坡 – 天文台死撐有需要掛八號波. 太陽報 A04 本地
新聞. 27 July 2001. 8. Overview – Impact of SARS. Asia Case Research Centre, The University of Hong Kong
(http://www.acrc.org.hk/sars/industry.asp) 9. Fan E. SARS: Economic Impacts and Implications. ERD Policy Brief No. 15. Manila: Asian
Development Bank, 2003. ( http://www.adb.org/Documents/EDRC/Policy_Briefs/PB015.pdf) 10. Asian Development Bank. Asian Development Outlook 2006.
(http://www.adb.org/Documents/Books/ADO/2006/hkg.asp) 11. Siu A, RYC Wong. Economic impact of SARS: The case of Hong Kong. Hong Kong: The University of
Hong Kong. (http://www.hiebs.hku.hk/working_paper_updates/pdf/wp1084.pdf) 12. Thorpe A. Assessment of personal direct-reading dust monitors for the measurement of airborne
inhalable dust. Annals of Occupational Hygiene 2007;51:97-112. 13. Soutar A, Watt M, Cherrie JW, Seaton A. Comparison between a personal PM10 sampling head and the
tapered oscillating microbalance (TEOM) system. Atmospheric Environment 1999;33:4373-7. 14. Wong CM, Ou CQ, Thach TQ, Chau YK, Chan KP, Ho SY, Chung RY, Lam TH, Hedley AJ. Does
regular exercise protect against air pollution-associated mortality? Preventive Medicine 2007;44:386-92. 15. Wong CM, Ou CQ, Lee NW, Chan KP, Thach TQ, Chau YK, Ho SY, Hedley AJ, Lam TH. Short-term
effects of particulate air pollution on male smokers and never-smokers. Epidemiology 2007; 18:593-8. 16. Lam TH, Ho SY, Hedley AJ, Mak KH, Leung GM. Leisure time physical activity and mortality in Hong
Kong: case-control study of all adult deaths in 1998. Annals of Epidemiology 2004;14:391-8. 17. Heron L. Bad air sees sports events relocated from Victoria park. Pollution forces school to move swim
gala indoors. South China Morning Post, 20 September 2007.
16

On: 25 July 2008Access Details: Free AccessPublisher: Taylor & FrancisInforma Ltd Registered in England and Wales Registered Number: 1072954Registered office: Mortimer House, 37-41 Mortimer Street, London W1T 3JH, UK
Journal of Toxicology andEnvironmental Health, Part ACurrent IssuesPublication details, including instructions for authors and subscription information:http://www.informaworld.com/smpp/title~content=t713667303
Air Pollution: Costs and Paths to a Solution in HongKong—Understanding the Connections Among Visibility,Air Pollution, and Health Costs in Pursuit ofAccountability, Environmental Justice, and HealthProtectionAnthony J. Hedley a; Sarah M. McGhee a; Bill Barron b; Patsy Chau a; June Chaua; Thuan Q. Thach a; Tze-Wai Wong c; Christine Loh d; Chit-Ming Wong aa Department of Community Medicine, University of Hong Kong, Pokfulam, Hong
Kong SAR, Chinab Institute for Environment, University of Science & Technology, Hong Kong SAR, Chinac Department of Community and Family Medicine, Chinese University of Hong Kong, Prince of Wales Hospital, HongKong SAR, Chinad Civic Exchange, Hoseinee House, Hong Kong SAR, China
Online Publication Date: 01 January 2008
To cite this Article: Hedley, Anthony J., McGhee, Sarah M., Barron, Bill, Chau, Patsy, Chau, June, Thach, ThuanQ., Wong, Tze-Wai, Loh, Christine and Wong, Chit-Ming (2008) 'Air Pollution: Costs and Paths to a Solution in HongKong—Understanding the Connections Among Visibility, Air Pollution, and Health Costs in Pursuit of Accountability,Environmental Justice, and Health Protection', Journal of Toxicology and Environmental Health, Part A, 71:9, 544 —554
To link to this article: DOI: 10.1080/15287390801997476URL: http://dx.doi.org/10.1080/15287390801997476
PLEASE SCROLL DOWN FOR ARTICLE
Full terms and conditions of use: http://www.informaworld.com/terms-and-conditions-of-access.pdf
This article maybe used for research, teaching and private study purposes. Any substantial or systematic reproduction,re-distribution, re-selling, loan or sub-licensing, systematic supply or distribution in any form to anyone is expresslyforbidden.
The publisher does not give any warranty express or implied or make any representation that the contents will becomplete or accurate or up to date. The accuracy of any instructions, formulae and drug doses should beindependently verified with primary sources. The publisher shall not be liable for any loss, actions, claims, proceedings,demand or costs or damages whatsoever or howsoever caused arising directly or indirectly in connection with orarising out of the use of this material.
marie
Typewritten Text
Attachment 4

Dow
nloa
ded
At:
02:4
8 25
Jul
y 20
08
544
Journal of Toxicology and Environmental Health, Part A, 71: 544–554, 2008Copyright © Taylor & Francis Group, LLCISSN: 1528-7394 print / 1087-2620 online DOI: 10.1080/15287390801997476
UtehAir Pollution: Costs and Paths to a Solution in Hong Kong—Understanding the Connections Among Visibility, Air Pollution, and Health Costs in Pursuit of Accountability, Environmental Justice, and Health Protection
Air Pollution costsAnthony J. Hedley1, Sarah M. McGhee1, Bill Barron2, Patsy Chau1, June Chau1, Thuan Q. Thach1, Tze-Wai Wong3, Christine Loh4, and Chit-Ming Wong1
1Department of Community Medicine, University of Hong Kong, Pokfulam, Hong Kong SAR, China, 2Institute for Environment, University of Science & Technology, Kowloon, Hong Kong SAR, China, 3Department of Community and Family Medicine, Chinese University of Hong Kong, Prince of Wales Hospital, Shatin, Hong Kong SAR, China, and 4Civic Exchange, Hoseinee House, Hong Kong SAR, China
Air quality has deteriorated in Hong Kong over more than15 yr. As part of a program of public accountability, photo-graphs on Poor and Better visibility days were used as represen-tations of the relationships among visibility, air pollution,adverse health effects, and community costs for health care andlost productivity. Coefficients from time-series models andgazetted costs were used to estimate the health and economicimpacts of different levels of pollution. In this population of 6.9million, air quality improvement from the annual average to thelowest pollutant levels of Better visibility days, comparable tothe World Health Organization air quality guidelines, wouldavoid 1335 deaths, 60,587 hospital bed days, and 6.7 million doc-tor visits for respiratory complaints each year. Direct costs andproductivity losses avoided would be over US$240 million ayear. The dissemination of these findings led to increaseddemands for pollution controls from the public and legislators,but denials of the need for urgent action arose from the govern-ment. The outcome demonstrates the need for more effectivetranslation of the scientific evidence base into risk communica-tion and public policy.
The Hong Kong Special Administrative Region (SAR) is aterritory of 1100 km2 comprising an archipelago of 2 majorislands and many smaller outer islands, a peninsula, and landadjacent to the mainland of the People’s Republic of China.Annual deaths total about 30,000 and age-standardized totalmortality (0.4%) is about 18% lower than in the West, withcardiovascular disease 47% lower and respiratory disease 40%
higher. The annual gross domestic product (GDP) per capita isUS$25,000 in a mostly service-based economy. In recent yearsthe manufacturing sector moved north of the boundary into themainland, and over 70,000 factories operate around the PearlRiver Delta.
In 1990, by restricting fuel sulfur content to 0.5% byweight, the Hong Kong SAR demonstrated that even modestreductions in pollution led to significant health gains (Peterset al., 1996; Wong et al., 1998; 1999; Hedley et al., 2002).Since then air quality has been continuously degraded. Despitethe progressive establishment of a large evidence base on airpollution health effects, there has been (1) a lack of recognitionof the real community costs incurred by harm to health and lostproductivity produced by air pollution; ( 2) a lack of compre-hensive approaches to improve urban air quality, includingcleaner fuels, transportation, and infrastructure of urban envi-ronments; and (3) a failure to implement new laws and regula-tions on emissions and air quality standards. As a result, airquality in Hong Kong now compares unfavorably with the cur-rent situation in other cities such as Auckland, Berlin, London,New York, Paris, and Vancouver. Particulate matter (PM) lev-els are about 40% higher than in Los Angeles, the most pol-luted city in the United States (U.S. EPA, 2003).
VISIBILITY, AIR POLLUTANTS, AND HEALTHWatson (2002) cited the U.S. Environmental Protection
Agency (EPA) as identifying impaired visibility as the “bestunderstood of all environmental effects of air pollution.” Inaddition to impairing quality of life, daily loss of visibilitydirectly reflects the risk of injury by airborne pollutants to car-diovascular and pulmonary systems. The commonest manifesta-tions of these health problems include serious cardiopulmonary
The authors thank Edward Stokes for his support of the project andcontribution of the photographs contained within this report.
Address correspondence to Sarah M. McGhee, Department ofCommunity Medicine, University of Hong Kong, 5/F, 21 Sassoon Road,Pokfulam, Hong Kong SAR, China. E-mail: [email protected]

Dow
nloa
ded
At:
02:4
8 25
Jul
y 20
08
AIR POLLUTION COSTS 545
events such as heart attacks, stroke, and respiratory illnesses,including bronchitic symptoms of cough, phlegm and wheeze,acute and chronic bronchitis, pneumonia, and attacks of asthma(Samet et al., 2006; Saldiva et al., 2006; Forastiere et al., 2006).
Effects of air pollution on visibility are apparent to every-one but the adverse health effects may be silent and unobserv-able until they result in symptoms, illness episodes, and death.Even then, direct attribution of illnesses in an individualexposed daily to air pollution is not possible in the same way asnoted with infectious diseases. This uncertainty and lack ofdirect evidence is associated with lower perceptions of risk bysome sections of the public, who are potentially importantdrivers of policy, and with lack of political will by decisionmakers, and it provides scope for arguments against interven-tions and air quality controls by vested interests.
Visibility has been deteriorating in Hong Kong for severalyears (Figure 1). This trend is now raising concern in the tourismand hospitality industry because of its impact on Hong Kong’sattractiveness as a destination, and in the finance and foreign busi-ness sector because of increasing difficulties in recruiting overseaspersonnel. However, the threat of pollution to the health of thelocal community, demonstrated in many recent scientific reports(Peters et al., 1996; Wong et al., 1998, 1999, 2001, 2002a, 2002b,2002c, 2006; Hedley et al., 2002; McGhee et al., 2005), has notprompted the necessary radical action. In this analysis the loss ofvisibility was used as an index with face validity as the basis forrepresenting some of the avoidable adverse health impacts of airpollution and their costs to the community.
METHODS
Photographic Records. Daily concentrations of pollutantlevels were contributed to by both local and regional sources ofemissions. Variations in pollutant levels in Hong Kong are also
strongly influenced by southerly or northerly air mass move-ments and show a marked seasonal pattern. On six occasionsbetween January 2004 and July 2005, landscape photographswere taken at random by a professional photographer on daysthat were perceived to have low and higher visibility (Figure 2).The photographs were taken at three different locations:(1) Tsim Sha Tsui across Victoria Harbour to Central; (2) fromthe Peak across Victoria Harbour to Kowloon; and (3) Ap LeiChau across Aberdeen Harbour. Pairs of photographs withpoor and better visibility were recorded for each location. Onthe low visibility days, data from the Hong Kong Observatoryindicated that visibility averaged 5 km and on higher visibilitydays between 20 to 30 km (Figure 3).
Pollutant Levels. For the dates on which the photographswere taken, the hourly concentrations were obtained offour criteria pollutants (NO2, SO2, PM10, and O3) from theHong Kong Environmental Protection Department (Hong KongEnvironmental Protection Department, 2005). The hourly val-ues were plotted for Poor and Better visibility days (Figure 2),and the daily average concentration of each pollutant was cal-culated based on hourly values from 10 general monitoringstations on those 3 dates. Four different levels of pollutionwere defined: three of them using the pollutant levels associ-ated with the visibility recorded in the photographs and thefourth with additional data from routine annual air pollutantmonitoring (Table 1). The four levels of air quality weredefined in terms of pollutant concentrations for NO2, SO2,PM10, and O3, at both general and roadside monitoring sta-tions (Table 1), and were used to estimate economic gainsfrom air quality improvements under the assumption thatthese levels represented the annual mean concentrations ofpollutants in Hong Kong:
Poor: mean of concentrations observed on Poor visibility days.Better: mean of concentrations on Better visibility days.Good: mean of the minimum concentrations recorded on Better
visibility days.Average: Hong Kong annual mean pollutant concentrations for
2004.
The Good levels were close to or better than those proposedin the new WHO 2006 Air Quality Guidelines (WHO, 2006)(Table 1) but in terms of PM10 they currently comprise only2% of all days in a year. The mean PM10 level of Better daysaccounts for 8%, with 43% of days between Better and the cur-rent Average, and 45% of days having concentrations higherthan Average (Figure 4).
On Poor visibility days, data showed that all pollutantlevels were high at all general and roadside stations, withmarked diurnal variation (Figure 2). On Better visibilitydays the pollutant levels were uniformly lower with anabsence of peaks.
To illustrate the possible adverse health and monetarybenefits from abatement of air pollution, the differencesbetween the air quality levels defined were used (Table 2) to
FIG. 1. Deteriorating visibility (<8km) due to haze based on directobservation of landmarks by the Hong Kong Observatory 1970–2005.
1970 1975 1980 1985 1990 1995 2000 20050
10
20
30
40
50
Hazy days
Numberper year
Year
Source: Hong Kong Observatory

Dow
nloa
ded
At:
02:4
8 25
Jul
y 20
08
546 A. J. HEDLEY ET AL.
calculate the value of reductions in air pollution on an annual-ized basis. As illustrated in (Figure 4), improvements in air qual-ity from Average to Better and Average to Good were used.
Avoidable Health EventsFrom previously published local studies on air pollution
and associated increased daily utilization of primary and
FIG. 2. Landscape photographs on higher (Better) and lower (Poor) visibility days with associated air pollutant levels at general and roadside monitoringstations on those days. Source: Environmental Protection Department 2004–2005. http://epic.epd.gov.hk/ca/uid/airdata/p/1.
Tsim Sha Tsui to Victoria Harbour Average pollutant levels across Hong Kong
Sunday 1 August 2004
Tuesday 4 Jan 2005
Peak to Victoria Harbour
Sunday 18 July 2004
Friday 23 July 2004
Wednesday 20 April2005
Thursday 16September 2004
Ap Lei Chau to Aberdeen Harbour

Dow
nloa
ded
At:
02:4
8 25
Jul
y 20
08
AIR POLLUTION COSTS 547
secondary health care and mortality (Wong et al., 2001,2002a, 2002b, 2006), the excess risks for each 10-μg/m3
increase in air pollutants were obtained (Table 3). In all ofthese studies Poisson regression adjusted for autocorrelationand overdispersion was employed to estimate the change inrisks due to the daily variation of a single pollutant, takinginto account season, temperature, humidity, holidays, andinfluenza periods (Wong et al., 2001, 2002a, 2002c). Thetotal number of primary care events was based on a surveyof daily family doctor visits for respiratory complaints inyear 2000 (Wong et al., 2002c, 2006), and the daily num-bers of hospital admissions and deaths in the years 1995 to2000 were obtained from the Hong Kong Hospital Authorityand the Census and Statistics Department death registration(Hong Kong Hospital Authority, 2002; Hong Kong Censusand Statistics Department, 2001). In the present study, datafrom an updated report were used (Wong et al., 2002b). Allanalyses were based on daily pollutant levels obtained fromthe Hong Kong Environmental Protection Department(2005).The linear exposure-response relationship wasemployed between air pollution and adverse health out-comes to estimate the overall reduction in risks that wouldbe associated with the defined improvements in air quality.This risk reduction was applied to population mortality andhealth care utilization data to obtain the annual number ofavoidable deaths and health care events. For primary carethese estimates were restricted to respiratory complaints; forhospital admissions, for cardiovascular and respiratory dis-eases; and for deaths, from all nonaccidental causes ofdeath.
FIG. 3. Hourly visibility on the days photographs were taken for Poor and Better visibility days and the annual average visibility for 2004. Source: Hong KongObservatory 2004–2005.
Annual average for 2004 (12.8 km)
TABLE 1 Four Levels of Air Quality with Corresponding Concentrations
of Four Criteria Pollutants, Defined by Either Visibility or Routine Air Quality Monitoring, at General and Roadside Stations
Concentrations (μg/m3)
Level Definition NO2 SO2 PM10 O3
Poor The mean of the concentrations on Poor visibility days
G 107 64 129 53R 163 66 145 –
Better The mean of the concentrations on Better visibility days
G 35 22 25 19R 60 23 45 –
Good The mean of the minimum concentrations on Better visibility days
G 20 8 16 6R 36 9 23 –
Average The annual Average of all daily concentrations in 2004
G 62 25 61 39R 101 23 80 –
G: 10 General monitoring stations except the background monitoringstation at Tap Mun Chau.
R: 3 Roadside monitoring stations.

Dow
nloa
ded
At:
02:4
8 25
Jul
y 20
08
548 A. J. HEDLEY ET AL.
For each pollutant (P) the impact (IP) in avoidable healthevents (avoidable mortality and avoidable health care utili-zation) for each type of health outcome resulting from airquality improvements was estimated as
where NI is the annual number of the event I in the population;ERP the excess risk for 10 μg/m3 of pollutant P (assumedequivalent to the reduction in risk with a fall of 10 μg/m3 ofpollutant); LP the change in the level of pollutant P for thereduction from one defined level to the other; and P, each ofthe criteria pollutants.
An illustration of estimated changes in risk and healthevents with improved air quality is the calculation of the num-ber of deaths avoided from reduction of a single pollutant. Theexcess risk of mortality associated with a 10-μg/m3 increase inNO2 was 0.64%. With reduction in the pollution level for NO2of 27 μg/m3 (Table 2) associated with air quality improvement
from Average to Better and the assumption of a linear expo-sure-response relationship, the resulting decrease in mortalityrisk would be 1.7%. The number of avoided deaths attributableto this change in NO2 is 545, i.e., 1.7% of the total nonacciden-tal deaths in Hong Kong in the year 2000. Similar calculationswere performed for the other pollutants. The numbers of avoid-able deaths after adjusting for the correlation between pollut-ants were subsequently summed up.
Combining the effects of pollutants. Hourly concentra-tions for NO2, SO2, PM10, and O3 in 2004 were aggregated asdaily means from general and roadside stations. Using 1 to rep-resent the 100% contribution of PM10, first the correlation wasobtained between PM10 and NO2 (r), then the proportionalvariation of NO2 explained by PM10 (r2) was calculated andsubtracted from 1. This obtained value was then reduced by thecorrelation between NO2 and SO2 adjusted by PM10 andbetween PM10 and NO2 adjusted by SO2 (Figure 5). For ourmain estimate it was assumed that only the contributions ofPM10 and O3 were 100%, so the total number of avoidablehealth events associated with pollution was estimated on thebasis of:
To determine the sensitivity of our results to the assump-tions made in the analysis, four additional analyses for eachhealth outcome were performed: (1) SO2 as the dominantpollutant in place of PM10 (T = SO2+0.88 PM10+0.31NO3+O3); (2) NO2 as the dominant pollutant (T = NO2+0.75SO2+0.46 PM10+O3); (3) a single pollutant with the greatest
FIG. 4. Measures of potential improvements in air quality in Hong Kong, illustrated for respirable suspended particulates (PM10), used to estimate avoidableadverse health effects and community costs.
0
20
40
60
80
100
Respirable suspended particulates (PM10)
Hong Kong
2004 (62)
Good
Better
Average
Poor
% of days atthese levels
2%
8%
44%
43%
2%
(16)
(25)
MIC
RO
GR
AM
S/m
3
(112)
TABLE 2 Mean Reduction (μg/m3) in Air Pollutants with Improvement
in Levels of Air Quality
Differences between air quality levels NO2 SO2 PM10 O3
Average – Better 27 3 37 20Average – Good 42 17 46 33Poor – Better 72 41 104 34Better – Good 15 14 9 13
I N LP P P* ER= ×I
T 10= + + +PM 0.41 NO 0.84 SO O2 2 3
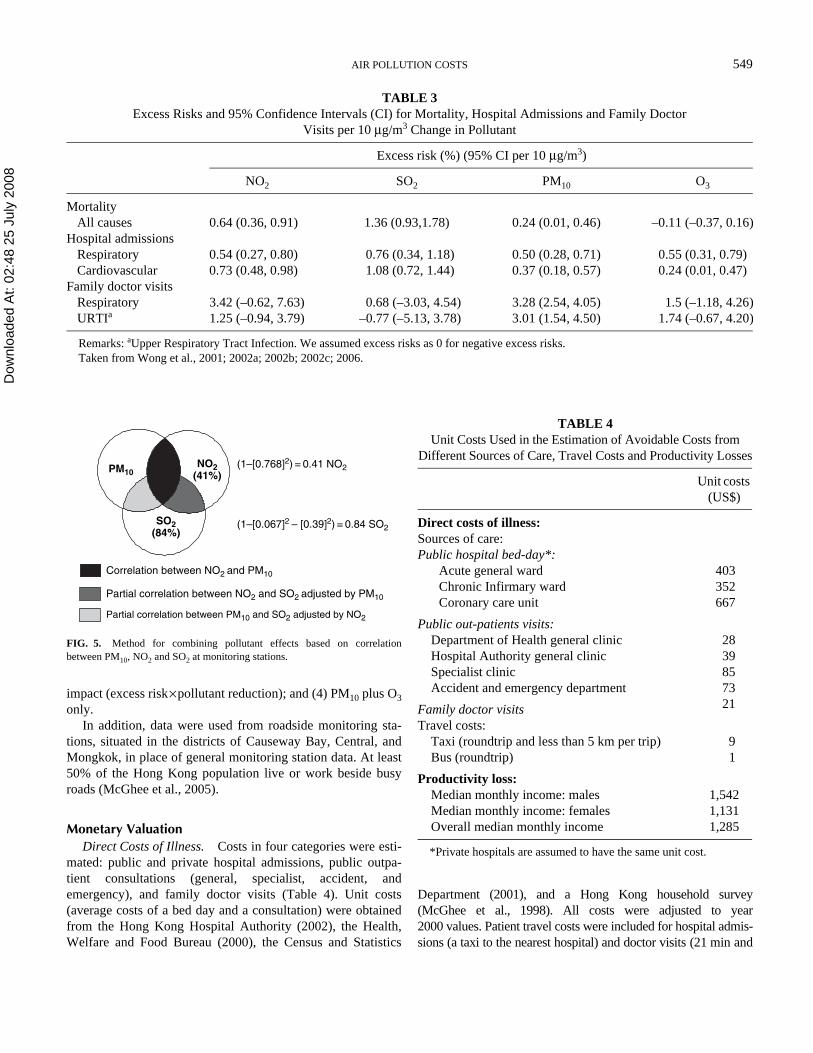
Dow
nloa
ded
At:
02:4
8 25
Jul
y 20
08
AIR POLLUTION COSTS 549
impact (excess risk×pollutant reduction); and (4) PM10 plus O3only.
In addition, data were used from roadside monitoring sta-tions, situated in the districts of Causeway Bay, Central, andMongkok, in place of general monitoring station data. At least50% of the Hong Kong population live or work beside busyroads (McGhee et al., 2005).
Monetary ValuationDirect Costs of Illness. Costs in four categories were esti-
mated: public and private hospital admissions, public outpa-tient consultations (general, specialist, accident, andemergency), and family doctor visits (Table 4). Unit costs(average costs of a bed day and a consultation) were obtainedfrom the Hong Kong Hospital Authority (2002), the Health,Welfare and Food Bureau (2000), the Census and Statistics
Department (2001), and a Hong Kong household survey(McGhee et al., 1998). All costs were adjusted to year2000 values. Patient travel costs were included for hospital admis-sions (a taxi to the nearest hospital) and doctor visits (21 min and
TABLE 3 Excess Risks and 95% Confidence Intervals (CI) for Mortality, Hospital Admissions and Family Doctor
Visits per 10 μg/m3 Change in Pollutant
Excess risk (%) (95% CI per 10 μg/m3)
NO2 SO2 PM10 O3
MortalityAll causes 0.64 (0.36, 0.91) 1.36 (0.93,1.78) 0.24 (0.01, 0.46) –0.11 (–0.37, 0.16)
Hospital admissionsRespiratory 0.54 (0.27, 0.80) 0.76 (0.34, 1.18) 0.50 (0.28, 0.71) 0.55 (0.31, 0.79)Cardiovascular 0.73 (0.48, 0.98) 1.08 (0.72, 1.44) 0.37 (0.18, 0.57) 0.24 (0.01, 0.47)
Family doctor visitsRespiratory 3.42 (–0.62, 7.63) 0.68 (–3.03, 4.54) 3.28 (2.54, 4.05) 1.5 (–1.18, 4.26)URTIa 1.25 (–0.94, 3.79) –0.77 (–5.13, 3.78) 3.01 (1.54, 4.50) 1.74 (–0.67, 4.20)
Remarks: aUpper Respiratory Tract Infection. We assumed excess risks as 0 for negative excess risks.Taken from Wong et al., 2001; 2002a; 2002b; 2002c; 2006.
FIG. 5. Method for combining pollutant effects based on correlationbetween PM10, NO2 and SO2 at monitoring stations.
PM10
SO2(84%)
NO2(41%)
Correlation between NO2 and PM10
Partial correlation between NO2 and SO2 adjusted by PM10
Partial correlation between PM10 and SO2 adjusted by NO2
(1–[0.768]2) = 0.41 NO2
(1–[0.067]2 – [0.39]2) = 0.84 SO2
TABLE 4 Unit Costs Used in the Estimation of Avoidable Costs from
Different Sources of Care, Travel Costs and Productivity Losses
Unit costs (US$)
Direct costs of illness:Sources of care:Public hospital bed-day*:
Acute general ward 403Chronic Infirmary ward 352Coronary care unit 667
Public out-patients visits:Department of Health general clinic 28Hospital Authority general clinic 39Specialist clinic 85Accident and emergency department 73
Family doctor visits 21
Travel costs:Taxi (roundtrip and less than 5 km per trip) 9Bus (roundtrip) 1
Productivity loss:Median monthly income: males 1,542Median monthly income: females 1,131Overall median monthly income 1,285
*Private hospitals are assumed to have the same unit cost.

Dow
nloa
ded
At:
02:4
8 25
Jul
y 20
08
550 A. J. HEDLEY ET AL.
average bus fare per visit), but not for accident and emergencyattendances. The avoidable monetary costs were the product ofavoidable health care utilization and unit costs.
Productivity Losses. Avoidable productivity losses frompremature deaths and from time lost from work due to publicand private hospital admissions and family doctor visits for peo-ple aged 15 to 64 yr were estimated.. For premature deaths theperson-years of life lost under age 65 in the year 2000 was mul-tiplied, adjusted by labor force and employment rates (HongKong Census and Statistics Department, 2005), by the propor-tion avoidable due to reductions in air pollution. Then theseyears were given a value using gender-specific median salaries(Table 4). Productivity losses due to hospital admissions wereestimated using avoidable hospital bed days for those aged 15 to64 yr, adjusted by labor force and employment rates, and gen-der-specific median daily salaries, and those due to family doc-tor visits in the same way but using days of sick leave grantedafter consultation for a respiratory disease (Wong et al., 2002c).
RESULTS
Health Gains From Air Quality ImprovementOn an annualized basis deaths avoidable were 611 for
improvement from Average to Better and 1335 from Averageto Good levels of air quality. Avoidable bed days for hospitaladmissions were 35,244 for Average to Better and 60,587 forimprovement from Average to Good. Avoidable family doctorvisits for respiratory problems alone totalled 6.7 million forimprovement from Average to Good (Table 5).
In recent years the number of days with air pollution levelsworse than average amount to about 45% of the calendar year.
In terms of PM10 this includes a range of approximately 60–111 μg/m3 at general monitoring stations. The pollutant levelson Poor visibility days were over 110 μg/m3 and the trend hasbeen toward Poor. On an annualized basis, the numbers ofdeaths avoided with air quality improvement from Poor to Bet-ter were 2912 and an additional 724 for improvement fromBetter to Good. Avoidable hospital days for these changeswere 115,895 and 25,343, respectively. Doctor visits avoidedfor respiratory disease were 13 and 1.95 million, respectively.
Sensitivity AnalysesAvoidable deaths and costs associated with alternative
assumptions about combinations of pollutants and their effectswere estimated, and also the use of roadside levels withchanges in pollutant levels from Average to Good were deter-mined (Table 6). The majority of the population was exposedto roadside levels for varying periods on a daily basis. Esti-mates of deaths and health care utilization were stable with dif-ferent combinations of four pollutants. The lowest overallestimate was associated with the assumption of independent
TABLE 5 Avoidable Deaths and Health Care Utilization Events
Associated with Air Quality Improvements
Mortality (all causes)
Hospital bed days#
Family doctor visits§
GeneralAverage to Better 611 35,244 4,777,924Average to Good 1,335 60,587 6,732,174Poor to Better 2,912 115,895 13,010,852Better to Good 724 25,343 1,954,250
Roadside*Average to Better 615 36,193 5,133,977Average to Good 1,505 69,698 8,437,168Poor to Better 3,171 123,263 13,808,230Better to Good 891 33,521 3,303,476
*Roadside concentration of O3 was assumed to be the same as thegeneral concentration of O3.
#cardiovascular+respiratory admissions.§respiratory symptoms.
TABLE 6 Results of Sensitivity Analyses for Annual Avoidable Mortality and Costs if Pollution Levels Reduce from
Average to Good levels
No. of avoidable
deathsDirect cost
US$ million
Productivity loss
US$ million
Original assumptionGeneral stations 1,335 190 57Roadside pollutant
levels1,505 235 66
Alternative assumptionsGeneral stationsSO2 as the
dominant pollutant
1,326 170 55
NO2 as the dominant pollutant
1,583 193 65
Single pollutant with largest effect*
860 103 35
PM10+O3 348 136 231990 sulfur
restriction597 – –
Roadside stationsRoadside PM10+O3 437 162 28Roadside single
pollutant with largest effect**
1,319 153 54
*Mortality NO2; Admissions NO2; doctor visits PM10.**Mortality NO2; Admissions NO2; doctor visits PM10.

Dow
nloa
ded
At:
02:4
8 25
Jul
y 20
08
AIR POLLUTION COSTS 551
effects confined to PM10 and O3. Intermediate values wereobtained from the single pollutant with the largest effect (NO2for deaths and admissions; PM10 for doctor visits) and for theobserved effects on mortality for SO2 reduction following the1990 fuel sulfur restriction.
Monetary CostThe avoidable direct costs of illness were US$131 million
up to US$190 million for improvements in air quality fromAverage to Better or to Good, respectively (Table 7). About77% of these costs were due to avoided family doctor visitsand 18% due to costs of public health care from public hospitaladmissions and outpatient visits. Avoidable productivity losseswere valued up to US$57 million (Table 7).
DISCUSSIONAccording to the U.S. Environmental Protection Agency
(2006), governments should “develop, implement and enforcethe environmental laws and regulations and policies” in orderto achieve environmental justice and to safeguard the poor andsocially deprived and the health of the whole community.
At the present time the inventory of pollution associatedadverse health problems in Hong Kong is inevitably incom-plete. In these analyses the proportion of the populationexposed was assumed to be 100%, although detailed quantifica-tion of exposure is lacking. Gaps in our evidence base concern-ing pollution-related adverse health effects and costs include (1)use of self-medication or traditional medicine practitioners forsymptoms produced by pollution, (2) a range of maternal and
child health problems including retardation of fetal growth dur-ing pregnancy and health problems in infants (Glinianaia et al.,2004), and (3) relationship between visibility and suddeninfant deaths as reported in Taiwan (Knobel et al., 1995). Sim-ilarly there is a lack of long-term follow-up studies, which areneeded to examine the risks of stunting of lung growth in chil-dren and adolescents, as recently demonstrated in the UnitedStates (Gauderman et al., 2004).
This analysis has face validity in that it uses simple, conser-vative, validated, and robust methods to estimate the potentialhealth gains and reductions in community costs that might beachieved by consistent steps toward cleaner fuels, cleanerpower units, and improved efficiency in all forms of powergeneration.
The analysis is conservative in that many health outcomesare not yet included. However, although underestimation ofadverse health effects may arise because of incomplete epide-miological information and the use of short-term risk estimatesfrom time-series analyses compared with cohort studies, over-estimation may occur through double counting of outcomes bytreating each of the criteria pollutants as independent risks.There are no statistical or epidemiological methods to reliablydefine the effects of individual pollutants, and natural experi-ments are rare, such as the closure of the Utah steel mill (Pope,1989), the Dublin ban on coal sales (Clancy et al., 2002), andthe Hong Kong fuel sulfur restriction (Hedley et al., 2002).
A range of sensitivity analyses was presented to provide alower bound for our estimates of morbidity deaths and costs.There was little variation among all estimates based on combi-nations of pollutants, with different assumptions about thedominant pollutant, with annual deaths ranging from 1335 to1583. The highest estimates were associated with roadsidemonitoring data concerning air to which a large proportion ofthe Hong Kong population is exposed for long periods on adaily basis. The combination of PM10 and O3, suggested by theWHO Working Group (2003), provided the lowest estimate fordeaths and overall costs, although direct costs were relativelyhigh because of the marked association between PM10 and doc-tor visits for respiratory problems. However, this estimate waslower than the observed effect on deaths following the HongKong 1990 fuel sulfur restriction and reduction of a single pol-lutant, SO2. This short-term effect is the most significant evi-dence for an independent effect of a single pollutant or at leasta surrogate for other pollutants, such as metals from sulfur richfuels. Similarly, from Hong Kong time-series estimates, singlepollutants with the largest effect for mortality (NO2), hospitaladmissions (NO2), and doctor visits (PM10) gave intermediatevalues, with 860 deaths avoided each year.
Our approach to estimation of adverse health effects from acombined analysis of four pollutants is justified if one consid-ers the evidence for possible independent effects of pollutantsin Hong Kong. The 1990 sulfur restriction in fuel was associ-ated with a temporary (18 mo) reduction in sulfate in respirableparticulates and a sustained long-term reduction in SO2 and
TABLE 7 Annual Avoidable Costs for Reductions in Levels of Air
Pollution from Average to Better and to Good Air Quality
Avoidable Costs (US$)
Avoidable costsAverage to Better
Average to Good
Direct cost of illness:Public hospital admissions 12.9 22.1Public out-patient visits 11.3 16.8Private hospital admissions 0.9 1.6Family doctor visits 100.4 141.4Travel costs 5.6 7.9Total direct cost 131.0 189.8Productivity loss:Hospital admissions 0.2 0.4Family doctor visits 11.2 15.8Premature deaths 18.7 40.8Total productivity loss 30.1 57.0Total direct and productivity
costs161.1 246.8
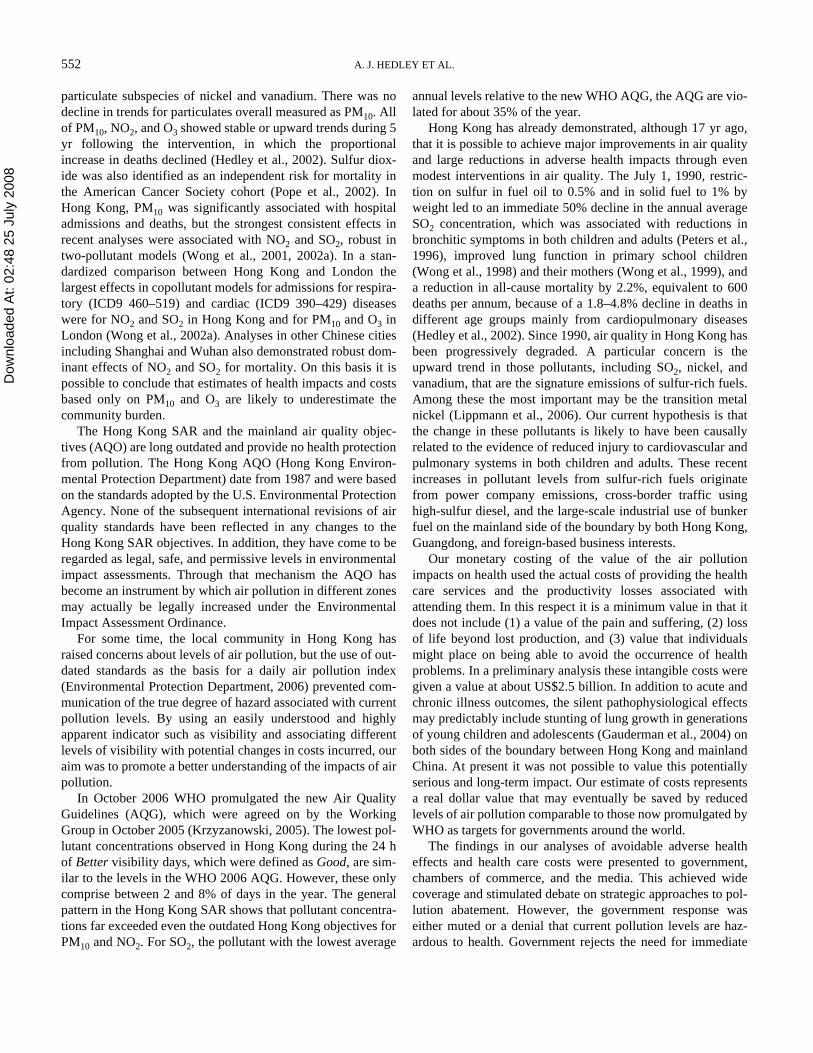
Dow
nloa
ded
At:
02:4
8 25
Jul
y 20
08
552 A. J. HEDLEY ET AL.
particulate subspecies of nickel and vanadium. There was nodecline in trends for particulates overall measured as PM10. Allof PM10, NO2, and O3 showed stable or upward trends during 5yr following the intervention, in which the proportionalincrease in deaths declined (Hedley et al., 2002). Sulfur diox-ide was also identified as an independent risk for mortality inthe American Cancer Society cohort (Pope et al., 2002). InHong Kong, PM10 was significantly associated with hospitaladmissions and deaths, but the strongest consistent effects inrecent analyses were associated with NO2 and SO2, robust intwo-pollutant models (Wong et al., 2001, 2002a). In a stan-dardized comparison between Hong Kong and London thelargest effects in copollutant models for admissions for respira-tory (ICD9 460–519) and cardiac (ICD9 390–429) diseaseswere for NO2 and SO2 in Hong Kong and for PM10 and O3 inLondon (Wong et al., 2002a). Analyses in other Chinese citiesincluding Shanghai and Wuhan also demonstrated robust dom-inant effects of NO2 and SO2 for mortality. On this basis it ispossible to conclude that estimates of health impacts and costsbased only on PM10 and O3 are likely to underestimate thecommunity burden.
The Hong Kong SAR and the mainland air quality objec-tives (AQO) are long outdated and provide no health protectionfrom pollution. The Hong Kong AQO (Hong Kong Environ-mental Protection Department) date from 1987 and were basedon the standards adopted by the U.S. Environmental ProtectionAgency. None of the subsequent international revisions of airquality standards have been reflected in any changes to theHong Kong SAR objectives. In addition, they have come to beregarded as legal, safe, and permissive levels in environmentalimpact assessments. Through that mechanism the AQO hasbecome an instrument by which air pollution in different zonesmay actually be legally increased under the EnvironmentalImpact Assessment Ordinance.
For some time, the local community in Hong Kong hasraised concerns about levels of air pollution, but the use of out-dated standards as the basis for a daily air pollution index(Environmental Protection Department, 2006) prevented com-munication of the true degree of hazard associated with currentpollution levels. By using an easily understood and highlyapparent indicator such as visibility and associating differentlevels of visibility with potential changes in costs incurred, ouraim was to promote a better understanding of the impacts of airpollution.
In October 2006 WHO promulgated the new Air QualityGuidelines (AQG), which were agreed on by the WorkingGroup in October 2005 (Krzyzanowski, 2005). The lowest pol-lutant concentrations observed in Hong Kong during the 24 hof Better visibility days, which were defined as Good, are sim-ilar to the levels in the WHO 2006 AQG. However, these onlycomprise between 2 and 8% of days in the year. The generalpattern in the Hong Kong SAR shows that pollutant concentra-tions far exceeded even the outdated Hong Kong objectives forPM10 and NO2. For SO2, the pollutant with the lowest average
annual levels relative to the new WHO AQG, the AQG are vio-lated for about 35% of the year.
Hong Kong has already demonstrated, although 17 yr ago,that it is possible to achieve major improvements in air qualityand large reductions in adverse health impacts through evenmodest interventions in air quality. The July 1, 1990, restric-tion on sulfur in fuel oil to 0.5% and in solid fuel to 1% byweight led to an immediate 50% decline in the annual averageSO2 concentration, which was associated with reductions inbronchitic symptoms in both children and adults (Peters et al.,1996), improved lung function in primary school children(Wong et al., 1998) and their mothers (Wong et al., 1999), anda reduction in all-cause mortality by 2.2%, equivalent to 600deaths per annum, because of a 1.8–4.8% decline in deaths indifferent age groups mainly from cardiopulmonary diseases(Hedley et al., 2002). Since 1990, air quality in Hong Kong hasbeen progressively degraded. A particular concern is theupward trend in those pollutants, including SO2, nickel, andvanadium, that are the signature emissions of sulfur-rich fuels.Among these the most important may be the transition metalnickel (Lippmann et al., 2006). Our current hypothesis is thatthe change in these pollutants is likely to have been causallyrelated to the evidence of reduced injury to cardiovascular andpulmonary systems in both children and adults. These recentincreases in pollutant levels from sulfur-rich fuels originatefrom power company emissions, cross-border traffic usinghigh-sulfur diesel, and the large-scale industrial use of bunkerfuel on the mainland side of the boundary by both Hong Kong,Guangdong, and foreign-based business interests.
Our monetary costing of the value of the air pollutionimpacts on health used the actual costs of providing the healthcare services and the productivity losses associated withattending them. In this respect it is a minimum value in that itdoes not include (1) a value of the pain and suffering, (2) lossof life beyond lost production, and (3) value that individualsmight place on being able to avoid the occurrence of healthproblems. In a preliminary analysis these intangible costs weregiven a value at about US$2.5 billion. In addition to acute andchronic illness outcomes, the silent pathophysiological effectsmay predictably include stunting of lung growth in generationsof young children and adolescents (Gauderman et al., 2004) onboth sides of the boundary between Hong Kong and mainlandChina. At present it was not possible to value this potentiallyserious and long-term impact. Our estimate of costs representsa real dollar value that may eventually be saved by reducedlevels of air pollution comparable to those now promulgated byWHO as targets for governments around the world.
The findings in our analyses of avoidable adverse healtheffects and health care costs were presented to government,chambers of commerce, and the media. This achieved widecoverage and stimulated debate on strategic approaches to pol-lution abatement. However, the government response waseither muted or a denial that current pollution levels are haz-ardous to health. Government rejects the need for immediate

Dow
nloa
ded
At:
02:4
8 25
Jul
y 20
08
AIR POLLUTION COSTS 553
and urgent action without further evidence of adverse healtheffects, and an external consultancy is scheduled not to reportuntil January 2009 on the formulation of revised air qualityobjectives.
Hong Kong must integrate both its local and cross-boundaryactions in new strategies to achieve specific air quality targetson clearly defined time scales. The present situation, in whichtargets and time scales are only considered “on a best endeav-our basis” (Hong Kong Advisory Council on the Environment,2002), is unacceptable from an environmental and publichealth viewpoint.
CONCLUSIONAt both the population and individual level, the clear and
urgent indications are that the Hong Kong SAR governmentneeds to act to ensure that radical pollution abatement mea-sures are implemented, enforced, and monitored both locallyand in relation to cross-boundary movements. The major con-tinuing challenge to public health and environmental special-ists is the translation and promotion of the scientific evidencebase into risk communication and public policy.
REFERENCESClancy, L., Goodman, P., Sinclair, H., and Dockery, D. W. 2002. Effect of air-
pollution control on death rates in Dublin, Ireland: An intervention study.Lancet 360:1210–1214.
Environmental Protection Department, Hong Kong SAR. 2005. Past air moni-toring station data. www.epd.gov.hk/epd/english/environmentinhk/air/data/air_data.html (12 December 2005).
Environmental Protection Department, Hong Kong SAR. 2006. API subindexlevels and their corresponding concentrations. www.epd-asg.gov.hk/print/english/backgd/table122.php (11 December 2006).
Forastiere, F., Peters, A., Kelly, F. J., and Holgate, S. T. 2006. Nitrogen diox-ide. In Air quality guidelines global update 2005. Particulate matter,ozone, nitrogen dioxide and sulfur dioxide, pp. 331–394. Copenhagen:World Health Organization.
Gauderman, W. J., Avol, E., Gilliland, F., Vora, H., Thomas, D., Berhane, K.,McConnell, R., Kuenzli, N., Lurmann, F., Rappaport, E., Margolis, H.,Bates, D., and Peters, J. 2004. The effect of air pollution on lung develop-ment from 10 to 18 years of age. N. Engl. J. Med. 351:1057–1067.
Glinianaia, S. V., Rankin, J., Bell, R., Pless-Mulloli, T., and Howel, D. 2004.Particulate air pollution and fetal health: A systematic review of the epide-miologic evidence. Epidemiology 15:36–45.
Health, Welfare and Food Bureau. 2000. Lifelong investment in health: Consul-tation document on health care reform. Hong Kong: Government Printer.
Hedley, A. J., Wong, C. M., Thach, T. Q., Ma, S. L. S., Lam, T. H., and Ander-son, H. R. 2002. Cardiorespiratory and all-cause mortality after restrictionson sulphur content of fuel in Hong Kong: An intervention study. Lancet360:1646–1652.
Hong Kong Advisory Council on Environment. 2002. Improving air quality inPearl River Delta region. ACE Paper 15/2002, 29 April. Hong Kong.
Hong Kong Census and Statistics Department. 2001. Hong Kong annual digestof statistics. Hong Kong: Hong Kong Printer.
Hong Kong Census and Statistics Department. 2005. Men and women in HongKong, Key statistics (2005 edition). Hong Kong: Hong Kong Printer.
Hong Kong Environmental Protection Department. 2005. Technical memoran-dum for specifying air quality objectives for Hong Kong. Issued undersubsection 7(1A) of the air Pollution Control Ordinance. Accessed9 December 2006. www.epd.gov.hk/epd/english/envir_standards/files/apgn 8e.pdf
Hong Kong Hospital Authority. 2002. Hospital authority annual report 2000–2001. Hong Kong: Hong Kong Hospital Authority. www.ha.org.hk/hesd/nsapi?MIval=ha_view_template&group=AHA&Area=ANR&Subj=R01&ustamp=2006%2d05%2d18+15%3a41%3a16%2e893 (18 May 2006).
Knobel, H. H., Chen, C. J., and Liang, K. Y. 1995. Sudden infant death syn-drome in relation to weather and optimetrically measured air pollution inTaiwan. Pediatrics 96:1106–1110.
Krzyzanowski, M. 2005. WHO air quality guidelines. Global update. WHORegional Office for Europe. European Centre for Environment and Health,Bonn Office. www.euro.who.int/Document/E87950.pdf (18 April 2006).
Lippmann, M., Ito, K., Hwang, J. S., Maciejczyk, P., and Chen, L. C. 2006.Cardiovascular effects of nickel in ambient air. Environ. Health Perspect.114:1662–1669.
McGhee, S. M., Bacon-Shone, J., Hung, J., Ma, S. K., Brudevold, C., and Hed-ley, A. J. 1998. Household survey report 1998. Report prepared for Har-vard University. Department of Community Medicine and Social SciencesResearch Centre, University of Hong Kong.
McGhee, S. M., Yeung, R. Y. T., Wong, L. C., Chau, J., Wong, C. M., Ho, L. M.,and Fielding, R. 2005. The health benefits of reduced air pollution:Value and trade-offs. Health Care and Promotion Fund. Health, Welfareand Food Bureau, Hong Kong SAR Government. Final report referencenumber 213018. http://hwfbgrants.netsoft.net/english/funded_search/funded_search.php.
Peters, J., Hedley, A. J., Wong, C. M., Lam, T. H., Ong, S. G., Liu J., andSpiegelhalter, D. J. 1996. Effects of an ambient air pollution interventionand environmental tobacco smoke on children's respiratory health in HongKong. Int. J. Epidemiol. 25:821–828.
Pope, C. A. III. 1989. Respiratory disease associated with community air pol-lution and a steel mill, Utah Valley. Am. J. Public Health 79:623–628.
Pope, C. A. III, Burnett, R. T., Thun, M. J., Calle, E. E., Krewski, D., Ito, K.,and Thurston, G. D. 2002. Lung cancer, cardiopulmonary mortality, andlong-term exposure to fine particulate air pollution. J Am. Med. Assoc.287:1132–1141.
Saldiva, P. H. N., Künzli, N., and Lippmann, M. 2006. Ozone. In Air qualityguidelines global update 2005. Particulate matter, ozone, nitrogendioxide and sulfur dioxide, pp. 307–330. Copenhagen: World HealthOrganization.
Samet, J. M., Brauer, M., and Schlesinger, R. 2006. Particulate matter. In Air qual-ity guidelines global update 2005. Particulate matter, ozone, nitrogen dioxideand sulfur dioxide, pp. 217–305. Copenhagen: World Health Organization.
U.S. Environmental Protection Agency 2003. National air quality and emis-sions trends report, 2003 Special studies edition. www.epa.gov/air/air-trends/report.html (27 January 2006).
U.S. Environmental Protection Agency 2006. Environmental justice.www.epa.gov/compliance/environmentaljustice/index.html (27 January 2006)
Watson, J. G. 2002. Visibility: Science and regulation. J. Air Waste Manage.Assoc. 52:628–713.
Wong, C. M., Lam, T. H., Peters, J., Hedley, A. J., Ong, S. G., Tam, A. Y. C.,Liu, J., and Speigelehalter, D. J. 1998. Comparison between two districts ofthe effects of an air pollution intervention on bronchial responsiveness inprimary school children in Hong Kong. J. Epidemiol. Commun. Health52:571–578.
Wong, C. M., Hu, Z. G., Lam, T. H., Hedley, A. J., and Peters, J. 1999. Effects ofambient air pollution and environmental tobacco smoke on respiratory healthof non-smoking women in Hong Kong. Int. J. Epidemiol. 28:859–864.
Wong, C. M., Ma, S. L. S., Hedley, A. J., and Lam, T. H. 2001. Effect of airpollution on daily mortality in Hong Kong. Environ. Health Perspect.109:335–340.
Wong, C. M., Atkinson, R. W., Anderson, H. R., Hedley, A. J., Ma, S. L. S.,Chau, Y. K., and Lam, T. H. 2002a. A tale of two cities: effects of air pol-lution on hospital admissions in Hong Kong and London compared. Envi-ron. Health Perspect. 110:67–77.
Wong, C. M., McGhee, S. M., Yeung, R. Y. T., Thach, T. Q., Wong, T. W.,and Hedley, A. J. 2002b. Short term health impact and costs due to roadtraffic-related air pollution. Final Report submitted to Environmental Pro-tection Department. Hong Kong Air Pollution and Health Joint ResearchGroup. www.epd.gov.hk/epd/english/environmentinhk/air/studyrpts/files/ap_health_impact_02.pdf (20 May 2006).
Dow
nloa
ded
At:
02:4
8 25
Jul
y 20
08
554 A. J. HEDLEY ET AL.
Wong, T. W., Wun, Y. T., Yu, T. S., Tam, W., Wong, C. M., and Wong, A. H.S. 2002c. Air pollution and general practice consultations for respiratoryillnesses. J. Epidemiol. Commun. Health 56:949–950.
Wong, T. W., Tam, W., Yu, I. T. S., Wun, Y. T., Wong, A. H. S., andWong, C. M. 2006. The association between air pollution and generalpractitioner visits for respiratory diseases in Hong Kong. Thorax61:585–591.
World Health Organization. 2003. Health aspects of air pollution with particu-late matter, ozone and nitrogen dioxide. Report on a WHO WorkingGroup, Bonn, Germany, 13–15 January. www.euro.who.int/document/e79097.pdf (7 December 2006)
World Health Organization. 2006. Air quality guidelines global update 2005.Particulate matter, ozone, nitrogen dioxide and sulfur dioxide. Copenhagen:World Health Organization.