


Languages
Pages
Legal


NBER WORKING PAPER SERIES
YOU GET A BOOK! DEMAND SPILLOVERS, COMBATIVE ADVERTISING, ANDCELEBRITY ENDORSEMENTS
Craig L. Garthwaite
Working Paper 17915http://www.nber.org/papers/w17915
NATIONAL BUREAU OF ECONOMIC RESEARCH1050 Massachusetts Avenue
Cambridge, MA 02138March 2012
I am grateful to Jen Brown, Meghan Busse, Kerwin Charles, Joseph Doyle, Bill Evans, Melissa Kearney,Matt Notowidigdo, Alan Sorensen, and Heidi Williams for valuable comments and advice. Lena Fishmanprovided excellent research assistance. I would like to thank Jonathan Stolper at BookScan for providingaccess to the book sales data. All errors remain my own. The views expressed herein are those of theauthor and do not necessarily reflect the views of the National Bureau of Economic Research.
NBER working papers are circulated for discussion and comment purposes. They have not been peer-reviewed or been subject to the review by the NBER Board of Directors that accompanies officialNBER publications.
© 2012 by Craig L. Garthwaite. All rights reserved. Short sections of text, not to exceed two paragraphs,may be quoted without explicit permission provided that full credit, including © notice, is given tothe source.

You Get a Book! Demand Spillovers, Combative Advertising, and Celebrity EndorsementsCraig L. GarthwaiteNBER Working Paper No. 17915March 2012JEL No. D20,D22,I2,L0,L1,L2,L8
ABSTRACT
This paper studies the economic effects of endorsements. In the publishing sector, endorsements fromthe Oprah Winfrey Book Club are found to be a business stealing form of advertising that raises titlelevel sales without increasing the market size. The endorsements decrease aggregate adult fiction sales;likely as a result of the endorsed books being more difficult than those that otherwise would have beenpurchased. Economically meaningful sales increases are also found for non-endorsed titles by endorsedauthors. These spillover demand estimates demonstrate a broad range of benefits from advertisingfor firms operating in a multiproduct brand setting.
Craig L. GarthwaiteDepartment of Management and StrategyKellogg School of ManagementNorthwestern University2001 Sheridan RoadEvanston, IL 60208and [email protected]

1
Celebrity endorsements are a common advertising tool. Products as varied as cosmetics,
apparel, watches, liquor, cars, pharmaceuticals, weight loss programs, financial services and
countertop grilling machines are commonly promoted through an explicit association with
celebrities. The use of such endorsements dates at least as far back as Pope Leo XIII’s 1899
endorsement of the alcoholic beverage Vin Mariani.1
The efforts by economists to understand advertising’s effects on competitors and
consumers share a similarly long history. Early on, Marshall (1919) characterized two broad
types of advertising for which economic impacts differ significantly. “Constructive advertising”
increases sales by attracting new buyers into the market. In contrast, “combative advertising”
shifts existing customers between products, meaning that the gains to firms that advertise are
matched by losses for competitors.2 While the advertising firm will obtain increased sales in
either case, the effect on competitors’ profits—and therefore the response the advertising firm
should anticipate from its competitors—differs between the two types.
In this paper, I study the effects of a particular set of celebrity endorsements. I estimate
the direct endorsement sales effect, the impact on other unadvertised products sold under an
umbrella brand, and Marshall’s nearly century old question about potential market expanding or
business stealing impacts. My results are useful not only for understanding the effects of
celebrity endorsements, but also for understanding more generally the impact of advertising on
consumer behavior with respect to both advertised and competing products.
1 Vin Mariani was a popular drink containing Bordeaux wine and coca leaves and reportedly served as an inspiration for the original Coca-Cola recipe. In 1899, Pope Leo XIII awarded the drink a Vatican gold medal and his image was used on posters advertising the beverage. Thomas Edison was another vocal proponent (Inciardi, 1992). 2 More recently, the marketing literature has attempted to estimate the aggregate effects of advertising using advertising response models (Little, 1979). Similarly, authors have considered a related question to this study at the micro-level with respect to the impact of advertising on brand switching and repeat purchasing behavior. For example, Deighton et al. (1994) found that advertising in the ketchup, liquid detergent, and powdered detergent markets caused brand switching but not repeat purchasing for those who had recently purchased the brand.

2
There is a fundamental difficulty in obtaining consistent estimates of the effect of
endorsements—and advertising in general—which arises from a lack of exogenous variation. In
short, the problem is that firms get to decide when, how, and how much to advertise. It is
reasonable to expect that a firm’s decision to hire a celebrity endorser or to purchase other costly
advertising results from a strategic planning process driven at least in part by past and forecasted
future sales. For example, one might argue that firms experiencing sales growth and increased
profits would be expected to reinvest at least part of these earnings into advertising in an attempt
to build on their market position. Conversely, one might believe that firms facing declining sales
would be expected to increase their advertising efforts in an attempt to halt their fall. As a result
of these factors and a number of other potential latent confounds, a lack of exogenous variation
in advertising generates estimates that are biased in unknown directions.
In an attempt to avoid endogeneity concerns, Knittel and Stango (2011) and Mathur et al.
(1997) used event-study methodologies to estimate the impact of unexpected shocks to the
anticipated impact of endorsers stemming from the public embarrassments of Tiger Woods and
the surprising return of Michael Jordan to professional basketball, respectively. However, these
authors lacked product and category sales data and instead proxied for this information with
stock market performance—limiting their ability to estimate the competitive effects and spillover
benefits resulting from advertising.
To overcome these problems, I exploit Oprah Winfrey’s Book Club (hereafter “the
Club”) as an exogenous set of endorsements in the publishing sector. Over the Club’s 15 years
of existence, Winfrey endorsed 70 titles that sold millions of post-endorsement copies. Club
endorsements occurred with no temporal pattern within or across years. Publishers had no
control over which titles were selected or when the endorsements were announced. To study the
3
effects of these exogenous events, I use data from Nielsen’s BookScan panel, a proprietary point-
of-sale dataset representing approximately 75 percent of total U.S. book sales.
I find three main effects of endorsements. First, consumers immediately increase
purchases of an endorsed product. This estimated sales effect peaks at an approximately 400
percent increase during the week following the endorsement. In subsequent weeks, the effect
smoothly declines, but remains large and statistically significant more than half a year later.
Second, endorsements generate meaningful spillover benefits for cobranded goods.
Immediately following the endorsement, the sales of non-endorsed titles written by endorsed
authors increase. Relative to pre-endorsement sales, this increase is similar in magnitude to the
effect of a positive review in the New York Times estimated by Berger et al. (2010). Unlike the
main endorsement effect, the spillover sales impact increases in the months following the
endorsement. Additionally, the spillover demand effect is largest for the non-endorsed titles with
the highest pre-endorsement weekly sales. From this pattern of spillover demand we can infer
that an endorsement for one product can provide important information to consumers about
related goods or services.3 This demonstrates the broad range of benefits which accrue to firms
from advertising in an umbrella brand setting. This is particularly true in markets where buyers
cannot determine the underlying quality of products prior to purchase but can infer quality
signals from cobranded goods.
Third, despite causing large changes in purchasing behavior, endorsements result in more
business stealing than market expansion. In the publishing sector, aggregate book sales do not
increase following a Club endorsement—suggesting that non-readers are unaffected. Among
adult fiction books, which represent approximately 85 percent of Club selections, aggregate sales
3 Balachander and Ghose (2003) were among the first authors to estimate the spillover effects of advertising in the presence of a brand extension. However, these authors relied on firm-chosen advertising efforts, leaving their estimates susceptible to the endogeneity concerns described above.

4
actually decline following an endorsement. As I argue below, one plausible explanation is that
endorsed titles are harder or longer on average than books that would have been purchased in the
endorsement’s absence. At the genre level, the post-endorsement period is marked by large sales
declines in the romance, mystery, and action categories. These genres were popular prior to the
endorsements in the geographic areas demonstrating the largest endorsement responses. Using
quantitative measures of text readability, I show that endorsed titles require one additional year
of education to read than is typical for romance, mystery and action books. Furthermore, the
post-endorsement sales decline was largest following the endorsement of classic novels, which
require nearly four more years of education to comprehend than typical romance, mystery, or
action titles. Since the cost of consuming a book is the combination of the retail price and the
opportunity cost of the time spent reading the text, the post-endorsement sales decline in
publishing should be considered similar to endorsements in other sectors that shift consumers
towards more expensive products.
In addition to serving as a source of exogenous variation, the market-wide effects of the
Club are of general interest. Contrary to popular perception, the Club’s heavily publicized effort
to “get America reading again” did little to increase the total number of books purchased. Given
the high profile nature of Winfrey’s program, the fact that it was unable to attract new readers
into the market makes it necessary to reconsider the potential efficacy of other attempts to
increase reading. 4 New and existing programs may benefit from lessons about the dynamics of
the Club’s impact on the quality of reading. Winfrey’s endorsements consistently increased the
4 For example, the National Endowment for the Arts program “The Big Read” was a highly publicized effort to “restore reading to the center of American culture.” This was primarily done by selecting a book at a city level and hosting wide ranging activities related to the title. Even this multi-city and heavily funded book club program is dwarfed by the popularity of Winfrey’s club. A Google search for the exact phrase, “Oprah Book Club,” returns approximately 1.5 million results. A similar search for “The Big Read” returns only 455,000 results—and many of those results are for a famous BBC survey of the same name.

5
sales of books that were harder on average than the novels that readers would have otherwise
purchased. While this may have decreased the total number of titles purchased, the increase in
the text’s difficulty may be desirable from the perspective of a reading promotion program.
Given this evidence, these literacy programs might have a larger impact if they focused more of
their efforts on increasing the quality rather than the quantity of books read.
The results of this study may also contribute to a broader debate in economics about the
mechanism by which advertising influences consumer behavior.5 Stigler (1961) argued that
advertisements provide consumers with explicit information about goods or services of which
they were unaware, while Stigler and Becker (1977) and Becker and Murphy (1993) introduced
the notion that persuasive advertising may change the underlying demand for a product, perhaps
by serving as a complement in the utility function.6 Following an endorsement, the main and
spillover estimates follow distinctly different paths. The continual growth in the magnitude of
the spillover effect in three months following an endorsement, compared to the steady decline of
the main endorsement effect, is suggestive of consumers becoming informed about the existence
of a product they prefer rather than being persuaded solely by the endorsement to make a one-
time purchase.
5 Importantly, economists’ efforts have primarily focused on modeling advertising’s efficacy without relying on changes in consumer preferences. There is a rich and important literature in both marketing and psychology concerning advertising’s impact on consumer behavior that extends beyond this constraint. Vakratsas and Ambler (1999) provided an excellent summary of the different theories in this literature, including but not limited too models which focus on the emotional responses of consumers (and their preferences) to advertising. 6 This could also be thought of as the pure consumption value of the brand. McClure et al. (2004) provided compelling evidence of the intrinsic value consumers place on brands. The authors show that in a blind test consumers had an equal split of preferences between the soft drinks Coke and Pepsi. However, customers expressed a statistically significant preference for a brand labeled glass of Coke compared to an unbranded glass they were told contained either Coke or Pepsi. Furthermore, using functional magnetic resonance imaging technology, the authors find differential brain activity when drinking a Coke based on whether the customer was told it was a Coke or they were told it contained either Coke or Pepsi. A similar effect was not found for Pepsi. Bronnenberg et al. (2011) further showed the importance of brands in a non-experimental setting. By exploiting regional migration patterns these authors documented that consumer brand preferences for similar products are persistent and can explain 40 percent of the differences in market shares across geographic areas.
6
I. Advertising and Consumer Behavior
One of the first economists to study the competitive effects of advertising, Marshall
(1919) described advertising’s effects on aggregate market size. Marshall was concerned that
advertising that simply shifted consumers between firms within a market is socially wasteful and
leads to higher prices. Although Marshall’s early thoughts lacked a detailed framework for
understanding advertising’s impact on consumer behavior, other economists have more recently
examined and modeled the mechanism underlying advertising’s efficacy. Two primary
categories have emerged among economists: informative and persuasive advertising.
Informative advertising provides consumers with information about product quality and
prices. Stigler (1961) first suggested that this type of advertising could be valuable when
consumers are uniformed and search is costly. Nelson (1970, 1974) extended this theory to show
that even advertisements not providing direct information may still serve an informative role.7
Economists have also posited a persuasive view of advertising. In separate but related analyses,
Stigler and Becker (1977) and Becker and Murphy (1993) consider advertising as a complement
to the advertised product in a consumer utility function. For example, Becker and Murphy
theorize that a consumer may enjoy greater utility from consuming both the product and its
advertising or prestige, relative to consuming the product alone. Unlike the informative view,
under this framework the existence of advertising shifts the actual utility individuals receive
from the consumption of the main product. Of course, in practice, advertising could operate
through both of these channels individually or simultaneously.
7 This was particularly true in the situation of experience goods—products where quality is not revealed until after purchase. In these markets, advertisements can improve the match between buyers and products through the mechanism of repeat purchases. For goods that are repeatedly purchased, high quality firms have the greatest incentive to advertise and therefore even customers that have never purchased the product before may infer a quality signal from the advertising expenditures. Marketing expenditures can also be a sign of a successful company possessing the resources to advertise, which also may impart a signal of quality.

7
II. Previous Difficulties Estimating the Endorsement Effect
Celebrity spokespeople are an important feature of advertising. Approximately 20
percent of advertisements feature an endorsement and, in some countries, this number can reach
as high as 45 percent (Bowman, 2010). A 2009 survey found that approximately one quarter of
consumers reported having purchased a product because of a celebrity spokesperson. Half of all
consumers in the survey reported that they only notice an endorsement if it is for a product
category in which they are already interested, suggesting that endorsements lead to business
stealing for many consumers (MEC Global, 2009).
In the economics literature, endorsements have been found to be associated with
increased stock market performance for the advertising firm and, to a more limited extent, higher
sales of the advertised product (Agrawal and Kamakura, 1995; Elberse and Verleun, 2011).
However, this previous research has faced several empirical challenges. The most immediate
challenge is potential endogeneity in the timing and selection of an endorser. As detailed above,
numerous latent confounds drive both the advertising decision and product sales, generating a
bias in the estimates.
In addition to endogeneity concerns, it is often difficult to obtain accurate and complete
sales data. Instead, many researchers proxy for sales with stock market performance. Agrawal
and Kamakura (1995) employed an event-study methodology using 110 celebrity endorsements
and found a positive effect of these endorsements on firm value. Elberse and Verleun (2011)
also found positive stock market effects for a panel of 178 athlete endorsers across 95 firms.8
These results, however, do not account for the fact that endorsements are often anticipated and
8 Elberse and Verleun (2011) also used consumer tracking data and found a product-level sales increase. However, the sales estimates are still subject to the endogeneity concerns discussed above.
8
investors have likely incorporated this expectation into the firm’s stock price. Moreover,
endogeneity in the endorsement decision remains a concern with these methodologies.
Others authors who have exploited exogenous variation in endorsement behavior were
unable to measure product or category level sales effects.9 This limits their ability to estimate
the competitive and spillover effects from endorsements. Mathur et al. (1997) examined the
impact of Michael Jordan’s surprise emergence from retirement in 1995. The authors found
Jordan’s announced return increased the market value of firms employing him as an endorser and
some (self-described) “weak evidence” of an effect on the equity prices of competitors. Knittel
and Stango (2011) estimated that the negative publicity surrounding Tiger Woods’ car crash and
alleged marital infidelity in 2009 decreased the stock market performance of firms that he
endorsed. In addition, competitor firms not employing any prominent endorsers experienced
increased returns. Given the reliance on stock market data the authors were unable to separate an
endorsement sales effect for these competitors from a broad re-pricing of the risk of celebrity
advertising. Finally, in a study of unpaid endorsements, Yermack (2011) found that clothing
companies saw a 1.7 percent increase in their stock market performance when First Lady
Michelle Obama wore their products. In 2009, this generated approximately $5 billion in
shareholder value.
I overcome the challenges facing the previous literature by exploiting the differential
timing of the selection of books for Oprah Winfrey’s highly publicized book club. Since
publishing firms and their authors are unable to select themselves into the Club, this environment
overcomes the typical endogeneity concerns resulting from self-selection into advertising. In
addition, the subjects of the endorsements were difficult (if impossible) to anticipate, limiting
9 One way to overcome this problem would be through the use of field experiments. Krishnamurthi and Raj (1985) used a split cable experiment where one set of houses received advertising signals while others did not. Among those receiving advertisement, demand for the advertised advertising becomes more inelastic.
9
concern about trends in consumer behavior prior to the announcement biasing the estimates.
Finally, point-of-sale (POS) book sales data is available for a large sample of sellers in the
market. These data have the advantage of providing information about title, genre, and
aggregate sales, allowing me to estimate the endorsement’s effect along many dimensions.
While the richness of this setting represents an opportunity to cleanly identify the effect
of celebrity endorsements, these endorsements represent a unique form of advertising that may
not be representative of all paid product endorsements. For example, the endorsement is paired
with the activities of the Club. It is possible that individuals respond to the advertisement
because of the utility they receive from participating in the Club activities and not any increased
utility from reading the novel. However, we would not expect this version of the Club effect to
spillover to other products; yet, I provide evidence that a Club endorsement impacts other titles
written by the same author that were not associated with any unique activities.
A further concern is that Winfrey has stated publicly that she does not accept any
payments for product endorsements and that publishers and authors have no influence on the
Club selection process. This is a benefit with respect to addressing potential endogeneity in the
advertising decision. However, it is also true that the effect of Winfrey’s unpaid endorsement of
a book may not fully reflect the impact of firm-determined advertising. In particular, Winfrey’s
endorsement is different in nature to the costly advertising expenditures used by firms with
differentiated products to signal product quality, as discussed in Nelson (1970, 1974). This
might be less of a concern in the publishing industry, where one of the most popular forms of
advertising (particular in the 1990s and 2000s) is “free media” from television appearances on
10
daily talk shows (Bosman, 2007).10 In this way, a Club endorsement is more similar to the
traditional advertising activity in this market, limiting concerns about external validity.
Finally, Winfrey’s sheer celebrity is remarkable and raises concern about the
generalizability of her impact to other endorsement settings. To better understand whether the
presence of the estimated endorsement effect is unique to Winfrey, I also analyze the main and
spillover effects of the Today Show Book Club (hereafter the Today Club).11 Although smaller
in magnitude, the endorsement effects from the Today Club are similar to Winfrey’s effects,
suggesting that Winfrey’s impact is unique in its size but not its existence.
III. Oprah Winfrey as an Endorser
Oprah Winfrey began hosting a daily, syndicated talk show in 1986. In 1996, she altered
the show’s format to differentiate the program from its daytime competitors. Self-described as
“Change Your Life” television, the show offered guidance and suggestions about various
activities, products, and services. In the years following this change, Winfrey herself enjoyed
considerable influence. In 1999, Time magazine named Winfrey (along with Albert Einstein and
Mohandas Karamchand (Mahatma) Ghandi) among the most influential people of the 20th
Century. She was included on each subsequent list produced by the magazine. Only four people
were included on lists in both the 20th and 21st Century—Winfrey, Bill Gates, Nelson Mandela,
and Pope John Paul II. Time is not alone; in 2007, Forbes magazine named Winfrey the most
powerful celebrity in the world (Goldman, 2007).
10 As evidence of this fact, many public relations experts sold books and media kits detailing specific strategies for placing a novel on a regular episode of The Oprah Winfrey Show or other prominent talk shows (Harrow, 2002). 11 Due to data limitations, it is not possible to analyze the competitive effects of the Today Club. Most of the selections for this club occur before aggregate sales data are available. For this reason, the Today Club estimates are presented as a supplement to the Oprah Club main and spillover effect estimates.
11
Commercial responses to Winfrey’s product suggestions serve as further evidence of this
influence. In 2002, she created “Oprah’s Favorite Things,” an annual segment highlighting the
merits of goods and services. Her endorsement had immediate impact. For example, during the
2003 segment, Winfrey spoke for 42 seconds about holiday smoked turkeys from Greenberg
Smoked Turkeys of Tyler, Texas. Previously, the firm averaged 5,000 new customers a year. In
the two weeks following the show the company sold 22,000 turkeys to new customers,
generating over $1 million in revenue. Eight years later the company was selling 200,000
turkeys a year, a 33 percent increase over their average annual pre-endorsement sales
(Townsend, 2011).
This endorsement influence extends beyond the commercial sphere. Despite a long
history of avoiding political involvement, she formally endorsed United States Senator Barack
Obama’s first presidential campaign in 2007. At the time, there was great controversy over the
potential for Winfrey or any celebrity to influence a presidential election. Garthwaite and Moore
(2011) found that Winfrey’s endorsement was responsible for an increase of approximately one
million votes for President Obama throughout the 2008 Democratic Primaries.
Negative comments from Winfrey also carry great weight. During a 1996 episode on
bovine spongiform encephalopathy (“Mad Cow”) disease, Winfrey said that the information
about the disease “stopped me cold from eating another burger.” The following day cattle
futures fell 10 percent (Verhovek, 1998). Subsequent research into the response of both futures
prices and consumer purchasing habits found that the impact of Winfrey’s comment was 50
percent of the size of the estimated effect of the first documented case of an infected American
cow (Schlenker and Villas-Boas, 2009).
12
IV. Oprah Winfrey’s Book Club
Winfrey’s most publicized endorsement effort began in 1996 with the creation of
“Oprah’s Book Club,” a self-described effort to “get America reading again.” She personally
selected the titles, endorsed them during a nationally televised segment, and hosted a televised
segment discussing each book. An article in The New York Times stated that the Club “provoked
considerable skepticism in the literary world, where many associated daytime television with
lowbrow entertainments like soap operas and game shows” (Kirkpatrick, 2002).
It quickly became apparent that the selections were not the simplistic books and self-help
guides traditionally associated with daytime television. For example, the first selection was The
Deep End of the Ocean, a novel describing the destructive events following the kidnapping of a
three-year-old child. Prior to being endorsed, the novel sold approximately 70,000 copies—
impressive for a first novel, but hardly a blockbuster. In the month following Winfrey’s
endorsement, sales increased by 700,000 copies and became a number one bestseller (Feldman,
1997). The next two selections were older novels: Toni Morrison’s Beloved and Jane Hamilton’s
A Story of Ruth. Each sold nearly a million copies following the endorsement.
The Club’s impact was not lost on authors or publishers. Toni Morrison commented that
she received more notoriety from being included in the Club than she did from winning the
Nobel Prize (Minzesheimer, 2011). Publishers Weekly Executive Editor Daisy Maryles wrote
that “in fiction, veteran bestseller authors dominate, and for debut novels, a nod from Oprah is
the only way to real success. The only two first novelists in the top 30 [in 1999] are White
Oleander and Mother of Pearl—both were book club picks on her show” (Maryles, 2000).
Previous research has shown that each of the first 48 selected books became bestselling
titles (Butler et al., 2005). This sales increase extended well beyond the time period the book
13
was included in the Club. However, these researchers did not have data on the number of books
sold either individually or in the aggregate. In a separate analysis of the sales effect of being
named a New York Times bestseller, Sorensen (2007) noted that books endorsed by the Club in
2001 and 2002 experienced large sales increases.
Due to Winfrey’s lofty ambitions to change America’s reading behavior and the highly
publicized sales increases for endorsed novels, there is a general consensus that the Club
benefitted the entire publishing sector. For example, a Time magazine article opined, “[i]t’s not
true that Oprah Winfrey’s book club was the most important development in the history of
literacy. For instance, there was the invention of the written word. Then there was movable type.
So Oprah comes in third” (Lacayo and Sachs, 2002). The American Library Association granted
Winfrey an honorary lifetime membership and stated that she “single-handedly expanding the
size of the reading public” (Lamolinara, 1997). However, no research to date has quantified the
aggregate effects of these endorsements on the total number of books sold or on the Club’s
spillover demand effects on the preferences of readers.
V. The United States Publishing Industry
The United States publishing industry employs over 90,000 individuals and generates
approximately $30 billion in annual revenue (IBISWorld, 2010). In recent history, the industry
has grown dramatically—from 2002 to 2010, the number of new titles printed each year
increased by nearly 50 percent (Bowkers, 2010). Indeed, recent growth is a continuation of a
historical trend—from 1989 to 1995; the total number of books sold increased by 10 percent and
the dollar sales in the industry grew by nearly 40 percent (Greco, 2005).
14
Despite these sales increases, the percentage of Americans reporting that they read
“literature” has declined from 56.9 percent in 1982 to 46.7 percent in 2002. 12 This rate
increased to 50.2 percent by 2008, but remained nearly 12 percent below its 1982 level. Over the
same time period, the percentage of respondents reading “any book” declined from 60.9 in 1982
to 56.6 in 2002. In contrast to the percentage reading literature, the percent reading any book
declined further to 54.3 in 2008 (National Endowment for the Arts, 2009).
Individual books are experience goods—the quality of the story and writing are only
revealed after the purchase. Therefore, the customer’s problem can be framed as a search for
quality using a variety of noisy signals and information sources. Readers select individual titles
for a variety of reasons. Survey evidence found that nearly 27 percent of customers report that
they were persuaded by information coming from reviews, individuals they know,
advertisements, and sales people (Book Industry Study Group, 2001). Academic research has
also documented the importance of these signals. Berger et al. (2010) found that a positive
review from the New York Times increased sales by between 32 and 52 percent. For new
authors, even a negative review increased sales by 45 percent. Similarly, Carmi et al. (2009)
found that online recommendation engines provided information that influenced consumer
purchase decisions.
Another important factor in the purchase decision is a title’s cover art, which was cited by
approximately 15 percent of surveyed customers (Book Industry Study Group, 2001). This
cover art includes emblems such as being selected as part of the Club or winning an award such
as the Pulitzer Prize or PEN/Faulkner award for fiction.
12 For the purposes of the survey, the National Endowment of the Arts defined literature as “any novels, short stories, plays, or poetry in their leisure time (not for work or school).” They made no attempt to identify the underlying quality of the books being read.

15
In general, book advertising is the responsibility of the marketing and promotion
departments of large publishing houses.13 The primary methods of promotion are author book
tours and media appearances. Traditionally these tours involve visits to retail outlets with the
requisite readings and book signings. Over time the activities have concentrated on radio and
television appearances (Greco, 2005). By the mid-2000s, media opportunities included
appearances on prominent national talk shows which were known to feature writers and believed
to greatly influence sales (Bosman, 2007). Similar to an endorsement, television interviews are
believed to be positive because the hosts typically provide laudatory comments about the author
and book. Indeed, these positive words may be more important than the appearance before a
national audience. It has been suggested that business commentator Jim Cramer’s appearance on
The Daily Show, during which he was heavily criticized by host Jon Stewart, decreased his book
sales in subsequent weeks (Ritholz, 2009).
VI. Data
The data for this analysis come from Nielsen BookScan (hereafter BookScan)—the
premier tracking system for book sales in the United States. BookScan collects sales and
return data at the point of sale, providing detailed information on the book purchasing
behavior of American consumers. Titles are tracked by their International Standard Book
Number (ISBN) number, which is unique to a particular edition.14 According to BookScan,
“[i]n a typical week over 500,000 different ISBNs are tracked selling approximately 14
13 While there are a large number of book publishers, the vast majority of successful books are marketed and distributed by large publishing houses. In 2005, the top ten publishing houses were responsible for 96.7 percent of hardcover bestsellers and 88.6 percent of paperback bestsellers. This number remains generally constant over time (Maryles, 2006). 14 For example, the first edition hardcover of a novel would have a unique ISBN while the subsequent mass market paperback edition would have a different ISBN. Special editions such as a movie tie-in or the “Oprah Book Club” edition would also receive their own ISBN.

16
million units in total” (Nielsen, 2011). BookScan claims that its sample represents
approximately 75 percent of total market sales. These data come from chain booksellers
such as Borders, Barnes and Noble, B. Dalton, and Books-a-Million, as well as a large
number of independent booksellers. BookScan also receives data from online retailers such
as Amazon.com, BN.com, and Powells.com. It does not collect data for sales that occur at
Wal-Mart, Sam’s Club, many grocery stores, or for the sales of electronic books.
BookScan first began collecting individual title sales data in 2001. These data are
available as consistent panel as of 2004, aggregated at the national and designated market
area (DMA) level.15 This analysis uses title-level data from January 2001 to June 2011 and
aggregate sales data from January 2004 to June 2011. Data are available for both adult and
juvenile titles and are categorized into genres such as “classics,” “romance,” and “memoirs.”
BookScan also provides weekly bestseller lists and a weekly index of the relative popularity
of genres in each DMA.
VII. Effect of Club Endorsements on Title Sales
From 2001 to 2011—the years for which title-level BookScan sales data are
available—Winfrey made 25 Club endorsements.16 Table 1 contains descriptive data about
these titles, including the year and week of the year of the endorsement. The summary table
reveals no consistent pattern of selection dates; the 25 titles are selected in 18 different weeks
of the year and the number of endorsements each year varies over time. The selected works
are in the genres of general fiction, classics, or memoirs. The average price for the Club
15 DMAs are groups of counties that form a metropolitan area. They are the same local areas used for Nielsen television ratings and are generally larger than Metropolitan Statistical Areas. 16 Of these 25 titles, 17 were selected after 2004—the time period where aggregate book sales data is available from Nielsen BookScan.

17
edition of the novel was $18.34, and the average length was 491 pages. The retail price of
selections was not systematically higher than the average available book during this period.17
The magnitude of the direct Club endorsement sales effect can be estimated using the
following equation:
52 7
11 1
I{Endorsement Week} I{Week of Year} I{Year} (1)it i it m t n t i itm n
LNSALES
where LNSALESit is the logarithm of weekly reported sales for all editions of a particular
title i during week t, I{Endorsement Week}it is an indicator variable equal to 1 if the week is
during the defined time period following the announcement of the endorsement of title i,
I{Week of Year}t are a series of indicator variables for the 52 weeks of the year that control
for the seasonality of book sales18, I{Year}t is a set of indicator variables for the calendar
year, µi is a book-specific fixed effect, and εit is an idiosyncratic error term. Standard errors
allow for within group correlation at the individual title level. The coefficient of interest is
β1, which measures the approximate percentage change in weekly sales for a specified
number of weeks following the endorsement, compared to the sales of books that were
endorsed in other time periods. Therefore, the sales of endorsed books during the weeks
when they were not endorsed control for the time path of sales that would have occurred in
the absence of the endorsement.19
17 In 2004, the average price for all hardcover titles was $27.52, for trade paperbacks the price was $15.76, and for mass-market paperback the average price was $7.35 (Bowker, 2005). In response to concern that endorsed hardcover books were considerably more expensive than paperback books, Winfrey asked publishers to donate copies of selected editions to local libraries (Feldman, 1997). Depending on their size libraries received up to five free copies of the text and, in total, over 600,000 Club selections have been distributed to libraries (Kniffel, 2011). 18 Historically, the book industry exhibited similar seasonal patterns to the general retail sector. In particular, the fourth quarter (including Christmas) had a disproportionate level of sales. This changed over time, and, by 2001, retails sales appeared uniformly distributed over all quarters (Greco, 2005). Overall, however, there are still particular weeks of the year with consistently disproportionate sales and therefore week effects are important for accurately estimating the impact of the Club selections. 19 To consider the possibility that the data after an endorsement do not serve as an appropriate comparison for counterfactual sales, I estimate the main results excluding these post-endorsement observations. This change does
18
Table 2 reports the estimates from specifications of equation (1) for post-selection
periods of one, four, eight, and twelve weeks. The estimates show a consistently large
increase in title-level sales resulting from the endorsement. For example, during the first
week following the selection announcement sales increased by approximately 390 percent.
This effect was long-lasting. Over the entire 12 weeks following the announcement, there
was an average weekly increase of approximately 360 percent.20 It is important to note that
individuals may respond to the endorsement by reading a copy they already own (a distinct
possibility with some of Winfrey’s older selections), borrowing a copy from the library, or
purchasing the book at a non-BookScan location such as Wal-Mart. That is, the results in
Table 2 may underestimate the true magnitude of the endorsement’s effect on reading
behavior.
The estimates from equation (1) provide the average weekly sales increase over
certain time periods. The time path and persistence of this endorsement effect can be
estimated using the following equation,
26 52 10
8 1 1
I{k weeks since Endorsement} I{Week of Year} I{Year} (2)it i k it m t n t i itk m n
LNSALES
where each πk coefficient represents the estimated effect of a Club endorsement on sales for a
week that falls k weeks before and after the endorsement. If Club endorsements are
uncorrelated with pre-existing sales, there should be no detectable impact on sales during the
8 weeks prior to the announcement. To examine the persistence of the endorsement effect
not have a meaningful effect on the estimated coefficients. For example, the estimated effect for the 12 week post-endorsement time period with all titles is 3.57 (0.284). The corresponding effect dropping observations after this treatment window is 3.63 (0.313). 20 Recall that aggregate sales data from Nielsen, which will be used in the aggregate sales analysis below, are only available following January 1, 2004. Re-estimating the results in Table 2 using data from this time period finds similarly large impacts from the endorsements. For example, the estimate for the 8 week period following an endorsement was 3.573 (0.262).
19
over time, I estimate coefficients for the 26 weeks following the endorsement. Given the
large number of coefficients, the results from equation (2) are summarized in Figure 1.
There are several features to note. First, in the 8-week period prior to the endorsement, there
are no statistically significant sales effects for endorsed titles. Sales spike immediately and
then peak during the week following the endorsement at an approximately 420 percent
increase.21 This effect then steadily decreases in every subsequent week. Despite this
decline, the endorsement exhibits remarkable persistence—even half a year after the
announcement Club endorsed title sales were approximately 160 percent higher.
As discussed above, there could be a concern that the sheer popularity of Oprah
Winfrey makes the presence—not just the magnitude—of the sales impact a unique and non-
generalizable phenomenon. To address this concern, I exploit the existence of a second
national, albeit smaller and less popular, book club that existed during the same time period.
In response to the success of Winfrey’s Club, NBC’s The Today Show launched its
own book-themed segment (hereafter the “Today Club”). The Today Club invited popular
authors to appear and select a favorite book that was then discussed one month later during a
live segment. I gathered data on 16 of the selected titles from 2002 to 2004.22 Over this time
period, there were several differences between the two clubs with respect to the types of
novels and the timing of the announcements. Novels in the Today Club were much more
recent, with the average novel in the sample available for approximately 300 days prior to the
selection. In contrast, the average Oprah Club title was available for several years. Many of
the Today Club authors selected were relatively new or unknown. As a result, the average
21 The size of this effect relative to the week of the endorsement is likely a result of differential timing of the endorsement during the week resulting in a varying number of days for consumers to respond to the new information. For example, a Friday endorsement would only allow two days to respond during the “first week,” while an announcement on a Monday would provide an entire week. 22 Titles were excluded from the dataset if they had been released within two months of their selection date.

20
weekly book sales prior to the endorsement were only 381 for these titles compared to over
1,800 for Oprah Club titles.
To compare the Today Club to Winfrey’s Club, I re-estimate equation (1) using the
Today Show endorsement data. If Winfrey’s effect is unique, then we might expect the
results to dramatically differ across the clubs. The results are presented in the second panel of
Table 2. During the eight-week period following the endorsement, the estimated effect of a
Winfrey Club endorsement is 85 percent larger than the effect of a Today Club
endorsement.23 It is important to note that this estimated effect is measured as a percentage
change, and the Today Club books had dramatically lower pre-endorsement sales.
Over time, the Today Club estimates follow a muted but similar pattern to Oprah
Club endorsements. In an unreported analysis similar to Figure 1, the endorsement effect
peaks and then smoothly declines until it is small and statistically insignificant 15 weeks after
the endorsement. Comparing the estimates from one week after to 12 weeks after the
endorsement, the Winfrey Club endorsement falls by 8 percent while the Today Club
endorsement falls by 33 percent. A half year after the endorsement, the Today Club point
estimate is 0.0605 (0.355) compared to 1.61 (0.21) for the Oprah Club endorsements.
Despite the differences in persistence, the Today Club estimates demonstrate that the
effects of Winfrey’s endorsements are different in their size, but not in their presence. That
is, Winfrey may be a unique celebrity, but her endorsement’s impact is similar to other
sources.
23 This should perhaps not be surprising as Winfrey’s show enjoyed demonstrably more regular viewers than the Today Show. In 2008, Winfrey’s show had a viewership of nearly 7.5 million, compared to approximately 5 million for the Today Show.
21
VIII. Spillover Demand from Club Endorsements
The analysis in the previous section demonstrates that Club endorsements increase title-
level sales. An open question is whether consumers change their future path of purchasing
behavior in the face of the new information from the endorsement or if instead individuals
respond narrowly to the one-time endorsement stimulus. To answer this question, I estimate the
sales change for non-endorsed books written by endorsed authors using a dataset of title-level
sales for all other books written by endorsed authors. 24 This includes data for 106 titles by 15
authors from 2001 to 2011.25
The first panel of Table 3 contains estimates from equation (1) using this dataset and
provides strong evidence of spillover demand following the endorsement. For the 1, 4, 8 or 12
week period following the endorsement, there is a large and statistically significant sales increase
for non-endorsed titles written by endorsed authors. For example, in the eight weeks following
the endorsement, the sale of these non-endorsed titles increased by approximately 37 percent per
week. This change is approximately one tenth the size of the main endorsement effect in Table 2,
but is still economically meaningful. Relative to pre-endorsement sales the spillover demand
from a Club endorsement is of a similar magnitude to the main effect of a positive New York
Times review (Berger et al., 2010).
The evolution of the spillover benefits over time provides suggestive evidence of the
mechanism underlying the change in consumer behavior. Recall that the main endorsement
24 Hendricks and Sorensen (2009) examined a related question concerning the spillover effects of product entry, as opposed to advertising, in the context of newly released albums by artists with existing records. These authors found that the release of a new album, particularly a hit album, caused a permanent increase in the sales of earlier recordings by the same artist. 25 This is smaller than the total number authors endorsed over this time period. Authors were not included if they did not have a second book available for sale at the time of the Club endorsement. In addition, this dataset does not include novels written by Ken Follett. Nearly five weeks prior to his Club endorsement, Follett released World Without End a highly publicized sequel to Pillars of the Earth. Due to the fact that the release of this title impacts the sale of other book by the same author, including Follett’s works would bias the estimated spillover effect.
22
effect in Figure 1 peaks immediately and then smoothly declines. If consumers are learning
about the quality of the author by consuming the endorsed product, then the spillover effect
should follow a different pattern that increases in magnitude as the length of time since the
endorsement grows. However, if the spillovers are solely the result of hearing the author’s name,
differential title placement within a physical bookstore, or the suggestions of an online
recommendation system at the point of purchase, this effect should either follow the same pattern
as Figure 1 or remain constant following its initial rise.
To explore these dynamics, I estimate a specification of equation (2) using non-endorsed
title sales data. These estimates are summarized in Figure 2. Beginning the week of the
endorsement there is an immediate and persistent sales increase. In fact, 26 weeks after the
endorsement, there remains a statistically significant 25 percent weekly sales increase. In
contrast to the main endorsement estimate, the spillover demand effect does not peak until 12
weeks following the endorsement, when the estimate is 63 percent larger than and statistically
different from the first week estimate (p-value < 0.05). For comparison, at 12 weeks the main
endorsements effect is 33 percent smaller than the endorsement week.
An analysis of all other books by an endorsed author may not provide the most accurate
evidence of a spillover demand effect. Many of these authors have a number of unpopular and
low-selling books that have not been read even by the authors’ most ardent fans. Since it is not
immediately clear that the lesser-known titles will experience any spillover demand effect,
including these effectively untreated titles in the analysis may attenuate estimates of spillover.
The second panel of Table 3 contains estimates from weekly sales data for only the highest
selling non-endorsed book for each author.26 For example, Leo Tolstoy’s top selling non-
26 The highest selling non-endorsed book is defined as the title with the highest average weekly sales prior to the endorsement announcement.
23
endorsed title is War and Peace and John Steinbeck’s is Of Mice and Men. Except for the week
of the endorsement, this smaller set of titles enjoys large and statistically significant sales
increases. In each post-endorsement time period, the bestseller spillover estimate is larger than
the estimate for all titles. This should perhaps not be surprising; the highest-selling non-
endorsed title may be the natural next selection for readers who enjoyed the endorsed title.
Figure 3 contains the point estimates from equation (2) for the bestselling pre-
endorsement title and for all other novels. These estimates provide even greater evidence of
consumers learning from information gained from the endorsement. For both sets of books, the
endorsement causes an immediate sales increase. The effect for best-selling non-endorsed titles
consistently increases until 11 weeks after the endorsement when the estimate is nearly three
times the estimated effect for all other non-endorsed novels and two and a half times greater than
the bestseller estimate during the endorsement week. These estimates suggest that customers are
not simply responding to increased exposure to the author’s name resulting from the
endorsement. The estimates for best-selling novels remain well above the effect for all other
novels and the initial bestselling endorsement effect until 15 weeks after the endorsement.
Following the 18th week, the estimate for bestselling novels is similar in magnitude to all other
titles, but it is not statistically significant at conventional levels.
Beyond the bestselling title, many of the endorsed authors had several exceptionally
popular books prior to the Club endorsement. For example, although John Steinbeck’s
bestselling non-endorsed title, Of Mice and Men, sold nearly 4,000 weekly copies prior to the
endorsement, The Grapes of Wrath and The Pearl sold nearly 3,000 and 2,000 copies per week,
respectively. To provide a more systematic analysis of the impact of the pre-endorsement sales

24
on spillover demand, I estimate a specification of equation (1) where I{Endorsement Week}it is
interacted with the logarithm of the title’s average pre-endorsement weekly sales.
Figure 4 contains the linear combination and 95% confidence interval of the estimates
from such a specification where the 8-week post-endorsement variable is interacted with a
quadratic pre-endorsement sales effect. There are several things of importance in this figure.
Among the non-endorsed titles, the 10th percentile of the logarithm of pre-endorsement sales was
2.45 and the 90th percentile was 7.39. Over this range, the spillover demand effect is positive,
statistically significant, and strictly increasing in the pre-endorsement popularity of the title. A
title at the 10th percentile of pre-endorsement sales experienced a 17 percent increase in weekly
sales, while there was an approximately 68 percent increase at the 90th percentile. It is important
to note that this is not simply a mechanical relationship. Figure 5 contains a similar specification
for the main Club endorsement effect and displays exactly the opposite pattern. For endorsed
titles, the 10th percentile of the logarithm of pre-endorsement sales was 5.03 and the 90th
percentile was 8.14. Over this interval, the endorsement effect is strictly decreasing from a 480
to 190 percent sales increase. The main endorsement effect is strongest for products with which
individuals are likely least familiar, while the spillover effect appears strongest for cobranded
products that are best-known prior to the endorsement.
To consider again the uniqueness of Winfrey’s effect on spillover demand, the bottom
panel of Table 3 contains similar estimates from Today Club endorsements.27 After an
endorsement, authors’ non-endorsed titles saw large percentage sales increases. Importantly,
the magnitude of the coefficient represents the relative sales increase, and the non-endorsed
Today Club titles had less than one third of the sales of Oprah Club non-endorsed titles prior
27 Because the Today Show had fewer of authors who tended to younger, there are a much smaller number of titles available for this analysis. In total, 12 authors and 31 titles are included in the spillover analysis.
25
to their selection. The spillover demand impact for the Today Club is less persistent than for
the Oprah Club. Figure 6 contains the estimated impact on non-endorsed titles for the 26
weeks following the selection. The spillover demand immediately spikes following the
endorsement. After eight weeks, the effect on weekly sales is only sporadically statistically
significant at conventional levels.
Together, the main and spillover sales estimates suggest that Club endorsements have
a large impact on consumer purchasing decisions. The observed patterns may also describe
consumer behavior in other sectors where firms offer many products under one umbrella
brand. Advertising expenditures for one specific product provide benefits across the entire
brand, and consumers increase their purchases of the most familiar cobranded products. The
increase in the sales effect over time suggests that consumer responses to advertising in an
experience good market is driven, in part, by the provision of new information about product
quality.
IX. Competitive Effects of Celebrity Endorsements
Evidence of large changes in consumer purchasing behavior in response to an
endorsement leads naturally to a question about the change in aggregate book sales. In general,
individuals within the industry, the media, and the public assumed that the Club markedly
increased overall book sales. However, predicting the potential effects of these endorsements on
aggregate sales requires carefully considering the structure of the publishing sector. Broadly,
this large experience good market is composed of two consumer types—readers and non-
readers.28
28 PubTrack, a market research survey of the book buying habits of Americans, found that approximately 45 percent of Americans over the age of thirteen read a book in the previous year (Milliot, 2009).
26
Readers receive direct utility from the act of reading, regularly consume books, and
continually purchase new texts after they have finished their current selection.29 These
consumers choose individual titles based on information garnered from a variety of sources such
as advertising, author television appearances, endorsements, or bookstore displays. For readers,
the overall price of consuming the book reflects a combination of the retail price and the
opportunity cost of the time spent reading the text. That is, books that take longer to complete
are more expensive than shorter books with the same retail price. The length of time necessary
to complete a book is a function of the word count, difficulty of the writing, and the complexity
of the story.
In contrast, non-readers may have previous experience in the book market, but have
determined that they typically receive no direct utility from reading. These potential customers
only purchase books when the benefits from indirect factors—such as widespread media
attention, prominent endorsements, media mentions, movie releases, and other attention—
overcome their personal cost of reading.
Even under this simple framework, it is clear that the impact of advertising and
endorsements on title-level and aggregate sales will not necessarily be uniform. If endorsements
attract non-readers into the market, then individual title and aggregate sales should increase.
Instead, if endorsements merely shift the purchases of readers towards more difficult books, then
title-level sales should increase while aggregate sales remain constant or even decrease. This
second impact would be considered business stealing rather than market expansion.
The empirical results below examine the effect of endorsements in the United States
publishing sector on title-level and aggregate sales. However, this conceptual framework
29 Readers don’t purchase necessarily one book at a time but the rate at which they purchase books is related to the speed with which they finish their current selection.
27
extends to other markets—indeed, longer and more difficult books are simply examples of
products that are more expensive than what would have been purchased in the absence of an
endorsement.
For the publishing sector, I estimate the aggregate sales effect of Club endorsements
using the following equation on total sales data:
52 7
11 1
I{Endorsement Week} I{Week of Year} I{Year} (3)t t m t n t tm n
LNSALES
where LNSALESt is equal to the logarithm of total or category sales in week t, I{Endorsement
Week}t is an indicator variable for a week falling within a defined time period following the
announcement of a Club selection, and all other variables are defined as in equation (1).
Standard errors are adjusted using the Newey-West correction to account for autocorrelation. An
augmented Dickey Fuller test rejects the null hypothesis of a unit root. Under the assumption
that the timing of Club endorsements is unrelated to other factors affecting the demand of books,
γ1 represents the estimated percentage change in aggregate sales resulting from an endorsement.30
The first four columns of Table 4 contain estimates from equation (3) using aggregate
data for total adult sales, adult fiction sales, and adult non-fiction sales. Each entry in the table
contains an estimate of γ1 from a specification that accounts for different post-announcement
time periods and sales categories. For example, the estimate in the first row of the first column
shows that, in the week following a Club endorsement, there was a statistically insignificant
change of approximately 1.2 percent in the sales of adult books.
30 One such alternate event would be the release of other popular books concurrently with the announcement of the book club selection. An examination of genre-level and aggregate sales show that this only occurs once over the seven years of the sample. During the 38th week of 2009, Winfrey announced Say You’re One of Them, as an Oprah book club selection. During the same week, Dan Brown released The Lost Symbol, his popular follow up novel to The DaVinci Code. Since these events cannot be separately identified in the data, the results below do not include Say You’re One of Them as a Club book. Including the novel would generate an upward bias to the estimate of the endorsement effect. This is particularly true in the genre-level results in Table 5.
28
Nearly all of the endorsed titles were in the adult fiction sales category, contained in the
second row. In the eight weeks following an endorsement, there was a statistically significant
2.1 percent decrease in weekly adult fiction sales (p-value < 0.10). In the 12 weeks following an
endorsement, weekly adult fiction book sales decreased by a statistically significant 2.5 percent
(p-value <0.05). The estimated effects for adult non-fiction sales in the third row are negative,
but they are not statistically significant at conventional levels. The next four columns of results
are for sales data without endorsed titles. All of the estimates show greater sales decreases,
suggesting that a Club endorsement had a business stealing effect among booksellers in the
Nielsen panel. 31
Endorsement Sales Effect by Genre
Given the large title-level sales effects, if the lack of a positive effect on aggregate sales
reflects business stealing there should be a corresponding decrease for books that would have
been purchased in the absence of the endorsement. To test for this effect, I estimate the sales
change at the genre level. I then assess whether the genres experiencing post-endorsement sales
declines were disproportionately popular during time periods without an endorsement in the
geographic areas exhibiting the largest title-level positive responses or where Winfrey herself
was most popular.
31 Since market wide BookScan data are not available until 2004, it is not possible to estimate the effect of the creation of the Club on the reading behavior of Winfrey’s followers. One possibility is that the creation of the Club caused all of her previously non-reading followers (who are also responsive to endorsements) to begin reading on a regular basis. In this case, there might be no aggregate change in book sales following any individual endorsement. This is unlikely for two reasons: First, there was no noticeable change in the annual book sales around the time period surrounding the creation of the Club (Greco, 2005). The entry of this many new readers would have had a noticeable impact on these sales. Second, it would have to be that these new readers do not continue to read books similar to Winfrey’s recommendations, but instead read books in the genre of Action, Mystery or Romances and switch to read books the Winfrey endorses.
29
The first column of Table 5 contains the genre-level endorsement sales effect for adult
fiction titles tracked by BookScan during the eight weeks following a selection. Following an
endorsement, the sales of classics rose by 3.5 percent (p-value < 0.05). In contrast, there were
statistically significant decreases for mysteries and action/adventure novels. Romances also saw
a sales decline, but the p-value of this estimate was 0.11. A composite category combining the
sales of mysteries, action novels, and romances experienced 5.1 percent lower post-endorsement
sales (p-value < 0.05).
These estimates demonstrate that while the endorsements had no effect or even decreased
overall sales, they caused a substantial shift in the types of books being purchased. To test
whether the sales decreases were caused by changes in the purchases of regular market
participants, I examine if mystery, action, and romance titles were disproportionately popular in
areas where the Club had its largest impact or where the ratings of The Oprah Winfrey Show
were highest.
Answering this question requires several additional data points. The first is a geographic
measure of genre popularity in the absence of the endorsement. BookScan provides a genre
popularity index at the designated market area (DMA) level.32 The index is obtained by dividing
the percentage of a genre’s national sales that occur in a particular DMA by the percentage of
total book sales from that DMA.33 Higher index values signify that consumers in the DMA
purchase a disproportionate amount of a respective genre.
During the third week of 2006, Winfrey endorsed Night by Elie Wiesel. The next
selection was not announced until the fourth week of 2007. This is the longest time period
32 DMAs are metropolitan area definitions that are commonly used for tracking consumer behavior. 33 For example, if the New York DMA represents 10 percent of the sales of romance novels and 10 percent of overall book sales, their index value for romance titles is 1. This suggests that consumers in New York prefer romances to the same degree that they prefer all books. If New York accounts for 20 percent of the sales of classic novels, their index value for classics is 2.
30
without an endorsement in the sample. Therefore, genre popularity index values from the middle
of this period provide the best available measure of regional book buying preferences in the
absence of the Club’s influence.
I also require data on the expected regional impact of the endorsements. I use two
potential measures of regional variation in the endorsement: television ratings of The Oprah
Winfrey Show and an index of post-endorsement changes in the sales of Club selections. Ratings
data provide information about the areas where Winfrey is more popular, while book sales data
show where the Club had the greatest impact.
Nielsen television ratings are the premier source of viewership data and are used to set
advertising rates in both broadcast and cable television programming. The data for this analysis
uses the average Nielsen ratings for The Oprah Winfrey Show during the 2006-2007 television
season. These ratings represent Nielsen’s estimate of the percentage of television households
watching each first-run episode during the four “sweeps” periods in November, February, May,
and July. Nielsen also provides data on the number of African-American and Hispanic television
households in the DMA as well as the number of men, women, and working women in television
households. For the analysis, viewership information is supplemented with county-level data
from the 2000 Census.
An index of the impact of Club endorsements on DMA level book sales can be generated
using a similar methodology as the BookScan category popularity index discussed above. This
“Club impact index” is calculated by dividing the percentage of endorsed title sales in a DMA by
the percentage of total book sales in the DMA. The ratio of this index in the eight weeks
following the announcement to the eight weeks before the announcement provides a measure of
the Club’s DMA-level impact that controls for the title’s pre-endorsement popularity. For

31
example, this ratio equals 1 if the endorsed novel was equally popular before and after its
selection. Higher values of this ratio indicate a greater endorsement impact.34, 35
The first column of Table 6 contains the estimates from an OLS model of DMA
household ratings for The Oprah Winfrey Show on a variety of demographic variables from
Nielsen and the Census. Winfrey’s syndicated daily talk show has higher ratings in DMAs with
a greater percentage of African-American television households, television households without
children under the age of 18, television households with women greater than 65 years of age, and
divorced households. The show has lower ratings in DMAs with a higher percentage of the total
population living in urban areas and married households.
A similar analysis for the Club impact index is contained in the second column of Table
6. Unlike the television ratings, the Club has a bigger sales impact in DMAs with a greater share
of the population in urban areas, working women, married households, individuals possessing a
high school degree or less, and individuals with some college education. There is no statistically
significant relationship between the percentage of African-American television households and
the Club impact index. The difference between these two sets of results demonstrates that the
Club’s impact is not driven solely by the number of Winfrey’s television viewers in the DMA.
This is likely a result of the large amount of publicity surrounding the endorsements, including
prominent in-store advertising displays and newspaper coverage.36
34 A simpler measure of the Club’s impact would be to consider the percentage increase in sales following the endorsement. However, this measure does not control for differences in the pre-endorsement popularity of the any title at the DMA level. The results of the paper using the percentage change measure are qualitatively similar but less precise than the estimates using the Club popularity index. 35 According to this index the top 10 DMAs for the sales impact were Sacramento, Fresno, Indianapolis, Des Moines, Evansville, Davenport, Tucson, Harrisburg, Toledo, and Phoenix. The bottom 10 were Burlington, Boston, Birmingham, Baton Rouge, Albany, Portland (ME), Lexington, Tri-Cities (TN/VA), Houston, and New York. 36 Despite these differences in the demographics, an unreported specification of the estimates in the column (2) of Table 6 that includes television ratings shows that, even controlling for a rich set of covariates, there is a statistically significant relationship between television ratings and the Club impact index (p-value < 0.01).
32
The final two columns of Table 6 contain estimates for the relationship between the
DMA level average genre popularity indices and measures of the Club’s expected influence.
The first of these columns contains the estimates for the relationship between both the Club
impact index and Winfrey’s television ratings on the average regional popularity of classics and
general fiction titles (i.e. the genres containing all Club fiction endorsements). The estimate
shows that, in the absence of an endorsement, classics and general fiction titles were less popular
in the DMAs experiencing the largest sales impact from a Club endorsement. There was no
statistically significant relationship between television ratings and these genres—though an
unreported regression not including the Club impact index did find such a relationship. The final
column contains the average popularity index for romance, mystery and action titles—these
genres showed the largest sales declines following an endorsement. In the absence of an
endorsement, there is a positive relationship between the Club impact index and the popularity of
these genres, suggesting that residents in DMAs with the largest endorsement responses would
otherwise purchase romance, mystery, and action titles.
Difficulty of the Endorsed Novels
In isolation, the shifting of sales between genres cannot explain the decline in post-
endorsement adult fiction sales. However, this decrease would occur if the endorsed novels took
longer to read than the books that otherwise would have been purchased. Linguistic scholars
have developed several measures of the difficulty of written text. Two examples are the
Gunning Fog and the Flesch-Kincaid indices, both of which attempt to quantify the United States

33
grade level necessary for comprehension.37 These indices measure only the complexity of the
writing and are not an analysis the intricacy of plot developments or characters. Instead, they
provide a quantitative measure of one dimension affecting the amount of time required to
complete a novel.
As part of their book digitization efforts, Amazon.com now offers readability statistics
for many books available on their website. Table 7 contains the median readability index values
and word counts for several groups of books.38 The first column contains the values for Club
endorsed books.39 The median endorsed book’s Gunning Fog Index predicts that the text should
be understandable to someone with an 8th grade education or higher. The median endorsed novel
had a Flesch-Kincaid estimated grade level of 6.5 and contained approximately 150,000 words.40
Columns (3) – (6) contain the median values for the top twenty bestselling romance,
mystery, action, and overall bestselling novels respectively. 41 The median Gunning Fog index
score for this genre was more than one grade level below the median Club selection. Bestselling
mystery novels had a median Gunning Fog grade level of 7. Titles in the action/adventure genre
were slightly more difficult than the Club selections, but these novels were approximately 20,000
words shorter. Finally, Club endorsed titles were approximately 1.5 grade levels harder than the
median overall bestseller.
37 These tests estimate the grade level necessary for understanding written text. The equation for the Gunning Fog index is: total words complex words
0.4 100total sentences words
. Complex words are those with three or more syllables that are not
proper nouns or compound words. The Fleisch-Kincaid index equation is: total words total syllables0.39 11.8 15.59
total sentences total words
.
38 Statistics were not available for every book in each category. However, in each category statistics were available for over 75 percent of titles. There does not appear to be any pattern as to which books had available statistics. 39 Statistics are available for all endorsed books in the aggregate sales data except for The Road by Cormac McCarthy, A New Earth by Ekhart Tolle, The Story of Edgar Sawtelle by David Wroblewski, Say You’re One of Them by Uwen Alkan, and Freedom by Jonathan Franzen. 40 Across all of the groups the Fleisch-Kincaid scores are consistently lower than the Gunning Fog index. Despite the lower grade level scores, the second index does follow the same pattern as the first index. 41 The categories are for the novels as of May 23, 2004. This date is the week before the selection of Anna Karenina. It was selected for illustrative purposes and results for alternate weeks provide similar readability scores.

34
These statistics show that the Club selections were longer and more difficult than the
bestselling titles in the genres that were popular among consumers likely to respond to the
endorsement. Assuming that longer and more difficult books will take more time to read, the
difference in estimated grade level combined with the genre-level sales shifts help explain the
pattern of aggregate sales declines in the main results. To explore this further, I exploit variation
in the genre-level difficulty amongst endorsed novels. Fiction Club endorsements were all either
general fiction or classic texts. The second to last column of Table 8 contains the readability
scores and word counts for classic Club selections. With a median Gunning Fog grade level of
10.93 and length of over 160,000 words, these books were considerably harder and longer than
other Club selections. For comparison, the last column contains the values for the top ten books
of all time according to a Time magazine survey of 125 authors.42 Classic club selections require
a similar grade level for comprehension as the top ten books and were approximately 30,000
words longer.
The last two columns in Table 5 allow the eight week endorsement effect in equation (3)
to vary by the classic status of the selection. The estimated sales decrease for adult fiction novels
during the eight weeks following a classic selection is large and statistically significant.
Following the endorsement of a non-classic title, there was no detectable change in aggregate
sales.43 Statistically significant declines following a classic selection were also seen individually
across the romance and action genres. The decline for mysteries was large in magnitude and has
42 This ranking is a composite top ten of the surveys of these 125 authors. The titles include, Anna Karenina by Leo Tolstoy, Madame Bovary by Gustave Flaubert, War and Peace by Leo Tolsoy, Lolita by Vladimir Nabokov, The Adventures of Huckleberry Finn by Mark Twain, Hamlet by William Shakespeare, The Great Gatsby F. Scott Fitzgerald, In Search of Lost Time by Marcel Proust, The Stories of Anton Chekhov by Anton Chekhov, and Middlemarch by George Eliot. 43 There could be some concern for the results in Table 5 that Winfrey picked three of the four classic novels during the first half of 2004. Two of these novels were picked relatively close in time and the last two weeks of the eight-week post-period overlap. Considering only the four week time period following a selection, which does not overlap for these books, produces qualitatively similar results in magnitude and precision. The estimate for this non-overlapping time period for classics selection is -0.06 (0.023) and for non-classics is 0.0015 (0.0115).

35
a p-value of 0.114. In all categories except for one, the estimated sales declines are larger in
magnitude following a classic endorsement. The final row contains estimates for a composite
category of mystery, action and romance sales. The estimated effect of a classic novel
endorsement is nearly three times larger than for a non-classic. Taken together, these estimates
suggest that the difficulty of the endorsed titles contributes to the aggregate sales decline.44
Robustness Checks
Since publishers have no influence over the selection process, the use of Club
endorsements limits concern of title-specific endogeneity related to past sales trends or other
factors. However, there could be a lingering concern that the timing of these endorsements
corresponds to periods of generalized decreased demand in the publishing industry. If this were
the case, then similar effects should be seen for the endorsement effect using juvenile fiction
sales, which are correlated with adult book sales but were not treated by any club endorsements.
The correlation coefficient for the weekly sales of these two categories is 0.7329. If the timing
of the announcement of Club endorsements matches particular events or cycles in the publishing
industry, a specification of equation (3) using data from juvenile fiction sales should follow a
similar pattern. However, there is no statistically significant relationship between endorsements
and sales in juvenile fiction.45 The absence of detectable effect is not driven by precision—the
effects are small in magnitude and lack a consistent pattern of signs.
44 There could be a concern that the larger sales declines following a classic selection are not driven by differential difficulty but instead by these books having large title-level sales responses to the endorsement. Instead, unreported results of equation (1) for Club endorsement effects by classics status show fewer consumers purchased classics at BookScan reporting outlets following the endorsement. However, it is important to remember that there could be differential acquisition of endorsed classics since many people may have already owned these well-known and established novels or they may be differentially better stocked by public libraries. It is clear that a larger title-level sales effect for classics cannot explain the pattern of results in the last two columns of Table 5. 45 The estimated effects in the juvenile fiction category in the 1, 4, 8, and 12 weeks following the endorsements are -0.004 (0.015), -0.028 (0.022), 0.004 (0.026), and -0.0002 (0.024) respectively.

36
One might also be concerned about the ability to detect market expanding effects in any
context. That is, it is useful to consider whether all shocks to publishing simply appear to shift
the purchases of regular market participants using the methods described above. To address this
concern, I examine the release of novels in the Harry Potter series by J.K. Rowling, a publishing
event commonly believed to have increased aggregate sales. This seven book series was a
publishing sensation and each of the titles sold millions of copies. The last two novels of the
series, Harry Potter and the Half Blood Prince and Harry Potter and the Deathly Hallows, were
published after 2004—thus, their sales data are available. Table 8 contains a specification of
equation (3) using indicator variables for the weeks following the release of the two novels. The
first four columns of estimates contain the results using data on all book sales, including other
titles written by J.K. Rowling. The release of a Harry Potter novel increases total book sales and
juvenile fiction sales by a large and statistically significant amount. For example, in the week in
which a Potter novel is released, there was an approximately 31.7 percent increase in all books
sold than would have been expected in the absence of the release. Interestingly, despite the
popularity of this title among both adults and juveniles, the increase in overall sales was not
correlated with statistically significant decreased adult fiction sales
These results suggest that Harry Potter novels are not stealing business from adult fiction
titles. Of course, the stolen sales could still have come from other titles within the juvenile
fiction category. The last four columns of Table 8 contain estimates using sales data that contain
no J.K. Rowling titles.46 Unlike the Club endorsement effect, even the data without the J.K.
Rowling titles shows no statistically significant decrease in the sales juvenile fiction titles.
Moreover, during the first week following a release there was a statistically significant increase
46 The excluded titles were the seven “Harry Potter” novels, as well as the following three Potter-related works: Fantastic Beasts and Where to Find Them, Quidditch Through the Ages, and The Tales of Beedle The Bard.

37
of approximately 8.4 percent in juvenile fiction sales (p-value < 0.001)—perhaps due to higher
traffic from bookstores. This magnitude suggests that approximately 8 percent of individuals
purchasing the Potter novel also buy an additional juvenile fiction title.47 The 4-, 8-, and 12-
week post-endorsement estimates are still positive and large in magnitude demonstrating that the
increased sales of non-Rowling titles in the week after the release are not simply shifted sales.
These robustness checks demonstrate two important facts. First, it does not appear that
the Club endorsements are systematically timed to cyclical sales changes in the publishing
industry. Second, all shocks to the publishing industry do not simply shift the purchases of
regular market participants—an event receiving a large amount of general popular attention can
attract large numbers of consumers into this market. In addition, the methods used to analyze the
Club endorsement effect are able to detect increased aggregate sales caused by large shocks to
the publishing industry.
X. Conclusion
Oprah Winfrey’s Book Club increased sales for endorsed titles and other books by
endorsed authors. Despite the popular belief that the Club expanded the population of
Americans who read regularly, I find no evidence that these endorsements attracted individuals
into the book market. Following an endorsement, there is a reduction in the aggregate sales of
adult fiction—the category containing the majority of Club endorsements. I provide evidence
suggesting that Winfrey endorsed harder books than would have been otherwise purchased.
Given that the cost of a book is a combination of the retail price and the time necessary to
47 In unreported genre level results, this increase was largest across the Science Fiction and Fantasy, Animals, and General Juvenile Fiction genres.

38
complete the text, the post-endorsement sales decrease can be seen as resulting from the shift of
purchases towards more expensive products.
The estimated sales effect provides evidence that the benefits of celebrity endorsements
primarily come from business stealing. This confirms the earlier suggestive evidence from other
endorsements (Mathur et al., 1997; Knittel and Stango, 2011). If endorsements drive business
stealing, firms’ profits may be directly threatened by competitors’ advertising efforts. Therefore,
these estimates can be useful for designing profit maximizing strategies.
The results above also provide strong evidence of spillover demand from endorsements.
Following an endorsement, non-endorsed titles by endorsed authors experience an immediate
sales increase that grows over the next three months. This continual growth in the spillover
demand effect provides suggestive evidence of a mechanism through which advertising impacts
consumer behavior. While the main endorsement effect could be a result of either persuasive or
informative advertising, the post-endorsement growth in sales of non-endorsed titles suggests
that endorsements provide consumers with information about product quality as discussed in
Stigler (1961). Furthermore, the dynamics of the spillover demand estimates suggest that while
endorsements in the publishing sector are primarily business stealing, they are not Marshall’s
socially wasteful combative advertising. These endorsements improve the quality of the
product-consumer match for some participants in an experience good market.
Previous research into spillover demand has been primarily theoretical. Choi (1998)
developed a model of brand equity that showed how firms can use a positive reputation among
consumers in one market to solve information asymmetries in other markets. Similarly, Cabral
(2000) described a “feedback reputation effect” where the introduction of a high quality new
product increases the willingness to pay for the firm’s original product and signals overall
39
quality. To my knowledge, only one other empirical study has exploited exogenous variation to
estimate spillover demand across products, and this was in the context of product entry as
opposed to advertising (Hendricks and Sorensen, 2009). The results of the current paper show
that the benefits of firm advertising efforts extend well beyond the advertised product. This
provides a greater incentive for firms with high quality product lines to develop advertising
programs, especially those under one common brand as discussed in Cabral (2000). These
expenditures can be seen as investments in the brand equity discussed in Choi (1998).
Finally, the estimates cast doubt on the ability of national book clubs or other broad
literacy efforts to increase the number of adult Americans who read. This was one of the most, if
not the most, highly publicized reading programs in history and was widely believed to have
increased the number of Americans reading. However, the results of this paper provide
compelling evidence against this contention. Of course, this does not mean that the
endorsements did not have a meaningful impact on consumer behavior. The endorsements
increased the difficulty of purchased books. Increasing the number of Americans reading on a
regular basis is a laudable goal, but these estimates suggest that large reading programs might be
more successful if they encourage existing readers to pursue more challenging books.
References Agrawal, Jagdish and Wagner A. Kamakura. 1995. “The Economic Worth of Celebrity Endorsers: An Event Study Analysis,” The Journal of Marketing, 59(3): 56-62 Balachander, Subramanian and Sanjoy Ghose. 2003. “Reciprocal Spillover Effects: A Strategic Benefit of Brand Extensions,” The Journal of Marketing, 67(1): 4-13. Becker, Gary, and Kevin Murphy. 1993. “A Simple Theory of Advertising as a Good or Bad,” Quarterly Journal of Economics, 108(4): 941-964. Berger, Jonah, Alan Sorensen, and Scott Rasmussen. 2010. “Positive Effects of Negative Publicity: When Negative Reviews Increase Sales,” Journal of Marketing Science, 29(5): 815-27. Book Industry Study Group. 2001. 2001 Consumer Research Study of Book Purchasing, New York: Book Industry Study Group. Bosman, Julie. “Serious Book to Peddle? Don’t Laugh, Try a Comedy Show,” New York Times, Feb 27, 2007. Bowkers. “New Book Titles and Editions 2002-2010,” available at www.bowkerinfo.com/pubtrack/AnnualBookProduction2010/ISBN_Output_2002-2010.pdf Bowker. “US Production Reaches New High of 195,000 Titles in 2004; Fiction Soars,” Press Release, May 24, 2005. Bowman, Jo. “Wishing on a Star,” CNBC Business, July 2010.
Bronnenberg, Bart, Jean-Pierre Dube, and Matthew Gentzkow. 2011. “The Evolution of Brand Preferences: Evidence from Consumer Migration,” forthcoming American Economic Review. Butler, Richard, Benjamin Cowan, and Sebastion Nilssson. 2005. “From obscurity to bestseller: Examining the impact of Oprah’s Book Club selections,” Publishing Research Quarterly, 20(4): 23-34. Cabral, Luis. 2000. “Stretching Firm and Brand Reputation,” The RAND Journal of Economics, 31(4): 658-73. Carmi, Eyal, Gal Oestreicher-Singer, and Arun Subdararajan. 2009. “Spreading the Oprah Effect: The Diffusion of Demand Shocks in a Recommendation Network,” ICIS 2009 Proceedings. Choi, Jay Pil. 1998. “Brand Extension as Information Leverage,” Review of Economic Studies, 65(4): 655-669. Deighton, John, Caroline Henderson, and Scott Neslin. 1994. “The Effects of Advertising on Brand Switching and Repeat Purchasing,” Journal of Marketing Research, 31(1): 28-43.

41
Elberse, Anita and Jeroen Verleun. 2011. “The Economic Value of Celebrity Endorsements,” forthcoming. Journal of Advertising Research. Feldman, Gayle. “Making Book on Oprah,” New York Times, Feb 2, 1997.
Garthwaite, Craig and Timothy Moore. 2011. “The Role of Celebrity Endorsements in Politics: Oprah, Obama, and the 2008 Democratic Primary,” forthcoming Journal of Law, Economics, and Organizations. Goldman, Lea. “The World’s Most Powerful Celebrities,” Forbes, Jun 16, 2007.
Greco, Albert. The Book Publishing Industry, 2nd Edition. Boston: Allyn and Bacon.
Harrow, Susan. 2002. “The Ultimate Guide to Getting Booked on Oprah: 10 Steps to Becoming a Guest on the World's Top Talk Show,” available at www.prsecrets.com. Hendicks, Ken and Alan Sorensen. 2009. “Information and the Skewness of Music Sales,” Journal of Political Economy, 117(2): 324-369. IBISWorld. 2010. Book Publishing in the US: Market Research Report.
Kirkpatrick, David. “Oprah Will Curtail ‘Book Club’ Picks, And Authors Weep,” New York Times, Apr 6, 2002. Kniffel, Leonard. “Reading for Life: Oprah Winfrey,”American Libraries Magazine, May, 2011. Knittel, Christopher and Victor Stango. 2011. “Celebrity Endorsements, Firm Value, and Reputation Risk: Evidence from the Tiger Woods Scandal,” working paper. Krushnamurthi, Lakshman, and S.P. Raj. 1985. “The Effect of Advertising on Consumer Price Sensitivity,” Journal of Marketing Research, 22(2): 119-29. Lacayo, Richard and Andrea Sachs. “Media: Oprah Turns a Page,” TIME, Apr 15, 2002. Lamolinara, Guy. 1997. “LC at the ALA. Henriette Avram Receives Honorary Life Membership,” Library of Congress Information Bulletin, 56(13). Little, John C. 1979. “Aggregate Advertising Models: The State of the Art,” Operations Research, 27 (July-August), 629-65. Maryles, Daisy. “PW: Bestsellers of 1999—Hardcover: So Far, Little Has Changed,” Publishers Weekly, Apr 10, 2000. Maryles, Daisy, “Bestsellers by the Numbers,” Publishers Weekly, Jan 9, 2006. Marshall, Alfred(1919), Industry and Trade, London: MacMillan and Co..

42
Mathur, Lynette, Ike Mathur, and Nanda Rangan. 1997. “The Wealth Effects Associated with a Celebrity Endorser: The Michael Jordan Phenomenon,” Journal of Advertising Research, 37(3): 67-73. McClure, Samuel, Jian Li, Damon Tomlin, Kim Cypert, Latane Montague, P. Read Montague. 2004. “Neural Correlates of Behavioral Preference for Culturally Familiar Drinks,” Neuron, 44(2): 379-387. MEC Global. 2009. MEC Celebrity Endorsement SENSOR. Milliot, Jim ed. 2009 Book Consumer Annual Review. New Providence, NJ: Bowker.
Minzesheimer, Bob. “How the ‘Oprah Effect’ Changed Publishing,” USA Today, May 22, 2011.
National Endowment for the Arts, 2009
Nelson, Phillip. 1970. “Information and Consumer Behavior,” Journal of Political Economy, 78(2): 311-329. Nelson, Phillip. 1974. “Advertising as Information,” Journal of Political Economy, 82(4): 729-754. Nielsen. 2011. United States Consumer Market. Ritzholz, Barry. “The Power of the Daily Show,” The Big Picture Blog, Apr 23, 2009.
Schlenker, Wolfram and Sophia Villas-Boas. 2009. “Consumer and market responses to mad-cow disease,” American Agricultural Economics Association, 91(4): 1140-1152. Sorensen, Alan. 2007. “Bestseller Lists and Product Variety,” The Journal of Industrial Economics, 55(4): 715-738. Stigler, George. 1961. “The Economics of Information,” Journal of Political Economy, 69(3): 213-225. Stigler, George and Gary Becker. 1977. “De Gustibus Non Est Disputandum,” American Economic Review, 67(2): 276-90. Townsend, Matt. “Riding the Oprah Wave, Ready or Not,” Business Week, May 19, 2011.
Vakratsas, Demetrios, and Tim Ambler. 1999. “How Advertising Works: What Do We Really Know?,” The Journal of Marketing, 63(1): 26-43. Verhovek, Sam. “Talk of the Town: Burgers v. Oprah,” New York Times, Jan 21, 1998 Yermack, David. 2011. “The Michelle Markup: The First Lady’s Impact on Stock Prices of Fashion Companies,” mimeo New York University.

43
Figure 1 Effect of Club Endorsements on Share of Endorsed Titles
Figure 2 Effect of Oprah Club Endorsements on Sales of Non-Endorsed Titles by Endorsed Authors
‐1
0
1
2
3
4
5
6
‐8 ‐7 ‐6 ‐5 ‐4 ‐3 ‐2 ‐1 0 1 2 3 4 5 6 7 8 9 10 11 12 13 14 15 16 17 18 19 20 21 22 23 24 25 26
Coefficient on the Logarithm of Sales
Weeks Since Endorsement
‐0.4
‐0.2
0
0.2
0.4
0.6
0.8
‐8 ‐7 ‐6 ‐5 ‐4 ‐3 ‐2 ‐1 0 1 2 3 4 5 6 7 8 9 10 11 12 13 14 15 16 17 18 19 20 21 22 23 24 25 26
Coefficient on the Logarithm of Sales
Weeks Since Endorsement
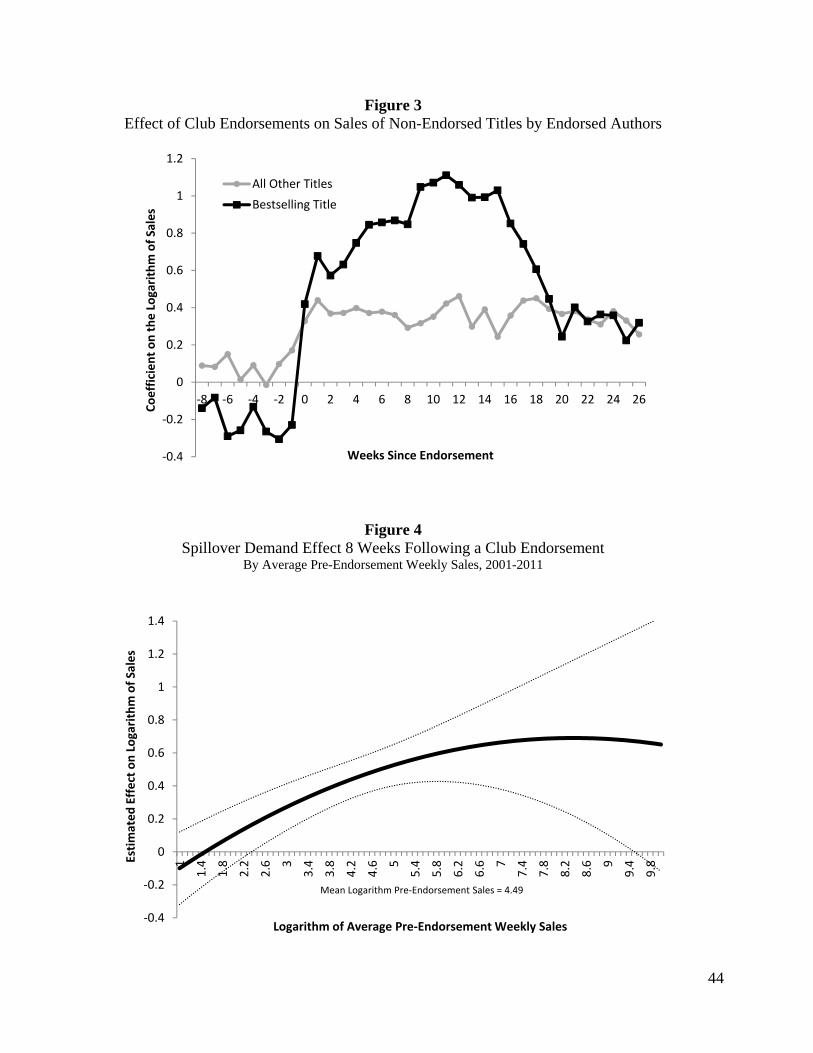
44
Figure 3 Effect of Club Endorsements on Sales of Non-Endorsed Titles by Endorsed Authors
Figure 4 Spillover Demand Effect 8 Weeks Following a Club Endorsement
By Average Pre-Endorsement Weekly Sales, 2001-2011
‐0.4
‐0.2
0
0.2
0.4
0.6
0.8
1
1.2
‐8 ‐6 ‐4 ‐2 0 2 4 6 8 10 12 14 16 18 20 22 24 26
Coefficient on the Logarithm of Sales
Weeks Since Endorsement
All Other Titles
Bestselling Title
‐0.4
‐0.2
0
0.2
0.4
0.6
0.8
1
1.2
1.4
1
1.4
1.8
2.2
2.6 3
3.4
3.8
4.2
4.6 5
5.4
5.8
6.2
6.6 7
7.4
7.8
8.2
8.6 9
9.4
9.8
Estimated Effect on Logarithm of Sales
Logarithm of Average Pre‐Endorsement Weekly Sales
Mean Logarithm Pre‐Endorsement Sales = 4.49
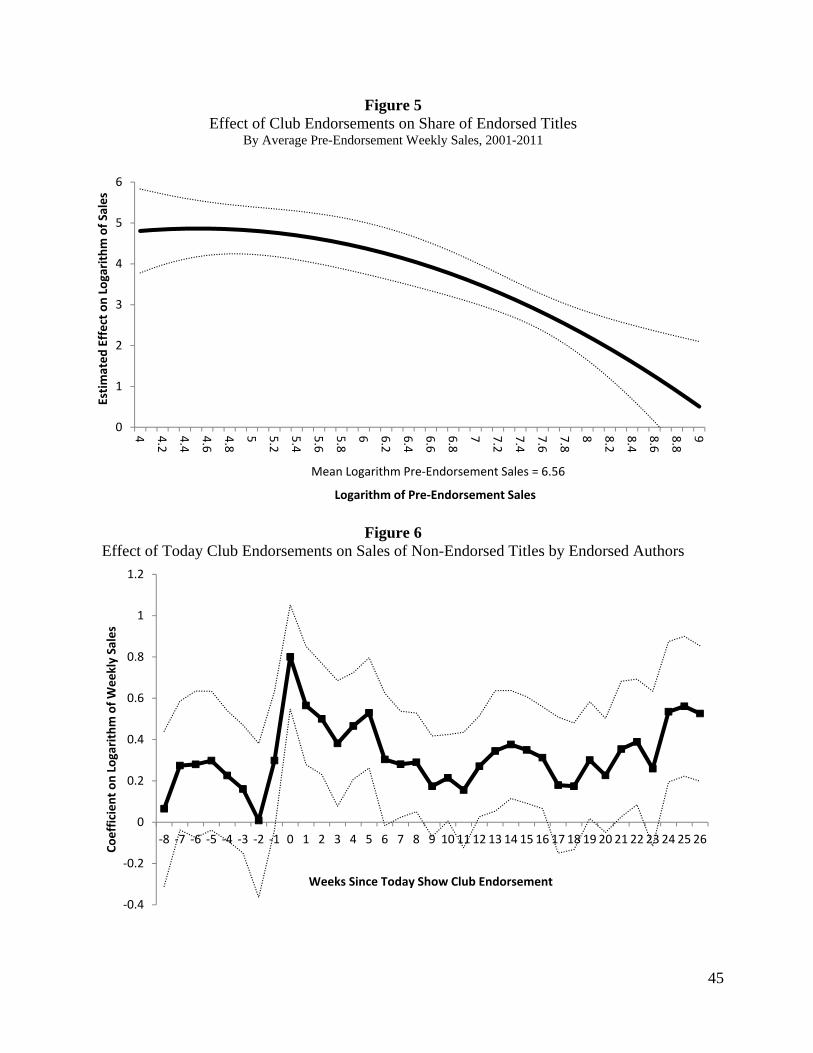
45
Figure 5 Effect of Club Endorsements on Share of Endorsed Titles
By Average Pre-Endorsement Weekly Sales, 2001-2011
Figure 6 Effect of Today Club Endorsements on Sales of Non-Endorsed Titles by Endorsed Authors
0
1
2
3
4
5
6
4 4.2
4.4
4.6
4.8
5 5.2
5.4
5.6
5.8
6 6.2
6.4
6.6
6.8
7 7.2
7.4
7.6
7.8
8 8.2
8.4
8.6
8.8
9Estimated Effect on Logarithm of Sales
Logarithm of Pre‐Endorsement Sales
Mean Logarithm Pre‐Endorsement Sales = 6.56
‐0.4
‐0.2
0
0.2
0.4
0.6
0.8
1
1.2
‐8 ‐7 ‐6 ‐5 ‐4 ‐3 ‐2 ‐1 0 1 2 3 4 5 6 7 8 9 10 11 12 13 14 15 16 17 18 19 20 21 22 23 24 25 26
Coefficient on Logarithm of Weekly Sales
Weeks Since Today Show Club Endorsement

46
Table 1 Books Included In Oprah Winfrey’s Book Club
2001-2010 Selection
Year Selection Week
of the Year Publication
Year Title Author Number of Pages Genre Price48
2001 10 1999 Icy Sparks Gwyn Hyman Rubio 336 General Fiction $ 15.00
2001 20 1999 Stolen Lives: Twenty Years in a Desert Jail Malika Oufkir 304 Memoir $ 14.99
2001 25 2001 Cane River Lalita Tademy 543 General Fiction $ 24.95
2001 39 2001 The Corrections Jonathan Franzen 567 General Fiction $ 26.00
2002 4 1997 Fall on Your Knees Ann-Marie MacDonald 512 General Fiction $ 16.00
2002 14 1973 Sula Toni Morrison 192 General Fiction $ 24.95
2003 25 1952 East of Eden John Steinbeck 601 Classics $ 18.00
2003 40 1948 Cry, The Beloved Country Alan Paton 316 Classics $ 15.00
2004 4 1970 One Hundred Years of Solitude Gabriel García Márquez 464 General Fiction $ 14.00
2004 17 1940 The Heart Is a Lonely Hunter Carson McCullers 368 Classics $ 13.95
2004 23 1877 Anna Karenina Leo Tolstoy 864 Classics $ 17.00
2004 38 1931 The Good Earth Pearl S. Buck 368 Classics $ 15.00
2005 22 N/A The Sound and the Fury, As I Lay Dying, Light in August William Faulkner 1,126 General Fiction $ 29.95
2005 35 2003 A Million Little Pieces James Frey 448 Memoir $ 15.95
2006 3 1955 Night Elie Wiesel 120 Memoir $ 9.95
2007 4 2000 The Measure of a Man: A Spiritual Autobiography Sidney Poitier 272 Memoir $ 14.99
2007 13 2006 The Road Cormac McCarthy 287 General Fiction $ 14.95
2007 23 2002 Middlesex Jeffrey Eugenides 544 General Fiction $ 15.00
2007 40 1988 Love in the Time of Cholera Gabriel García Márquez 368 General Fiction $ 15.00
2007 44 1989 The Pillars of the Earth Ken Follett 973 General Fiction $ 24.95
2008 5 2005 A New Earth Eckhart Tolle 336 General Nonfiction $ 14.00
2008 38 2008 The Story of Edgar Sawtelle David Wroblewski 576 General Fiction $ 25.95
2009 38 2008 Say You're One of Them Uwem Akpan 384 General Fiction $ 14.99
2010 37 2010 Freedom Jonathan Franzen 576 General Fiction $ 28.00
2010 49 N/A Great Expectations, A Tale of Two Cities Charles Dickens 848 Classics $ 20.00
48 This price is for the “Oprah Edition” ISBN.

47
Table 2 Effect of Club Endorsement Announcement on Selected Books
Nielsen BookScan Data, 2001-2011 Dependent Variable One Week Four Weeks Eight Weeks Twelve Weeks
Oprah Winfrey Book Club Oprah Books Only 3.885***
(0.194)
3.957*** (0.248)
3.739*** (0.274)
3.569*** (0.284)
Mean Weekly Pre-Sales 1,865 1,865 1,865 1,865 Today Show Book Club
Today Show Books 2.664*** (0.3699)
2.364*** (0.4115)
2.021*** (0.4178)
1.76** (0.4116)
Mean Weekly Pre-Sales 381 381 381 381
Entries in the table are the estimated coefficients (standard errors) from a fixed effects regression on log weekly sales of books that were endorsed by Winfrey’s book club. The estimates are for an indicator variable identifying a specified number of weeks following the endorsement announcement. Each cell is an estimate from a different specification. For example, the estimate in the first row of the first column provides the estimated effect during the one week period after an endorsement, while the estimate in the second column is the estimated weekly increase in sales during the four weeks after Oprah announces a book. Only books that were at some point endorsed are included in the data, and therefore the sale of books in the time periods when they are not considered an endorsed tittle control for the time path of sales in the absence of the endorsement. Unreported covariates include week of the year and calendar year dummy variables. Standard errors are clustered at the book level.
Table 3 Effect of Club Endorsement on Other Books by Endorsed Authors
Nielsen BookScan Data, 2001-2011 Dependent Variable One Week Four Weeks Eight Weeks Twelve Weeks
All Unendorsed Titles by Endorsed Author Ln Weekly Sales 0.305***
(0.08) 0.374*** (0.0732)
0.3984*** (0.0669)
0.4154*** (0.0682)
Most Popular Pre-Endorsed Title by Endorsed Author
Ln Weekly Sales
0.3639 (0.2549)
0.5315** (0.2449)
0.6668** (0.2268)
0.7965** (0.2357)
All Unendorsed Titles by Today Club Endorsed Author
Ln Weekly Sales 0.7139*** (0.1134)
0.484*** (0.108)
0.4102*** (0.1041)
0.33** (0.098)
Entries in the table are the estimated coefficients from a fixed effects regression on log weekly sales of books written by authors that were endorsed by Winfrey’s book club except for the title that was actually endorsed. The estimates are for an indicator variable identifying a specified number of weeks following the endorsement announcement. Each cell is an estimate from a different specification. For example, the estimate in the first row of the first column provides the estimated effect during the one week period after an endorsement, while the estimate in the second column is the estimated weekly increase in sales during the four weeks after the endorsement. The second row of results is from data containing only for the title (other than the endorsed title) that had the highest average weekly sales prior to the announcement date. Only books written by authors that were at some endorsed are included in the data, and therefore the sale of books in the time period when their authors is not considered an Oprah selection control for the time path of sales in the absence of the endorsement. Unreported covariates include week of the year and calendar year dummy variables. Standard errors are clustered at the book level.
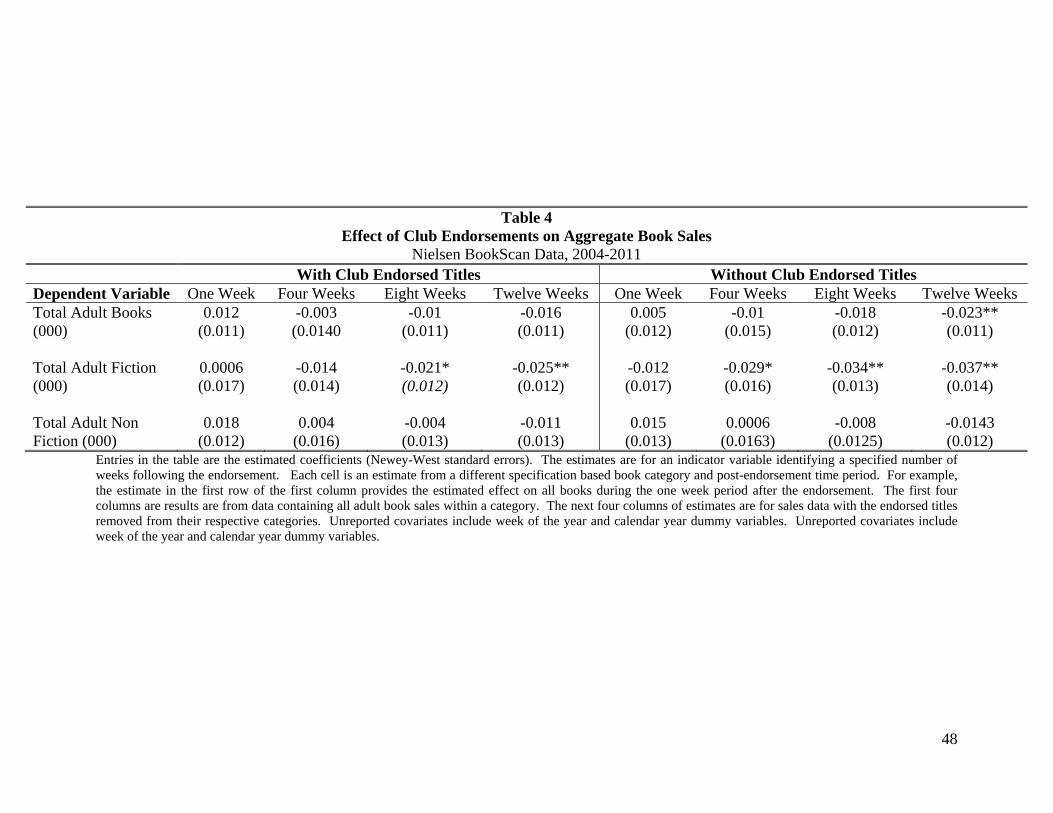
48
Table 4 Effect of Club Endorsements on Aggregate Book Sales
Nielsen BookScan Data, 2004-2011 With Club Endorsed Titles Without Club Endorsed Titles Dependent Variable One Week Four Weeks Eight Weeks Twelve Weeks One Week Four Weeks Eight Weeks Twelve Weeks Total Adult Books (000)
0.012 (0.011)
-0.003 (0.0140
-0.01 (0.011)
-0.016 (0.011)
0.005 (0.012)
-0.01 (0.015)
-0.018 (0.012)
-0.023** (0.011)
Total Adult Fiction (000)
0.0006 (0.017)
-0.014 (0.014)
-0.021* (0.012)
-0.025** (0.012)
-0.012 (0.017)
-0.029* (0.016)
-0.034** (0.013)
-0.037** (0.014)
Total Adult Non Fiction (000)
0.018 (0.012)
0.004 (0.016)
-0.004 (0.013)
-0.011 (0.013)
0.015 (0.013)
0.0006 (0.0163)
-0.008 (0.0125)
-0.0143 (0.012)
Entries in the table are the estimated coefficients (Newey-West standard errors). The estimates are for an indicator variable identifying a specified number of weeks following the endorsement. Each cell is an estimate from a different specification based book category and post-endorsement time period. For example, the estimate in the first row of the first column provides the estimated effect on all books during the one week period after the endorsement. The first four columns are results are from data containing all adult book sales within a category. The next four columns of estimates are for sales data with the endorsed titles removed from their respective categories. Unreported covariates include week of the year and calendar year dummy variables. Unreported covariates include week of the year and calendar year dummy variables.
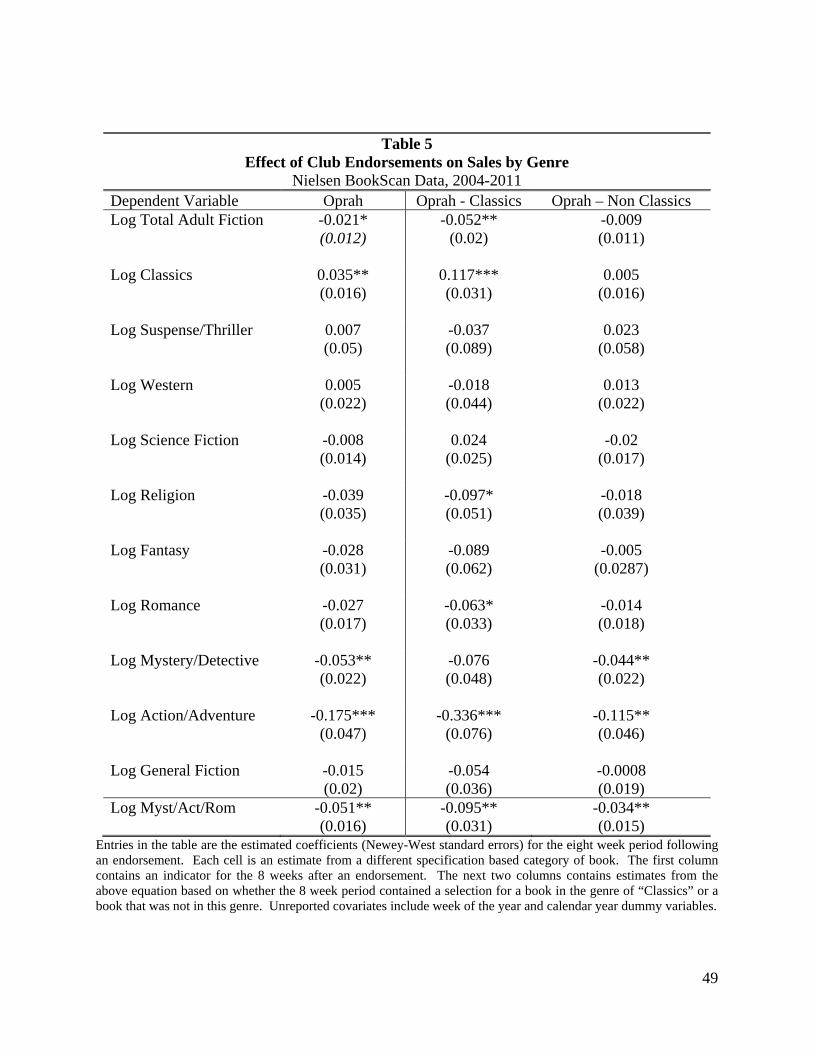
49
Table 5 Effect of Club Endorsements on Sales by Genre
Nielsen BookScan Data, 2004-2011 Dependent Variable Oprah Oprah - Classics Oprah – Non Classics Log Total Adult Fiction -0.021*
(0.012)
-0.052** (0.02)
-0.009 (0.011)
Log Classics 0.035** (0.016)
0.117*** (0.031)
0.005 (0.016)
Log Suspense/Thriller 0.007 (0.05)
-0.037 (0.089)
0.023 (0.058)
Log Western 0.005 (0.022)
-0.018 (0.044)
0.013 (0.022)
Log Science Fiction -0.008 (0.014)
0.024 (0.025)
-0.02 (0.017)
Log Religion -0.039 (0.035)
-0.097* (0.051)
-0.018 (0.039)
Log Fantasy -0.028 (0.031)
-0.089 (0.062)
-0.005 (0.0287)
Log Romance -0.027 (0.017)
-0.063* (0.033)
-0.014 (0.018)
Log Mystery/Detective -0.053** (0.022)
-0.076 (0.048)
-0.044** (0.022)
Log Action/Adventure -0.175*** (0.047)
-0.336*** (0.076)
-0.115** (0.046)
Log General Fiction -0.015 (0.02)
-0.054 (0.036)
-0.0008 (0.019)
Log Myst/Act/Rom -0.051** (0.016)
-0.095** (0.031)
-0.034** (0.015)
Entries in the table are the estimated coefficients (Newey-West standard errors) for the eight week period following an endorsement. Each cell is an estimate from a different specification based category of book. The first column contains an indicator for the 8 weeks after an endorsement. The next two columns contains estimates from the above equation based on whether the 8 week period contained a selection for a book in the genre of “Classics” or a book that was not in this genre. Unreported covariates include week of the year and calendar year dummy variables.

50
Table 6 Relationship Between Indicators of Winfrey’s Impact and DMA Level Demographics
2006-2007 TV Ratings Club Index Classics and
General Fiction Index
Mystery, Romance, and Action Index
Club Impact Index
-0.217*** (0.05)
0.079*** (0.02)
Household Rating
-0.004 (0.01)
-0.001 (0.00)
Black 9.179** (3.41)
-0.373 (0.44)
0.271* (0.16)
0.238** (0.07)
Hispanic -4.255 (5.11)
-0.757 (0.47)
-0.068 (0.17)
0.206** (0.08)
Urban -6.246** (2.53)
0.729** (0.35)
0.033 (0.13)
0.061 (0.06)
Male 50.714 (55.97)
-1.430 (8.12)
-6.311** (2.62)
4.100*** (1.03)
No Children < 18 years
62.44*** (16.31)
-0.620 (2.58)
1.876* (1.00)
-0.038 (0.58)
Working Women -9.879 (9.98)
2.477* (1.48)
-0.615 (0.46)
-0.077 (0.24)
Women > 65 years 87.352** (32.35)
2.569 (4.84)
2.572 (1.63)
1.048 (0.72)
Married -25.655* (14.79)
4.432** (2.12)
-0.179 (0.74)
0.073 (0.31)
Divorced 40.146* (21.38)
4.033 (2.90)
-0.181 (0.91)
0.902* (0.47)
HS Graduate -5.806 (7.01)
3.095** (1.06)
-1.067** (0.39)
0.377** (0.15)
Some College -12.941 (10.96)
4.380** (1.79)
-1.428** (0.55)
0.335 (0.25)
N 97 97 97 97 Mean Dep. Var. 6.65 1.17 0.941 1.004
Entries in the table represent the OLS coefficients (standard errors). Unreported covariates include the statistically insignificant coefficients for the percentage in poverty, unemployed and widowed. Estimates are weighted using the number of households in the DMA.

51
Table 7 Readability Statistics for Book Club Books and Bestselling Titles in Other Genres
All Oprah Book Club Titles
Romance
Mystery
Action
General Fiction
Overall Bestsellers
Oprah "Classics" Selections
Top Ten of All Time
Gunning Fog Index 8.4 7.35 7 8.7 7.6 7 10.93 10.95 Flesch-Kincaid 6.5 5.3 5.1 6.5 5.8 5.6 8.55 8.6 # of Words 149,523 96,512.5 106,619 128,263 106,895 106,619 161,277.5 132,998
Entries in the tables represent the median values as reported on Amazon.com. For column (2) – (5) the categories represent the top 20 bestselling titles in each category as reported by Nielsen BookScan on May 24, 2004. Column (1) contains the estimates for all Oprah Book Club titles selected between 2001 and 2011 that had data available on Amazon.com. Column (7) contains the results for only those selected novels that are in the “classics” genre. Column (8) contains the median values for books declared the top ten of all time by a Time magazine survey of 125 authors.
Table 8 Effect of Harry Book Title Release on Aggregate Book Sales
Nielsen BookScan Data, 2004-2011 With JK Rowling Titles Without JK Rowling Titles Dependent Variable One Week Four Weeks Eight Weeks Twelve Weeks One Week Four Weeks Eight Weeks Twelve Weeks Total Sales (000) 0.317***
(0.015)
0.114** (0.039)
0.061* (0.0320
0.043 (0.027)
0.032 (0.021)
-0.006 (0.016)
-0.004 (0.015)
-0.002 (0.017)
Total Juvenile Fiction (000)
1.062*** (0.055)
0.489*** (0.1150
0.282** (0.103)
0.205** (0.079)
0.084*** (0.0242)
0.022 (0.027)
0.025 (0.022)
0.027 (0.02)
Total Adult Fiction (000)
0.016 (0.021)
-0.018 (0.018)
-0.015 (0.017)
-0.017 (0.019)
Entries in the table are the estimated coefficients (Newey-West standard errors). The estimates are for an indicator variable identifying a specified number of weeks following the release of a Harry Potter novel. Each cell is an estimate from a different specification based category of book and the length of time after J.K. Rowling releases a novel. For example, the estimate in the first row of the first column provides the estimated effect on all books during the one week period after a new “Harry Potter” novel was released. The first four columns of results contain the results with all book sales. The next four columns of estimates are from data where the sales for the seven “Harry Potter” novels are removed from the “Total Juvenile Fiction” and the “Total Sales” categories. The results for Total Adult Fiction are the unaffected by the removal of the “Harry Potter” novels. Unreported covariates include week of the year and calendar year dummy variables.
Top Related