


Languages
Pages
Legal


Yamaha CorporationAnalyst and Investor Briefing
on the Fiscal Year Ended March 31, 2013 (FY2013.3)
May 1, 2013
2
Overview of Performance in FY2013.3Overview of Performance in FY2013.3
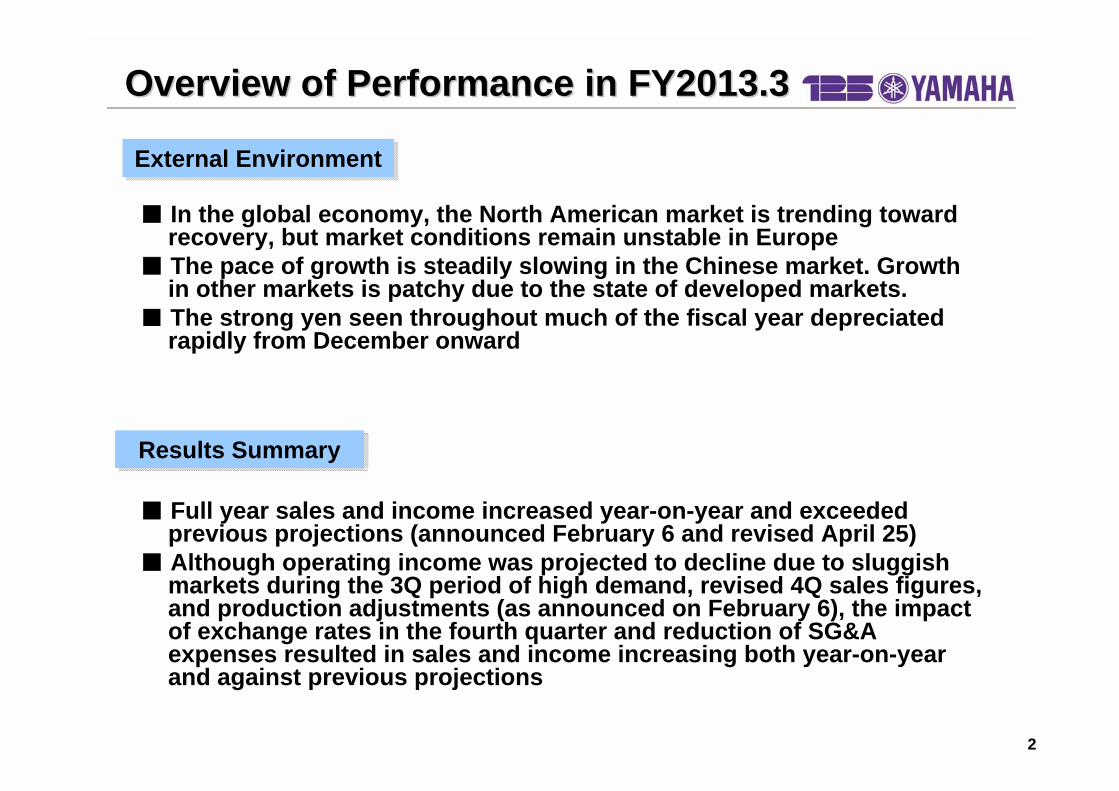
■ Full year sales and income increased year-on-year and exceeded previous projections (announced February 6 and revised April 25)
■ Although operating income was projected to decline due to sluggish markets during the 3Q period of high demand, revised 4Q sales figures, and production adjustments (as announced on February 6), the impact of exchange rates in the fourth quarter and reduction of SG&A expenses resulted in sales and income increasing both year-on-year and against previous projections
External EnvironmentExternal Environment
Results SummaryResults Summary
■ In the global economy, the North American market is trending toward recovery, but market conditions remain unstable in Europe
■ The pace of growth is steadily slowing in the Chinese market. Growth in other markets is patchy due to the state of developed markets.
■ The strong yen seen throughout much of the fiscal year depreciated rapidly from December onward
3
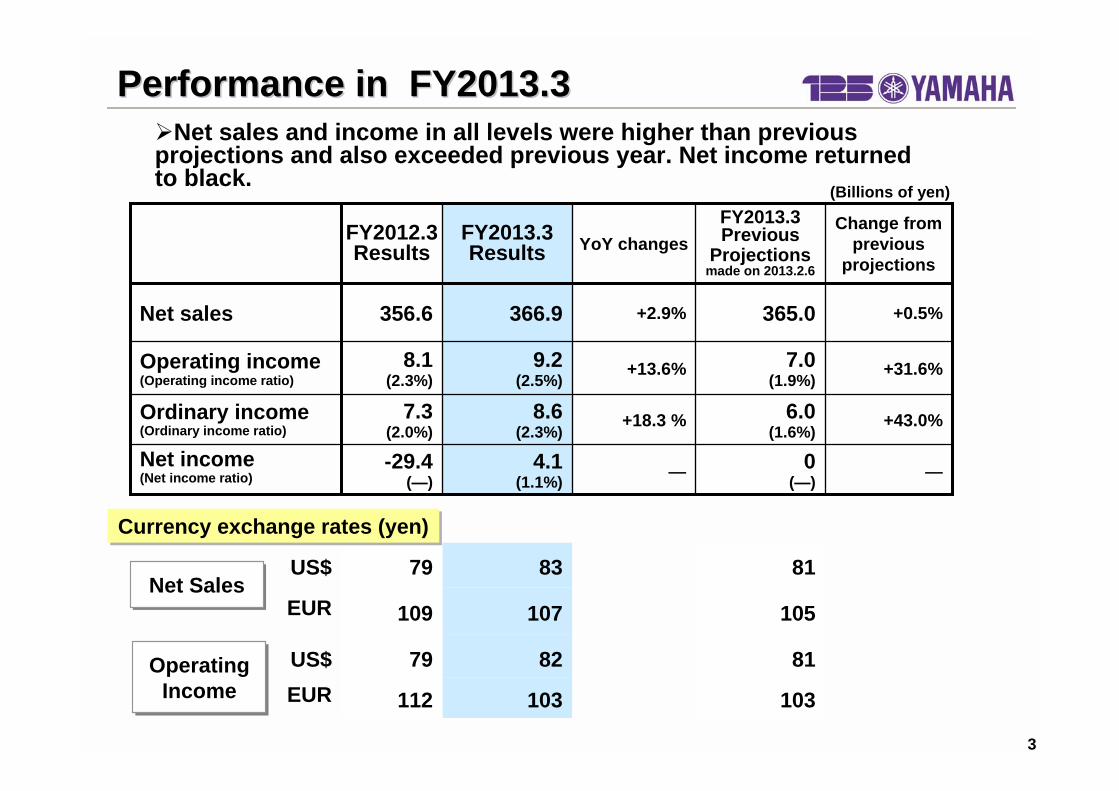
(Billions of yen)
Net sales and income in all levels were higher than previous projections and also exceeded previous year. Net income returnedto black.
103103112EUR818279US$
105107109EUR
818379US$
―0
(―)―4.1
(1.1%)-29.4
(―)Net income(Net income ratio)
+43.0%6.0 (1.6%)
+18.3 %8.6 (2.3%)
7.3(2.0%)
Ordinary income(Ordinary income ratio)
+31.6%7.0(1.9%)
+13.6%9.2(2.5%)
8.1(2.3%)
Operating income(Operating income ratio)
+0.5%365.0+2.9%366.9356.6Net sales
Change from previous
projections
FY2013.3 Previous
Projectionsmade on 2013.2.6
YoY changesFY2013.3 Results
FY2012.3 Results
Performance in FY2013.3Performance in FY2013.3
Currency exchange rates (yen)Currency exchange rates (yen)
Net SalesNet Sales
Operating Income
Operating Income

4
272.7265.1 270.5
55.4 55.053.216.2 15.0 15.5
24.023.822.1
Net SalesNet Sales Operating IncomeOperating Income
7.7 6.58.1
2.92.5
2.9
-2.9 -2.0 -2.5
0.30.5
0.4
8.1
Performance by Business Segment in FY2013.3Performance by Business Segment in FY2013.3
356.6 366.9 365.0
9.2 7.0
(musical instruments +¥2.8 billion, AV/IT +¥0.6 billion)+¥3.5 billionVersus previous
projections
(musical instruments +¥2.9 billion, AV/IT +¥0.7 billion, Electronic Devices +¥0.1 billion)
+¥3.7 billionYear-on-Year
Impact of Exchange Rates
(musical instruments +0.3 billion, AV/IT -0.1 billion)+¥0.2 billion
(musical instruments -1.9 billion, AV/IT -¥1.1 billion)
-¥3.0 billion
(+2.9)
(+4.1)(-7.4)(+7.7)
(+2.9%)
(+0.8)
(+0.7)
(-3.0)(-0.7)
(+0.5%)
FY2013.3(Previous projections
made on Feb. 6, 2013)
FY2013.3FY2012.3FY2013.3
(Previous projections made on Feb. 6, 2013)
FY2013.3FY2012.3
Musical Instruments
AV/IT
Electronic Devices
Others
Musical Instruments
AV/IT
Electronic Devices
Others
(Billions of yen)
Figures in parentheses represent changes from the previous year or from previous projections
5
Domestic Business Structural ReformDomestic Business Structural Reform
Main measures Details Restructuringexpenses
Savings in FY2014.3
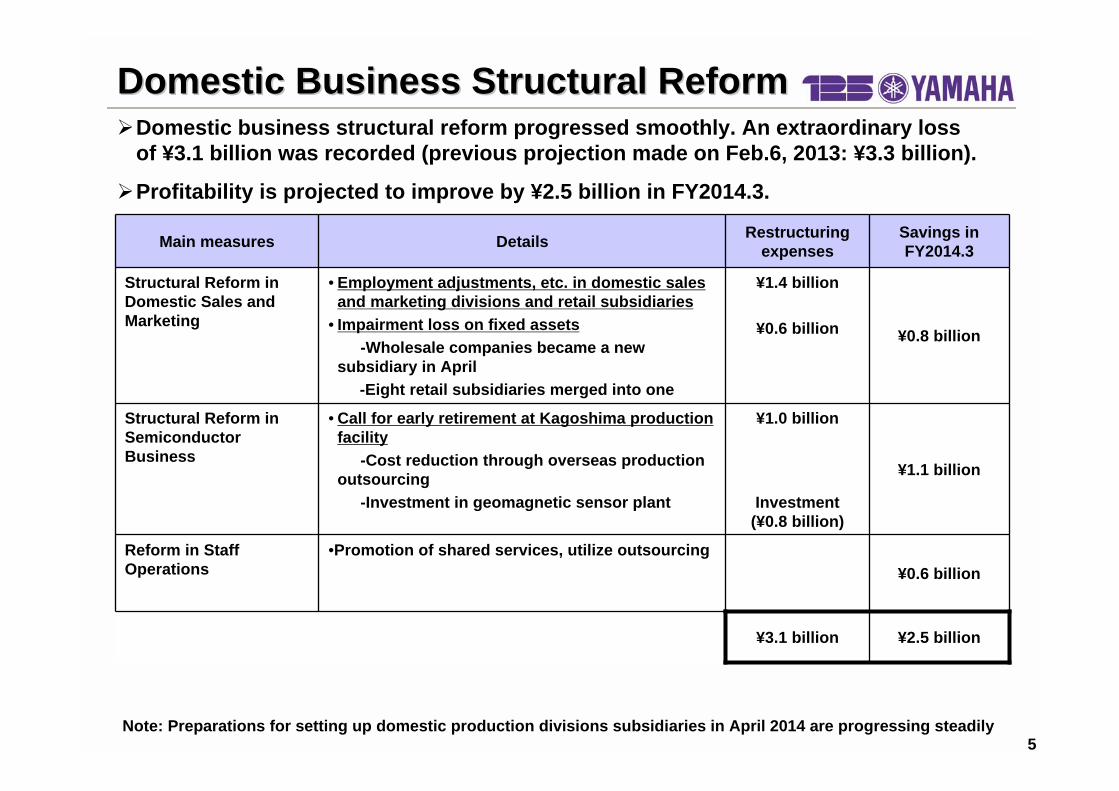
Structural Reform in Domestic Sales and Marketing
• Employment adjustments, etc. in domestic sales and marketing divisions and retail subsidiaries
• Impairment loss on fixed assets-Wholesale companies became a new
subsidiary in April -Eight retail subsidiaries merged into one
¥1.4 billion
¥0.6 billion ¥0.8 billion
Structural Reform in Semiconductor Business
• Call for early retirement at Kagoshima production facility
-Cost reduction through overseas production outsourcing
-Investment in geomagnetic sensor plant
¥1.0 billion
Investment (¥0.8 billion)
¥1.1 billion
Reform in Staff Operations
•Promotion of shared services, utilize outsourcing¥0.6 billion
¥3.1 billion ¥2.5 billion
Domestic business structural reform progressed smoothly. An extraordinary loss of ¥3.1 billion was recorded (previous projection made on Feb.6, 2013: ¥3.3 billion).
Profitability is projected to improve by ¥2.5 billion in FY2014.3.
Note: Preparations for setting up domestic production divisions subsidiaries in April 2014 are progressing steadily

6
8.1 9.2
7.0
FY2013.3 previous projections made on Feb. 6, 2013
FY2013.3
Impact of exchange rates
0.2
9.2
Versus previous projectionsVersus previous projections
Versus previous yearVersus previous year
FY2013.3 Operating Income AnalysisFY2013.3 Operating Income Analysis
FY2012.3 FY2013.3
Impact of exchange rates-3.0
(Billions of yen)
Increase in actual SG&A-1.4
Decrease in material cost0.4
Retirement benefit obligation0.9
Effects of structural reform (Saitama integration)1.1
Increase in sales/ price3.1
Improvement in operating margins
0.5
Cost cutting measures
1.5

7
Musical InstrumentsMusical Instruments
47.741.7 45.6
22.923.023.9
-0.1 0 -1.6
70.7 68.565.6
183.4185.5177.7
87.187.287.4
272.7 270.5265.1
FY2012.3 4Q FY2013.3 4Q FY2013.3 4Q(previous
projections made on Feb. 6, 2013)
4Q Overview FY2013.3 Overview• Pianos sales were robust in North America and China• Digital piano sales were up year-on-year, but portable
keyboards struggled• Double-digit growth in professional audio equipment• Strong sales of wind instruments as demand rebounded in the
North American rental market• Music school and digital musical instrument struggled in Japan
and overall Japan sales declined.
• Actual sales rose year-on-year despite sluggish results during the year-end period of high demand
• Production adjustments were implemented due to slow sales• The North American market showed steady growth, but Europe
continued to face challenging economic conditions. Although the pace of growth slowed in China, it remained in double digits. Other markets slowed.
• Sales of digital musical instruments and audio equipment grew, although they did not meet targets
• Musical instrument and audio equipment sales and marketing reforms were carried out in Japan, with new subsidiaries established in April
Music schools, etc.
Yamaha musical
instruments Operating income
Net sales
6.57.7 8.1
FY2012.3 FY2013.3 FY2013.3
full year full year(previous
projections made on Feb. 6, 2013)
(Billions of yen)
8
Other Regions
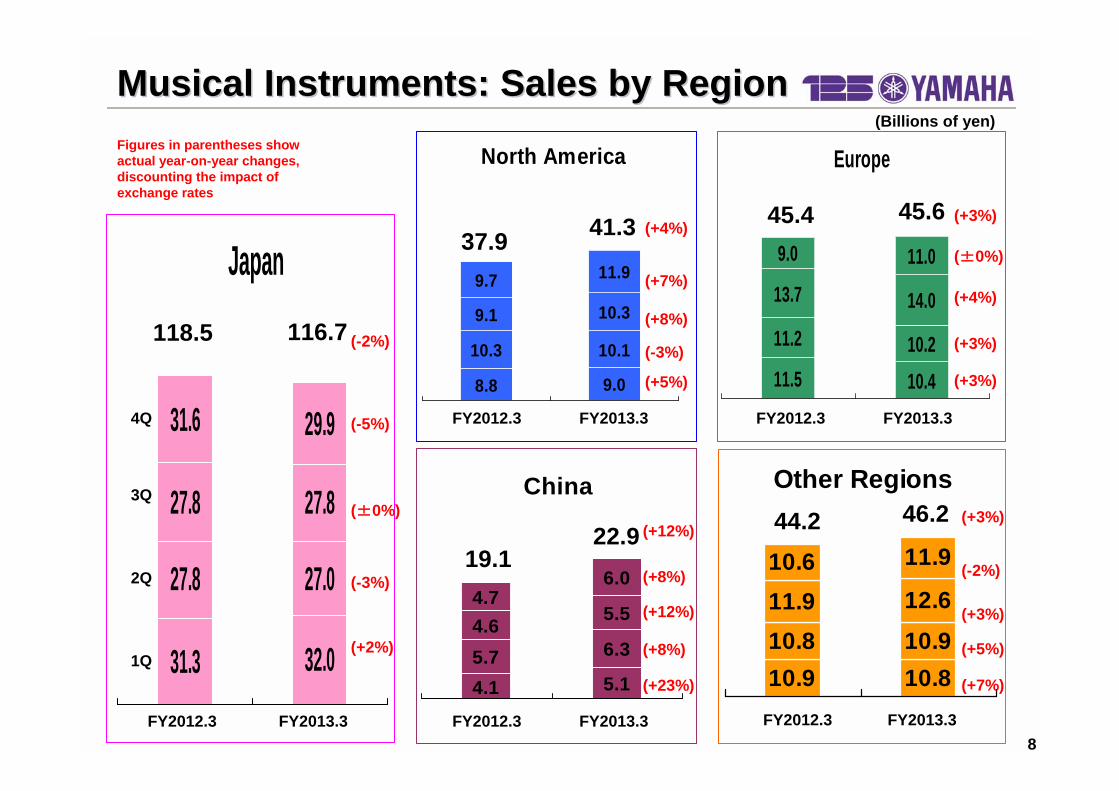
10.810.910.910.8
12.611.9
11.910.6
Japan
32.031.3
27.027.8
27.827.8
29.931.6
Musical Instruments: Sales by RegionMusical Instruments: Sales by Region
North America
9.08.8
10.110.3
10.39.1
9.7 11.9
Europe
10.411.510.211.2
14.013.7
11.09.0
118.5 116.7
41.337.9
China
5.14.1
6.35.7
5.54.6
6.04.7
45.6
46.244.2
4Q
45.4
19.122.9
3Q
2Q
1Q(+2%)
(-3%)
(±0%)
(-5%)
(-2%)
(+5%)
(-3%)
(+8%)
(+7%)
(+4%)
(+3%)
(+3%)
(+4%)
(±0%)
(+3%)
(+23%)
(+8%)
(+12%)
(+8%)
(+12%)
(+7%)
(+5%)
(+3%)
(-2%)
(+3%)
FY2013.3FY2012.3
FY2013.3FY2012.3 FY2013.3FY2012.3
FY2013.3FY2012.3 FY2013.3FY2012.3
(Billions of yen)Figures in parentheses show actual year-on-year changes, discounting the impact of exchange rates

9
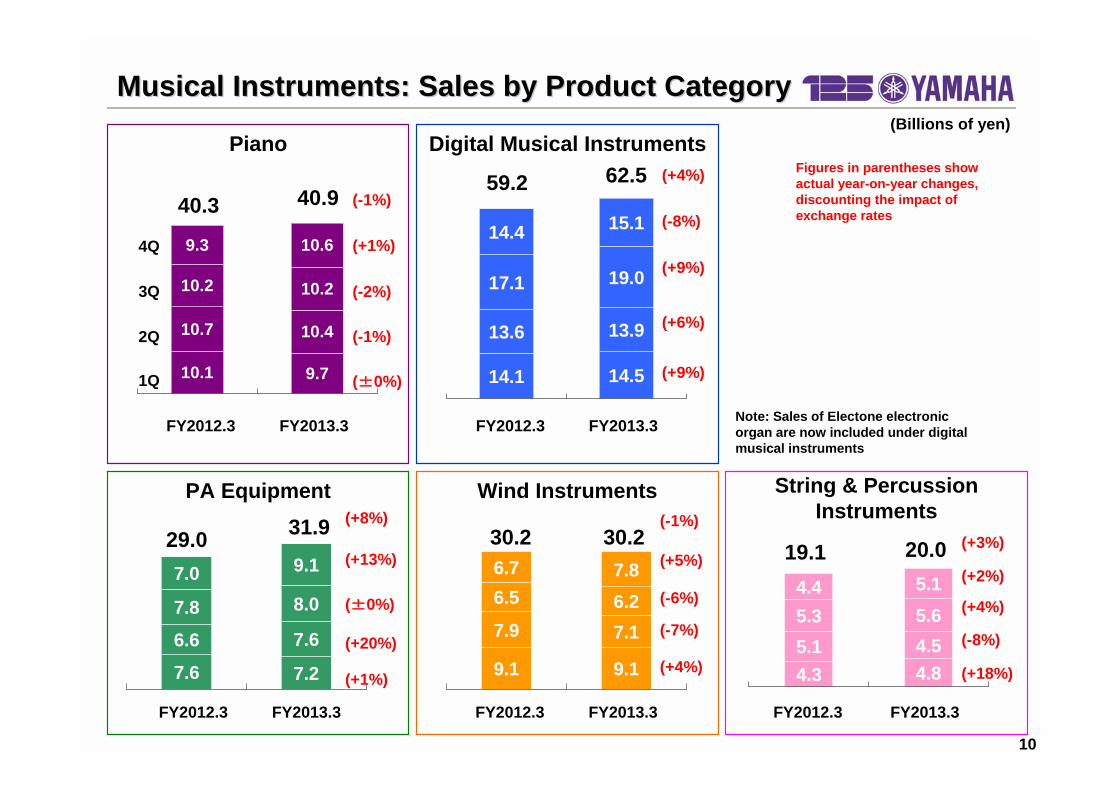
Musical Instruments: Sales by RegionMusical Instruments: Sales by RegionMusical Instrument Sales by Region
Japan
A stagnant market produced overall results even lower than those of the previous year, which suffered from the impact of the Great East Japan Earthquake. Although demand for grand pianos and upright pianos manufactured in Indonesia rallied in the fourth quarter and sales of the NU1 hybrid piano increased year-on-year, overall piano sales were lower than the previous year, as were digital musical instrument sales. Mid-range wind instruments struggled throughout the year. Guitar sales were up from the previous year, partly due to continuing strong sales of THR guitar amplifiers. Professional audio equipment sales were robust in the fourth quarter and grew by double digits over the full year as the projects decreased and unit prices fell.
North America
Economic conditions continued to recovery gradually. Thanks to strong sales in March, fourth quarter and full year results were both up year-on-year. The Canadian market was unable to escape its sluggishness from December onward. Except for portable keyboards, synthesizers and drums, region-wide sales of all products increased year-on-year.
Europe
With the European economy still in recession, fourth quarter results were flat year-on-year. Although year-on-year figures were up in Northern Europe, the UK, France, Spain, and Eastern Europe, they were down in Central Europe and Italy. Sales of professional audio equipment, wind instruments, and string and percussion instruments exceeded the previous year’s results, but those of pianos and digital musical instruments did not. Full year sales rose only slightly year-on-year. Although they improved in the UK, Central and Eastern Europe, and Northern Europe, they declined in the Southern European nations of France, Spain, and Italy amidst challenging economic conditions. Although sales of digital pianos and professional audio equipment were up year-on-year, those of other products were generally down.
China
The Chinese market as a whole achieved double-digit year-on-year growth. Although market conditions improved somewhat in the fourth quarter following slow consumption and anti-Japanese sentiment in the third, there was no broad-based recovery. Core piano products were affected by the slowing economy and high-end products manufactured in Japan struggled, but sales of locally-made models were robust. Sales of digital keyboard instruments, guitars, and professional audio equipment were robust in the fourth quarter.
Other Regions
Emerging markets slowed under the influence of economic downturns in developed countries and China. In major emerging countries, sales expanded in Russia, but were flat in India. In Southeast Asia, Indonesia and Thailand continued to record robust sales. In Latin America, Argentina remained sluggish as import restrictions continued and Colombia and Brazil slowed, but Mexico grew. Economic sanctions on Iran and ongoing situations in Syria had a negative impact on the Middle East. Retailers showed signs of recovery in Australia, where sales rallied to generally match the previous year’s levels.
10
Note: Sales of Electone electronic organ are now included under digital musical instruments
9.710.1
10.410.7
10.210.2
10.69.3
14.514.1
13.913.6
19.017.1
14.4 15.1
4.84.34.55.1
5.3 5.65.14.4
9.19.1
7.17.96.26.57.86.7
FY2013.3FY2012.3FY2013.3FY2012.3
FY2013.3FY2012.3 FY2013.3FY2012.3
40.3 40.9 (-1%)
(-2%)
(±0%)
(-1%)
(+1%)
1Q
2Q
3Q
4Q
Piano Digital Musical Instruments
Wind Instruments String & Percussion Instruments
59.2 62.5
(-8%)
(+9%)
(+9%)
(+6%)
(+4%)
30.2 30.2(+5%)
(-6%)
(+4%)
(-7%)
(-1%)
19.1 20.0(+2%)
(+4%)
(+18%)
(-8%)
(+3%)
7.27.6
7.66.6
8.07.8
9.17.0
FY2013.3FY2012.3
PA Equipment
29.0 31.9(+13%)
(±0%)
(+1%)
(+20%)
(+8%)
Musical Instruments: Sales by Product CategoryMusical Instruments: Sales by Product Category(Billions of yen)
Figures in parentheses show actual year-on-year changes, discounting the impact of exchange rates

11
9.4 11.1 10.6
1.91.81.7
-0.8-0.4-0.9
AV/ITAV/IT
48.448.946.8
6.56.4 6.6
2.52.92.9
Routers, etc.
AV productsKaraoke
55.4 55.0
12.9 12.511.1
53.2
4Q Overview FY2013.3 Overview• Profitability improved as sales increased• Robust sales of AV receivers in the North American
and European markets• Genuine increase in sales of TV peripheral devices
in overseas markets• Strong sales of online karaoke equipment• Routers showed steady growth, despite a decline in
large orders
• Sales rose year-on-year but operating income remained the same. Sales and income were both higher than previous projections
• Continued strong sales of audio products drove solid results in the North American market
• Sound bar speaker sales grew in North America and Europe
• Shipments of online karaoke equipment were steady, continuing to enjoy the effects of model changes
• Router sales were on a par with the previous year, partly due to market inventory adjustments
Operating income
Net sales
FY2012.3 4Q FY2013.3 4Q FY2013.3 4Q(previous
projections made on Feb. 6, 2013)
FY2012.3 FY2013.3 FY2013.3
full year full year(previous
projections made on Feb. 6, 2013)
(Billions of yen)

12
4.23.74.3
-0.4-1.6 -0.9
15.515.016.2
-2.5-2.0-2.9
Electronic DevicesElectronic Devices4Q Overview FY2013.3 Overview
• Sales were down year-on-year and against previous projections, but profitability improved
• Graphics controllers for amusement equipment struggled, but sound controllers sold briskly.
• Although sales of geomagnetic sensors were robust, those of devices for other applications were down year-on-year
• Gross sales margins increased and profitability at the Kagoshima production subsidiary improved
•Delay in recovery of amusement market in second half•Progress with overseas outsourcing of production•Solid sales of geomagnetic sensors•Fixed costs curbed through measures including early retirements at Kagoshima production subsidiary
Operating income
Net sales
FY2012.3 4Q FY2013.3 4Q FY2013.3 4Q(previous
projections made on Feb. 6, 2013)
FY2012.3 FY2013.3 FY2013.3
full year full year(previous
projections made on Feb. 6, 2013)
(Billions of yen)

13
1.71.81.71.2 1.6 1.8
1.11.01.0
1.31.31.1
-0.1-0.3 -0.4
7.97.0 8.0
5.45.9 5.2
5.35.25.0
5.45.44.2
0.50.4 0.3
OthersOthers
Factory automation equipment, etc.
ResortsGolf products
Automobile interior wood components
23.822.1
5.95.75.0
24.0
4Q Overview FY2013.3 Overview• Steady sales of automobile interior wood
components• Measures taken for golf product defect issue have
nearly been completed• Successful efforts to attract more guests to resorts
in the winter season increased the number of day-trippers
• Smoothly managed 1Q transition of automobile interior wood components in response to customer model changes, and subsequent sales were robust
• Golf product sales were slow in overseas markets and declined in Japan due to factors including product issues
• Efforts to attract more guests to resorts in the off-season during the second half had some effect
• Orders for factory automation equipment rebounded
Operating income
Net sales
FY2012.3 4Q FY2013.3 4Q FY2013.3 4Q(previous
projections made on Feb.
6, 2013)
FY2012.3 FY2013.3 FY2013.3
full year full year(previous
projections made on Feb. 6, 2013)
(Billions of yen)
14
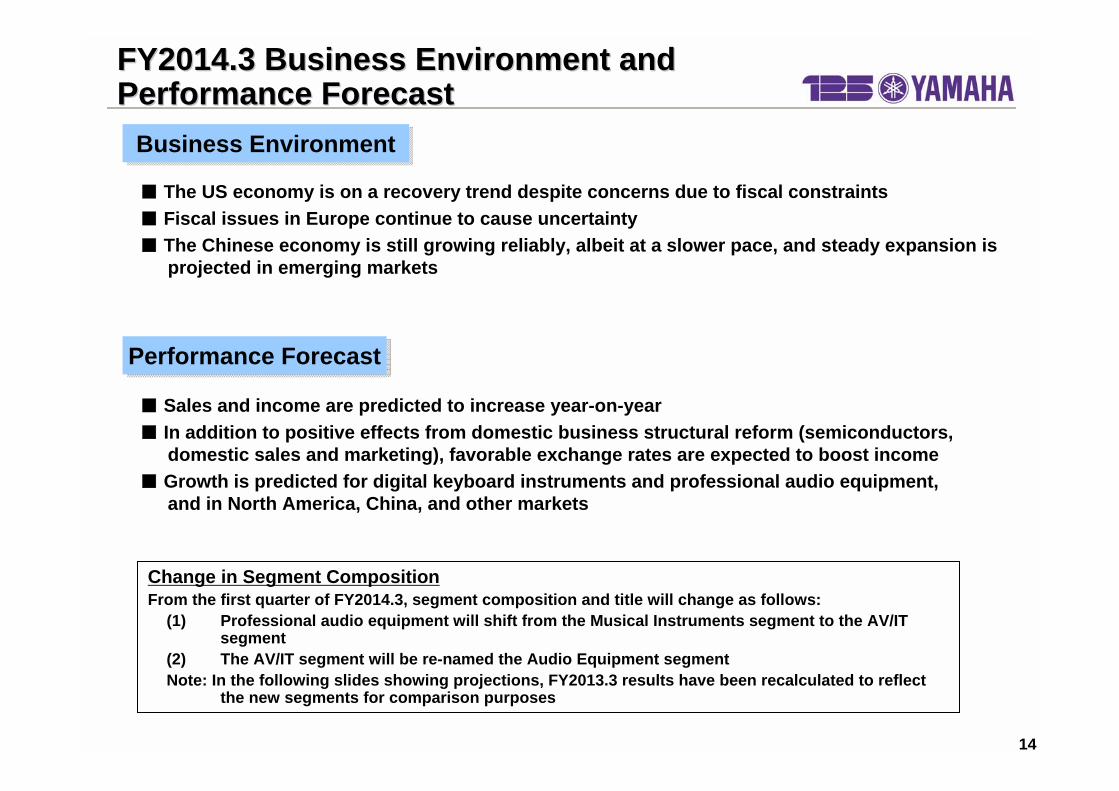
FY2014.3 Business Environment and FY2014.3 Business Environment and Performance ForecastPerformance Forecast
■ The US economy is on a recovery trend despite concerns due to fiscal constraints■ Fiscal issues in Europe continue to cause uncertainty■ The Chinese economy is still growing reliably, albeit at a slower pace, and steady expansion is
projected in emerging markets
■ Sales and income are predicted to increase year-on-year■ In addition to positive effects from domestic business structural reform (semiconductors,
domestic sales and marketing), favorable exchange rates are expected to boost income■ Growth is predicted for digital keyboard instruments and professional audio equipment,
and in North America, China, and other markets
Business EnvironmentBusiness Environment
Performance ForecastPerformance Forecast
Change in Segment CompositionFrom the first quarter of FY2014.3, segment composition and title will change as follows:
(1) Professional audio equipment will shift from the Musical Instruments segment to the AV/IT segment
(2) The AV/IT segment will be re-named the Audio Equipment segmentNote: In the following slides showing projections, FY2013.3 results have been recalculated to reflect
the new segments for comparison purposes

15
Forecast for Performance in FY2014.3Forecast for Performance in FY2014.3
115107EUR
8582US$
+227.5%+9.413.5(3.5%)
4.1(1.1%)
Net income(Net income ratio)
8583US$
+7.9
+8.8
+23.1
Increase/ decrease
115103EUR
+92.3%16.5 (4.2%)
8.6 (2.3%)
Ordinary income(Ordinary income ratio)
+95.3%18.0(4.6%)
9.2(2.5%)
Operating income(Operating income ratio)
+6.3%390.0366.9Net sales
Year-on-year percentage
changeFY2014.3
projectionsFY2013.3 results
Currency exchange rates (yen)Currency exchange rates (yen)
Net salesNet sales
Operating income
Operating income
Sales and income are forecast to increase against previous year.(Billions of yen)
16
12.06.4
5.5
4.6
-2.0 0
0.5
0.3235.5 246.5
99.592.6
19.015.023.8 25.0
*
*
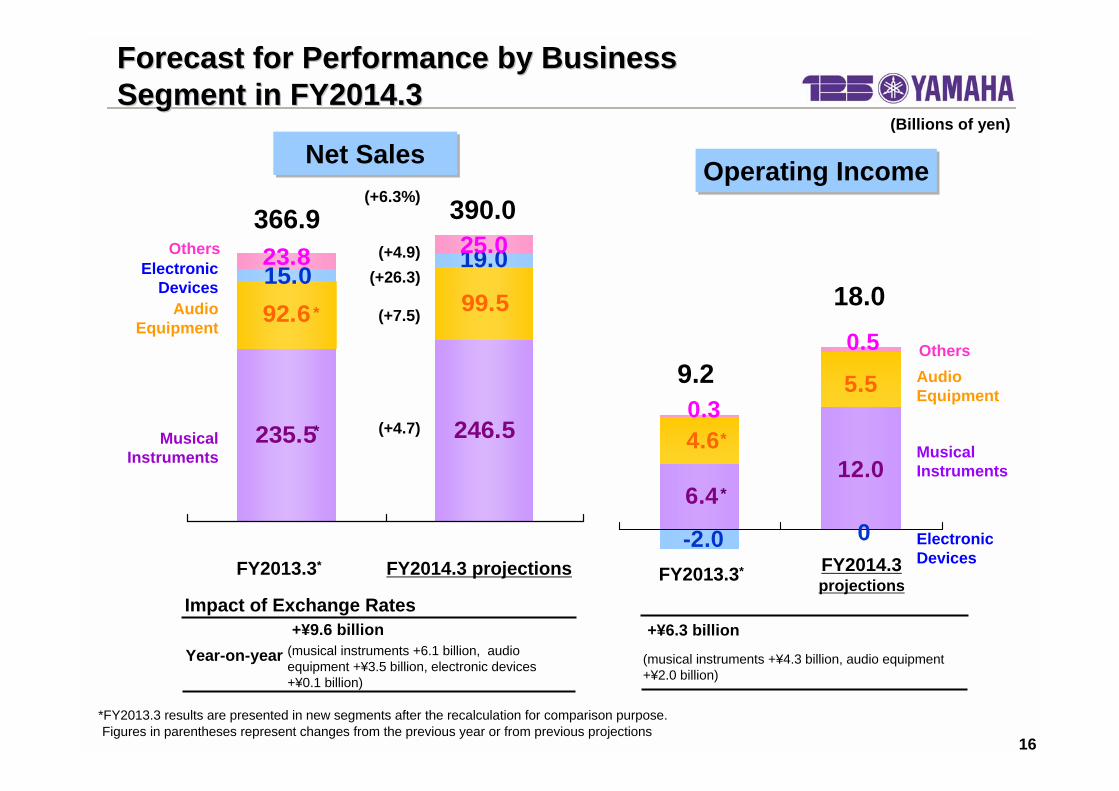
Forecast for Performance by Business Forecast for Performance by Business Segment in FY2014.3Segment in FY2014.3
366.9 390.0
9.2
FY2013.3* FY2014.3 projections
Musical Instruments
Others
18.0
FY2013.3* FY2014.3projections
(musical instruments +6.1 billion, audio equipment +¥3.5 billion, electronic devices +¥0.1 billion)
Year-on-year+¥9.6 billion
Impact of Exchange Rates
(musical instruments +¥4.3 billion, audio equipment +¥2.0 billion)
+¥6.3 billion
(+4.7)
(+7.5)
(+26.3)(+4.9)
(+6.3%)
Musical Instruments
Audio Equipment
Electronic Devices
Others
Electronic Devices
*FY2013.3 results are presented in new segments after the recalculation for comparison purpose.
*
*
Audio Equipment
Figures in parentheses represent changes from the previous year or from previous projections
Net SalesNet SalesOperating IncomeOperating Income
(Billions of yen)
17
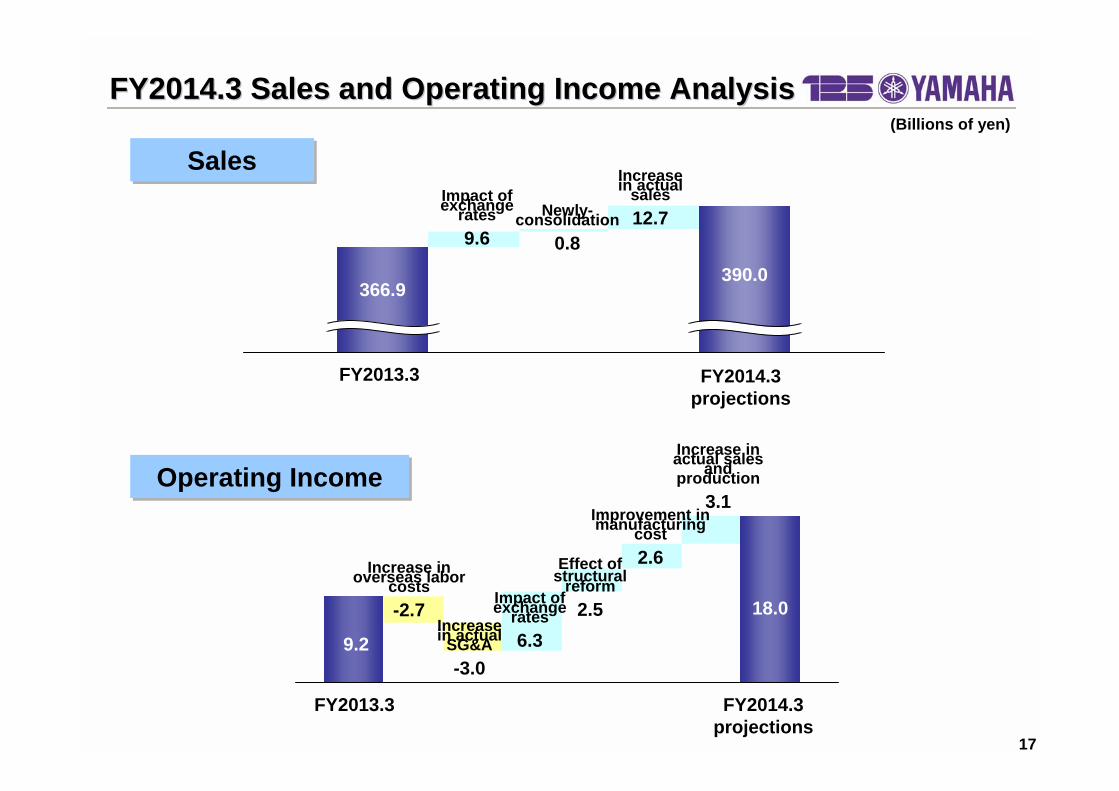
366.9390.0
FY2013.3 FY2014.3 projections
FY2013.3 FY2014.3 projections
9.2
Impact of exchange rates6.3
18.0
FY2014.3 Sales and Operating Income AnalysisFY2014.3 Sales and Operating Income Analysis
SalesSales
Operating IncomeOperating Income
(Billions of yen)
Impact of exchange rates9.6
Newly-consolidation0.8
Increase in actual sales12.7
Increase in overseas labor costs-2.7
Increase in actual SG&A-3.0
Effect of structuralreform
2.5
Improvement in manufacturing cost2.6
Increase in actual sales and production3.1

18
12.06.4
Musical Instruments: ProjectionsMusical Instruments: Projections
235.5*Full Year Projections•Sales and income are expected to increase year-on-year
•Sales are anticipated to rise in China and emerging markets
•Wind instrument, string and percussion instrument, and especially digital keyboard instrument sales are predicted to grow
•Domestic business structural reform will improve profitability
Net SalesNet Sales
Operating IncomeOperating Income
FY2013.3* FY2014.3 (projections)
*
*
*Music schools, etc.
Yamaha musical
instruments
FY2013.3* FY2014.3 (projections)
165.0153.6
81.581.9
246.5
*
*
*FY2013.3 results are presented in new segments after the recalculation for comparison purpose.
(Billions of yen)

19
Other Regions
20.217.6
21.220.0
Japan
55.4 53.6
52.6 52.9
Musical Instrument: Sales by regionMusical Instrument: Sales by regionNorth America
15.4 17.9
18.0 17.8
Europe
19.116.6
21.120.1
108.0* 106.5
35.833.4*
China
11.710.0
9.8 11.0
40.2
41.337.6*
36.7*
19.8* 22.7
2H
1H(-3%)
(+1%)
(-1%)(+8%)
(+1%)
(+4%)
(+1%)
(+2%)
(+1%)
(+8%)
(+16%)
(+12%)
(+5%)
(+6%)
(+6%)
FY2014.3 projections
FY2013.3*
FY2014.3 projections
FY2013.3* FY2014.3 projections
FY2013.3*
FY2014.3 projections
FY2013.3* FY2014.3 projections
FY2013.3*
*
*
*
*
*
*
*
*
*
*
Figures in parentheses show actual year-on-year changes, discounting the impact of exchange rates
(Billions of yen)
*FY2013.3 results are presented in new segments after the recalculation for comparison purpose.

20
21.820.1
21.520.8
31.728.4
36.334.1
10.79.3
10.7 11.0
18.316.2
14.0 13.9
FY2014.3 projections
FY2013.3
40.943.3 (+3%)
(+1%)
(+4%)
1H
2H
Piano Digital Musical Instruments
Wind Instruments String & Percussion Instruments
62.568.0
(+6%)
(+3%)
(+5%)
30.2 32.2
(-1%)
(+6%)
(+3%)20.0
21.7
(+2%)
(+7%)
(+4%)
Musical Instruments: Sales by Product CategoryMusical Instruments: Sales by Product Category
Japan33.420%
NorthAmerica34.621%
Europe38.824%
China22.013%
OtherRegions36.222%
Yamaha Musical Instrument Sales by Region
Yamaha musical
instrument sales:
¥165.0 billion
FY2014.3 projections
Figures in parentheses show actual year-on-year changes, discounting the impact of exchange rates
(Billions of yen)
FY2014.3 projections
FY2013.3
FY2014.3 projections
FY2013.3 FY2014.3 projections
FY2013.3

21
5.54.6
Audio Equipment: ProjectionsAudio Equipment: Projections
Routers, etc.
Professional audio
equipment
AV productsKaraoke
92.6*
Full Year Projections
•Sales and income are expected to rise year-on-year
•Karaoke equipment sales are anticipated to decline as the effects of model changes fade
•Professional audio equipment sales are forecast to increase, partly due to expansion of the business field
•The current round of router inventory adjustments is projected to end and the product field will be expanded
•Product development expenses is projected for professional audio equipment, routers, etc.
*
*
Net SalesNet Sales
Operating IncomeOperating Income
FY2013.3* FY2014.3 (projections)
FY2013.3* FY2014.3 (projections)
51.348.9
41.137.2
6.5 7.2
99.5
*
*FY2013.3 results are presented in new segments after the recalculation for comparison purpose.
(Billions of yen)
22
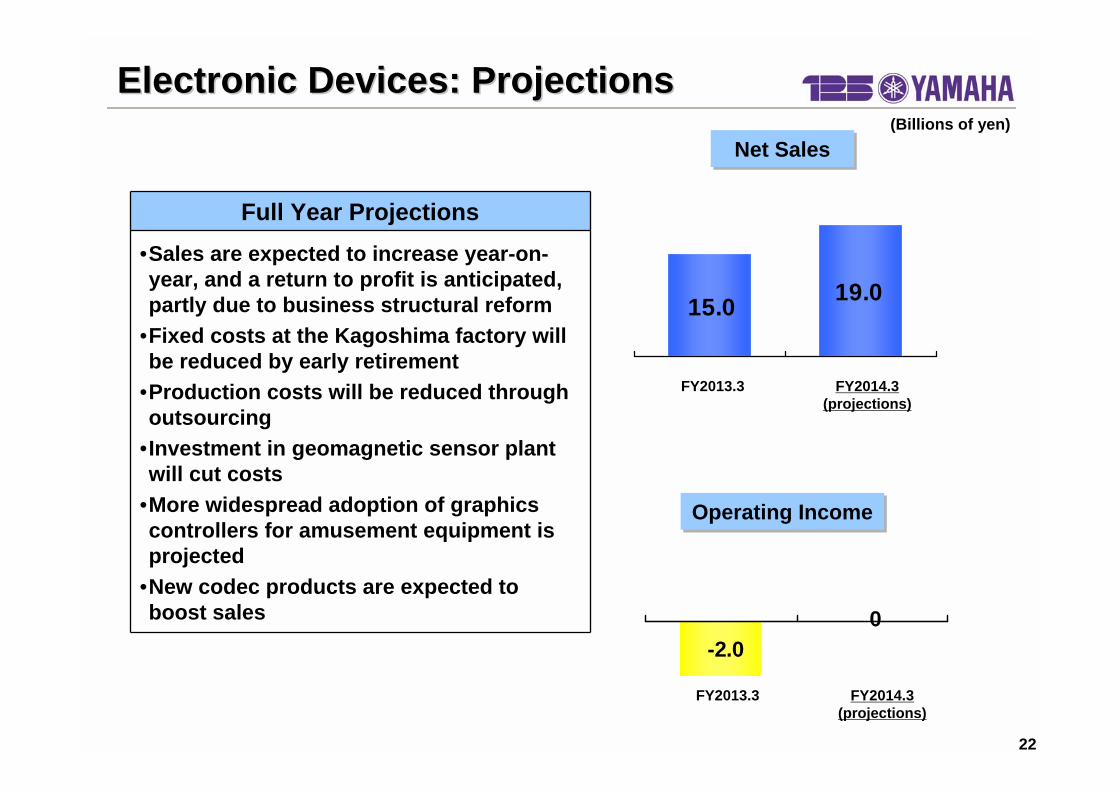
19.015.0
-2.00
Electronic Devices: ProjectionsElectronic Devices: Projections
Full Year Projections•Sales are expected to increase year-on-year, and a return to profit is anticipated, partly due to business structural reform
•Fixed costs at the Kagoshima factory will be reduced by early retirement
•Production costs will be reduced through outsourcing
•Investment in geomagnetic sensor plant will cut costs
•More widespread adoption of graphics controllers for amusement equipment is projected
•New codec products are expected to boost sales
Net SalesNet Sales
Operating IncomeOperating Income
FY2013.3 FY2014.3 (projections)
FY2013.3 FY2014.3 (projections)
(Billions of yen)
23
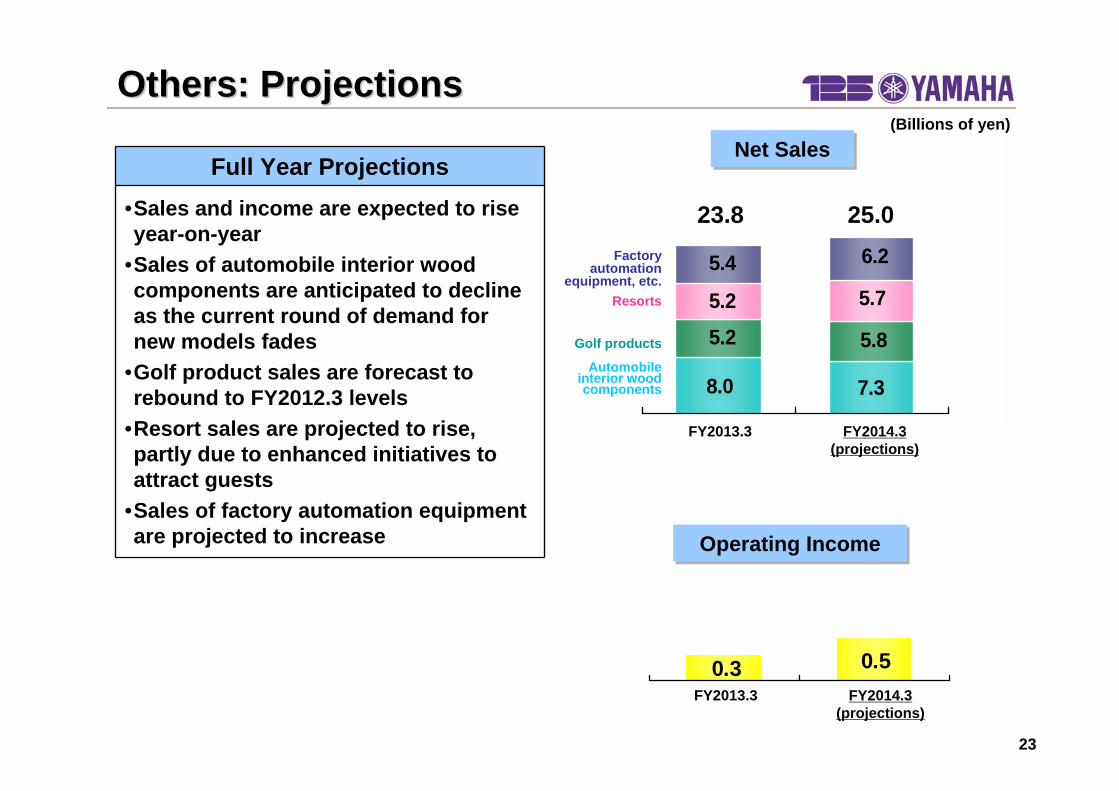
8.0 7.3
5.2 5.8
5.75.2
6.25.4
0.3 0.5
Others: ProjectionsOthers: Projections
25.023.8
Full Year Projections•Sales and income are expected to rise year-on-year
•Sales of automobile interior wood components are anticipated to decline as the current round of demand for new models fades
•Golf product sales are forecast to rebound to FY2012.3 levels
•Resort sales are projected to rise, partly due to enhanced initiatives to attract guests
•Sales of factory automation equipment are projected to increase
Net SalesNet Sales
Operating IncomeOperating Income
Factory automation
equipment, etc.Resorts
Golf products
Automobile interior wood components
FY2013.3 FY2014.3 (projections)
FY2013.3 FY2014.3 (projections)
(Billions of yen)
24
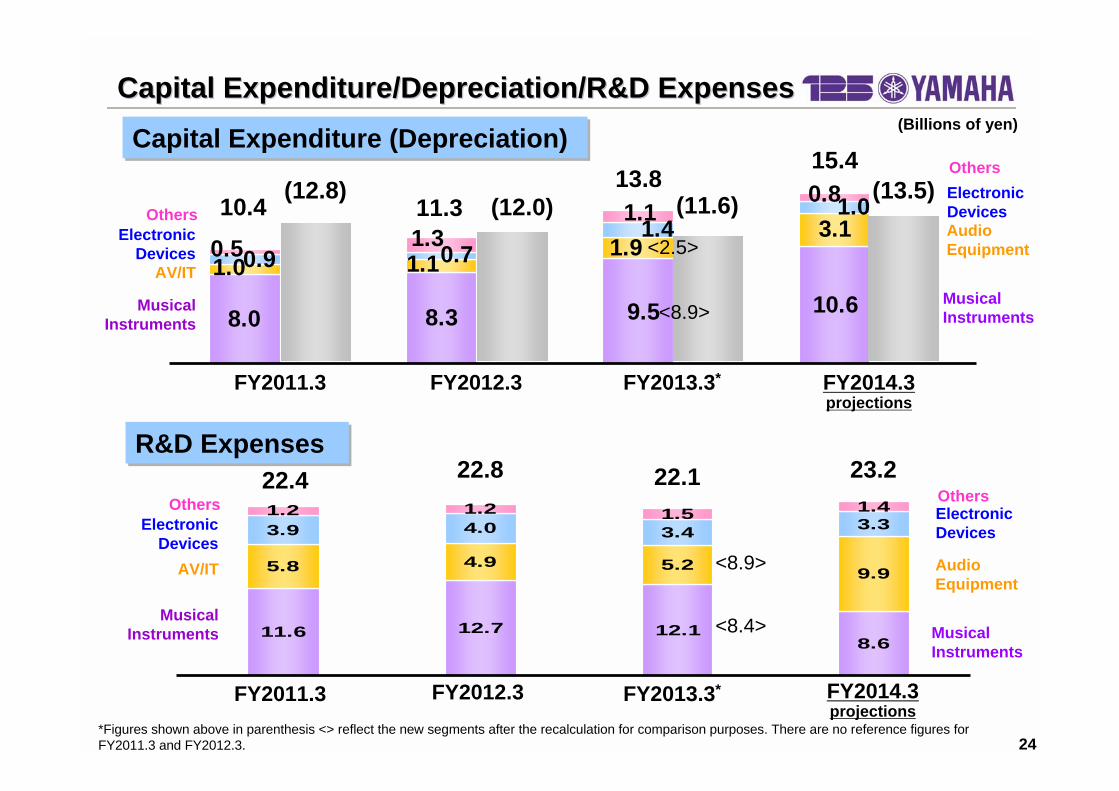
10.68.38.0 9.5
3.11.1
1.91.00.9
1.01.4
0.7
0.81.1
0.5 1.3
8.612.112.711.6
9.95.24.95.8
3.33.44.03.91.41.51.21.2
FY2013.3* FY2014.3 projections
FY2012.3
(12.8)15.4
(13.5)11.3 (12.0)
FY2014.3 projections
FY2012.3
22.4 23.222.1
FY2013.3*
FY2011.3
22.8
FY2011.3
13.8(11.6)10.4
<8.9>
<2.5>
<8.4>
<8.9>
Capital Expenditure/Depreciation/R&D ExpensesCapital Expenditure/Depreciation/R&D Expenses
Capital Expenditure (Depreciation)Capital Expenditure (Depreciation)
R&D ExpensesR&D Expenses
Musical Instruments
AV/IT
Electronic Devices
Others
(Billions of yen)
Musical Instruments
OthersElectronic DevicesAudio Equipment
Musical Instruments
OthersElectronic Devices
Audio Equipment
Musical Instruments
AV/IT
Electronic Devices
Others
*Figures shown above in parenthesis <> reflect the new segments after the recalculation for comparison purposes. There are no reference figures for FY2011.3 and FY2012.3.

25
Inventories at the end of period were ¥4.9 billion higher than previous year.Discounting the impact of exchange rates of +¥6.2 billion, actual
inventories decreased by ¥1.3 billion.Inventories were ¥4.9billion higher than the previous projections including
¥4.9 billion impact of exchange rates, ending at the planned level.
34.844.137.0 41.9
7.67.9
8.813.9
2.2 2.22.22.5
25.127.0
24.325.5
InventoriesInventories
77.1 76.0
FY2011.3 FY2012.3 FY2013.3* FY2014.3
82.071.7
Goods in process/
materials
AV/IT
Musical instruments
Other products
<36.8>
<16.1>
(Billions of yen)
Goods in process/ materials
Audio equipment
Musical instruments
Other products
projections*Figures shown above in parenthesis <> reflect the new segments after the recalculation for comparison purposes. There are no reference figures for FY2011.3 and FY2012.3.
26
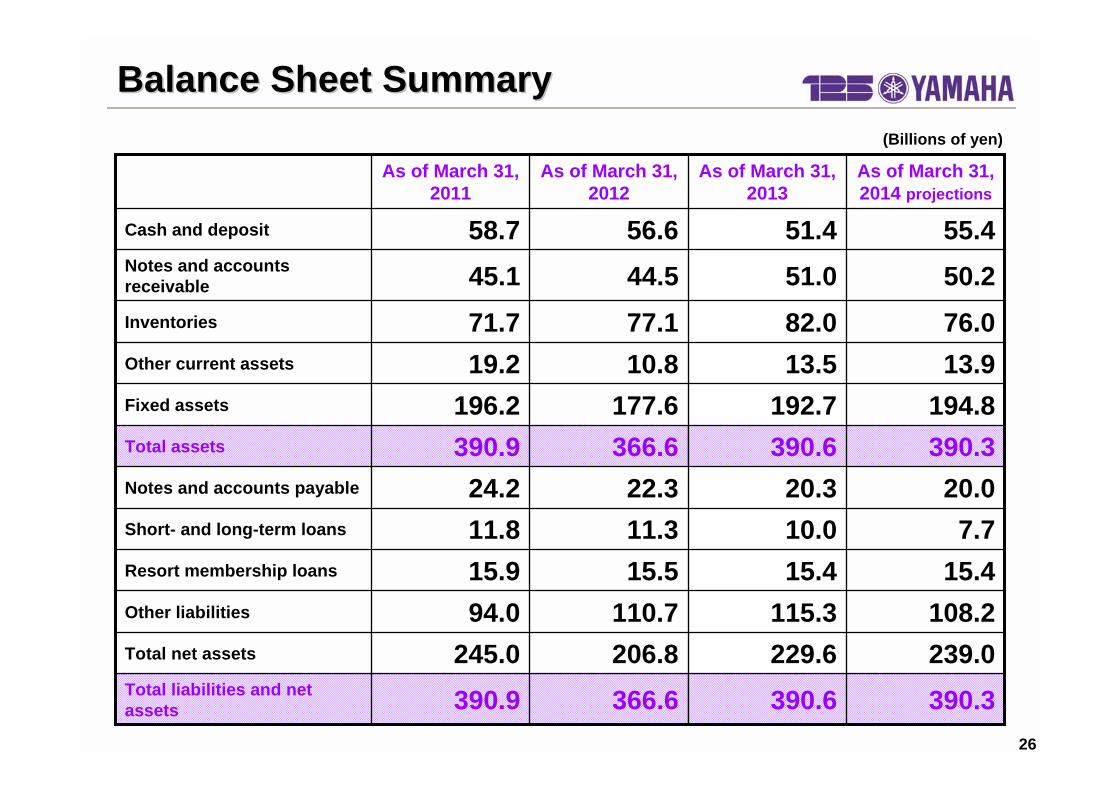
390.3
239.0108.215.47.7
20.0390.3194.813.976.0
50.2
55.4
As of March 31, 2014 projections
390.6366.6 390.9Total liabilities and net assets
229.6206.8245.0Total net assets
115.3110.794.0Other liabilities
15.415.515.9Resort membership loans
10.011.311.8Short- and long-term loans
20.322.324.2Notes and accounts payable
390.6366.6390.9Total assets
192.7177.6196.2Fixed assets
13.510.819.2Other current assets
82.077.171.7Inventories
51.044.545.1Notes and accounts receivable
51.456.658.7Cash and deposit
As of March 31, 2013
As of March 31, 2012
As of March 31, 2011
Balance Sheet SummaryBalance Sheet Summary(Billions of yen)
27
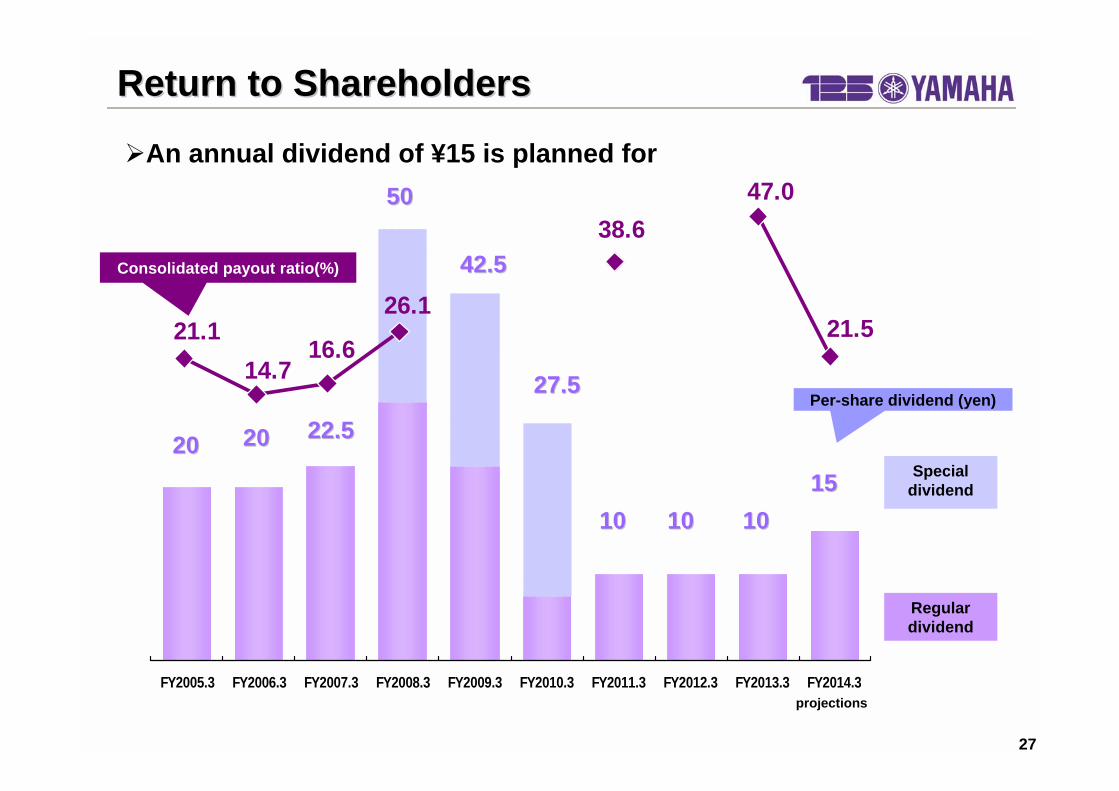
FY2005.3 FY2006.3 FY2007.3 FY2008.3 FY2009.3 FY2010.3 FY2011.3 FY2012.3 FY2013.3 FY2014.3
21.5
47.038.6
14.721.1
26.1
16.6
Return to ShareholdersReturn to Shareholders
Special dividend
projections
Regular dividend
2020 2020 22.522.5
5050
Consolidated payout ratio(%)
An annual dividend of ¥15 is planned for
Per-share dividend (yen)
42.542.5
27.527.5
1010 10101515
1010

付 属 資 料Appendix

29
Sales and income exceeded previous year and previous projections
105104104EUR
85 9078US$
115122104EUR
859279US$
―-4.5―-0.3-32.1Net loss
―-3.6―-1.0-2.2Ordinary loss
―-3.4―-1.2-2.9Operating loss
+2.1%91.1+8.2%93.086.0Net sales
Change from previous
projections
FY2013.3 4Q previous
projections made on Feb. 6,
2013
YoY changesFY2013.3 4Q results
FY2012.3 4Q results
Performance in the Fourth Quarter of FY2013.3Performance in the Fourth Quarter of FY2013.3
(Billions of yen)
Currency exchange rates (yen)Currency exchange rates (yen)
Net salesNet sales
Operating income
Operating income
30
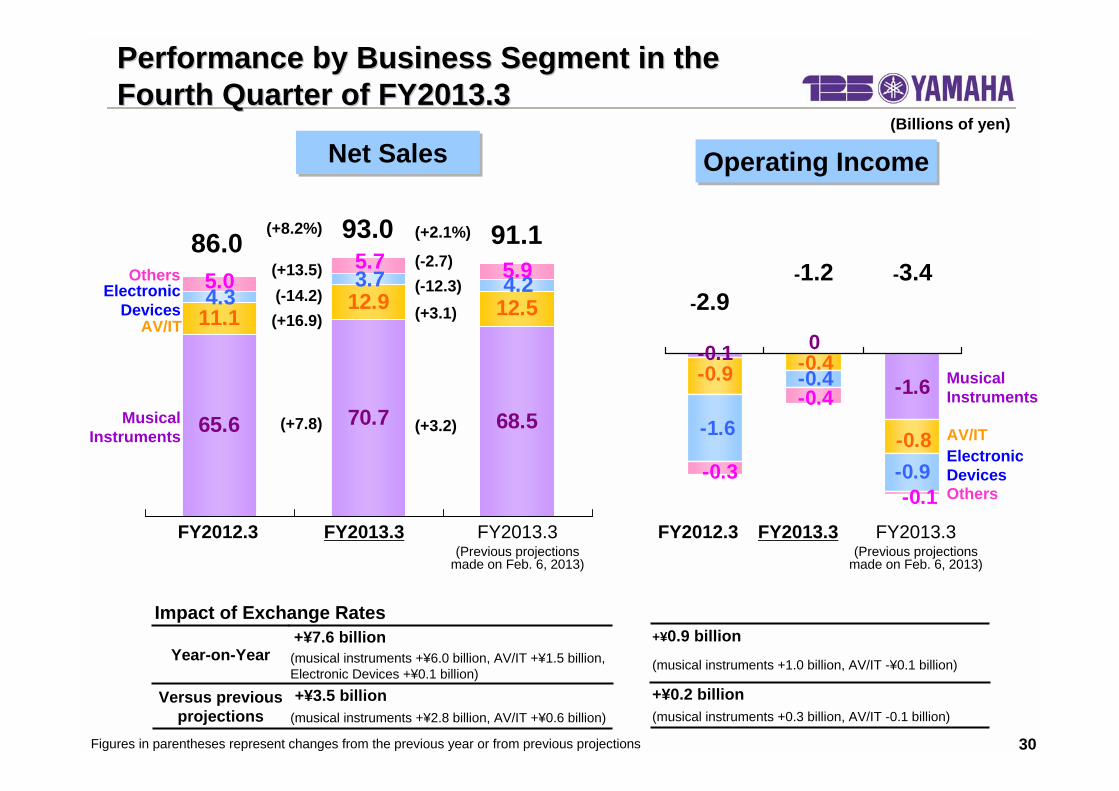
-1.6-0.1 0
-0.4
-0.8
-0.9
-1.6
-0.4
-0.9
-0.4
-0.1-0.3
65.6 70.7 68.5
12.512.911.1
4.23.74.35.0
5.7 5.9
Performance by Business Segment in the Performance by Business Segment in the Fourth Quarter of FY2013.3Fourth Quarter of FY2013.3
91.193.0-1.2 -3.4
86.0
-2.9
(+3.2)
(+3.1)(-12.3)(-2.7)
(+2.1%)
(+7.8)
(+16.9)(-14.2)(+13.5)
(+8.2%)
Net SalesNet Sales Operating IncomeOperating Income
FY2013.3(Previous projections
made on Feb. 6, 2013)
FY2013.3FY2012.3 FY2013.3(Previous projections
made on Feb. 6, 2013)
FY2013.3FY2012.3
(Billions of yen)
Figures in parentheses represent changes from the previous year or from previous projections
Musical Instruments
AV/IT
Electronic Devices
Others
Musical Instruments
AV/ITElectronic DevicesOthers
(musical instruments +¥2.8 billion, AV/IT +¥0.6 billion)+¥3.5 billionVersus previous
projections
(musical instruments +¥6.0 billion, AV/IT +¥1.5 billion, Electronic Devices +¥0.1 billion)
+¥7.6 billionYear-on-Year
Impact of Exchange Rates
(musical instruments +0.3 billion, AV/IT -0.1 billion)+¥0.2 billion
(musical instruments +1.0 billion, AV/IT -¥0.1 billion)
+¥0.9 billion

31
FY2012.3 results
Extraordinary income/lossExtraordinary income/loss
Net financial income/lossOther
Total
Income from (loss on) disposal of fixed assetsOther
Total
Income taxes - currentIncome taxes - deferredMinority interests in income
Total
FY2013.3 results FY2014.3 projections
Full Year NonFull Year Non--Operating Income/Loss & Operating Income/Loss & Extraordinary Income/LossExtraordinary Income/Loss
Non-operating income/lossNon-operating income/loss
Income taxes and other expensesIncome taxes and other expenses
1.3-2.1-0.8
-0.1-0.2-0.3
4.032.10.3
36.4
1.1-1.7-0.6
1.6-2.4-0.8
3.7-0.20.23.7
Structural reform expenses -3.1-Employment adjustments in Japan business -2.5-Impairment of business facilities related to sales & marketing -0.6
1.0-2.5-1.5
3.6-0.80.23.0
-0.10.1
0
(Billions of yen)

32
Sales and Income by Quarter :Sales and Income by Quarter :Musical InstrumentsMusical Instruments
5.54.52.21.63.12.61.93.6
-0.5 002.0
66.561.5 57.561.0
Other regions
China
Europe
North America
Japan
FY2014.3 projections1Q
FY2013.31Q4Q3Q 4Q3Q2Q
FY2013.3 results
4Q3Q2Q2Q1Q
61.058.8 59.556.2
70.267.3 70.764.5
*reference only
Net sales: ¥272.7 billionOperating income: ¥8.1 billion
Net sales: ¥235.5 billionOperating income: ¥6.4 billion
Net sales: ¥246.5 billionOperating income: ¥12.0 billion
(Billions of yen)
*FY2013.3 results are presented in new segments after the recalculation for comparison purpose.
33
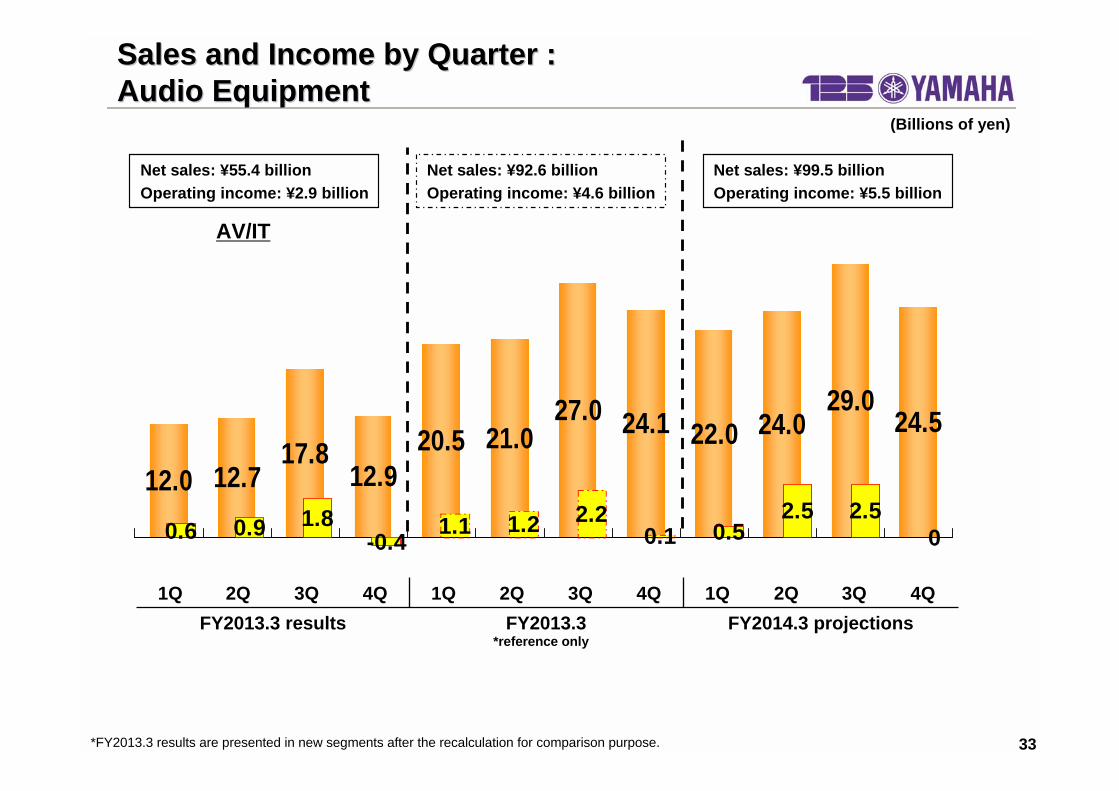
24.529.0
24.022.024.127.021.020.5
12.917.8
12.712.02.52.51.21.80.9 2.2
0.6 1.1-0.4 0.50.1 0
FY2014.3 projections1Q
FY2013.31Q4Q3Q 4Q3Q2Q
FY2013.3 results4Q3Q2Q2Q1Q
AV/IT
Sales and Income by Quarter :Sales and Income by Quarter :Audio EquipmentAudio Equipment
*reference only
Net sales: ¥55.4 billionOperating income: ¥2.9 billion
(Billions of yen)
Net sales: ¥92.6 billionOperating income: ¥4.6 billion
Net sales: ¥99.5 billionOperating income: ¥5.5 billion
*FY2013.3 results are presented in new segments after the recalculation for comparison purpose.
34
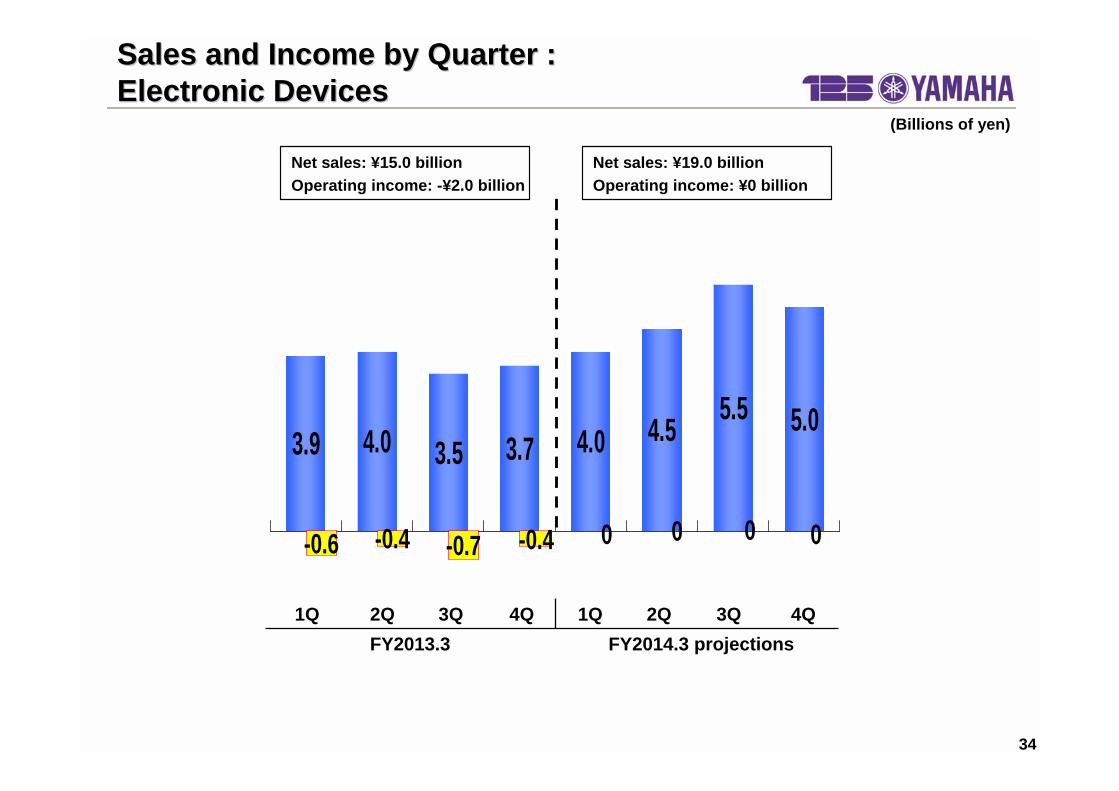
5.05.54.54.03.73.54.03.9
-0.7-0.4-0.6 000-0.4 0
FY2014.3 projections1Q
FY2013.31Q 4Q3Q2Q 4Q3Q2Q
Sales and Income by Quarter :Sales and Income by Quarter :Electronic DevicesElectronic Devices
Net sales: ¥15.0 billionOperating income: -¥2.0 billion
(Billions of yen)
Net sales: ¥19.0 billionOperating income: ¥0 billion
35
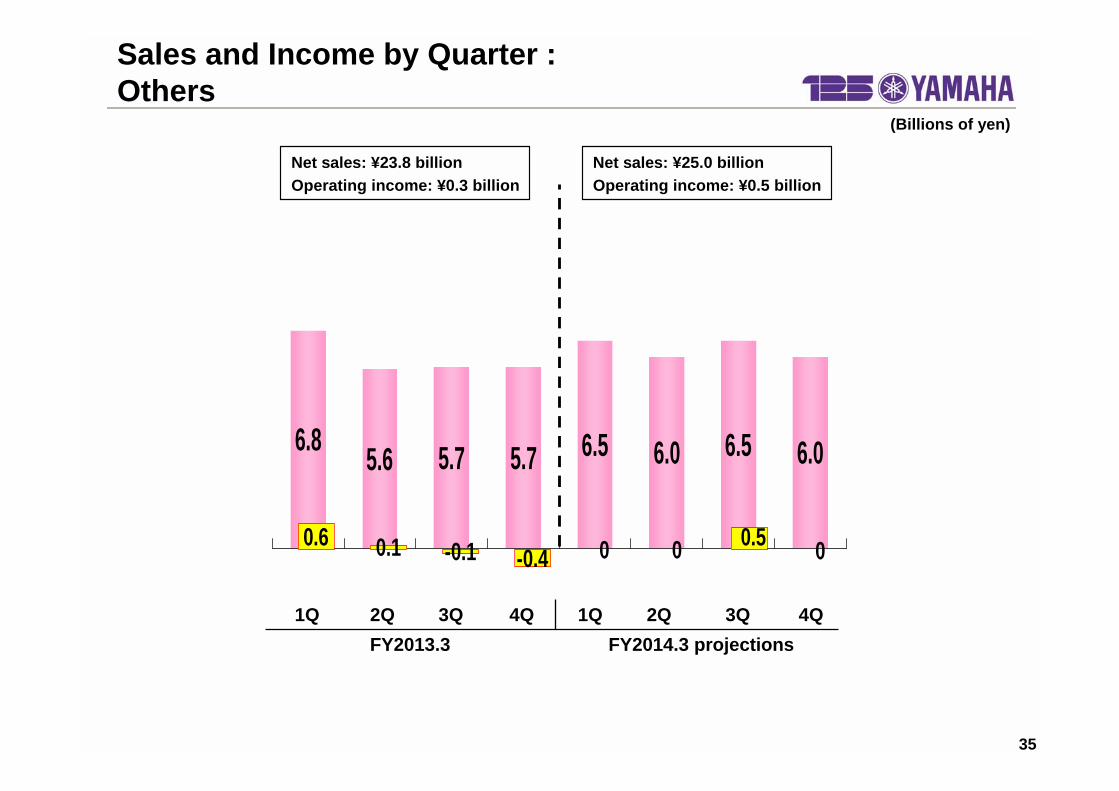
6.06.56.06.55.75.75.66.8
0-0.10.1 0.50 0-0.40.6
FY2014.3 projections1Q
FY2013.31Q 4Q3Q2Q 4Q3Q2Q
Sales and Income by Quarter :Others
Net sales: ¥23.8 billionOperating income: ¥0.3 billion
(Billions of yen)
Net sales: ¥25.0 billionOperating income: ¥0.5 billion

In this report, the figures forecast for the Company’s future performance have been calculated on the basis of information currently available to Yamaha and the Yamaha Group. Forecasts are, therefore, subject to risks and uncertainties.
Accordingly, actual performance may differ greatly from our predictions depending on changes in the economic conditions surrounding our business, demand trends, and the value of key currencies, such as the U.S. dollar and the euro.
Top Related