


Languages
Pages
Legal


Worldwide Tugs in Numbers and A Focus on Europe
UZMAR Workboat and Tug FactoryMEng Sadik MEMIS
Project Engineer / Marketing & Sales

The Objective
• This is an informative study of understanding the relationships between Bollard Pull, Length, Gross Tonnage, Propulsion Systems, Horse Power, Built Years of the Worldwide tug fleet and a focus on Europe
• The effects of the World economic climate on the demand for towage services
• Forecast for very large ship size

Sources
Data is collected for Terminal and Harbour Tugs from:• ETA Contribution of Members Data 2014• Marcon International, Inc. Publications, 2013• Tug Operators’ Web Data• World Trade Organisation Report, 2013• United Nations Economic and Social Commission for
Asia and the Pacific Reports, 2013• United Nations Conference on Trade and
Development Reports, 2013

Top 20 Worldwide Tug Fleets*listed by Flag

World Total HP Through Years
1996 1997 1998 1999 2000 2001 2002 2003 2004 2005 2006 2007 2008 2009 2010 2011 2012 20131,000,000
1,250,000
1,500,000
1,750,000
2,000,000
2,250,000
2,500,000
Years
Tota
l Hor
se P
ower
/ b
HP
Increase of Large Vessel Traffic due to Worldwide Sea Trade of Energy, Raw Material and Container Shipping Demand affected the TBPs over years after 2010

Worldwide Tugs by Bollard Pull vs Built Year
1970 1974 1978 1982 1986 1990 1994 1998 2002 2006 2010 20140
10
20
30
40
50
60
70
80
90
100
Built Year
Bolla
rd P
ull /
TBP
Concentration of Higher BP New Buildings Tugs after 2003 due to increasing vessel size

European Tugs by Bollard Pull vs Built Year
1970 1974 1978 1982 1986 1990 1994 1998 2002 2006 2010 20140
10
20
30
40
50
60
70
80
90
100
Built Year
Bolla
rd P
ull /
TBP
2003
The Same Pattern Exists for Europe: Increasing Vessel Size and Higher BP New Building Tugs After 2003
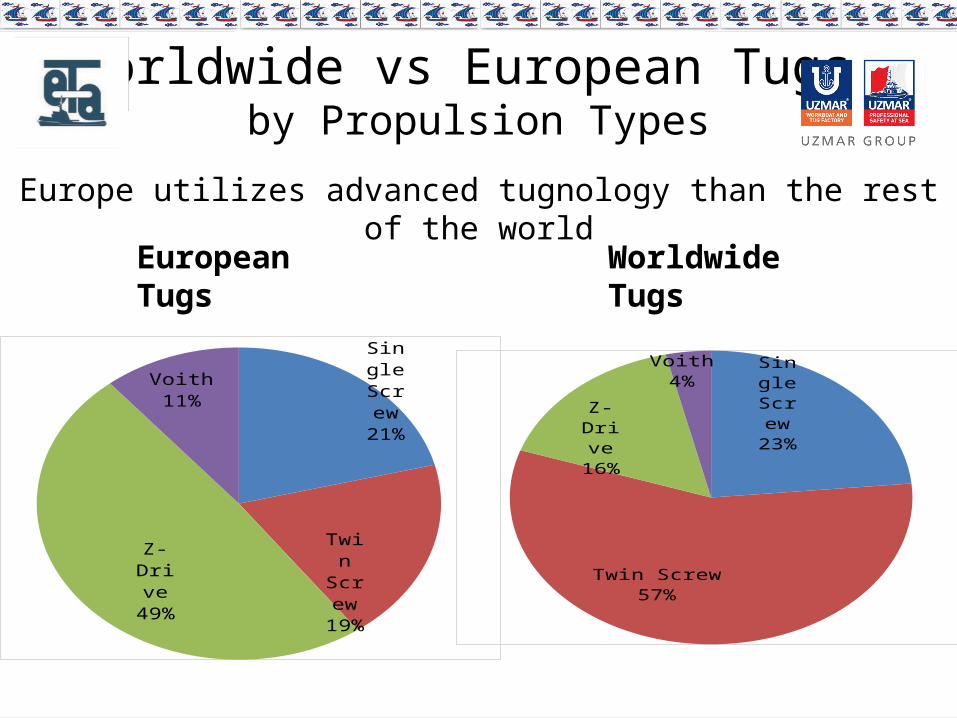
Worldwide vs European Tugs by Propulsion Types
Europe utilizes advanced tugnology than the rest of the world
Sin-gle
Screw
23%
Twin Screw57%
Z-Driv
e16%
Voith4%
European Tugs Worldwide Tugs
Single Screw21%
Twin
Screw
19%
Z-Driv
e49%
Voith11%
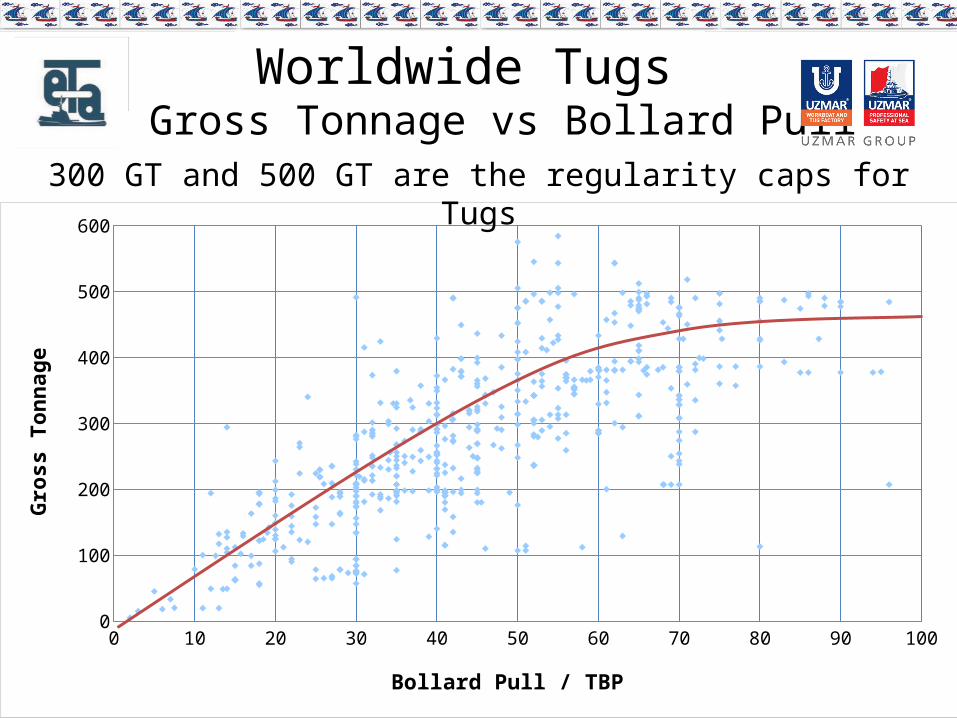
Worldwide Tugs by Gross Tonnage vs Bollard Pull
0 10 20 30 40 50 60 70 80 90 1000
100
200
300
400
500
600
Bollard Pull / TBP
Gros
s Ton
nage
300 GT and 500 GT are the regularity caps for Tugs

European Tugs by Bollard Pull vs Power & Length
0 5 10 15 20 25 30 35 40 45 50 55 60 65 70 75 80 85 90 9505
1015202530354045505560657075808590
100 bHP Linear (100 bHP) Metre
Linear (Metre)
Bollard Pull / TBP
by V
alue
s
Tug length vs BP is optimized for confined harbour areas and vessel sizes
25 m length and 30 to 45 TBP 32 m length and 60 to 75 TBP

Summary of Tug Orders by Years and Horsepower
19961997
19981999
20002001
20022003
20042005
20062007
20082009
20102011
20122013
0
50
100
150
200
250
300
350
400
450
0- 2999HP
3000-5999HP
6000-8999HP
9000 Plus HP
Years
Num
bers
0 to 2999 BHP Tugs mostly conventional and the demand for 3000 to 6000+ BHP Tugs increased since 2009 due to more frequent larger Vessels calls and partly driven by speculative orders

Worldwide Tug Deliveries by Propeller Types 2013
Conventional47%
Z-Drive51%
Voith2%
The demand for higher tugnology is increasing

Worldwide Tugs On Orders Over 299 GRT in 2013 by Building Countries
Malaysia
Vietnam
RomaniaBrazil
Indonesia USAIndia
Russia
SingaporeCuba
Serbia
UAE
Chinese TaipeiPeru
Azarb
eijan
ColombiaLib
ya
Ukraine0
102030405060708090
100110120130
Built by Country
Num
ber o
f Tug
s
Majority of new building are in Far East due to low pricing
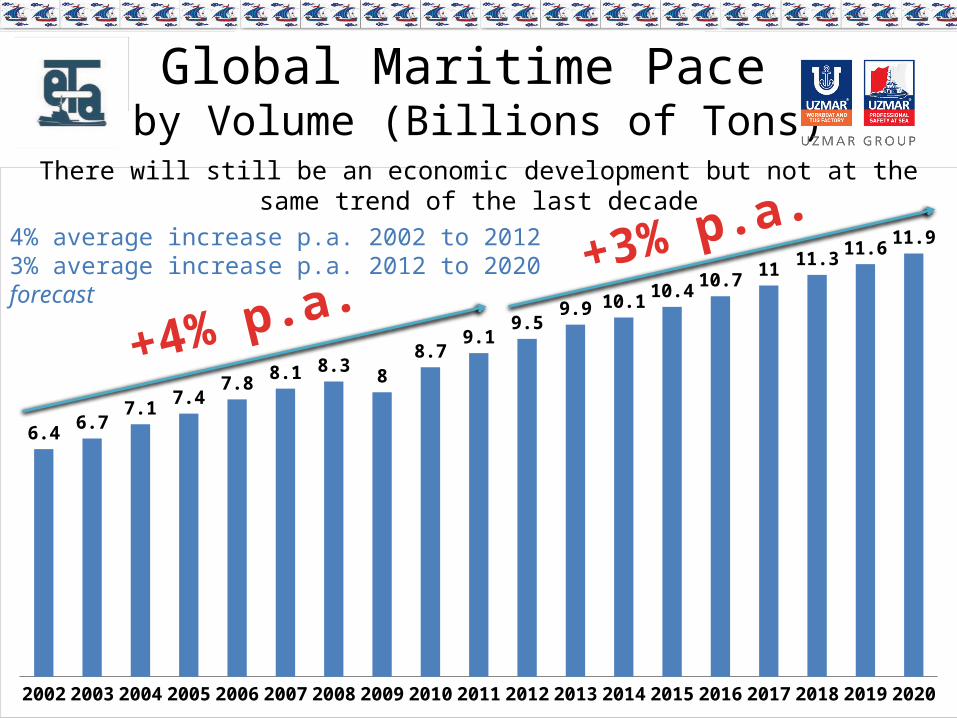
Global Maritime Pace by Volume (Billions of Tons)
2002 2003 2004 2005 2006 2007 2008 2009 2010 2011 2012 2013 2014 2015 2016 2017 2018 2019 2020
6.4 6.77.1 7.4
7.8 8.1 8.3 88.7
9.19.5
9.9 10.1 10.4 10.7 11 11.3 11.6 11.9
+4% p.a.+3% p.a.
4% average increase p.a. 2002 to 2012 3% average increase p.a. 2012 to 2020 forecast
There will still be an economic development but not at the same trend of the last decade

Container Vessel Sizes Over Years
19801982
19841986
19881990
19921994
19961998
20002002
20042006
20082010
20120
2000
4000
6000
8000
10000
12000
14000
16000
18000
20000
Years
TEU
Panama Canal Limit
Expanded Panama Canal Limit
Largest Container Ship Size
S Class 9600 TEU
E Class 15500 TEU
EEE Class 18000 TEU
+9,9% p.a.
Avarage Container Ship Size

Conclusion
• How to handle these giants?
• You need more bollard pull
and tugnology…

THANK YOUMEng Sadik MEMIS
Project Engineer / Marketing & Sales
Top Related