


Languages
Pages
Legal

wPs aqq,POLICY RESEARCH WORKING PAPER 1996
Namibia's Social Safety Net At a timen enNamibiasinformal social safety net is
failing the poor, Namibia has
Issues and Options for Reform toomarnypoorlyadministered
formal programs. The result:
Kalinidhi Subbarao regional bias, exclusion errors.and fraud. It seems highly
desirable for the formal
system to comprise four
programs: a social pension
plus grants for poor children,
blind people, and the
disabled.
The World Bank
Poverty Reduction and Economic Management Network
Poverty Division
October 1998
Pub
lic D
iscl
osur
e A
utho
rized
Pub
lic D
iscl
osur
e A
utho
rized
Pub
lic D
iscl
osur
e A
utho
rized
Pub
lic D
iscl
osur
e A
utho
rized

POLICY RESEARCH WORKING PAPER 1996
Summary findings
In Namibia, the extended family is a big shock absorber: Child allowances should relieve poverty, but the threeinformal sharing arrangements between and within main grants for needy children are heavily urban-biasedhouseholds are a unique source of strength. and regionally asymmetric. The bias toward urban andGrandparents contribute enormously to the continuation middle-class children is greatest for in-kind (schoolof this safety net by letting the entire family share their feeding and shelter/housing) programs. A priority shouldsocial pension in times of need and by looking after their be placed on reallocating public resources to upgradegrandchildren when parents are away or infected by squatter settlements and single-room apartments.AIDS. Nongovernmental organizations need to be encouraged
But these informal safety nets are not robust at times to explore demand-driven approaches to promotingof drought and are strained when unemployment, and informal businesses in rural Namibia.the burden of children of AIDS-infected parents, are Programs to subsidize welfare homes and remit renthigh. for apartments where rent is overdue should be
Among formal safety net programs, the social pension eliminated to free up resources for social pensions andand the disability grant touch the lives of the poor more disability grants. It appears best to supplement cashthan other programs, but the administration of both transfer programs by a better targeted shelter/housingprograms needs to improve. program and an expanded labor-based works program
Namibia is one of the few African countries to (implemented by private contractors).administer a social pension for everyone 60 and over - The Northern and Northeastern provinces area safety net that has potential to significantly reduce underserved by all transfer programs; coverage in thepoverty. But the program suffers from undercoverage North must improve. Further decentralization should(exclusion errors) in the heavily populated and poorer help rationalize the deployment of staff resources inNorth. social welfare.
With the disability pension, regional asymmetry ispervasive and needs immediate correction.
This paper is a product of the Poverty Division, Poverty Reduction and Economic Management Network. Copies of thepaper are available free from the World Bank, 1818 H Street NW, Washington, DC 20433. Please contact Precy Lizarondo,room MC4-568, telephone 202-458-7199, fax 202-522-3283, Internet address [email protected]. The authormay be contacted at ksubbarao(@worldbank.org. October 1998. (48 pages)
The Policy Research 'Working Paper Series disseminates the findings of work in progress to encourage the exchange of ideas aboutdevelopment issues. An objective of the series is to get the findings out quickly, evens if the presentations are less than fully polished. Thepapers carry the names of the authors and should be cited accordingly. The findings, interpretations, and conclusions expressed in this
paper are entirely those of the authors. They do not necessarily represent the view of the World Bank, its Executive Directors, or the
countries they represent.
Produced by the Policy Research Dissemination Center
Poverty Reduction and Economic Management NetworkI The World Bank
NAMIBIA'S SOCIAL SAFETY NET:ISSUES AND OPTIONS FOR REFORM
by
K. Subbarao
II

ACKNOWLEDGMENTS
This study was made possible through a collaborative effort between the NationalPlanning Commission of the Government of the Republic of Namibia, and the CountryOperations Department (Southern Africa 1) and the Poverty Group of the PREMNetwork of the World Bank.
I wish to express my gratitude to the Government of the Republic of Namibia forits support and cooperation in providing information and data reviewed in this study. Inparticular, special thanks go to Ms. Sarah Kuugongelwa, Director-General and Mr.Andrew Ndishishi, Permanent Secretary, of the National Planning Commission forfacilitating my work. This study would not have been possible without the unfailingsupport and assistance of Ms. Sylvia Hamata of the National Planning Commission.Mr. Michaell Kafidi organized the field trips.
I have benefited from discussions with a number of officials of the variousMinistries, researchers at the National Economic Policy Research Unit, the Social SciencesDivision of the University of Namibia, the UNDP, bilateral donors, NGOs and severalinterviewees during the field trips who generously spared their time. I am especiallyindebted to A. Weerasinghe of the Central Statistical Organization for retabulating someof the data of the Household Income and Expenditure Survey.
I am grateful to Brian Levy, Bert Hofman, and Dominique van de Walle for helpfulcomments and suggestions. Precy Lizarondo has processed the draft.

NAMIBIA'S SOCIAL SAFETY NET: ISSUES AND OPTIONS FOR REFORM
Table of Contents
Executive Summary ............. i
I. Introduction ........ ,.,.,,.1
Scope and Limitations of the study ..
II. Namibia's social safety net: An Overview , , ,...2
A. Informal safety net .3
B. Formal transfers .6
III. Transfers Without a Work Requirement ................................. 8
A. Social pensions ............................... 8
B. Disability pensions .............................. 17
C. Child and family allowances .............................. 18
D. Other subsidies .............................. 23
E. Social Assistance Transfers: A Summary .............................. 25
IV. Shelter/Housing ................................... 28
V. Social Security (Insurance) .............. .................... 30
VI. Transfers with a Work Requirement ................................ 31
A. Food- or Cash-for-Work Programs .................................. 31
B. Labor-based works programs ............................. 33
C. Microcredit/Informal Sector Activities ............................ 35
VII. Decentralization and transfer programs ............ .. .................. 37
VIII. Reform Options and Recommendations . . ............................ 40
References ... 45

Executive Summary
In Namibia, the extended family is a big "shock absorber": informal sharing
arrangements between and within households are Namibia's unique source of strength.
Grandparents contribute enormously to the continuation of this safety net by letting the
entire family share their social pension in times of need, and by looking after their
grandchildren while parents are away or are AIDS-infected. Yet, these informal safety
nets are not robust during periods of drought, and are strained in normal times due to the
high levels of unemployment and the growing burden of children of AIDS-infected
parents.
Of all the formal safety net programs, the social pension program and the disability
grant touch the lives of the poor more than other programs. Namibia is one of the few
countries in Africa to administer a social pension program for every individual after
attaining the age of 60: a formal safety net with significant poverty-reducing impacts.
However, the current operation of the program suffers from an under-coverage (exclusion
errors) in the heavily populated and poorer North. As for the disability pension, the
regional asymmetry is pervasive and needs immediate correction. The beneficial impacts
on the poor can be significantly enhanced by better administration of both programs.
Of the remaining cash transfer programs, child allowances are important from the
perspective of poverty relief. However, the three main grants for needy children also
suffer from regional asymmetry and are heavily urban-biased. The pro-urban and -middle
class bias appear highest for in-kind programs, viz., school feeding programs and
shelter/housing programs. Upgradation of squatter settlements and single-room
apartments, and provision water and sanitation facilities are a priority; public resources
need to be reallocated to these programs of direct relevance to the rural poor.
The country has many other transfer programs including subsidization of welfare
homes and remission of rent for apartments with overdue rents. The impact of these
programs on poverty appears at best dubious. Elimination of these programs will release
the administrative resources needed to implement social pensions and disability grants
more effectively. The resource savings may contribute to overall fiscal sustainability of
programs.
The Northern and North-eastern provinces are considerably underserved by all
transfer programs. At the same time, the administrative cost has sharply increased in the
recent period. Some redeployment of staff may be necessary to implement the programs
effectively and also to save on administrative costs. The ongoing decentralization efforts
should provide an opportunity to bring about a more rational deployment of staff
resources of the Directorate of Social Welfare than at present.
Of the programs with a work requirement, the labor-based works program is of
considerable importance for the country. At present, only a meager amount of resources
is devoted to this program. In comparison with equipment-based programs for similar
ii

activities, the labor-based program appears to be both technically and economically
feasible in Namibia. On a priority basis, attention needs to be devoted to enhancing the
capacity to implement and manage these programs.
The principal conclusion of this study is while the informal safety net is unable to
cope with the increasing demands, the formal programs are too many and poorly
administered. The result: pervasive regional asymmetry, exclusion errors and fraud. To
enhance the potential for poverty reduction in a fiscally sustainable manner, the programs
need to be reduced to four basic programs-a social pension, a disability grant, a blind
person grant, and a child maintenance grant. The programs' coverage of the rural North
needs to be improved. The cash transfer programs need to be supplemented by a better
targeted shelter/housing program, and an expanded labor-based works program
(implemented by private contractors). To promote informal businesses in rural Namibia,
the potential for demand-driven approaches needs to be explored by encouraging the
ongoing efforts of non-governmental organizations.
iii

NAMIBIA'S SOCIAL SAFETY NET: ISSUES AND OPTIONS FOR REFORMby
K. Subbarao
I. Introduction
1. Namibia has inherited a strongly dualistic economy and society. Extreme
inequality between ethnic (racial) groups and language groups is a unique characteristic of
Namibia. Yet, poverty and vulnerability in Namibia is somewhat similar to other African
countries: a high incidence of poverty in rural areas and, sharp rural-urban income
differentials, a high prevalence of female-headed households, high levels of unemployment
and urban migration, and a growing burden of children of AIDS-infected parents. An
ungenerous agro-climatic environment (over 92 percent of the country is arid or desert)
contributes to inter- and intra-year fluctuations in income (welfare) and renders a
permanent escape from poverty difficult for most households.
2. To alleviate poverty, the Government of Namibia has emphasized, inter alia,
income-support programs of various kinds including social pensions for the elderly and the
disabled, a variety of grants for children, labor-based works programs, and shelter and
housing programs. Notwithstanding the range of programs and a large amount of
resources devoted to their implementation, there has been no empirical overview of
programs and their poverty- and inequality-reducing impacts. This paper fills this gap.
Scope and Limitations of the study.
3. While the paper covers all the major cash and in-kind programs and programs
with a work requirement, the principal limitation of the study is that it is based on
secondary sources of information. The only primary source -- the Household Income and

Expenditure Survey -- has some information on social pensions. However, this
information is not reported in such a way as to facilitate an estimation of the severity of
poverty with and without the transfer. Most administering offices do not collect
information on beneficiary profiles so that it is difficult to assess the distributional impacts
of transfers. Even at the aggregate level, while budgeted numbers are available, there is a
large time gap in the collection and reporting of data on actual numbers. Despite these
difficulties and data gaps, an effort has been made to use all available information and
identify the main iissues.
4. This paper is organized as follows. Section (II) provides an overview of publicly-
funded programs and informal safety nets. The cash transfer programs are reviewed in
section III, shelter and housing programs in section IV, social security programs in
Section V and programs with a work requirement in section VI. The implications on the
proposed decentralization for program delivery are examined in section VII. The main
recommendations are summarized in the last section.
II. Namibia's social safety net: An Overview
5. Figure I presents the prevailing formal and informal safety nets in Namibia. A
variety of informall sharing arrangements within and between households exist in Namibia.
Formal safety nets consists of four categories: cash transfers administered by the
Department of Social Welfare, a school feeding program administered by the Ministry of
Basic Education and Culture, a shelter/housing program administered by the Ministry of
Local Government and Housing, and a social security program for formal sector workers
administered by the newly created Social Security Commission. Transfers with a work
2

requirement comprise of food- or cash-for-works programs usually administered during a
drought year, labor-based works program administered at all times, and microcredit
programs.
A. Informal safety net.
6. As with other countries of Africa, family and/or community-based informal sharing
arrangements constitute the most pervasive safety net in the country. According to the
Household Income and Expenditure Survey (1993-94), over 50 percent of households are
extended families;' and about 10 percent of households have non-relatives as household
members.
7. An important function performed by extended families is taking care of children
usually by grand-parents while parents are either away in urban areas in income-earning
activities, or are AIDS-affected. Disabled children are especially looked after by grand-
parents. While no monetary value can be placed on this function, it is worth stressing that
in its absence the overall poverty situation, especially of children, would have been much
worse.
An "extended family" is defined as one which includes at least one of the following categories: ownchildren's spouse. children's children, parents (including spouse's parents) or other relatives.
3

Figui-e 1.
NAMIBIA'S SOCIAL SAFETY NET
INFORMAL FORMAL, PUBLICLY-FUNDED
_ _ _ _ _ _ _ _ _ v+ 4| Family and/ or community- Transfers without |h|lTransfers with |ter, Social Security
based sharing arrangements a work reuirement work requirement housi (contributory; only tothose in the fonmal sector)
* Child care (usually by grand- . Social pension . Food for works . Build together * Existingparents) * War veterans pension (temporary) * Low-cost
* Taking care of orphaned/ * Blinds person's grant a Labor-based works housing Death! retirement benefitdisabled/ AIDS affected . Disability grant program (regular) a Resettlement Maternity leavechildren . Maintenance grant * Upgrading Sick leave
* Sharing of food (reciprocal) * Foster parent informalGifts at weddings, funeral allowance settlements * Plannedcosts (reciprocal) * Place of safety grant
* Interest-free loans from * Subsidies to welfare National Pension Fund (to payrelatives/ neighbors organizations(institut old age pensions to all those
ional care) registered)* Remission of rent* Free school meals* Free distribution of
food (in year ofdrought)
4

8. How well do the informal arrangements function during a crop failure? This
question is important because as already noted, over 90 percent of Namibia is arid/desert
or drought-prone. An analysis of coping strategies in two drought-prone areas during the
1992 drought suggests that the informal support systems are not robust or resilient to
drought conditions (T. Naeraa et. al., 1993). This is not a surprising finding, since all
households in a given region face declining incomes under drought conditions, thus
restricting the scope for informal sharing (especially of food). In a drought situation, not
only do formal cash transfers (especially social pensions) assume critical importance, but
more frequently these are converted into informal transfers through a redistribution within
households. Grand parents spending their pension on school fees of grand children is one
such common redistributive practice within households. Paradoxical as it may appear, in
a drought situation, the most vulnerable households are those without any single
vulnerable group (such as the elderly).
9. Some of the informal transfers are reciprocal -- gifts at weddings, contributions to
the cost of funerals, and interest-free loans from relatives and neighbors. T. Naeraa et. al.
note that in eastern Caprivi, every month or so a family member would send the needy
family money or food such as a bag of maize meal. Unfortunately, the totality of informal
transfers are not captured in the Household Income and Expenditure Survey (1993-94).
However, it is possible to document the role of one major informal transfer, viz.,
remittances received from family members employed in the formal economy. The
Household Survey confirms the role of cash remittances (Table 1). A higher proportion of
urban households (6 percent) depended mainly on cash remittances than rural households
5

(3 percent). A much higher proportion of households in Erongo, Kunene, Hardap, and
Ohangwena seem to depend on cash transfers as their main source of income than
households in other regions, suggesting a high outmigration of adult men and women to
urban areas for work. Income inequality ratios (Ginis) with and without private cash
remittances were estimated; there appears to be no significant difference implying that
while private cash remittances may be critical for the poor, their role in inequality-
reduction is miniimal.
B. Formal transfers.
10. From the perspective of impacts on the poor, by far the most important formal
transfer is the social pension. All individuals who have crossed 60 years of age receive a
pension of N$160 per month. A number of cash transfers are available for other
vulnerable groups including the disabled, orphaned children, and other children in need.
Institutions taking care of the elderly receive a subsidy; housing apartments with defaulters
are compensated by a remission of defaulted rent, and abused children are placed in
custody of other families which are provided with a "place of safety grant".
11. Provision of shelter and housing has been given prominence in public policy since
Independence. The country's "Build Together" program has won many international
Awards as an exaLmple of joint efforts of government and communities to build affordable
housing. Upgrading of informal squatter settlements -- a legacy of apartheid -- is also
stressed. Much of this activity is driven by concessional loans by the government.
6

Table 1: Households By Main Source of Income, Region and Rural/Urban Areas,1993-94
Region Main Source Of Income TotalSubsistence Wages in Business Pensions Cash
farming cash RemittancesCaprivi Number 7,580 5,506 870 2,022 906 16,884
% 45 33 5 12 5 100Erongo Number 418 12,092 462 1,885 1,690 16,611
% 3 73 3 11 10 100Hardap Number 228 8,573 851 1,980 889 12,521
% 2 68 7 16 7 100Karas Number 268 7,885 810 2,010 474 11,545
% 2 68 7 17 4 100Khomas Number 87 28,049 2,921 1,907 1,137 34,101
% 0 82 9 6 3 100Kunene Number 2,350 4,510 1,476 1.341 670 10,398
% 23 43 14 13 6 100Ohangwena Number 18,209 1,544 587 3,796 1,437 25,574
% 771 6 2 15 6 100Okavango Number 13,099 4,737 737 1,308 514 20,394
% 64 23 4 6 3 100Omaheke Number 1,724 4,761 631 1,717 324 9,157
% 19 52 7 19 4 100Omusati Number 17,071 2,156 507 1,942 84 21,822
% 78 10 2 9 0 100Oshana Number 13,364 6,169 1,739 2,141 774 24,198
% 44 25 7 9 3 100Oshikoto Number 9,788 4,427 531 3,483 503 18,795
% 52 24 3 19 3 100Otjozondjupa Number 863 16,953 1,785 2,971 1,155 22,827
% 4 74 8 9 5 100NAMIBIA Number 85,050 107,362 13,909 27,602 10,556 244,827
% 35 44 6 11 4 100Rural Number 83,382 43,474 7.357 21,990 5,421 161,962
% 51 27 5 14 3 100Urban Number 1,668 63,889 6,551 5,612 5,135 82,864
% 2 77 8 7 6 100Note: There is a small group "Other" of the variable "Main Source of income" representing 0.1 % of the households.This group is not presented in the table.Definition:Region and ruraVurban: See table 3.1Main source of income: The classification of the households mi main source of income is based on the answer to thequestion "What is the main source of income of this household i.e. what is most important for the well-being of theentire householdT'Source: Living Conditions in Namibia (1996), Central Statistical Organization.
12. A program of social security covering death/retirement benefit, maternity leave and
sick leave has been introduced, and a Social Security Commission was established. It is a
7

contributory program, and as of now there has been no commitment of government (tax-
payer) funds. It is largely targeted to workers in the formal sectors, though the self-
employed are welcome to join.
13. Of the transfers with a work requirement, food-for-works and/or cash-for-works
have been the dominant programs during periods of drought. More recently, a labor-
based works program has been in operation on an experimental basis in the North.
However, pure transfer programs administered by the Department of Social Welfare
account for over 90 percent of total spending.
III. Transfers Without a Work Requirement
A. Social pensions.
14. Without doubt, social pensions contribute significantly to household income and
poveity reduction (Morgan, 1991). According to the Household Income and Expenditure
Survey (1993-94), social pensions are the main source of income for 14 percent of rural
households, and 7 percent of urban households (Table 1). Even for the households with
subsistence farming as the main source of income (35 percent of total households), the
contribution of pensions at margin is substantial. For well over half of the population of
Namibia, most of whom are poor, social pension constitutes an indispensable source of
household income.
15. Pension level. Prior to Independence, whites received a pension of R382 per
month whereas 90 percent of blacks received a minimum pension of R55. During the
post-Independence period, pensions were equalized and the minimum was at N$135 per
month in 1994, which was roughly adjusted for inflation to the present level of N$160. In
8

1991, N$92 per month was estimated as sufficient to support fully the nutritional
requirements of three adults (Morgan, 1991): a notional food poverty line. At 1996 July
prices, this works out to N$154. A pension of N$160 is thus sufficient for a family of
three to stay above the poverty line2.
16. Exclusion and inclusion errors. The program, however, suffers from several
shortcomings. First, the coverage, defined as persons actually receiving pensions as
percent of eligible pensioners, is now 88 percent for the country as a whole. Regional
break-up of the distribution of eligible persons and those actually receiving pensions is not
available for any recent year. In order to know the regional distribution of exclusion
errors, the data from the Household Income and Expenditure Survey were retabulated.3
Persons (households) receiving pensions -- whether or not as the main source of income --
are shown as percentage of total number of persons 60 years or older in the survey (Table
2). For the country as a whole, only about half of eligible sample households actually
received a pension. It is worth noting that the survey year was 1993 and the situation has
clearly improved since then. However, the regional variations in coverage are of some
interest. The coverage of eligible households ranged between 30 to 45 percent in the five
Northern provinces -- the lowest in the country. Even if total coverage has improved, it
is quite possible that the exclusion errors continue to plague the Northern provinces. One
of the reasons for inadequate coverage of the poor in the North is that the regional
2 This does not necessarily imply that the pension is generous. The sociology of rural Namibia suggeststhe preponderance of extended families, typically of a size exceeding 5, with only one earning member.For nearly 20 percent of families, social pension is the only source of income.3 With the permission of the National Planning Commission, I have accessed the Household Income andExpenditure Survey. All the retabulations. Ginis, and some minor ratios were done with generous help ofMr. Weerasinghe of the Central Statistical Organization.
9

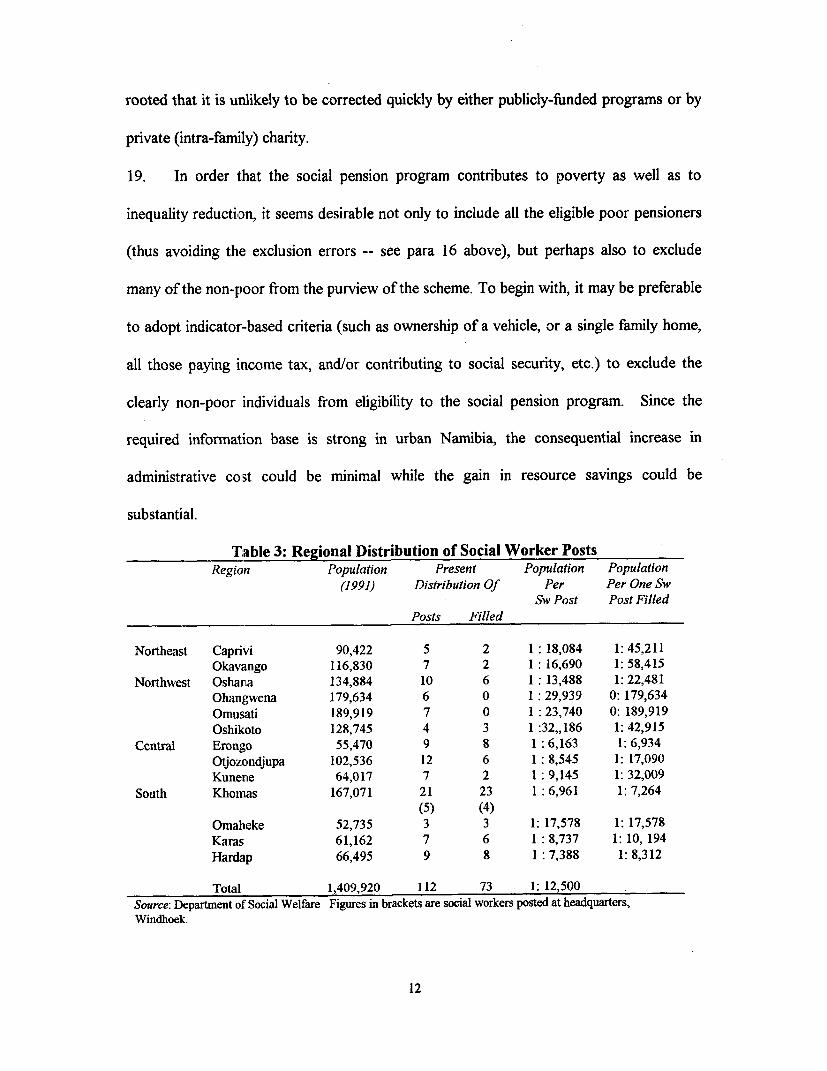
distribution of social workers -- the officials responsible for ensuring the coverage of
eligible pensioners -- is more favorable in the South than in the Northern provinces (Table
3). In the Khomas (Windhoek Region), one social worker posted serves a population of
7,264 whereas in Omusati, with a population of about 182,000, not a single social worker
was posted. In Okavango, two social workers were filled instead of the seven sanctioned
so that one worker looks after a population of about 60,0004. As of mid-1997, there were
31 unfilled social worker posts in the Northern regions, and just 9 in the remainder of the
country. Considering that the North accounts for disproportionately large numbers of the
poor, the overall poverty-reducing impact of social pensions is thus muted.
17. Because the program is universal, most elderly non-poor individuals especially in
urban Namibia also receive social pensions. Moreover, the relatively well-educated,
urban-based and rnon-poor individuals are better aware of the procedures and paper work
(see below) required to draw the social pension. About a half of the 90,000 pensioners
may be regarded as non-poor. According to the Department of Social Welfare, non-
receipt of social pension for the well-off pensioners is an unlikely event.
4 A simple linear regression analysis yielded the following results:Y (% receiving social pensions) = 6.25-0.00018* Population per one social worker post filled.
(-2.2.)*Coefficient significant at 5% level; adjusted R2 0.26.
10

Table 2: Social Pensions: Regional Variations in CoverageRegion No. ofpersons Persons receiving Col. 3 as % of
60 years or older social pension Col. 2(1) (2) (3) (4)
Caprivi 3,616 2,343 64.8Erongo 4,457 3,204 72.0Hardap 4,347 3,395 78.1Karas 4,262 3,227 75.7Khomas 5,703 3,744 65.6Kunene 3,609 1,829 50.7Okavango 16,740 6,442 38.5Omaheke 4,412 2,629 60.0Omusati 12,031 4,093 34.0Oshana 10,508 3,248 30.9Oshikoto 10,605 5,145 48.5Otjozondjupa 6,031 2,896 48.0Namibia 91,496 44,036 48.1Retabulated from the Household Income and Expenditure Survey, 1993-94.
18. If all the non-poor pensioners are reached, and if we generously assume that a
maximum of about 70 percent of poor pensioners are covered, then the program as a
whole may not be contributing to a reduction of inequality, though still certainly playing a
poverty-reducing role. To verify this proposition, the data of the Household Income and
Expenditure Survey were retabulated, and Ginis of household incomes with and without
pensions are estimated. There appears to be virtually no difference between the Lorenz
curves (Figure 2). While the Gini inclusive of pensions is 0.69, the Gini without pensions
is 0.701, implying that the current design and implementation of the social pension scheme
is not contributing to a reduction in inequality. Interestingly, the income/welfare position
of those relying heavily on cash remittances (Gini, mean income) is about the same as
those relying on social pensions. However, neither private cash remittances nor social
pensions are contributing much to a reduction of inequality. What this means is that
Namibia's income inequality-driven fundamentally by social/ethnic forces-is so deep-
11
rooted that it is unlikely to be corrected quickly by either publicly-funded programs or by
private (intra-family) charity.
19. In order that the social pension program contributes to poverty as well as to
inequality reduction, it seems desirable not only to include all the eligible poor pensioners
(thus avoiding the exclusion errors -- see para 16 above), but perhaps also to exclude
many of the non-poor from the purview of the scheme. To begin with, it may be preferable
to adopt indicator-based criteria (such as ownership of a vehicle, or a single family home,
all those paying income tax, and/or contributing to social security, etc.) to exclude the
clearly non-poor individuals from eligibility to the social pension program. Since the
required information base is strong in urban Namibia, the consequential increase in
administrative cost could be minimal while the gain in resource savings could be
substantial.
Table 3: Regional Distribution of Social Worker PostsRegion Population Present Population Population
(1991) Distribution Of Per Per One SwSw Post Post Filled
Posts Filled
Northeast Caprivi 90,422 5 2 1: 18,084 1: 45,211Okavango 116,830 7 2 1:16,690 1: 58,415
Northwest Osharna 134,884 10 6 1:13,488 1: 22,481Ohangwena 179,634 6 0 1: 29,939 0: 179,634Omusati 189,919 7 0 1: 23,740 0: 189,919Oshikoto 128,745 4 3 1 :32,,186 1: 42,915
Central Erongo 55,470 9 8 1: 6,163 1: 6,934Otjozondjupa 102,536 12 6 1: 8,545 1: 17,090Kunene 64,017 7 2 1: 9,145 1: 32,009
South Khomas 167,071 21 23 1: 6,961 1: 7,264(5) (4)
Omaheke 52,735 3 3 1: 17,578 1: 17,578Karas 61,162 7 6 1: 8,737 1: 10, 194Hardap 66,495 9 8 1: 7,388 1: 8,312
Total 1,409,920 112 73 1: 12,500Source: Department of Social Welfare Figures in brackets are social workers posted at headquarters,Windhoek.
12

Figure 2: Lorenz curve of the incomes of theindividuals with and without pensions
1.00
0.80
u 0.40
0.20
0.001 8 15 22 29 36 43 50 57 64 71 78 85 92 99
Population (%)
All income Income without pension
Source: Derived from Household Income and Expenditure Data, 1993-94.
20. Fraud One problem duly recognized by the program administrators is fraud.
Instances of children and grandchildren drawing pensions of parents and grandparents long
dead is not infrequent. The pensioner can always authorize some one else to receive the
pension on his behalf. After the demise of the pensioner, the authorized person continues
to draw the pension. Even when no such authorization exists, it has been found that
people routinely bring the identification cards of deceased persons and draw pension. It is
difficult to check such fraud especially when the cash payment points are over-crowded
(see below).
21. Inefficient administration and transaction costs to recipients. Most pensioners in
rural Namibia do not have Bank accounts; so cash needs to be carried closer to
households. In the past, carrying huge amounts of cash to villages has created problems
including robbery, misappropriation, etc. To overcome this problem, the Department has
privatized cash distribution in some provinces by hiring Cashmaster Payment Services
13

(CPS), a private company. But this has created new problems. The CPS would typically
economize on the number of distribution points so that pensioners have to travel long
distances -- often incurring substantial transport costs -- to the distribution point.4 The
number of pay lpoints were reduced with the implementation of the new CPS system.
Very old and/or handicapped pensioners and single women looking after young
grandchildren, are particularly at a disadvantage.
22. The procedures for registration are also complex and documentation-intensive.
Those wishing to claim the pension have to submit a birth certificate and a certificate of
Namibian citizenship. Many pensioners experience difficulties in registering themselves
because they do not possess birth certificates nor IDs; quite a few of them are very old and
immobile, physically disabled or otherwise unable to travel long distances to obtain the
necessary documents. The computer verification by the CPS paymasters has also created
problems because some pensioners found their names missing due to system faults but
when the problems were rectified, they were not paid for the missed pensions. Insisting on
both an ID and also on computer verification appear to be an "overkill": it creates
obstacles for genuine pensioners to draw pensions without necessarily preventing
fraudulent claims. Thus the actual functioning of the system is imposing considerable
transaction costs to the recipients.
23. Cost-effectiveness. The budget document for the Department Social Welfare
provide information separately for the amount of transfers (pensions and child
4Field visit to the North has confirmed that many pensioners travel distances of 50 to 100 kms incurringconsiderable transportation charges. The real value of the pension (net of transport costs) is often muchlower than the nominal value of N$160. Some pension distribution points serve as many 1,500pensioners, resulting in overcrowding, long queues and delays.
14

maintenance grants), and total cost of administration which includes staff costs, transport,
etc. We have used these numbers to estimate the cost of administration (as defined above)
as percent of the value of the transfer. We have not been able to estimate these
exclusively for social pensions. Pensions account for 90 percent of the total budget of the
department; we adjusted the costs proportionately.5
24. Prior to entering into a contract with the CPS, i.e., for the year 1995, the
administrative cost of the program amounted to 7 percent of the value of the pension -- a
modest percent by international standards. In other words, for every N$160, about N$11
were spent on the cost of delivery. But the situation has dramatically changed following
the hiring of CPS. The actual number of pensioners reached is not available for 1996-97.
Assuming that all the eligible pensioners were reached -- a clearly unrealistic assumption -
- the administrative cost would have jumped to 14 percent during 1996-97. But if only as
many pensioners were served in 1996-97 as in the previous year -- a more realistic
assumption -- the cost would have amounted to 36 percent of the value of the transfer.
The reason for the sharp escalation of cost appears to be that even after the privatization
of the actual cash distribution function, there has been no contraction of the staff of the
Department.
25. Universal coverage andfiscal sustainability. Can the social pension scheme be
fiscally sustainable over the medium-run in its present form as a universal entitlement for
all those who have reached the age of 60? According to the population projections of the
National Planning Commission, the number of the elderly is likely to grow at 0.8 percent
per year over the period 1995-2005. In other words, over 800 persons will be added each
5 This adjustment is unlikely to significantly alter the argument/numbers discussed here.
15
year to the number of recipients of the social pension, costing the government an
additional N$1.54 million per annum. The rate of increase in the pension budget of the
Directorate would be 0.8 percent per annum. During 1996-97, the social pension program
alone costed the government 3.7 percent of total budgetary expenditure. The current
projections of the government show that by 31st March, 1998, total government
expenditure may exceed own revenues by 12.1 percent. Considering the potentially
worsening budget deficit situation, an annual rate of increase in the pension budget of 0.8
percent does not appear to be fiscally sustainable.
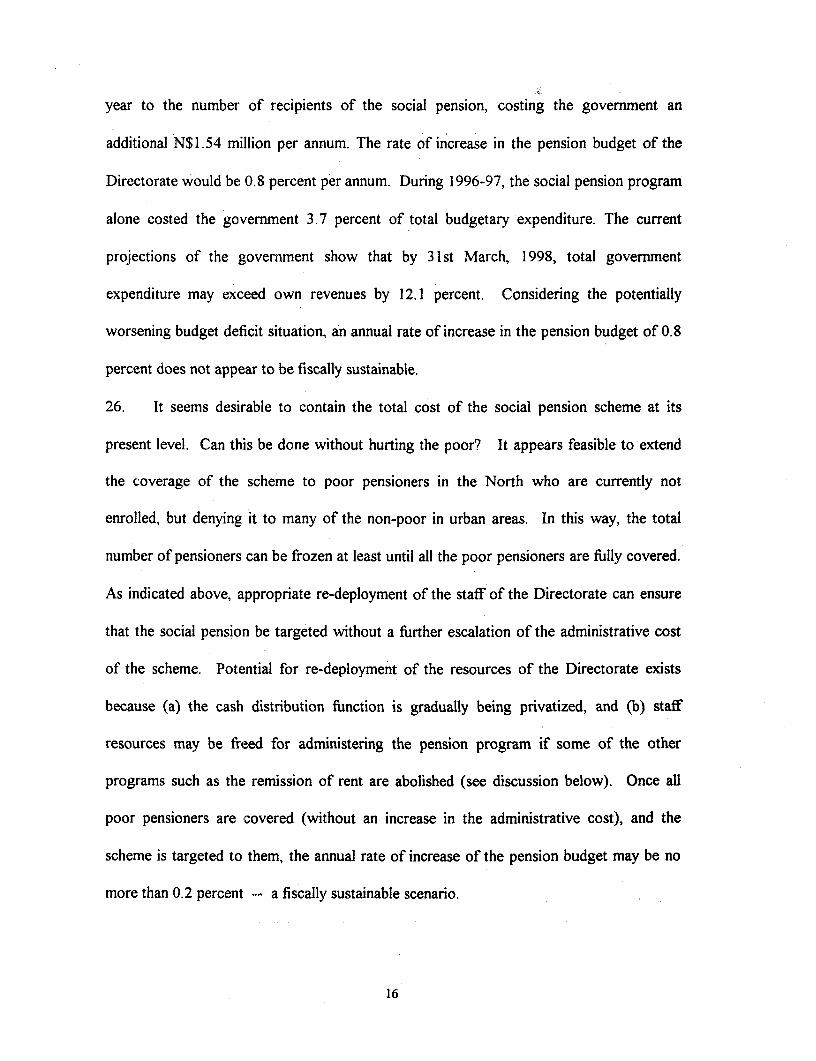
26. It seems desirable to contain the total cost of the social pension scheme at its
present level. Can this be done without hurting the poor? It appears feasible to extend
the coverage of the scheme to poor pensioners in the North who are currently not
enrolled, but denying it to many of the non-poor in urban areas. In this way, the total
number of pensioners can be frozen at least until all the poor pensioners are fully covered.
As indicated above, appropriate re-deployment of the staff of the Directorate can ensure
that the social pension be targeted without a further escalation of the administrative cost
of the scheme. Potential for re-deployment of the resources of the Directorate exists
because (a) the cash distribution function is gradually being privatized, and (b) staff
resources may be freed for administering the pension program if some of the other
programs such as the remission of rent are abolished (see discussion below). Once all
poor pensioners are covered (without an increase in the administrative cost), and the
scheme is targeted to them, the annual rate of increase of the pension budget may be no
more than 0.2 percent -- a fiscally sustainable scenario.
16
B Disability pensions.
27. About 3 percent of the population of Namibia (44,000) are persons with
disabilities. The Government programs include rehabilitation, disability prevention, and
logistical and financial support. The Department of Social Welfare administers the
pension scheme for the disabled and the blind person's grants.
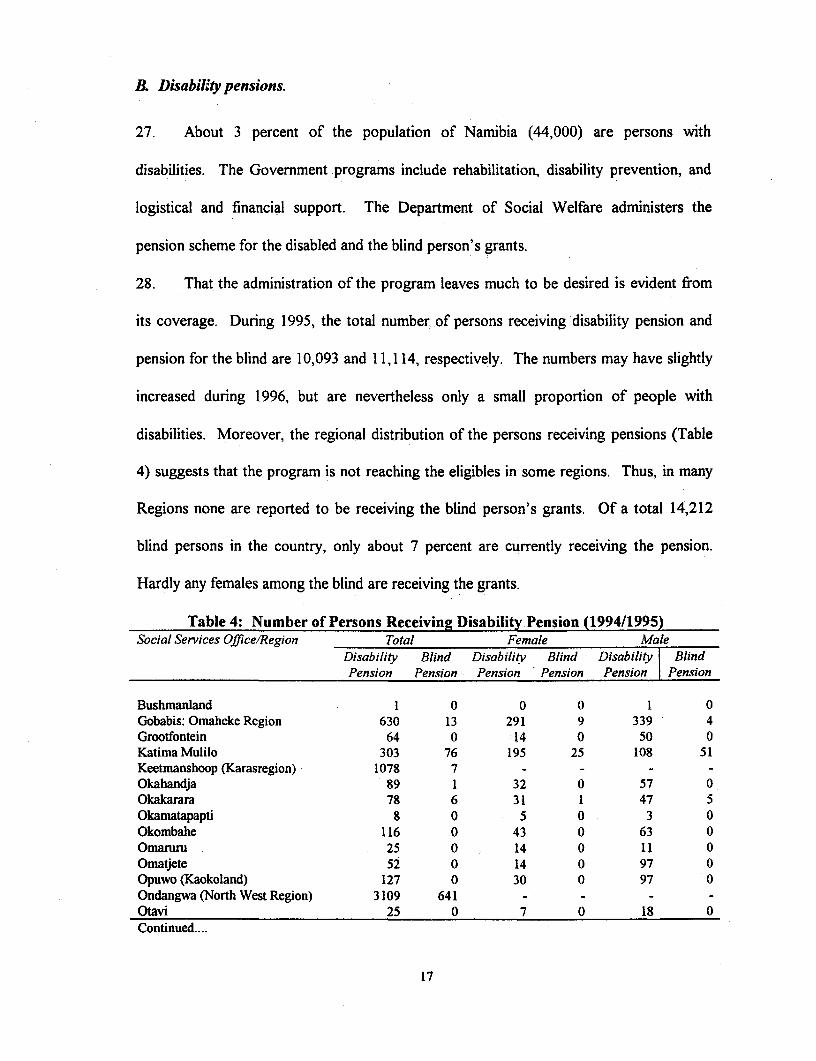
28. That the administration of the program leaves much to be desired is evident from
its coverage. During 1995, the total number of persons receiving disability pension and
pension for the blind are 10,093 and 11,114, respectively. The numbers may have slightly
increased during 1996, but are nevertheless only a small proportion of people with
disabilities. Moreover, the regional distribution of the persons receiving pensions (Table
4) suggests that the program is not reaching the eligibles in some regions. Thus, in many
Regions none are reported to be receiving the blind person's grants. Of a total 14,212
blind persons in the country, only about 7 percent are currently receiving the pension.
Hardly any females among the blind are receiving the grants.
Table 4: Number of Persons Receiving Disability Pension (1994/1995)Social Services Office/Region Total Female Male
Disability Blind Disabilitv Blind Disability BlindPension Pension Pension Pension Pension | Pension
Bushmanland I 0 0 0 1 0Gobabis: Omaheke Region 630 13 291 9 339 4Grootfontein 64 0 14 0 50 0Katima Mulilo 303 76 195 25 108 51Keetmanshoop (Karasregion) 1078 7 - - - -Okahandja 89 1 32 0 57 0Okakarara 78 6 31 1 47 5Okamatapapti 8 0 5 0 3 0Okombahe 116 0 43 0 63 0Omanuu 25 0 14 0 11 0Omatjete 52 0 14 0 97 0Opuwo (Kaokoland) 127 0 30 0 97 0Ondangwa (North West Region) 3109 641 - -Otavi 25 0 7 0 18 0Continued....
17

Cont... Table 4: Number of Persons Peceiving Disability Pension (1994/1995)Social Services Office/Region Total Female Male
Disabilitv Blind Disabilitv Blind Disability BlindPension Pension Pension Pension Pension Pension
Otjimbingwe 88 0 30 0 58 0Otjituuo 41 2 25 0 27 0Otjiwarongo 165 0 67 0 98 0Outjo 115 1 43 0 72 1Rehoboth 832 18 - - - -
Rundu 801 234 - - - -Tsumeb 125 0 0 0 2 0Tsumkwe 2 0 0 0 2 0Windhoek 2219 22 - - - -TOTAL 10093 1021 887 35 1141 61
Source: These numbers were made available by the Social Pension Office Windhoek, as cited in Barbro-IsabelBruhns et al (1995).
29. Even those registered for pension seem to be experiencing difficulties in actually
receiving it (Barbro-Isabel Bruhns, et. aL 1995). Researchers have noted numerous
problems, including rnost importantly the fact that the pay procedures are so complex that
a "lot of money disappears and is very difficult to trace" (page 55, op. cit.) Information
about the procedures for registration and payment are not known to many eligible persons.
After a careful analysis of the situation based on extensive field work, Barbro-Isabel
Bruhns et al. (1995) note that "a clear policy and well-distributed information on
disability pension is needed." (page 56).
C Child andfamily allowances.
30. Namibia has three grants targeted to children: maintenance grant, foster parent
grant, and place of safety grant. All the three grants are administered by the Department
of Social Welfare.
18

31. Maintenance grant consists of a parent's grant (N$160) and a children's grant
(N$60 per child for the first three children). Parent's grant is given only to single women
who either have never been married, or are divorced, or widowed or has been deserted by
her husband for a period of 3 months or longer; or to women whose husband is in receipt
of a social pension; or whose husband has been certified to be unfit for remunerative work,
or is imprisoned. However, for unclear reasons, a parent's grant is not payable to a
woman who is in receipt of a social pension. It is means-tested inasmuch as the parent's
income should not exceed N$500 per month. No children's grant is payable to any parent,
unless such parent is a woman placed in the circumstances described above, or a man who
is in receipt of a social pension. Several supporting documents are needed, including birth
certificate, marriage certificate, school report, death certificate, etc.
32. The regional distribution of the beneficiaries (Table 5) suggests that very few
children in the North are receiving these grants, whereas Khomas (Windhoek) accounts
for a disproportionately large number of beneficiaries. It is difficult to analyze the
distributional/ethnic or racial incidence of these grants owing to data constraints. It is
clear, however, that the majority of Namibians are not even aware of these grants (just one
child/parent receiving it in Okavango). These grants can be extremely helpful for single
women with young children especially in poor regions of the North. In practice, most
rural and uneducated women are unable to furnish written proofs and a variety of
documents. Enormous delays are common.6 Not surprisingly, at present the grants
appear to be availed of by the urban middle class and the rich. A particularly worrisome
feature is that the child maintenance grants were not reaching adequately the most needy
6 During the field visit. women complained about delays ranging from 18 to 24 months.
19

group (but not necessarily "eligible" by current laws): grandparents looking after children
of AIDS-affected parents, or those looking after the disabled children. This is a unique
informal safety net, and deserves to be strengthened by child maintenance grants and by
suitable modification of the laws and effective implementation.
33. Foster parent grants are given to any person who undertakes the temporary care
of any child who has been placed in his/her custody. An amount of N$220 (N$160 per
foster parent and N$60 per foster child) per month is granted; and there is no restriction
on the number of children. Like the maintenance grant, the regional distribution is skewed
in favor of relatively developed regions, the North receiving almost nothing (Table 5).
20
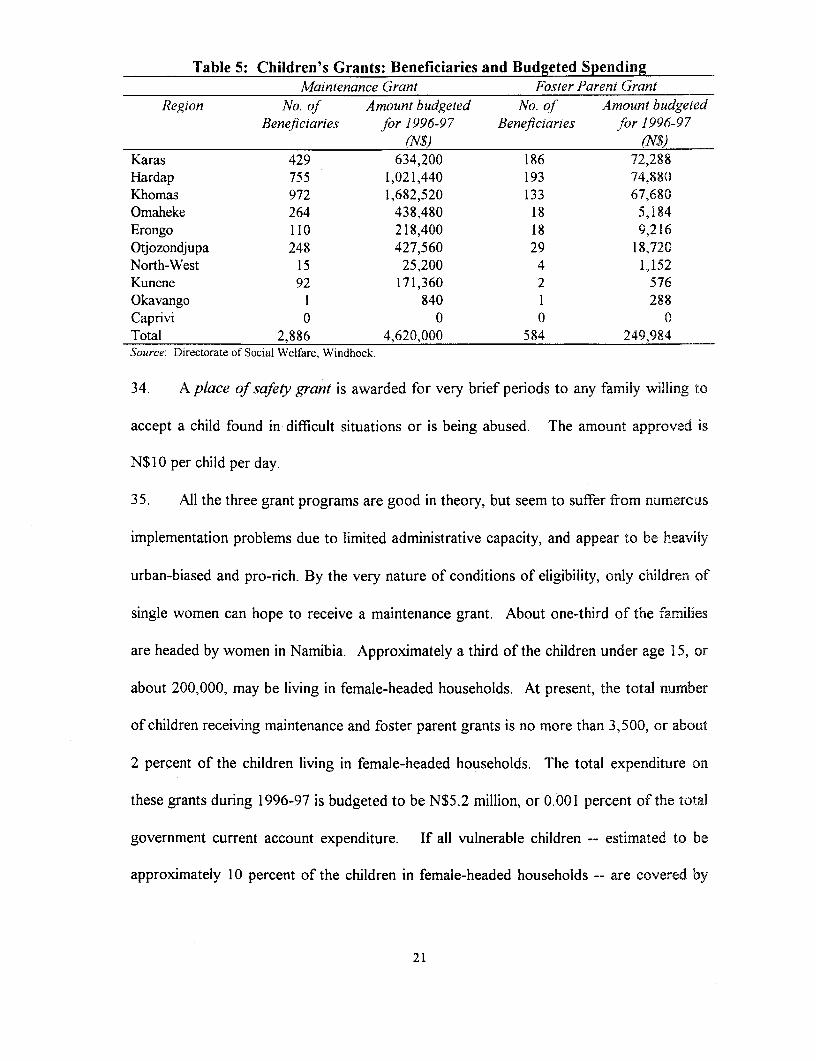
Table 5: Children's Grants: Beneficiaries and Budgeted SpendingMaintenance Grant Foster Parent Grant
Region No. of Amount budgeted No. of Amount budgetedBeneficiaries for 1996-97 Beneficiaries for 1996-97
(N$) (N$)Karas 429 634,200 186 72,288Hardap 755 1,021,440 193 74,880Khomas 972 1,682,520 133 67,680Omaheke 264 438,480 18 5,184Erongo 110 218,400 18 9,216Otjozondjupa 248 427,560 29 18,720North-West 15 25,200 4 1,152Kunene 92 171,360 2 576Okavango 1 840 1 288Caprivi 0 0 0 0Total 2,886 4,620,000 584 249,984Source: Directorate of Social Welfare, Windhoek.
34. A place of safety grant is awarded for very brief periods to any family willing to
accept a child found in difficult situations or is being abused. The amount approved is
N$10 per child per day.
35. All the three grant programs are good in theory, but seem to suffer from numercus
implementation problems due to limited administrative capacity, and appear to be heavily
urban-biased and pro-rich. By the very nature of conditions of eligibility, only children of
single women can hope to receive a maintenance grant. About one-third of the families
are headed by women in Namibia. Approximately a third of the children under age 15, or
about 200,000, may be living in female-headed households. At present, the total number
of children receiving maintenance and foster parent grants is no more than 3,500, or about
2 percent of the children living in female-headed households. The total expenditure on
these grants during 1996-97 is budgeted to be N$5.2 million, or 0.001 percent of the total
government current account expenditure. If all vulnerable children -- estimated to be
approximately 10 percent of the children in female-headed households -- are covered by
21
maintenance grants, fiscal sustainability may still not emerge as a serious issue. But abuse,
pro-rich and urban bias are likely to plague the program.
36. The reasons for urban, pro-rich bias stem from the fact that the program was
introduced to serve the white population prior to Independence. The program has never
been adapted to fiit in with the realities of post-Independent Namibia. Besides, it is not
clear to what ext,ent these grants are acting as an obstacle to responsible parenthood.
Government programs should not encourage men and women to stay away from making
payments for child maintenance. Though it is not possible to document with numbers,
unstructured interviews during field visits suggest that cases of parents deliberately not
paying for child maintenance, even when they are able to financially, are common. The lax
implementation of child maintenance grant is reported to be widespread in urban areas.
These grants may be retained since the fiscal implications do not appear to be serious.
However, efforts should also be made to enforce the laws governing
marriage/divorce/child maintenance, so that the burden of rearing children is shared
equally between the spouses, and in no case is passed on to the state simply because
maintenance grants exist.
37. Another issue worth stressing is who should receive the maintenance grant: the
parent usually living in urban areas, or the grandparent actually looking after the child in
rural areas. In theory (and according to law), the person actually looking after the child
should be the recipient of the maintenance grant. In practice, however, it appears that the
grants are being received by parents living in urban areas, and not by the grandparents
22

who bear the burden of rearing children in rural areas. This is no doubt an implementation
issue, but deserves some attention.
D. Other subsidies.
38. Subsidies to welfare organizations. A number of private welfare organizations
look after the aged and the handicapped. The majority of such private organizations are
located in towns (5 in Windhoek). The formula for the calculation of the subsidy varies
from one type of welfare organization to another, but roughly the Government bears about
30 percent of the actual expenditure. The program is administered by the Department of
Social Welfare.
39. No data on the income profiles of the actual beneficiaries are available, but it is
well-known that only the rich can afford to gain admission into these privately-run welfare
homes. Serious problems are currently being encountered in the actual administration of
these subsidies (Department of Social Welfare, 1997). The organizations are either over-
or under-paid, and there appears to be no proper audit or check.
40. Remission of rent. The Department of Social Welfare assists the local authority
with the rent and service fee of the needy. The scheme is confined to urban towns. In
actual practice, the scheme provides for remission of rent of those who defaulted .
Although an investigation into the socio-economic condition of those defaulted needs to
be done by social workers, the claims are usually granted upon submission of a report by
municipalities or local authorities. During 1996-97, an amount of N$2.3 million would
have been paid to local authorities on this account. The main problem with the program
is in a majority of cases the beneficiaries are in a position to pay their own rent; so this
23

expenditure is virtually a transfer to the non-poor. Besides, the program is believed to be
generating a moral hazard problem -- many default because they are aware that the
Government pays for the defaulted amount.
41. School-feeding program. The Ministry of Basic Education and Culture runs a
school-feeding program. The institutions covered include the primary schools, pre-
schools, private hostels, and informal hostels. An amount of N$2.8 million was spent
during 1996-97. In addition, bilateral donors provide milk powder and oil. The
distribution by institutions/students is shown in Table 6. The primary schools account for
the bulk of spending and coverage.
Table 6: Namibian School Feeding Program: Institutions and Beneficiaries, 1997Number of Beneficiaries
,Tnstitution Number Total Pupils Teacher Cooks Total Dry Total WeeklyInstitution Pupils & Rations Rations Rations
HostelStaff
Primary schools 413 99,145 65,844 689 1,057 67,590 3,171 70,761 353,805Pre-schools 153 6,910 6,839 250 188 7,277 564 7,841 39,205Private hostels 62 9,326 9,326 0 276 9,602 0 9,602 67,872Informal hostels 56 7,746 6,010 0 132 6,142 396 6,538 58,842Informal hostels 6 1,044 553 0 13 566 39 566 4,800
690 124,171 88,572 939 1,666 91,177 4,170 95,308 524,524Source: Ministry of Basic Education and Culture
42. The regional/town/municipalities of the primary school feedings -- the most
dominant program -- is shown in Table 7. Three towns -- Keetmanshoop, Ondangwa and
Windhoek -- account for over half of the beneficiaries reflecting that the program is highly
skewed towards urban areas. Moreover, most students in (expensive) private hostels may
be expected to belong to relatively well-off households. It is doubtful if the program is
pro-poor; it is certainly not equitable between rural and urban areas.
24
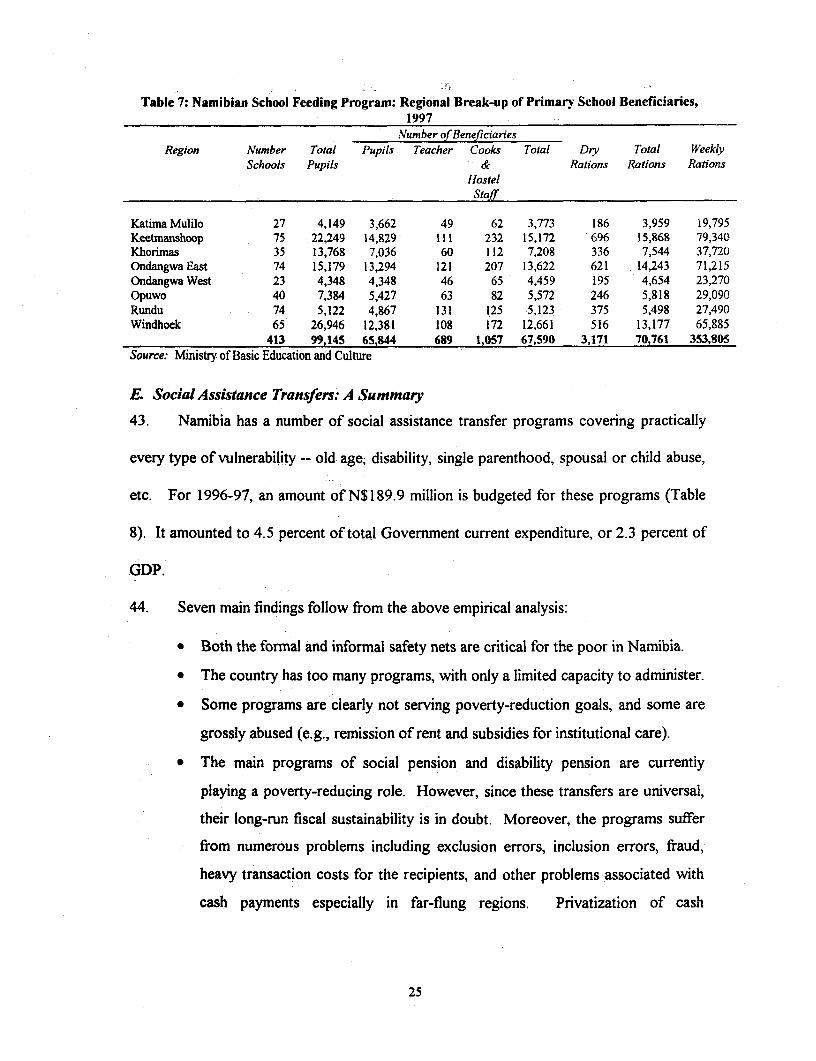
Table 7: Namibian School Feeding Program: Regional Break-up of Primary School Beneficiaries,1997
Number of BeneficiariesRegion Number Total Pupils Teacher Cooks Total Dry Total Weekly
Schools Pupils & Rations Rations RationsHostelStaff
Katima Mulilo 27 4,149 3,662 49 62 3,773 186 3,959 19,795Keetmanshoop 75 22,249 14,829 111 232 15,172 696 15,868 79,340Khorimas 35 13,768 7,036 60 112 7,208 336 7,544 37,720Ondangwa East 74 15,179 13,294 121 207 13,622 621 14,243 71,215Ondangwa West 23 4,348 4,348 46 65 4,459 195 4,654 23,270Opuwo 40 7,384 5,427 63 82 5,572 246 5,818 29,090Rundu 74 5,122 4,867 131 125 5,123 375 5,498 27,490Windhoek 65 26,946 12,381 108 172 12,661 516 13,177 65,885
413 99,145 65,844 689 1,057 67,590 3,171 70,761 353,805Source: Ministry of Basic Education and Culture
E. Social Assistance Transfers: A Summary
43. Namibia has a number of social assistance transfer programs covering practically
every type of vulnerability -- old age, disability, single parenthood, spousal or child abuse,
etc. For 1996-97, an amount of N$189.9 million is budgeted for these programs (Table
8). It amounted to 4.5 percent of total Government current expenditure, or 2.3 percent of
GDP.
44. Seven main findings follow from the above empirical analysis:
* Both the formal and informal safety nets are critical for the poor in Namibia.
* The country has too many programs, with only a limited capacity to administer.
* Some programs are clearly not serving poverty-reduction goals, and some are
grossly abused (e.g., remission of rent and subsidies for institutional care).
* The main programs of social pension and disability pension are currently
playing a poverty-reducing role. However, since these transfers are universal,
their long-run fiscal sustainability is in doubt. Moreover, the programs suffer
from numerous problems including exclusion errors, inclusion errors, fraud,
heavy transaction costs for the recipients, and other problems associated with
cash payments especially in far-flung regions. Privatization of cash
25
disbursement has not resolved these problems. The cost of administration has
dramatically increased since the last year.
• Adverse incentives for work do not appear to be a problem. However, moral
hazard problems, and individuals abandoning personal responsibility, seem to
be issues requiring attention especially for the program of child maintenance
grant. The program also suffers from pro-rich and pro-urban bias.
* Practically every program suffers from regional asymmetry. Program coverage
is most definitely inadequate in the North where the poorest are concentrated.
. Finally, publicly-funded programs are only inadequately contributing to a
strengthening of the informal safety net. Moreover, some programs are
wittingly or unwittingly doing the opposite, viz., financing formal welfare
institutions that are least likely to house the needy poor individuals in the
country.
26

Table 8: Social Assistance Transfers in Namibia: A SummaryBeneficiaries Budget
Number 1996/97 1997/19(Estimated, NA/fonltW (Appropriated) (Planned)
Allowance, Grants, Subsidiaries Not Actual) Beneficiary NS million NSmillion
A. Pensions, Allowances and Institutional Subsidies
1. Pensions (Non Contributory)
1.1 Old Age Pension 82,670 160 158.741.2 Blind Person's Pension 819 160 0.361.3 Disabled Person's Pension 11,850 160 22.751.4 War Veteran's Allowance 111 160 0.21
TOTAL 94,320 160 182.06 182.0
2. Child and Family Allowances
2.1 Foster Parent Grants 584 160 0.252.2 Maintenance Grant/ 2,886 60/child 4.62
Family Allowance 1602.3 Places of Safetv Allowance c.a. 70 60/child 0.33
cases/month N$10/day child
TOTAL 5.20 5.8
3. Subsidies to institutions/welfare 16 institutions + 8 org. NS 1,000 1.60 1.0organizations NS 4,000
4. Remission of Rent 28 localities c.a. N550 (budg.) 1.00TOTAL 52,765 beneficiaries max 80 (paid) 2.48 1.0
5. Other allowances (to individualsfamilies) (budg.) 0.045.1 Escort Fees TOTAL (paid) 0.004
Total Pensions, Allowances and 189.86 189.8Institutional Subsidies
*As a percentage of Current Govt Exp. 4.5*As a percent of GDP 2.3
B. Other Programs
6. School feeding program 2.8 N/A
7. Shelter/housing program 20.2 22.0
8. Labor-based work programs 1.7 1.1TOTAL OTHER PROGRAMS 24.7 23.1GRAND TOTAL: ALL PROGRAMS 214.6
*As a percentage of Current Govt Exp. 5.1*As a percent of GDP 2.6
Source: Compiled from Situation Analysis, Directorate of Social Welfare; Minister of Local Government andHousing; Transport; and Basic Education and Culture.
27

IV. Shelter/Housing
45. Much of the housing crisis in the country is a by-product of racial segregation in
housing that was imposed on the people prior to Independence. Since Independence, the
Government has encouraged housing finance through the private sector, a parastatal,
National Housing Enterprises (NHE) and by direct involvement. The Government's
Build-Together (BT) housing program seeks to assist low-income households who have
little access to pr'ivate sector housing finance, or to the finance offered by NHE. While
NHE and the private sector caters to the non-poor, the BT program targets households
with incomes below N$1250 per month. About 60 percent of all urban households, who
do not have decent housing, fall in this category. By 1995-96, the program has assisted
about 3400 families with housing loans valued at N$42.5 million. The average loan
amount was N$12,500 -- clearly inadequate for constructing a housing unit without
considerable contribution from the beneficiaries themselves. The loans carry a positive
interest rate ranging from 9 to 14 percent, depending upon the size of the loan. However,
since the market rate of interest is twice this level, there is an implicit subsidy.
46. The impact of the program has been reported to be "impressive" (National Habitat
II Committee). Some women have built homes worth over N$25,000 with only a loan
amount of N$6,000. About 45 percent of beneficiaries were female-headed households.
The repayment rates are high. However, evaluations (NEPRU 1996a; Onibokun et al.
1995) have shown that the program is not reaching the target groups, and is neither
financially nor institutionally sustainable. Most beneficiaries (80 percent) are in the
28

category of "permanently employed" located predominantly in urban towns. The program
may not be reaching the poorest in rural areas adequately.
47. The urban poor and the nonpoor are clearly benefiting from the housing programs.
But are the urban poor served disproportionately? Up to 80 percent of the population in
the informal settlements in the urban north are unemployed (and most still have no security
of tenure) and hence were unable to get any loans under the BT program (Inge Tvedten
and M. Mupotola, 1995). Moreover, from the perspective of the urban poor, the
upgrading of squatters and provision of drinking water are more of a priority than
improving the low-cost housing stock. During 1994-95, public expenditure on informal
settlement upgrading was nil; it was budgeted for N$1.5 million during 1996-97, whereas
the program of enhancing new housing stock received an amount of N$11.5 million.
(Table 9) Moreover, historically Namibia's water and sanitation services were also
biased towards high quality provision to urban centers and commercial farms, and the bias
continues (S. Stone and M. Gaomab, 1994).
Table 9: Summary Development Budget for Housing: 1994-95 to 1997/98Name of Program Actual Up to Estimatedfor Estimated 1997/98
1994/95 1995/96 Expenditure1996/97
Urban/Rural Housing Sub- 43,385,000 11,000,000 11,550,000 11,700,000ProgrammneSocial Housing Sub- 1,450,000 5,000,000 950,000 1,100,000ProgrammeWindhoek Single Quarters 3,550,000 3,500,000 3,000,000 2,800,000Sub-ProgrammeInformal Settlement 1,250,000 1,500,000 1,700,000Upgrading Sub-Programme
Total 48,385,000 16,250,000 17,000,000 17,300,000
Source: Ministry of Local Government and Housing, Government of Namibia
29

48. These considerations suggest that a reorientation of public expenditure within the
housing sector towards upgradation of squatter settlements and provision of water and
sanitation in urban areas, and expansion of affordable housing stock in rural areas, may be
needed.
49. Namibia's experience in shelter/housing -- implicit subsidies reaching
disproportionately urban non-poor population -- is similar to the experience of other
countries that experimented with similar programs (K. Subbarao, et al, 1997). In fact, of
all subsidies, housing subsidies have proven to be the most regressive. It is very unlikely
that the historically driven biases in housing provision can be corrected by direct
government (public sector) involvement without giving rise to new distortions and fiscal
sustainability issues.
V. Social Security (Insurance)
50. A Social Security Commission was established by the Parliament in 1994 with a
view to providing income security to Namibians. A contributory Social Security system
was introduced in 1995. The system provides for maternity leave, sick leave and death
benefits to its members. It is based on a principle of 50-50 contribution from employers
and employees. There appears to be some implicit subsidy from the relatively higher
paying employers to lower paid employees, but it is too early to come up with quantitative
magnitudes. As of July 1997, 23,720 employers and 232,725 employees have registered
themselves. The income (from contributions) is now about N$4.5 million a month. For
the first three months of 1996-97 financial year, an amount of N$5.2 was disbursed by
30

way of benefits. The pension scheme is still in its infancy, but may grow in magnitude in
the next five years. Since the inception of the Funds, maternity leave benefits have
dominated.
51. The program is clearly targeted to workers in the formal sectors and will
strengthen the already strong urban bias in social protection. Social security -- whether
financed by employers or employees -- is most likely to act as an additional tax on labor
and can counteract policies to promote labor use in the country.
VI. Transfers with a Work Requirement.
52. Three types of transfers with a work requirement exist in the country: (a) Food-
or Cash-for-Work programs, (b) a Labor-based works program, and (c) Microcredit
programs (for expanding wage and/or self-employment in informal sectors and in small
scale enterprises).
A. Food- or Cash-for- Work Programs.
53. These programs, largely donor-funded, have been implemented during years of
drought. The able-bodied are generally ineligible for free food distribution during a
drought, and therefore participate in food- or cash-for-work programs. Considerable
experience on their working has been gained, and the programs have been evaluated in
depth (A. Ashby et. al. 1996; S. Adkisen and S. Devereux 1995; S. Devereux 1995; S.
Devereux and C. Solomon 1994). Instead of presenting a detailed overview of these
evaluations, the main findings (which are broadly in conformity with the cross-country
evidence presented in K. Subbarao, et. al. 1997), are summarized below.
31

54. First, the program outreach has been inadequate. Owing to inherent difficulties in
scaling up the program during drought periods, the proportion of the able-bodied
participating in the program has been low. One reason was the logistical problem created
by the distribution of food as wages. Private food markets are well-developed in Namibia.
During a drought, food imports do reach the private retail outlets throughout the country.
Therefore, instead of food, use of cash or food vouchers (redeemable at private outlets) as
wages could have expanded the coverage of the program rapidly. Replacing food by cash
or food vouchers appears highly desirable.
55. Even where cash was used, the program suffered from poor targeting. One
problem was that the equipment provided was free, and that attracted the non-poor to the
program in large numbers. To avoid mis-targeting of the program, the equipment would
be owned by local municipalities or institutions, or NGOs managing the program (instead
of individuals) and then be lent to workers. Another issue was the wage rate. It was
usually set (both food and cash) at a level that attracted the nonpoor to the program, apart
from contributing to job rationing.
56. The country has no regular nation-wide works program during normal times,
unlike in drought-prone regions of India. A pilot labor-based program is in operation (see
next section). A more regular labor-based works program is highly recommended, because
all the administrative and institutional framework would then be in place. With the onset
of a drought, the program could then be expanded quickly and with relative
(administrative) ease.
32

57. Administrative capacity of the government of Namibia is limited, and is usually
very strained during periods of drought. And experience suggests (K. Subbarao, et. al.
1997) that well-run works programs are usually administration-intensive. Therefore, it is
best to develop capacity outside of the government -- through NGOs, and the private
sector. The experience of other African countries is helpful in this context. In other
African countries (e.g., Ghana) public provision (funding) by the government (or donors)
was combined with private production (actual implementation of the program by a private
contractors or NGOs).
B. Labor-based works programs.
58. Labor-based works have proven to be economically and technically feasible and
appear to be an especially good option for drought-prone countries. In Namibia, pilot
projects have been in operation in the North. Recently, a Green Paper was written by a
group of technical experts designed to encourage public debate on the feasibility of
extending labor-based methods in all the activities of line Ministries.
59. A critical review of the pilot projects in the North strongly favors the use of Labor-
based works as a vehicle for expanding employment and building infrastructure (especially
gravel-based rural roads) in the country. I visited an ongoing labor-based road
construction worksite (Onethindi to Olukonda road in Oshikoto region). The program is
being implemented by private contractors with the oversight of donor-funded specialists.
Four impressions of the visit to the worksite can readily be noted: (a) a high degree of
gender equality in hired labor7, (b) a reasonable proportion of (one-third) casual labor to
' Contractors noted that under the task-based system. women were actually preferred because they wereable to complete the tasks much faster and more efficiently than men.
33

skilled labor, (c) a relatively low wage that permitted self-targeting, and (d) technical
feasibility of the program as revealed by the good quality of the road constructed.
60. Hard data on the economics of labor-based works in Namibia is limited. However,
the limited information that exists confirms the above impressions. Thus, unskilled wage
cost as a percent of total wage cost was 30 percent in the Ombalantu/Omusati region, and
47 percent in Ongenga-Omungwelume worksite. The total cost of labor-based project is
61 percent of the equipment-based project, in the same region and for the same type
(quality) of road. (ILO, 1995). During April 1996 to March 1997, in the labor-based
project at Ombalantu/Omusati region, about 60,000 person days of low-wage employment
was created.
61. Given the high level of unemployment, and the highly uncertain agro-climatic
environment, labor-based methods have a definite role to play in Namibia's development.
The pre-requisites are: development of private contractor capacity, and necessary
managerial skills required to run a labor-based program. Bilateral donors (SIDA) and the
ILO are currently involved in this effort. The Government has also shown considerable
interest as evidenced by the preparation of the Green Paper. Nevertheless, the capacity
both in the Government and in the private sector to design and manage an expanded
labor-based works program appear to be limited. The resources allocated for the program
in the Development Budget (barely N$1.7 million in 1996-97, and N$1.1 in 1997-98) may
appear inadequate in relation to the needs, but not in relation to the limited capacity in the
country. However, it seems highly desirable to expand the capacity and the resources
34

devoted to the program. This is an area where more donor involvement and technical
assistance may have rich pay-offs.
C Microcredit/Informal Sector Activities
62. The Namibia Development Corporation (NDC), a parastatal, is charged with the
responsibility to provide credit for micro enterprises. The NDC has a program of start-up
assistance to help entrepreneurs launch sustainable business activities. The program
included credit, training and business counseling. The amount of start-up loans range
from N$1,000 to N$80,000, the average loan size being N$10,000. The interest will be at
the going prime bank rate, and loans are to be repaid within five years. No collateral or
own contribution is required, but the purchased equipment will be mortgaged to the
Corporation. Over N$850,000 has been advanced as loans to 82 individuals or businesses.
63. The Corporation's activities are almost entirely (95 percent) urban. Though no
quantitative information on the income profiles of borrowers is available, it is to be
expected that poor people with low skill base could have hardly benefited from this
program. Moreover, the available data suggest that the default rate is over 30-40 percent.
With such a high default rate, the Corporation's business is clearly not sustainable.
Already, the high default rate is creating a cash flow problem. The cost of serving a loan
is also high at 30 percent of the loan amount.
64. There is now considerable evidence to suggest that in rural Namibia, the poor
require (demand) small amounts of loan (often N$100 to N$500), frequent loans, and a
market place such as a shed with basic amenities (A. Botelle, 1991; M. Seiche, 1995).
Credit at this small scale is being provided by local (Namibian) NGOs such as the Private
35
Sector Foundation (PSF). The PSF offers (appropriately) a less formal type of training
than the NDC, to those who engage themselves in subsistence type of informal business
activities. An interesting aspect of the functioning of NGO organizations such as the PSF
is that the business activities is not separated from other aspects of community. Often,
group discussions are arranged to discuss issues of healthcare and family planning. The
program was successfully targeted to women (Table 10). The average value of loan was
N$524 for women as N$554 for men. It is worth stressing, however, that even this
relatively successful NGO-run credit operation is heavily concentrated in Khomas
(Windhoek), which accounted for about half of the value of loans. The main constraints
to a rapid expansion of microcredit programs in rural Namibia appear to be on the demand
side. It is hard for small businesses to survive, much less thrive, in a low-income, rural,
stagnating region.
65. Owing to limited time, and due to their dispersed nature, the credit activities of the
NGOs, parastatals and those of the Ministry of Industry could not be reviewed in depth.
However, a recent study has reviewed the programs in depth. (M. Seiche, 1995).
Overall, the institutional efforts to promote informal businesses are characterized by (a)
large-scale, urban-oriented operations, (b) separation of credit from business training, and
(c) inadequate attention to marketing and support activities. As a consequence, the
growth potential of informal business could not be exploited in full. Thus far, the best
efforts seem to be those of the NGOs, with the parastatal's performance being neither
satisfactory nor even relevant to the needs of informal businesses in rural Namibia.
36

Table 10: Regional Distribution of Loans, August 1997Region Number of loans Value of loans
Female Male Total Female Male TotalN$ NS N$
Caprivi 1 1 I 1Erongo 126 7 133 62.8 3.5 66.3Hardap 302 93 395 126.7 40.0 166.7Karas 206 49 255 95.7 22.6 118.3Khomas 1,002 216 1,218 556.9 135.6 692.5Kunene 81 27 108 41.5 13.5 54.0Ohangwena 0 0.0Omusati 0 0.0Oshana 443 83 52 251.9 48.8 200.7Oshikoto 16 8 24 8.0 4.0 12.0Okavango 0 0.0Omaheke 17 17 8.2 8.2Otjozondjupa 79 3 82 39.8 500.00 39.8TOTAL 2,272 487 2,759 1,190.3 269.7 1,460.0Percentage 82.35 17.65 100.00 81.53 18.47 100.0Average value 523.390 553.72 529.16
Source: Private Sector Foundation, August 1997.
VII. Decentralization and transfer programs
66. A policy decision has been taken to gradually decentralize the functional
responsibilities of line Ministries. The basic long-term goals are to (a) let local
units/offices administer programs such as health care (functional decentralization), and (b)
create or strengthen sub-national levels of the Government that are broadly independent
from the national government with respect to defined functions including the right to raise
revenues in that locality (devolution). According to the Ministry of Local Government
and Housing directive of 12th December, 1996, primary health care, social services, and
resettlement/rehabilitation will be in a group of "immediate" or "intermediate"
decentralization to Regional Councils or Local Authorities.
37

67. What does the decentralization process mean for the implementation of transfer
programs by the I)irectorate of Social Services? Our analysis has shown (a) considerable
regional asymmetry in staffing, with the North getting relatively less attention, (b)
generally poor record in reaching the eligible beneficiaries especially in the rural North, (c)
an escalation of the administrative cost in the recent period, and (d) lack of coordination
between different segments of the Directorate, and between the contributory and non-
contributory systems.
68. The first two drawbacks can be resolved if the local authorities are given the
authority to implement the program, along with the budget allocated in proportion to the
eligible beneficiaries in each Region. The development of a cadre of administrative
support at the local and regional levels may not happen immediately. In the interim, it may
require a transfer of staff resources from Windhoek to the Regions. Also, devolution of
funds may require a change (updating) of the current legislation. Presumably due to these
reasons, the proposals of the Directorate currently do not recommend a transfer of
budgetary resources to the local authorities. However, the above problems can be
resolved with relative ease. Transferring responsibilities to implement the program without
a corresponding transfer of funds may not be the best way to reap the gains from
decentralization. One short run solution to the problem of inadequate administrative
support at the local level would be a policy of sending staff from Windhoek to the regions
by rotation (say 3 to 6 months of work at a local office). In the process, the staff working
at the Centre could also be enabled to develop regional expertise, so that at a future date,
staff may be transferred to the Regions keeping their preferences/expertise in mind.
38

Inadequate local administrative capacity is a problem, but is solvable with creative
redeployment of staff of the Directorate.
69. The problem of increasing administrative cost is a more difficult one, because it
may involve some downsizing of the Directorate. This issue is not linked to the
decentralization process as such, but can be interfaced. For example, staff found in excess
of the needs could be sent to the Regions currently understaffed (Table 3). Alternatively,
some staff could be redeployed to conduct means tests and assist in the removal of the
non-poor pensioners from the program. Also, some of the staff could be placed in charge
of means tests of the elderly currently under institutional care. If staff are entrusted with
the additional responsibility of targeting of some of the programs, the costs of
administration can at least be matched by resource savings and downsizing may not be
warranted.
70. One of the reasons for the high administrative cost is that work at all levels is
manually done. Some degree of computerization and reduction of paper work is
necessary to improve the overall efficiency of the Directorate. The fact that information
on either the actual number of beneficiaries or the actual amount spent during the previous
financial year is nowhere collated and stored electronically is suggestive of the slack in the
system. The Department has to make serious efforts to develop a proper management
information system. Decentralization can provide an useful opportunity to develop such a
disaggregated management information system.
71. Finally, targeting of social pensions and child allowances cannot be achieved
without the inputs of the community and the NGOs. Community efforts in a country with
39
a historical legacy of top-down administration is unlikely to emerge immediately, but a
decentralized pension administration provides a unique opportunity for the gradual
emergence of community initiatives. Much of the Directorate's functions involve direct
interface with people and institutions at the grass-roots level. The Directorate is also
charged with other responsibilities of monitoring of the social situation and people's living
conditions ("social monitoring"), and needs assessment and reporting. The present highly
centralized administration is at odds with the requirements of efficient delivery of the
mandate of the [irectorate.
VIII. Reforni Options and Recommendations
72. In the light of the above analysis, what options should the Government consider?
Twc approaches are possible, the first a short-term option, and a second more longer-term
option. In the short run, the Government may reform the existing programs of social
pension, child and disability allowances and implement the programs better: some specific
recommendations towards this goal are outlined below. In the medium run, the
Government mav rethink the safety net programs more fundamentally in the direction of
new initiatives in the North where poverty is concentrated. In particular, there is a greater
need to develop capacity to implement public works programs (implemented preferably
with private contractors, given the limited capacity of the Government), and provide
incentives for the expansion of informal businesses in the countryside. Considering that
over 90 of the country is arid with highly fluctuating incomes, a works program that
provides both transfer benefits and consumption-smoothing appears to be consistent with
the profile of poverty and vulnerability.
40
73. A few specific recommendations are outlined below.
* Reduce the number and complexity of programs. At present, Namibia has a large
number of programs. The Directorate of Social Services alone is administering nine
cash transfer programs. The programs which have no direct bearing on poverty
reduction, such as the remission of rent and blanket subsidies to welfare institutions,
need to be abolished. It seems highly desirable to streamline and reduce the number of
programs to four: a basic social pension program, a disability pension program, a blind
person grant, and a child maintenance grant. Such a restructuring would release
resources -- both financial and administrative -- which can then be re-deployed so that
the retained four programs are implemented effectively, avoiding exclusion errors. (see
below).
• Pay particular attention to the social pension program. Special attention is
required to administer the social pension program well, in view of its critical role in
poverty reduction. Exclusion errors are particularly worrisome, especially since these
are occurring in regions with the highest concentrations of poverty. The high
transaction costs (including transport costs) incurred by the poor, which greatly reduce
the real value of pensions, is also a source of concern. Decentralization provides
an opportunity to remedy the observed deficiencies. On a pilot basis (in regions such
as Kunene), identification of eligible beneficiaries may be done by local
authorities/regional councils with community inputs. Responsibility for complete
program coverage be given to them, and the performance evaluated a year later. It
41

appears desirable to decentralize both budgetary control and program
implementation in the pilot regions.
* Target social pensions on a pilot basis in urban areas. From the perspective of
long-run fiscal sustainability, there appears to be a good case for targeting of social
pensions to the needy. However, extreme caution is required to ensure that targeting
does not further exacerbate the already high exclusion errors. It is best to test out
indicator-based targeting on a pilot basis in urban areas. Excluding certain categories
(individuals owning vehicles, independent houses, or paying income-tax and/or
contributing to formal social security etc.,) appears to be a desirable way to proceed.
* Coordinate the contributory and non-contributory systems so as to reduce
overlap.
* Strengthen the country's informal safety net (for example, by providing additional
relief to families looking after children of AIDS-affected parents, or disabled children).
3 Remove regional asymmetry in the outreach of programs. All the major programs
are currently not reaching many eligible persons in some Regions (especially the
North). This is particularly so for disability pensions, blind person's grant and
maintenance grants. To improve coverage in far-flung Regions, some re-deployment
of administrative staff to under-served Regions would be required. If limitations to
moving professional staff between regions cannot be overcome, other options of
reaching the underserved Northern regions (including the use of para-professionals)
may also need to be considered.
42

* Enforce the laws governing marriage/divorce/child maintenance, so that the
burden of rearing children is shared equally between the spouses. At present, it seems
most likely that the government programs encourage spouses to avoid payments for
child maintenance. The child maintenance programs suffer not so much from the
problem of fiscal sustainability, but more from abuse, and pro-urban and pro-rich bias.
* Re-orient shelter/housing programs. Much of the shelter programs are urban-
biased, and pro-middle class. More resources need to go to the programs of
importance to the poorest -- upgradation of single quarters, squatter settlements and
slums. Government subsidy on loans seem to be helping the moderately-poor and the
non-poor, but not the poorest in rural areas. Regional asymmetry is far the greatest in
housing/shelter programs. Considering the potential for regressivity in the distribution
of government spending on housing/shelter, more government involvement needs to be
justified only if the various components of the program are rendered pro-poor and pro-
rural. Considering that even the Build-Together program is urban-biased and pro-
middle class, there appears to be no justification for the prevailing (implicit) subsidy on
the rate of interest.
. Invest in capacity-building and expand the labor-based works program. It
appears highly desirable to invest in training of small-scale contractors and managers
to expand the labor-based works program on a priority basis. Resources and efforts
currently going to this program appear to be much too inadequate, given the
exceptionally high unemployment rates.
43
Reduce direct government involvement; encourage NGO efforts in micro-credit.
The Government-supported parastatal has proven both inefficient (with mounting
overdues) and irrelevant for expanding informal businesses in rural Namibia.
It is best to encourage the efforts of the NGOs who have been successful not only in
reaching the poor and women among them, but also in designing credit and savings
schemes of relevance to the setting up of informal businesses, more than the parastatal.
44

REFERENCES 8
Adkisen S. and S. Devereaux, 1995. Options for Drought Relief in Namibia: New
Choices Based on the Experience of the 1992/1993 Drought Relief Programme.
SSD Research Report 22. Windhoek: University of Namibia.
Alderman, Harold. 1997. Safety Nets and Income Transfers in South Africa. Background
paper for Poverty Assessment (Draft).
Ashby, Auriol, G. Bruce and R. Davis. 1996. The Reorientation of the Food-For-Works
Programme. (Draft), Namibia Resource Consultants, Windhoek. Written for the
Ministry of Agriculture, Water and Rural Development.
Bruhns, Barbro-Isabel Bruhns. 1995. "Disability and Rehabilitation in Namibia A National
Survey." Nepru Working Paper No. 9. Windhoek: The Namibian Economic
Policy Research Unit.
Bogosi, Ruth. 1992. Notes on the Housing Situation and Housing Policy in Namibia.
Botelle, A. 1991. "A Socio-Economic Survey of the Onaanda Road Construction Project,
Western Owambo". SSD Research Report. Windhoek: University of Namibia.
Central Statistics Office. Statistical Abstract. 1996. No. 5. Windhoek: National Planning
Commission.
"Credit and Savings in Kavango and Caprivi". 1996. SSD Research Report No. 27.
Windhoek: University of Namibia.
Devereaux, S. et. al. 1995. "Namibia Poverty Profile". SSD Research Report No. 21.
Windhoek: University of Namibia.
8 Not all studies mentioned here have actually been cited in the paper.
45
Devereaux, S. 1995. "Coping with Vulnerability in Namibia". SSD Research Report.
Windhoek: University of Namibia.
Devereaux, Steven and Colette Solomon. 1994. "Food-for-Work in Namibia: A Review
of the 1992/93 Food-for-Work Programme". SSD Research Report No. 18.
Windhoek: University of Namibia.
Devereaux, Steven and Trine Naeraa. 1993. "Drought and Entitlement Decline in
Namibian Agriculture". SSD Research Report No. 3. Windhoek: University of
Namibia.
Directorate of Social Welfare. 1997. Situation Analysis on Social Welfare Policy in
Namibia. Namibia.
Government of the Republic of Namibia. 1996. Decentralization Development and
Democracy. Decentralization Policy for Namibia. Ministry of Regional and
Local Government and Housing.
Government of the Republic of Namibia. 1996. First National Development Plan (NDPI)
Volume 1. 1995/1996-1999/2000. Windhoek: National Planning Commission.
Government of the Republic of Namibia. 1997. Green Paper on Labour Based Works.
Ministry of Works, Transports and Communications, Department of Transport.
Human Developmnent Report 1997. "The Impact of HIV and AIDS in Namibia". 1997.
Windhoek: UNDP
ILO-ASIST Cosjt Comparison Between Equipment and Labour-based Operations on
Road D3608 in Northern Namibia. 1995.. Mission findings.
46

Morgan, R. 1991. "State Pensions as an Income Safety Net in Namibia". Food Policy
351-359 pp
Naeraa, T. et al, 1993. Coping with Drought in Namibia: Informal Social Security
Systems in Caprivi and Erongo, 1992. Namibian Institute for Social and
Economic Research.
Republic of Namibia. 1995. Namibian National Labour-Based Forum Project Document.
Ministry of Works, Transport and Communication. Department of Transport.
Republic of Namibia. National Accounts, 1981-1996. Central Statistics Office. National
Planning Commission.
Republic of Namibia. 1995. Labour-based Roadworks Program: Project Document.
Ministry of Works, Transport and Communication.
Republic of Namibia. 1996. National Plan of Action. National Habitat II Committee..
Ministry of Regional, and Local Government and Housing.
Republic of Namibia. 1994. Namibia: Population and Development Planning. Population
Planning Unit. Windhoek: National Planning Commission.
Seiche, M. 1995. "Scopes for Policies Towards the Development of Informal Small
Business in Namibia". NEPRU Occasional Paper No. 3. Windhoek: The
Namibian Economic Policy Research Unit.
"Seven Years Independence Current Developments and Future Prospects in Namibia-
Some Topical Highlights". 1997. Nepru Working Paper No. 54. Windhoek: The
Namibian Economic Policy Research Unit.
47
Shah, A. 1997. "Fostering Responsive and Accountable Governance: Lessons from
Decentralization Experience". Draft.
Social Security Commission. Social Security Commission Employees' Rights and
Obligations.
Stone, S. and Mihe Gaomab. 1994. "Poverty and Income Distribution in Namibia". Nepru
Working Paper No. 31. Windhoek: The Namibian Economic Policy Research
Unit.
Subbarao, K. et al. 1997. Safety Net Programs and Poverty Reduction: Lessons from
Cross-Country Experience. Washington D.C.: World Bank.
Tvedten, I. and Moono Mupotola. 1995. "Urbanization and Urban Policies in Namibia".
A discussion paper prepared for the Annual Meeting of the Association of Local
Authorities in Namibia. SSD Research Report No. 10. Windhoek: University of
Namibia.
van der Berg, S. 1994. "Issues in South African Social Security". A background paper
prepared for the World Bank.
48

Policy Research Working Paper Series
ContactTitle Author Date for paper
WPS1 979 Banking on Crises: Expensive Gerard Caprio, Jr. September 1998 P. Sintim-AboagyeLessons from Recent Financial 38526Crises
WPS1980 The Effect of Household Wealth Deon Filmer September 1998 S. Fallonon Educational Attainment: Lant Pritchett 38009Demographic and Health SurveyEvidence
WPS1981 Evaluating Public Expenditures James E. Anderson September 1998 L. TabadaWhen Governments Must Rely Will Martin 36896on Distortionary Taxation
WPS1982 Analyzing Financial Sectors in Alan Roe September 1998 D. CortijoTransition: With Special Reference Paul Siegelbaum 84005to the Former Soviet Union Tim King
WPS1983 Pension Reform in Small Developing Thomas Charles Glaessner September 1998 M. NavarroCountries Salvador Valdes-Prieto 84722
WPS1984 NAFTA, Capital Mobility, and Thomas Charles Glaessner September 1998 M. NavarroMexico's Financial System Daniel Oks 84722
WPS1985 The Optimality of Being Efficient: Lawrence M. Ausubel September 1998 S. VivasDesigning Auctions Peter Cramton 82809
WPS1 986 Putting Auction Theory to Work: Paul Milgrom September 1998 S. VivasThe Simultaneous Ascending Auction 82809
WPS1987 Political Economy and Political Ariel Dinar September 1998 F. ToppinRisks of Institutional Reform in Trichur K. Balakrishnan 30450the Water Sector Joseph 'Wambia
WPS1988 The Informal Sector, Firm Dynamics, Alec R. Levenson September 1998 T. Gomezand Institutional Participation William F. Maloney 32127
WPS1989 Contingent Government Liabilities: Hana Polackova October 1998 A. PantcnA Hidden Risk for Fiscal Stability 85433
WPS1990 The East Asia Crisis and Corporate Michael Pomerleano October 1998 N. DacanayFinances: The Untold Micro Story 34068
WPS1991 Reducing Air Pollution from Urban Mark Heil October 1998 R. YazigiPassenger Transport: A Framework Sheoli Pargal 37176for Policy Analysis
WPS1992 The Present Outlook for Trade John Croome October 1998 L. TabadaNegotiations in the World Trade 36896Organization
Policy Research Working Paper Series
ContactTitle Author Date for paper
WPS1993 Financial Safety Nets and Incentive Philip L. Brock October 1998 K. LabrieStructures in Latin America 38256
WPS1994 Estimating Wealth Effects without Deon Filmer October 1998 S. FallonExpenditure Data - or Tears: Lant Pritchett 38009with an Application to EducationalEnrollments in States of India
WPS1995 What Macroeconomic Policies Mansoor Dailami October 1998 B. NedrowAre'Sound?" Nadeem ul Haque 31585
Top Related