


Languages
Pages
Legal


Working Paper 277
Joining the Supply Chain:
A Firm-Level Perspective from Southeast Asia
Ganeshan Wignaraja
June 2014
INDIAN COUNCIL FOR RESEARCH ON INTERNATIONAL ECONOMIC RELATIONS
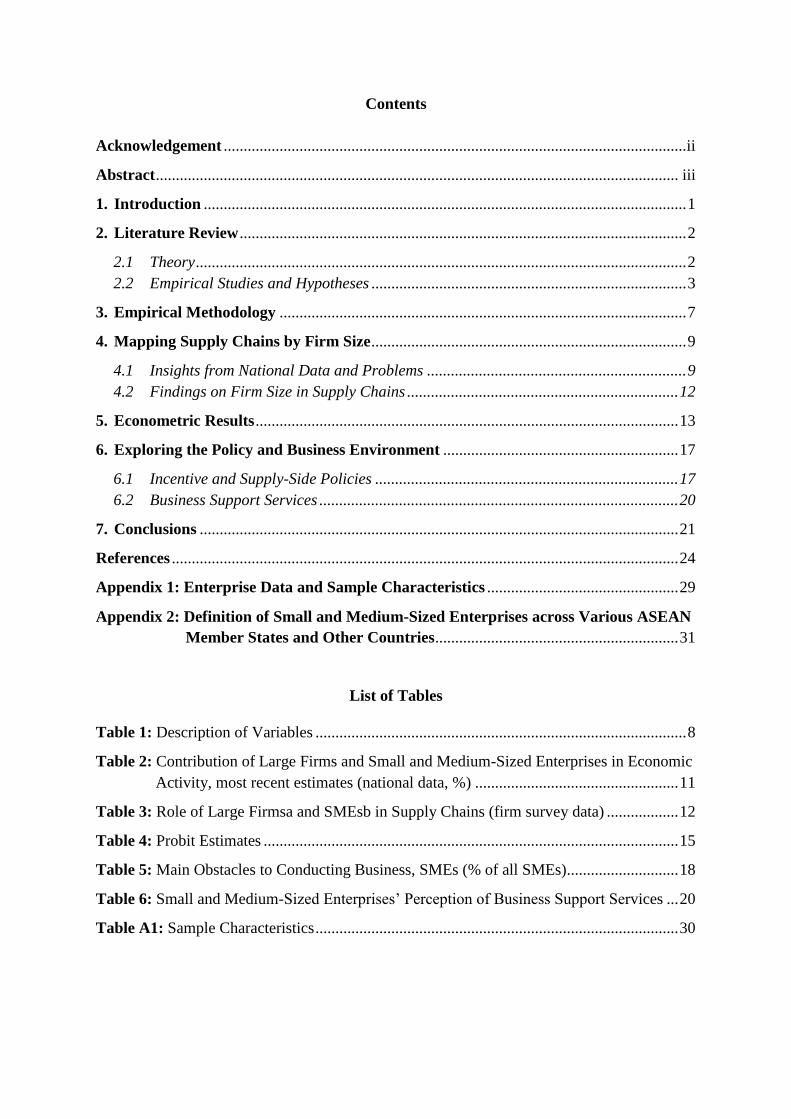
Contents
Acknowledgement .................................................................................................................... ii
Abstract ................................................................................................................................... iii
1. Introduction ......................................................................................................................... 1
2. Literature Review ................................................................................................................ 2
2.1 Theory ........................................................................................................................... 2
2.2 Empirical Studies and Hypotheses ............................................................................... 3
3. Empirical Methodology ...................................................................................................... 7
4. Mapping Supply Chains by Firm Size ............................................................................... 9
4.1 Insights from National Data and Problems ................................................................. 9
4.2 Findings on Firm Size in Supply Chains .................................................................... 12
5. Econometric Results .......................................................................................................... 13
6. Exploring the Policy and Business Environment ........................................................... 17
6.1 Incentive and Supply-Side Policies ............................................................................ 17
6.2 Business Support Services .......................................................................................... 20
7. Conclusions ........................................................................................................................ 21
References ............................................................................................................................... 24
Appendix 1: Enterprise Data and Sample Characteristics ................................................ 29
Appendix 2: Definition of Small and Medium-Sized Enterprises across Various ASEAN
Member States and Other Countries ............................................................. 31
List of Tables
Table 1: Description of Variables ............................................................................................. 8
Table 2: Contribution of Large Firms and Small and Medium-Sized Enterprises in Economic
Activity, most recent estimates (national data, %) ................................................... 11
Table 3: Role of Large Firmsa and SMEsb in Supply Chains (firm survey data) .................. 12
Table 4: Probit Estimates ........................................................................................................ 15
Table 5: Main Obstacles to Conducting Business, SMEs (% of all SMEs)............................ 18
Table 6: Small and Medium-Sized Enterprises’ Perception of Business Support Services ... 20
Table A1: Sample Characteristics ........................................................................................... 30

ii
Acknowledgement
I am most grateful to Dr. Rajat Kathuria and Dr. Saon Ray for facilitating publication of this
paper and to Professor Charles Harvie and Professor Dev Nathan for comments.

iii
Abstract
This paper undertakes a comparative, firm-level analysis of joining the supply chain in five
Southeast Asian economies to improve our understanding of fragmentation of manufacturing
across borders. The research maps supply chains and conducts firm-level econometric
analysis on 5,900 enterprises. The findings suggests that firm size (reflecting economies of
scale to overcome entry costs) matters for joining supply chains with large firms playing the
dominant role in Southeast Asian economies. Meanwhile, small and medium enterprises
(SMEs) make a small contribution to supply chain activity relatively to the sectors
employment or GDP contribution in South East Asian economies. However, firm size is not
the whole story. Efficiency – particularly investment in building technological capabilities
and skills – and access to commercial bank credit also influence joining supply chains. The
paper suggests that governments can facilitate SMEs joining supply chains through a market-
oriented strategy for SMEs, modern physical infrastructure, streamlined bureaucratic
procedures and good quality business support services.
________________
JEL Classification: F1, F2, F21, F23, F43, L25, and O31
Keywords: Global supply chains, firm-level analysis, firm size, SMEs, technological
capabilities, access to finance, policy and business environment, South East Asia
Author Email: [email protected]
__________
Disclaimer: The findings, interpretations, and conclusions expressed in the paper are entirely
those of the author alone and do not necessarily represent the views of the Asian
Development Bank, its Institute, its executive directors, or the countries they represent
_________________
Opinions and recommendations in the paper are exclusively of the author(s) and not of any
other individual or institution including ICRIER

1
Joining the Supply Chain:
A Firm-Level Perspective from Southeast Asia
Ganeshan Wignaraja
1. Introduction
Global production networks and supply chains (hereafter, supply chains) have transformed
Asia in recent decades (Baldwin 2013). Joining supply chains has been a fast-track route for
some Asian economies to industrialize and achieve unprecedented prosperity. Adopting
outward-oriented policy reforms have facilitated entry into supply chains. Rising inequality is
a problem in Asia and greater participation of small and medium-sized enterprises (SMEs) in
supply chains supports more inclusive growth (Lim and Kimura 2010). Increasing attention
has focused on measuring the magnitude of supply chain trade through trade in parts and
components and trade in value added (e.g., Ng and Yeats 2003; Athukorala 2011; Koopman
et al. 2010; and WTO and IDE-JETRO 2011). However, little micro-level work exists on
supply chains in Asia.1 The behavior of large firms and SMEs in supply chains in Asia thus
largely remains a mystery.
This paper studies the supply chain from the unique micro-level perspective of the firm. It
undertakes a comparative and firm-level analysis of factors influencing joining supply chains
in Southeast Asian economies. The research aims to improve our understanding of the micro-
level behavior of firms in supply chains and contribute to the handful of empirical studies on
Asia. The main focus of the research is a firm-level econometric investigation of why some
firms have been better able to join supply chains than others. This investigation draws on
recent literature emphasizing the notion of heterogeneity of firms and highlights key
enterprise characteristics (e.g., firm size, technological capabilities, skills, and access to
finance) underlying success. The research also maps supply chains in Southeast Asian
economies by firm size at the national and enterprise levels and explores the role of the
business environment in shaping enterprise behavior.
The absence of cross-country firm-level data was previously a binding constraint on micro-
level research on supply chains in Asia. This research benefitted from access to a large cross-
sectional enterprise dataset from the World Bank. It covers 5,900 firms in five economically
important outward-oriented Southeast Asian economies (Indonesia, Malaysia, the
Philippines, Thailand, and Viet Nam).
The paper is organized as follows. Section 2 reviews the literature and formulates hypotheses
for empirical testing. Section 3 sets out the empirical methodology. Section 4 maps supply
chains by firm size. Section 5 presents econometric results. Section 6 explores the role of the
Director of Research, Asian Development Bank Institute

2
policy and business environment. Section 7 concludes. The enterprise dataset is described in
Appendix 1.
2. Literature Review
An established body of trade, industrial organization, and technology literature points to the
overwhelming importance of firm-specific factors, on which competitive advantages are
built. As background to this research of the role of firms in supply chains, key aspects of the
theoretical and empirical literature are discussed here.
2.1 Theory
Several strands of literature can explain trade and supply chain activity of firms, which is the
focus of this paper. The so-called fragmentation of production approach—found in seminal
work by Jones and Kierzkowski (1990) and Arndt and Kierzkowski (2001)—has become the
standard framework for international economists to study supply chains. It shows how
increasing returns and the advantages of specialization of factors within firms encouraged the
location of different stages of manufacturing production across geographical space connected
by service links. Products traded between firms in different countries are components rather
than final goods. Papers by Kimura and Ando (2005) and Baldwin (2013) are among those
that develop conceptual explanations as to why fragmentation trade occurs. Meanwhile, Low
(2013) points out that the role of services in production and trade has been understated and
that this has become a greater problem with the growth of supply chains.
Competing methods have been used to quantify the magnitude of fragmentation trade. One
uses national trade data obtained from the United Nations trade data reporting system to
identify trade in parts and components (e.g., Ng and Yeats 2003; Athukorala 2011) which are
used as a proxy for supply chain trade. It shows that East Asia’s trade is increasingly made up
of parts and components trade, which suggests that global supply chains are growing in
importance in Asia. Within East Asia, the People’s Republic of China (PRC) has been the
major driving force but Southeast Asian economies have grown faster than the regional
average.2 More industrially developed economies such as Malaysia and Thailand are more
prominent in supply chain trade than other Southeast Asian economies. Another more
innovative method—relying on input–output tables to trace value added in production
networks—suggests that value added seems a more accurate means of capturing supply chain
activity in Asia than trade data (e.g., Koopman et al. 2010; and WTO and IDE-JETRO 2011).
Both methods are widely used to chart trends in supply chain trade, but their findings require
careful interpretation. However, neither method highlights factors affecting firms joining
supply chains. Case studies show that micro-level factors matter in supply chains. In
particular, case studies suggest that large multinational corporations, which use the region as
an international production base, drive the process of production fragmentation (Kuroiwa and
Heng 2008; Kuroiwa 2009).
3
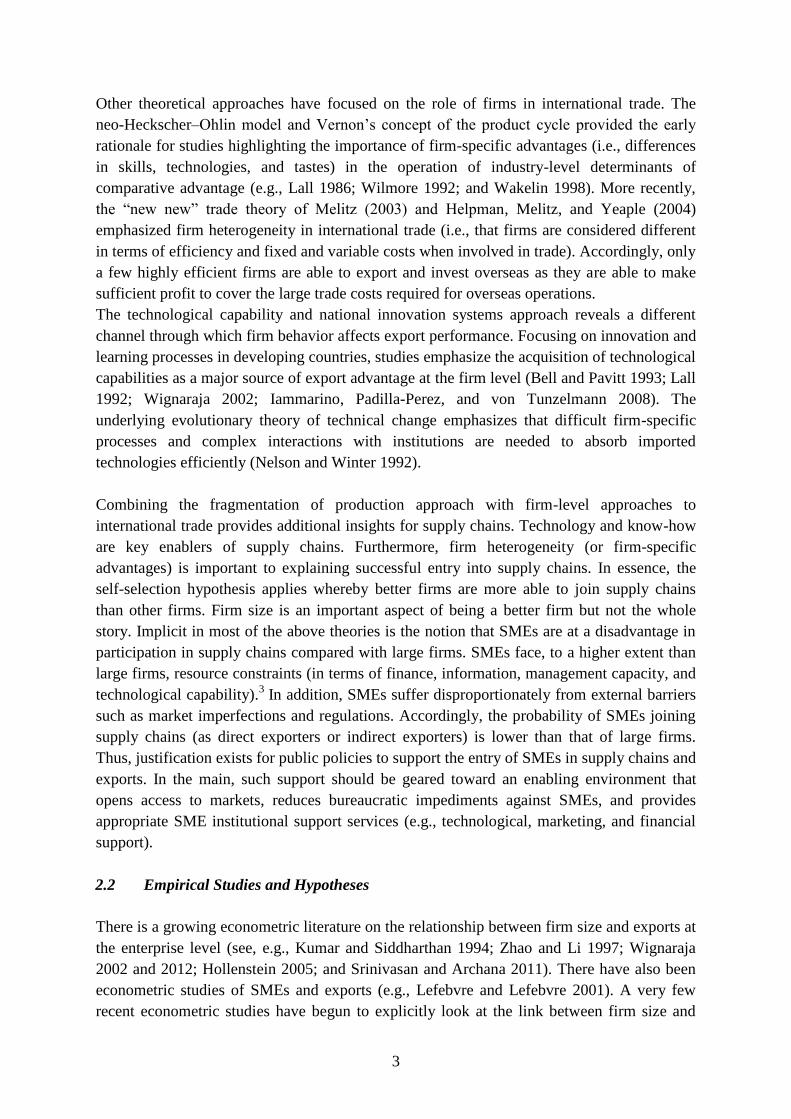
Other theoretical approaches have focused on the role of firms in international trade. The
neo-Heckscher–Ohlin model and Vernon’s concept of the product cycle provided the early
rationale for studies highlighting the importance of firm-specific advantages (i.e., differences
in skills, technologies, and tastes) in the operation of industry-level determinants of
comparative advantage (e.g., Lall 1986; Wilmore 1992; and Wakelin 1998). More recently,
the “new new” trade theory of Melitz (2003) and Helpman, Melitz, and Yeaple (2004)
emphasized firm heterogeneity in international trade (i.e., that firms are considered different
in terms of efficiency and fixed and variable costs when involved in trade). Accordingly, only
a few highly efficient firms are able to export and invest overseas as they are able to make
sufficient profit to cover the large trade costs required for overseas operations.
The technological capability and national innovation systems approach reveals a different
channel through which firm behavior affects export performance. Focusing on innovation and
learning processes in developing countries, studies emphasize the acquisition of technological
capabilities as a major source of export advantage at the firm level (Bell and Pavitt 1993; Lall
1992; Wignaraja 2002; Iammarino, Padilla-Perez, and von Tunzelmann 2008). The
underlying evolutionary theory of technical change emphasizes that difficult firm-specific
processes and complex interactions with institutions are needed to absorb imported
technologies efficiently (Nelson and Winter 1992).
Combining the fragmentation of production approach with firm-level approaches to
international trade provides additional insights for supply chains. Technology and know-how
are key enablers of supply chains. Furthermore, firm heterogeneity (or firm-specific
advantages) is important to explaining successful entry into supply chains. In essence, the
self-selection hypothesis applies whereby better firms are more able to join supply chains
than other firms. Firm size is an important aspect of being a better firm but not the whole
story. Implicit in most of the above theories is the notion that SMEs are at a disadvantage in
participation in supply chains compared with large firms. SMEs face, to a higher extent than
large firms, resource constraints (in terms of finance, information, management capacity, and
technological capability).3 In addition, SMEs suffer disproportionately from external barriers
such as market imperfections and regulations. Accordingly, the probability of SMEs joining
supply chains (as direct exporters or indirect exporters) is lower than that of large firms.
Thus, justification exists for public policies to support the entry of SMEs in supply chains and
exports. In the main, such support should be geared toward an enabling environment that
opens access to markets, reduces bureaucratic impediments against SMEs, and provides
appropriate SME institutional support services (e.g., technological, marketing, and financial
support).
2.2 Empirical Studies and Hypotheses
There is a growing econometric literature on the relationship between firm size and exports at
the enterprise level (see, e.g., Kumar and Siddharthan 1994; Zhao and Li 1997; Wignaraja
2002 and 2012; Hollenstein 2005; and Srinivasan and Archana 2011). There have also been
econometric studies of SMEs and exports (e.g., Lefebvre and Lefebvre 2001). A very few
recent econometric studies have begun to explicitly look at the link between firm size and
4
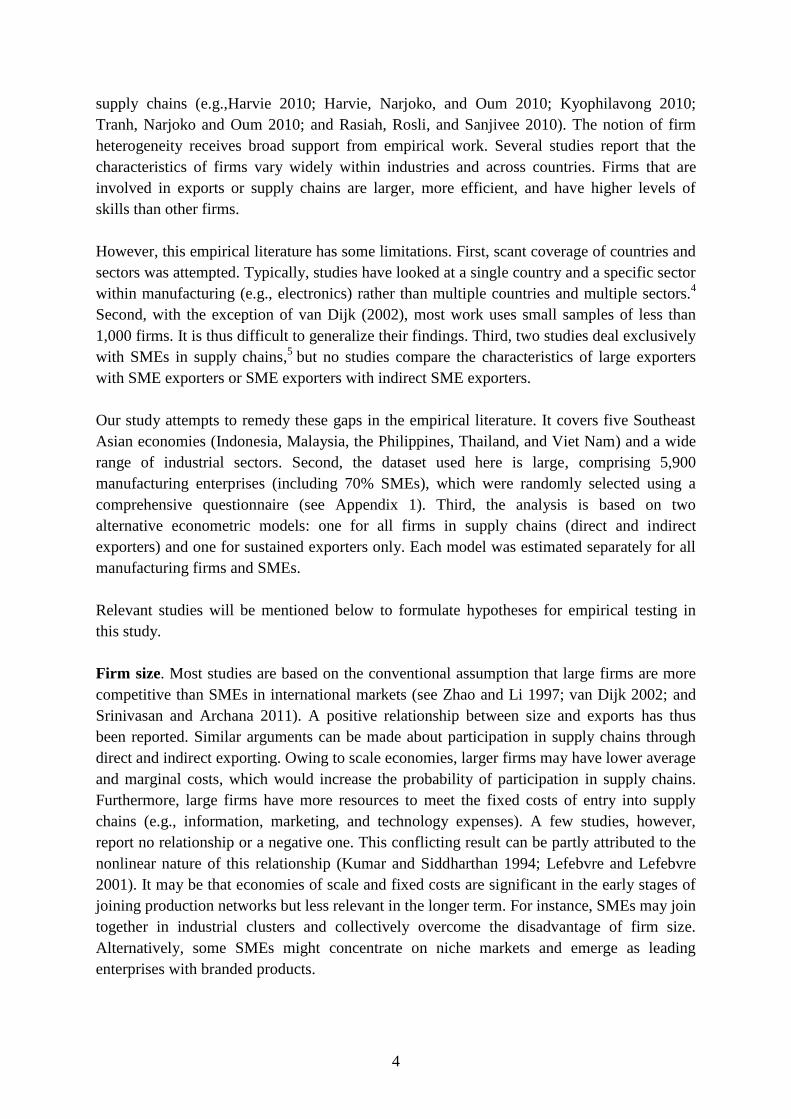
supply chains (e.g.,Harvie 2010; Harvie, Narjoko, and Oum 2010; Kyophilavong 2010;
Tranh, Narjoko and Oum 2010; and Rasiah, Rosli, and Sanjivee 2010). The notion of firm
heterogeneity receives broad support from empirical work. Several studies report that the
characteristics of firms vary widely within industries and across countries. Firms that are
involved in exports or supply chains are larger, more efficient, and have higher levels of
skills than other firms.
However, this empirical literature has some limitations. First, scant coverage of countries and
sectors was attempted. Typically, studies have looked at a single country and a specific sector
within manufacturing (e.g., electronics) rather than multiple countries and multiple sectors.4
Second, with the exception of van Dijk (2002), most work uses small samples of less than
1,000 firms. It is thus difficult to generalize their findings. Third, two studies deal exclusively
with SMEs in supply chains,5 but no studies compare the characteristics of large exporters
with SME exporters or SME exporters with indirect SME exporters.
Our study attempts to remedy these gaps in the empirical literature. It covers five Southeast
Asian economies (Indonesia, Malaysia, the Philippines, Thailand, and Viet Nam) and a wide
range of industrial sectors. Second, the dataset used here is large, comprising 5,900
manufacturing enterprises (including 70% SMEs), which were randomly selected using a
comprehensive questionnaire (see Appendix 1). Third, the analysis is based on two
alternative econometric models: one for all firms in supply chains (direct and indirect
exporters) and one for sustained exporters only. Each model was estimated separately for all
manufacturing firms and SMEs.
Relevant studies will be mentioned below to formulate hypotheses for empirical testing in
this study.
Firm size. Most studies are based on the conventional assumption that large firms are more
competitive than SMEs in international markets (see Zhao and Li 1997; van Dijk 2002; and
Srinivasan and Archana 2011). A positive relationship between size and exports has thus
been reported. Similar arguments can be made about participation in supply chains through
direct and indirect exporting. Owing to scale economies, larger firms may have lower average
and marginal costs, which would increase the probability of participation in supply chains.
Furthermore, large firms have more resources to meet the fixed costs of entry into supply
chains (e.g., information, marketing, and technology expenses). A few studies, however,
report no relationship or a negative one. This conflicting result can be partly attributed to the
nonlinear nature of this relationship (Kumar and Siddharthan 1994; Lefebvre and Lefebvre
2001). It may be that economies of scale and fixed costs are significant in the early stages of
joining production networks but less relevant in the longer term. For instance, SMEs may join
together in industrial clusters and collectively overcome the disadvantage of firm size.
Alternatively, some SMEs might concentrate on niche markets and emerge as leading
enterprises with branded products.
5
As a result of the above discussion, the following hypothesis is proposed: Hypothesis 1—firm
size is expected to have a positive effect on participation in supply chains up to a given
threshold, but may not matter later on.
Technological capabilities. Empirical studies indicate that firm-level technological
capabilities contribute to export performance (Zhao and Li 1997; Hobday 2001; Rasiah 2004;
Wignaraja 2002, 2011, and 2012). Building technological capabilities in developing country
firms, particularly SMEs, is not just a simple function of years of production experience.
Rather, it requires conscious investments in creating skills and information to operate
imported technology efficiently. Such investments involve a spectrum of technological
activities, such as technology search, quality management, engineering, and research and
development (R&D) activities (Kumar and Siddharthan 1994; Lefebvre and Lefebvre 2001).
Importing technology through foreign licenses is an important mechanism for transfer of new
technologies and internal capability building. Furthermore, foreign buyers and subcontractors
view internal quality standards (e.g., International Organization for Standardization [ISO]
certification) as increasingly compulsory for enterprises to qualify as potential suppliers.
Developing new products (or modifying existing products) and taking out patents to protect
intellectual property rights also facilitate export competitiveness at the firm level.
These considerations suggest: Hypothesis 2—firms that have acquired high levels of
technological capabilities are more likely to succeed in supply chains.
Human capital. Within a given activity, a higher level of human capital contributes to a
firm’s export performance. Higher levels of human capital are generally linked with
development of more effective business strategies and more rapid technological learning that
can provide a competitive edge at the enterprise level (van Dijk 2002; Dueñas-Caparas 2006).
Enterprises with a stock of high-quality human capital are expected to be more likely to
perform well in supply chains as this is essential for forging close supplier relationships with
large exporters, effective technology transfer, and efficient production of orders (Harvie,
Narjoko, and Oum 2010). Although human capital at all levels is important, workers’
education and that of the chief executive officer (CEO) and his or her experience are
particularly significant for participation in supply chains. A literate workforce made up of
high school graduates is more productive and adaptive to new technology than one that is not.
Furthermore, a CEO with a college degree or vocational training as well as work experience
may have a better business attitude (i.e., in terms of risk taking or willingness to implement
new business ideas). In SMEs, with few high school-educated workers, much of the firm’s
human capital may be reflected in the quality of the CEO’s education and experience.
Accordingly, the following could be said: Hypothesis 3—higher levels of human capital, in
terms of secondary level educated workers or well-educated and experienced CEOs, are
positively correlated with joining supply chains.
Age. A learning by doing effect may be at work. The older the firm, the more accumulated
experience in production and tacit knowledge, which is likely to facilitate participation in
6
supply chains. Alternatively, a technology lock in effect may apply whereby mature firms
may become complacent with an overreliance on accumulated experience and set in past
ways. Meanwhile, younger firms may be at an advantage in joining supply chains for two
reasons. First, younger enterprises may use relatively modern technology, which increases
productivity and product quality (van Dijk 2002). Second, they may be more proactive in
learning about business and technological opportunities in supply chains. For instance,
younger firms may be more nimble in seeking out new sources of information and external
knowledge, such as market information from buyers of output or technical know-how from
equipment suppliers. Younger firms may be more flexible in combining external and internal
information to realize opportunities in supply chains.
Bearing in mind these different possibilities, the following hypothesis is put forward:
Hypothesis 4—firm age needs to be controlled for when looking for relationships between
factors affecting firm-level participation in supply chains.
Foreign ownership. A joint venture with a foreign partner (or 100% foreign equity)
facilitates participation in supply chains, as it enables firms to reap the ownership advantages
of parent companies (Wilmore 1992; Nguyen and Nishijima 2009; Srinivasan and Archana
2011). First, access to the superior marketing connections and know-how of parent
companies enables direct and indirect exporting. Second, access to parent companies’
accumulated learning experience of export production as well as access to sophisticated
technologies and management experience improves technical efficiency. The transfer of such
ownership-specific advantages depends on whether the foreign firm has a controlling interest
in the domestic venture. A controlling interest typically can occur with minority foreign
equity in a project rather than total foreign equity. In most of the previous literature on firm-
level exporting and participation in supply chains, it has been consistently observed that
foreign ownership matters.
These arguments lead to the following proposition: Hypothesis 5—foreign ownership is
positively related to participation in supply chains because it provides access to superior
marketing, technology, and management expertise.
Access to credit. Access to credit for working capital and investment is typically a binding
constraint on the involvement of firms in supply chains (Harvie, Narjoko, and Oum 2010).
Capital markets in developing countries are highly segmented into a formal bank sector and
informal sources due to various market imperfections associated with underdevelopment.
Credit from commercial banks is usually cheaper than finance from informal credit sources
but requires substantial information about balance sheets and collateral. Many firms
(including SMEs) find it difficult to provide the requisite financial information and collateral
and instead rely on internally generated funds or more expensive informal sources. This puts
them at a cost disadvantage compared to well-organized firms with an established record with
commercial banks.

7
The following hypothesis emerges: Hypothesis 6—enterprises with access to bank credit are
more likely to join supply chains than other firms.
3. Empirical Methodology
In order to examine the firm-level characteristics shaping all manufacturing firms’ and
SMEs’ joining supply chains, the following general equation is estimated:
Y = X + , (1)
where Y is the vector denoting joining supply chains at the firm level, X is the matrix of
explanatory variables, is the matrix of coefficients, and is the matrix of error terms.
Joining supply chains is captured by a binary variable reflecting different activities by firms
in such networks, particularly SMEs. The probit model in two alternative forms was used
here. In the first, the dependent variable takes a value of 1 if a firm undertakes any form of
activity in a supply chain (i.e., as an exporter, an indirect exporter, or some combination of
the two) and 0 for a wholly domestic market-oriented firm. In the second, the dependent
variable is 1 if the firm’s primary mission is to export (defined as more than total sales being
exported globally) and 0 otherwise.
The first captures all involvement of firms in supply chains regardless of the intensity of
exporting or indirect exporting behavior (subcontracting or input supply) of a given firm.
While this definition is inclusive, it encompasses a range of participation in supply chains
from occasional and limited involvement of firms to more sustained involvement.
Accordingly, the second was formulated to represent a more focused mission of sustained
involvement in supply chains through exports. It is interesting to examine whether the
determinants are the same for both models. Our approach refines previous work which did
not distinguish between different activities undertaken by SMEs in production networks.6
The hypotheses were described in section 2. The explanatory variables in X in equation (1)
are described in the following and Table 1 includes a summary.
8
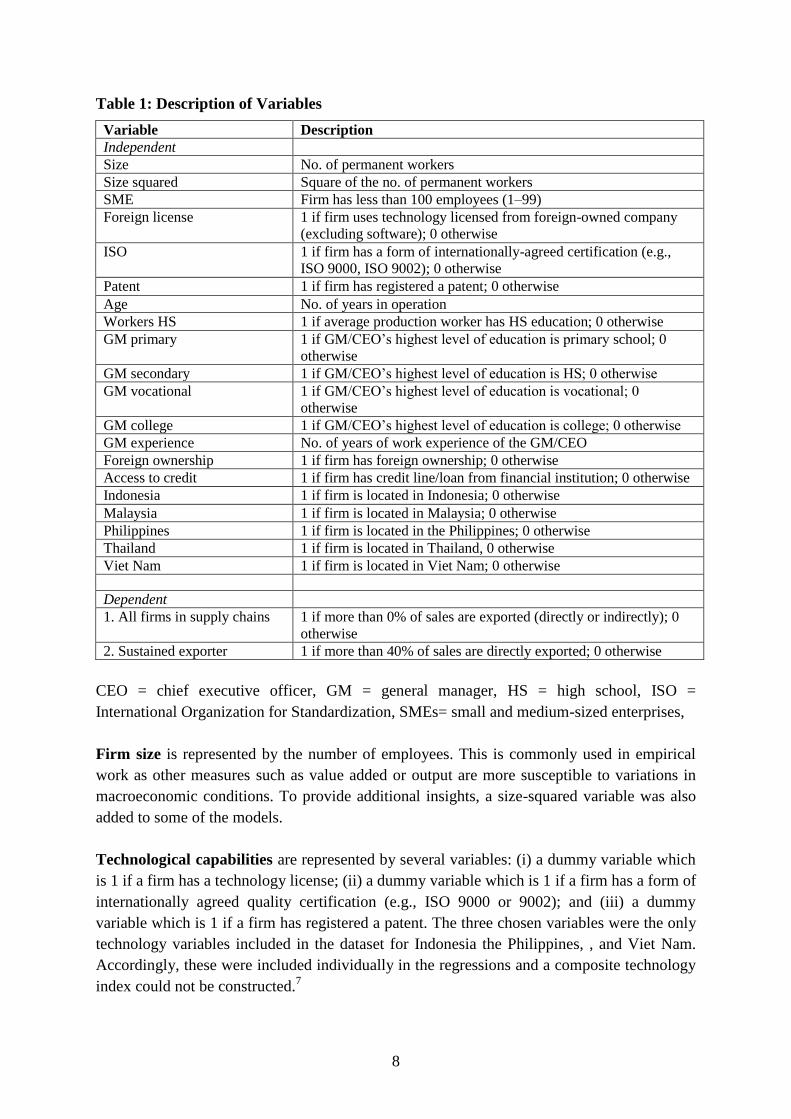
Table 1: Description of Variables
Variable Description
Independent
Size No. of permanent workers
Size squared Square of the no. of permanent workers
SME Firm has less than 100 employees (1–99)
Foreign license 1 if firm uses technology licensed from foreign-owned company
(excluding software); 0 otherwise
ISO 1 if firm has a form of internationally-agreed certification (e.g.,
ISO 9000, ISO 9002); 0 otherwise
Patent 1 if firm has registered a patent; 0 otherwise
Age No. of years in operation
Workers HS 1 if average production worker has HS education; 0 otherwise
GM primary 1 if GM/CEO’s highest level of education is primary school; 0
otherwise
GM secondary 1 if GM/CEO’s highest level of education is HS; 0 otherwise
GM vocational 1 if GM/CEO’s highest level of education is vocational; 0
otherwise
GM college 1 if GM/CEO’s highest level of education is college; 0 otherwise
GM experience No. of years of work experience of the GM/CEO
Foreign ownership 1 if firm has foreign ownership; 0 otherwise
Access to credit 1 if firm has credit line/loan from financial institution; 0 otherwise
Indonesia 1 if firm is located in Indonesia; 0 otherwise
Malaysia 1 if firm is located in Malaysia; 0 otherwise
Philippines 1 if firm is located in the Philippines; 0 otherwise
Thailand 1 if firm is located in Thailand, 0 otherwise
Viet Nam 1 if firm is located in Viet Nam; 0 otherwise
Dependent
1. All firms in supply chains 1 if more than 0% of sales are exported (directly or indirectly); 0
otherwise
2. Sustained exporter 1 if more than 40% of sales are directly exported; 0 otherwise
CEO = chief executive officer, GM = general manager, HS = high school, ISO =
International Organization for Standardization, SMEs= small and medium-sized enterprises,
Firm size is represented by the number of employees. This is commonly used in empirical
work as other measures such as value added or output are more susceptible to variations in
macroeconomic conditions. To provide additional insights, a size-squared variable was also
added to some of the models.
Technological capabilities are represented by several variables: (i) a dummy variable which
is 1 if a firm has a technology license; (ii) a dummy variable which is 1 if a firm has a form of
internationally agreed quality certification (e.g., ISO 9000 or 9002); and (iii) a dummy
variable which is 1 if a firm has registered a patent. The three chosen variables were the only
technology variables included in the dataset for Indonesia the Philippines, , and Viet Nam.
Accordingly, these were included individually in the regressions and a composite technology
index could not be constructed.7

9
Age is represented by the number of years in operation of the firm. This is more accurate than
number of years since establishment as there can be a lag between the legal incorporation of a
firm and the start-up of plant operations.
Human capital is proxied by the following variables:8 (i) a dummy variable which is 1 if the
average production worker has high school education; (ii) four dummy variables to capture
different levels of educational attainment of the CEO from primary schooling to college
education; and (iii) the number of years of work experience of the CEO. In line with the
hypothesis on human capital, these variables attempt to capture the average quality of
education of workers and the CEO. In addition, the CEO’s experience is included.
Foreign ownership is captured by a dummy variable which takes a value of 1 if the firm has
any foreign equity. The standard measure—share of foreign equity—seems to suffer from
some noise and may be correlated with number of employees.
Access to credit is proxied by a dummy variable which is 1 if a firm has a credit line or loan
from a formal financial institution.
In addition, four country dummy variables were included to capture country-specific effects
of the five Southeast Asian economies.
4. Mapping Supply Chains by Firm Size
4.1 Insights from National Data and Problems
Research on firm size in Southeast Asian economies is scarce and sometimes contentious. A
major problem facing such research is the dearth of data at the sectoral level and the use of
different definitions of SMEs (e.g., turnover, employment, assets, etc.). Appendix 2 shows
the definitions of SMEs in Southeast Asia and other economies. In Thailand and Viet Nam,
SMEs are defined by broad economic sectors and assets or employees. Malaysia defines
SMEs by broad economic sectors and turnover or employees. Indonesia uses only assets or
turnover, while the Philippines relies only on assets. A further problem is that assets or
turnover are expressed in national currencies and the firm size thresholds are not comparable
when converted into US dollars. These problems make it difficult to reliably compare the role
of SMEs across Southeast Asian economies over time. As a crude approximation, studies
(e.g., Harvie and Lee 2002; Tambunan 2009; Lim and Kimura 2010) have typically used
national SME definitions to compute the share of SMEs in employment, gross domestic
product (GDP), and exports in Southeast Asian economies for the most recent year. The
balance shares of economic aggregates are attributed to large firms. The SME shares of
exports can be used as an indication of the sector’s involvement in supply chains.
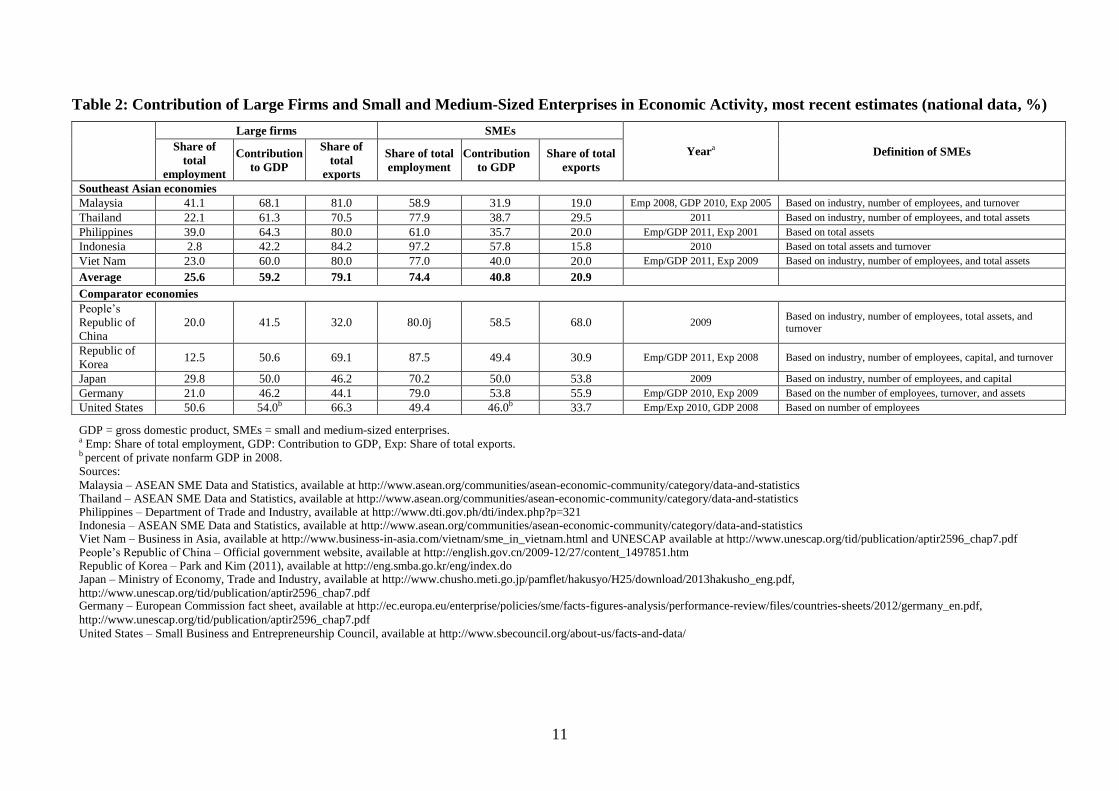
Following this approach, Table 2 provides most recent estimates of economic activity by firm
size for the five Southeast Asian economies in this study and for other selected economies

10
(the PRC, Germany, the Republic of Korea, Japan and the US). Several interesting findings
emerge.
First, on average, SMEs account for the majority of national employment in Southeast Asian
economies (74.4%) and a notable share of GDP (40.8%). Meanwhile, large firms account for
the remainder (25.6% of employment and 59.2% of GDP). Inter-country variations are visible
in these figures. Indonesia seems an outlier in Southeast Asia with SMEs accounting for as
much as 97.2% of employment and 57.8% of GDP. The figures for the Southeast Asian
economies are generally in line with international trends. SMEs make up the majority of
employment and about half of GDP in the comparator economies. The US has a much lower
SME share of employment than other comparator economies.
Second, SMEs in Southeast Asian economies make relatively little contribution to exports
relative to the sector’s size or employment contribution. On average, SMEs account for only
20.9% of exports compared to 79.1% for large firms. A comparison with an earlier study by
Harvie and Lee (2002) suggests that the figure for SME exports in Southeast Asian
economies may have modestly risen over time.9 It thus appears that SMEs in Southeast Asia
play a limited role in supply chains as direct exporters. It is possible, however, that SME
export shares in Southeast Asian economies may be understated if indirect exports through
subcontracting or input supply are included (Tambunan 2009). Data gaps, however, make it
hard to estimate the indirect contribution of SMEs to national exports.
Third, Thailand seems an outlier among the five Southeast Asian economies with a relatively
high share of its exports (29.5%) originating from SMEs. The other Southeast Asian
economies have notably lower SME export shares. In Indonesia, the figure is particularly low
(15.8%).
Fourth, SMEs in more industrialized East Asian economies and other developed economies
are more involved in supply chains as direct exporters than in Southeast Asian economies.
The data show that as much as 68% of the PRC’s exports, 53.8% of Japan’s exports, and
30.9% of the Republic of Korea’s exports come from SMEs. It seems that room exists for the
advancement of SMEs in Southeast Asian economies’ exports through supply chains.
National-level data, however, suffer from some important drawbacks from the perspective of
this study on enterprise behavior in supply chains. As discussed earlier, no standard definition
of firm size exists for national data collection in Southeast Asian economies, which makes
cross-country comparisons problematic. Furthermore, national sources on Southeast Asian
economies lack data on indirect SME exports (for small firms as input suppliers or
subcontractors) and explanatory variables for micro-level econometric analysis of supply
chains or exports. To remedy these problems with national data sources, our study was based
on information from multi-country, multi-firm surveys collected by the World Bank’s
Enterprise Surveys. Appendix 1 describes the cross-section dataset of 5,900 enterprises in the
five Southeast Asian economies, which was collected in the late-2000s. The absence of cross-
country firm-level data has been up to now a binding constraint on such research.
11
Table 2: Contribution of Large Firms and Small and Medium-Sized Enterprises in Economic Activity, most recent estimates (national data, %)
Large firms SMEs
Yeara Definition of SMEs Share of
total
employment
Contribution
to GDP
Share of
total
exports
Share of total
employment
Contribution
to GDP
Share of total
exports
Southeast Asian economies
Malaysia 41.1 68.1 81.0 58.9 31.9 19.0 Emp 2008, GDP 2010, Exp 2005 Based on industry, number of employees, and turnover
Thailand 22.1 61.3 70.5 77.9 38.7 29.5 2011 Based on industry, number of employees, and total assets
Philippines 39.0 64.3 80.0 61.0 35.7 20.0 Emp/GDP 2011, Exp 2001 Based on total assets
Indonesia 2.8 42.2 84.2 97.2 57.8 15.8 2010 Based on total assets and turnover
Viet Nam 23.0 60.0 80.0 77.0 40.0 20.0 Emp/GDP 2011, Exp 2009 Based on industry, number of employees, and total assets
Average 25.6 59.2 79.1 74.4 40.8 20.9
Comparator economies
People’s
Republic of
China
20.0 41.5 32.0 80.0j 58.5 68.0 2009 Based on industry, number of employees, total assets, and turnover
Republic of
Korea 12.5 50.6 69.1 87.5 49.4 30.9 Emp/GDP 2011, Exp 2008 Based on industry, number of employees, capital, and turnover
Japan 29.8 50.0 46.2 70.2 50.0 53.8 2009 Based on industry, number of employees, and capital
Germany 21.0 46.2 44.1 79.0 53.8 55.9 Emp/GDP 2010, Exp 2009 Based on the number of employees, turnover, and assets
United States 50.6 54.0b 66.3 49.4 46.0b 33.7 Emp/Exp 2010, GDP 2008 Based on number of employees
GDP = gross domestic product, SMEs = small and medium-sized enterprises. a Emp: Share of total employment, GDP: Contribution to GDP, Exp: Share of total exports. b percent of private nonfarm GDP in 2008.
Sources:
Malaysia – ASEAN SME Data and Statistics, available at http://www.asean.org/communities/asean-economic-community/category/data-and-statistics Thailand – ASEAN SME Data and Statistics, available at http://www.asean.org/communities/asean-economic-community/category/data-and-statistics Philippines – Department of Trade and Industry, available at http://www.dti.gov.ph/dti/index.php?p=321 Indonesia – ASEAN SME Data and Statistics, available at http://www.asean.org/communities/asean-economic-community/category/data-and-statistics Viet Nam – Business in Asia, available at http://www.business-in-asia.com/vietnam/sme_in_vietnam.html and UNESCAP available at http://www.unescap.org/tid/publication/aptir2596_chap7.pdf People’s Republic of China – Official government website, available at http://english.gov.cn/2009-12/27/content_1497851.htm Republic of Korea – Park and Kim (2011), available at http://eng.smba.go.kr/eng/index.do Japan – Ministry of Economy, Trade and Industry, available at http://www.chusho.meti.go.jp/pamflet/hakusyo/H25/download/2013hakusho_eng.pdf,
http://www.unescap.org/tid/publication/aptir2596_chap7.pdf Germany – European Commission fact sheet, available at http://ec.europa.eu/enterprise/policies/sme/facts-figures-analysis/performance-review/files/countries-sheets/2012/germany_en.pdf,
http://www.unescap.org/tid/publication/aptir2596_chap7.pdf
United States – Small Business and Entrepreneurship Council, available at http://www.sbecouncil.org/about-us/facts-and-data/

12
4.2 Findings on Firm Size in Supply Chains
Table 3 provides data on aspects of the sample firms’ overall participation in supply chains
for each Southeast Asian economy sample and across the five countries. These include the
number of firms in supply chains (i.e., both direct and indirect exporters), large firms in
supply chains as a percentage of all large firms, and SMEs in supply chains as a percentage of
all SMEs. Table 3 also provides data on export behavior by firm size, including the
percentage of exports from large firms and SMEs in total export value as well as the share of
the top 25% of SME exporters in terms of export value.
Table 3: Role of Large Firmsa and SMEsb in Supply Chains (firm survey data)
All
Sample
Countries
Malaysia Thailand Philippines Indonesia Viet
Nam
(1) Number of firms in
supply chainsc
2,203 646 619 352 206 380
(2) Supply chain firms
as a percentage of
all firms, %
37.3 59.7 59.3 26.9 14.5 36.4
(3) Large firms in
supply chains as a
percentage of all
large firms, %
72.1 82.4 91.1 51.1 52.0 64.6
(4) SMEs in supply
chains as a
percentage of all
SMEs, %
22.0 46.2 29.6 20.1 6.3 21.4
(5) Share of large firms
in total exports, % 77.0 71.9 65.3 66.6 90.7 83.2
(6) Share of SMEs in
total exports, % 23.0 28.1 34.7 33.4 9.3 16.8
(7) Share of top 25%
SME exporters in
terms of export
value, %
85.8 69.9 85.0 78.9 96.3 76.2
(8) Share of SMEs that
are 100% exportersd
18.2 14.1 16.4 27.2 15.0 19.2
SMEs = small and medium-sized enterprises.
Notes: a Large firms are defined as firms with 100 or more employees.
b SMEs are defined as firms with 1–99 employees.
c Number of firms in supply chain includes direct and indirect exporters.
d SMEs that don’t serve the domestic market.
Source: Author’s calculations based on World Bank Enterprise Surveys.
13
The following can be observed:
A minority of the sample firms (37.3% of the total) are in supply chains. More
developed Southeast Asian economies such as Malaysia and Thailand have particularly
high representation in supply chains (nearly 60% of their firms participate). Viet Nam
(36.4%) follows. The Philippines (26.9%) and Indonesia (14.5%) have relatively low
participation in supply chains.
Large firms are the major players in supply chains with 72.1% of all large firms
participating. Most of the large firms in Malaysia and Thailand are involved in supply
chains and over half the large firms in the remaining three countries.
SMEs are minor players in supply chains as only 22.0% of all SMEs participate. SME
participation rates vary considerably across Southeast Asian economies. As much as
46.2% of all SMEs in Malaysia and 29.6% of all SMEs in Thailand are involved in
supply chains. In Viet Nam, the figure is 21.4% and in the Philippines 20.1%. Indonesia
seems an outlier with only 6.3% of all SMEs involved in supply chains.
A small fraction of SMEs in supply chains are 100% global exporters. The vast majority
of such SMEs engage in either a mix of global exports and indirect exporting, or purely
indirect exports. Accordingly, only 18.2% of SMEs in supply chains in all the countries
are 100% global exporters. The figures by country are: Malaysia (14.1%), Thailand
(16.4%), Philippines (27.2%), Indonesia (15.0%), and Viet Nam (19.2%).
Large firms (77%) make a larger contribution to exports in all countries compared with
SMEs (23%). The country-level pattern of SME export shares is broadly reflective of
the picture of SME participation in supply chains. Malaysia (28.1%) and Thailand
(34.7%) are among the leaders in terms of SME export shares. The Philippines,
unexpectedly, has a similarly high SME export share (33.4%), which may partly reflect
the high proportion of SME numbers in the country sample. Viet Nam’s SME export
share is 16.8%, while Indonesia’s is 9.3%.
SME exports are highly concentrated in a relatively few firms in the Southeast Asian
economies: The top 25% of SMEs account for 85.8% of SME exports in all countries.
Concentration in the top 25% SME exporters is highest in Indonesia (96.3%). This is
followed by Thailand (85.0%), the Philippines (78.9%), Viet Nam (76.2%), and
Malaysia (69.9%).
5. Econometric Results
This section examines factors influencing the engagement of firms in supply chains in the
five Southeast Asian economies. A probit model was used to estimate equation (1) specified
in Section 3 using the two alternative dependent variables but with the same set of
14
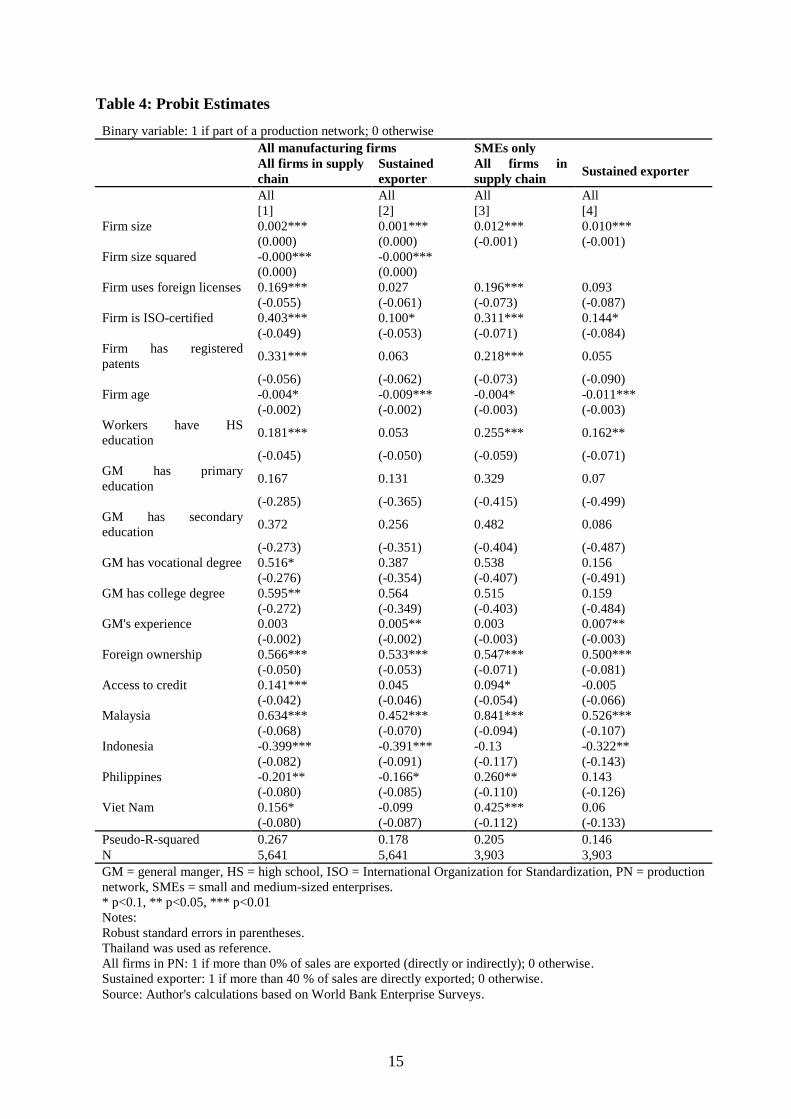
determinants. The results of the probit regressions are shown in Table 4. Column 1 shows the
results of the model for all manufacturing firms in supply chains, while the results of
sustained exporters are in column 2. The results for SMEs are in columns 3 and 4.
Following diagnostic testing, we first consider the results for all manufacturing firms and
then for SMEs. As shown by a higher R2, the “all manufacturing firms in supply chains”
model better fits the outcome data than the “sustained exporters” model. Many of the firm-
specific variables are significant, as hypothesized. The coefficient of firm size is positive and
significant, as expected, in both models. Adding a size-squared variable in the all
manufacturing firms model was useful in clarifying the size effect. The coefficient on size-
squared is negative and significant, implying a nonlinear relationship. Thus, it seems that
economies of scale and fixed costs are important in the early stages of joining production
networks, but less relevant over time as SMEs become important players in their own niche
markets or form industrial clusters.
The coefficient on internationally agreed quality certification is positive and significant in
both models. Having an internationally agreed quality certificate (like ISO) increases the
probability of a firm joining a supply chain. Foreign licenses and registered patents are also
significant with the correct sign in the all manufacturing firms model. Accordingly, firms that
have acquired higher levels of technological capabilities are more likely to succeed in supply
chains.10
This requires firms to undertake conscious investments in skills and information to
operate imported technologies rather than simply learning by doing. Capability building
involves a range of technological activities, including actively acquiring new technologies
through foreign licenses, implementing international quality standards, and developing new
products supported by patent protection.
The firm age variable is negative and significant in both models, thereby contradicting the
hypothesized positive sign. While age may be a proxy for many influences, this result
suggests that younger firms are likely to be more nimble in learning new market and
technological information and more flexible in combining internal and external knowledge in
an efficient manner. Both of these traits are likely to facilitate younger firms joining
production networks.
15
Table 4: Probit Estimates
Binary variable: 1 if part of a production network; 0 otherwise
All manufacturing firms SMEs only
All firms in supply
chain
Sustained
exporter
All firms in
supply chain Sustained exporter
All All All All
[1] [2] [3] [4]
Firm size 0.002*** 0.001*** 0.012*** 0.010***
(0.000) (0.000) (-0.001) (-0.001)
Firm size squared -0.000*** -0.000***
(0.000) (0.000)
Firm uses foreign licenses 0.169*** 0.027 0.196*** 0.093
(-0.055) (-0.061) (-0.073) (-0.087)
Firm is ISO-certified 0.403*** 0.100* 0.311*** 0.144*
(-0.049) (-0.053) (-0.071) (-0.084)
Firm has registered
patents 0.331*** 0.063 0.218*** 0.055
(-0.056) (-0.062) (-0.073) (-0.090)
Firm age -0.004* -0.009*** -0.004* -0.011***
(-0.002) (-0.002) (-0.003) (-0.003)
Workers have HS
education 0.181*** 0.053 0.255*** 0.162**
(-0.045) (-0.050) (-0.059) (-0.071)
GM has primary
education 0.167 0.131 0.329 0.07
(-0.285) (-0.365) (-0.415) (-0.499)
GM has secondary
education 0.372 0.256 0.482 0.086
(-0.273) (-0.351) (-0.404) (-0.487)
GM has vocational degree 0.516* 0.387 0.538 0.156
(-0.276) (-0.354) (-0.407) (-0.491)
GM has college degree 0.595** 0.564 0.515 0.159
(-0.272) (-0.349) (-0.403) (-0.484)
GM's experience 0.003 0.005** 0.003 0.007**
(-0.002) (-0.002) (-0.003) (-0.003)
Foreign ownership 0.566*** 0.533*** 0.547*** 0.500***
(-0.050) (-0.053) (-0.071) (-0.081)
Access to credit 0.141*** 0.045 0.094* -0.005
(-0.042) (-0.046) (-0.054) (-0.066)
Malaysia 0.634*** 0.452*** 0.841*** 0.526***
(-0.068) (-0.070) (-0.094) (-0.107)
Indonesia -0.399*** -0.391*** -0.13 -0.322**
(-0.082) (-0.091) (-0.117) (-0.143)
Philippines -0.201** -0.166* 0.260** 0.143
(-0.080) (-0.085) (-0.110) (-0.126)
Viet Nam 0.156* -0.099 0.425*** 0.06
(-0.080) (-0.087) (-0.112) (-0.133)
Pseudo-R-squared 0.267 0.178 0.205 0.146
N 5,641 5,641 3,903 3,903
GM = general manger, HS = high school, ISO = International Organization for Standardization, PN = production
network, SMEs = small and medium-sized enterprises.
* p<0.1, ** p<0.05, *** p<0.01
Notes:
Robust standard errors in parentheses.
Thailand was used as reference.
All firms in PN: 1 if more than 0% of sales are exported (directly or indirectly); 0 otherwise.
Sustained exporter: 1 if more than 40 % of sales are directly exported; 0 otherwise.
Source: Author's calculations based on World Bank Enterprise Surveys.
16
The coefficient on workers’ high school education is positive and significant in the all
manufacturing firms model. Having a high school-educated workforce increases the
probability of a firm joining a supply chain. Furthermore, the CEO having a college degree or
vocational degree is positive and significant in the all manufacturing firms model.
Meanwhile, the CEO’s experience is positive and significant in the sustained exporters
model. These results suggest that higher levels of human capital, particularly literate
secondary-level educated workers, college and vocational educated CEOs, and experienced
CEOs, increase the probability of a manufacturing firm joining a supply chain.
The foreign ownership variable has a positive and significant effect on the probability of
joining supply chains in both models. Access to the superior marketing connections and
know-how of parent companies enables direct and indirect exporting by firms. Furthermore,
access to parent companies’ accumulated learning experience of export production as well as
access to sophisticated technologies and management experience improves technical
efficiency in firms.
Access to commercial bank credit is positive and significant in the all manufacturing firms
model. This suggests that, in the presence of capital market imperfections, well-organized
firms with collateral and an established record with commercial banks are more likely to join
production networks.
The significance of the coefficients on the country dummies suggests that some differences
exist between the Southeast Asian countries. Indonesia, Malaysia, and the Philippines are
significant in both models. Viet Nam is significant in the all manufacturing firms model.
The two all manufacturing firms models provide a somewhat better fit than the two SME
models (compare the R2 in columns 1 and 2 with columns 3 and 4). The all SMEs model
(column 3) is a better fit to the outcome data than the sustained SME exporters model
(column 4). Interestingly, several variables (firm size, international quality certification, firm
age, workers high school education and foreign ownership) turn out as significant with the
correct sign in both SME models. Hence, the key determinants of firm-level participation in
supply chains are remarkably stable across the four models, suggesting that the pattern for all
manufacturing firms broadly holds for SMEs.
There are also some differences between the all-manufacturing-firms models (columns 1 and
2) and the SME models (columns 3 and 4). The size-squared variable was not significant in
either SME model. In addition, the CEO’s characteristics are less pronounced in the SME
models, with only CEO’s experience being significant in the sustained-SME-exporters model.
Finally, country characteristics matter but differ somewhat between the different models.
It is interesting to examine some predicted probabilities of the size variable holding all other
variables at their means.11
In the all-SMEs model (column 3) the probability of an SME
participating in a supply chain for a firm with 1 to 25 workers is 10%, compared to 35% for
one that has 75 to 100 workers. Having an internationally agreed quality certificate (like ISO)

17
increases the probability of an SME joining a supply chain from 16% to 25% in the all-SMEs
model 3. Having a high school-educated workforce increases the probability of an SME
joining a production network from 14% to 21% in the all-SMEs model 3.
6. Exploring the Policy and Business Environment
6.1 Incentive and Supply-Side Policies
The overall business environment in Southeast Asian economies is an important influence on
firms joining supply chains. A myriad of reform policies, factor markets, and targeted
policies are involved. These range from trade policies and customs regulations to business
start-up regulations, export promotion initiatives, special financing schemes, and technology
support measures.12
It is hard to portray the overall business environment in Southeast Asian
economies and disentangle the different effects on firms. One practical method is to use
available data on enterprise perceptions to examine the supportive nature of the business
environment facing SMEs in their quest to participate in supply chains. SME-level analysis of
the business environment is useful to formulate policy implications for SMEs, which are less
present in supply chains or exports than large firms in Southeast Asian economies.
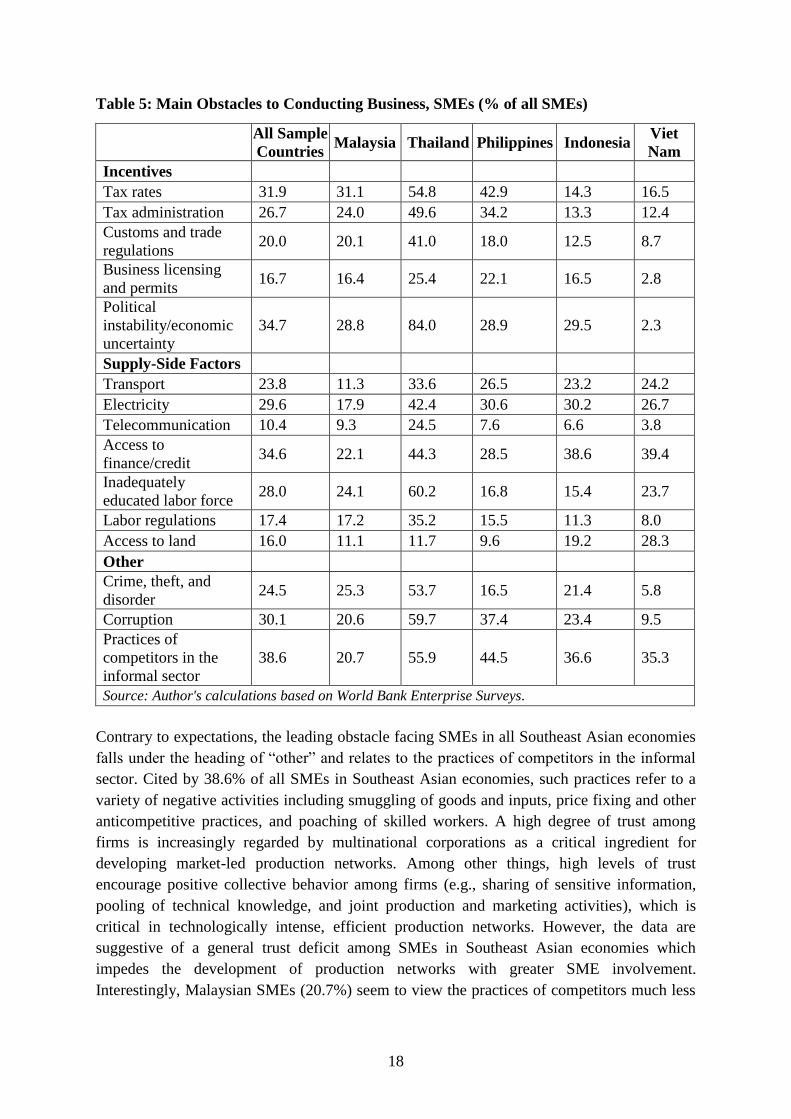
Table 5 lists the main obstacles identified by the SMEs in conducting business in the
Southeast Asian economies using information from the World Bank’s Enterprise Surveys.
These are grouped under three headings: incentive framework, supply-side factors, and other.
The discussion that follows highlights SMEs’ views of major obstacles facing them for all
five Southeast Asian economies and for individual economies. The data for Thailand should
be interpreted with caution as the survey was conducted in the late-2000s during a period of
political turbulence and uncertainty.
18
Table 5: Main Obstacles to Conducting Business, SMEs (% of all SMEs)
All Sample
Countries Malaysia Thailand Philippines Indonesia
Viet
Nam
Incentives
Tax rates 31.9 31.1 54.8 42.9 14.3 16.5
Tax administration 26.7 24.0 49.6 34.2 13.3 12.4
Customs and trade
regulations 20.0 20.1 41.0 18.0 12.5 8.7
Business licensing
and permits 16.7 16.4 25.4 22.1 16.5 2.8
Political
instability/economic
uncertainty
34.7 28.8 84.0 28.9 29.5 2.3
Supply-Side Factors
Transport 23.8 11.3 33.6 26.5 23.2 24.2
Electricity 29.6 17.9 42.4 30.6 30.2 26.7
Telecommunication 10.4 9.3 24.5 7.6 6.6 3.8
Access to
finance/credit 34.6 22.1 44.3 28.5 38.6 39.4
Inadequately
educated labor force 28.0 24.1 60.2 16.8 15.4 23.7
Labor regulations 17.4 17.2 35.2 15.5 11.3 8.0
Access to land 16.0 11.1 11.7 9.6 19.2 28.3
Other
Crime, theft, and
disorder 24.5 25.3 53.7 16.5 21.4 5.8
Corruption 30.1 20.6 59.7 37.4 23.4 9.5
Practices of
competitors in the
informal sector
38.6 20.7 55.9 44.5 36.6 35.3
Source: Author's calculations based on World Bank Enterprise Surveys.
Contrary to expectations, the leading obstacle facing SMEs in all Southeast Asian economies
falls under the heading of “other” and relates to the practices of competitors in the informal
sector. Cited by 38.6% of all SMEs in Southeast Asian economies, such practices refer to a
variety of negative activities including smuggling of goods and inputs, price fixing and other
anticompetitive practices, and poaching of skilled workers. A high degree of trust among
firms is increasingly regarded by multinational corporations as a critical ingredient for
developing market-led production networks. Among other things, high levels of trust
encourage positive collective behavior among firms (e.g., sharing of sensitive information,
pooling of technical knowledge, and joint production and marketing activities), which is
critical in technologically intense, efficient production networks. However, the data are
suggestive of a general trust deficit among SMEs in Southeast Asian economies which
impedes the development of production networks with greater SME involvement.
Interestingly, Malaysian SMEs (20.7%) seem to view the practices of competitors much less

19
seriously than those of the other Southeast Asian economies, suggesting that higher levels of
trust exist among its enterprises.
A variety of supply-side factors are viewed as an obstacle by SMEs. The usual constraint in
most studies of SMEs—access to finance (34.6%)—follows closely as the second most
important obstacle in Southeast Asian economies. This issue seems least severe in Malaysia
(22.1%) and most severe in Viet Nam (39.4%) and Indonesia (38.6%). Both the high cost of
borrowing and the availability of financing from commercial banks fall under this heading.
Inter-country differences in access to finance partly reflect the influence of monetary policies
and the development of capital markets. A lack of financing is a deterrent to some firms
investing in new equipment, technologies, and marketing methods which are needed to
participate in production networks.
Bottlenecks pertaining to physical infrastructure and worker skills also show up as
impediments to SMEs joining production networks in Southeast Asian economies. Electricity
costs (and some fluctuations in supply) were cited by 29.6% of SMEs in all Southeast Asian
economies and the quality of transport systems (roads, rail, and ports) by another 23.8%.
High electricity costs and the quality of transport systems appear to be less of a problem in
energy-producing economies (e.g., Malaysia and Indonesia) than in the three energy-
importing economies. Relative infrastructure gaps in energy-importing Southeast Asian
economies was reflected in poorer connectivity and higher trade costs compared with energy-
producing economies.
An inadequately educated labor force was mentioned as a problem by 28.0% of SMEs in all
Southeast Asian economies, but Thailand, Malaysia, and Viet Nam report higher figures than
the other economies. This pattern may reflect skill shortages and rising wage costs in part
associated with moves in the direction of full employment. Amidst a tightening labor market,
labor regulations were perceived to be more of a problem for SMEs in Malaysia and Thailand
than in the other Southeast Asian economies.
In contrast, access to land is generally not seen as an obstacle, with only 16% of SMEs in all
Southeast Asian economies highlighting this issue. Within this overall picture, however,
SMEs in Viet Nam (28.3%) may have some concerns in relation to access to land.
On the policy and incentive front, regulatory issues at the border seem to be of limited
concern. For instance, only 20.0% of SMEs in all Southeast Asian economies cited customs
and trade regulations as a concern. This may reflect the fact that tariffs are quite low in
Southeast Asian economies and that customs administrations have been improved due to
decades of gradual trade reforms. Thailand may be somewhat of an outlier, and the issue may
relate to customs administration rather than trade regulations per se. Thus, customs and trade
regulations generally do not seem to be an important impediment to SMEs participating in
production networks.
20
There are mixed views about some behind-the-border regulatory issues. Business licensing
and permits are not a widespread problem in Southeast Asian economies, with only 16.7% of
firms pointing to this issue. Meanwhile, tax policy issues do matter. In this vein, high
corporate tax rates were cited by 31.9% of SMEs and gaps in tax administration by 26.7%.
Tax policy issues directly affect enterprise profitability and the incentive to participate in
production networks. These issues appear to be of particular concern in the Philippines and
Thailand and, to a lesser extent, in Malaysia.
According to 34.7% of SMEs in all Southeast Asian economies, economic uncertainty is also
a notable impediment. However, a closer look at the data indicates that this figure is partly
attributed to Thailand (84%) being an outlier for an unusually long period of domestic
political turbulence. With the exception of Viet Nam (2.3%), some concerns about economic
uncertainty were also expressed in the other Association of Southeast Asian Nations
(ASEAN) economies.
Finally, corruption was mentioned by 30.1% of SMEs in all Southeast Asian economies and
crime, theft, and disorder by 24.5%, indicating that these are significant issues for SMEs.
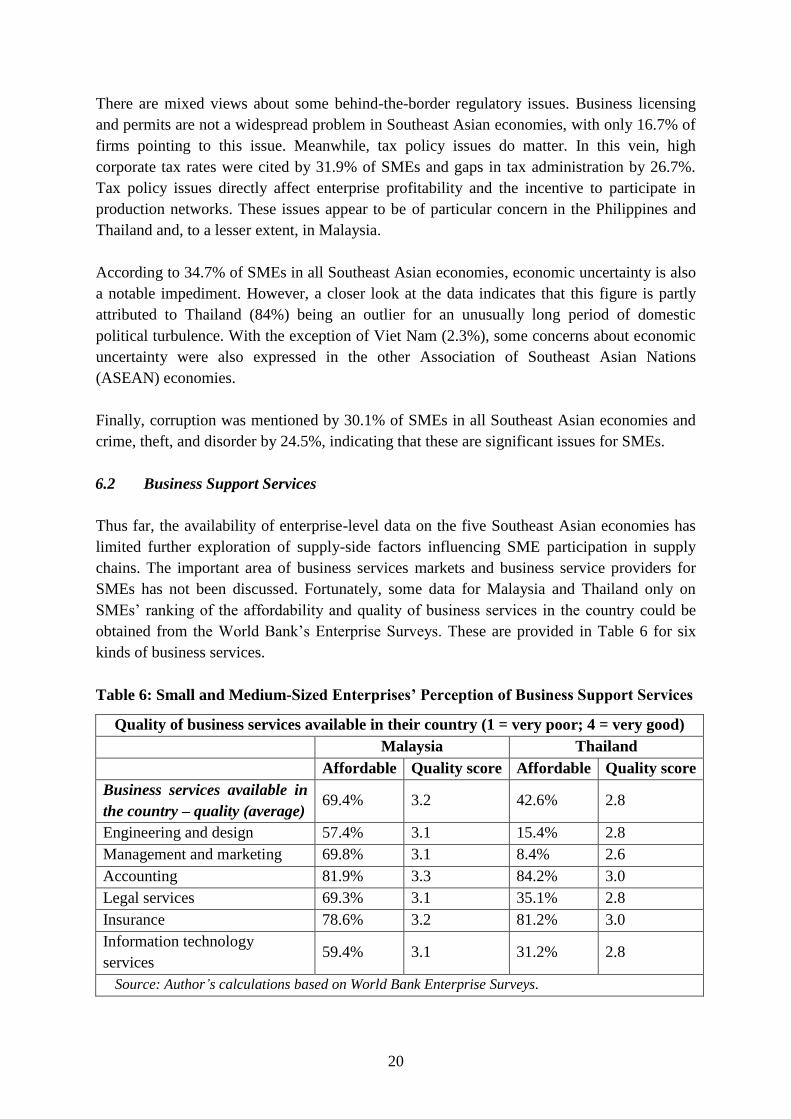
6.2 Business Support Services
Thus far, the availability of enterprise-level data on the five Southeast Asian economies has
limited further exploration of supply-side factors influencing SME participation in supply
chains. The important area of business services markets and business service providers for
SMEs has not been discussed. Fortunately, some data for Malaysia and Thailand only on
SMEs’ ranking of the affordability and quality of business services in the country could be
obtained from the World Bank’s Enterprise Surveys. These are provided in Table 6 for six
kinds of business services.
Table 6: Small and Medium-Sized Enterprises’ Perception of Business Support Services
Quality of business services available in their country (1 = very poor; 4 = very good)
Malaysia Thailand
Affordable Quality score Affordable Quality score
Business services available in
the country – quality (average) 69.4% 3.2 42.6% 2.8
Engineering and design 57.4% 3.1 15.4% 2.8
Management and marketing 69.8% 3.1 8.4% 2.6
Accounting 81.9% 3.3 84.2% 3.0
Legal services 69.3% 3.1 35.1% 2.8
Insurance 78.6% 3.2 81.2% 3.0
Information technology
services 59.4% 3.1 31.2% 2.8
Source: Author’s calculations based on World Bank Enterprise Surveys.

21
The following are the main findings:
On average, Malaysia seems to have more affordable and higher-quality business
services than Thailand. Thus, 69.4% of SMEs in Malaysia said that business services
were affordable, compared with only 42.6% in Thailand. Likewise, the quality of
business services in Malaysia was scored as 3.2 and in Thailand as 2.8 (where 4 is very
good).
Looking at individual services, there is little variation in the good quality of individual
business services in Malaysia. Technology services (engineering and design as well as
information technology services), however, are somewhat less affordable compared
with other services.
Meanwhile, Thailand shows notable variation in terms of affordability and quality of
business services. Strikingly, engineering and design (15.4%), management and
marketing (8.4%), and information technology services (31.2%) are considered less
affordable than other business services. In terms of service quality, marketing and
management services (with a score of 2.6) are rated lower than other business services.
7. Conclusions
This paper conducted a comparative, firm-level analysis of joining the supply chain in five
Southeast Asian economies to improve our understanding of fragmentation of manufacturing
across borders in Asia. It mapped supply chains by firm size at the national and firm levels,
undertook econometric analysis of factors influencing supply chain participation, and
discussed enterprises’ perceptions of the influence of the business environment. This difficult
and painstaking research was facilitated by access to a large and comprehensive dataset of
manufacturing enterprises from the World Bank.
Analysis of national data indicates that SMEs play an important role in economic activity in
Southeast Asia. Not only are SMEs the major source of employment in Southeast Asian
economies, but they also contribute notably to GDP. Large firms are a minor source of
employment and significant contributor to GDP. However, SMEs in Southeast Asian
economies make relatively little contribution to exports relative to the sectors employment or
GDP contribution. Furthermore, even more industrially developed Southeast Asian
economies (e.g., Thailand and Malaysia) lag behind the SME export shares of advanced East
Asian economies such as the PRC, Japan and the Republic of Korea. Accordingly, national
export data hint at the underperformance of SMEs in supply chains relative to large firms in
Southeast Asia and SMEs in advanced East Asian economies.
Complementary and more detailed insights show up in the analysis of firm-level data (which
include both direct and indirect exporters). A minority of firms in Southeast Asian economies
are involved in supply chains through exports, input supply, and subcontracting. More
developed economies (such as Thailand and Malaysia) have a higher share of their firms in
supply chains than other Southeast Asian economies. Turning to firm size, the dominance of

22
large firms in supply chains and the minor role of SMEs is confirmed by firm-level data.
SME participation varies across Southeast Asia with Malaysia and Thailand having a higher
proportion of their SMEs in supply chains than in other economies. SME exports are highly
concentrated in relatively few firms in the Southeast Asian economies—the top 25% of
SMEs account for the bulk of SME exports in Southeast Asia.
The results of the micro-econometric analysis, conducted separately on all manufacturing
firms and on SMEs in Southeast Asian economies, underscore the notion of firm
heterogeneity in supply chains. The findings indicate that some firms are better at joining
supply chains than others and that these differences are linked to various factors. Firm size
shows up as an important influence on the probability of joining supply chains but exhibits a
nonlinear form. It seems that economies of scale and fixed costs are significant in the early
stages of joining production networks but less relevant in the longer term. SMEs may form
clusters or embark on niche market strategies to overcome the disadvantages of firm size.
However, econometric analysis further suggests that firm size is not the whole story.
Efficiency, particularly investment in technological capabilities and skills, and access to
commercial banks also affect the probability of supply chain participation. The controls on
firm age and ownership are also revealing. Unexpectedly, the econometric results further
indicate that younger firms are likely to be more nimble in joining supply chains than older
firms as they more easily use information and knowledge. In addition, foreign ownership
facilitates participation in supply chains through access to marketing and technological know-
how.
The exploration of SME perceptions of the business environment provides additional policy
insights. A trust deficit seems to hamper the requisite intra-firm cooperation needed for
effective SME participation in supply chains. Supply-side factors—such as lack of access to
finance, high electricity costs, variable quality of transport systems, and inadequately
educated workers—are an additional hindrance to SMEs. On the policy and incentive side,
behind-the-border issues like high corporate tax rates as well as economic uncertainty also
play their part. Finally, the limited evidence from Malaysia and Thailand suggests that the
affordability and quality of business support services are an issue.
Some limitations in the methodology employed in this study may be addressed in future
research. First, several factors that may also affect the participation of firms in supply chains
(e.g., trade policies, domestic regulations, infrastructure, and business support services) were
considered in the descriptive part but not in the econometric exercise. Attempting to include
such factors in future econometric work may provide additional insights. Second, the supply
chains functions estimated are static as only cross-section data were available from the World
Bank surveys. Panel data analysis would be invaluable to highlight changes over time when
the requisite data are available. Third, the research was unable to examine the issue of foreign
direct investment by large firms and SMEs in Southeast Asia due to data gaps. Fourth, as
larger enterprise samples become available in the future, it would be useful to explore
23
whether the characteristics of joining the supply chain of one industry sub sector differs from
that of another. Thus, the findings need to be interpreted with caution.
Three policy implications may be drawn from the research. First, policy and incentive
reforms are necessary but not sufficient to promote the participation of firms in supply
chains. The myriad of supply-side obstacles and other issues identified by firms in Southeast
Asia suggests that transparent and comprehensive national policies (which integrates supply
side and incentive interventions) are crucial to support the participation of firms in supply
chains. Specific policies to support SMEs (e.g., to form industrial clusters) could be useful,
but further research is required on what works as there is a risk of government failure.
Second, private sector representatives such as business associations should be involved in
formulating policies for supply chains in Southeast Asia as they have firsthand knowledge
and experience of rapidly evolving supply chains. Third, to facilitate effective policy
development for supply chains, national statistics need to take better account of trends in
supply chains and firm size. Noteworthy initiatives include using a consistent definition of
firm size across countries to enable better mapping of exports by firm size, attempting to
incorporate the contribution of indirect exports into gross export data, and, ultimately,
measuring value-added trade.

24
References
Arndt, S. W. and H. Kierzkowski. 2001. Fragmentation: New Production Patterns in
World Economy. Oxford, UK: Oxford University Press.
Athukorala, P. 2011. Production Networks and Trade Patterns in East Asia: Regionalization
or Globalization? Asian Economic Papers 10(1): 65–95.
Baldwin, R. 2013. Global Supply Chains: Why They Emerged, Why They Matter and Where
They Are Going. In Global Value Chains in a Changing World edited by D.K. Elms
and P. Low. Geneva: World Trade Organization.
Bell, M. and K. Pavitt. 1993. Technological Accumulation and Industrial Growth. Industrial
and Corporate Change 2(2): 157–209.
Dueñas-Caparas, M. T. 2006. Determinants of Export Performance in the Philippine
Manufacturing Sector. Discussion Papers DP 2006-18. Makati City, Philippines:
Philippine Institute for Development Studies.
Fischer, E. and R. Reuber. 2003. Industrial Clusters and Business Development Services
for Small and Medium Enterprises. In Competitiveness Strategy in Developing
Countries, edited by G. Wignaraja. London: Routledge.
Hallberg, K. 2000. A Market-Oriented Strategy for Small and Medium-Scale Enterprises.
Discussion Paper No. 40. International Finance Corporation.
Harvie, C. 2010. East Asian Production Networks—The Role and Contribution of SMEs.
International Journal of Business and Development Studies 2(1): 27–62.
Harvie, C. and B. C. Lee. 2002. East Asian SMEs: Contemporary Issues and
Developments—An Overview. In The Role of SMEs in National Economies in East
Asia, edited by C. Harvie and B. C. Lee. Cheltenham, UK: Edward Elgar.
Harvie, C., D. Narjoko, and S. Oum. 2010. Firm Characteristic Determinants of SME
Participation in Production Networks. ERIA Discussion Paper Series 2010–11.
Jakarta: Economic Research Institute for ASEAN and East Asia.
Helpman, E., M. J. Melitz, and S. R. Yeaple. 2004. Export versus FDI with Heterogeneous
Firms. American Economic Review 94(1): 300–316.
Hobday, M. 2001. The Electronics Industries of the Asia-Pacific: Exploring International
Production Networks for Economic Development. Asian-Pacific Economic Literature
15(1): 13–29.
25
Hollenstein, H. 2005. Determinants of International Activities: Are SMEs Different? Small
Business Economics 24(5): 431–450.
Iammarino, S., R. Padilla-Perez, and N. von Tunzelmann. 2008. Technological
Capabilities and Global–Local Interactions: The Electronics Industry in Two Mexican
Regions. World Development 36(10): 1980–2003.
Jones, R. W and H. Kierzkowski. 1990. The Role of Services in Production and
International Trade: A Theoretical Framework. In The Political Economy of
International Trade: Essays in Honour of R.E. Baldwin, edited by R. W Jones and A.
O. Krueger. Oxford, UK: Basil Blackwell.
Kimura, F., and M. Ando. 2005. Two-Dimensional Fragmentation in East Asia: Conceptual
Framework and Empirics. International Review of Economics and Finance 14(3):
317–48.
Koopman, R., W. M. Powers, Z. Wang, and S. J. Wei. 2010. Give Credit Where Credit Is
Due. Tracing Value Added in Global Production Networks. National Bureau of
Economic Research Working Paper No. W16426.
Kumar, N., and N. S. Siddharthan. 1994. Technology, Firm Size and Export Behaviour in
Developing Countries: The Case of Indian Enterprises. Journal of Development
Studies 31(2): 289–309.
Kuroiwa, I., ed. 2009. Plugging into Production Networks! Industrialization Strategies in
Less Developed Southeast Asian Countries. Singapore: Institute of Southeast Asian
Studies (ISEAS).
Kuroiwa, I., and T. M. Heng, eds. 2008. Production Networks and Industrial Clusters:
Integrating Economies in Southeast Asia. Singapore: Institute of Southeast Asian
Studies (ISEAS).Kyophilavong, P. 2010. Integrating Lao SMEs into a More
Integrated East Asia Region. In Integrating Small and Medium Enterprises into More
Integrating East Asia, edited by V. T. Tranh, D. Narjoko, and S. Oum. ERIA
Research Report 2009 No. 8. Jakarta: Economic Research Institute for ASEAN and
East Asia.
Lall, S. 1986. Technological Development and Export Performance in LDCs: Leading
Engineering and Chemical Firms in India. Weltwirtschaftliches Archiv 122(1): 80–91.
———. 1992. Technological Capabilities and Industrialization. World Development 20(2):
165–186.
Low, P. 2013. The Role of Services. In Global Value Chains in a Changing World, edited by
D.K. Elms and P. Low. Geneva: World Trade Organization.

26
Lefebvre, E., and L. A. Lefebvre. 2001. Innovative Capabilities as Determinants of Export
Behavior and Performance: A Longitudinal Study of Manufacturing SMEs. In
Innovation and Firm Performance, Econometric Exploration of Survey Data, edited
by A. Kleinknecht and P. Mohnen. London: Palgrave.
Levy, B., R. A. Berry, and J. I. Nugent. 1999. Fulfilling the Export Potential of Small and
Medium Firms. Dordrecht, The Netherlands: Kluwer Academic Publishers.
Lim, H., and F. Kimura. 2010. The Internationalization of Small and Medium Enterprises in
Regional and Global Value Chains. ADBI Working Paper Series No. 231. Tokyo:
Asian Development Bank Institute.
Melitz, M. J. 2003. The Impact of Trade on Intra-Industry Reallocations and Aggregate
Industry Productivity. Econometrica 17(6): 1695–1725.
Nelson, R. R., and S. G. Winter. 1982. An Evolutionary Theory of Economic Change.
Cambridge, MA: Belknap/Harvard University Press.
Ng, F., and A. Yeats. 2003. Major Trade Trends in East Asia—What Are Their Implications
for Regional Cooperation and Growth? World Bank Policy Research Working Paper
3084. Washington, DC: World Bank.
Nguyen, H., and S. Nishijima. 2009. Export Intensity and Impacts from Firm Characteristics,
Domestic Competition and Domestic Constraints in Vietnam: A Micro-Data Analysis.
Kobe University Research Institute for Economics & Business Administration
Discussion Paper Series 238. Kobe, Japan: Kobe University.
Organisation for Economic Co-operation and Development (OECD). 1997. Globalisation
and Small and Medium Enterprises. Vol. 1 Synthesis Report. Paris: OECD.
Rasiah, R. 2004. Foreign Firms, Technological Intensities and Economic Performance:
Evidence from Africa, Asia and Latin America Cheltenham, UK: Edward Elgar.
Rasiah, R., M. Rosli and P. Sanjivee. 2010. The Significance of Production Networks in
Productivity, Exports and Technological Upgrading: Small and Medium Enterprises
in Electric-Electronics, Textiles-Garments, Automotives and Wood Products in
Malaysia. In Integrating Small and Medium Enterprises into More Integrating East
Asia, edited by V. T. Tranh, D. Narjoko, and S. Oum. ERIA Research Report 2009
No. 8. Jakarta: Economic Research Institute for ASEAN and East Asia.
Srinivasan, T. N. and V. Archana. 2011. Determinants of Export Decision of Firms.
Economic and Political Weekly 46(7): 49–58.

27
Tambunan, T. T. H. 2009. SMEs in Asian Developing Countries. Basingstoke, UK:
Palgrave Macmillan.
Tranh, V. T., D. Narjoko, and S. Oum (eds.). 2010. Integrating Small and Medium
Enterprises into More Integrating East Asia. ERIA Research Report 2009 No. 8.
Jakarta: Economic Research Institute for ASEAN and East Asia.
Van Dijk, M. 2002. The Determinants of Export Performance in Developing Countries: The
Case of Indonesian Manufacturing. Eindhoven Centre for Innovation Studies Working
Paper 02.01. Eindhoven, The Netherlands: Eindhoven University.
Wakelin, K. 1998. Innovation and Export Behaviour at the Firm Level. Research Policy 26:
829–841.
Wilmore, L. 1992. Transnationals and Foreign Trade: Evidence from Brazil. Journal of
Development Studies 28(2): 314–335.
Wignaraja, G. 2002. Firm Size, Technological Capabilities and Market-Oriented Policies in
Mauritius. Oxford Development Studies 30(1): 87–104.
———. 2011. FDI, Size, and Innovation: Influences on Firm-Level Exports in East Asia.
TMD Working Paper Series No. 047. Queen Elizabeth House, University of Oxford.
———. 2012. Innovation, Learning and Exporting in China: Does R&D or a Technology
Index Matter? Journal of Asian Economics 23(3): 224–233.
Wignaraja, G., J. Kruger, and A. M. Tuazon. 2013. Production Networks, Profits and
Innovative Activity: Evidence from Malaysia and Thailand. ADBI Working Paper
Series No. 460. February. Tokyo: Asian Development Bank Institute.
World Trade Organization (WTO) and Institute for Developing Economies-Japan External
Trade Organization (IDE-JETRO). 2011. Trade Patterns and Global Value Chains in
East Asia: From Trade in Goods to Trade in Tasks. Geneva: WTO and Tokyo: IDE-
JETRO.
Zhao, H., and H. Li 1997. R&D and Exports: An Empirical Analysis of Chinese
Manufacturing Firms. The Journal of High Technology Management Research 8(1):
89–1.

28
Notes
1 The very few micro-level studies of supply chains in Asia include Harvie, Narjoko, and Oum (2010);
Kyophilavong (2010); Rasiah, Rosli, and Sanjivee (2010); and Lim and Kimura (2010). See also some papers
in Kuroiwa and Heng (2008) and Kuroiwa (2009).
2 Athukorala (2011) presents data on world trade based on network trade or supply chain trade. His data show
that Southeast Asian economies, with the exception of Singapore, have increased their world share of network
trade between 1992–1993 and 2006–2007. Thus, Malaysia’s world share of network trade increased from
1.8% to 2.6%, Thailand’s from 0.8% to 1.6%, the Philippines’ from 0.4% to 1.2%, Indonesia’s from 0.1% to
0.5%, and Viet Nam’s from 0.0% to 0.1%.
3 For further discussion of resource constraints and external barriers faced by SMEs as well as appropriate policy
interventions, see Levy, Berry, and Nugent (1999); Hallberg (2000); Wignaraja (2002); Fischer and Reuber
(2003); and Tambunan (2009).
4 There are a few multi-country, multi-sector studies (Harvie, Narjoko, and Oum 2010; Wignaraja 2011) and one
multi-country single sector study (Rasiah 2004).
5 See Harvie, Narjoko, and Oum (2010); and Rasiah, Rosli, and Sanjivee (2010).
6 For instance, Harvie, Narjoko, and Oum (2010) simply define SME participation in supply chains according to
whether it is a supplier, importer of intermediate goods, or exporter of some of its products.
7 Technological capabilities are hard to measure and empirical work has either used aspects of technological
activity (e.g., quality certification, patents, etc.) or a composite index of technological capability made up of
many different technical functions performed by enterprises to assimilate imported technologies.
8 Most unfortunately, data were not available from the World Bank Enterprise Surveys on the share of engineers
and technicians in employment to more accurately capture technical-level skills at the firm level.
9 Unfortunately, time series data on exports by firm size are not readily available from national sources.
Methodological difficulties notwithstanding, a rough indication may be obtained by comparing the the share of
SME exports (largely for the late-2000s) in Table 2 with the estimate by Harvie and Lee (2002) for the late-
1990s. This crude comparison suggests that the percentage of SME exports in Southeast Asian economies rose
from 14.3% to 20.9% between the late-1990s and the late-2000s.
10 Wignaraja, Kruger, and Tuazon (2013) further explore this insight for a sample of Malaysian and Thai firms
using a technology index (consisting of eight technical functions) based on the taxonomy of technological
capabilities developed by Lall (1992). The results show that participation in production networks and supply
chains is positively correlated with technology upgrading at the firm level.
11 The same assumption is made for all the probabilities given in the text. A complete set of results on predicted
probabilities is available on request.
12 It is recognized that the developing industrial clusters involving SMEs and large firms are also an important
means to promote SME entry into production networks. However, a lack of data on this aspect meant that
clustering and cluster promotion could not be examined in this paper (see Fischer and Reuber 2003).
29
Appendix 1: Enterprise Data and Sample Characteristics
The dataset and sampling methodology used in this study are briefly described here. Our
firm-level study on five Southeast Asian economies was based on cross-section data collected
in the late 2000s from the World Bank’s Enterprise Surveys dataset. The World Bank surveys
are conducted at infrequent intervals in the given countries—the data for Malaysia and
Thailand were gathered in 2007 and those for the other three economies in 2009. This is the
only relatively detailed and recent firm-level dataset currently available for Southeast Asian
economies. The data are not publicly available, but it is possible to apply to the World Bank
for access for research purposes.
Stratified random sampling with replacement was the sampling methodology used by the
World Bank Enterprise Surveys.1 This means that all population units are grouped within a
homogenous group and simple random samples are selected within each group. This method
allows computing estimates for each of the strata with a specific level of precision, while
population estimates can also be estimated by properly weighting individual observations.
The strata for Enterprise Surveys are firm size, business sector, and geographic region within
a country. In most developing countries, small and medium-sized enterprises (SMEs) form
the bulk of the enterprises. Large firms are oversampled in the firm surveys as they tend to be
engines of job creation.
Face-to-face interviews using a common questionnaire were conducted with business owners
and senior managers of firms. The surveys provide cross-section firm-level information on
direct and indirect exports, employment, ownership, human capital, technology, access to
credit, and aspects of the policy regime. Table A1 provides a snapshot of the enterprise
dataset for the five Association of Southeast Asian Nations (ASEAN) economies according to
firm size, ownership, and sector. The dataset largely consists of a total of 5,900
manufacturing firms with reasonable samples of over 1,000 firms for each ASEAN country.
1 For details of the sampling methodology in the World Bank surveys, see www.enterprisesurveys.org/methodology.

30
Table A1: Sample Characteristics
All
firms Malaysia Thailand Philippines Indonesia
Viet
Nam
Number of firms 5,900 1,082 1,043 1,310 1,422 1,043
By sector, % of
distribution
Garment 11.4 8.2 15.2 10.8 11.6 11.2
Textile 7.6 3.5 12.8 0.2 12.5 9.6
Machinery and
equipment 3.6 8.5 8.0 0.2 0.5 2.7
Electronics/electric
al appliances 2.3 8.9 8.7 9.6 0.4 1.8
Rubber and plastic 15.0 25.3 24.7 13.4 10.5 3.0
By size, % of
distribution
SMEs 69.3 62.7 51.6 78.2 82.1 65.3
Large 30.7 37.3 48.4 21.8 17.9 34.7
By ownership, %
of distribution
Foreign 25.5 30.5 59.9 23.3 6.8 14.0
Domestic 74.5 69.5 40.1 76.7 93.2 86.0
SMEs = small and medium-sized enterprises.
Source: Author’s calculations based on World Bank Enterprise Surveys.
Following the standard Organisation for Economic Co-operation and Development (OECD)
definition, large firms are defined in our study as enterprises with more than 100 employees
and SMEs those with fewer than 100 employees.2 Large firms constitute 30.7% of the total
sample and the remaining 69.3% consists of SMEs. The figure for SMEs as a percentage of
total number of firms varies by country: Malaysia (62.7%), Thailand (51.6%), the Philippines
(78.2%), Indonesia (82.1%), and Viet Nam (65.3%). About a quarter of the total sample has
some proportion of foreign equity. The share of firms with foreign equity as a percentage of
total number of firms is highest in Thailand and Malaysia and lowest in Indonesia.
2 See Organisation for Economic Co-operation and Development (OECD). 1997. Globalisation and Small and
Medium Enterprises. Vol. 1 Synthesis Report. Paris: OECD.

31
Appendix 2: Definition of Small and Medium-Sized Enterprises across Various
ASEAN Member States and Other Countries
Economy Category of industry Criteria/country's official definition Source
Thailand
Manufacturing industry
≤ 200 employees or assets ≤ 200 million
baht ASEAN SME Data and Statistics, available at
http://www.asean.org/communities/asean-
economic-community/category/data-and-statistics
Wholesale industry ≤ 200 employees or assets ≤100 million baht
Retailing industry ≤ 150 employees or assets ≤ 60 million baht
Service industry
≤ 200 employees or assets ≤ 200 million
baht
Viet Nam
Agriculture, forestry, and fishing
≤ 300 employees or assets ≤ 100 billion
dong ASEAN SME Data and Statistic, available at
http://www.asean.org/communities/asean-
economic-community/category/data-and-statistics Industry and construction
≤ 300 employees or assets ≤ 100 billion
dong
Commerce and services ≤ 100 employees or assets ≤ 50 billion dong
Indonesia
Assets ≤ 10 billion rupiah or sales per
annum ≤ 50 billion rupiah
ASEAN SME Data and Statistics, available at
http://www.asean.org/communities/asean-
economic-community/category/data-and-statistics
Malaysia Manufacturing
Turnover ≤ 25 million ringgit or full-time
employees ≤ 150 ASEAN SME Data and Statistics, available at
http://www.asean.org/communities/asean-
economic-community/category/data-and-statistics Services
Sales turnover ≤ 5 million ringgit or full-
time employees ≤ 50
Philippines
Total assets less than 100 million pesos
ASEAN SME Data and Statistics, available at
http://www.asean.org/communities/asean-
economic-community/category/data-and-statistics
United
States ≤ 500 employees
United States Small Business Administration,
available at http://www.sba.gov/
Japan
Manufacturing and others
≤ 300 employees and capital ≤ or equal to
300 million yen Ministry of Economy, Trade and Industry,
available at
http://www.chusho.meti.go.jp/sme_english/outlin
e/04/20131007.pdf
Wholesale ≤ 100 employees or assets ≤ 100 million yen
Services
≤ 100 employees or assets ≤ 100 million
yen
Retail ≤ 50 employees or assets ≤ 50 million yen
Germany
(European
Commission
definition)
≤ 250 employees, turnover ≤ 50 million
euros, or balance sheet total ≤ 43 million
euros
European Commission, available at
http://ec.europa.eu/enterprise/policies/sme/facts-
figures-analysis/sme-definition/index_en.htm
Republic of
Korea
Manufacturing
≤ 300 employees, capital or sales ≤ 8 billion
won
Small and Medium Business Administration,
available at http://eng.smba.go.kr/eng/index.do
Mining, construction, and transportation
≤ 300 employees, capital or sales ≤ 3 billion
won
Publication, information and
communication; administrative and
support service activities; human health,
and social work activities; professional
scientific and technical activities
≤ 300 employees, capital or sales ≤ 30
billion won
Agricultural, forestry, and fishery;
electricity, gas, steam, and waterworks
business; wholesale and retail trade;
accommodation; food services activities;
financial and insurance activities; arts,
entertainment, and recreation
≤ 300 employees, capital or sales ≤ 20
billion won
Sewerage, waste management, and
remediation activities; education; repair
and other services
≤ 300 employees, capital or sales ≤ 10
billion won
Real estate, rental, and leasing activities
≤ 300 employees, capital or sales ≤ 5 billion
won
People’s
Republic of
China
Industry
≤ 300 employees, total assets ≤ 40 million
yuan, or business sales ≤ 30 million yuan
Economic Research Institute for ASEAN and East
Asia, available at
http://www.eria.org/SME%20Development%20in
%20China_A%20Policy%20Perspective%20on%
20SME%20Industrial%20Clustering.pdf
Construction
≤ 600 employees, total assets ≤ 40 million
yuan, or business sales ≤ 30 million yuan
Wholesale
≤ 100 employees, or business sales ≤ 30
million yuan
Retail
≤ 100 employees, or business sales ≤ 10
million yuan
Transport
≤ 500 employees, or business sales ≤ 30
million yuan
Post
≤ 400 employees, or business sales ≤ 30
million yuan
Hotel and restaurant
≤ 400 employees, or business sales ≤ 30
million yuan
ASEAN = Association of Southeast Asian Nations, SMEs = small and medium-sized enterprises.
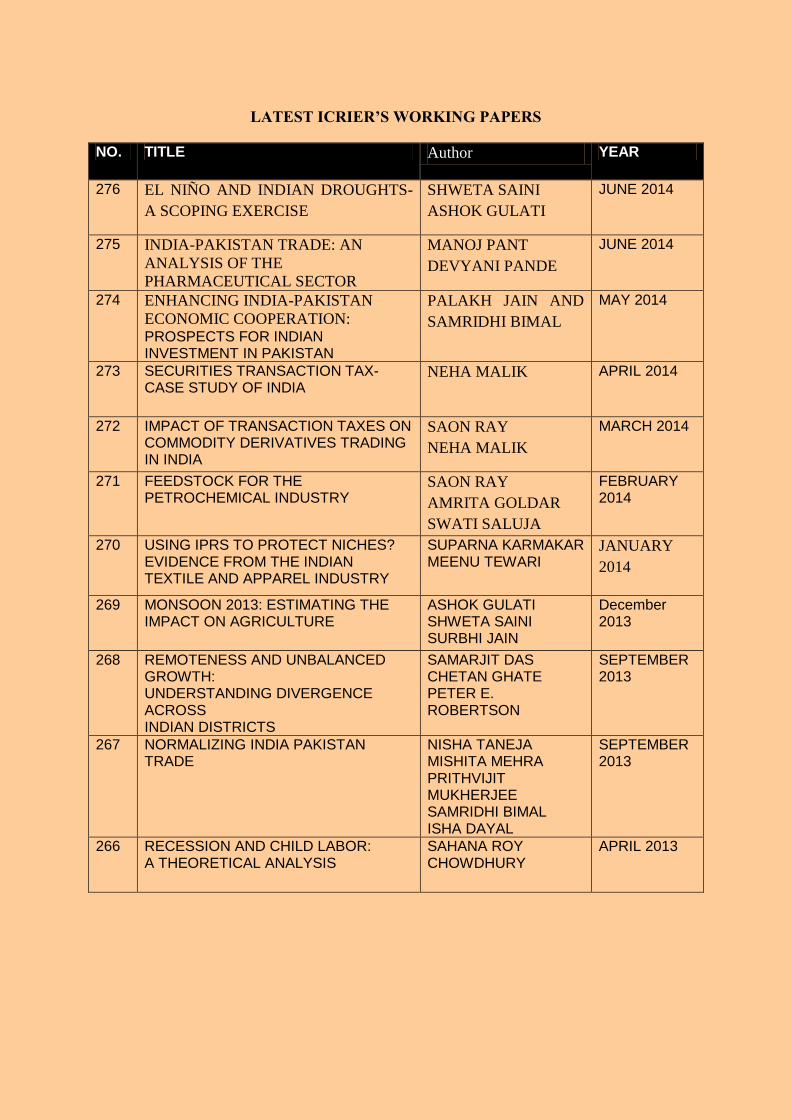
32
LATEST ICRIER’S WORKING PAPERS
NO. TITLE Author YEAR
276 EL NIÑO AND INDIAN DROUGHTS-
A SCOPING EXERCISE
SHWETA SAINI
ASHOK GULATI
JUNE 2014
275 INDIA-PAKISTAN TRADE: AN
ANALYSIS OF THE
PHARMACEUTICAL SECTOR
MANOJ PANT
DEVYANI PANDE
JUNE 2014
274 ENHANCING INDIA-PAKISTAN
ECONOMIC COOPERATION: PROSPECTS FOR INDIAN INVESTMENT IN PAKISTAN
PALAKH JAIN AND
SAMRIDHI BIMAL
MAY 2014
273 SECURITIES TRANSACTION TAX- CASE STUDY OF INDIA
NEHA MALIK APRIL 2014
272 IMPACT OF TRANSACTION TAXES ON COMMODITY DERIVATIVES TRADING IN INDIA
SAON RAY
NEHA MALIK
MARCH 2014
271 FEEDSTOCK FOR THE PETROCHEMICAL INDUSTRY
SAON RAY
AMRITA GOLDAR
SWATI SALUJA
FEBRUARY 2014
270 USING IPRS TO PROTECT NICHES? EVIDENCE FROM THE INDIAN TEXTILE AND APPAREL INDUSTRY
SUPARNA KARMAKAR MEENU TEWARI
JANUARY
2014
269 MONSOON 2013: ESTIMATING THE IMPACT ON AGRICULTURE
ASHOK GULATI SHWETA SAINI SURBHI JAIN
December 2013
268 REMOTENESS AND UNBALANCED GROWTH: UNDERSTANDING DIVERGENCE ACROSS INDIAN DISTRICTS
SAMARJIT DAS CHETAN GHATE PETER E. ROBERTSON
SEPTEMBER 2013
267 NORMALIZING INDIA PAKISTAN TRADE
NISHA TANEJA MISHITA MEHRA PRITHVIJIT MUKHERJEE SAMRIDHI BIMAL ISHA DAYAL
SEPTEMBER 2013
266 RECESSION AND CHILD LABOR: A THEORETICAL ANALYSIS
SAHANA ROY CHOWDHURY
APRIL 2013
33
About ICRIER
Established in August 1981, ICRIER is an autonomous, policy-oriented, not-for-profit,
economic policy think tank. ICRIER's main focus is to enhance the knowledge content of
policy making by undertaking analytical research that is targeted at informing India's policy
makers and also at improving the interface with the global economy. ICRIER's office is
located in the institutional complex of India Habitat Centre, New Delhi.
ICRIER's Board of Governors includes leading academicians, policymakers, and
representatives from the private sector. Dr. Isher Ahluwalia is ICRIER's chairperson. Dr.
Rajat Kathuria is Director and Chief Executive.
ICRIER conducts thematic research in the following seven thrust areas:
Macro-economic Management in an Open Economy
Trade, Openness, Restructuring and Competitiveness
Financial Sector Liberalisation and Regulation
WTO-related Issues
Regional Economic Co-operation with Focus on South Asia
Strategic Aspects of India's International Economic Relations
Environment and Climate Change
To effectively disseminate research findings, ICRIER organises workshops, seminars and
conferences to bring together academicians, policymakers, representatives from industry and
media to create a more informed understanding on issues of major policy interest. ICRIER
routinely invites distinguished scholars and policymakers from around the world to deliver
public lectures and give seminars on economic themes of interest to contemporary India.
Top Related