


Languages
Pages
Legal

Women, Minorities, and Persons with Disabilities in Science and Engineering: 2011
Division of Science Resources Statistics Directorate for Social, Behavioral, and Economic Sciences
National Science Foundation


Women, Minorities, and Persons with Disabilities in Science and Engineering: 2011
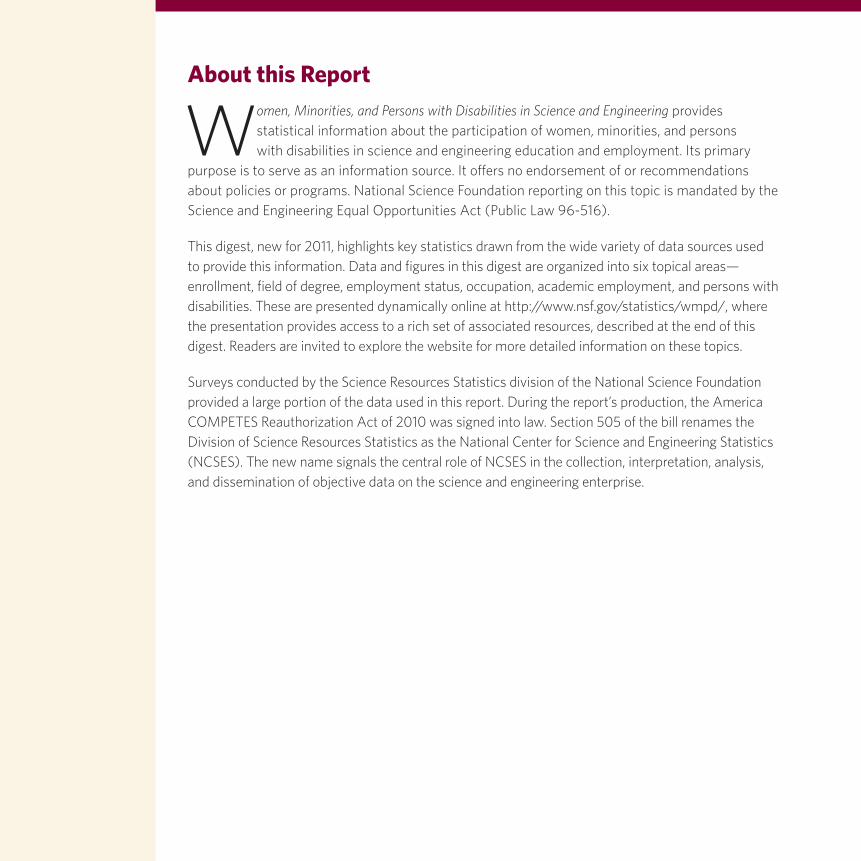
About this Report
Women, Minorities, and Persons with Disabilities in Science and Engineering provides statistical information about the participation of women, minorities, and persons with disabilities in science and engineering education and employment. Its primary
purpose is to serve as an information source. It offers no endorsement of or recommendations about policies or programs. National Science Foundation reporting on this topic is mandated by the Science and Engineering Equal Opportunities Act (Public Law 96-516).
This digest, new for 2011, highlights key statistics drawn from the wide variety of data sources used to provide this information. Data and figures in this digest are organized into six topical areas—enrollment, field of degree, employment status, occupation, academic employment, and persons with disabilities. These are presented dynamically online at http://www.nsf.gov/statistics/wmpd/, where the presentation provides access to a rich set of associated resources, described at the end of this digest. Readers are invited to explore the website for more detailed information on these topics.
Surveys conducted by the Science Resources Statistics division of the National Science Foundation provided a large portion of the data used in this report. During the report’s production, the America COMPETES Reauthorization Act of 2010 was signed into law. Section 505 of the bill renames the Division of Science Resources Statistics as the National Center for Science and Engineering Statistics (NCSES). The new name signals the central role of NCSES in the collection, interpretation, analysis, and dissemination of objective data on the science and engineering enterprise.

Contents
Introduction .................................................................................2
Enrollment.................................................................................... 3
Field of Degree............................................................................4
Women .............................................................................4
Minorities .........................................................................5
Minority Women ............................................................6
Employment Status ................................................................... 7
Occupation ..................................................................................8
Academic Employment ...........................................................9
Persons with Disabilities ......................................................10
Data Sources ............................................................................. 12
Glossary ...................................................................................... 13
Online Resources .....................................................................14
2 Women, Minorities, and Persons with Disabilities in Science and Engineering: 2011
Introduction
Women, persons with disabilities, and three racial/ethnic groups—blacks, Hispanics, and American Indians—are considered underrepresented in science and engineering because they constitute smaller percentages of science and engineering degree recipients and of
employed scientists and engineers than they do of the population. Asians are not considered under-represented because they are a larger percentage of science and engineering degree recipients and of employed scientists and engineers than they are of the population. Subgroups of Hispanics and Asians may vary in terms of under- or overrepresentation in science and engineering.
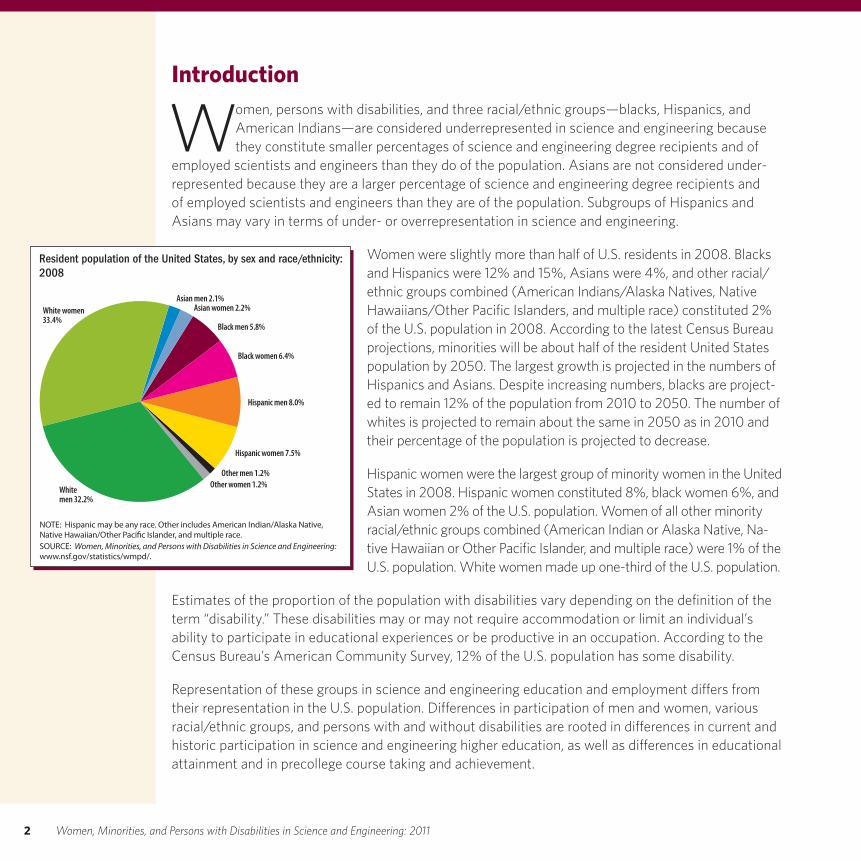
Women were slightly more than half of U.S. residents in 2008. Blacks and Hispanics were 12% and 15%, Asians were 4%, and other racial/ethnic groups combined (American Indians/Alaska Natives, Native Hawaiians/Other Pacific Islanders, and multiple race) constituted 2% of the U.S. population in 2008. According to the latest Census Bureau projections, minorities will be about half of the resident United States population by 2050. The largest growth is projected in the numbers of Hispanics and Asians. Despite increasing numbers, blacks are project-ed to remain 12% of the population from 2010 to 2050. The number of whites is projected to remain about the same in 2050 as in 2010 and their percentage of the population is projected to decrease.
Hispanic women were the largest group of minority women in the United States in 2008. Hispanic women constituted 8%, black women 6%, and Asian women 2% of the U.S. population. Women of all other minority racial/ethnic groups combined (American Indian or Alaska Native, Na-tive Hawaiian or Other Pacific Islander, and multiple race) were 1% of the U.S. population. White women made up one-third of the U.S. population.
Estimates of the proportion of the population with disabilities vary depending on the definition of the term “disability.” These disabilities may or may not require accommodation or limit an individual’s ability to participate in educational experiences or be productive in an occupation. According to the Census Bureau’s American Community Survey, 12% of the U.S. population has some disability.
Representation of these groups in science and engineering education and employment differs from their representation in the U.S. population. Differences in participation of men and women, various racial/ethnic groups, and persons with and without disabilities are rooted in differences in current and historic participation in science and engineering higher education, as well as differences in educational attainment and in precollege course taking and achievement.
Resident population of the United States, by sex and race/ethnicity: 2008
NOTE: Hispanic may be any race. Other includes American Indian/Alaska Native, Native Hawaiian/Other Paci�c Islander, and multiple race.SOURCE: Women, Minorities, and Persons with Disabilities in Science and Engineering:www.nsf.gov/statistics/wmpd/.
Whitemen 32.2%
White women33.4%
Asian men 2.1%Asian women 2.2%
Black men 5.8%
Black women 6.4%
Hispanic men 8.0%
Hispanic women 7.5%
Other men 1.2%Other women 1.2%
www.nsf.gov/statistics/wmpd/ 3
URM = underrepresented minority.SOURCE: Women, Minorities, and Persons with Disabilities in Science and Engineering:www.nsf.gov/statistics/wmpd/.
White women White men Asian women Asian men URM women URM men0
10
20
30
40
50
60
70
80
90
100
Full-time enrollment among undergraduates: 2008 Percent
Minorities earning science and engineering bachelor’s at minority-serving institutions, by institution type: 2000–08 Percent
HBCU = historically black college or university; HHE = high Hispanic enrollment. SOURCE: Women, Minorities, and Persons with Disabilities in Science and Engineering:www.nsf.gov/statistics/wmpd/.
2000 2001 2002 2003 2004 2005 2006 2007 20080
5
10
15
20
25
30
35
40
45
50Hispanic, HHEBlack, HBCUAmerican Indian, tribal college
URM = underrepresented minority.SOURCE: Women, Minorities, and Persons with Disabilities in Science and Engineering:www.nsf.gov/statistics/wmpd/.
Undergraduate enrollment, by type of school: 2008 Percent
White women White men Asian women Asian men URM women URM men0
5
10
15
20
25
30
35
40
45
50Public 4-year Public 2-year Private For pro�t
HBCU = historically black college or university.SOURCE: Women, Minorities, and Persons with Disabilities in Science and Engineering:www.nsf.gov/statistics/wmpd/.
Black doctorate recipients with HBCU baccalaureate origins, by �eld: 2004–08, aggregate
Social sciences
Psychology
Computer sciences
Earth, atmospheric, and ocean sciences
Mathematics
Engineering
Biological sciences
Physical sciences
Agricultural sciences
Science and engineering
0 20 40Percent
60 80 100
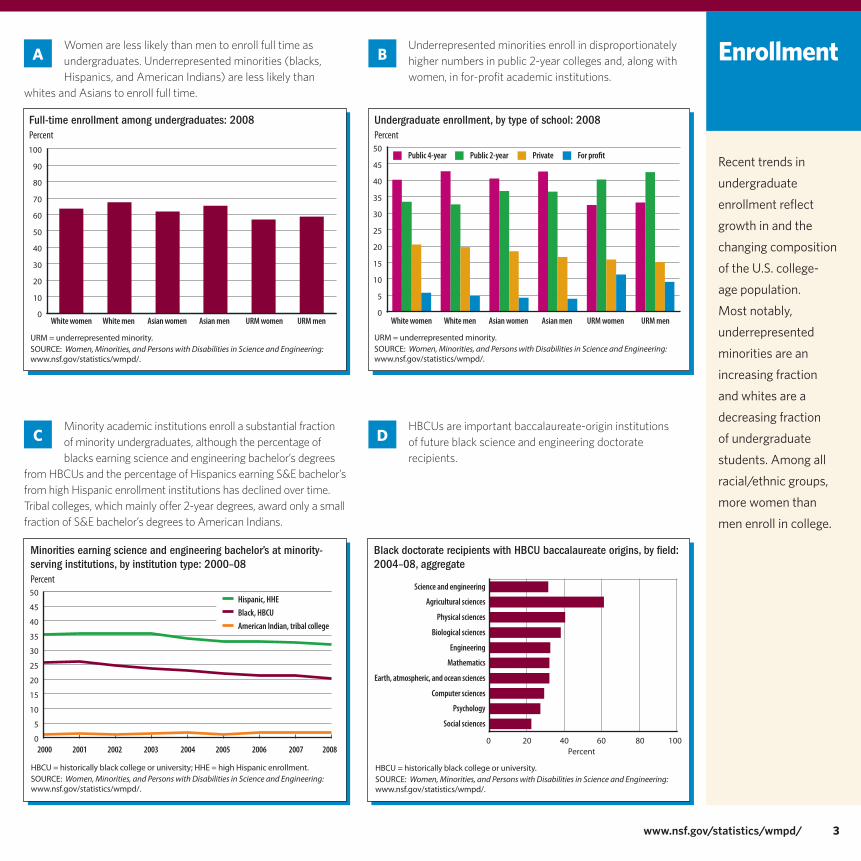
Women are less likely than men to enroll full time as undergraduates. Underrepresented minorities (blacks, Hispanics, and American Indians) are less likely than
whites and Asians to enroll full time.
Underrepresented minorities enroll in disproportionately higher numbers in public 2-year colleges and, along with women, in for-profit academic institutions.
HBCUs are important baccalaureate-origin institutions of future black science and engineering doctorate recipients.
Minority academic institutions enroll a substantial fraction of minority undergraduates, although the percentage of blacks earning science and engineering bachelor’s degrees
from HBCUs and the percentage of Hispanics earning S&E bachelor’s from high Hispanic enrollment institutions has declined over time. Tribal colleges, which mainly offer 2-year degrees, award only a small fraction of S&E bachelor’s degrees to American Indians.
Enrollment
Recent trends in undergraduate enrollment reflect growth in and the changing composition of the U.S. college-age population. Most notably, underrepresented minorities are an increasing fraction and whites are a decreasing fraction of undergraduate students. Among all racial/ethnic groups, more women than men enroll in college.
A B
DC
4 Women, Minorities, and Persons with Disabilities in Science and Engineering: 2011
High participation �elds for women: Psychology and medical sciences, 1989–2008 Percent
NOTE: Data not available for 1999. SOURCE: Women, Minorities, and Persons with Disabilities in Science and Engineering:www.nsf.gov/statistics/wmpd/.
1989 1992 1994 1996 1998 2000 2002 2004 2006 20080
10
20
30
40
50
60
70
80
90
100
Psychology PhDMedical sciences PhDMedical sciences MA
Psychology MA
Medical sciences BA Psychology BA
Medium-low participation �elds for women: Physical sciences and mathematics, 1989–2008Percent
NOTE: Data not available for 1999. SOURCE: Women, Minorities, and Persons with Disabilities in Science and Engineering:www.nsf.gov/statistics/wmpd/.
1989 1992 1994 1996 1998 2000 2002 2004 2006 20080
10
20
30
40
50
60
70
80
90
100
Physical sciences PhDMathematics PhDMathematics MAPhysical sciences MAMathematics BA
Physical sciences BA
Medium participation �elds for women: Biosciences and social sciences, 1989–2008Percent
NOTES: Data not available for 1999. Social sciences excludes psychology.SOURCE: Women, Minorities, and Persons with Disabilities in Science and Engineering:www.nsf.gov/statistics/wmpd/.
1989 1992 1994 1996 1998 2000 2002 2004 2006 20080
10
20
30
40
50
60
70
80
90
100
Social sciences PhDBiosciences PhDBiosciences MA
Social sciences MA
Biosciences BA Social sciences BA
Low participation �elds for women: Computer sciences and engineering, 1989–2008Percent
NOTE: Data not available for 1999. SOURCE: Women, Minorities, and Persons with Disabilities in Science and Engineering:www.nsf.gov/statistics/wmpd/.
1989 1992 1994 1996 1998 2000 2002 2004 2006 20080
10
20
30
40
50
60
70
80
90
100
Engineering MAEngineering PhDComputer sciences MAEngineering BAComputer sciences BAComputer sciences PhD
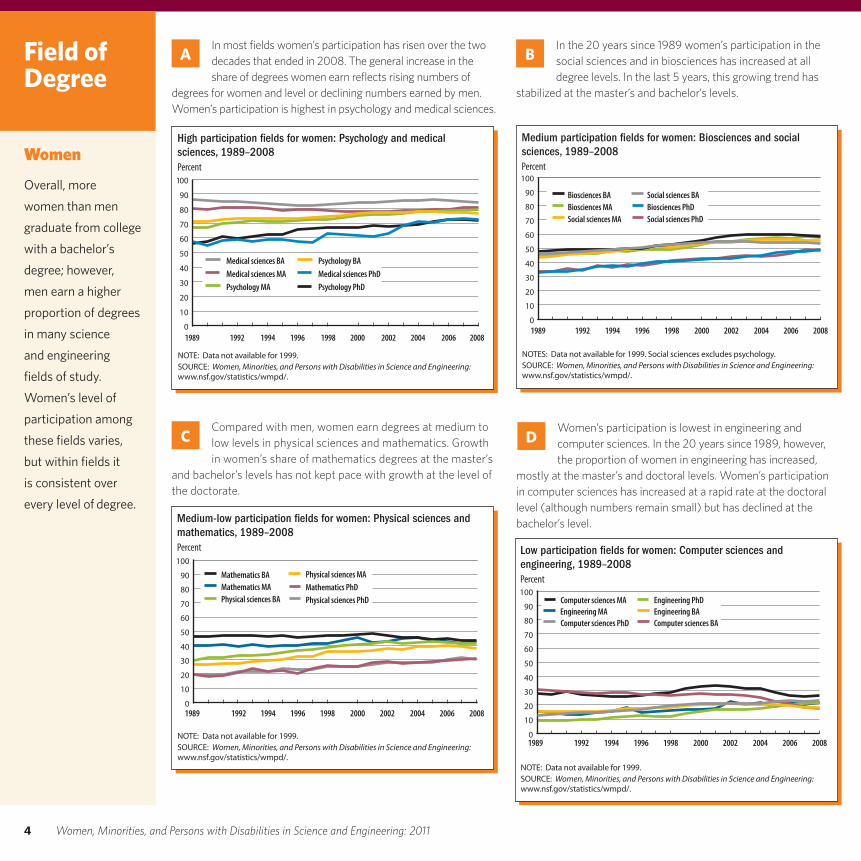
In most fields women’s participation has risen over the two decades that ended in 2008. The general increase in the share of degrees women earn reflects rising numbers of
degrees for women and level or declining numbers earned by men. Women’s participation is highest in psychology and medical sciences.
In the 20 years since 1989 women’s participation in the social sciences and in biosciences has increased at all degree levels. In the last 5 years, this growing trend has
stabilized at the master’s and bachelor’s levels.
Women’s participation is lowest in engineering and computer sciences. In the 20 years since 1989, however, the proportion of women in engineering has increased,
mostly at the master’s and doctoral levels. Women’s participation in computer sciences has increased at a rapid rate at the doctoral level (although numbers remain small) but has declined at the bachelor’s level.
Compared with men, women earn degrees at medium to low levels in physical sciences and mathematics. Growth in women’s share of mathematics degrees at the master’s
and bachelor’s levels has not kept pace with growth at the level of the doctorate.
Field of Degree
Women
Overall, more women than men graduate from college with a bachelor’s degree; however, men earn a higher proportion of degrees in many science and engineering fields of study. Women’s level of participation among these fields varies, but within fields it is consistent over every level of degree.
A B
DC

www.nsf.gov/statistics/wmpd/ 5
Field of Degree
Minorities
Underrepresented minorities—blacks, Hispanics, and American Indians—are less likely than whites to attend college or to graduate, but for those who do graduate, the degree patterns are similar to those of whites.
Science and engineering degrees earned by underrepresented minorities: 1989–2008 Percent
NOTE: Data not available for 1999. SOURCE: Women, Minorities, and Persons with Disabilities in Science and Engineering:www.nsf.gov/statistics/wmpd/.
1989 1992 1994 1996 1998 2000 2002 2004 2006 20080
5
10
15
20
25
Bachelor’sMaster’sDoctorate
Science and engineering degrees earned by Asians: 1989–2008 Percent
NOTE: Data not available for 1999. SOURCE: Women, Minorities, and Persons with Disabilities in Science and Engineering:www.nsf.gov/statistics/wmpd/.
1989 1992 1994 1996 1998 2000 2002 2004 2006 20080
5
10
15
20
25
Bachelor’sMaster’sDoctorate
Science and engineering bachelor’s degrees earned by underrepresented minorities, by �eld: 1989–2008Percent
NOTE: Data not available for 1999. SOURCE: Women, Minorities, and Persons with Disabilities in Science and Engineering:www.nsf.gov/statistics/wmpd/.
1989 1992 1994 1996 1998 2000 2002 2004 2006 2008
25
20
15
10
5
0
Social sciencesComputer sciencesMedical sciences
Biological sciencesEngineeringPhysical sciencesMathematics
Science and engineering bachelor’s degrees earned by Asians, by �eld: 1989–2008Percent
NOTE: Data not available for 1999. SOURCE: Women, Minorities, and Persons with Disabilities in Science and Engineering:www.nsf.gov/statistics/wmpd/.
1989 1992 1994 1996 1998 2000 2002 2004 2006 2008
25
20
15
10
5
0
Engineering Biological sciences
MathematicsPhysical sciences
Computer sciencesSocial sciencesMedical sciences
Underrepresented minorities’ shares of science and engineering bachelor’s and master’s degrees have been rising over the two decades since 1989, with shares of
doctorates in these fields flattening after 2000.
The greatest rise in science and engineering bachelor’s degrees earned by underrepresented minorities has been in the social, computer, and medical sciences fields of study.
Although Asians’ share of science and engineering degrees has been steady over the past decade, major share shifts by field have occurred in bachelor’s degrees: most
pronounced are a drop in computer sciences and rises in physical and biological sciences.
Asian U.S. citizens and permanent residents’ shares of all science and engineering degrees are roughly similar for bachelor’s, master’s, and doctoral degrees. Their shares
of science and engineering degrees at all levels rose slightly in the 1990s but have been steady over the past decade.
A B
DC
6 Women, Minorities, and Persons with Disabilities in Science and Engineering: 2011
Field of Degree
Minority Women
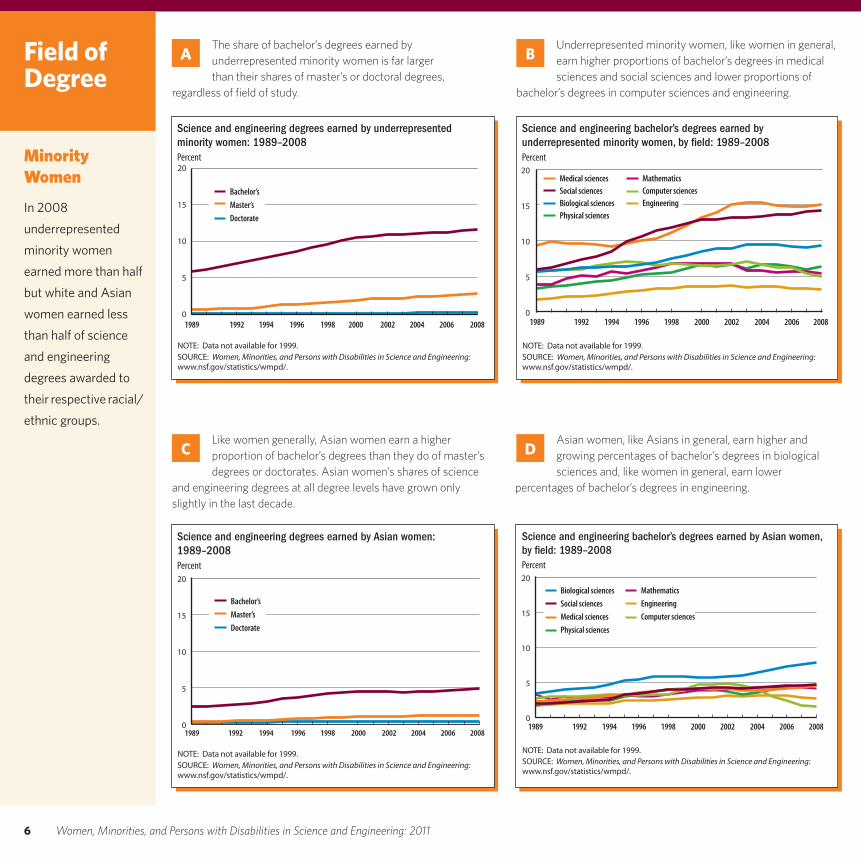
In 2008 underrepresented minority women earned more than half but white and Asian women earned less than half of science and engineering degrees awarded to their respective racial/ethnic groups.
Science and engineering degrees earned by underrepresented minority women: 1989–2008 Percent
NOTE: Data not available for 1999. SOURCE: Women, Minorities, and Persons with Disabilities in Science and Engineering:www.nsf.gov/statistics/wmpd/.
1989 1992 1994 1996 1998 2000 2002 2004 2006 20080
5
10
15
20
Bachelor’sMaster’sDoctorate
Science and engineering degrees earned by Asian women: 1989–2008 Percent
NOTE: Data not available for 1999. SOURCE: Women, Minorities, and Persons with Disabilities in Science and Engineering:www.nsf.gov/statistics/wmpd/.
1989 1992 1994 1996 1998 2000 2002 2004 2006 20080
5
10
15
20
Bachelor’sMaster’sDoctorate
Science and engineering bachelor’s degrees earned by underrepresented minority women, by �eld: 1989–2008Percent
NOTE: Data not available for 1999. SOURCE: Women, Minorities, and Persons with Disabilities in Science and Engineering:www.nsf.gov/statistics/wmpd/.
1989 1992 1994 1996 1998 2000 2002 2004 2006 20080
5
10
15
20
Social sciences Computer sciencesMedical sciences
Biological sciences Engineering Physical sciences
Mathematics
Science and engineering bachelor’s degrees earned by Asian women, by �eld: 1989–2008Percent
NOTE: Data not available for 1999. SOURCE: Women, Minorities, and Persons with Disabilities in Science and Engineering:www.nsf.gov/statistics/wmpd/.
1989 1992 1994 1996 1998 2000 2002 2004 2006 20080
5
10
15
20
Social sciences
Medical sciences
Biological sciences
Physical sciences
Computer sciences
Engineering
Mathematics
The share of bachelor’s degrees earned by underrepresented minority women is far larger than their shares of master’s or doctoral degrees,
regardless of field of study.
Underrepresented minority women, like women in general, earn higher proportions of bachelor’s degrees in medical sciences and social sciences and lower proportions of
bachelor’s degrees in computer sciences and engineering.
Asian women, like Asians in general, earn higher and growing percentages of bachelor’s degrees in biological sciences and, like women in general, earn lower
percentages of bachelor’s degrees in engineering.
Like women generally, Asian women earn a higher proportion of bachelor’s degrees than they do of master’s degrees or doctorates. Asian women’s shares of science
and engineering degrees at all degree levels have grown only slightly in the last decade.
A B
DC

www.nsf.gov/statistics/wmpd/ 7
URM = underrepresented minority.SOURCE: Women, Minorities, and Persons with Disabilities in Science and Engineering:www.nsf.gov/statistics/wmpd/.
Unemployment rates of scientists and engineers: 2006 Percent
White women White men Asian women Asian men URM women URM men0
0.5
1.0
1.5
2.0
2.5
3.0
3.5
4.0
4.5
URM = underrepresented minority. Not all reasons are shown; respondents could select more than one reason.SOURCE: Women, Minorities, and Persons with Disabilities in Science and Engineering:www.nsf.gov/statistics/wmpd/.
Reasons for unemployment of scientists and engineers: 2006 Percent
Family Retired Job not available Layo�
White women White men Asian women Asian men URM women URM men0
20
40
60
80
100
URM = underrepresented minority.SOURCE: Women, Minorities, and Persons with Disabilities in Science and Engineering:www.nsf.gov/statistics/wmpd/.
Part-time employment rates of scientists and engineers: 2006 Percent
White women White men Asian women Asian men URM women URM men0
5
10
15
20
25
30
URM = underrepresented minority. Not all reasons are shown; respondents could select more than one reason.SOURCE: Women, Minorities, and Persons with Disabilities in Science and Engineering:www.nsf.gov/statistics/wmpd/.
Reasons for part-time employment of scientists and engineers: 2006 Percent
White women White men Asian women Asian men URM women URM men0
20
40
60
80
100Family RetiredNo need
Unemployment rates are higher for minority scientists and engineers than for white scientists and engineers and are higher for minority female than for minority male scientists
and engineers.
Among those employed, a higher percentage of female than of male scientists and engineers in all racial/ethnic groups are employed part time.
Men and women who were employed part time mirrored those unemployed when citing reasons for their part-time employment. Women cited family responsibilities
most frequently, whereas with the exception of Asians, men cited retirement more frequently than family responsibilities.
Across all racial/ethnic groups, women who were unemployed were far more likely than men to cite family responsibilities and less likely than men to cite retirement
as the reason for their unemployment.
Employment Status
Variations in the age distributions of men and women in the science and engineering workforce, as well as differing family responsibilities, are reflected in their respective rates of unemployment and part-time employment across racial/ethnic groups.
A B
DC
8 Women, Minorities, and Persons with Disabilities in Science and Engineering: 2011
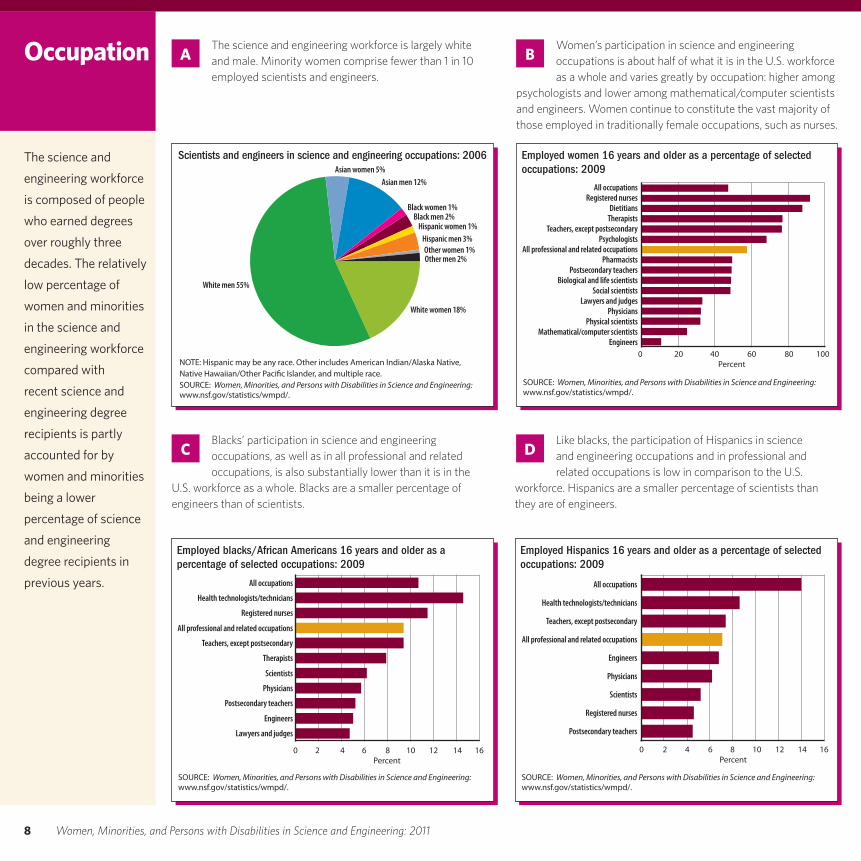
The science and engineering workforce is largely white and male. Minority women comprise fewer than 1 in 10 employed scientists and engineers.
Women’s participation in science and engineering occupations is about half of what it is in the U.S. workforce as a whole and varies greatly by occupation: higher among
psychologists and lower among mathematical/computer scientists and engineers. Women continue to constitute the vast majority of those employed in traditionally female occupations, such as nurses.
A B
NOTE: Hispanic may be any race. Other includes American Indian/Alaska Native, Native Hawaiian/Other Paci�c Islander, and multiple race.SOURCE: Women, Minorities, and Persons with Disabilities in Science and Engineering:www.nsf.gov/statistics/wmpd/.
Scientists and engineers in science and engineering occupations: 2006
White women 18%
White men 55%
Asian women 5%Asian men 12%
Black women 1%Black men 2%
Hispanic women 1%Hispanic men 3%Other women 1%Other men 2%
SOURCE: Women, Minorities, and Persons with Disabilities in Science and Engineering:www.nsf.gov/statistics/wmpd/.
Employed blacks/African Americans 16 years and older as a percentage of selected occupations: 2009
0 2 4 6 8 10Percent
12 14 16
Lawyers and judges
Engineers
Postsecondary teachers
Physicians
Scientists
Therapists
Teachers, except postsecondary
All professional and related occupations
Registered nurses
Health technologists/technicians
All occupations
SOURCE: Women, Minorities, and Persons with Disabilities in Science and Engineering:www.nsf.gov/statistics/wmpd/.
Employed women 16 years and older as a percentage of selected occupations: 2009
0 20 40 60Percent
80 100Engineers
Mathematical/computer scientistsPhysical scientists
PhysiciansLawyers and judges
Social scientistsBiological and life scientists
Postsecondary teachersPharmacists
All professional and related occupationsPsychologists
Teachers, except postsecondaryTherapistsDietitians
Registered nursesAll occupations
SOURCE: Women, Minorities, and Persons with Disabilities in Science and Engineering:www.nsf.gov/statistics/wmpd/.
Employed Hispanics 16 years and older as a percentage of selected occupations: 2009
0 2 4 6 8 10Percent
12 14 16
Postsecondary teachers
Registered nurses
Scientists
Physicians
Engineers
All professional and related occupations
Teachers, except postsecondary
Health technologists/technicians
All occupations
Like blacks, the participation of Hispanics in science and engineering occupations and in professional and related occupations is low in comparison to the U.S.
workforce. Hispanics are a smaller percentage of scientists than they are of engineers.
Blacks’ participation in science and engineering occupations, as well as in all professional and related occupations, is also substantially lower than it is in the
U.S. workforce as a whole. Blacks are a smaller percentage of engineers than of scientists.
Occupation
The science and engineering workforce is composed of people who earned degrees over roughly three decades. The relatively low percentage of women and minorities in the science and engineering workforce compared with recent science and engineering degree recipients is partly accounted for by women and minorities being a lower percentage of science and engineering degree recipients in previous years.
DC

www.nsf.gov/statistics/wmpd/ 9
Among science and engineering doctorate holders employed full time as full, associate, or assistant professors in 4-year colleges or universities, women are less likely
than men to have been supported by federal grants or contracts, and underrepresented minority women are the least likely to have had such support.
Regardless of racial or ethnic group, women and men who hold doctorates in science and engineering fields have shown a similar pattern in publication activity over
the 5-year period from 2003 to 2008.
URM = underrepresented minority.SOURCE: Women, Minorities, and Persons with Disabilities in Science and Engineering:www.nsf.gov/statistics/wmpd/.
Full-time faculty in 4-year institutions who have science and engineering doctorates and receive federal support: 2008Percent
White women White men Asian women Asian men URM women URM men0
10
20
30
40
50
60
SOURCE: Women, Minorities, and Persons with Disabilities in Science and Engineering:www.nsf.gov/statistics/wmpd/.
Women and underrepresented minorities as a percentage of full-time, full professors with science and engineering doctorates: 1979–2008Percent
1979 1989 1999 20080
5
10
15
20
25Women Underrepresented minorities
URM = underrepresented minority.SOURCE: Women, Minorities, and Persons with Disabilities in Science and Engineering:www.nsf.gov/statistics/wmpd/.
Doctorate holders employed full time in 4-year institutions with one or more refereed articles, books, or patents in the period 2003–08Percent
White women White men Asian women Asian men URM women URM men0
20
40
60
80
100Articles Books Patents
Median salaries of doctoral scientists and engineers employed full time in 4-year institutions, by years since doctorate: 2008 Dollars
URM = underrepresented minority.SOURCE: Women, Minorities, and Persons with Disabilities in Science and Engineering:www.nsf.gov/statistics/wmpd/.
1 or 2 3 or 4 5 or 6 7 or 8Years since doctorate
9 or 10 11 or 12 13 or 140
20,000
40,000
60,000
80,000
100,000
Asian womenURM womenWhite women
Asian men URM menWhite men
Among scientists and engineers, women generally earn less than men, and underrepresented minorities generally earn less than their white counterparts. Among
science and engineering doctorate holders employed full time in 4-year colleges or universities with similar experience, however, median salaries for men, women, and racial/ethnic groups were more similar.
The share of full-time, full professorships held by women has risen substantially over time, whereas the share held by underrepresented minorities has risen more slowly and
has remained fairly flat in recent years.
Academic Employment
Women and underrepresented minorities in academic employment differ from their male and white counterparts in rank, tenure, and other characteristics.
A B
DC

10 Women, Minorities, and Persons with Disabilities in Science and Engineering: 2011
SOURCE: Women, Minorities, and Persons with Disabilities in Science and Engineering:www.nsf.gov/statistics/wmpd/.
Students with disabilities as a percentage of undergraduate and graduate students, by �eld: 2008
0 2 4 6Percent
8 10 12
Graduate engineering/computer sciences
Graduate life/physical/mathematical sciencesGraduate social/behavioral sciences
Graduate non-science and engineeringGraduate, all �elds
Undergraduate engineering/computer sciences
Undergraduate life/physical/mathematical sciences
Undergraduate social/behavioral sciencesUndergraduate non-science and engineering
Undergraduate undeclared major
Undergraduate, all �elds
SOURCE: Women, Minorities, and Persons with Disabilities in Science and Engineering:www.nsf.gov/statistics/wmpd/.
Employment status of scientists and engineers, by disability status: 2006 Percent
Without disability With disability0
10
20
30
40
50
60
70
80
90
100Employed Unemployed Not in labor force
Doctoral degrees awarded to U.S. citizens and permanent residents with disabilities: 1997–2008 Doctorates
SOURCE: Women, Minorities, and Persons with Disabilities in Science and Engineering:www.nsf.gov/statistics/wmpd/.
1997 1998 1999 2000 2001 2002 2003 2004 2005 2006 2007 20080
50
100
150
200
250
300
350
400
Non-science and engineering �eldsScience and engineering �elds
Students with disabilities are a larger proportion of undergraduate students than of graduate students. At both the undergraduate and graduate levels, students with
disabilities were about as likely to major in science and engineering fields as in non-S&E fields.
U.S. citizens and permanent residents with disabilities earned higher numbers of science and engineering doctorates in 2008 than they did in 1997 and now earn
more doctorates in those fields than they do in non-S&E fields.
Scientists and engineers with disabilities are more likely than those without disabilities to be unemployed or out of the labor force.
Persons with Disabilities
Disability can occur throughout one’s life. Disabilities acquired at birth or at an early age may influence decisions to pursue science and engineering studies; those acquired at later ages may influence opportunities to continue or seek employment. Regardless of when disabilities were acquired, persons with disabilities are underrepresented in the science and engineering workforce compared to the population as a whole.
A B
C

www.nsf.gov/statistics/wmpd/ 11
SOURCE: Women, Minorities, and Persons with Disabilities in Science and Engineering:www.nsf.gov/statistics/wmpd/.
Scientists and engineers who are unemployed or out of the labor force, by reason for not working: 2006 Percent
Without disability With disability0
10
20
30
40
50
60
70
80
90
100Chronic illness orpermanent disability
Did not need/want to work Family responsibilities
Laid o� Retired StudentSuitable job not available
Other
SOURCE: Women, Minorities, and Persons with Disabilities in Science and Engineering:www.nsf.gov/statistics/wmpd/.
Age at onset of disability among scientists and engineers: 2006
0 5 10 15Percent
20 25 30
Since birth
Younger than 10 years
10–19 years
20–29 years
30–39 years
40–49 years
50–75 years
Retirement was the primary reason for not working both for persons with and without disabilities, but for persons with disabilities, chronic illness or permanent disability was
also a prevalent reason for not working.
About two-thirds of scientists and engineers with disabilities became disabled at age 30 or older. Relatively few of those with disabilities had been disabled since birth.
D E

12 Women, Minorities, and Persons with Disabilities in Science and Engineering: 2011
Data Sources
The data in this digest come from surveys conducted by the National Science Foundation (Division of Science Resources Statistics), the U.S. Department of Education (National Center for Education Statistics), and the U.S. Department of Labor (Bureau of Labor
Statistics). The technical notes for this report, available online at http://www.nsf.gov/statistics/wmpd/, provide information on specific data sources, including the survey population, data collection procedures, and sampling errors.
This digest includes data on people with degrees in science, engineering, and health fields, constituted in this report by the following fields: astronomy, chemistry, physics, atmospheric sciences, earth sciences, oceanography, mathematics and statistics, computer sciences, agricultural sciences, biological sciences, psychology, social sciences, engineering, medical sciences, and other life sciences. Medical sciences and other life sciences are considered health fields and include such fields as public health, nursing, and health care administration. To present data in a condensed form for this digest, several fields were aggregated in figures and in text. The biological sciences field includes agricultural sciences; the physical sciences field includes earth, atmospheric, and ocean sciences; the medical sciences field includes other life sciences; and the social sciences field includes behavioral sciences except where noted. Data on degrees include data on bachelor’s, master’s, and doctoral degrees and do not include data on professional degrees, such as the MD or JD.
Racial/ethnic categories reported are generally those mandated by the U.S. Office of Management and Budget (OMB) effective 1 January 2003. OMB specified the following categories of racial/ethnic groups: Black or African American; American Indian or Alaska Native; Asian; Native Hawaiian or Other Pacific Islander; White; Hispanic or Latino regardless of race; and more than one race reported. Previously, racial/ethnic groups were identified as white; black; Hispanic; Asian or Pacific Islander; and American Indian or Alaskan Native. Degree and enrollment data by race/ethnicity were collected by the National Center for Education Statistics under the previous standards through 2008; thus, the racial/ethnic groups described for degree data are designated by the old categories: Asian includes Pacific Islander and American Indian includes Alaska Native. Degree data by race/ethnicity refer to U.S. citizens and permanent residents only. American Indian also includes Alaska Native for employment data. Because of insufficient sample size in some workforce surveys, not all groups are reported in all figures.
Previously published data on doctorate holders in the workforce for 2006 erroneously included some individuals reporting two or more races in other individual racial/ethnic categories. Workforce data for 2006 in this report have been revised. The 2008 data in this report for doctorate holders are preliminary.

www.nsf.gov/statistics/wmpd/ 13
GlossaryHigh Hispanic enrollment institution. HHE institutions are academic institutions on the U.S. Department of Education’s list of minority-serving institutions with high Hispanic enrollment in 2006. This list includes the institutions of higher education whose full-time equivalent enrollment of undergraduate students is at least 25% Hispanic. See http://www.ed.gov/about/offices/list/ocr/edlite-minorityinst-list-hisp-tab.html.
Historically black college or university. HBCUs are academic institutions on the list maintained by the White House Initiative on Historically Black Colleges or Universities. The Higher Education Act of 1965, as amended, defines an HBCU as: “any historically black college or university that was established prior to 1964, whose principal mission was, and is, the education of black Americans, and that is accredited by a nationally recognized accrediting agency or association determined by the Secretary [of Education] to be a reliable authority as to the quality of training offered or is, according to such an agency or association, making reasonable progress toward accreditation.” See http://www2.ed.gov/about/inits/list/whhbcu/edlite-list.html.
Minority. A minority is a racial/ethnic group that is a small percentage of the U.S. population. Blacks, Hispanics, American Indians/Alaska Natives, Native Hawaiians/Other Pacific Islanders, and Asians are minority groups.
Scientists and engineers. In this report persons classified as scientists and engineers are residents of the United States with a baccalaureate degree or higher who were either educated as or are working as a scientist or engineer. A baccalaureate or higher degree is a bachelor’s, master’s, doctoral, or professional degree.
Tribal college. Tribal colleges are academic institutions that are members of the American Indian Higher Education Consortium and that are included as tribal colleges in the basic classification scheme of the 2005 Carnegie Classification of Institutions of Higher Education. See http://www.aihec.org/colleges/TCUroster.cfm and http://classifications.carnegiefoundation.org/lookup_listings/standard.php.
Underrepresented minority. This category comprises three racial/ethnic minority groups (blacks, Hispanics, and American Indians) whose representation in science and engineering is smaller than their representation in the U.S. population.
Key to AcronymsHBCU = historically black college or university
HHE = high Hispanic enrollment
S&E = science and engineering
URM = underrepresented minority

14 Women, Minorities, and Persons with Disabilities in Science and Engineering: 2011
Online ResourcesA rich set of resources that supplement this digest is available online at http://www.nsf.gov/statistics/wmpd/. Women, Minorities, and Persons with Disabilities in Science and Engineering online is a dynamic information source with data updated as they become available.
Data tables. Detailed data tables, organized by topic, allow the reader to explore the data in more depth. Data tables are available for download, either as Excel files or in portable document format (PDF).
Figures. Presentation graphics, in PowerPoint slide and image (JPEG) formats, accompanied by their supporting data in Excel format, are provided for each of the figures that illustrate the topics in this digest.
Technical notes. Technical notes provide information on reporting categories, sources of data, and sampling errors.
Resource links. Links are provided to additional sources of data on these topics from the National Science Foundation and to related reports published by NSF, as well as to related reports and data from external sources, such as the National Center for Education Statistics and American Council on Education.

SUGGESTED CITATION
National Science Foundation, Division of Science Resources Statistics. 2011. Women, Minorities, and Persons with Disabilities in Science and Engineering: 2011. Special Report NSF 11-309. Arlington, VA. Available at http://www.nsf.gov/statistics/wmpd/.
AcknowledgmentsThis report was developed by the Science Resources Statistics (SRS) division of the National Science Foundation. It was guided by Rolf F. Lehming and Mary J. Frase, assisted by staff in the Science and Engineering Indicators Program. Production of the printed volume and its online presentation was accomplished by staff of the Information and Technology Services Program of SRS. Eileen Kessler and staff at OmniStudio Inc. designed the print layout; staff of Compuware Corporation provided assistance with the online presentation.
NSF 11-309
Top Related