


Languages
Pages
Legal


TABLE OF CONTENTS
Page No.
Introduction 1
Part I
Analysis of Broad Indicators of State Finances 3
Revenue Receipts 4
Revenue Expenditure 7
Revenue Deficit 10
Fiscal Deficit 10
Debt Profile 14
Committed Liabilities 20
Part II
Public Finance 27
Unproductive Expenditure 27
Lapsing of Central Assistance 27
Trend of Balance from Current Revenue 28
Net Accrual from Public Account 29
Part III
Options for the Government 31

LIST OF TABLES
Page No.
T1 GSDP in 2000-01 to 2009-10 3
T2 Trend in Revenue Receipts 5
T3 Revenue Receipts 6
T4 Revenue and Expenditure as percentage of GSDP 7
T5 Trend in Revenue Expenditure 8
T6 Salaries, Pension and Interest Payments 9
T7 Debt of the State 11
T8 Key Financial Indicators 13
T9 Debt Profile 15
T10 Outstanding Commitments causing immediate outflow 19
T11 Balance from Current Revenues 28
T12 Accruals under Public Accounts 30

1
Introduction
1 The UDF Government assumed office on 18.05.2011. It is committed to
place the current status of state finances before the people of Kerala.
Accordingly, it decided to bring out a white paper on the State finances.
2. This White Paper is intended to present the facts about the financial
position of the State and the difficulties being faced by it. It is organized in three
parts :
• The first part contains a brief description of the nature and magnitude
of the problems that the State exchequer is facing today. It mainly
gives an analysis of the fiscal parameters. The historical data and their
analyses have been extensively mentioned in the White paper 2001,
published when the UDF Government had taken over in 2001. Hence
instead of repeatedly referring to a long term past data, this white
paper (2011) takes into account the more recent data over the last
decade i.e., 2001-02 to 2010-11. This is expected to present a
concurrent financial status of the State.
• The second part briefly deals with the issues of public finances and
their analysis.
• The third part deals with the possible options desirable under the
contemporary financial condition.
3. The details that are being provided in this paper are expected to initiate a
wider debate on the state of public finances and analyses thereof. It can only offer
a limited choice of options to address the financial issues facing the State. It
would indeed be difficult to exercise preference of one service over the other in
social sector or preference of one sector over the other. Certainly, these options
and preferences should also be consistent with the structural imperatives of our

2
economy. This paper is therefore intended to facilitate selection of informed
options of economic recovery and fiscal consolidation.
4. Government hopes that this white paper will help in learning important
lessons from the more recent experience in State finances. It is considered
necessary because there are some apparently satisfactory indicators like cash
balance retained in treasury, which is actually a sub optimal option of cash
managements because positive treasury surplus entails a cost of carrying that
surplus which, in ultimate analysis, adds to the liability of the State. An example
can clearly elucidate this proposition. A cash balance of A 3881.94 crore was
available in treasuries on 01.04.2011 in the form of Treasury Bill holdings. It
contained mostly treasury saving bank deposits. But the cost of treasury holding
actually adds to the carrying cost, as higher interest rates are payable on treasury
deposits and the amount blocked in it is not available for deployment on ‘return
based instruments’. There are other examples of certain sectors, which are unable
to significantly utilize even the allocated resources. Source of funds include
borrowings. Part of this borrowed money is held in treasury as unutilized. Hence
at least a part of treasury holding suffers from interest liability at two ends; one at
the time of borrowing and the second at the time of failure in its utilization and
consequent retention in the treasury. Hence one just cannot sigh in relief on
maintaining huge treasury balance.

3
PART – I
ANALYSIS OF BROAD INDICATORS OF STATE FINANCES
5. To understand and appreciate the finances of the State, certain basic
indicators have to be taken into account. Gross State Domestic Product (GSDP)
and its sectoral composition, fiscal deficit, revenue deficit, capital and revenue
expenditure, debts, etc are a few of these indicators. This paper discusses them in
seriatum.
6. Gross State Domestic Product (GSDP) signifies the sum total of the value
of economic activities in the State. A rising GSDP indicates vibrancy of the
economy. A steady or ascending growth rate of GSDP underlines the growth of
economy over a period of time. If we look at the data on Gross State Domestic
Product (GSDP) during the last few years, it has some interesting lessons. During
the UDF rule, we had highest growth of GSDP at 23.34% in 2004-05. Prior to
that, during 2002-03 and 2003-04, it was 11.51% and 11.28%. In 2005-06, it was
14.74%. Even this figure was never achieved by the previous Government in
subsequent five years, as the table T1 reveals. At the current prices, the GSDP
stands at A 230316 crore (2009-10) which signifies a growth of 14.57% over the
last year.
Table : T1
GSDP in 2000-01 to 2009-10
Year GSDP (AAAA crore) % Growth
2000-01 72659 5.05
2001-02 77924 7.25
2002-03 86895 11.51
2003-04 96698 11.28
2004-05 119264 23.34
2005-06 136842 14.74
2006-07 153785 12.38
2007-08 175141 13.89
2008-09 201020 14.78
2009-10 230316 14.57
GSDP: Source: Dept of Economics and Statistics, Kerala

4
7. GSDP is contributed by all the sectors of the occupational structure. Going
by the composition, the primary, the secondary and the tertiary sector constituted
15.36%, 23.14% and 61.50% of the GSDP respectively in 2009-10. A further
analysis of primary sector indicates that the agriculture and allied sectors’
contribution to the GSDP had declined from 12.68% in 2007-08 to 12.14% in
2008-09 and later 11.47% in 2009-10. Similarly, the analysis of secondary sector
reveals that within it, the construction activities alone constituted 12.21% and the
manufacturing activities 9.33% of the GSDP in 2009-10. On the same lines, an
analysis of the tertiary sector reveals that ‘trade, hotel and restaurants’ constituted
21.14% and ‘transport, storage and communication 9.40% of the GSDP.
Transport by other means contributed 7.13% to the GSDP. Going by the trend,
one can hypothesize that these are the areas which can ensure better revenue
receipts and also point out potential areas for policy intervention in the medium
term.
8. Slow economic growth leads to lower levels of investment in both public
and private ventures. This in turn retards the pace of economic growth! With one
succeeding into the other, it becomes a vicious cycle, adversely impacting the
revenue generation, thus starving the economy of funds for economic and social
development. If this is appreciated properly for evaluation of development
alternatives, it may offer better options for management of available financial
resources, keeping in view the contemporary development requirements. In this
backdrop, optimizing the resources for the achievement of development
objectives appears to be the only way to address the issues facing our State’s
economy at the moment. Of course, while proceeding on these lines, one has to
remember that ordinarily, increase in resources becomes difficult as one scales the
higher targets.
Revenue Receipts.
9. An analysis of the trend in revenue receipts Table T2 discloses that share
of taxes and duties has been between 80.41% in 2005-06 and 84.35% in 2009-10

5
(This is lesser than 85.49% in 2003-04, the highest in last 10 years). States’ own
taxes and duties have been between 66.40% in 2004-05 and 68.65% in 2002-03.
It has hovered between 64.76% (in 2007-08) and 67.50% (in 2009-10).
Table T2
TREND IN REVENUE RECEIPTS 2000-01 TO 2009-10
(A in crore )
Item 2000-
01 2001-02 2002-03 2003-04 2004-05 2005-06 2006-07 2007-08 2008-09 2009-10
1 2 3 4 5 6 7 8 9 10 11
I. Taxes and Duties 7455.87 7537.68 9017.76 10100.78 11368.60 12296.82 15153.86 17720.65 20265.70 22023.80
Percentage to total 85.40 83.23 84.77 85.49 84.21 80.40 83.32 83.96 82.68 84.35
Index 408 413 494 553 622 673 830 970.14 1109 1206
(I)Share of Central Taxes 1585.61 1614.26 1715.22 2012.00 2404.95 2518.20 3212.04 4051.70 4275.52 4398.78
Percentage to total 18.16 17.82 16.12 17.03 17.81 16.46 17.66 19.20 17.44 16.85
(ii)State Taxes and Duties 5870.26 5923.42 7302.54 8088.78 8963.65 9778.62 11941.82 13668.95 15990.18 17625.02
Percentage to total 67.24 65.41 68.65 68.46 66.40 63.94 65.66 64.76 65.23 67.50
II. Non-tax Revenue 1274.99 1518.71 1619.63 1714.59 2131.88 2997.71 3032.77 3386.15 4246.47 4085.60
Percentage to total 14.60 16.77 15.23 14.51 15.79 19.60 16.68 16.04 17.32 15.65
Index 221 264 281 298 370 520 526 587.54 737 709
(I)Interest Receipts 36.81 31.08 35.86 32.40 40.51 46.36 44.63 69.65 83.69 152.50
Percentage to total 0.42 0.34 0.34 0.27 0.30 0.30 0.25 0.33 0.34 0.58
(ii)Other non-tax Revenue 1238.18 1487.63 1583.77 1682.19 2091.38 2951.35 2988.14 3316.49 4162.79 3933.10
Percentage to total 14.18 16.43 14.89 14.24 15.49 19.30 16.43 15.71 16.98 15.06
III. Total Revenue 8730.86 9056.39 10637.39 11815.37 13500.49 15294.53 18186.63 21106.79 24512.18 26109.40
Index 363 377 443 492 562 636 757 878 1020 1087
10. Within the States’ own tax receipts, the contribution of sales tax and VAT
had been between 68.56% and 72.46% during the last five years. It may be
recalled that the UDF Government had in 2001-06 been able to raise this share to
74.76% in 2004-05 and 74.07% in 2003-04. Similar is the example of Motor
Vehicle tax in which the growth rate hovered between 5.86% and 6.43% during
the last five years. One may recollect that the previous UDF Government in
2001-06 had been able to achieve the growth 7.24% in 2003-04 and 6.81% in
2004-05.
State’s own Revenue
11. More importantly, the revenue deficit of the State has been over its target
during the last few years. Along side this, the rate of increase of States Own Tax

6
Revenue (SOTR) was 0.91% in 2001-02; it rose to 10.23% in 2009-10. During
the period from 2001-02 to 2010-11, first it grew up to 23.28% in 2002-2003.
Then it was 22.11% in 2006-07 which was on account of introduction of VAT
and resultant additional accrual of tax resources to the Government. The growth
rate of the States Own Tax Revenue has been 10.77% during the year 2003-04
and 10.82% in the year 2005-06. It came up to 14.46% in 2007- 08, and 16.98%
in 2008-09. It however slid to 10.22% in 2009-10. It is obvious from these data
that the SOTR growth rate of 22 to 23% witnessed twice during the last decade is
not easy to sustain in the long run. On the basis of these figures, it would be
reasonable to indicate the general growth rate in the States own tax revenue at 16
to18% in the long run. Similarly although, the States Own Non Tax Revenue
(SONTR) constitute much less in terms of percentage of overall revenue, its
growth rate has been hovering around 0.09% to 29% during the last 5 years. Here
also, it had peaked in 2002-03 when it was 25.37%. And just like SOTR, the
same assumptions apply with regard to the growth rate of SONTR and it will be
reasonable to assume a growth rate of 16-18 % for SONTR too. Its rationale is
clear from the following table T3.
Table : T3
Revenue Receipts AAAA in crore
State’s own Tax
Revenue
State’s own Non Tax
Revenue
State’s Own Revenue
(2+4)
Share of Central
Taxes and Grants
Total Revenue
(6+8) Year
Amount Growth
rate Amount
Growth
rate Amount
Growth
rate Amount
Growth
rate Amount
Annual
Growth rate
2000-01 5870.26 13.03 659.09 24.19 6529.35 14.07 2201.51 -0.72 8730.86 9.94
2001-02 5923.42 0.91 543.38 -17.56 6466.8 -0.96 2589.59 17.63 9056.39 3.73
2002-03 7302.54 23.28 681.26 25.37 7983.8 23.46 2653.58 2.47 10637.38 17.46
2003-04 8088.78 10.77 806.98 18.45 8895.76 11.42 2919.61 10.03 11815.37 11.07
2004-05 8963.65 10.82 819.08 1.50 9782.73 9.97 3717.75 27.34 13500.48 14.26
2005-06 9779.64 9.10 936.77 14.37 10716.41 9.54 4578.11 23.14 15294.52 13.29
2006-07 11941.82 22.11 937.57 0.09 12879.39 20.18 5307.23 15.93 18186.62 18.91
2007-08 13668.95 14.46 1209.55 29.01 14878.50 15.52 6228.29 17.35 21106.79 16.06
2008-09 15990.18 16.98 1559.29 28.92 17549.47 17.95 6962.71 11.79 24512.18 16.13
2009-10 17625.02 10.22 1852.22 18.78 19477.24 10.98 6632.16 -4.74 26109.40 6.52
AAGR 13.16 14.31 13.21 12.02 12.74
7
Share of Central Taxes and Duties.
12. Share of central taxes had substantially increased in 2004-05 and
2005-06 at the rate of 27.34% and 23.14% respectively. This was on account of
the 12th
Finance Commission’s recommendations and consequent upon the
expansion of divisible pool of funds, the State stood to gain. However, the central
share of taxes in 2008-09 and 2009-10 and also the following year declined,
arguably due to the economic slow down which picked up in the year 2010-11
and the growth rate became 20.36% that year against (-) 4.74% in 2009-2010.
Similarly, the total transfers to the State during the last 5 years have generally
growing been in the range of 11 to 17% of its revenues as the Table T3 above
explains. The State could make all efforts to claim entire legitimate funds that are
due to it from Government of India.
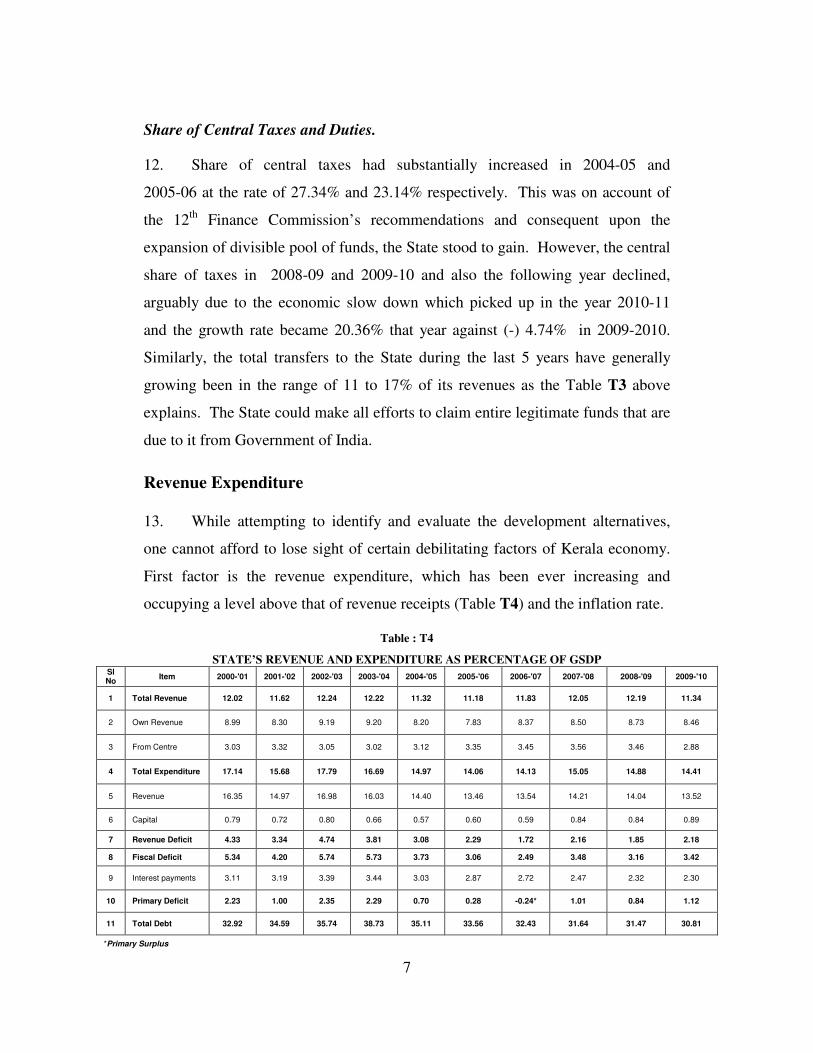
Revenue Expenditure 13. While attempting to identify and evaluate the development alternatives,
one cannot afford to lose sight of certain debilitating factors of Kerala economy.
First factor is the revenue expenditure, which has been ever increasing and
occupying a level above that of revenue receipts (Table T4) and the inflation rate.
Table : T4
STATE’S REVENUE AND EXPENDITURE AS PERCENTAGE OF GSDP Sl No
Item 2000-'01 2001-'02 2002-'03 2003-'04 2004-'05 2005-'06 2006-'07 2007-'08 2008-'09 2009-'10
1 Total Revenue 12.02 11.62 12.24 12.22 11.32 11.18 11.83 12.05 12.19 11.34
2 Own Revenue 8.99 8.30 9.19 9.20 8.20 7.83 8.37 8.50 8.73 8.46
3 From Centre 3.03 3.32 3.05 3.02 3.12 3.35 3.45 3.56 3.46 2.88
4 Total Expenditure 17.14 15.68 17.79 16.69 14.97 14.06 14.13 15.05 14.88 14.41
5 Revenue 16.35 14.97 16.98 16.03 14.40 13.46 13.54 14.21 14.04 13.52
6 Capital 0.79 0.72 0.80 0.66 0.57 0.60 0.59 0.84 0.84 0.89
7 Revenue Deficit 4.33 3.34 4.74 3.81 3.08 2.29 1.72 2.16 1.85 2.18
8 Fiscal Deficit 5.34 4.20 5.74 5.73 3.73 3.06 2.49 3.48 3.16 3.42
9 Interest payments 3.11 3.19 3.39 3.44 3.03 2.87 2.72 2.47 2.32 2.30
10 Primary Deficit 2.23 1.00 2.35 2.29 0.70 0.28 -0.24* 1.01 0.84 1.12
11 Total Debt 32.92 34.59 35.74 38.73 35.11 33.56 32.43 31.64 31.47 30.81
*Primary Surplus

8
14. It will be interesting to see the trend in the revenue expenditure of the
State during the last decade. Table T5 reveals that in 2005-06, rate of growth in
total revenue expenditure was 7.3%, which increased to 13.03% in the next year
and peaked at 19.53% in 2007-08.
Table : T5
Trend in Revenue Expenditure
AAAA in crore
Total Revenue Expenditure Development Expenditure Non Development
Expenditure
Year
Amount
Annual
Growth
Rate
Amount
% to total
Revenue
expenditure
Amount
% to total
Revenue
expenditure
2000-01 11877.92 2.69 6396.50 53.85 5481.42 46.15
2001-02 11662.03 -1.18 6028.34 51.69 5633.69 48.31
2002-03 14756.05 26.53 8064.80 54.65 6691.25 45.35
2003-04 15495.67 5.01 8061.94 52.03 7433.73 47.97
2004-05 17169.41 10.80 9244.45 53.84 7924.95 46.16
2005-06 18423.58 7.30 9757.79 52.96 8665.79 47.04
2006-07 20824.57 13.03 9283.26 44.58 11541.31 55.42
2007-08 24891.64 19.53 12332.42 49.54 12559.22 50.46
2008-09 28223.85 13.39 15154.25 53.69 13069.60 46.31
2009-10 31132.38 10.31 16633.43 53.43 14498.95 46.54
15. However, it dropped to 13.39% in 2008-09 and declined further to 10.3%
in the following year (i.e., 2009-10). The total development expenditure has been
in the range of 44 to 52% during this period. In 2006-07 the development
expenditure declined to 44.58% of the revenue expenditure; it was 49.54% in
2007-08. This may be compared with the first 5 years of the decade 2001-11
when the development expenditure was generally of the order of 51-54% of the
revenue expenditure. It is therefore evident that during these two years viz.,
2006-07 and 2007-08, the development expenditure has suffered correspondingly.
During these two years, the non development expenditure had increased which
was otherwise in the range of 46.31% to 47.04% of the total revenue expenditure

9
Table : T6
Salaries, Pensions and Interest Payments (AAAA in crore)
2000-01 2001-02 2002-03 2003-04 2004-05 2005-06 2006-07 2007-08 2008-09 2009-10
1 Interest Payments 2257.6 2489.47 2946.77 3328.29 3612.54 3799.25 4189.7 4329.65 4659.69 5292.48
2 Pension Payments 1929.48 1837.93 2282.90 2408.83 2600.77 2861.18 3294.58 4924.53 4686.43 4705.5
3 Salaries 4491.61 4200.82 4678.99 5067.09 5345.58 5607.78 6585.45 7693.66 9063.81 9800.20
4 Total (1+2+3) 8678.69 8528.22 9908.66 10804.21 11558.89 12268.21 14069.73 16947.84 18409.93 19798.18
5 Total Revenue Receipts 8730.86 9056.39 10637.39 11815.37 13500.48 15294.53 18186.62 21106.79 24512.18 26109.40
6 Total Revenue
Expenditure 11877.91 11662.03 14756.05 15495.67 17169.40 18423.68 20824.57 24891.64 28223.85 31132.37
7
Salaries + pensions +
interest as % of
Revenue Expenditure
73.07% 73.13% 67.15% 69.72% 67.32% 66.59% 67.56% 68.09% 65.23% 63.59%
8
Salaries + pensions +
interest as % of
Revenue Receipts
99.40% 94.17% 93.15% 91.44% 85.62% 80.21% 77.36% 80.30% 75.11% 75.83%
16. A good proportion of rising revenue expenditure is on account of rise in
the salary, pension and interest liabilities. Second factor is that the results from
investment in the industrial sector have not been optimal. And to sustain even
those sub-optionally performing industrial undertakings, requirement for further
investments have indeed been going up. Third, some of the ventures in the
infrastructure viz, in ports, airports, power, etc have not only been capital
intensive, their gestation period too had virtually been on extension for various
reasons, but significantly on account of delay in land acquisition. And Kerala
having highest population density among the states of India, it becomes a costly
affair to ensure land for any project. The time and cost of land acquisition has
indeed been a spoilsport as far as development initiatives are concerned.
17. Revenue expenditure constituted 91% of the total expenditure. Interest
payments as percentage of revenue receipts ranged between 19 and 25 percent
during the Twelfth Finance Commission award period against the normative
recommendation of 15% by the year under report. Capital expenditure
constituted only 6% of the total expenditure.

10
Revenue Deficit
18. While capital expenditure has been far outweighed by the revenue
expenditure, a good portion of resources has been mobilized through the
borrowings, which were effected at a rising rate of interest.
19. Figures of revenue deficit (i.e., the difference between revenue receipt and
the revenue expenditure) reveal a declining trend. When the UDF government
assumed office in 2001, we had inherited the revenue deficit of 4.33%. Following
the correctional path, that Government was able to bring it down to 3.08% in
2004-05 and finally 2.29% in 2005-06. The revenue deficit has had still further
declined to 1.72%, 2.16%, 1.85% and 2.18% in years 2006-07 to 2009-10 in that
order. But we are still away from the target of zero revenue deficit, that we have
to achieve by 2014-15 under the Medium Term Fiscal Correction Path.
Fiscal Deficit
20. Fiscal deficit i.e., the difference between receipts and disbursals is an
important indicator to gauge the functioning of the economy. By definition, a
declining fiscal deficit signifies consolidation of the resources’ position and the
sustainable functioning of the economy. When the UDF Government assumed
power in 2001-02, the fiscal deficit was 4.2% of GSDP. That Government
worked on the correctional course and brought down the fiscal deficit to 3.06% in
2005-06 (when the last UDF government demitted office in 2006). Subsequent
figures of fiscal deficit explain that although in 2006-07 the fiscal deficit was
2.49%, the last LDF government could not control the deficit that hovered
between 3.48% and 3.16% in next three years.
21. Fiscal deficit is usually financed by way of borrowings by the State. The
quantum of fiscal deficit has been increasing during the last five years as has the
total revenue been increasing. Obviously, the total debt of the state too has been
increasing over the last decade. In the year 2001-02, it was A 26950 crore which

11
increased to A 70969 crore in 2009-10. As per the latest indications, it will be at
the level of A 78673 crore by 31.03.2011. This is estimated to reach the level of
A 78673 crore by the end of March 2011. The rate of growth of debt during the
period had been hovering between 8.57% and 20.58%. Consequently, the debt
repayment liability too has been increasing correspondingly. Public debt
repayment which was A 750.76 crore in 2001-02, rose to the level of A 2405.68
crore in 2009-10. In addition, increasing reliance on debt for financing current
expenditure (not capital expenditure), increase in the debt liability on account of
loans raised by the SPVs on the strength of government guarantee and the
commitments on account of debt servicing, all manifest in enlargement of the
size of our debt. Details of growth of debt is given in the Table T7.
Table : T7
Debt of the State (2000-01 to 2010-11)
Year Debt
(AAAAin crore) Growth Rate
(in %) Average
Net Addition
(AAAA in crore)
Growth Rate of
Net Addition (in
%)
Average
2000-01 23919 18.55 3743 -16.36
2001-02 26951 12.68 3032 -19.00
2002-03 31060 15.25 4109 35.52
2003-04 37452 20.58 6392 55.57
2004-05 41877.87 11.82
15.77
4425.63 -30.77
4.99
2005-06 45929.05 9.67 4051.18 -8.46
2006-07 49875.18 8.59 3946.13 -2.59
2007-08 55409.57 11.10 5534.39 40.25
2008-09 63269.67 14.19 7860.1 42.02
2009-10 70969.43 12.17
11.14
7699.76 -2.04
13.84
22. The decade 2001-11 had inherited the fiscal deficit at 5.34% of its Gross
State Domestic Product (GSDP) (in 2000-01). It went on decreasing to a lower
level of 3.42% in 2009-10. This by itself may be a little reassuring, but the real
cause of worry is the revenue deficit. The table T2 above shows a trend of
decline in it with 2.18 % in 2009-10. But again, this declining trend per se does
not give any room for complacence; the normative targets stipulated in the
recommendations of the XIII Finance Commission still remain to be achieved.
The target was to restrict the revenue deficit to 1.4% in 2011-12 and eliminate it

12
altogether by 2014-15. This will be a challenging task and has to be achieved
by 2014-15. Further, these targets will attain statutory force once the State’s
Fiscal Responsibility Act is amended in line with the fiscal adjustment path
prescribed by the 12th
Finance Commission. The last Government has not
amended the Act. We have to amend the same to incorporate targets of fiscal
correction course, lest we lose out our share of grants from Government of India.
23. Deficit in the Government accounts represents the gap between revenue
and expenditure. Nature and extent of deficit indicates the extent of prudence
exercised in fiscal management of the government. Equally important is the way
the deficit is financed to determine the fiscal health of the State. It would suffice
to refer to the report of Comptroller and Auditor General of India on State
Finances for 2009-10 (Report No. 1). Main observations contained therein are as
under:-
i. There was an increase of 35.3% in revenue deficit during 2009-10, which was
due to 10.3% increase in revenue expenditure compared to 6.5% increase in
revenue receipts.
ii. Revenue deficit increased to 2.3% of GSDP (from 2%) and the fiscal deficit
grew upto 3.7% in 2009-10 (from 3.5%).
iii. The ratio of revenue deficit to fiscal deficit declined steadily from 74.82% in
2005-06 to 58.5% in 2008-09 but increased again to 63.8% in 2009-10 which
indicated that borrowed funds were increasingly used for revenue expenditure
rather than capital expenditure.
iv. Market borrowings to finance the fiscal deficit constituted 34.8% of the total
financial resources in 2005-06 which grew up to 46.7% in 2006-07 and 59.6%
in 2007-08. It shot up to 75.3% in 2008-09 and declined to 59.8% in 2009-10.
These figures reveal that market borrowings were mainly relied upon to finance
the fiscal deficit.
24. Causes of worry do not stop with the figures of revenue deficit. States
own revenue has been in the range of 8.30% of GSDP (in 2001-02) and 9.20% of
GSDP in 2003-04. In fact, the second half of the preceding decade saw the

13
State’s own revenue at 7.83% in 2005-06, 8.37% in 2006-07, 8.50% in 2007-08,
8.73% of GSDP in 2008-09 and 8.46% in 2009-10. Compared to this, the revenue
expenditure has been growing at much higher rates, hovering between 16.98%
and 13.46% of GSDP in 2002-03 and 2005-06 respectively. Further, capital
expenditure figures hardly offer any hope; it has always been less than 2% of
GSDP.
Table T8
Key Financial Indicators AAAA in crore
2000-01 2001-02 2002-03 2003-04 2004-05 2005-06 2006-07 2007-08 2008-09 2009-10
Revenue Receipts 8730.86 9056.39 10637.39 11815.37 13500.48 15294.53 18186.62 21106.79 24512.18 26109.40
Revenue Expenditure 11877.91 11662.03 14756.05 15495.67 17169.40 18423.68 20824.57 24891.64 28223.85 31132.37
Revenue Deficit 3147.05 -2605.64 -4118.66 -3680.30 -3668.92 -3129.15 -2637.95 -3784.85 -3711.67 -5022.97
Capital Expenditure
(including Loan
Disbursements)
847.89 719.12 948.67 1931.65 878.23 1104.05 1251.97 2367.74 2679.29 2936.06
Fiscal Deficit -3877.80 -3269.41 -4986.54 -5539.05 -4451.90 -4181.70 -3821.88 -6100.21 -6346.21 -7871.60
Primary Deficit(-)/
Surplus(+) -1620.20 -779.94 -2039.77 -2210.76 -839.36 -382.45 367.82 -1770.56 -1686.52 -2579.12
GSDP 72658.83 77923.75 86894.76 96698.03 119264.00 136841.76 153784.88 175141.08 201019.75 230315.55
Revenue Deficit as% of
GSDP 4.33% 3.34% 4.74% 3.81% 3.08% 2.29% 1.72% 2.16% 1.85% 2.18%
Fiscal Deficit as% of GSDP 5.34% 4.20% 5.74% 5.73% 3.73% 3.06% 2.49% 3.48% 3.16% 3.42%
Primary Deficit/ Surplus as
% of GSDP 2.23% 1.00% 2.35% 2.29% 0.70% 0.28% -0.24% 1.01% 0.84% 1.12%
Outstanding Debt 23919 26950 31060 37452 41877 45929 49875 55410 63270 70969
Outstanding Debt as % of
GSDP 32.92% 34.59% 35.74% 38.73% 35.11% 33.56% 32.43% 31.64% 31.47% 30.81%
Interest Payments 2257.6 2489.47 2946.77 3328.29 3612.54 3799.25 4189.7 4329.65 4659.69 5292.48
Interest Payments as % of
GSDP 3.11% 3.19% 3.39% 3.44% 3.03% 2.78% 2.72% 2.47% 2.32% 2.30%
Interest Payments as % of
Revenue Receipts 25.86 27.49 27.70 28.17 26.76 24.84 23.04 20.51 19.01 20.27
Capital Expenditure
(including Loan
Disbursements) as % of
GSDP
1.17% 0.92% 1.09% 1.99% 0.74% 0.81% 0.81% 1.35% 1.33% 1.27%
25. It is a matter of common knowledge that the receipts of the State Government in
general are not able to fully meet the expenditure requirements, and the States seek to fill
the gap by borrowings. This has particularly been a phenomenon from the end of eighties

14
in the last century. In Kerala, huge revenue deficits have been a persistent feature over
last several years. Of course, the XII and XIII Finance Commission recommendations
sought to rein in the fiscal deficit and the revenue deficit. But prior to that, the States had
been resorting to financing non plan expenditure through cuts in their outlays for
development. Faced with these constraints, State Governments have at times diverted
borrowings at costlier rates to meet the requirements of current expenditure. Hence
capital investment programme in general has suffered from resource scarcity. This has
two direct consequences. First, it prevents potential gains in output and productivity
from being realized. Second, it leads to rise in internal debt and interest payment
liabilities of the borrowing state. The resource base of the State is limited to meet the
ever growing expenditure commitments. Tax receipt in the State has not been growing at
uniform and sustainable rate. Hence even if some better growth in tax revenue is
expected or experienced in certain years, the rate of growth of tax revenue itself offers no
assurance, and may not form a stable pattern.
Debt Profile
26. The debt’s growth rate during the last five years has been meandering from
9.67% in 2005-06 and 8.59% in 2006-07 to 11.10% 14.19% and 12.17% in years
2007-08, 2008-09 and 2009-10 respectively. Despite the declining trend in 2005-06 and
2006-06 the debt has shown the tendency to grow to higher levels in 2007-08, 2008-09
and 2009-10.
27. As indicated earlier in table T7, the total debt of the State has been going up,
particularly during the last 10 years. It stood at A 70969 crore by the end of 2009-10
against A 26950 crore in 2001-02. This would be reaching the level of A 78673 crore by
the end of 2010-11. The rate of growth of debt during the decade 2001-2010 has been in
the range of 8.59% to 20.58%.
28. In addition, there is yet another indicator which is quite alarming and indeed
disturbing. The per capita debt in the State has been going up during the last few years. It
was A 11478 in 2004 but it has gone up to A 16074 in the year 2008. Per capita debt at
the national level is A 10018. Hence the per capita debt of Kerala is almost 60% above
the national average of per capita debt. Further, it is also more than the per capita debt of

15
A 8901 in Karnataka and A 9692 in Tamil Nadu (in 2008). Arguably, debt per se may be
a necessity for the economy at a particular juncture of time. But it cannot be
untrammeled by the imperatives of efficient financial resource management; it is rather
saddled with certain hard options for the management of State resources as its condition
precedent.
29. The Internal Debt comprising Market Loans, special Securities issued to
NSSF, Negotiated loans, bonds, etc. stood at A 43368 crore in 2009-10. That was
Table : T9
Debt Profile of the State (2000-01 to 2009-10) (A crore)
Item 2000-01 2001-02 2002-03 2003-04 2004-05 2005-06 2006-07 2007-08 2008-09 2009-10
Receipts 483.11 780.7 1192.86 968.17 1482.11 603.29 205.01 416.43 768.04 562.34
Disbursements 284.01 536.12 1004.44 1875.09 1699.25 596.71 250.64 255.57 292.05 265.68
Interest 732.27 778.56 805.02 809.92 671.60 436.44 432.73 429.48 435.23 425.31
Gross Retention 199.1 244.58 188.42 -906.92 -217.14 6.58 -45.63 160.86 475.99 296.66
Lo
an
s a
nd
Ad
van
ces
fro
m G
overn
men
t o
f In
dia
Net Retention -533.17 -533.98 -616.60 -1716.84 -888.74 -429.86 -478.36 -268.62 40.76 -128.65
Receipts 6295.44 5917.95 8147.87 7011.55 6317.80 6181.49 5838.15 6601.46 10136.03 10109.02
Disbursements 5332.26 4830.23 6770.85 5824.84 6523.40 6738.29 6818.20 6404.44 8780.28 8176.42
Interest 386.75 479.82 627.01 662.72 668.7 634.13 782.59 548.97 515.99 760.13
Gross Retention 963.18 1087.72 1377.02 1186.71 -205.60 -556.8 -980.05 197.02 1355.75 1932.60
Sm
all S
avin
gs a
nd
D
ep
osit
s
Net Retention 576.43 607.90 750.01 523.99 -874.3 -1190.93 -1762.64 -351.95 839.76 1172.47
Receipts 1722.62 1268.51 1685.99 1761.58 1578.63 1595.75 2058.83 2821.66 3082.01 2814.04
Disbursements 1033.71 1284.34 1546.29 1323.33 985.53 988.85 1385.45 1695.17 1848.70 1897.35
Interest 391.03 290.03 375.98 353.86 449.14 537.38 500.67 624.21 699.62 753.30
Gross Retention 688.91 -15.83 139.70 438.25 593.10 606.90 673.38 1126.49 1233.31 916.69
Sta
te P
rovid
en
t F
un
ds
Net Retention 297.88 -305.86 -236.28 84.39 143.96 69.52 172.71 502.28 533.69 163.39
Receipts 6975.36 7849.70 10518.26 14120.87 14442.36 11366.48 11577.39 12212.07 10074.33 6693.80
Disbursements 5083.63 6134.59 8113.70 8446.95 10187.07 7371.99 7278.96 8162.06 5279.26 2140.00
Interest 747.71 941.14 1140.29 1502.06 1823.45 2216.21 2380.17 2727.71 3009.31 3353.17
Gross Retention 1891.73 1715.11 2404.56 5673.92 4255.29 3994.49 4298.43 4050.01 4795.07 4553.80
Inte
rnal D
eb
t
Net Retention 1144.02 773.97 1264.27 4171.86 2431.84 1778.28 1918.26 1322.30 1785.76 1200.63
Receipts 15476.53 15816.86 21544.98 23862.17 23820.90 19747.01 19679.38 22051.62 24060.41 20179.20
Disbursements 11733.61 12785.28 17435.28 17470.21 19395.25 15695.84 15733.25 16517.24 16200.29 12479.45
Interest 2257.76 2489.55 2948.30 3328.56 3612.89 3824.16 4096.16 4330.37 4660.15 5291.91
Gross Retention 3742.92 3031.58 4109.70 6391.96 4425.65 4051.17 3946.13 5534.38 7860.12 7699.75To
tal D
eb
t
Net Retention 1485.16 542.03 1161.40 3063.40 812.76 227.01 -150.03 1204.01 3199.97 2407.84

16
12.03% higher than its previous year’s total that stood at A 38814 crore which
itself was 11.73% more than its previous year. The percentage by themselves
may look innocent and do not convey the ferocity of the quantum as the
borrowing has increased the per capita debt from A 12503 in 2005 to A 16074 in
2008 and A 19626 in 2010.
30. The liabilities on account of Small Savings, Provident Funds and other
debts also have been increasing during the last few years. In 2001-02 its rate of
growth was 10.52% (A 11261.65 crore). However, it had increased to 15.44%
(A 21296 crore) during the year 2009-10. In this regard, a bitter fact has to be
appreciated. These debts are costlier and put the state in a piquant situation where
it results into surplus cash balance in the treasury but the state has to pay higher
rate of interest on these treasury saving deposit and PF accounts. Then there is an
opportunity cost of revision of projects and programmes for which funds were
drawn and kept in treasury. But not utilizing these sums in time, projects are
revised upward on account of delay, seeking more funds later. Obviously, it is a
costly surplus. Hence there is a need to revisit the entire issue.
31. Comptroller and Auditor General of India in his Report on State Finances
for 2009-10 (Report No. 1) has further observed as under :
“Apart from the magnitude of debt of the State Government, it is
important to analyze various indicators that determine the debt
sustainability of the State”
32. Debt sustainability refers to the state’s ability to maintain a constant
debt-GDP ratio over a period of time. Thus it implies State’s ability to service the
debt. It would therefore mean sufficiency of liquid assets to meet the current or
committed obligations and the capacity to maintain a balance between cost of
additional borrowings and the returns from the borrowings. It would also mean
that the rise in fiscal deficit must match the increase in capacity to service the
debt.

17
33. Stability of debt can be achieved if the rate of growth of economy exceeds
the interest rate or the cost of public borrowings. Then the debt GDP ratio can be
used as an indicator provided primary balances are positive or zero or marginally
negative. Debt sustainability can be achieved if the quantum spread (debt
multiplied by the rate spread ; rate spread is GSDP growth rate minus interest
rate) together with primary deficit is zero. Then the debt GSDP ratio would be
constant or the debt would eventually stabilize. If however, quantum spread and
the primary deficit together is negative, the debt-GSDP ratio would be rising.
34. It is on this principle that CAG has observed in the Report referred in para
23 above as under :-
“During 2007-08 to 2009-10, the quantum spread together with
primary deficit was positive, indicating declining trend in debt GSDP
ratio. The resource gap (sufficiency of non-debt receipt) was negative
throughout the period 2007-10 which showed that the incremental
non-debt receipts were inadequate to finance incremental primary
expenditure and incremental interest burden. This means that the
government will have no option but to go for debt receipts to meet its
operational expenditure, Moreover, the net availability of borrowed
funds after providing for interest and repayment of principal decreased
during 2009-10 from the previous years which shows that a larger part
of borrowings was used for current consumption including debt
servicing, leaving only a small portion of the borrowed funds to be
spent for developmental activities. The burden of interest payment
(interest payment to revenue receipt ratio) was much higher in Kerala
(20%) than the TFC recommended norm of 15%.”
35. There is another comment by CAG in his report “Union and state Finance
At a Glance 2009-10”, which is quoted below.

18
“… As on 31 March 2010, as many as 17 States have more liabilities
than financial assets. West Bengal, Kerala and Punjab have financial
liabilities more than double of their financial assets ….”
36. Kerala’s ratio of financial assets to liabilities of the state in the years
2007-08, 2008-09 and 2009-10 had been 36,39 and 39. This indicator explains
why Kerala has been included in the list of debt stressed states, along with West
Bengal and Punjab.
Contingent Liabilities
37. Yet another area of concern is the government guarantees. It is true that
the quantum of guaranteed amount as well as amount outstanding has come down
to A 10225.78 crore and A 7495 crore respectively in 2009-10. However, an
increased possibility of invoking government guarantees has been a matter of
concern because, if invoked, these guarantees may put an unexpected pressure on
the State exchequer. Perhaps the time has come we should seriously review the
economics of contingent liabilities
38. The surplus cash balance in the State Government’s account as on
18.5.2011 was A 1963.47 crore. As explained earlier, it gives an impression of
comfortable liquidity position but it is actually quite discomforting. This amount
has accumulated because of the fact that a portion of the committed liabilities of
2010-11 had spilled over to the current financial year. A major component of this
treasury surplus will have to be spent on Pay Revision Pension Revision arrears.
Even though the 9th
pay revision is applicable w.e.f. 01.07.2009, the process of
eliciting options and processing the same for preparation of arrears could not be
completed within March 2011. Consequently, major share of this liability will
fructify for payment in 2011-12, and payments will have to be effected
immediately. The table below (T10) indicates the liabilities that were committed
during the previous year(s), resulting in immediate outflow from State’s
exchequer.

19
Table : T10
Outstanding Commitments causing immediate outflow
AAAA in crore
Arrears of Salaries and Pension 800
Outstanding payments to contractors 425
Electricity subsidy to farmers 27
Farmers’ debt relief 27
Cost of Medicines / equipments, etc. 13.80
MLAs’ Special Development Fund – Additional allocation 35
Kerala State Co-operative Bank-Share Capital 136
Social Security Pensions & Welfare Pensions at enhanced rate 200
Ration Subsidy (food grains @ 2 per kg.) 266
Arrears of compensation for paddy procurement & market
intervention operations (to Supplyco) 125
Land acquisition charges 100
Total 2154.80
39. During the last 10 years, the fiscal deficit and revenue deficit as also the
primary deficit have all been coming down. In fact, the state witnessed negative
primary deficit in 2006-07. Since primary deficit is comprised of the fiscal deficit
minus interest payment, this only gives a partial view of the financial health of the
state. Thus negative primary deficit by itself does not give room for
complacence. Our other main concerns are the revenue deficit and the fiscal
deficit. The 13th
Finance Commission’s recommendation is to eliminate the
revenue deficit by the year 2014-15 and restrict the fiscal deficit to 3.0% from
2013-14 onwards. The targets for the current year are at 1.4% and 3.5% for the
revenue deficit and the fiscal deficit respectively. Immediate past data show that
the fiscal deficit has generally been within the limits prescribed under the fiscal
correction path, ranging between 2.49% and 3.42% during the period from
2006-07 onwards. But during the same period, revenue deficit has not been
showing any uniform pattern; it has ranged between 1.72% to 2.17% from
2006-07 onwards. The table T4 in para 13 ante indicates it.
20
Committed Liabilities
40. In the light of the current financial situation of the State, it is obvious that,
today; government finds it extremely difficult to allocate resources for its priority
sectors as it has to discharge the committed liabilities first. Committed
expenditures themselves tend to consume a lion’s share out of available resources.
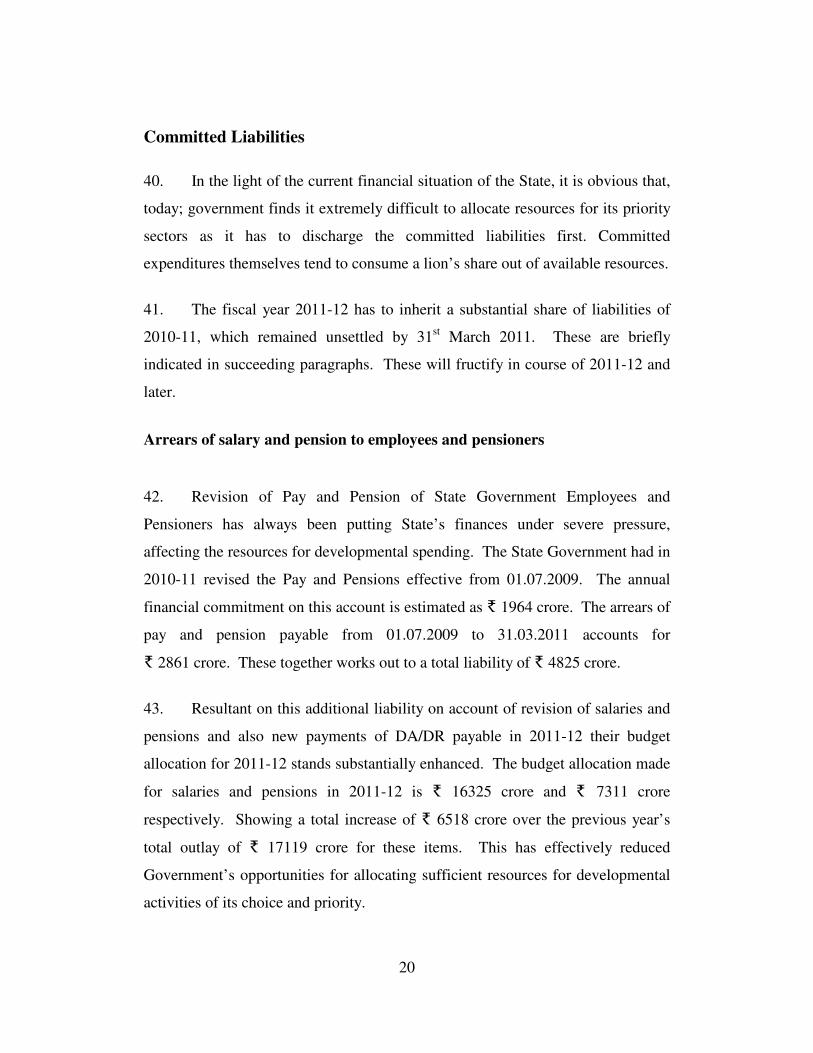
41. The fiscal year 2011-12 has to inherit a substantial share of liabilities of
2010-11, which remained unsettled by 31st March 2011. These are briefly
indicated in succeeding paragraphs. These will fructify in course of 2011-12 and
later.
Arrears of salary and pension to employees and pensioners
42. Revision of Pay and Pension of State Government Employees and
Pensioners has always been putting State’s finances under severe pressure,
affecting the resources for developmental spending. The State Government had in
2010-11 revised the Pay and Pensions effective from 01.07.2009. The annual
financial commitment on this account is estimated as A 1964 crore. The arrears of
pay and pension payable from 01.07.2009 to 31.03.2011 accounts for
A 2861 crore. These together works out to a total liability of A 4825 crore.
43. Resultant on this additional liability on account of revision of salaries and
pensions and also new payments of DA/DR payable in 2011-12 their budget
allocation for 2011-12 stands substantially enhanced. The budget allocation made
for salaries and pensions in 2011-12 is A 16325 crore and A 7311 crore
respectively. Showing a total increase of A 6518 crore over the previous year’s
total outlay of A 17119 crore for these items. This has effectively reduced
Government’s opportunities for allocating sufficient resources for developmental
activities of its choice and priority.

21
Dues payable to Co-operative Institutions/ Banks etc.
(i) Agriculture Production cost Relief Scheme.
44. Government is to provide relief to credit Co-operatives under Agriculture
Production Cost Relief Scheme sanctioned in G.O. (Ms) No. 11/92/Co-op. dated
07.03.1992. Pending claims under this scheme up to 2009-10 accounts for
A 44 crore.
(ii) Grant to CAPE against Deposit Mobilisation through Co-operatives
45. In terms of G.O. (Rt) No. 1911/2000/Fin dated 29.03.2000, the State
Government is also committed to provide grant in aid to Co-operative Academy
of Professional Education (CAPE) to the extent of 25% of the deposits mobilised
from primary Co-operative Societies as a part of resource mobilisation drive
under the Treasury small savings Fixed Deposit Scheme. Against A 81.91 crore
due to CAPE on this account, A 40.86 crore has been released so far.
A 40.85 crore is still outstanding.
(ii) Additional Share Participation in Kerala State Co-operative Bank
46. For the revitalization of the Kerala State Co-operative Bank, an action
plan has been drawn up in 2010-11 with the approval of NABARD and
Government of India. The Action Plan aims at the Bank achieving a positive net
worth by improving its financial position over a period of 3 year by augmenting
its share capital base by A 344 crore. Government released A 150 crore in
2010-11 as State’s equity contribution to the Bank. The balance contribution of
A 194.20 crore is to be made during 2011-12 and 2012-13.
Paddy Procurement and market Intervention operations by Kerala State
Civil Supplies Corporation
47. Government procure paddy from farmers through the Kerala State Civil
Supplies Corporation (Supplyco) and compensate the Corporation for its losses on

22
this account. Apart from this compensation is payable to Kerala State Civil
Supplies Corporation for its market intervention operations. Government has also
to meet the milling charges. Claims to the tune of A 291 crore submitted by the
Kerala State Civil Supplies Corporation (KSCSC) Ltd. for the period up to
31.03.2011 was pending to be settled, against the available budget provision of
A 75 crore.
Payment towards free electricity to small and marginal farmers
48. Agriculture Department provides subsidy to small and marginal farmers
towards electricity used for agricultural purposes. As on 31.03.2011, an amount
of A 27 crore was due for payment to Kerala State Electricity Board on this
account.
Ration subsidy
49. The previous Government during the last quarter of 2010-11 extended the
scheme of distribution of food grains @ A 2 per kg. to all ration card holders.
Due to the large number of APL card holders being brought under the scheme, the
total financial commitment would increase to A 458 crore whereas the budget
provision available is A 250 crore. This will result in an additional outflow of
A 250 crore during the current financial year. Further, the rates of commission to
ration dealers were also increased and an amount of A 15.68 crore is required to
clear its arrears. The total additional liability works out to A 266 crore.
Debt Relief to farmers
50. Applications for debt relief numbering around 4.14 lakh have been
received by the Kerala State farmers Debt Relief Commission. Of this about
1.71 lakh applications have been disposed off by the Commission with a total
compensation of A 89.69 crore out of this, A 62.45 crore has been disbursed so
far. The balance of A 27.24 crore is pending to be disbursed. The budget

23
provision available is A 8 crore and hence A 19.24 crore is to be provided
additionally now. Apart from this, the pending 2.43 lakh applications, when
disposed off, can result in additional liability of around A 175 crore, even when
assessed with a very nominal compensation of A 7500 on an average.
Payments towards medicine equipments, water charges etc. of Medical
College Hospitals.
51. A 13.81 crore is outstanding to be paid towards the cost of medicines and
equipments purchased and water charges payable to Kerala Water Authority by
the Medical College Hospitals.
Road up gradation works taken up under MLA SDF
52. An additional allocation of A 25 lakh per Constituency was sanctioned in
2010-11 exclusively for taking up road up gradation work under the Special
Development Fund for MLA. Majority of works have been taken up and
completed and payments are due now. A 35.25 crore is the additional requirement
on this account.
Compensation for Land Acquisition
53. About A 100 crore will be immediately required to settle the outstanding
claims in land acquisition cases including commitments on account of satisfaction
of Court decrees in LAR cases and settlements reached through Lok Adalaths.
Stimulus package
54. During 2009-10 an anti recession stimulus package was announced for a
total amount of A 10,000 crore, consisting of A 5000 crore for Water Supply,
Irrigation, Public Work sectors and another A 5000 crore on projects implemented
by LSGIs, PSUs, etc. No budget provision was made for this package during
2009-10. 1280 works with estimated cost of A 3000 crore were sanctioned in
PWD during 2009-10. For PWD, works bill amount to A 324.26 crore were paid
24
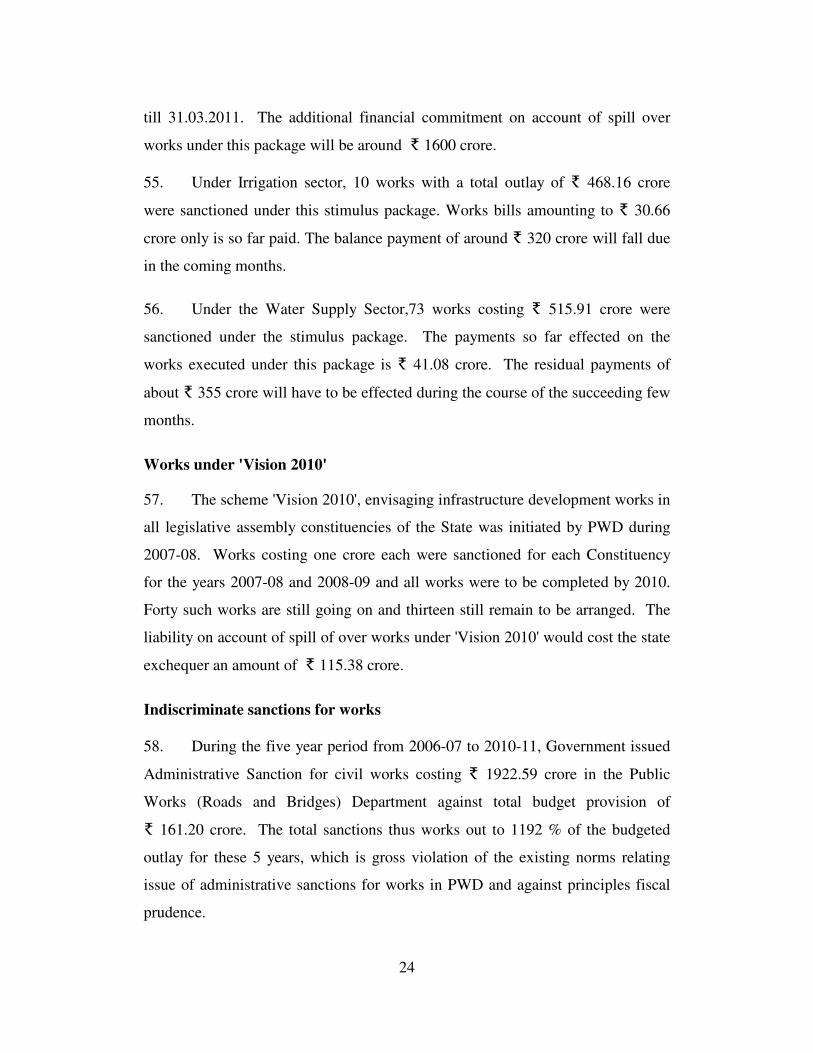
till 31.03.2011. The additional financial commitment on account of spill over
works under this package will be around A 1600 crore.
55. Under Irrigation sector, 10 works with a total outlay of A 468.16 crore
were sanctioned under this stimulus package. Works bills amounting to A 30.66
crore only is so far paid. The balance payment of around A 320 crore will fall due
in the coming months.
56. Under the Water Supply Sector,73 works costing A 515.91 crore were
sanctioned under the stimulus package. The payments so far effected on the
works executed under this package is A 41.08 crore. The residual payments of
about A 355 crore will have to be effected during the course of the succeeding few
months.
Works under 'Vision 2010'
57. The scheme 'Vision 2010', envisaging infrastructure development works in
all legislative assembly constituencies of the State was initiated by PWD during
2007-08. Works costing one crore each were sanctioned for each Constituency
for the years 2007-08 and 2008-09 and all works were to be completed by 2010.
Forty such works are still going on and thirteen still remain to be arranged. The
liability on account of spill of over works under 'Vision 2010' would cost the state
exchequer an amount of A 115.38 crore.
Indiscriminate sanctions for works
58. During the five year period from 2006-07 to 2010-11, Government issued
Administrative Sanction for civil works costing A 1922.59 crore in the Public
Works (Roads and Bridges) Department against total budget provision of
A 161.20 crore. The total sanctions thus works out to 1192 % of the budgeted
outlay for these 5 years, which is gross violation of the existing norms relating
issue of administrative sanctions for works in PWD and against principles fiscal
prudence.

25
59. As per the prevailing norms cost of administrative sanction issued during a
year should not exceed 150% of the budget outlay for the year. During the last
4 years, the total cost of the works sanctioned has exceeded the budget provision
by over 1000%. In the year 2009-10 the excess was over 2000%. The additional
commitment on account of these excessive sanctions is estimated to be above
A 1300 crore. For 2011-12 alone, A 715 crore will be required for effecting
payment of work bills of this category.
Social Security Pension
60. In his budget speech, the former Finance Minister has announced his
Government’s intention to enhance the monthly rate of Social Security Pension
and other welfare pensions from A 300 to A 400. As this Government can not do
way with the proposed enhancement, an additional liability of A 200 crore is to be
taken over during the current year.
Kerala State Road Transport Corporation
61. Currently the KSRTC is incurring an operating loss of around A 40 crore
every month. The annual operating loss will come to A 480 crore. But for the
liberal financial support from State Government, KSRTC will not be able to carry
out its regular operations. This will add additional pressure on State’s finances.
Kerala State Housing Board
62. The Kerala State Housing Board has been in deep financial crisis for
several years now. KSHB’s outstanding liabilities with HUDCO alone is A 750
crore State Government is committed to clear at least ⅓ of this liability
immediately, lest the State Government will not be able to avail any more loans
from HUDCO. Hence the State Government is now compelled to take over a
liability of A 250 crore.
63. The additional financial liability on account of the above commitments
would be AAAA 10197 crore for the financial year 2011-12. However, only an
26
amount of A 5133 crore was provided in the budget 2011-12 for defraying
expenses on account of pay and pension revision and part of liability under
anti-recession stimulus package. Deducting the above amount from the total
commitment of A 10197 crore, an uncovered commitment of AAAA 5064 crore
remains for which no provision was made at all in the budget 2011-12 presented
in February 2011. This additional liability is a heavy burden, resulting in severe
strain on State’s finances

27
Part-II
PUBLIC FINANCE
Unproductive Expenditure 64. In terms of the recommendations of the 12
th Finance Commission, a
scheme of debt waiver of principal portion of central loans based on reduction to
be achieved in revenue deficit consistently from 2005-06 was introduced by
Government of India. The 12th
Finance Commission computed the eligible sum
to the State as A 1063.05 crore under the scheme. As against this, the State could
avail only A 250.26 crore. The failure in availing the balance of A 812.79 crore
was due to the inability of the Government to reduce revenue deficit in a regular
manner. This was because of the non plan revenue expenditure (NPRE) growing
by nearly 100 percent from the figure of A 15227 crore in 2005-06 to A 29403
crore in 2010-11. This was against a growth of just 53 percent during the period
2000-01 to 2005-06. This brings to light the extravaganza of the previous
Government in favour of unproductive expenditure.
Lapsing of Central Assistance
65. In the meantime, an amount of A 414 crore that was receivable as grants
under 12th
Finance Commission award was allowed to lapse because of the
non-compliance of ‘not so severe’ conditionalities stipulated by the 12th
Finance
Commission and also due to the inefficiency of the Government in spending and
furnishing utilization certificates in time. In the case of grants relating to PWD, a
sum of A 174 crore was allowed to lapse just because adequate Non Plan Revenue
Expenditure (NPRE) for maintenance was not incurred. In sectors like 'Inland
Waterways and Canal' and 'Coastal Zone Management' the Government was
virtually in the dark and could not finalise workable projects till the end of the
12th
Finance Commission award period. That resulted in the loss of A 240 crore.

28
Trends of Balance from Current Revenue
66. Though there was proliferation in NPRE the expenditure could not reach
the required level in the targeted areas. Also there was failure in availing debt
waiver and eligible grants from the Centre. This resulted in deterioration of
Balance from Current Revenue (BCR) as well. The previous UDF Government
had addressed this issue and was able to avoid massive hike in negative BCR in
the first three years viz. 2001-02, 2002-03 and 2003-04. The Government
succeeded in its attempt in reducing the negative BCR by 24.6% (to A 1496 crore)
in 2004-05. It was further reduced by 52.7% (to A 707.60 crore) in 2005-06.
However, such a trend was reversed by the previous Government. The negative
BCR increased by 88.4% in the year 2006-07 and by 177% in 2007-08. The
figure remained consistently high even in the next two years though there was a
decline from 2007-08 figure. It ended at (-)A 1624 crore in 2009-10 as can be
seen from Table T11 below.
Table : T11
Balance from Current Revenues
(AAAA in crore)
2001-02 (-) 1724
2002-03 (-) 1811
2003-04 (-)1983
2004-05 (-)1496
2005-06 (-) 707
2006-07 (-)1332
2007-08 (-) 3691
2008-09 (-) 2259
2009-10 (-) 1624

29
67. The worsening contribution from revenue account for plan financing
resulted not only in excessive dependence on borrowings but also reduced the
availability of resources for financing capital expenditure. Had the better Balance
from Current Revenues (BCR) in 2005-06, continued in subsequent years also, it
would have improved not only the revenue deficit but also the capital expenditure.
If serious thoughts were given to achieving the targets of Kerala Fiscal
Responsibility Act (KFRA) 2003, the lapses of such magnitude would not have
occurred.
Net accruals under Public Account
68. The Constitution envisages maintaining 'Public Account' in respect of
which the state has to act as a trustee and has to function as a banker for some
limited essential items of inflows and outflows in the smooth conduct of
Government business. But in the State the Public Account has been extensively
utilized with a view to secure additional funds by exhorting the Welfare Fund
Boards and other government institutions to deposit their money with treasury at
an interest rate higher than the interest rate payable on open market borrowings.
As a result, the outstanding liabilities under Public Account have swollen to
A 21296 crore in 2009-10 from A 14841 crore in 2005-06. This can upset the
financial planning of Government, if funds are withdrawn at large scale from
these accounts at call.
69. Another unhealthy practice is the provision of maintaining TSB account
and PD accounts by the departments, quasi government institutions and Local Self
Government Institutions (LSGIs). Transfers to these accounts are without cash
flows that is, through accounting adjustments from service heads in the nature of
an actual expenditure. Hence expenditure eventhough booked in the service
heads would happen in a later date only. The claims arising during a later period
will put State’s liquidity under pressure. The increase in the net liabilities under
Public Account in the last five years is illustrated in the table T12:

30
Table : T12
Accruals under Public Account (net)
(A in crore)
2005-06 331
2006-07 (-) 287.56
2007-08 1891
2008-09 916
2009-10 3062
70. The danger of promoting deposits to Public Account, in excess of the
manageable limits is that a liquidity crisis looms large over the government as had
prevailed in the State in the later half of 1990's when the cheques issued by
Government authorities failed to be honoured, questioning the credibility of
sovereign instruments. This kind of situation would affect the process of planning
and budgeting and also implementation of programmes.
31
Part III
Options for the Government
71. In view of the stress on resources as elucidated in foregoing chapters,
government has very little options for the management of its finances. Some
possible options are briefly mentioned in succeeding paragraphs.
72. Diversification from agriculture to industrial sector and expansion of
tertiary sector is expected to add considerably to the gross domestic product.
However, the Kerala economy has for long been dependent on the growth of
service sector rather than the growth of agriculture and industrial sectors. The
state is lagging behind in the agricultural and industrial sector even though fertile
soil, suitable climate, skilled manpower and capital are in abundance. The
productive sector is far behind the national trend. It is the high time to zero in on
the factors responsible for this backwardness and rectify the mistakes without
losing further time.
73. Union Government has come out with a draft manufacturing policy to
raise the share of manufacturing in GDP to 25 percent from 16 percent at present
with the intention of generating employment. The policy brought out by the
Centre can be adopted by Kerala with modifications wherever required. As we
are aware, the number of unemployed persons registered with the employment
exchange has swollen to a whopping 45 lakh. With careful and thoughtful
diversification into secondary and tertiary sectors, employment opportunities can
be enhanced. Further improvement in the occupational structure can also be
achieved by such diversification. Within secondary sector, micro, small and
medium enterprises need to be promoted as these ventures have the potentiality to
employ the vast number of qualified skilled labour. As its corollary, marketing of
products too will have to be organized for ensuing remunerative returns to these
ventures.

32
74. Industrial sector in the state needs rejuvenation. But it should not mean
that such a rejuvenation would be only through the public sector undertakings. In
addition to public sector, partnership of private sector is essential for major
investments. The State should not shy away from private capital. But in order to
facilitate extensive private investment, the state has to organize basic facilitating
infrastructure. Accordingly, it seeks massive investment in infrastructure such as
seaport, airports, roads and transportation sector. But the state having inherited
massive committed liability, finds it difficult at this juncture to allocate sufficient
funds for investments in infrastructure.
75. The state has to manage its finances in accordance with the targets set by
the 13th
Finance Commission in course of the larger macro economic management
of the country. We are aware that confrontationist attitude with Centre will not be
beneficial to the state economy. Further, fiscal consolidation in the state cannot
be achieved by compressing the social sector expenditure and the expenditure on
much needed public goods. Compression of expenditure has to be limited to
those sectors where private investments are relatively easy to come by or where
the investments will not fetch the desired results at this point of time.
Augmentation of revenue alone cannot result in fiscal consolidation. In fact,
economic tremors can occasionally pull down revenue in medium term. Hence
the two pronged approach of revenue augmentation and avoiding wasteful or
inefficient expenditure can lend credence to the fiscal consolidation efforts.
76. Outstanding dues of all kinds will have to be cleared in a phased manner
so that budgetary planning and MTFP targets are not vitiated.
77 The Kerala Fiscal Reforms Act 2003 will have to be amended in
compliance of the 13th
Finance Commission recommendations so that the fiscal
consolidation process are rolled on in the State and the benefits recommended in
the 13th
FC are availed as far as possible.
33
78. Debt sustainability will have to be achieved through prudent financial
interventions. The composition of debt has remained almost the same during the
last five years. The internal debt as a percent of total debt stock is 63.46 per cent
while the loan from the Centre is at 8.56 percent in 2011-12. PF, Small Savings
etc constitute 28.28 percent of debt stock. The debt as a per centage of GSDP has
come down to 28.99 in 2011-12 (Alt). The Debt/GSDP limit proposed by the 13th
Finance Commission for 2011-12 is 32.3 percent. The FD/GSDP and RD/GSDP
ratios allowed by the 13th
Finance Commission for 2011-12 are 3.5 percent and
1.4 percent respectively. But in the year 2011-12, the RD/GSDP ratio is expected
to be at an increased level of 1.81 per cent whereas FD/GSDP ratio will remain
within the limit. It may be made clear that non achievement of RD/GSDP target
is due to the provisioning for pay and pension revision arrears in 2011-12. The
RD/FD ratio which was as high as 74.82 per cent has come down to 52.66 percent
in 2011-12 (Alt.). Thus the RD/FD ratio shows that the quality of fiscal deficit
has been improving.
79. Government has already chalked out the Medium Term Fiscal Policy Plan
for 2011-12 and 2012-13. The main objectives mentioned there are indicated
below:-
• Inadequate infrastructure of international standard hinders Kerala’s
image as an attractive investment destination. Given the resource
constraints of Government, infrastructure will be built up with private
participation. Major infrastructure projects will have to be put a fast
track mode.
• Measures will have to be taken to focus Kerala as an attractive
investment destination.
• Agriculture and industry will have to be the thrust areas for creating
employment opportunities through diversification and resource /
technical collaborations.

34
• Not only growth but also development with equity without sacrificing
the interest of the poor has to be the prime concern.
80. Sustained growth of the State’s own tax revenues is essential to reduce
fiscal imbalances. Therefore tax administration has to be strengthened further and
rationalised.
81. As against a legislative ceiling of A 14000 crore in respect of contingent
liabilities, the outstanding liabilities are A 7495 crore. State will have to be
careful and prudent in incurring further contingent liability.
82. It is obvious that the intricacies of finances of the state has to be
understood properly and addressed. It cannot be done in a year or through a
year’s budget. It has to follow a sustained train of efforts over next new years.
Effort has to maximize its usage subject to the constraints of the economy.
Management of revenue gap is never a one-step effort. It combines proverbial
‘tightening of the belt’ with increasing the economic efficiency of expenditure
based on informed options of spending, without compromising on the social
commitment and economic imperatives.

35
Top Related