


Languages
Pages
Legal


WHERE IS INDIAN PHARMA
HEADED?
September 2017
Motilal Oswal 2017 Conference
Nilesh GuptaManaging DirectorLupin Ltd.

IS THE INDIAN PHARMA DREAM RUN OVER?

0
5,000
10,000
15,000
20,000
20
01
20
02
20
03
20
04
20
05
20
06
20
07
20
08
20
09
20
10
20
11
20
12
20
13
20
14
20
15
BSE Healthcare Index
3
Pharma Company Growth and Returns
Indian Pharma Company Growth Indian Pharma Company Returns
The 2017 Story The 2017 Story
0
400
800
1,200
2001 2003 2005 2007 2009 2011 2013 2015 2017
(IN
R b
n)
Total Sales of Top 6 Listed Pharma
0
5,000
10,000
15,000
20,000
2015 2016
BSE Healthcare Index
Sep - 2017Sep -
35.6
46.0 47.340.7
29.8
21.2
0.0
10.0
20.0
30.0
40.0
50.0
Q4FY16 Q1FY17 Q2FY17 Q3FY17 Q4FY17 Q1FY18
(IN
R b
n)
Total Net Profit of Top 6 Listed Pharma

Is the Indian Pharma Market Model done?
Current Model Showing Signs of Ageing
US
• Customer Consolidation leading to more bargaining powers
• Pricing Pressure
• Hyper-competitive
India
• Too many disruptions
• Facing regulatory uncertainties in terms of new proposed policy
• Generic-generic drugs
Other Markets
• Pricing Pressure is constant across ALL markets
• Other markets don’t move the needle
So What’s Next?
4

THE GLOBAL PHARMA MARKET IS STILL HUGE

6
Global Pharma Market is $1.1 tn
Sources: QuintilesIMS MAT Q1 2017
US44%
CHINA8%
JAPAN8%
GERMANY4%
FRANCE3%
ITALY3%
BRAZIL3%
UK2%
SPAIN2%
CANADA2%
REST OF WORLD21%
2016 Pharma Market Split by Geography
Almost half of Global Pharma market is US followed by China and Japan

7
Markets Geographic Ranking over time
Sources: QuintilesIMS IIHI
BRIC moving up the rankings with China already moved up to #2 and India entering Top 10 in 2021
2011 2016 2021
1 US US US
2 JAPAN CHINA CHINA
3 CHINA JAPAN JAPAN
4 GERMANY GERMANY GERMANY
5 FRANCE FRANCE BRAZIL
6 ITALY ITALY UK
7 UK UK ITALY
8 SPAIN BRAZIL FRANCE
9 CANADA SPAIN INDIA
10 BRAZIL CANADA SPAIN
11 SOUTH KOREA INDIA CANADA
12 AUSTRALIA AUSTRALIA SOUTH KOREA
13 INDIA SOUTH KOREA RUSSIA
14 MEXICO RUSSIA TURKEY

8
Market to grow to $1.5 tn by 2021
594726
242
343120
140183
333
2015 2021
$ B
N
2015-21 MARKET SIZE EVOLUTION
Biosimilars
Biologics
OTC
Small moleculeGenerics
Patented/Originatorsmall molecule
Driven by increased innovation in this areas and acceptance of Biosimilars
$1.1 tn $1.5 tn
3%
6%
3%
11%
47%
5%
Growth Rate Declining
Genericization reaching saturation (>65% of global volume)
Some innovation still happening in small molecules
Growth Drivers
Source: QuintilesIMS 2021, Broker notes
Global Pharma market is expected to reach $1.5 tn in 2021, driven by biologics

9
Demographic Drivers support the Growth
Ageing Population
Ageing population convergence between developed and developing nationsChina is expected to have higher proportion of 60+ than developed nations by year 2100
Cardiovascular disease: #1 cause of death (30% of all global deaths)Cancer: #2 cause of death (13% of all global deaths)347 million people worldwide have diabetesWorldwide obesity has nearly doubled since 1980
Global Chronic diseases prevalence
Increasing prevalence of chronic diseasesDisease incidence increases with age
0.0
10.0
20.0
30.0
40.0
60
+ as
a %
of
tota
l po
pu
lati
on
Global Population Ageing 2000-2100
More developed regions Less developed regions
Source: MUFG and United Nations
70% - 80% of all deaths from chronic diseases occur in low- and middle-income countries

SO WHAT IS TROUBLING INDIAN PHARMA?

11
India Pharma Industry: Evolution
Indian Pharma Industry has evolved from almost being non-existent to one of the world’s leading suppliers of generic drugs
1970 2000 2012
Wave 1: Establishment of Domestic Pharma Industry with ROW Exports
Wave 2: Dominated Developed market Generics
Wave 3:Enter Complex Generics, Biosimilars and Specialty

INDIA PHARMA INDUSTRY EVOLUTION
WAVE 1
13
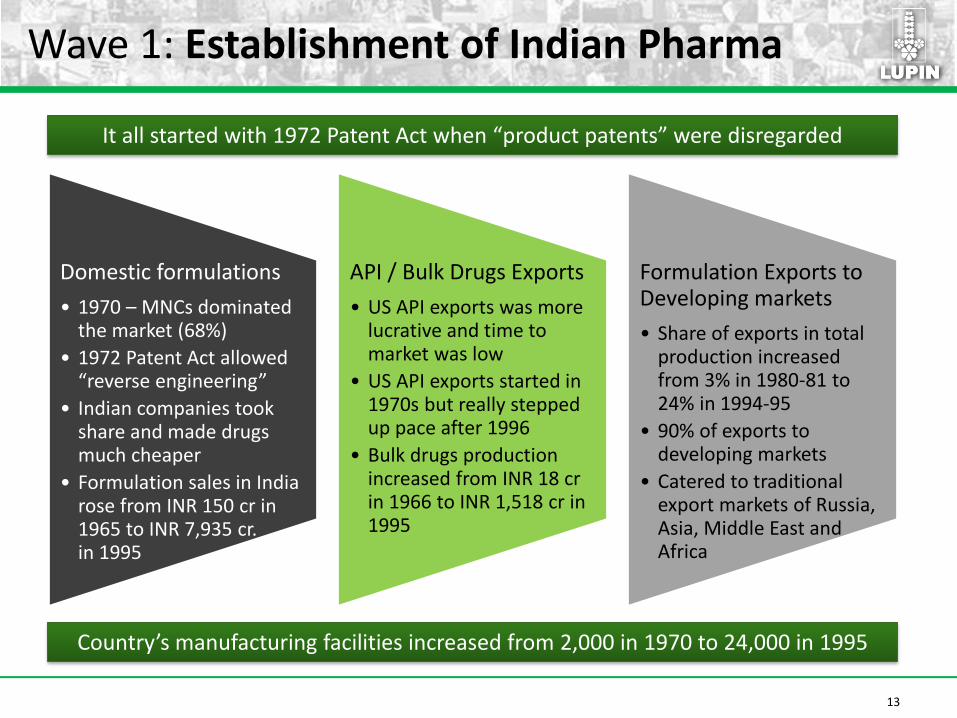
Wave 1: Establishment of Indian Pharma
It all started with 1972 Patent Act when “product patents” were disregarded
Country’s manufacturing facilities increased from 2,000 in 1970 to 24,000 in 1995
Domestic formulations
• 1970 – MNCs dominated the market (68%)
• 1972 Patent Act allowed “reverse engineering”
• Indian companies took share and made drugs much cheaper
• Formulation sales in India rose from INR 150 cr in 1965 to INR 7,935 cr. in 1995
API / Bulk Drugs Exports
• US API exports was more lucrative and time to market was low
• US API exports started in 1970s but really stepped up pace after 1996
• Bulk drugs production increased from INR 18 crin 1966 to INR 1,518 cr in 1995
Formulation Exports to Developing markets
• Share of exports in total production increased from 3% in 1980-81 to 24% in 1994-95
• 90% of exports to developing markets
• Catered to traditional export markets of Russia, Asia, Middle East and Africa

14
Wave 1: DMF Filings peaked in 1996-2001
Indian DMFS share increased to 6.2% in 2001 from 1.8% in 1996…
2191 92
233
1969-1985 1956-1990 1991-1995 1996-2001
# of DMFs filed by Indian companies between 1969-2001
15%60%
85%40%
Formulations API
Exports / Domestic Volume share in 2002
Exports Domestic
… Led to ~60% API volume being exported in 2002
Took Share away from MNCs in India
68 60 50 40 32 23
32 40 50 60 68 77
0%
50%
100%
1970 1978 1980 1991 1998 2004
Domestic Market Composition (%)
MNCs Indian Companies

INDIA PHARMA INDUSTRY EVOLUTION
WAVE 2

16
Wave 2: Dominate Generics
Source: Citi 2016 broker notes, Corporate Research
Patents (Amendments) Act 2005 re-instituted “product” patents… India started to aggressively look for other opportunities with the expertise built
Dominate US Generics
• 35 years of protection enabled Indian companies to perfect scientific and manufacturing capabilities
• Moved up the value chain to develop formulations for the US market
• Also capitalized on P4 and blockbuster opportunities
• Consolidated API position
Lions Share of the Domestic market
• By 2005, Indian companies held ~70% share in domestic market
• Indian companies grew the market exponentially by increasing penetration
• MNCs came back after 2005 and some have re-established strongly
Meaningful position in other markets
• Indian companies entered markets like Japan
• In 2005-06, 18 companies spent ~$1.6 bn to acquire in Europe, North America and Mexico
• Ranbaxy and DRL made several acquisitions in EU
• Companies built presence in markets like Brazil

17
Wave 2: Key Drivers for Value Creation
Forward Integration and Developed Market Expansion led to value creation
Forward Integration Developed Market Expansion
Indian pharma companies actively transformed from API manufacturers to finished dosage suppliers
The Industry was able to move up the value chain with exponential increase in sales and profitability
With manufacturing capability and experience in adopting the regulations of developed markets, Indian pharma significantly expanded their footprint in regulated markets
55% 58%73%
45% 41% 23%
4%
0%
20%
40%
60%
80%
100%
2005 2009 2014
% o
f sa
les
Formulation API Others
45%
67%
0%
10%
20%
30%
40%
50%
60%
70%
80%
2000 2016
Gro
ss M
argi
ns
%
Source: Citi 2016 notes, Corporate Research
90%
44%
10%
56%
0%
50%
100%
1990s 2010s
% o
f ex
po
rts
Developed markets
Developing markets

18
Wave 2: Dominance in Global Generics
In a short span of time, Indian companies are fast emerging as leaders in the Global generics industryFive of the Top 10 Global Generic Companies are Indian
Source: Corporate Research
22.7
11.6
5.1 4.5
2.6 2.5 2.4 2.2 2.2 2.1
TEVA MYLAN PERRIGO SUN ASPEN LUPIN STADA AUROBINDO DR REDDY'S CIPLA
Top 10 Global generic companies by sales ($bn)

19
Wave 2: India in the United States Today
~40% of
annual ANDA approvals are from
India
40% of US
generics volume supplied by India
>600 sites
in India are USFDA approved
(highest outside US)
33% of
Indian companies sales come from the
US
31 acquisitions
for US generics business by Indian
companies
~50% of
DMFs filed each year are from India
Source: GS, ATKearney, MUFG

India joins WTO: India began to amend its patent law to offer better protection for patented drugs
20
Wave 2: India is a Global Generics Powerhouse
India is the most efficient export-oriented pharma industry in the world
Total Formulation Sales is currently $31bn equally split between domestic market and exports
1
EU's equivalent of Hatch-Waxman Act came into effect
2
Indian Patent Act 2005 came into effect
3
Source: Citi
2 3 3 3 4 4 56 5 6 7
8
1113 14
16
20
2224
2729
31
0%
10%
20%
30%
40%
50%
60%
0
5
10
15
20
25
30
35
1995 1997 1999 2001 2003 2005 2007 2009 2011 2013 2015
$ b
n
Formulations Market Evolution ($bn)
Domestic Exports Total Exports as % of total
1
23

So Where is Indian Pharma Today?
India Pharma today is nearing the end of Wave 2
Existing model is facing challenges and doesn’t give the kind of growth we have seen in the past
US
• Channel consolidation increased bargaining power of customers
• GDUFA providing faster approvals increasing competition
• Above factors along with the political backdrop on pricing causing pricing deflation
India
• Expected to grow at 12% CAGR
• But facing regulatory uncertainties in terms of new proposed policy
• Generic-generic drugs
• Jan Aushadi
Other Markets
• Japan may move to annual pricing revisions from current biennial
• Pricing pressure is a constant across markets
• Other developing markets growing but don’t really move the needle
21

22
Compliance – India under Scrutiny
Constantly evolving and a Holistic Regulatory Compliance effort is a must todayGood Regulatory Compliance costs money and doesn’t necessarily get you a premium
In the facility Outside the facility
• In 2015-16, Indian facilities were issued 20 warning letters of total 52 ex-US ones
• Data integrity was the biggest cause of warning letters in the last 2 years
• But, other compliance issues have also been seen in recent 483s and Warning Letters‐ Procedures not being followed‐ Scientifically sound laboratory controls‐ Investigations of discrepancies, failures
• Procurement: Multiple Issues with the quality of raw materials from India (and from China)
• R&D: Lack of quality control in R&D may lead to delays in development and approvals
• Post marketing: Issues such as complaints, rejects, and product failures are having a direct impact on reputation
Source: UBS, FDA, ATKearney

23
Execution – Running on a Treadmill
Execution has become very challenging today as high # of uncertainties at each stageWith significant base, Indian companies now need significant new product launches each year just to maintain their position
Source: BCG
Product Identification
Development
FilingApproval
Launch and Continue
Supply
Identify opportunities early
Develop Dossiers timely
Determine Commercials
Price erosion
FDA CRLs & IRs
The Old Model just does NOT work anymore
Timely approval

INDIA PHARMA INDUSTRY EVOLUTION
WAVE 3: NEXT WAVE OF GROWTH

25
Wave 3: Three Key Drivers of Growth
Source: Citi
Complex Generics
• Indian companies have only 19% penetration in complex generics compared to 34% penetration in simple generics
• Big classes of Complex products are not genericized or are still semi-exclusive
• Excusive and Para 4 opportunities will remain lucrative
Biosimilars
• Current biologics market worldwide is estimated to be ~ $240 bn
• Of this, biosimilarscontribute only ~ $4-6bn
• US and EU are opening up differently due to patent expiries
• Still considerable marketing / regulatory challenges in EU and US
Specialty / Branded
• Target areas which have unmet needs and provide clinical advantage
• Acquire opportunities which are in late stage of development
• Supplement with internal pipeline
• Focus would be primarily US but also developed markets like Europe and Japan

26
Wave 3: Complex Generics Opportunity
US: Product categories difficult to develop are underpenetrated compared to orals and offer large opportunities
Source: US IMS CY 2016; Classified by NFC123 codes and captures total market (including biologics)
218
2 6
138
249 15
30
80%
61%
52%46%
40% 37%
25%
8%
0%
10%
20%
30%
40%
50%
60%
70%
80%
90%
100%
0
50
100
150
200
250
SystemicOral
Nasal Other Injectables Inhalations Ophthal Derma Long-actingInj.
$ b
n
Total US Market Size ($bn) Generics Volume Share

27
Wave 3: Complex Generics Opportunity
Next few years launch calendars will be dominated by complex generics
Source: IMS MAT 17
ProductIMS MAT Mar 17 ($mn)
Axiron 244
Byetta 270
Welchol POS 595
Welchol tabs 93
Copaxone 40 mg 2,200
Neupro 134
BuTrans 287
Estrace 420
ProductIMS MAT Mar 17 ($mn)
Renvela Tabs 1,830
Renagel 194
NuvaRing 758
Tamiflu OS 371
Remodulin 602
Suboxone 1,556
Canasa 240
Advair Diskus 4,443
Longer development timelinesLonger FDA review cycle (but changing)Expensive biostudies or clinical studies High costs of failure
Guidances are evolving often citing additional requirements
Challenges

28
Wave 3: Enter Biosimilars
Currently over 50 distinct biosimilarsare under development
Biosimilars market to reach $25-$35 billion by 2020
Source: Barclays and Corporate Reesearch
BrandUS Market
Size ($ bn)Originator
Active
develop-
ments
Humira 11.7 Abbvie 19
Enbrel 7.1 Amgen 18
Remicade 5.2 JNJ 10
Neupogen 0.8 Amgen 4
Neulasta 3.9 Amgen 7
Rituxan 3.7 Roche 24
Lucentis 1.5 Roche 3
Big biotech
/ Large
Pharma
Pure-play
Biosimilars
only
Generic
compani
es
Companies Amgen Celltrion Teva
Abbvie Samsung Biocon
Pfizer Coherus Dr Reddy
Sandoz Epirus Intas
BI Pfenex Lupin
Capabilities
Development Partial
Regulatory / Legal Partial Partial
Manufacturing Partial
Commercial
Capabilities required are different and current launches are mostly by large pharma and big biotech names
ChallengesOpportunities

29
Wave 3: Enter Biosimilars
The Biosimilars market is still evolving. Uptake has been mixed across products and markets. Infliximab is a classic example
Source: IMS

Prescriber Base
Business Development
ModelSmall InfrastructureSmall Customer BaseSmaller Costs
“What is required to “Own a Therapy Area”?”
“- ologist” Driven< 5,000 Physicians
Big Pharma Approach Specialty Approach
BIG InfrastructureBIG Customer BaseBIG Cost
“What is available?”
Primarily “Primary Care”~ 50 – 100K
Wave 3: Build Specialty
Specialty requires a different set of capabilities but gives much more sustainability in growth
30

31
Wave 3: India’s involvement in Specialty space
Pipeline plays have started and will hit market in next two years
India has typically played a role as service provider to the development process of branded products
Source: MUFG and Corporate Research

SO WHERE IS INDIA PHARMA HEADED TODAY?

33
End of Wave 2; Wave 3 is still to kick in
We are at the end of Wave 2 and Wave 3 is still to kick inThe Next Two years are going to be challenging We are investing for Wave 3 now but Returns will start only in next two years
Factors
Development costs
Scientific Expertise
Manufacturing Setup
Front end
Simple generics
Low
Leverage the same expertise
Same
Same
Complex generics
High
Build separate expertise
Separate (Make vs buy)
Same
Biosimilars & Specialty
Very High
CROs involved
Not Relevant
Build separate
Not so much about giving up the Old but embracing the New

34
Key Indicators
The next two years are criticalWhat should you watch out for to assess that companies are making a successful transition to Wave 3
Complex Generics
Continued filing on P4 and semi-
exclusive generic products
Delivery on R&D development milestones for
Complex Generic products
Biosimilars
Key filing and approval milestones
for Biosimilars
Commercialization capability build or
Partner
Specialty / Branded
Pipeline build through acquisitions
and internal development
Companies must OWN their
Therapeutic Area

Simple Gx
Complex Gx
Delivery
Mechanism Route of Admin. Indication extension
Combinations Reformulations
Biosimilars
NCE
$11 bn sales / ~38% specialty
35
Other International successful transitions
Teva and Mylan started this process in early 2000s and have successful scaled up their branded generics and specialty businessesIndian peers only started in 2011-12, after first establishing the US generics business
505(b)(2) / NME / Branded generics
$22 bn sales / ~40% specialty
Requires Specialty field forceSubstitutable
Indian companies (8% sales from branded generics)
Wave 1 and Wave 2 were necessary stepping stones Wave 3 will drive predictable growth for the next 20 years

LUPIN TODAY

37
• Lupin’s sales of INR 172 bn spread across regulated and emerging markets
• Have grown at CAGR of 16% in the last 5 years;
• FY’17 US sales at Record $1.2bn and 38% growth
– 94% coming from generics and 6% from brands
– Ranked #4 by total Rx volume amongst US generics
• India business generated INR 38 bn revenues in FY17 growing consistently at 15%
– Ranked #5
– Top 5 therapies contribute 70% of sales
• Rest 30% sales contributed by direct presence in Japan, South Africa, Brazil, Mexico, Philippines, Australia and API business
• Invested INR 23 bn or 13.5% of sales on R&D in FY18 at 9 R&D sites globally
• 18 manufacturing sites globally with 8 USFDA approved sites
A leader in Generics with a diversified Geographical Footprint and strong Growth Profile
North America
48%
India22%
APAC13%
EMEA6%
LATAM3%
ROW1%
API7%
95 112 127 138 171
FY 13 FY 14 FY 15 FY 16 FY 17
INR
bn
Sales Evolution
FY17 Sales Breakdown
About Lupin

38
Lupin is a Dominant Force in Global Generics
7th
largest generic globally (by market cap1)
2nd
largest Indian Pharma Co (by global sales2)
6th
largest generic company(by sales2)
Globally
#1in Anti-TB(globally)
6th
India Pharma Market Rank5
4th
largest South Africa generics6
Emerging Markets
4th
largest US(by prescriptions3)
6th
Largest Japanese Gx4
Advanced Markets
Sources:1. Bloomberg EQS, 30 Jun 20172. LTM sales available as of 31 Mar 20173. QuintilesIMS MAT Mar 17
4. QuintilesIMS Data Japan (As of Jun 2017) at NHI price basis5. QuintilesIMS MAT Jun 176. QuintilesIMS MAT Jun 17
US$2.55bnGlobal Revenues

Our Strategic Direction
2016
• Primarily a Generic / Branded Generic Business
• 3 strong geographies (US/India/Japan)
2017-2020
• Leading generics player with a larger complex generics mix
• Building Specialty business
• Stronger geographic spread
2020+
• Leading generics player with a significant complex generics mix
• Material Specialty business
• Leading Global player
39

Complex Generics at Lupin
Inhalation
• First MDI Product filed and PAI done
• 2 DPI developments on track in late stage
• 5 other programs in early stage
• Targeting total US market size of $19bn
Biosimilars
• Etanerceptdevelopment on track with filing this FY in Japan and Europe
• Developing Pipeline of select few products
• Actively partnering for first few products
• Targeting total US market size of $19bn
Complex Injectables
• Acquisition of Nanomifor developing depot injections
• State-of-the-art facility ready by end-2017
• First filing in 2019
40

Lupin has chosen niche areas out of larger therapy areas
Movement disorders – Adult and Pediatric ($2bn+ by 2020)
Neurology ($50bn+) Peadiatric Specialty Women’s Health ($8.5bn)
Specialty Areas of Focus for Lupin
Alzh ($2bn) + Phsyc. Dis. ($10bn) + ADHD ($7bn) and Epilepsy ($12bn)
Neuro-immunology ($20bn)
Neuro-muscular disorders
Infectious diseases + Vaccines
Orphan / Rare diseases
Core areas (OC) and Infertility ($5bn)
Hormone therapies($2.2bn)
Niche and small indications ($1.3bn)
41

Manufacturing & R&D – Diverse Global Network
18Manufacturing Sites
• 8 USFDA approved sites• Various audits conducted by
other authorities without critical observations
9R&D Sites
• 368 US ANDA filings• 45 US First to Files• 2,837 patents filed globally• 1,700+ scientists at Global
locations
42

Our Investments for the Future
151 ANDA pending filings
45 First-to-Files (FTF) filings including 23 exclusive FTF opportunities
Enhanced investment on inhalation, biosimilars and injectables
Partnering selectively to defray enhanced spend on high-risk/high-reward products
Spend on Specialty R&D to increase in next two years
7.1 9.3 11.016.0
23.17.5% 8.4% 8.7%11.7% 13.5%
0.0%
5.0%
10.0%
15.0%
20.0%
0
5
10
15
20
25
FY13 FY14 FY15 FY16 FY17
(IN
R b
n)
R&D Spend
R&D Expense % of Sales
43

44
So where is Lupin Today?
We are at the beginning of Wave 3 – full transition by FY’20
1970 2000 2012
Wave 1
Wave 2
Wave 3
Filed first MDI (albuterol)Tiotropium DPI on track
Inhalation
First filing in FY19
Complex Injectables
CNS franchise in Japan boosted by acquisition (Shionogi) and in-licensing (Bipresso)Filed product for movement disorder in Germany
CNS
US Women's health foray with Methergine launch
Women’s Health
Etanercept on track
Biosimilars
Partnership with Monosol Rx
Paediatrics

40
Top Related